Embed Size (px)
Citation preview

I.J. Modern Education and Computer Science, 2017, 11, 49-57 Published Online November 2017 in MECS (http://www.mecs-press.org/)
DOI: 10.5815/ijmecs.2017.11.06
Copyright © 2017 MECS I.J. Modern Education and Computer Science, 2017, 11, 49-57
Modeling the effect of Network Access Control
and Sensor Random Distribution on Worm
Propagation
ChukwuNonso H. Nwokoye Department of Computer Science, Nnamdi Azikiwe University, Awka, Nigeria
Email: [email protected]
Njideka Mbeledogu, Ikechukwu I. Umeh, Ihekeremma, A. Ejimofor Department of Computer Science, Nnamdi Azikiwe University, Awka, Nigeria
Email: [email protected], [email protected], [email protected]
Received: 31 July 2017; Accepted: 24 October 2017; Published: 08 November 2017
Abstract—Sensor networks are appealing targets for
malicious attacks that invade the network with the aim of
depleting the confidentiality, availability and integrity
(CIA) features/parameters of neighboring sensor nodes.
This is due to its open communication, minimal resources
and its deployment in un-trusted, unguarded and
unfriendly terrains. To restrict illegitimate users or
malicious attackers (such as worms) network analysts
have suggested network access control (NAC).
Specifically, we apply NAC to wireless sensor network
epidemic models in order to investigate distribution
density, transmission range and sensor area/field. Our
analyses involved analytical expressions of two sensor
fields gleaned from literature. Additionally, we explored
the possibilities of infectivity of sensor nodes at the
exposed class using the two expressions for sensor field
topologies. We also derived the reproduction ratios and
solutions at several equilibrium points for the models. It
is our hope that that our work herein would impact sensor
deployment decisions for organizations that utilize
wireless sensor networks for meaningful daily activities.
Index Terms—Epidemic Theory, Wireless Sensor
Networks, Network Access Control, Random Distribution.
I. INTRODUCTION
The immense uses of Wireless Sensor Networks have
made it a prominent technology of this era. This kind of
networks mostly allows the random deployment of sensor
nodes in un-trusted terrains without predetermined or
engineered position. This emerging technology consists
of miniaturized but low battery-powered devices that
incorporate minimal sensing, processing, computation
and radio transmission capabilities [1]. Its huge potential
is evidently seen in its ability to provide dynamic and
adaptable architectures for diverse applications in homes,
healthcare, industry and in the military [1],[2].
Specifically, WSN applications are seen in the military
(for monitoring forces/equipments, battlefield
surveillance, reconnaissance, targeting, battle damage
evaluation); the home and in the environment (for
biocomplexity mapping, precision agriculture, fire and
flood detection etc) [1,3]. Its use extends also to health
applications (for telemonitoring of data,
tracking/monitoring of doctors/patients and drug
administration) and other commercial applications [3].
As shown in Fig 1, WSNs are “multi-hop packet based
networks”[4] that consists of sensor nodes which are
distributed in a sensor field where they are wirelessly
connected to the sink [5]. They track, record and send
ambient territorial parameters to a data collector (or base
station) through “multihop infrastructureless”
transmission between neighboring sensor nodes. The
communication done in the open air medium [4] and its
deployment in un-trusted, unguarded and unfriendly
terrain, makes the WSN an easy target to external attacks
that seek to delay/disrupt legitimate flow of information.
These attackers exploit other open challenges of the WSN
such as finite bandwidth, computational power, storage,
and communication range; packets’ authentication, and
uncertainty (in mobility, topology control, density,
sensing accuracy) [1,3]. Modern research-based
developments in sensor networks indicate that a
malevolent attacker can utilize several innards of sensor
nodes to outspread malicious codes all through the
network without physical contact or human intervention
[6]. As Giannetsos et al. [6] puts it, “such a method is to
exploit memory related vulnerabilities, like buffer
overflows, to launch a worm attack”.
Attacks such as sinkhole, sybil, wormhole and hello
flood in WSN are events that diminishes or eliminates a
network's capacity to perform its expected function [7]; in
other words these attacks deplete the confidentiality,
availability and integrity (CIA) parameters of
neighboring sensor nodes. To curb incidences of
malicious code attacks in networks, analysts have
proposed equation-based models to characterize,
represent and understand spread patterns, strategies.

50 Modeling the effect of Network Access Control and Sensor Random Distribution on Worm Propagation
Copyright © 2017 MECS I.J. Modern Education and Computer Science, 2017, 11, 49-57
Often times the strength of particular model is determined
by how much it can enhance understanding of malicious
code transmission.
Fig.1. Wireless Sensor Networks Environment [32]
II. RELATED WORKS
Researchers in network security have discovered that
there exist similar features between virus spread in
biological networks and the propagation of malicious
codes in telecommunication networks. With the
development of the widely applied Susceptible-Infected-
Removed (SIR) analytical model [8-10], the journey into
investigating the infectious outcomes of a susceptible
population in view of the interaction between “agent”,
“host” and “environment” began. Usually referred to as
“Epidemic models”, these system(s) of equations that
implement the epidemic theory can be ordinary
differential, partial differential, or difference (depending
on the intention of the modeler). Aside its application, in
public health, they are also evident in the characterization
of computer networks [11], peer-to-peer (P2P) [12],
wireless sensor networks [13] and the WWW [14] or the
internet [15].
To provide better understanding and to address security
issues arising in the above networks, analysts have
proffered (and involved) analytical solutions/suggestions
to cater for the observed features of known malicious
codes; they include inoculation, quarantine, time delay,
effect of anti-malicious code softwares etc. Their
suggestions are seen to be part of several models for
instance the SIS, SEIR, SEIRS-V, SEIQR, SEIQRS-V etc.
In a bid to represent the temporal and spatial dynamics
of worms spreading over a sensor network, Khayam and
Radha [16] developed the topologically-aware worm
propagation model (TWPM) that considered the
distribution of stationary and identical sensors on a grid
governed by a two-dimensional, discrete-time random
process. Their analysis included the expressions for the
effects of medium access control (MAC) layer contention,
network layer routing and transport layer protocol and
their impacts on worm spread in WSN. In a later
publication, the Khayam and Radha [17] used signal
processing technique and a more advanced mathematical
treatment to model propagation of worms in a sensor
network.
De, Liu and Das [18] assumed that malicious objects
can starts its spread in a wireless sensor network due to
either a compromised broadcast source or the lack of
complex authentication schemes. In the light of this
assumption they proposed an analytical model based on
epidemic theory that involves the essential parameters of
communication strategies of popular broadcast protocols
such as Trickle, Deluge and MNP, so as to investigate
speed and reachability.
Tang and Mark [19] considered the addition of a
maintenance capability to a group of identical and
uniformly distributed sensors in a geographical area.
Therein, the SIR model is modified to SIR-M (i.e., SIR
with Maintenance) in order to investigate the impact
transmission range and distribution density.
Wang and Li [20] also modified the SIR model to iSIR
model wherein the addition of the dead nodes (D) was
considered; these are nodes who has exhausted their
energy perhaps due to power consumption or due to
malware activities. Simulation results of the iSIR model
show that the process of worm propagation is sensitive to
the topological structure of the network and the energy
consumption of the sensor nodes.
Tang and Mark [19] and Wang and Li [20] did not
consider the sleep and work interleaving strategy
employed for elongating the lifetime of sensor nodes in
WSN. This shortcoming is alleviated by the EiSIRS
model developed by Wang, Li and Li [21] to practically
analyze the dynamics of worm propagation, and this
model considered sleep and work states.
The impact of medium access control (MAC) on the
propagation dynamics of worm behavior was modeled by
Wang and Yang [22] using the SI (Susceptible-Infected)
model. Numerical simulations were used to show that
increasing the network node density or the transmission
range increased the number of infected nodes.
Though Mishra and Keshri [13] didn’t consider the
sleep/work interleaving policy, their Susceptible-
Exposed-Infectious-Recovered-Susceptible-Vaccination
(SEIR-V) epidemic model involved the latent phase of
malicious code spread (wherein the the usual speed of
transmission of data become slow) and the inoculation of
sensor nodes before the outset of malicious code (worm)
infection.
Mishra, Srivastava and Mishra [23] proposed the
Susceptible-Infected-Quarantine-Recovered-Susceptible
(SIQRS) epidemic model and Mishra and Tyagi [24]
proposed the Susceptible-Exposed-Infectious-Quarantine-
Recovered with Vaccination (SEIQRS-V) epidemic
model. Aside characterizing worm dynamics in WSNs,
the symbolic solutions for the existent equilibrium states
(worm free and endemic). Zhang and Si [25] proposed a
delayed form of the SEIR-V epidemic model i.e. delay
was used as the bifurcation parameter. To determine the
direction of the Hopf bifurcation and the stability of the
bifurcated periodic solutions, they used the normal form
method and the center manifold theorem.
Even though Feng et al. [26] failed to consider the
exposed state of worm dynamics as well as the
vaccination of sensor nodes in WSN, their Susceptible-
Infected-Recovered (SIR) epidemic model used the
topological expression of Wang and Li [20] to study the
Modeling the effect of Network Access Control and Sensor Random Distribution on Worm Propagation 51
Copyright © 2017 MECS I.J. Modern Education and Computer Science, 2017, 11, 49-57
effect of communication range, network node density and
energy consumption. In addition the jacobian method was
used to investigate the local stability while the lyapunov
theorem was used to study the global stability.
On the other hand, to ensure network security some
schools of thought have suggested Network Access
Control (NAC) as a way of disallowing illegitimate
users/nodes in WSNs [27,28]. According to Butun and
Sankar [27], though NAC has been settled for traditional
computer systems, it has not been investigated thoroughly
in WSN scenarios. This is due to some inherent
features/challenges of the sensor network which include
open air communication, unreliable hardware,
uniqueness/difficulty of access control, key renewal for
newly deployed nodes and low-battery power. However,
in traditional computer systems NAC has proved to be of
immense benefits. For instance the CISCO version of
NAC, called the Network Admission Control can harden
a network, prevent network breaches, eliminates
unauthorized network connections and identify,
quarantine and remediate non-compliant/vulnerable
devices in the network. Recently, a governing solution
was derived for what seem like the NAC using classic
epidemic models in [29]. This first order equation therein
caters for quarantining and remediation of immigrant
infected nodes through its Pre-quarantining compartment.
In this paper, we modify the Quarantine-Susceptible-
Exposed-Infectious-Recovered-Susceptible with
Vaccination (Q-SEIRV) epidemic model of [29] by
applying Tang and Mark [19]’s expression for Sensor
Field 1 and Wang et al. [20]’s expression for Sensor
Field 2. Additionally, we explored the possibilities of
infectivity of sensor nodes at the exposed class using the
two expressions for sensor fields/WSN topologies which
represents uniform random distribution of sensor nodes.
This is aimed at investigating the effect of distribution
density, transmission range and NAC on worm
propagation.
III. THE NAC SEIRS-V MODEL
To accurately represent malicious code spread with
respect to time in a sensor network we propose the
inclusion of distribution density (σ), transmission range
( 𝑟2 ) in the Network Access Control–Susceptible–
Exposed–Infectious–Remediated–Vaccinated (NAC-
SEIRV) epidemic model. At first, we assume sensor
nodes pass through a pre-screening process, where
infectious immigrant nodes are isolated, treated and sent
to the remediated compartment. This act of remediating
infective sensor nodes closely mimics the “Remedial”
nature of NAC. Sensor nodes that are free of any
malicious code infection enter the susceptible sensor
population. To a large extent the NAC applied here
implements “the assume guilty till proven innocent”
slogan of the cyber space. Inoculation of the susceptible
sensor nodes provides additional immunization capability
toward the outbreak of subsequent malicious code
infections.
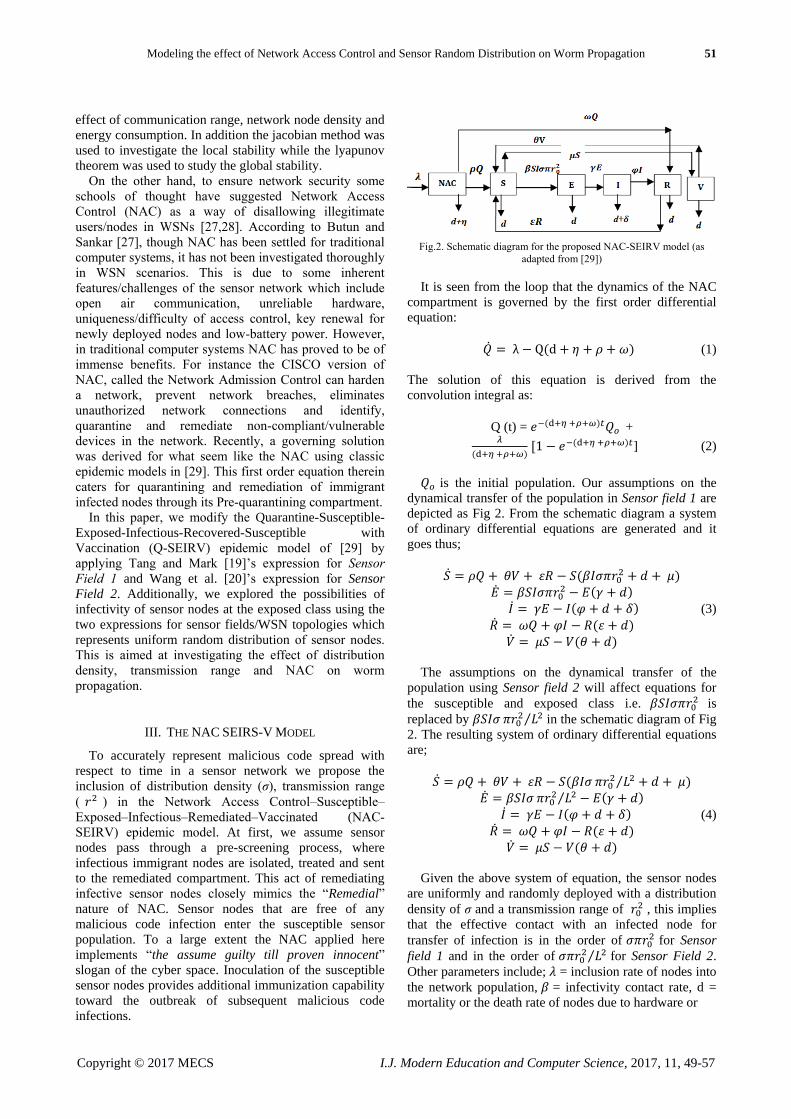
Fig.2. Schematic diagram for the proposed NAC-SEIRV model (as
adapted from [29])
It is seen from the loop that the dynamics of the NAC
compartment is governed by the first order differential
equation:
�̇� = λ − Q(d + 𝜂 + 𝜌 + 𝜔) (1)
The solution of this equation is derived from the
convolution integral as:
Q (t) = 𝑒−(d+𝜂 +𝜌+𝜔)𝑡𝑄𝑜 +
𝜆
(d+𝜂 +𝜌+𝜔) [1 − 𝑒−(d+𝜂 +𝜌+𝜔)𝑡] (2)
𝑄𝑜 is the initial population. Our assumptions on the
dynamical transfer of the population in Sensor field 1 are
depicted as Fig 2. From the schematic diagram a system
of ordinary differential equations are generated and it
goes thus;
�̇� = 𝜌𝑄 + 𝜃𝑉 + 휀𝑅 − 𝑆(𝛽𝐼𝜎𝜋𝑟02 + 𝑑 + 𝜇)
�̇� = 𝛽𝑆𝐼𝜎𝜋𝑟02 − 𝐸(𝛾 + 𝑑)
𝐼̇ = 𝛾𝐸 − 𝐼(𝜑 + 𝑑 + 𝛿) (3)
�̇� = 𝜔𝑄 + 𝜑𝐼 − 𝑅(휀 + 𝑑)
�̇� = 𝜇𝑆 − 𝑉(𝜃 + 𝑑)
The assumptions on the dynamical transfer of the
population using Sensor field 2 will affect equations for
the susceptible and exposed class i.e. 𝛽𝑆𝐼𝜎𝜋𝑟02 is
replaced by 𝛽𝑆𝐼𝜎 𝜋𝑟02 𝐿2⁄ in the schematic diagram of Fig
2. The resulting system of ordinary differential equations
are;
�̇� = 𝜌𝑄 + 𝜃𝑉 + 휀𝑅 − 𝑆(𝛽𝐼𝜎 𝜋𝑟02 𝐿2⁄ + 𝑑 + 𝜇)
�̇� = 𝛽𝑆𝐼𝜎 𝜋𝑟02 𝐿2⁄ − 𝐸(𝛾 + 𝑑)
𝐼̇ = 𝛾𝐸 − 𝐼(𝜑 + 𝑑 + 𝛿) (4)
�̇� = 𝜔𝑄 + 𝜑𝐼 − 𝑅(휀 + 𝑑)
�̇� = 𝜇𝑆 − 𝑉(𝜃 + 𝑑)
Given the above system of equation, the sensor nodes
are uniformly and randomly deployed with a distribution
density of σ and a transmission range of 𝑟02 , this implies
that the effective contact with an infected node for
transfer of infection is in the order of 𝜎𝜋𝑟02 for Sensor
field 1 and in the order of 𝜎𝜋𝑟02 𝐿2⁄ for Sensor Field 2.
Other parameters include; 𝜆 = inclusion rate of nodes into
the network population, 𝛽 = infectivity contact rate, d =
mortality or the death rate of nodes due to hardware or
52 Modeling the effect of Network Access Control and Sensor Random Distribution on Worm Propagation
Copyright © 2017 MECS I.J. Modern Education and Computer Science, 2017, 11, 49-57
software failure, 𝜂 = death rate of infected immigrant
nodes, 𝛿 = is the crashing rate due to attack of worms, 휀
is the rate of transmission from remediated class to
susceptible class, 𝜌 is the rate of transmission from
quarantined to susceptible class, 𝛾 is the rate of
transmission from exposed to infectious class, 𝜔 = rate
of transmission from quarantine class to remediated class.
𝜑 = rate of transmission from infectious to the
remediated class, 𝜃 = rate of transmission from
vaccinating class to susceptible class, 𝜎 is the vaccinating
rate coefficient for the susceptible nodes.
A. Solution at Equilibrium Points
Equating the modified system of differential equations
(3) to zero we obtain two solutions which are the worm-
free equilibrium and the endemic equilibrium points.
Hence, a worm-free equilibrium of the model that exists
is the same for both sensor fields and it goes thus; 𝑊𝑓 =
(𝑆𝑓, 𝐸𝑓 , 𝐼𝑓 , 𝑅𝑓, 𝑉𝑓) =
((𝑑+𝜃)(𝑑𝑄∗𝜌+ (𝜑+𝑄∗(𝜌+𝜔)))
𝑑(𝑑+ )(𝑑+𝜃+𝜇), 0,0,
𝜑+𝑄∗𝜔
𝑑+,
𝜇(𝑑𝑄∗(𝜌+ (𝜑+𝑄∗((𝜌+𝜔)))
𝑑(𝑑+ )(𝑑+𝜃+𝜇)) (5)
Sensor Field 1: At the endemic equilibrium there is
presence of infection or disease i.e. worm in the wireless
sensor network. Hence, an endemic equilibrium of the
model exists at: 𝑊𝑒=
𝑆∗ = (𝑑+𝛾)(𝑑+𝛿+𝜑)
𝛽𝛾𝜎πr02 ;
𝐸∗ =(
𝑑(𝑑+𝛾)(𝑑+ )(𝑑+𝜃+𝜇)(𝑑+𝛿+𝜑)
𝛽𝛾(𝑑+𝜃)σπr02 −𝑄∗(𝑑𝜌+ (𝜌+𝜔)))(−𝑑−𝛿−𝜑)
(𝑑+𝛾)(𝑑+𝛿)(𝑑+ )+𝑑(𝑑+𝛾+ )𝜑
𝐼∗ =(
𝑑(𝑑+𝛾)(𝑑+ )(𝑑+𝜃+𝜇)(𝑑+𝛿+𝜑)
𝛽𝛾(𝑑+𝜃)σπr02 −𝑄∗(𝑑𝜌+ (𝜌+𝜔)))(−𝑑−𝛿−𝜑)
(𝑑+𝛿+𝜑)((𝑑+𝛾)(𝑑+ )(𝑑+𝛿+𝜑)
𝛾− 𝜑)
(6)
𝑅∗ = 𝑄∗𝛾𝜌𝜑+𝑄∗(𝑑+𝛾)(𝑑+𝛿+𝜑)𝜔−
𝑑(𝑑+𝛾)(𝑑+𝜃+𝜇)𝜑(𝑑+𝛿+𝜑)
𝛽(𝑑+𝜃)σπr02
(𝑑+𝛾)(𝑑+𝛿)(𝑑+ )+𝑑(𝑑+𝛾+ )𝜑
𝑉∗ = (𝑑+𝛾)𝜇(𝑑+𝛿+𝜑)
𝛽𝛾(𝑑+𝜃)σπr02
Sensor Field 2: Here, an endemic equilibrium of the
model exists at: 𝑊𝑒=
𝑆∗ = 𝐿2(𝑑+𝛾)(𝑑+𝛿+𝜑)
𝛽𝛾σπr02
𝐸∗ =(Ω −𝑑𝑄∗(𝜌− (𝜑+𝑄∗((𝜌+𝜔)))(−𝑑−𝛿−𝜑)
𝛾((𝑑+𝛾)(𝑑+ )(𝑑+𝛿+𝜑)
𝛾− )
𝐼∗ =(Ω −𝑑𝑄∗(𝜌− (𝜑+𝑄∗((𝜌+𝜔)))(−𝑑−𝛿−𝜑)
(𝑑+𝛿+𝜑)((𝑑+𝛾)(𝑑+ )(𝑑+𝛿+𝜑)
𝛾− )
(7)
𝑅∗ =
𝜑+𝑄∗(𝜔+(Ω −𝑑𝑄∗(𝜌− (𝜑+𝑄∗((𝜌+𝜔)))(−𝑑−𝛿−𝜑)
(𝑑+𝛿+𝜑)((𝑑+𝛾)(𝑑+ )(𝑑+𝛿+𝜑)
𝛾 − )
𝑑+
𝑉∗ = 𝐿2(𝑑+𝛾)𝜇(𝑑+𝛿+𝜑)
𝛽𝛾(𝑑+𝜃)σπr02
Where
Ω = 𝑑𝐿2(𝑑+𝛾)(𝑑+ )(𝑑+𝜃+𝜇)(𝑑+𝛿+𝜑)
𝛽𝛾(𝑑+𝜃)σπr02
IV. TWO INFECTIVITY RATES
With the addition of an infectivity rate for the exposed
class, the transfer for the susceptible class to the exposed
class becomes something different. The system of
differential equations for two infectivity rates is;
�̇� = 𝜌𝑄 + 𝜃𝑉 + 휀𝑅 − 𝑆(𝛱𝐸𝜎𝜋𝑟02 + 𝛽𝐼𝜎𝜋𝑟0
2 + 𝑑 + 𝜇)
�̇� = 𝛱𝑆𝐸𝜎𝜋𝑟02 + 𝛽𝑆𝐼𝜎𝜋𝑟0
2 − 𝐸(𝛾 + 𝑑)
𝐼̇ = 𝛾𝐸 − 𝐼(𝜑 + 𝑑 + 𝛿) (8)
�̇� = 𝜔𝑄 + 𝜑𝐼 − 𝑅(휀 + 𝑑)
�̇� = 𝜇𝑆 − 𝑉(𝜃 + 𝑑)
Where 𝛱 is the infectivity rate of the sensors in the
exposed class. The solutions for the endemic equilibrium
points when the infectivity rates of the exposed and the
infectious sensors are considered are slightly different
from the (6). Note that at the worm-free equilibrium the
solutions are the same with (5). Here the endemic
equilibrium of the model (using sensor field 1) exists at:
𝑊𝑒=
𝑆∗ = (𝑑+𝛾)(𝑑+𝛿+𝜑)
(𝛽𝛾+𝛱(𝑑+𝛿+𝜑))σπr02
𝐸∗ = (𝑑+ )+(−𝑑−𝛿−𝜑)(− (𝜑+𝑄𝜔)(Φ−𝑄𝜌))
𝑑3+𝛾 (−1+𝛿+𝜑)+𝑑2(𝛾+𝛿+ +𝜑)+𝑑( (𝛿+𝜑)+𝛾(𝛿+ +𝜑))
𝐼∗ = 𝛾(−𝑑−𝛿−𝜑)(− (𝜑+𝑄𝜔)+(𝑑+ )(−𝑄𝜌+Φ))
Υ(𝑑3+𝛾 (−1+𝛿+𝜑)+𝑑2(𝛾+𝛿+ +𝜑)+𝑑( (𝛿+𝜑)+𝛾(𝛿+ +𝜑)))
(9)
𝑅∗ = 𝜑+𝑄𝜔+
𝛾(−𝑑−𝛿−𝜑)(− (𝜑+𝑄𝜔)+(𝑑+ )(Φ−𝑄𝜌))
Υ(𝑑3+𝛾 (−1+𝛿+𝜑)+𝑑2(𝛾+𝛿+ +𝜑)+𝑑( (𝛿+𝜑)+𝛾(𝛿+ +𝜑)))
𝑑+
𝑉∗ = (𝑑+𝛾)𝜇(𝑑+𝛿+𝜑)
(𝑑+𝜃)(𝛽𝛾+𝛱(𝑑+𝛿+𝜑))σπr02
Where
Υ = (𝑑 + 𝛿 + 𝜑), Φ = 𝑑(𝑑+𝛾)(𝑑+𝜃+𝜇)(𝑑+𝛿+𝜑)
(𝑑+𝜃)(𝛽𝛾+𝛱(𝑑+𝛿+𝜑))σπr02
The endemic equilibrium of the model (using sensor
field 2) exists at: 𝑊𝑒=
𝑆∗ = 𝐿2(𝑑+𝛾)(𝑑+𝛿+𝜑)
(𝛽𝛾+𝛱(𝑑+𝛿+𝜑))σπr02
𝐸∗ = ((𝑑+ )(Ρ−𝑄𝜌)− (𝜑+𝑄𝜔))(−𝑑−𝛿−𝜑)
𝑑3+𝛾 (−1+𝛿+𝜑)+𝑑2(𝛾+𝛿+ +𝜑)+𝑑( (𝛿+𝜑)+𝛾(𝛿+ +𝜑)) (10)
𝐼∗ = ((𝑑+ )(Ρ−𝑄𝜌)− (𝜑+𝑄𝜔))𝛾(−𝑑−𝛿−𝜑)
(𝑑+𝛿+𝜑)(𝑑3+𝛾 (−1+𝛿+𝜑)+𝑑2(𝛾+𝛿+ +𝜑)+𝑑( (𝛿+𝜑)+𝛾(𝛿+ +𝜑)))
𝑅∗ =
𝜑+𝑄𝜔+𝛾(−𝑑−𝛿−𝜑)(− (𝜑+𝑄𝜔)+(𝑑+ )(−𝑄𝜌+Ρ))
(𝑑+𝛿+𝜑)(𝑑3+𝛾 (−1+𝛿+𝜑)+𝑑2(𝛾+𝛿+ +𝜑)+𝑑( (𝛿+𝜑)+𝛾(𝛿+ +𝜑)))
𝑑+
𝑉∗ = 𝐿2(𝑑+𝛾)𝜇(𝑑+𝛿+𝜑)
(𝑑+𝜃)(𝛽𝛾+𝛱(𝑑+𝛿+𝜑))σπr02
A. Reproduction Ratio
The reproduction ratio is “the expected number of
secondary cases produced in a completely susceptible
population, by a typical infective individual” [30]. Mishra
& Pandey [31] refers to is as the as the inverse of the
susceptible at the endemic equilibrium. Going by that, the
reproduction number at both sensor fields is given as;

Modeling the effect of Network Access Control and Sensor Random Distribution on Worm Propagation 53
Copyright © 2017 MECS I.J. Modern Education and Computer Science, 2017, 11, 49-57
Sensor Field 1: R0 = 𝛽𝛾𝜎𝜋𝑟0
2
(𝛾+𝑑)(𝜑+𝑑+𝛿) (11)
Sensor Field 2: R0 = 𝛽𝛾𝜎𝜋𝑟0
2
𝐿2(𝑑+𝛾)(𝑑+𝛿+𝜑) (12)
When sensors in the exposed class possess a different
infectivity rate lesser than that of the fully infectious
nodes then the model’s reproduction ratio would certainly
differ from (11) and (12). Using the expression for sensor
field 1 the reproduction number/ratio is (13) while the
reproduction ratio for sensor field 2 is (14).
Sensor Field 1: R0 = (𝛽𝛾+𝛱(𝑑+𝛿+𝜑))σπr0
2
(𝑑+𝛾)(𝑑+𝛿+𝜑) (13)
Sensor Field 2: R0 = (𝛽𝛾+𝛱(𝑑+𝛿+𝜑))σπr0
2
𝐿2(𝑑+𝛾)(𝑑+𝛿+𝜑) (14)
V. SIMULATION RESULTS FOR NAC–SEIRV EPIDEMIC
MODEL
We present the numerical results using Runge-Kutta
Fehlberg method of order 4 and 5 for the NAC-SEIRV
model. The network is assumed to have initial values:
𝑄𝑜= 5; S=100; E=3; I=1; R=0; V=0. Other values used
for the simulation include 𝜆 =0.33; 𝜌 =0.3; 𝜔 =0.01;
𝜂 = 0.001; 휀 = 0.3; 𝛽 = 0.1; 𝛾 =0.25; 𝜑 =0.4; 𝑑 =0.003; 𝛿 = 0.07; 𝜃 = 0.06 ; 𝜇 = 0.3; adapted from the
time history of [29].
A. Sensor Field 1
We observed that at r=1, the responses are the same for
the time histories of [29] (Fig. 3) and NAC-SEIRV (Fig.
4). At r=2 in Fig. 4, the number of exposed sensor nodes
shot up to 51 from the initial 35 exposed sensor nodes at
r=1. Gauging the distribution density and the range
alongside our aznalytical NAC presents some interesting
factors worthy of note. Comparing Fig. 7 of [5] and Fig. 5
shows the impact of NAC. At density = 0.3, r=2 and at
density = 0.5, r=2; the exposed nodes of Fig. 7 is 65 and
72 while the exposed of Fig. 5 is 51 and 53. Even keeping
density constant at 0.5 and increasing r from 2.0 to 2.5
showed the impact of NAC because the 79 exposed nodes
recorded in Fig. 7 was reduced to 57 exposed nodes in
Fig 5.
Fig.3. Time History adapted from [29]
Fig.4. Time History at r=2 and σ = 0.3 for NAC-SEIRV
The impact of NAC becomes more evident if one
considers the behavior of the recovered class for the
model in [29] (Fig. 3) and Fig. 4. While the recovered
class is at 19 sensor nodes for Fig. 3, the recovered class
appreciated for Fig. 4 (i.e. it became 28 sensor nodes).
To further show the effect of NAC, we employ the
results of Nwokoye et al. [5] where there was a notable
increase in the exposed class (Fig. 7) and a decrease of
the vaccinated class (Fig. 8). Keeping density constant at
0.5 and increasing from 2.0 to 2.5 showed the impact of
NAC because the 79 exposed sensor nodes recorded in
Fig. 7 was reduced to 57 exposed nodes in Fig. 5. At
density = 0.3, r=2 and at density =0.5, r=2; the
vaccinated nodes of Fig. 8 is 12 and 15 while the
vaccinated of Fig. 5 is 30. Keeping density constant at 0.5
and increasing the transmission range from 2.0 to 2.5
showed the impact of NAC because the 21 vaccinated
sensor nodes recorded in Fig. 8 increased to 35 exposed
nodes in Fig 6. This implies that increase in worm
infection can be tackled using the NAC.
Fig.5. Infectious vs Exposed for NAC-SEIRV
Fig.6. Susceptible vs Vaccinated for NAC-SEIRV
0 10 20 30 40 50 60 70 80 90 1000
10
20
30
40
50
60
70
80
90
100
TIme
Sen
sor
Pop
ulat
ion
Time History of the Q-SEIRV Model
Susceptible
Exposed
Infectious
Recovered
Vaccinated
0 10 20 30 40 50 600
5
10
15
20
25
Exposed Sensor Nodes
Infe
ctious S
ensor
Nodes
Graph of Infectious Versus Exposed Sensor Nodes
density=0.3, r =2.0
data2
density=0.5, r = 2.0
data4
density=0.5, r = 2.5
data6
0 5 10 15 20 25 30 350
10
20
30
40
50
60
70
80
90
100
Vaccinated Sensor Nodes
Sus
cept
ible
Sen
sor
Nod
es
Graph of Susceptible against Vaccinated Compartment
density=0.3, r = 2.0
data2
density=0.5, r = 2.5
data4
density=0.5, r = 2.5
data6

54 Modeling the effect of Network Access Control and Sensor Random Distribution on Worm Propagation
Copyright © 2017 MECS I.J. Modern Education and Computer Science, 2017, 11, 49-57
Fig.7. Infectious vs Exposed [5]
Fig.8. Susceptible vs Vaccinated [5]
B. Sensor Field 2
To simulate the network (for Sensor Field 2), we
employ the same initial values used for NAC–SEIRV
Epidemic Model (Sensor Field 1).
Fig.9. Time History at r=1 and 𝐿 = 0.5 (NAC)
Fig.10. Time History at r=1.5 and 𝐿 = 0.5 (NAC)
From our simulation results, it is obvious that
increasing the value of r and keeping L constant,
increased the number of exposed nodes and reduced
greatly the number of vaccinated nodes. On the other
hand, NAC has no effect in Sensor field 2. This is clearly
seen if one considers Fig. 9, Fig. 11 and Fig. 10, Fig. 12.
There was no difference between the simulation
experiments that represent the presence (Fig. 9, Fig. 10)
and absence of NAC (Fig 11, Fig 12).
Fig.11. Time History at r=1, 𝐿 = 0.5 (Without NAC)
Fig.12. Time History at r=1.5 and 𝐿 = 0.5 (Without NAC)
C. Two Infectivity Rates
We assume the following initial values for the network;
S=100, E=1, I=1, R=0, V=0. Note that since the exposed
sensor nodes have been adjudged infectious i.e.
possessing some infectivity rate, we reduced the initial
value for the exposed class to 1. The result of the
modification of system of equation (8) is shown as Fig.
13. This figure is similar to the case of vertical
transmission described in Nwokoye, et al [33]; wherein
the exposed class increased due to the birth of a fraction
of the exposed and the infectious nodes.
Fig. 13. Time History at 𝜆=0.33, 휀=0.3, 𝛽=0.5, Π=0.2, 𝛾=0.25, 𝜑=0.02,
d=0.003, 𝛿=0.07, 𝜃=0.06, 𝜇=0.3, 𝜎=0.3, r=1
Note that aside the infectivity rate of the exposed class,
the range and density also contributes to the probable
cause for epidemic in the sensor network.
On the other hand, we performed simulation
experiments in order to observe the impact of NAC when
the infectivity rates of the exposed and the infectious
0 10 20 30 40 50 60 70 800
5
10
15
20
25
30
Exposed Sensor Nodes
Infe
cti
ou
s S
en
so
r N
od
es
Graph of Infectious Nodes Plotted against Exposed Nodes
density=0.3,range=2.00density=0.5,range=2.00density=0.5,range=2.50
0 5 10 15 20 250
10
20
30
40
50
60
70
80
90
100
Vaccinated Sensor Nodes
Su
scep
tib
le S
enso
r N
od
es
Graph of Susceptible Nodes Plotted against Vaccinated Nodes
density=0.3, range=2.0
0
density=0.5, range=2.0
0
density=0.5, range=2.5
0
0 10 20 30 40 50 60 70 80 90 1000
10
20
30
40
50
60
70
80
90
100
Time
Sen
sor
Pop
ulat
ion
Grpah of Sensor Population
Susceptible
Exposed
Infectious
Recovered
Vaccinated
0 10 20 30 40 50 60 70 80 90 1000
10
20
30
40
50
60
70
80
90
100
TIme
Sen
sor
Pop
ulat
ion
Graph of Sensor Population against Time
Susceptible
Exposed
Infectious
Recovered
Vaccinated
0 10 20 30 40 50 60 70 80 90 1000
10
20
30
40
50
60
70
80
90
100
TIme
Sen
sor
Pop
ulat
ion
Graph of Sensor Population (WITHOUT NAC)
Susceptible
Exposed
Infectious
Recovered
Vaccinated
0 10 20 30 40 50 60 70 80 90 1000
10
20
30
40
50
60
70
80
90
100
Time
Sensor
Popula
tion
Graph of Sensor Population (WITHOUT NAC)
Susceptible
Exposed
Infectious
Recovered
Vaccinated
0 10 20 30 40 50 60 70 80 90 1000
10
20
30
40
50
60
70
80
90
100
Time
Sensor
Popula
tion
Graph of Sensor Population
Susceptible
Exposed
Infectious
Recovered
Vaccinated

Modeling the effect of Network Access Control and Sensor Random Distribution on Worm Propagation 55
Copyright © 2017 MECS I.J. Modern Education and Computer Science, 2017, 11, 49-57
sensor nodes are considered. More so the impacts of
NAC are shown using the dynamic behavior of the
recovered class. Fig. 14 and Fig. 15 show the dynamical
behavior of the SEIR-V model (with two infectivity rates)
without NAC and with NAC respectively, at the same
recovery rate (0.4). From the two figures (simulated with
the values of Fig. 13, excepting 𝜑 ), it is evident that
persistent recovery of the sensors is more likely with the
latter (Fig. 15). Specifically, while the recovered class
was 27 sensor nodes for Fig. 14 (without NAC), the
recovered class was 35 sensor nodes for Fig 15 (with
NAC).
Fig.14. Time History of the (Two Infectivity Rate Model) at 𝜑=0.4.
Fig.15. Time History of the (NAC Two Infectivity Rate Model) at
𝜑=0.4
Fig. 14 and Fig. 15 are the results of our modification
using sensor field 1. Since the length of side (L2)
distinguishes sensor field 1 from sensor field 2, it is
necessary to observe its impact on the recovered class of
sensor nodes.
Fig.16. Time History of the Recovered Class at L2= 0.5, 1.0, 2.0
(Without NAC)
Fig.17. Time History of the Recovered Class at L2= 0.5, 1.0, 2.0 (With
NAC)
Fig. 16 shows the impact of length of side on the
SEIR-V model (without NAC). It is evident that the
sensor nodes in the recovered class reduced as the length
increases (from 0.5 to 2.0). This is so with Fig 17 (with
NAC)
VI. CONCLUSION
Our study here explored the
characterization/application of network access control
(NAC) to epidemic models in wireless sensor networks;
considering random distribution of nodes in two different
types of sensor fields. The first sensor field was proposed
by Tang and Mark [19] while the second one was
proposed by Wang, et al. [20]. We believe that NAC may
to some extent remediate immigrant infected nodes;
thereby reducing the importation of infections through
sensor node addition. Other insights on the factors that
increase the node exposure or infectiousness was also
highlighted using several simulation experiments of both
sensor fields. More so we derived the reproduction ratio
of both sensor fields in all the cases x-rayed by our study
herein. Firstly, is the case where only the infectious class
possess infectivity and secondly, the case where both the
exposed and infectious class possess infectivity.
We observed the impact of NAC when our model (for
Sensor field 1) herein was compared with an equivalent
model in literature. Specifically, NAC reduced the
exposed and the infectious compartment.
Correspondingly, it improved the vaccination
countermeasure.
Conversely, the topology described in [20, 26] (Sensor
field 2), was not impacted by NAC if one consider the
behavior of exposed, the infectious and the vaccinated
class. We feel the reason was due to the addition of the
length of side (L). This parameter is non-existent in
Sensor field 1 [19]. The rationale for using [5] for
comparative analyses in NAC-SEIRV for sensor field 1
was because the work has already highlighted the
negative impact of increasing both density and range in
the network. Furthermore, we noticed that increasing the
value of r and keeping L constant, increased the number
of exposed nodes and reduced greatly the number of
vaccinated nodes.
0 10 20 30 40 50 60 70 80 90 1000
5
10
15
20
25
30
Time
Rec
over
ed C
lass
Dynamical Behaviour of the Recovered Class
0 10 20 30 40 50 60 70 80 90 1000
5
10
15
20
25
30
35
40
Time
Recovere
d C
lass
Dynamical Behavior of the Recovered Class
0 10 20 30 40 50 60 70 80 90 1000
5
10
15
20
25
30
Time
Recovere
d C
lass
Time Histories for the Recovered Class
0.5
1.0
2.0
0 10 20 30 40 50 60 70 80 90 1000
5
10
15
20
25
30
35
40
Time
Recovere
d C
lass
Time Histories of the Recovered Class
0.51.0
2.0

56 Modeling the effect of Network Access Control and Sensor Random Distribution on Worm Propagation
Copyright © 2017 MECS I.J. Modern Education and Computer Science, 2017, 11, 49-57
On the case of infectivity at both the exposed and
infectious class (described with the simulation results of
section V, subsection C), we observed a better recovery
of the sensor network. However, it is clear that NAC is
not entirely an almighty solution to a worm-laden sensor
network i.e. network managers should entrench practices
that increase the recovery tendencies of sensors. Then
with the addition of NAC the network becomes fortified
against external importation of infection. Additionally,
the length of side impacted the recovered class for both
sensor fields.
The above analyses will impact sensor deployment
decisions in organizations that use wireless sensor
networks. Specifically, it will inform them on the factors
that inhibit/aid worm propagation. Furthermore, we
would apply other network characteristics/protocols in
order to check its effect in worm propagation and
containment.
ACKNOWLEDGMENT
We thank the anonymous reviewers that read our
manuscript and their keen efforts directed at ensuring
accuracy of our work.
REFERENCES
[1] I. F. Akyildiz, W. Su, Y. Sankarasubramaniam and E.
Cayirci, “Wireless sensor networks: A survey”, Computer
Networks, vol. 38, 4, pp. 393–422, 2002.
[2] D. Buch and D. Jinwala, “Prevention of wormhole attack
in wireless sensor network”, International Journal of
Network Security & Its Applications (IJNSA), vol. 3, pp.
85–98, 2011.
[3] C. H. Nwokoye, I. Umeh, M. Nwanze, B. F. Alao,
“Analyzing time delay and sensor distribution in sensor
networks”, IEEE African Journal of Computing & ICT 8,
vol. 1, pp. 159–164, 2015.
[4] A. Gupta and A. K. Gupta, “A survey: Detection and
prevention of wormhole attack in wireless sensor
networks”, Global Journal of Computer Science and
Technology: E Network, Web & Security, vol. 14, pp. 23–
31, 2014.
[5] C. H. Nwokoye, V. E. Ejiofor, R. Orji, I. Umeh and N.
Mbeledogu, Investigating the effect of uniform random
distribution of nodes in wireless sensor networks using an
epidemic worm model”, Proceedings of the 2nd
International Conference on Computing Research and
Innovations (CoRI’16), pp. 58–63, 2016.
[6] T. Giannetsos, T. Dimitriou and N. R. Prasad, “Self-
propagating worms in wireless sensor networks”, ACM
CoNEXT - Student Workshop’09, pp. 31–32, 2009.
[7] U. Narayanan and A. Soman, “Attack and counter
measurement of worm hole and false data injection in
wireless sensor networks: A survey. International Journal
of Advanced Research in Computer and Communication
Engineering, vol. 2, pp 2–6, 2013.
[8] W. O. Kermack and A. G. McKendrick, "A Contribution
to the Mathematical Theory of Epidemics," Proceedings
of the Royal Society A: Mathematical, Physical and
Engineering Sciences, vol. 115, pp. 700–721, 1927.
[9] W. O. Kermack and A. G. McKendrick, "Contributions to
the mathematical theory of epidemics. ii. the problem of
endemicity," Proceedings of the Royal Society of London.
Series A., vo1. 38i834, pp. 55–83, 1932.
[10] W. O. Kermack and A. G. McKendrick, "Contributions to
the mathematical theory of epidemics. III. Further studies
of the problem of endemicity," Proceedings of the Royal
Society of London. Series A, Containing Papers of a
Mathematical and Physical Character, vol. 141, pp. 94–
122, 1933.
[11] B. K. Mishra and D. K. Saini, “Mathematical models on
computer viruses”, Applied Mathematics and
Computation, vol. 187, pp. 929–936, 2007.
[12] T. Richard and C. Mark, “Epidemiological modelling of
peer-to-peer viruses and pollution”. Proceedings - IEEE
INFOCOM, 2006.
[13] B. K. Mishra and N. Keshri, "Mathematical model on the
transmission of worms in wireless sensor network,"
Applied Mathematical Modelling vol. 37, pp. 4103–4111,
2013. http://doi.org/10.1016/j.apm.2012.09.025
[14] L. Chunbo and J. Chunfu, “Modeling passive propagation
of malwares on the WWW”, Physics Procedia, vol. 33, pp.
271–278, 2012.
[15] Y. Yao, L. Guo, H. Guo, G. Yu, F. X. Gao and X. J. Tong,
“Pulse quarantine strategy of internet worm propagation:
Modeling and analysis”, Computers and Electrical
Engineering, vol. 38, pp. 1047–1061, 2012.
[16] S. A. Khayam and H. Radha, "A topologically-aware
worm propagation model for wireless sensor networks",
25th IEEE International Conference on Distributed
Computing Systems Workshops, IEEE, pp. 210–216, 2005.
[17] S. A. Khayam and H. Radha, "Using Signal Processing
Techniques to Model Worm Propagation over Wireless
Sensor Networks," IEEE Signal Processing Magazine, pp.
164–169, 2006.
[18] P. De, Y. Liu, and S. K. Das, "An epidemic theoretic
framework for evaluating broadcast protocols in wireless
sensor networks. 2007 IEEE International Conference on
Mobile Adhoc and Sensor Systems, IEEE, pp 1–9, 2007.
[19] S. Tang and Brian L. Mark, "Analysis of virus spread in
wireless sensor networks: An epidemic model,"
Proceedings of the 2009 7th International Workshop on
the Design of Reliable Communication Networks, DRCN
2009: pp. 86–91, 2009.
http://doi.org/10.1109/DRCN.2009.5340022
[20] X. Wang and Y. Li, "An improved SIR model for
analyzing the dynamics of worm propagation in wireless
sensor networks," Chinese Journal of Electronics, vol. 18,
2009.
[21] X. Wang, Q. Li, and Y. Li, "EiSIRS: A formal model to
analyze the dynamics of worm propagation in wireless
sensor networks," Journal of Combinatorial Optimization,
vol. 20, pp. 47–62, 2010. http://doi.org/10.1007/s10878-
008-9190-9
[22] Y. Wang and X. Yang, "Virus spreading in wireless
sensor networks with a medium access control
mechanism," Chinese Physics B, vol. 22, 40200-40206,
2013. http://doi.org/10.1088/1674-1056/22/4/040206
[23] B. K. Mishra, S. K. Srivastava, and B. K. Mishra, "A
quarantine model on the spreading behavior of worms in
wireless sensor network. Transaction on IoT and Cloud
Computing, vol. 2, pp. 1–12, 2014.
[24] B. K. Mishra and I. Tyagi, "Defending against malicious
threats in wireless sensor network: A mathematical
model", International Journal of Information Technology
and Computer Science, vol. 6, pp. 12–19, 2014.
[25] Z. Zhang and F. Si, "Dynamics of a delayed SEIRS-V
model on the transmission of worms in a wireless sensor
network," Advances in Difference Equations: pp. 1–15,
2014.

Modeling the effect of Network Access Control and Sensor Random Distribution on Worm Propagation 57
Copyright © 2017 MECS I.J. Modern Education and Computer Science, 2017, 11, 49-57
http://doi.org/http://www.advancesindifferenceequations.c
om/content/2014/1/295
[26] L. Feng, L. Song, Q. Zhao, and H. Wang, “Modeling and
stability analysis of worm propagation in wireless sensor
network. Mathematical Problems in Engineering, 2015.
[27] I. Butun and R. Sankar, “A brief survey of access control
in wireless sensor networks”, The 8th Annual IEEE
Consumer Communications and Networking Conference,
pp. 1118–1119, 2011.
[28] Y. Zhou, Y. Zhang, and Y. Fang, “Access control in
wireless sensor networks”, Ad Hoc Networks, vol. 5, pp.
3–13, 2007.
[29] C. H. Nwokoye, V. E. Ejiofor and C. G. Ozoegwu, "Pre-
Quarantine approach for defense against propagation of
malicious objects in networks," International Journal of
Computer Network and Information Security (IJCNIS),
vol. 9, pp. 43-52, 2017. doi:10.5815/ijcnis.2017.02.06
[30] O. Diekmann, J. A. P. Heesterbeek and J. A. J. Metz, “On
the definition and the computation of the basic
reproduction ratio r0 in models for infectious diseases in
heterogeneous populations. Journal of Mathematical
Biology, vol. 28, pp. 365–382, 1990.
[31] B. K. Mishra and S. K. Pandey, "Dynamic model of
worms with vertical transmission in computer network,"
Applied Mathematics and Computation, vol. 217, pp.
8438–8446, 2011.
[32] S. Yinbiao, K. Lee and P. Lanctot, “Internet of
Things:Wireless Sensor Networks, 2014.
[33] C. H. Nwokoye, V. E. Ejiofor, M. O. Onyesolu and B.
Ekechukwu,"Towards modeling malicious agents in
decentralized wireless sensor networks: a case of vertical
worm transmissions and containment", International
Journal of Computer Network and Information Security
(IJCNIS), vol.9, pp.12-21, 2017. DOI:
10.5815/ijcnis.2017.09.02.
Authors’ Profiles
ChukwuNonso H. Nwokoye obtained a
BSc degree in Computer Science. He is an
ACM SIGCHI Gary Marsden student
award recipient. His interests include
simulation and modeling of complex
systems, agent-based modeling, wireless
sensor networks and network security,
social computing and computer supported
cooperative work (CSCW). He is currently working on
modeling and analysis of the propagation of malicious objects
in network environments using analytical and agent-based
modeling approaches.
Njideka N. Mbeledogu is a lecturer at
the Department of Computer Science,
Nnamdi Azikiwe University, Awka,
Nigeria. She holds Bachelor of Science
(BSc), Master of Science (MSc) and PhD
degrees in Computer Science. She is a
member of the Computer Professional of
Nigeria (CPN) and the Nigerian
Computer Society (NCS). Her interests include Network
Security, Neural Networks and Fuzzy logic.
Ikechukwu I. Umeh is a lecturer in the
Department of Computer Science,
Nnamdi Azikiwe University, Awka,
Nigeria. He holds a Bachelor of Science
degree and a Master of Science degree in
Computer Science. He is currently
pursuing a doctoral degree in the same
field. His interests include computer
networks, information systems and
mathematical modeling.
Ihekeremma, A. Ejimofor is a lecturer at
the Department of Computer Engineering,
Faculty of Engineering, Madonna
University, Enugu, Nigeria. She holds a
Bachelor of Engineering degree in
Computer Engineering and a Master of
Science degree in Computer Science. She
is currently pursuing her PhD degree in
Computer Science in Nnamdi Azikiwe University, Awka,
Nigeria. Her interests include Networks security, Experts
systems and Big data analytics.
How to cite this paper: ChukwuNonso H. Nwokoye, Njideka Mbeledogu, Ikechukwu I. Umeh, Ihekeremma, A.
Ejimofor, "Modeling the effect of Network Access Control and Sensor Random Distribution on Worm Propagation",
International Journal of Modern Education and Computer Science(IJMECS), Vol.9, No.11, pp. 49-57, 2017.DOI:
10.5815/ijmecs.2017.11.06