Embed Size (px)
Citation preview

EFFECT OF ENVIRONMENTAL FACTORS ON ADAS SENSOR PERFORMANCE
OCTOBER 2021
NewsRoom.AAA.com

2 | P a g e
EFFECT OF ENVIRONMENTAL FACTORS ON
ADAS SENSOR PERFORMANCE
(this page intentionally left blank)

3 | P a g e
EFFECT OF ENVIRONMENTAL FACTORS ON
ADAS SENSOR PERFORMANCE
ABSTRACT
Advanced driver assistance systems (ADAS) are becoming increasingly integrated within new vehicles sold
in the United States. However, the majority of publicly available performance evaluations occur within
idealized operating conditions in terms of weather, time of day, and sensor status, which are typically
unrepresentative of naturalistic environments. To evaluate the performance of ADAS in suboptimal
conditions, four popular crossover vehicles equipped with lane keeping assist and automatic emergency
braking systems were tested in a number of simulated environmental scenarios.
Research Questions:
1. How do vehicles equipped with lane keeping assist and automatic emergency braking systems
perform during scenarios with simulated rainfall relative to baseline conditions?
a. Lane keeping on a roadway with well-defined lane markers
b. Reacting to a simulated stationary vehicle in the travel lane
2. How do vehicles equipped with lane keeping assist and automatic emergency braking systems
perform during scenarios with a dirty windshield (i.e., bugs and dirt) relative to baseline conditions?
a. Lane keeping on a roadway with well-defined lane markers
b. Reacting to a simulated stationary vehicle in the travel lane
Key Findings:
1. In general, evaluated lane keeping assist and automatic emergency braking systems were influenced
by simulated rainfall.
a. In terms of lane keeping performance, 69 percent of test runs conducted with simulated
rainfall resulted in the test vehicle crossing the lane marker on the roadway.
b. In aggregate, 17 and 33 percent of test runs conducted with simulated rainfall resulted in a
collision for test speeds of 25 and 35 mph, respectively.
2. In general, evaluated lane keeping assist and automatic emergency braking systems were minimally
influenced by a dirty windshield.
a. While minor differences were noted with respect to baseline conditions, lane keeping
performance was not negatively influenced by a dirty windshield.
b. No test runs conducted with a dirty windshield resulted in a collision for either 25mph or
35mph test speeds.
4 | P a g e
EFFECT OF ENVIRONMENTAL FACTORS ON
ADAS SENSOR PERFORMANCE
CONTENTS
I. Introduction.................................................................................................................................................... 7
II. Background ................................................................................................................................................... 8
III. Vehicle Selection Methodology..................................................................................................................... 9
IV. Test Equipment and Resources ................................................................................................................... 9
A. Vehicle Dynamics Equipment ................................................................................................................... 9
2) Data Acquisition System—dSPACE MicroAutoBox (MABX) .............................................................. 10
3) Visual/Audible Sensors ........................................................................................................................ 11
4) DRI Soft Car 360 ................................................................................................................................. 11
5) Simulated Rain System ....................................................................................................................... 12
B. Test Facility.............................................................................................................................................. 13
V. Vehicle Preparation ..................................................................................................................................... 13
VI. Inquiry 1: How do vehicles equipped with lane keeping Assistance and automatic emergency braking
systems perform during scenarios with simulated rainfall relative to Baseline conditions? ............................. 14
A. Objective .................................................................................................................................................. 14
B. Methodology ............................................................................................................................................ 14
1) Lane Placement ................................................................................................................................... 14
2) Automatic Emergency Braking ............................................................................................................ 15
C. Test Results ......................................................................................................................................... 16
1) Lane Placement ................................................................................................................................... 16
2) Automatic Emergency Braking ............................................................................................................ 23
D. Summary of Test Results .................................................................................................................... 27
1) Lane Placement ................................................................................................................................... 27
2) Automatic Emergency Braking ............................................................................................................ 27
VII. Inquiry 2: How do vehicles equipped with lane keeping assistance and automatic emergency braking
systems perform during scenarios conducted with a dirty windshield relative to baseline conditions? ........... 30
A. Objective .................................................................................................................................................. 30
B. Methodology ............................................................................................................................................ 30
1) Lane Placement ................................................................................................................................... 30
2) Automatic Emergency Braking ............................................................................................................ 31
C. Test Results ......................................................................................................................................... 32
1) Lane Placement
......... 32
2) Automatic Emergency Braking (AEB) ................................................................................................. 39
D. Summary of Test Results .................................................................................................................... 43
1) Lane Placement ................................................................................................................................... 43
2) Automatic Emergency Braking (AEB) ................................................................................................. 44
VIII. Overall Conclusions .................................................................................................................................... 46
IX. Key Findings................................................................................................................................................ 47
X. Summary Recommendations ..................................................................................................................... 47
XI. References .................................................................................................................................................. 48
occluded cameras
5 | P a g e
EFFECT OF ENVIRONMENTAL FACTORS ON
ADAS SENSOR PERFORMANCE
Appendix ............................................................................................................................................................. 49
FIGURES
Figure 1: Fully autonomous vehicles will be required to analyze and react to highly
dynamic environments ........................................................................................................................... 7
Figure 2: OxTS RT3000 v2 specifications ....................................................................................................... 11
Figure 3: OxTS RT-Range Hunter specifications ............................................................................................ 11
Figure 4: Data acquisition system and sensors installed in test vehicle ......................................................... 12
Figure 5: Light sensor for characterization of visual system alerts ................................................................. 12
Figure 6: DRI Low Profile Robotic Vehicle (Static Base) ................................................................................. 13
Figure 7: Simulated Rain System .................................................................................................................... 13
Figure 8: Rain system injector nozzle and mount. ........................................................................................... 14
Figure 9: Test lane for closed-course evaluation ............................................................................................. 15
Figure 10: 2020 Buick Enclave averaged baseline lane placement and individual runs
with simulated rainfall ........................................................................................................................... 18
Figure 11: Spearman correlation coefficients for individual runs with respect to characteristic
baseline run .......................................................................................................................................... 18
Figure 12: 2020 Buick Enclave averaged baseline and simulated rainfall lane placement ............................ 19
Figure 13: 2020 Hyundai Santa Fe average baseline lane placement and individual runs
with simulated rainfall .......................................................................................................................... 20
Figure 14: Spearman correlation coefficients for individual runs with respect to characteristic
baseline run .......................................................................................................................................... 20
Figure 15: 2020 Hyundai Santa Fe averaged baseline and simulated rainfall lane placement ..................... 21
Figure 16: 2020 Toyota RAV4 average baseline lane placement and individual runs
with simulated rainfall ........................................................................................................................... 22
Figure 17: Spearman correlation coefficients for individual runs with respect to characteristic
baseline run .......................................................................................................................................... 23
Figure 18: 2020 Toyota RAV4 averaged baseline and simulated rainfall lane placement ............................. 23
Figure 19: 2020 Volkswagen Tiguan average baseline lane placement and individual runs
with simulated rainfall .......................................................................................................................... 24
Figure 20: 2020 Buick Enclave individual run data at 25 mph with simulated rainfall .................................... 25
Figure 21: 2020 Buick Enclave individual run data at 35 mph with simulated rainfall .................................... 26
Figure 22: 2020 Hyundai Santa Fe individual run data at 25 mph with simulated rainfall .............................. 26
Figure 23: 2020 Hyundai Santa Fe individual run data at 35 mph with simulated rainfall .............................. 27
Figure 24: 2020 Toyota RAV4 individual run data at 25 mph with simulated rainfall ..................................... 28
Figure 25: 2020 Toyota RAV4 individual run data at 35 mph with simulated rainfall ..................................... 28
Figure 26: Average impact speed and final separation distance for each test vehicle at 25 mph ................. 29
Figure 27: Average impact speed and final separation distance for each test vehicle at 35 mph ................. 30
Figure 28: Averaged data for each test vehicle at 25 mph .............................................................................. 30
Figure 29: Averaged data for each test vehicle at 35 mph .............................................................................. 31
6 | P a g e
EFFECT OF ENVIRONMENTAL FACTORS ON
ADAS SENSOR PERFORMANCE
Figure 30: Spot pattern of stamp applicator ..................................................................................................... 32
Figure 31: 2020 Buick Enclave average baseline lane placement and individual runs
with bugs and dirt ................................................................................................................................. 34
Figure 32: Spearman correlation coefficients for individual runs with respect to characteristic
baseline run .......................................................................................................................................... 35
Figure 33: 2020 Buick Enclave averaged baseline and bugs and dirt placement .......................................... 35
Figure 34: 2020 Hyundai Santa Fe average baseline lane placement and individual runs
with bugs and dirt ................................................................................................................................. 36
Figure 35: Spearman correlation coefficients for individual runs with respect to characteristic
baseline run .......................................................................................................................................... 37
Figure 36: 2020 Hyundai Santa Fe averaged baseline and bugs and dirt placement .................................... 37
Figure 37: 2020 Toyota RAV4 average baseline lane placement and individual runs
with bugs and dirt ................................................................................................................................. 38
Figure 38: Spearman correlation coefficients for individual runs with respect to characteristic
baseline run .......................................................................................................................................... 38
Figure 39: 2020 Toyota RAV4 averaged baseline and bugs and dirt placement ........................................... 39
Figure 40: 2020 Volkswagen Tiguan average baseline lane placement and individual runs
with bugs and dirt ................................................................................................................................. 40
Figure 41: Spearman correlation coefficients for individual runs with respect to characteristic
baseline run .......................................................................................................................................... 40
Figure 42: 2020 Volkswagen Tiguan averaged baseline and bugs and dirt placement ................................. 41
Figure 43: 2020 Buick Enclave individual run data at 25 mph with occluded cameras .................................. 42
Figure 44: 2020 Buick Enclave individual run data at 35 mph with occluded cameras .................................. 42
Figure 45: 2020 Hyundai Santa Fe individual run data at 25 mph with occluded cameras ............................ 43
Figure 46: 2020 Hyundai Santa Fe individual run data at 35 mph with occluded cameras ............................ 44
Figure 47: 2020 Toyota RAV4 individual run data at 25 mph with occluded cameras ................................... 44
Figure 48: 2020 Toyota RAV4 individual run data at 35 mph with occluded cameras ................................... 45
Figure 49: Average impact speed and final separation distance at 25 mph ................................................... 46
Figure 50: Average impact speed and final separation distance at 35 mph ................................................... 47
Figure 51: Averaged data for each test vehicle at 25 mph .............................................................................. 48
Figure 52: Averaged data for each test vehicle at 35 mph .............................................................................. 48

7 | P a g e
EFFECT OF ENVIRONMENTAL FACTORS ON
ADAS SENSOR PERFORMANCE
I. INTRODUCTION
Inclusion of various types of advanced driver assistance systems (ADAS) in the majority of new vehicles sold
in the United States could result in significant reductions in fatalities, personal injury, and property damage. A
2018 AAA Foundation analysis estimated that if driver assistance technologies were installed on all vehicles,
they would have had the potential to help prevent or mitigate roughly 40 percent of all crashes involving
passenger vehicles [1]. Additionally, the Insurance Institute of Highway Safety reported that vehicles
equipped with forward collision warning with automatic emergency braking were involved in 50 percent fewer
police-reported front-to-rear collisions compared to vehicles without the technology [2]. With the
demonstrated effectiveness of ADAS, it is imperative that further development and refinement of existing
systems receive sustained emphasis.
Figure 1: Fully autonomous vehicles will be required to analyze and react to highly dynamic
environments Image Source: AAA
The ADAS test procedures utilized by most automakers and vehicle safety organizations specify idealized
environmental test conditions. This specification is beneficial in terms of maximum test repeatability by
limiting the inclusion of additional independent variables. However, it must be noted that naturalistic
environments do not exist in a vacuum; rain, fog, sleet, and snow are frequently encountered by drivers, and
vehicle sensors are in various states of cleanliness depending on individual ownership habits.
The purpose of this research is to provide insight into ADAS performance in the context of conditions
frequently encountered in naturalistic environments. Within this work, crossover vehicles with both lane
keeping assistance and automatic emergency braking systems were selected for evaluation in environments
consisting of simulated rain and image sensors occluded by bugs and dirt. All testing activities were
conducted on a closed-course and included various lane keeping and braking scenarios.
AAA recommends that testing initiatives utilized by the automotive industry incorporate suboptimal conditions
within a comprehensive set of evaluation criteria related to ADAS.

8 | P a g e
EFFECT OF ENVIRONMENTAL FACTORS ON
ADAS SENSOR PERFORMANCE
II. BACKGROUND
ADAS comes in many forms and can be broadly characterized as an active or passive system. Active ADAS
refers to a system that provides lateral and/or longitudinal vehicle control in a sustained or temporary
manner. Examples include active driving assistance, automatic emergency braking, lane keeping assistance,
and adaptive cruise control. In contrast, passive ADAS notifies the driver of an impending collision but does
not intervene with lateral or longitudinal vehicle motion. Examples include blind spot warning, forward
collision warning, rear cross traffic warning, and lane departure warning.
ADAS relies on a variety of sensors in order to gather information related to the surrounding environment.
Sensors consist of a hardware and a software component. The hardware component is composed of the
physical components necessary to convert information related to the surrounding environment into a digital
signal. The software component is responsible for converting raw analog data into useful information about
the dynamic environment surrounding the vehicle as well as determining an appropriate vehicle response.
Depending on the type of sensor, external influences such as weather and sensor cleanliness can have
various effects on operation. Specifically, radar1 sensors are minimally affected by rain, snow, and fog
relative to other sensor types and function equally well in lighting conditions ranging from complete darkness
to blinding sun. Additionally, radar sensors tend to be less affected by bugs and dirt because they are
frequently placed behind plastic bumper covers. In cases where radar sensors are exposed, emitted radio
energy can penetrate these particles with minimal attenuation. However, systems such as lane keeping
assistance or lane departure warning systems require integration of additional sensors because radar is not
effective at discerning object detail and cannot detect variations on a flat surface, such as lane markings.
Image sensors (cameras) are currently utilized for object classification and to track lane markings. Depending
on the type of electromagnetic radiation (visible, near-infrared, medium wave infrared, etc.) detected by the
camera, the sensitivity to weather and dirt varies. Cameras that detect energy in the visible spectrum are
most affected by weather, lighting conditions, and bugs/dirt relative to cameras specific to the infrared
spectrum.
Automatic emergency braking systems utilize front-facing radar and/or camera(s) to obtain kinematic data
pertaining to surrounding vehicles and objects. Lane keeping assistance systems currently rely on one or
more cameras to track the position of lane markers. Lane keeping assistance and automatic emergency
braking systems effect sustained lateral and temporary longitudinal motion control, respectively.
Currently, lidar2 sensors are not commonly utilized for lane keeping assistance and lane departure warning
systems; however, many analysts believe these sensors will become more widespread within ADAS and
eventual autonomous driving systems with further refinement. Some remaining challenges include the
aesthetic integration of lidar modules within the vehicle design, complexity, dependability, and cost.
1 The origin of the word radar is as an acronym for RAdio Detection And Ranging. 2 The origin of the word lidar is as an acronym for LIght Detection And Ranging.

9 | P a g e
EFFECT OF ENVIRONMENTAL FACTORS ON
ADAS SENSOR PERFORMANCE
III. VEHICLE SELECTION METHODOLOGY
AAA researchers utilized SBD Automotive’s ADAS and Autonomy Database and information from owner’s
manuals to verify test vehicles were equipped with both lane keeping assistance and automatic emergency
braking systems. In order to be eligible for testing, vehicles were required to be equipped with a lane keeping
assistance system capable of sustained operation and an automatic emergency braking system that provides
active intervention upon detection of an impending collision. Crossover vehicles were selected for evaluation
because of their continuing popularity in the United States. In 2020, sales of crossovers and utility vehicles
accounted for 50 percent of the new vehicle market share [3].
Additionally, the following criteria were utilized for vehicle selection:
Inclusion of domestic and import OEMs including European and Asian manufacturers
Variety of manufacturers (only one vehicle per manufacturer will be tested)
Based on the preceding requirements, the following vehicles were selected for testing:
2020 Buick Enclave Avenir with Automatic Emergency Braking and Lane Keep Assist
2020 Hyundai Santa Fe with Forward Collision Avoidance Assist and Lane Keeping Assist
2020 Toyota RAV4 with Pre-Collision System and Lane Tracing Assist
2020 Volkswagen Tiguan3 with Front Assist and Lane Assist
Additional information related to vehicle identification numbers, setup pictures, and measurements
can be found within the appendix of this report.
IV. TEST EQUIPMENT AND RESOURCES
Equipment specifications and illustrations are referenced in Figures 2–6.
A. Vehicle Dynamics Equipment
a) Oxford Technical Solutions (OxTS) RT3000 v2 and RT-Range Hunter
Each vehicle was outfitted with an OxTS RT3000 v2 to capture vehicle kinematic information and an OxTS
RT-Range Hunter to process vehicle-to-lane and vehicle-to-vehicle measurements relative to the vehicle
under test. The RT3000 interfaced with a site-installed base station to incorporate real-time kinematics (RTK)
technology. The RT-Range Hunter interfaced with targets via XLAN.
3 Upon conclusion of testing, it was determined the VW Tiguan does not use the ADAS camera for automatic
emergency braking (AEB) as is relies solely on the forward mounted radar. As a result, the VW Tiguan tests results for
automatic emergency braking are not included within this test report.

10 | P a g e
EFFECT OF ENVIRONMENTAL FACTORS ON
ADAS SENSOR PERFORMANCE
Figure 2: OxTS RT3000 v2 specifications Image Source: AAA
Figure 3: OxTS RT-Range Hunter specifications Image Source: AAA
2) Data Acquisition System—dSPACE MicroAutoBox (MABX)
Sensor inputs and data from the OxTS instrumentation were logged and time synced. Vehicle kinematics and
range data were captured at a rate of 100 Hz; the visual and audible alert data were logged at a rate of
100 Hz and 10 000 Hz, respectively. The data acquisition system was equipped with anti-aliasing filters to
attenuate frequencies above the Nyquist frequency.
Figure 4: Data acquisition system and sensors installed in test vehicle Image Source: AAA

11 | P a g e
EFFECT OF ENVIRONMENTAL FACTORS ON
ADAS SENSOR PERFORMANCE
3) Visual/Audible Sensors
Each test vehicle was equipped with a light sensor and a microphone to capture visual and audible warnings
provided by the lane keeping assistance or automatic emergency braking system.
Figure 5: Light sensor for characterization of visual system alerts Image Source: AAA
4) DRI Soft Car 360
Figure 6: DRI Low Profile Robotic Vehicle (Static Base) Image Source: AAA
The Soft Car 360® is calibrated to be representative of a small passenger vehicle relevant to automotive
sensors including radar and cameras. The hatchback model was utilized for testing; its length, width, and
height are 158 in, 67 in, and 56 in, respectively.

12 | P a g e
EFFECT OF ENVIRONMENTAL FACTORS ON
ADAS SENSOR PERFORMANCE
5) Simulated Rain System
To simulate the effect of rainfall on advanced driver assistance cameras mounted behind the windshield, a
custom fabricated system was mounted in the vehicle.
Figure 7: Simulated Rain System Image Source: AAA
This system was designed to be a stand-alone component that could be secured in the cargo area and not
move under decelerations exhibited in a typical automatic emergency braking event. To minimize variations
in water volume and spray pattern, a precision injector nozzle and water/methanol high-pressure injection
pump was utilized to ensure a consistent flowrate of 1L/min. A 5-gallon reservoir was integrated to allow for
continuous execution of all test runs for each vehicle. The nozzle was positioned such that the spray pattern
covered the entire windshield.
Figure 8: Rain system injector nozzle and mount. Image source: AAA

13 | P a g e
EFFECT OF ENVIRONMENTAL FACTORS ON
ADAS SENSOR PERFORMANCE
For all test vehicles, radar sensors were not targeted with simulated rainfall due to variations in sensor
placement in addition to the theorized minimal effect of rainfall on sensor performance.
B. Test Facility
All track testing was conducted on closed surface streets on the grounds of the Auto Club Speedway in
Fontana, CA. All testing was conducted on a dry asphalt surface free of visible moisture. The test lane was
characterized by a width of 12 feet and a testing length of approximately 1900 feet. The lane marker on the
right consisted of a solid white line while the lane marker on the left consisted of a broken white line divided
into portions of equal length. The lane was generally straight with the exception of a slight right curve at the
end of the testing portion. The pavement was in good condition with some minor ruts; this is representative of
most well-maintained public roadways.
Figure 9: Test lane for closed-course evaluation Image Source: AAA
Before testing, the test lane was mapped using OxTS Lane Survey and Map Creation software.
V. VEHICLE PREPARATION
All vehicles were procured directly from manufacturers or specialty rental fleets. Any vehicles procured
from a specialty rental company were sourced directly from the inventory of a new vehicle
dealership. All test vehicles were evaluated in the “as received” condition from the manufacturer or specialty
rental company.

14 | P a g e
EFFECT OF ENVIRONMENTAL FACTORS ON
ADAS SENSOR PERFORMANCE
All test vehicles were verified to be equipped with lane keeping assistance and automatic emergency braking
systems that were enabled and free of modifications. The odometer reading of all test vehicles was between
500 and 15,000 miles at the start of testing.
Additionally, vehicles were inspected to verify testing suitability according to the following checklist:
No warning lights illuminated All system components free of damage and unaffected by any technical service bulletins and/or
recalls Any stored diagnostic trouble codes resolved and cleared
All fluid reservoirs filled to at least the minimum indicated levels Before the start of each testing day, the areas surrounding the image and radar sensors on all test vehicles
were cleaned to ensure proper system operation.
VI. INQUIRY 1: HOW DO VEHICLES EQUIPPED WITH LANE KEEPING ASSISTANCE AND AUTOMATIC
EMERGENCY BRAKING SYSTEMS PERFORM DURING SCENARIOS WITH SIMULATED RAINFALL
RELATIVE TO BASELINE CONDITIONS?
A. Objective
Evaluate the effect of rainfall on lane keeping assistance and automatic emergency braking system
performance relative to baseline conditions.
B. Methodology
In order to evaluate system performance with sufficient repeatability, closed-course testing was utilized to
ensure a controlled environment with consistent testing conditions.
1) Lane Placement
Lane keeping assistance systems are designed to assist the driver by providing lateral vehicle control on
straight and slightly curved sections of roadway. Depending on the system, either sustained or corrective
control is provided. To evaluate the impact of rainfall on these systems, researchers evaluated system
performance under baseline conditions and repeated testing with simulated rainfall. Within this work, the
baseline is defined as daylight with no rain or fog. Additionally, testing was not conducted in low sun-angle
conditions (i.e., sunrise or sunset) under any circumstance. To minimize the impact of varying sun angles
and other environmental considerations, test runs with simulated rainfall were conducted immediately after
completion of baseline test runs. For all test runs with simulated rainfall, the windshield wipers were engaged
at the mid-range continuous speed setting.
For each vehicle, four test runs were performed for both baseline and simulated rainfall conditions. For a test
run to be considered valid, the test driver was required to accelerate the vehicle to a steady-state speed of
45 mph and ensure the lane keeping assistance system was engaged prior to entering the mapped portion of
the test lane. To ensure steady-state speed throughout the test run, adaptive cruise control was engaged.
The test driver loosened their grip on the steering wheel once the vehicle was up to target speed and
reached virtual starting gate for the test. The released grip / light touch of the steering wheel enabled the

15 | P a g e
EFFECT OF ENVIRONMENTAL FACTORS ON
ADAS SENSOR PERFORMANCE
driver to maintain control of the vehicle while allowing the vehicle to steer without external inputs. If the test
vehicle laterally deviated outside of the lane markers prior to reaching the end of the mapped testing lane,
the test run was terminated and counted as a valid run.
The raw data from each test run consisted of the lateral offset of the vehicle center relative to the right
shoulder of the mapped test lane. This metric was calculated with respect to the longitudinal vehicle position
relative to the beginning of the mapped test lane. Bessel spline interpolation was performed on each run to
calculate the lateral lane position at 50 cm increments. For each test condition, the resulting four
interpolations from baseline and simulated rainfall conditions were combined to determine the average lateral
lane placement throughout the entirety of the mapped test lane. For interpretation purposes, the average of
individual baseline test runs is considered the “characteristic” run. The standard error associated with each
run of interpolated data points was graphed as an upper and lower bound of the averaged measurement.
This represents a quantitative measure of consistency between individual test runs.
For each vehicle, the average graphs for baseline and simulated rainfall conditions were graphed to illustrate
general differences in lane placement and/or consistency along the mapped test lane. Additionally, the
Spearman correlation between individual runs with simulated rainfall and the characteristic baseline run was
calculated; positive values close to one indicate a strong correlation, negative values close to one indicate an
opposite correlation and values near zero indicate no correlation.
2) Automatic Emergency Braking
It is common to encounter stopped or slow-moving vehicles in a variety of driving environments. Automatic
emergency braking systems can prevent or mitigate the severity of a collision if the driver does not
sufficiently react. To evaluate the impact of rainfall on these systems, researchers evaluated system
performance under baseline conditions and repeated testing with the simulated rainfall system activated.
Within this work, the baseline is defined as daylight with no rain or fog. Additionally, testing was not
conducted in low sun-angle conditions under any circumstance. To minimize the impact of varying sun
angles and other environmental considerations, test runs with simulated rainfall were conducted immediately
after completion of baseline test runs. For all test runs with simulated rainfall, the windshield wipers were
engaged at the mid-range continuous speed. For vehicles with multiple continuous settings, the setting below
the fastest speed was utilized.
The DRI Soft Car 360® was utilized to simulate a stationary vehicle centered in the testing lane (herein
referred to as the “target vehicle”). For each test vehicle, speeds of 25 mph and 35 mph were evaluated. For
each speed, four runs were performed for both baseline and occluded camera conditions unless significant
impact occurred for the first two runs. In this case, additional runs were not performed to minimize vehicle
damage.
For the test run to be valid, the test driver was required to reach a steady-state target speed (25mph or
35mph) with adaptive cruise control engaged a minimum of 1,500 feet behind the target vehicle. As the test
vehicle approached the target vehicle, no driver intervention was applied until contact was made with the
target vehicle (if applicable). For each run, the following parameters were captured:
Detection distance (ft)
Detection time-to-collision (s)

16 | P a g e
EFFECT OF ENVIRONMENTAL FACTORS ON
ADAS SENSOR PERFORMANCE
Separation distance at start of automatic braking (ft)
Braking time-to-collision (s)
Impact speed (mph)
Final separation distance (ft)
Detection is considered to have occurred at the instant when a notification of an impending collision is
provided by the system (audible or visual). Automatic braking is considered to have occurred once
longitudinal deceleration exceeds 0.1 G. The test was considered complete once the test vehicle contacted
the target vehicle or the test vehicle came to a complete stop.
C. Test Results
1) Lane Placement
a) 2020 Buick Enclave
Figure 10: 2020 Buick Enclave averaged baseline lane placement and individual runs with simulated rainfall
Image Source: AAA
Figure 10 illustrates a graphical representation of the test vehicle lateral placement for the characteristic
baseline run in comparison to the four individual test runs conducted with simulated rainfall. Quasiperiodicity
is exhibited for baseline and simulated rainfall conditions analogous in appearance to an irregular sinusoidal
wave. Specifically, this indicates significant “ping-ponging” throughout the entirety of the testing lane for both
conditions. It is important to note that this is not characteristic of a system flaw in isolation.

17 | P a g e
EFFECT OF ENVIRONMENTAL FACTORS ON
ADAS SENSOR PERFORMANCE
Figure 11: Spearman correlation coefficients for individual runs with respect to characteristic baseline run
Image Source: AAA
Figure 11 provides the Spearman correlation coefficient for test runs with simulated rainfall with respect to
the characteristic baseline run. From a mathematical perspective, the resulting moderate to weak Spearman
correlations are due to irregular wave characteristics such as varying peak-to-peak amplitude and frequency.
The resulting disorder in phase shifts can “cancel” a strong correlational coefficient despite the clear visual
consistency between individual simulated rainfall test runs and the characteristic baseline run. Additionally,
phase shifts exhibited between characteristic and simulated rainfall runs can weaken correlation coefficients.
Figure 12: 2020 Buick Enclave averaged baseline and simulated rainfall lane placement Image Source: AAA
Two differences relate to the increased lateral deviation (peak-to-peak amplitude) and increased occurrence
of “ping-ponging” (peak-to-peak frequency) of test runs conducted with simulated rainfall relative to baseline
conditions. These differences persist when simulated rainfall test runs are averaged as shown in Figure 12.
These variations imply that lane keeping assistance system performance is influenced by significant rainfall.
Specifically, significant rainfall may result in larger and more frequent lateral deviations within the travel lane
if the driver fails to provide steering input.
Run 1 Run 2 Run 3 Run 4
-0.357 -0.416 -0.116 -0.463

18 | P a g e
EFFECT OF ENVIRONMENTAL FACTORS ON
ADAS SENSOR PERFORMANCE
b) 2020 Hyundai Santa Fe
Figure 13: 2020 Hyundai Santa Fe average baseline lane placement and individual runs with simulated rainfall
Image Source: AAA
Figure 13 illustrates a graphical representation of the test vehicle lateral placement for the characteristic
baseline run in comparison to the four individual test runs conducted with simulated rainfall. Quasiperiodicity
is exhibited for baseline and simulated rainfall conditions not similar in appearance to any common
mathematical functions. While the lane placement is generally similar between baseline and simulated rainfall
conditions, the lateral lane placement for simulated rainfall conditions is generally biased to the left of the
testing lane throughout the test until the end of the run.
Figure 14: Spearman correlation coefficients for individual runs with respect to characteristic baseline run
Image Source: AAA
Figure 14 provides the Spearman correlation coefficient for test runs with simulated rainfall with respect to
the characteristic baseline run. The general similarity in system behavior between the characteristic baseline
run and individual test runs with simulated rainfall is reflected in moderately strong Spearman coefficients
above 0.590.
Run 1 Run 2 Run 3 Run 4
0.742 0.593 0.847 0.733

19 | P a g e
EFFECT OF ENVIRONMENTAL FACTORS ON
ADAS SENSOR PERFORMANCE
Figure 15: 2020 Hyundai Santa Fe averaged baseline and simulated rainfall lane placement Image Source: AAA
As previously noted in Figure 13, test runs conducted with simulated rainfall have a persistent bias to the left
of the testing lane throughout the test run until the end. This is illustrated by the average of simulated rainfall
test runs in Figure 15. However, lane keeping assistance system performance is generally similar in the
second half of the run indicating either a corrective and/or adaptive response to simulated rainfall. In
combination, these observations suggest that while system performance may be initially influenced, the
system is also capable of corrective and/or adaptive actions in response to significant rainfall.

20 | P a g e
EFFECT OF ENVIRONMENTAL FACTORS ON
ADAS SENSOR PERFORMANCE
c) 2020 Toyota RAV4
Figure 16: 2020 Toyota RAV4 average baseline lane placement and individual runs with simulated rainfall Image Source: AAA
Figure 16 illustrates a graphical representation of the test vehicle lateral placement for the characteristic
baseline run in comparison to the four individual test runs conducted with simulated rainfall. It is important to
note that the characteristic baseline run is only comprised of three individual baseline test runs because the
test vehicle left the roadway for one of the four baseline runs. To ensure parity between baseline and
simulated rainfall scenarios, an additional baseline test run was not performed because test runs conducted
with simulated rainfall were counted as valid even if the test vehicle left the roadway prior to completion of the
test run.
Quasiperiodicity is exhibited for baseline and simulated rainfall conditions; however, the general appearance
between the characteristic averaged run and individual test runs with simulated rainfall is significantly
different. The characteristic baseline run does not resemble any common mathematic function whereas the
second and fourth test runs are analogous in appearance to an irregular sinusoidal wave. The test vehicle left
the testing lane during the first and third test runs. Specifically, test runs conducted with simulated rainfall
exhibited significantly more “ping-ponging” than the characteristic baseline run. Significant differences
between all individual simulated rainfall test runs with respect to the characteristic baseline run imply that the
lane keeping assistance system is influenced by significant rainfall.
21 | P a g e
EFFECT OF ENVIRONMENTAL FACTORS ON
ADAS SENSOR PERFORMANCE
Figure 17: Spearman correlation coefficients for
individual runs with respect to characteristic baseline run Image Source: AAA
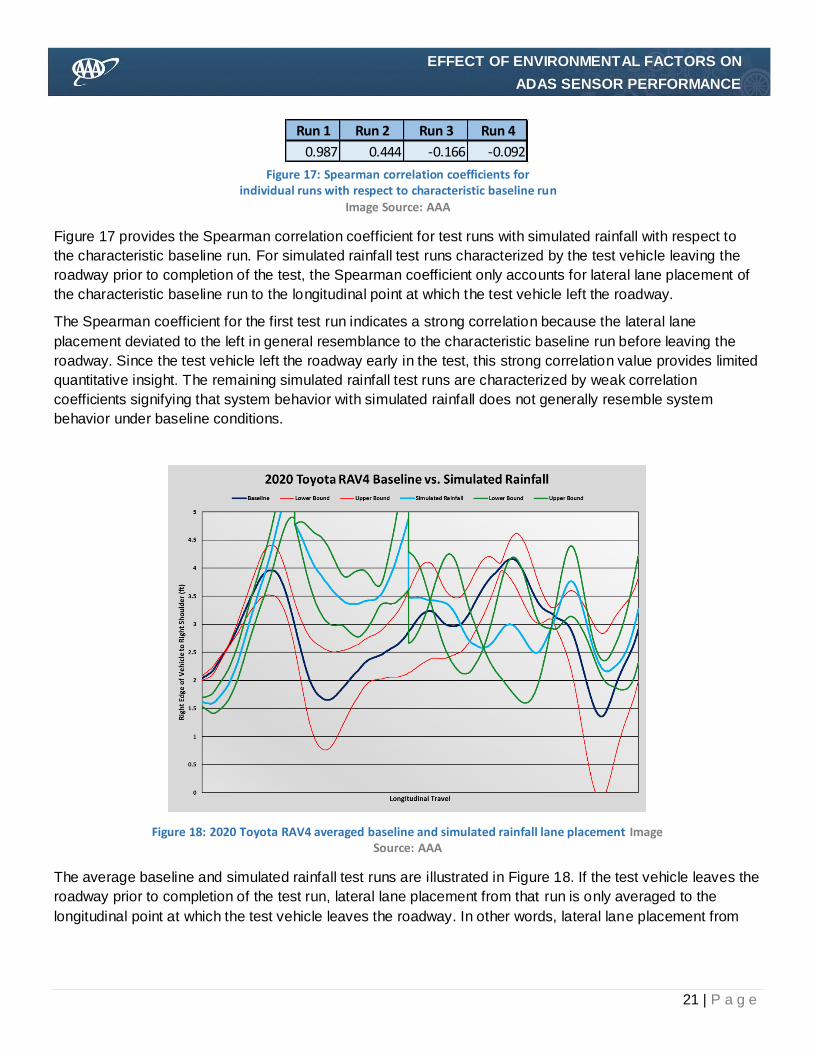
Figure 17 provides the Spearman correlation coefficient for test runs with simulated rainfall with respect to
the characteristic baseline run. For simulated rainfall test runs characterized by the test vehicle leaving the
roadway prior to completion of the test, the Spearman coefficient only accounts for lateral lane placement of
the characteristic baseline run to the longitudinal point at which the test vehicle left the roadway.
The Spearman coefficient for the first test run indicates a strong correlation because the lateral lane
placement deviated to the left in general resemblance to the characteristic baseline run before leaving the
roadway. Since the test vehicle left the roadway early in the test, this strong correlation value provides limited
quantitative insight. The remaining simulated rainfall test runs are characterized by weak correlation
coefficients signifying that system behavior with simulated rainfall does not generally resemble system
behavior under baseline conditions.
Figure 18: 2020 Toyota RAV4 averaged baseline and simulated rainfall lane placement Image Source: AAA
The average baseline and simulated rainfall test runs are illustrated in Figure 18. If the test vehicle leaves the
roadway prior to completion of the test run, lateral lane placement from that run is only averaged to the
longitudinal point at which the test vehicle leaves the roadway. In other words, lateral lane placement from
Run 1 Run 2 Run 3 Run 4
0.987 0.444 -0.166 -0.092

22 | P a g e
EFFECT OF ENVIRONMENTAL FACTORS ON
ADAS SENSOR PERFORMANCE
the only second and fourth test runs are averaged in the second half of Figure 18 (the point where the test
vehicle leaves the roadway on the third test run).
The standard error bounds intersect at multiple points due to the out of phase and irregular sinusoidal waves
that characterize the lateral lane placement for the second and fourth test runs. Figure 18 illustrates that
system behavior is significantly different for baseline and simulated rainfall conditions. Specifically, significant
rainfall may result in the test vehicle leaving the roadway and/or “ping-ponging” within the travel lane if the
driver fails to provide steering input.
d) 2020 Volkswagen Tiguan
Figure 19: 2020 Volkswagen Tiguan average baseline lane placement and individual runs with
simulated rainfall Image Source: AAA
Figure 19 illustrates a graphical representation of the test vehicle lateral placement for the characteristic
baseline run in comparison to the four individual test runs conducted with simulated rainfall. The test vehicle
left the roadway prior to test completion for each of the four test runs conducted with simulated rainfall. For
this reason, Spearman coefficients are not calculated and test runs with simulated rainfall were not averaged
for comparison purposes.
The finding that the test vehicle left the roadway for all individual simulated rainfall test runs prior to test
completion imply that the lane keeping assistance system is influenced by significant rainfall. Specifically,
significant rainfall may result in the test vehicle leaving the roadway if the driver fails to provide steering input.

23 | P a g e
EFFECT OF ENVIRONMENTAL FACTORS ON
ADAS SENSOR PERFORMANCE
2) Automatic Emergency Braking
For narrative purposes, impact speeds are defined as follows within this report:
0 mph < Impact Speed ≤ 5 mph = Minor Impact
5 mph < Impact Speed ≤ 10 mph = Moderate Impact
10 mph < Impact Speed = Significant Impact
a) 2020 Buick Enclave
Figure 20: 2020 Buick Enclave individual run data at 25 mph with simulated rainfall Image Source: AAA
Individual test run data for baseline and occluded camera conditions at 25 mph are provided in Figure 20. For
all parameters, the baseline and occluded camera mean values do not significantly differ at the 95 percent
confidence level. For both conditions, no contact between the test vehicle and target vehicle occurred for any
test runs conducted. Specifically, automatic emergency braking system performance is not significantly
influenced by simulated rainfall at 25 mph.
Detection Distance (ft) Detection TTC (s) Braking Distance (ft) Braking TTC (s) Impact Speed (mph) Separation Distance (ft)
Run 1 148.24 4.006 39.37 1.086 0.0 5.80
Run 2 147.63 4.047 39.11 1.076 0.0 5.61
Run 3 149.72 4.010 41.03 1.117 0.0 4.45
Run 4 150.16 4.108 37.86 1.058 0.0 4.13
Average 148.94 4.043 39.34 1.084 0.0 5.00
Standard Deviation 1.03 0.041 1.13 0.021 0.0 0.72
Detection Distance (ft) Detection TTC (s) Braking Distance (ft) Braking TTC (s) Impact Speed (mph) Separation Distance (ft)
Run 1 149.11 4.054 39.68 1.101 0.0 4.31
Run 2 147.32 3.974 41.11 1.117 0.0 4.13
Run 3 148.69 4.057 41.20 1.139 0.0 4.80
Run 4 149.62 4.090 40.69 1.119 0.0 2.15
Average 148.69 4.044 40.67 1.119 0.0 3.85
Standard Deviation 0.86 0.043 0.60 0.014 0.0 1.01
Baseline
Simulated Rain
Buick Enclave 25 mph

24 | P a g e
EFFECT OF ENVIRONMENTAL FACTORS ON
ADAS SENSOR PERFORMANCE
Figure 21: 2020 Buick Enclave individual run data at 35 mph with simulated rainfall Image Source: AAA
Individual test run data for baseline and occluded camera conditions at 35 mph are provided in Figure 21. For
all parameters, the baseline and simulated rainfall mean values do not significantly differ at the 95 percent
confidence level. However, minor impact occurred for one of four test runs conducted with simulated rainfall.
This contrasts with the baseline condition in which minor impact occurred with the target vehicle for two of
four runs. Specifically, automatic emergency braking system performance was not negatively influenced by
significant rainfall at 35 mph.
b) 2020 Hyundai Santa Fe
Figure 22: 2020 Hyundai Santa Fe individual run data at 25 mph with simulated rainfall
Image Source: AAA
Detection Distance (ft) Detection TTC (s) Braking Distance (ft) Braking TTC (s) Impact Speed (mph) Separation Distance (ft)
Run 1 148.73 2.869 70.88 1.381 4.5 0.00
Run 2 146.47 2.853 70.79 1.385 0.0 0.78
Run 3 147.83 2.875 73.14 1.431 0.7 0.00
Run 4 149.72 2.897 75.00 1.470 0.0 1.69
Average 148.19 2.874 72.46 1.417 1.3 0.62
Standard Deviation 1.20 0.016 1.75 0.036 1.9 0.69
Detection Distance (ft) Detection TTC (s) Braking Distance (ft) Braking TTC (s) Impact Speed (mph) Separation Distance (ft)
Run 1 149.79 2.917 73.10 1.425 3.8 0.00
Run 2 148.09 2.901 75.45 1.478 0.0 0.66
Run 3 148.53 2.900 72.71 1.430 0.0 1.58
Run 4 146.89 2.877 71.33 1.407 0.0 1.36
Average 148.32 2.899 73.15 1.435 1.0 0.90
Standard Deviation 1.04 0.014 1.48 0.026 1.7 0.62
Baseline
Simulated Rain
Buick Enclave 35 mph
Detection Distance (ft) Detection TTC (s) Braking Distance (ft) Braking TTC (s) Impact Speed (mph) Separation Distance (ft)
Run 1 71.48 1.983 40.72 1.163 0.0 8.82
Run 2 72.87 1.971 42.49 1.186 0.0 9.09
Run 3 72.67 1.970 42.09 1.181 0.0 9.80
Run 4 71.25 1.953 42.62 1.185 0.0 8.27
Average 72.07 1.97 41.98 1.18 0.0 8.99
Standard Deviation 0.71 0.01 0.75 0.01 0.0 0.55
Detection Distance (ft) Detection TTC (s) Braking Distance (ft) Braking TTC (s) Impact Speed (mph) Separation Distance (ft)
Run 1 71.28 1.948 45.27 1.281 0.0 4.89
Run 2 72.97 1.988 45.35 1.275 0.0 9.99
Run 3 73.63 1.981 42.74 1.187 0.0 8.02
Run 4 72.27 1.988 44.60 1.269 0.0 9.83
Average 72.54 1.976 44.49 1.253 0.0 8.18
Standard Deviation 0.87 0.016 1.05 0.038 0.0 2.05
Simulated Rain
Baseline
Hyundai Santa Fe 25 mph

25 | P a g e
EFFECT OF ENVIRONMENTAL FACTORS ON
ADAS SENSOR PERFORMANCE
Individual test run data for baseline and occluded camera conditions at 25 mph are provided in Figure 22. For
all parameters, the baseline and occluded camera mean values do not significantly differ at the 95 percent
confidence level. For both conditions, no contact between the test vehicle and target vehicle occurred for any
test runs conducted. Specifically, automatic emergency braking system performance is not significantly
influenced by simulated rainfall at 25 mph.
Figure 23: 2020 Hyundai Santa Fe individual run data at 35 mph with simulated rainfall
Image Source: AAA
Individual test run data for baseline and occluded camera conditions at 35 mph are provided in Figure 23. For
all parameters, the baseline and occluded camera mean values do not significantly differ at the 95 percent
confidence level. For both conditions, no contact between the test vehicle and target vehicle occurred for any
test runs conducted. Specifically, automatic emergency braking system performance is not significantly
influenced by simulated rainfall at 35 mph.
c) 2020 Toyota RAV4
Detection Distance (ft) Detection TTC (s) Braking Distance (ft) Braking TTC (s) Impact Speed (mph) Separation Distance (ft)
Run 1 117.12 2.312 80.93 1.631 0.0 6.22
Run 2 121.72 2.380 76.20 1.537 0.0 3.31
Run 3 122.50 2.380 80.67 1.608 0.0 6.47
Run 4 121.38 2.361 80.67 1.611 0.0 4.90
Average 120.68 2.358 79.62 1.597 0.0 5.23
Standard Deviation 2.09 0.028 1.97 0.036 0.0 1.26
Detection Distance (ft) Detection TTC (s) Braking Distance (ft) Braking TTC (s) Impact Speed (mph) Separation Distance (ft)
Run 1 118.11 2.309 83.07 1.658 0.0 4.61
Run 2 120.88 2.368 82.90 1.661 0.0 4.62
Run 3 120.35 2.359 81.90 1.643 0.0 5.35
Run 4 121.55 2.389 81.24 1.641 0.0 5.63
Average 120.22 2.356 82.28 1.651 0.00 5.05
Standard Deviation 1.29 0.029 0.75 0.009 0.00 0.45
Hyundai Santa Fe 35 mph
Baseline
Simulated Rain
Detection Distance (ft) Detection TTC (s) Braking Distance (ft) Braking TTC (s) Impact Speed (mph) Separation Distance (ft)
Run 1 77.65 2.132 58.40 1.621 0.0 2.65
Run 2 73.94 2.027 55.41 1.542 0.0 1.94
Run 3 76.95 2.119 58.50 1.633 0.0 2.84
Run 4 73.46 2.003 59.19 1.630 0.0 1.92
Average 75.50 2.070 57.87 1.606 0.0 2.34
Standard Deviation 1.82 0.056 1.46 0.037 0.0 0.42
Detection Distance (ft) Detection TTC (s) Braking Distance (ft) Braking TTC (s) Impact Speed (mph) Separation Distance (ft)
Run 1 77.96 2.137 58.32 1.616 11.7 0.00
Run 2 77.27 2.129 23.68 0.686 7.6 0.00
Run 3 NA NA NA NA NA NA
Run 4 NA NA NA NA NA NA
Average 77.61 2.133 41.00 1.151 9.7 0.00
Standard Deviation 0.35 0.004 17.32 0.465 2.1 0.00
Toyota RAV4 25 mph
Baseline
Simulated Rain

26 | P a g e
EFFECT OF ENVIRONMENTAL FACTORS ON
ADAS SENSOR PERFORMANCE
Figure 24: 2020 Toyota RAV4 individual run data at 25 mph with simulated rainfall Image Source: AAA
Individual test run data for baseline and simulated rainfall conditions at 25 mph are provided in Figure 24.
Since the first two test runs with simulated rainfall were characterized by significant and moderate impact, no
additional test runs were performed. As a result, statistical comparisons are not applicable for this dataset.
However, it can be inferred that automatic emergency braking system performance is influenced at 25 mph
because no impact occurred for any four test runs under baseline conditions in contrast to both test runs
conducted with simulated rainfall.
Figure 25: 2020 Toyota RAV4 individual run data at 35 mph with simulated rainfall Image Source: AAA
Individual test run data for baseline and simulated rainfall conditions at 35 mph are provided in Figure 25. For
all parameters, the baseline and simulated rainfall mean values do not significantly differ at the 95 percent
confidence level. However, this conclusion by a paired t-test for the impact speed is of limited value due to
the disparity in variance between the test conditions.
For the baseline condition, no contact occurred for any four runs in contrast to the simulated rainfall condition
in which minor contact occurred for two of four runs and significant impact occurred for an additional run. This
would imply automatic emergency braking system performance is influenced by rainfall at 35 mph.
D. Summary of Test Results
1) Lane Placement
Overall, the lane keeping assistance system in three out of four test vehicles was influenced by simulated
rainfall. Depending on the test vehicle, characteristics such as increased “ping-ponging” frequency/amplitude
and inconsistency in lateral lane placement from run to run were observed. Additionally, when reviewing raw
lane placement data, 11 of 16 (68.7%) tests runs with simulated rain resulted in the test vehicle crossing the
lane marker on the roadway.
Detection Distance (ft) Detection TTC (s) Braking Distance (ft) Braking TTC (s) Impact Speed (mph) Separation Distance (ft)
Run 1 133.85 2.615 75.79 1.533 0.0 0.77
Run 2 129.83 2.535 76.63 1.541 0.0 0.58
Run 3 126.22 2.446 79.80 1.590 0.0 0.76
Run 4 126.24 2.478 75.84 1.532 0.0 0.32
Average 129.04 2.518 77.01 1.549 0.0 0.61
Standard Deviation 3.14 0.064 1.64 0.024 0.0 0.18
Detection Distance (ft) Detection TTC (s) Braking Distance (ft) Braking TTC (s) Impact Speed (mph) Separation Distance (ft)
Run 1 117.06 2.292 75.07 1.608 0.0 2.27
Run 2 133.56 2.591 77.55 1.555 2.9 0.00
Run 3 126.15 2.473 77.76 1.571 4.0 0.00
Run 4 131.65 2.580 76.60 1.545 22.1 0.00
Average 127.10 2.484 76.74 1.570 7.2 0.57
Standard Deviation 6.40 0.120 1.06 0.024 8.7 0.98
Baseline
Simulated Rain
Toyota RAV4 35 mph
27 | P a g e
EFFECT OF ENVIRONMENTAL FACTORS ON
ADAS SENSOR PERFORMANCE
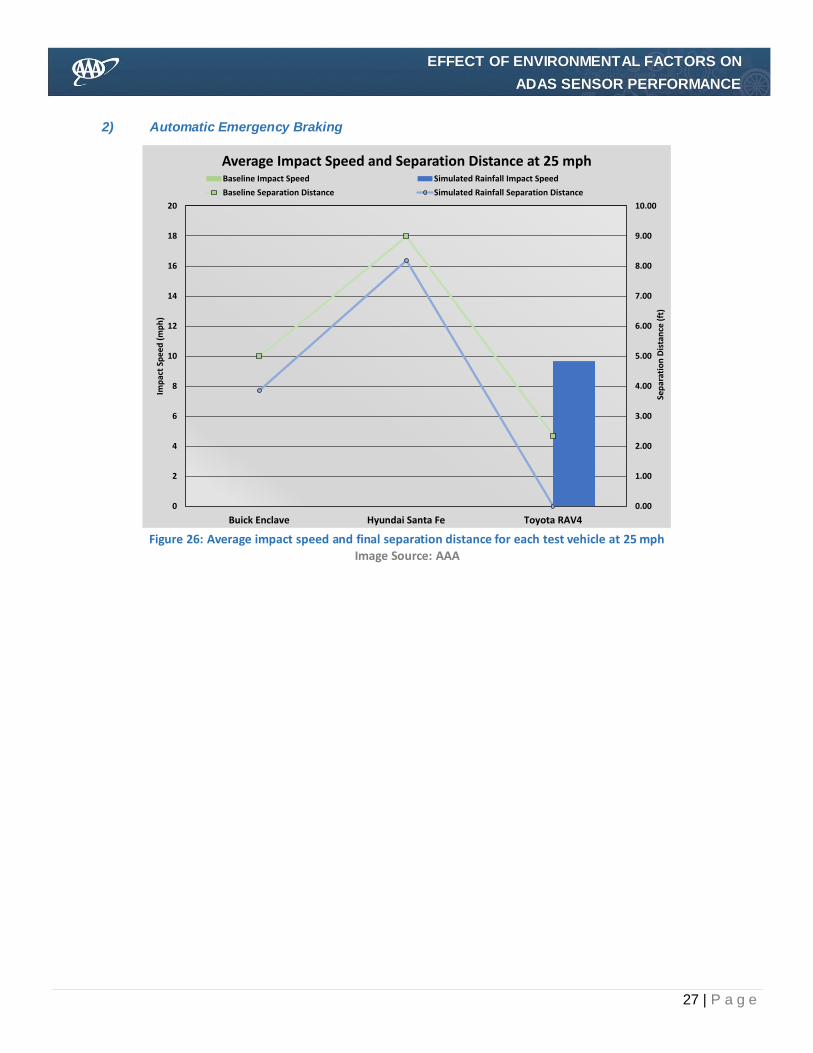
2) Automatic Emergency Braking
Figure 26: Average impact speed and final separation distance for each test vehicle at 25 mph
Image Source: AAA
0.00
1.00
2.00
3.00
4.00
5.00
6.00
7.00
8.00
9.00
10.00
0
2
4
6
8
10
12
14
16
18
20
Buick Enclave Hyundai Santa Fe Toyota RAV4
Sep
arat
ion
Dis
tan
ce (
ft)
Imp
act
Spee
d (
mp
h)
Average Impact Speed and Separation Distance at 25 mphBaseline Impact Speed Simulated Rainfall Impact Speed
Baseline Separation Distance Simulated Rainfall Separation Distance

28 | P a g e
EFFECT OF ENVIRONMENTAL FACTORS ON
ADAS SENSOR PERFORMANCE
Figure 27: Average impact speed and final separation distance for each test vehicle at 35 mph Image Source: AAA
Figures 26 and 27 illustrate the average impact speed and associated separation distance for baseline and
simulated rainfall conditions for each test vehicle at 25 mph and 35 mph, respectively.
Figure 28: Averaged data for each test vehicle at 25 mph Image Source: AAA
0.00
1.00
2.00
3.00
4.00
5.00
6.00
7.00
8.00
9.00
10.00
0
2
4
6
8
10
12
14
16
18
20
Buick Enclave Hyundai Santa Fe Toyota RAV4
Sep
arat
ion
Dis
tan
ce (
ft)
Imp
act
Spee
d (
mp
h)
Average Impact Speed and Separation Distance at 35 mphBaseline Impact Speed Simulated Rainfall Impact Speed
Baseline Separation Distance Simulated Rainfall Separation Distance
Detection Distance (ft) Detection TTC (s) Braking Distance (ft) Braking TTC (s) Impact Speed (mph) Separation Distance (ft)
Baseline Average 148.94 4.043 39.34 1.084 0.0 5.00
Rainfall Average 148.69 4.044 40.67 1.119 0.0 3.85
Group Average 148.81 4.043 40.01 1.101 0.0 4.42
Std. Deviation 0.13 0.001 0.67 0.017 0.0 0.57
Detection Distance (ft) Detection TTC (s) Braking Distance (ft) Braking TTC (s) Impact Speed (mph) Separation Distance (ft)
Baseline Average 72.07 1.969 41.98 1.179 0.0 8.99
Rainfall Average 72.54 1.976 44.49 1.253 0.0 8.18
Group Average 72.30 1.973 43.23 1.216 0.0 8.59
Std. Deviation 0.23 0.003 1.26 0.037 0.0 0.41
Detection Distance (ft) Detection TTC (s) Braking Distance (ft) Braking TTC (s) Impact Speed (mph) Separation Distance (ft)
Baseline Average 75.50 2.070 57.87 1.606 0.0 2.34
Rainfall Average 77.61 2.133 41.00 1.151 9.7 0.00
Group Average 76.56 2.102 49.44 1.379 4.8 1.17
Std. Deviation 1.06 0.032 8.44 0.228 4.8 1.17
Buick Enclave
Simulated Rain 25 mph
Toyota RAV4
Hyundai Santa Fe

29 | P a g e
EFFECT OF ENVIRONMENTAL FACTORS ON
ADAS SENSOR PERFORMANCE
Figure 28 provides averaged test run data for baseline and simulated rainfall conditions at 25 mph. Two out
of three test vehicles were not negatively influenced by simulated rainfall. The remaining test vehicle
impacted the target vehicle twice, which resulted in the researchers moving on to the next test scenario to
prevent damage to the vehicle.
Among all test vehicles, 17 percent of all test runs conducted with simulated rainfall at a speed of 25 mph
resulted in a collision, whereas no collisions were observed during the baseline testing for the same vehicles.
Figure 29: Averaged data for each test vehicle at 35 mph Image Source: AAA
Figure 29 provides averaged test run data for baseline and simulated rainfall conditions at 35 mph. Two out
of three test vehicles were not negatively influenced by simulated rainfall. The remaining vehicle impacted
the target vehicle on all three trials when evaluated with simulated rainfall.
Among all test vehicles, 33 percent of all test runs conducted with simulated rainfall at a speed of 35 mph
resulted in a collision. This contrasts with the baseline condition during which a collision occurred for 17
percent of all test runs.
Detection Distance (ft) Detection TTC (s) Braking Distance (ft) Braking TTC (s) Impact Speed (mph) Separation Distance (ft)
Baseline Average 148.19 2.874 72.46 1.417 1.3 0.62
Rainfall Average 148.32 2.899 73.15 1.435 1.0 0.90
Group Average 148.26 2.886 72.80 1.426 1.1 0.76
Std. Deviation 0.07 0.013 0.35 0.009 0.2 0.14
Detection Distance (ft) Detection TTC (s) Braking Distance (ft) Braking TTC (s) Impact Speed (mph) Separation Distance (ft)
Baseline Average 120.95 2.373 73.36 1.486 0.0 5.29
Rainfall Average 120.22 2.356 82.28 1.651 0.0 5.05
Group Average 120.59 2.364 77.82 1.568 0.0 5.17
Std. Deviation 0.37 0.008 4.46 0.083 0.0 0.12
Detection Distance (ft) Detection TTC (s) Braking Distance (ft) Braking TTC (s) Impact Speed (mph) Separation Distance (ft)
Baseline Average 129.04 2.518 77.01 1.549 0.0 0.61
Rainfall Average 127.10 2.484 76.74 1.570 7.2 0.57
Group Average 128.07 2.501 76.88 1.559 3.6 0.59
Std. Deviation 0.97 0.017 0.14 0.010 3.6 0.02
Buick Enclave
Hyundai Santa Fe
Toyota RAV4
Simulated Rain 35 mph
30 | P a g e
EFFECT OF ENVIRONMENTAL FACTORS ON
ADAS SENSOR PERFORMANCE
VII. INQUIRY 2: HOW DO VEHICLES EQUIPPED WITH LANE KEEPING ASSISTANCE AND AUTOMATIC
EMERGENCY BRAKING SYSTEMS PERFORM DURING SCENARIOS CONDUCTED WITH A DIRTY
WINDSHIELD RELATIVE TO BASELINE CONDITIONS?
A. Objective
Evaluate the effect of a dirty windshield on lane keeping assistance and automatic emergency braking
system performance relative to baseline conditions.
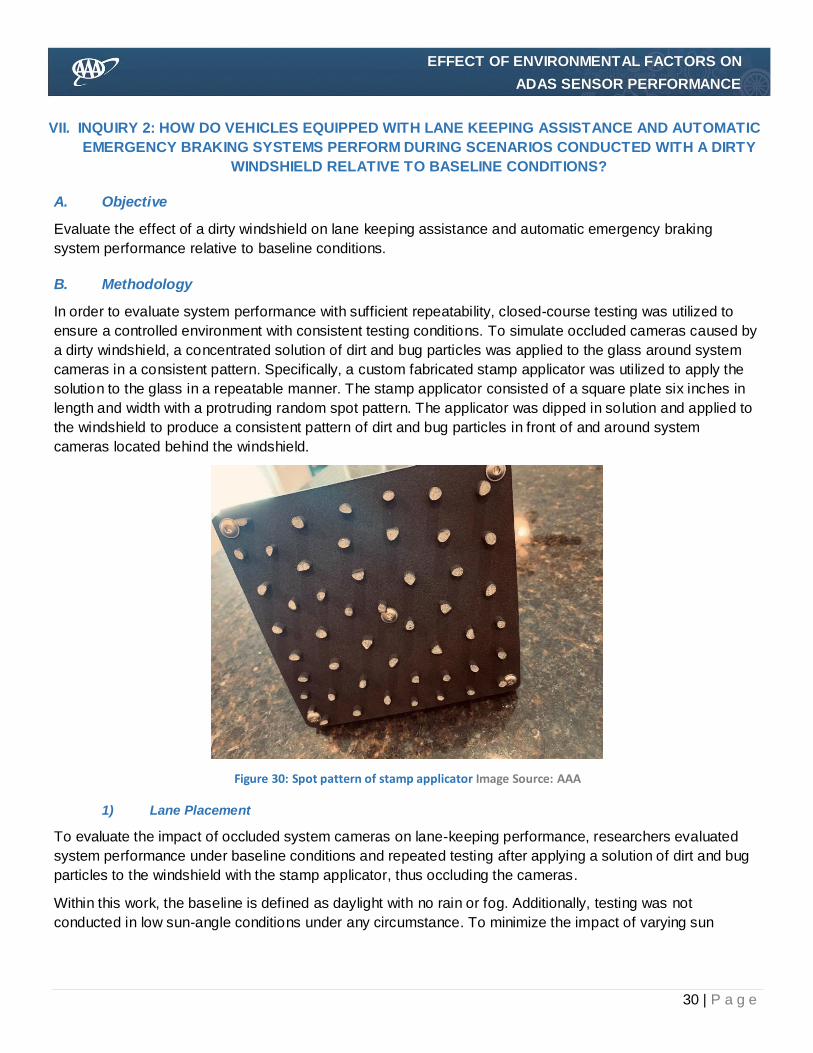
B. Methodology
In order to evaluate system performance with sufficient repeatability, closed-course testing was utilized to
ensure a controlled environment with consistent testing conditions. To simulate occluded cameras caused by
a dirty windshield, a concentrated solution of dirt and bug particles was applied to the glass around system
cameras in a consistent pattern. Specifically, a custom fabricated stamp applicator was utilized to apply the
solution to the glass in a repeatable manner. The stamp applicator consisted of a square plate six inches in
length and width with a protruding random spot pattern. The applicator was dipped in solution and applied to
the windshield to produce a consistent pattern of dirt and bug particles in front of and around system
cameras located behind the windshield.
Figure 30: Spot pattern of stamp applicator Image Source: AAA
1) Lane Placement
To evaluate the impact of occluded system cameras on lane-keeping performance, researchers evaluated
system performance under baseline conditions and repeated testing after applying a solution of dirt and bug
particles to the windshield with the stamp applicator, thus occluding the cameras.
Within this work, the baseline is defined as daylight with no rain or fog. Additionally, testing was not
conducted in low sun-angle conditions under any circumstance. To minimize the impact of varying sun

31 | P a g e
EFFECT OF ENVIRONMENTAL FACTORS ON
ADAS SENSOR PERFORMANCE
angles and other environmental considerations, test runs with occluded cameras were conducted
immediately after completion of baseline test runs.
For each vehicle, four test runs were performed for both baseline and occluded camera conditions. For a test
run to be considered valid, the test driver was required to accelerate the vehicle to a steady-state speed of 45
mph and ensure the lane keeping assistance system was engaged prior to entering the mapped portion of
the test lane. To ensure steady-state speed throughout the test run, adaptive cruise control was engaged.
The test driver released the grip on the steering wheel once the vehicle was up to target speed and reached
virtual starting gate for the test. The released grip/light touch of the steering wheel enabled the driver to
maintain control of the vehicle while allowing the vehicle to steer without external inputs. If the test vehicle
laterally deviated outside of the lane markers prior to reaching the end of the mapped testing lane, the test
run was terminated and counted as a valid run.
The raw data from each test run consisted of the lateral offset of the vehicle center relative to the right
shoulder of the mapped test lane. This metric was calculated with respect to the longitudinal vehicle position
relative to the beginning of the mapped test lane. Bessel spline interpolation was performed on each run to
calculate the lateral lane position at 50 cm increments. For each test condition, the resulting four
interpolations from baseline and occluded camera conditions were combined to determine the average lateral
lane placement throughout the entirety of the mapped test lane. For interpretation purposes, the average of
individual baseline test runs is considered the “characteristic” run. The standard error associated with each
run of interpolated data points was graphed as an upper and lower bound of the averaged measurement.
This represents a quantitative measure of consistency between individual test runs.
For each vehicle, the average graphs for baseline and occluded camera conditions were graphed to illustrate
general differences in lane placement and/or consistency along the mapped test lane. Additionally, the
Spearman correlation between individual runs with occluded cameras and the characteristic baseline run was
calculated; positive values close to one indicate a strong correlation, negative values close to one indicate an
opposite correlation and values near zero indicate no correlation.
2) Automatic Emergency Braking
To evaluate the impact of occluded system cameras on automatic emergency braking performance,
researchers evaluated system performance under baseline conditions and repeated testing after applying a
solution of dirt and bug particles to the windshield with the stamp applicator.
Within this work, the baseline is defined as daylight with no rain or fog. Additionally, testing was not
conducted in low sun-angle conditions under any circumstance. To minimize the impact of varying sun
angles and other environmental considerations, test runs with occluded cameras were conducted
immediately after completion of baseline test runs.
The DRI Soft Car 360® was utilized to simulate a stationary vehicle centered in the testing lane (herein
referred to as the “target vehicle”). For each test vehicle, speeds of 25 mph and 35 mph were evaluated. For
each speed, four runs were performed for both baseline and occluded camera conditions unless significant
impact occurred for the first two runs. In this case, additional runs were not performed to minimize vehicle
damage.

32 | P a g e
EFFECT OF ENVIRONMENTAL FACTORS ON
ADAS SENSOR PERFORMANCE
For the test run to be valid, the test driver was required to reach steady-state speed with adaptive cruise
control engaged a minimum of 1500 feet behind the target vehicle. As the test vehicle approached the target
vehicle, no driver intervention was applied until contact was made with the target vehicle (if applicable). For
each run, the following parameters were captured:
Detection distance (ft)
Detection time-to-collision (s)
Separation distance at start of automatic braking (ft)
Braking time-to-collision (s)
Impact speed (mph)
Final separation distance (ft)
Detection is considered to have occurred at the instant when a notification of an impending collision is
provided by the system (audible or visual). Automatic braking is considered to have occurred once
longitudinal deceleration exceeds 0.1 G. The test was considered complete once the test vehicle contacted
the target vehicle or the test vehicle came to a complete stop.
C. Test Results
1) Lane Placement
a) 2020 Buick Enclave
Figure 31: 2020 Buick Enclave average baseline lane placement and individual runs with
occluded cameras Image Source: AAA

33 | P a g e
EFFECT OF ENVIRONMENTAL FACTORS ON
ADAS SENSOR PERFORMANCE
Figure 31 illustrates a graphical representation of the test vehicle lateral placement for the characteristic
baseline run in comparison to the four individual test runs conducted with occluded system cameras.
Quasiperiodicity is exhibited for baseline and occluded camera conditions analogous in appearance to an
irregular sinusoidal wave. Specifically, this indicates significant “ping-ponging” throughout the entirety of the
testing lane for both conditions. It is important to note that this is not characteristic of a system flaw in
isolation.
Figure 32: Spearman correlation coefficients for
individual runs with respect to characteristic baseline run Image Source: AAA
Figure 32 provides the Spearman correlation coefficient for test runs with occluded cameras with respect to
the characteristic baseline run. For test run one, the Spearman coefficient only accounts for lateral lane
placement of the characteristic baseline run to the longitudinal point at which the test vehicle left the
roadway. Test run two indicates a strong correlation because this run is largely in phase with the
characteristic baseline run. Test runs three and four exhibit a weak correlation because they are significantly
out of phase with the characteristic baseline run. In general, all individual test runs with occluded cameras
are similar to the characteristic baseline run in terms of “ping-ponging” frequency.
Figure 33: 2020 Buick Enclave averaged baseline and occluded camera placement Image Source: AAA
Run 1 Run 2 Run 3 Run 4
0.422 0.922 -0.131 0.066
34 | P a g e
EFFECT OF ENVIRONMENTAL FACTORS ON
ADAS SENSOR PERFORMANCE
The average baseline and occluded camera test runs are illustrated in Figure 33. If the test vehicle leaves the
roadway prior to completion of the test run, lateral lane placement from that particular run is only averaged to
the longitudinal point at which the test vehicle leaves the roadway. In other words, lateral lane placement
from the first test run is averaged up to the point where the test vehicle leaves the roadway.
Based on a comparison of averaged runs, the lane keeping assistance system performance is generally
similar in terms of “ping-ponging” lateral deviation and frequency with the exception of one test run leaving
the roadway prior to test completion. This implies that system performance is minimally influenced by system
cameras occluded with bug and dirt particles.
b) 2020 Hyundai Santa Fe
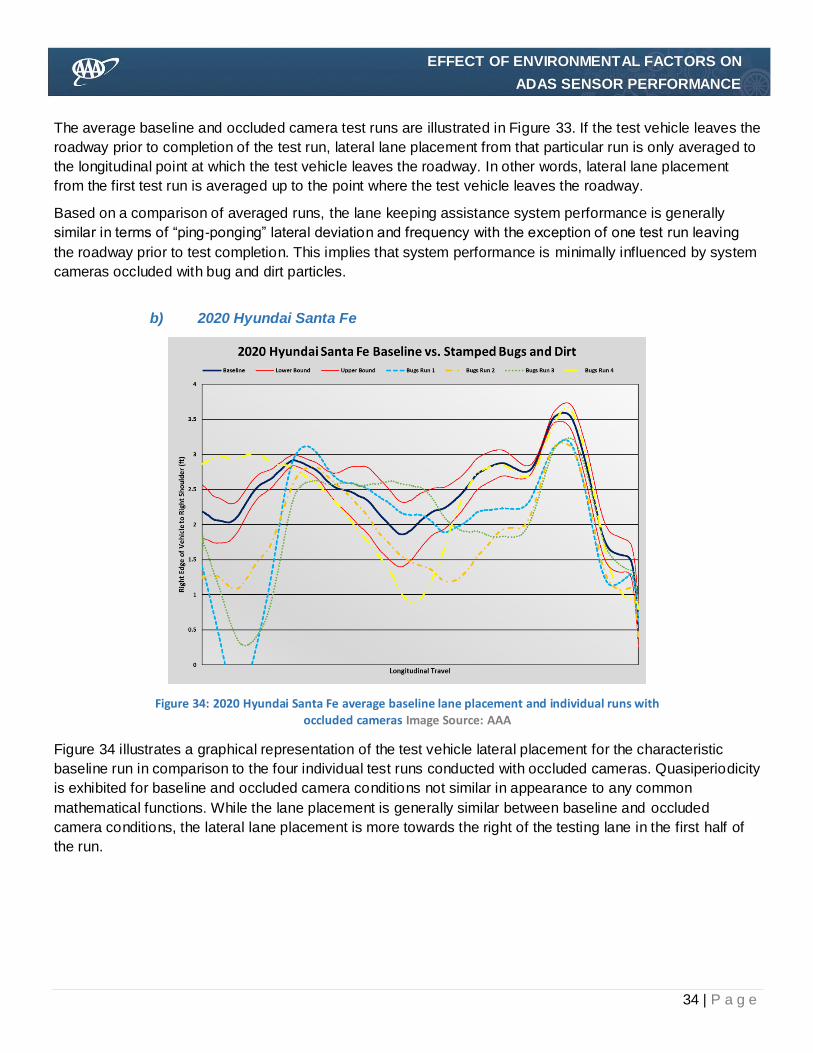
Figure 34: 2020 Hyundai Santa Fe average baseline lane placement and individual runs with
occluded cameras Image Source: AAA
Figure 34 illustrates a graphical representation of the test vehicle lateral placement for the characteristic
baseline run in comparison to the four individual test runs conducted with occluded cameras. Quasiperiodicity
is exhibited for baseline and occluded camera conditions not similar in appearance to any common
mathematical functions. While the lane placement is generally similar between baseline and occluded
camera conditions, the lateral lane placement is more towards the right of the testing lane in the first half of
the run.
35 | P a g e
EFFECT OF ENVIRONMENTAL FACTORS ON
ADAS SENSOR PERFORMANCE
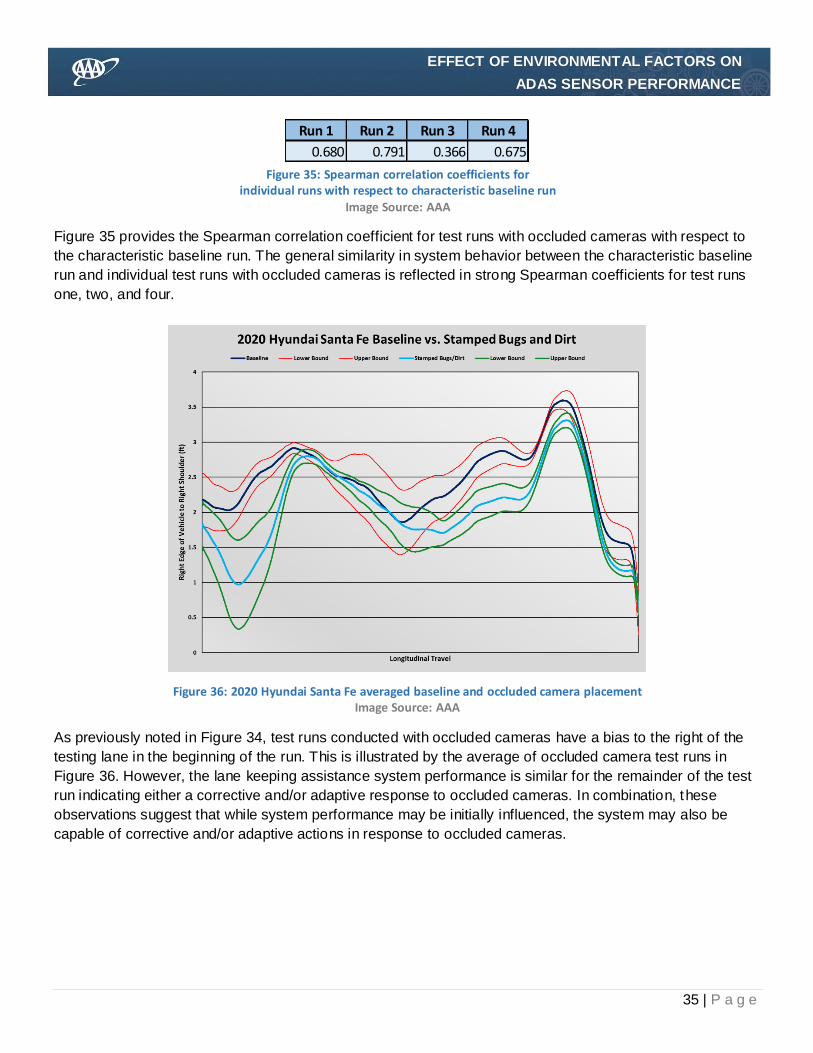
Figure 35: Spearman correlation coefficients for
individual runs with respect to characteristic baseline run Image Source: AAA
Figure 35 provides the Spearman correlation coefficient for test runs with occluded cameras with respect to
the characteristic baseline run. The general similarity in system behavior between the characteristic baseline
run and individual test runs with occluded cameras is reflected in strong Spearman coefficients for test runs
one, two, and four.
Figure 36: 2020 Hyundai Santa Fe averaged baseline and occluded camera placement Image Source: AAA
As previously noted in Figure 34, test runs conducted with occluded cameras have a bias to the right of the
testing lane in the beginning of the run. This is illustrated by the average of occluded camera test runs in
Figure 36. However, the lane keeping assistance system performance is similar for the remainder of the test
run indicating either a corrective and/or adaptive response to occluded cameras. In combination, these
observations suggest that while system performance may be initially influenced, the system may also be
capable of corrective and/or adaptive actions in response to occluded cameras.
Run 1 Run 2 Run 3 Run 4
0.680 0.791 0.366 0.675

36 | P a g e
EFFECT OF ENVIRONMENTAL FACTORS ON
ADAS SENSOR PERFORMANCE
c) 2020 Toyota RAV4
Figure 37: 2020 Toyota RAV4 average baseline lane placement and individual runs with occluded cameras Image Source: AAA
Figure 37 illustrates a graphical representation of the test vehicle lateral placement for the characteristic
baseline run in comparison to the four individual test runs conducted with occluded cameras. As previously
described in Section VI-C1c, the characteristic baseline run is comprised of three individual baseline test runs
because as in the previous test, the test vehicle left the roadway for one of the four baseline runs.
Quasiperiodicity is exhibited for baseline and occluded camera conditions; however, the general appearance
between the characteristic averaged run and individual test runs with occluded cameras is significantly
different. The characteristic baseline run does not resemble any common mathematic function whereas the
third and fourth test runs are similar in appearance to an irregular sinusoidal wave. The test vehicle left the
testing lane during the first test run. Specifically, test runs conducted with occluded cameras exhibited more
“ping-ponging” than the characteristic baseline run.
Figure 38: Spearman correlation coefficients for
individual runs with respect to characteristic baseline run Image Source: AAA
Figure 38 provides the Spearman correlation coefficient for test runs with occluded cameras with respect to
the characteristic baseline run. For the first test run, the Spearman coefficient only accounts for lateral lane
Run 1 Run 2 Run 3 Run 4
0.164 -0.433 0.328 0.413
37 | P a g e
EFFECT OF ENVIRONMENTAL FACTORS ON
ADAS SENSOR PERFORMANCE
placement of the characteristic baseline run to the longitudinal point at which the test vehicle left the
roadway.
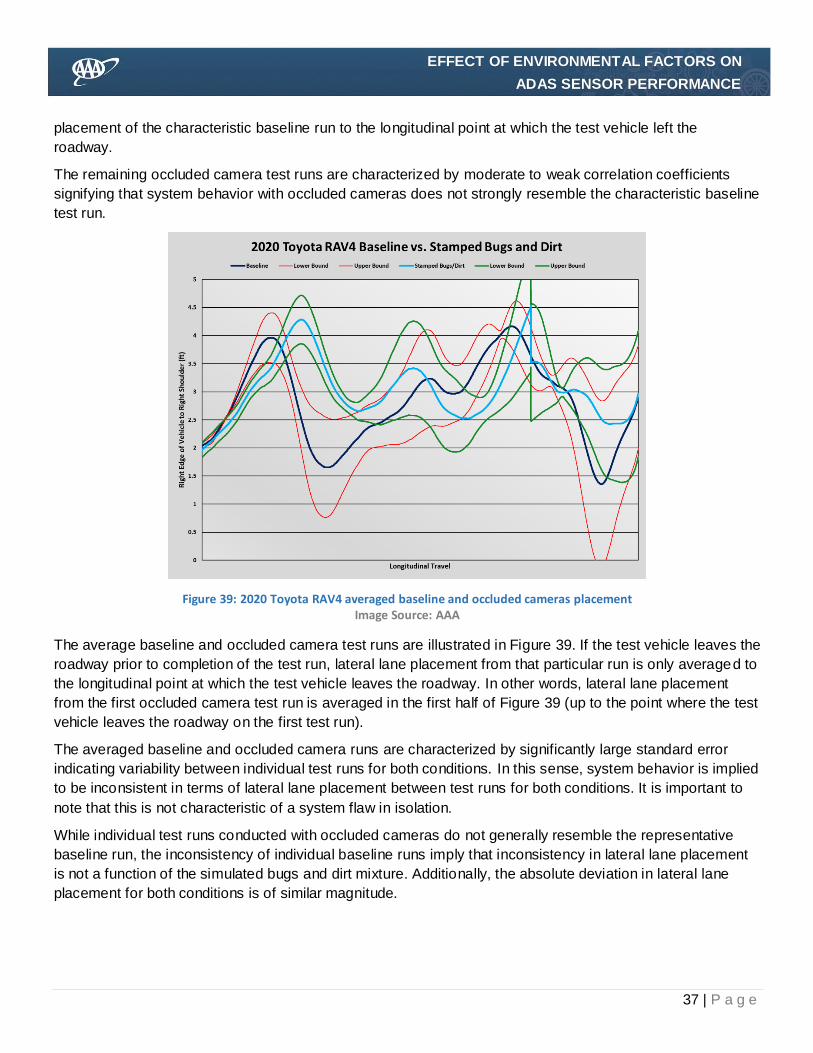
The remaining occluded camera test runs are characterized by moderate to weak correlation coefficients
signifying that system behavior with occluded cameras does not strongly resemble the characteristic baseline
test run.
Figure 39: 2020 Toyota RAV4 averaged baseline and occluded cameras placement Image Source: AAA
The average baseline and occluded camera test runs are illustrated in Figure 39. If the test vehicle leaves the
roadway prior to completion of the test run, lateral lane placement from that particular run is only averaged to
the longitudinal point at which the test vehicle leaves the roadway. In other words, lateral lane placement
from the first occluded camera test run is averaged in the first half of Figure 39 (up to the point where the test
vehicle leaves the roadway on the first test run).
The averaged baseline and occluded camera runs are characterized by significantly large standard error
indicating variability between individual test runs for both conditions. In this sense, system behavior is implied
to be inconsistent in terms of lateral lane placement between test runs for both conditions. It is important to
note that this is not characteristic of a system flaw in isolation.
While individual test runs conducted with occluded cameras do not generally resemble the representative
baseline run, the inconsistency of individual baseline runs imply that inconsistency in lateral lane placement
is not a function of the simulated bugs and dirt mixture. Additionally, the absolute deviation in lateral lane
placement for both conditions is of similar magnitude.

38 | P a g e
EFFECT OF ENVIRONMENTAL FACTORS ON
ADAS SENSOR PERFORMANCE
d) 2020 Volkswagen Tiguan
Figure 40: 2020 Volkswagen Tiguan average baseline lane placement and individual runs with occluded cameras
Image Source: AAA
Figure 40 illustrates a graphical representation of the test vehicle lateral placement for the characteristic
baseline run in comparison to the four individual test runs conducted with occluded cameras. Quasiperiodicity
is exhibited for baseline and occluded camera conditions not similar in appearance to any common
mathematical functions. While the lane placement is generally similar between baseline and occluded
camera conditions, the lateral lane placement for occluded camera conditions generally exhibit a minor
degree of weaving towards the end of the test run.
Figure 41: Spearman correlation coefficients for individual runs with respect to characteristic baseline run
Image Source: AAA
Figure 41 provides the Spearman correlation coefficient for test runs with occluded cameras with respect to
the characteristic baseline run. The general similarity in system behavior between the characteristic baseline
run and individual test runs with occluded cameras is reflected in moderately strong Spearman coefficients
above 0.649.
0
0.5
1
1.5
2
2.5
3
3.5
4
4.5
5
Rig
ht
Edge
of
Veh
icle
to
Rig
ht
Sho
uld
er (
ft)
Longitudinal Travel
2020 Volkswagen Tiguan Baseline vs. Stamped Bugs and DirtBaseline Lower Bound Upper Bound Bugs Run 1 Bugs Run 2 Bugs Run 3 Bugs Run 4
Run 1 Run 2 Run 3 Run 4
0.649 0.782 0.854 0.838

39 | P a g e
EFFECT OF ENVIRONMENTAL FACTORS ON
ADAS SENSOR PERFORMANCE
Figure 42: 2020 Volkswagen Tiguan averaged baseline and occluded cameras placement Image Source: AAA
The average baseline and occluded camera test runs are illustrated in Figure 42. The lane keeping
assistance system performance is notably similar throughout the test run indicating that system performance
is not significantly influenced by cameras occluded with bug and dirt particles.
2) Automatic Emergency Braking (AEB)
For narrative purposes, impact speeds are defined as follows within this report:
0 mph < Impact Speed ≤ 5 mph = Minor Impact
5 mph < Impact Speed ≤ 10 mph = Moderate Impact
10 mph < Impact Speed = Significant Impact
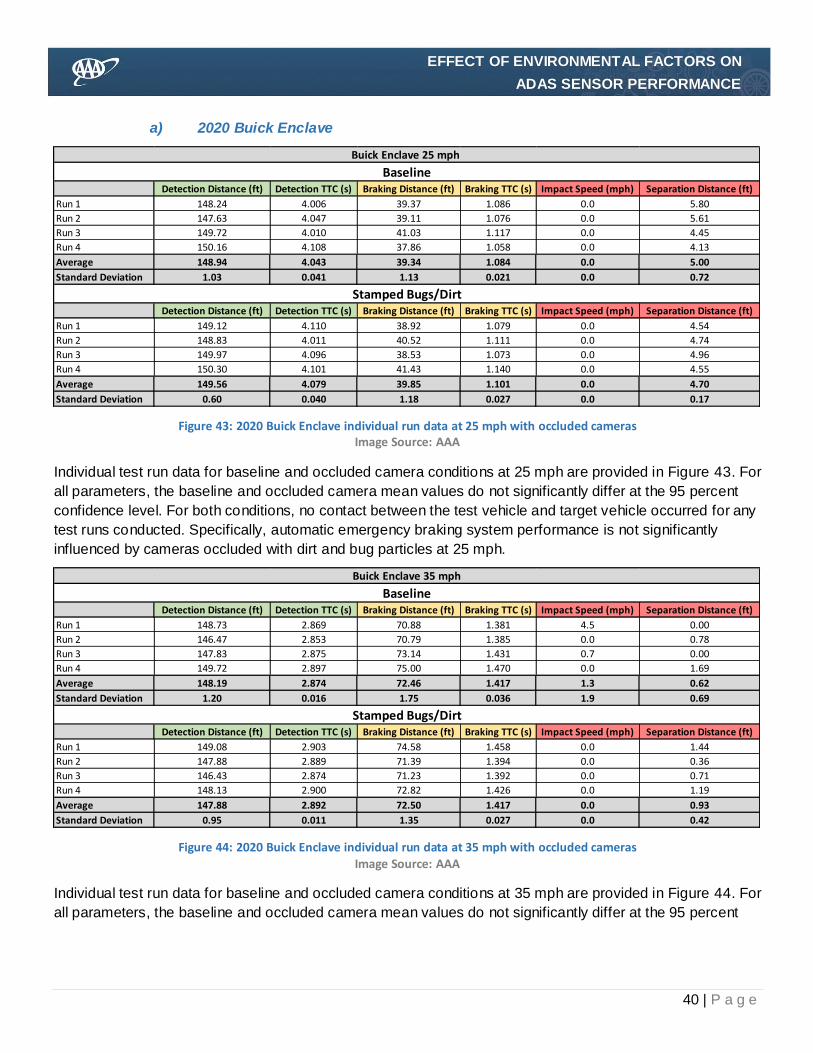
40 | P a g e
EFFECT OF ENVIRONMENTAL FACTORS ON
ADAS SENSOR PERFORMANCE
a) 2020 Buick Enclave
Figure 43: 2020 Buick Enclave individual run data at 25 mph with occluded cameras Image Source: AAA
Individual test run data for baseline and occluded camera conditions at 25 mph are provided in Figure 43. For
all parameters, the baseline and occluded camera mean values do not significantly differ at the 95 percent
confidence level. For both conditions, no contact between the test vehicle and target vehicle occurred for any
test runs conducted. Specifically, automatic emergency braking system performance is not significantly
influenced by cameras occluded with dirt and bug particles at 25 mph.
Figure 44: 2020 Buick Enclave individual run data at 35 mph with occluded cameras Image Source: AAA
Individual test run data for baseline and occluded camera conditions at 35 mph are provided in Figure 44. For
all parameters, the baseline and occluded camera mean values do not significantly differ at the 95 percent
Detection Distance (ft) Detection TTC (s) Braking Distance (ft) Braking TTC (s) Impact Speed (mph) Separation Distance (ft)
Run 1 148.24 4.006 39.37 1.086 0.0 5.80
Run 2 147.63 4.047 39.11 1.076 0.0 5.61
Run 3 149.72 4.010 41.03 1.117 0.0 4.45
Run 4 150.16 4.108 37.86 1.058 0.0 4.13
Average 148.94 4.043 39.34 1.084 0.0 5.00
Standard Deviation 1.03 0.041 1.13 0.021 0.0 0.72
Detection Distance (ft) Detection TTC (s) Braking Distance (ft) Braking TTC (s) Impact Speed (mph) Separation Distance (ft)
Run 1 149.12 4.110 38.92 1.079 0.0 4.54
Run 2 148.83 4.011 40.52 1.111 0.0 4.74
Run 3 149.97 4.096 38.53 1.073 0.0 4.96
Run 4 150.30 4.101 41.43 1.140 0.0 4.55
Average 149.56 4.079 39.85 1.101 0.0 4.70
Standard Deviation 0.60 0.040 1.18 0.027 0.0 0.17
Baseline
Stamped Bugs/Dirt
Buick Enclave 25 mph
Detection Distance (ft) Detection TTC (s) Braking Distance (ft) Braking TTC (s) Impact Speed (mph) Separation Distance (ft)
Run 1 148.73 2.869 70.88 1.381 4.5 0.00
Run 2 146.47 2.853 70.79 1.385 0.0 0.78
Run 3 147.83 2.875 73.14 1.431 0.7 0.00
Run 4 149.72 2.897 75.00 1.470 0.0 1.69
Average 148.19 2.874 72.46 1.417 1.3 0.62
Standard Deviation 1.20 0.016 1.75 0.036 1.9 0.69
Detection Distance (ft) Detection TTC (s) Braking Distance (ft) Braking TTC (s) Impact Speed (mph) Separation Distance (ft)
Run 1 149.08 2.903 74.58 1.458 0.0 1.44
Run 2 147.88 2.889 71.39 1.394 0.0 0.36
Run 3 146.43 2.874 71.23 1.392 0.0 0.71
Run 4 148.13 2.900 72.82 1.426 0.0 1.19
Average 147.88 2.892 72.50 1.417 0.0 0.93
Standard Deviation 0.95 0.011 1.35 0.027 0.0 0.42
Baseline
Stamped Bugs/Dirt
Buick Enclave 35 mph

41 | P a g e
EFFECT OF ENVIRONMENTAL FACTORS ON
ADAS SENSOR PERFORMANCE
confidence level. However, the test vehicle did not impact the target vehicle for any test runs conducted with
occluded cameras. This contrasts with the baseline condition in which minor impact occurred with the target
vehicle for two of four runs. Specifically, automatic emergency braking system performance was not
negatively influenced by cameras occluded with bug and dirt particles at 35 mph.
b) 2020 Hyundai Santa Fe
Figure 45: 2020 Hyundai Santa Fe individual run data at 25 mph with occluded cameras Image Source: AAA
Individual test run data for baseline and occluded camera conditions at 25 mph are provided in Figure 45. For
all parameters, the baseline and occluded camera mean values do not significantly differ at the 95 percent
confidence level. For both conditions, no contact between the test vehicle and target vehicle occurred for any
test runs conducted. Specifically, automatic emergency braking system performance is not significantly
influenced by cameras occluded with dirt and bug particles at 25 mph.
Detection Distance (ft) Detection TTC (s) Braking Distance (ft) Braking TTC (s) Impact Speed (mph) Separation Distance (ft)
Run 1 71.48 1.983 40.72 1.163 0.0 8.82
Run 2 72.87 1.971 42.49 1.186 0.0 9.09
Run 3 72.67 1.970 42.09 1.181 0.0 9.80
Run 4 71.25 1.953 42.62 1.185 0.0 8.27
Average 72.07 1.97 41.98 1.18 0.0 8.99
Standard Deviation 0.71 0.01 0.75 0.01 0.0 0.55
Detection Distance (ft) Detection TTC (s) Braking Distance (ft) Braking TTC (s) Impact Speed (mph) Separation Distance (ft)
Run 1 72.83 1.963 43.13 1.200 0.0 10.51
Run 2 72.69 1.969 42.07 1.180 0.0 6.61
Run 3 73.72 1.990 41.52 1.161 0.0 9.42
Run 4 72.16 1.978 40.09 1.141 0.0 9.78
Average 72.85 1.975 41.70 1.170 0.0 9.08
Standard Deviation 0.56 0.010 1.09 0.022 0.0 1.48
Baseline
Hyundai Santa Fe 25 mph
Stamped Bugs/Dirt
Detection Distance (ft) Detection TTC (s) Braking Distance (ft) Braking TTC (s) Impact Speed (mph) Separation Distance (ft)
Run 1 117.12 2.312 80.93 1.631 0.0 6.22
Run 2 121.72 2.380 76.20 1.537 0.0 3.31
Run 3 122.50 2.380 80.67 1.608 0.0 6.47
Run 4 121.38 2.361 80.67 1.611 0.0 4.90
Average 120.68 2.358 79.62 1.597 0.0 5.23
Standard Deviation 2.09 0.028 1.97 0.036 0.0 1.26
Detection Distance (ft) Detection TTC (s) Braking Distance (ft) Braking TTC (s) Impact Speed (mph) Separation Distance (ft)
Run 1 120.34 2.359 72.91 1.472 0.0 4.00
Run 2 119.48 2.339 71.56 1.447 0.0 5.87
Run 3 122.63 2.404 71.85 1.461 0.0 5.07
Run 4 121.36 2.390 77.11 1.563 0.0 6.20
Average 120.95 2.373 73.36 1.486 0.0 5.29
Standard Deviation 1.17 0.025 2.22 0.045 0.0 0.85
Hyundai Santa Fe 35 mph
Baseline
Stamped Bugs/Dirt

42 | P a g e
EFFECT OF ENVIRONMENTAL FACTORS ON
ADAS SENSOR PERFORMANCE
Figure 46: 2020 Hyundai Santa Fe individual run data at 35 mph with occluded cameras Image Source: AAA
Individual test run data for baseline and occluded camera conditions at 35 mph are provided in Figure 46. For
all parameters, the baseline and occluded camera mean values do not significantly differ at the 95 percent
confidence level. For both conditions, no contact between the test vehicle and target vehicle occurred for any
test runs conducted. Specifically, automatic emergency braking system performance is not significantly
influenced by cameras occluded with dirt and bug particles at 35 mph.
c) 2020 Toyota RAV4
Figure 47: 2020 Toyota RAV4 individual run data at 25 mph with occluded cameras
Image Source: AAA
Individual test run data for baseline and occluded camera conditions at 25 mph are provided in Figure 47. For
all parameters, the baseline and occluded camera mean values do not significantly differ at the 95 percent
confidence level. For both conditions, no contact between the test vehicle and target vehicle occurred for any
test runs conducted. Specifically, automatic emergency braking system performance is not significantly
influenced by cameras occluded with dirt and bug particles at 25 mph.
Detection Distance (ft) Detection TTC (s) Braking Distance (ft) Braking TTC (s) Impact Speed (mph) Separation Distance (ft)
Run 1 77.65 2.132 58.40 1.621 0.0 2.65
Run 2 73.94 2.027 55.41 1.542 0.0 1.94
Run 3 76.95 2.119 58.50 1.633 0.0 2.84
Run 4 73.46 2.003 59.19 1.630 0.0 1.92
Average 75.50 2.070 57.87 1.606 0.0 2.34
Standard Deviation 1.82 0.056 1.46 0.037 0.0 0.42
Detection Distance (ft) Detection TTC (s) Braking Distance (ft) Braking TTC (s) Impact Speed (mph) Separation Distance (ft)
Run 1 75.40 2.059 58.25 1.611 0.0 3.25
Run 2 74.57 2.029 58.45 1.608 0.0 1.97
Run 3 79.80 2.154 58.43 1.601 0.0 2.68
Run 4 77.50 2.134 53.96 1.510 0.0 3.32
Average 76.82 2.094 57.27 1.583 0.0 2.81
Standard Deviation 2.03 0.052 1.91 0.042 0.0 0.54
Toyota RAV4 25 mph
Baseline
Stamped Bugs/Dirt
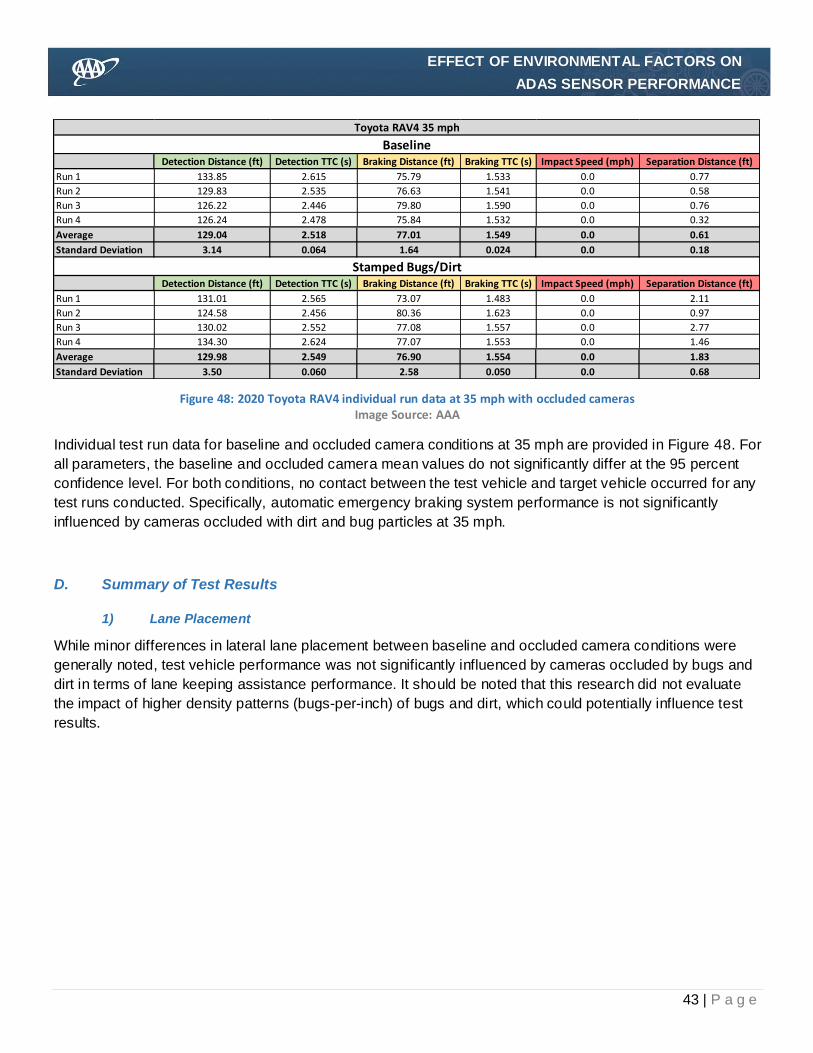
43 | P a g e
EFFECT OF ENVIRONMENTAL FACTORS ON
ADAS SENSOR PERFORMANCE
Figure 48: 2020 Toyota RAV4 individual run data at 35 mph with occluded cameras Image Source: AAA
Individual test run data for baseline and occluded camera conditions at 35 mph are provided in Figure 48. For
all parameters, the baseline and occluded camera mean values do not significantly differ at the 95 percent
confidence level. For both conditions, no contact between the test vehicle and target vehicle occurred for any
test runs conducted. Specifically, automatic emergency braking system performance is not significantly
influenced by cameras occluded with dirt and bug particles at 35 mph.
D. Summary of Test Results
1) Lane Placement
While minor differences in lateral lane placement between baseline and occluded camera conditions were
generally noted, test vehicle performance was not significantly influenced by cameras occluded by bugs and
dirt in terms of lane keeping assistance performance. It should be noted that this research did not evaluate
the impact of higher density patterns (bugs-per-inch) of bugs and dirt, which could potentially influence test
results.
Detection Distance (ft) Detection TTC (s) Braking Distance (ft) Braking TTC (s) Impact Speed (mph) Separation Distance (ft)
Run 1 133.85 2.615 75.79 1.533 0.0 0.77
Run 2 129.83 2.535 76.63 1.541 0.0 0.58
Run 3 126.22 2.446 79.80 1.590 0.0 0.76
Run 4 126.24 2.478 75.84 1.532 0.0 0.32
Average 129.04 2.518 77.01 1.549 0.0 0.61
Standard Deviation 3.14 0.064 1.64 0.024 0.0 0.18
Detection Distance (ft) Detection TTC (s) Braking Distance (ft) Braking TTC (s) Impact Speed (mph) Separation Distance (ft)
Run 1 131.01 2.565 73.07 1.483 0.0 2.11
Run 2 124.58 2.456 80.36 1.623 0.0 0.97
Run 3 130.02 2.552 77.08 1.557 0.0 2.77
Run 4 134.30 2.624 77.07 1.553 0.0 1.46
Average 129.98 2.549 76.90 1.554 0.0 1.83
Standard Deviation 3.50 0.060 2.58 0.050 0.0 0.68
Baseline
Stamped Bugs/Dirt
Toyota RAV4 35 mph

44 | P a g e
EFFECT OF ENVIRONMENTAL FACTORS ON
ADAS SENSOR PERFORMANCE
2) Automatic Emergency Braking (AEB)
Figure 49: Average impact speed and final separation distance at 25 mph Image Source: AAA
0.00
1.00
2.00
3.00
4.00
5.00
6.00
7.00
8.00
9.00
10.00
0
2
4
6
8
10
12
14
16
18
20
Buick Enclave Hyundai Santa Fe Toyota RAV4
Sep
arat
ion
Dis
tan
ce (
ft)
Imp
act
Spee
d (
mp
h)
Average Impact Speed and Separation Distance at 25 mphBaseline Impact Speed Stamped Bugs/Dirt Impact Speed
Baseline Separation Distance Stamped Bugs/Dirt Separation Distance

45 | P a g e
EFFECT OF ENVIRONMENTAL FACTORS ON
ADAS SENSOR PERFORMANCE
Figure 50: Average impact speed and final separation distance at 35 mph Image Source: AAA
Figures 49 and 50 illustrate the average impact speed and associated separation distance for baseline and
occluded camera conditions for each test vehicle at 25 mph and 35 mph, respectively.
Figure 51: Averaged data for each test vehicle at 25 mph Image Source: AAA
0.00
1.00
2.00
3.00
4.00
5.00
6.00
7.00
8.00
9.00
10.00
0
2
4
6
8
10
12
14
16
18
20
Buick Enclave Hyundai Santa Fe Toyota RAV4
Sep
arat
ion
Dis
tan
ce (
ft)
Imp
act
Spee
d (
mp
h)
Average Impact Speed and Separation Distance at 35 mphBaseline Impact Speed Stamped Bugs/Dirt Impact Speed
Baseline Separation Distance Stamped Bugs/Dirt Separation Distance
Detection Distance (ft) Detection TTC (s) Braking Distance (ft) Braking TTC (s) Impact Speed (mph) Separation Distance (ft)
Baseline Average 148.94 4.043 39.34 1.084 0.0 5.00
Bugs/Dirt Average 149.56 4.079 39.85 1.101 0.0 4.70
Group Average 149.25 4.061 39.60 1.092 0.0 4.85
Std. Deviation 0.31 0.018 0.25 0.008 0.0 0.15
Detection Distance (ft) Detection TTC (s) Braking Distance (ft) Braking TTC (s) Impact Speed (mph) Separation Distance (ft)
Baseline Average 72.07 1.969 41.98 1.179 0.0 8.99
Bugs/Dirt Average 72.85 1.975 41.70 1.170 0.0 9.08
Group Average 72.46 1.972 41.84 1.175 0.0 9.04
Std. Deviation 0.39 0.003 0.14 0.004 0.0 0.04
Detection Distance (ft) Detection TTC (s) Braking Distance (ft) Braking TTC (s) Impact Speed (mph) Separation Distance (ft)
Baseline Average 75.50 2.070 57.87 1.606 0.0 2.34
Bugs/Dirt Average 76.82 2.094 57.27 1.583 0.0 2.81
Group Average 76.16 2.082 57.57 1.595 0.0 2.57
Std. Deviation 0.66 0.012 0.30 0.012 0.0 0.23
Buick Enclave
Stamped Bugs/Dirt 25 mph
Hyundai Santa Fe
Toyota RAV4
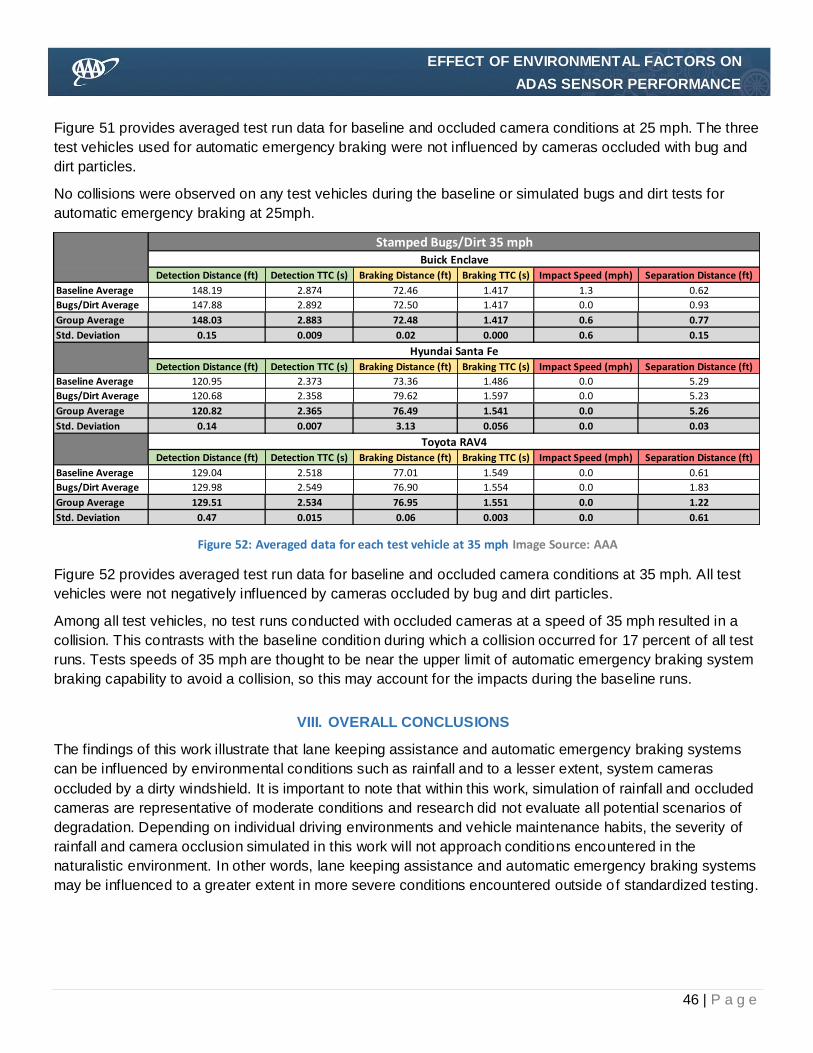
46 | P a g e
EFFECT OF ENVIRONMENTAL FACTORS ON
ADAS SENSOR PERFORMANCE
Figure 51 provides averaged test run data for baseline and occluded camera conditions at 25 mph. The three
test vehicles used for automatic emergency braking were not influenced by cameras occluded with bug and
dirt particles.
No collisions were observed on any test vehicles during the baseline or simulated bugs and dirt tests for
automatic emergency braking at 25mph.
Figure 52: Averaged data for each test vehicle at 35 mph Image Source: AAA
Figure 52 provides averaged test run data for baseline and occluded camera conditions at 35 mph. All test
vehicles were not negatively influenced by cameras occluded by bug and dirt particles.
Among all test vehicles, no test runs conducted with occluded cameras at a speed of 35 mph resulted in a
collision. This contrasts with the baseline condition during which a collision occurred for 17 percent of all test
runs. Tests speeds of 35 mph are thought to be near the upper limit of automatic emergency braking system
braking capability to avoid a collision, so this may account for the impacts during the baseline runs.
VIII. OVERALL CONCLUSIONS
The findings of this work illustrate that lane keeping assistance and automatic emergency braking systems
can be influenced by environmental conditions such as rainfall and to a lesser extent, system cameras
occluded by a dirty windshield. It is important to note that within this work, simulation of rainfall and occluded
cameras are representative of moderate conditions and research did not evaluate all potential scenarios of
degradation. Depending on individual driving environments and vehicle maintenance habits, the severity of
rainfall and camera occlusion simulated in this work will not approach conditions encountered in the
naturalistic environment. In other words, lane keeping assistance and automatic emergency braking systems
may be influenced to a greater extent in more severe conditions encountered outside of standardized testing.
Detection Distance (ft) Detection TTC (s) Braking Distance (ft) Braking TTC (s) Impact Speed (mph) Separation Distance (ft)
Baseline Average 148.19 2.874 72.46 1.417 1.3 0.62
Bugs/Dirt Average 147.88 2.892 72.50 1.417 0.0 0.93
Group Average 148.03 2.883 72.48 1.417 0.6 0.77
Std. Deviation 0.15 0.009 0.02 0.000 0.6 0.15
Detection Distance (ft) Detection TTC (s) Braking Distance (ft) Braking TTC (s) Impact Speed (mph) Separation Distance (ft)
Baseline Average 120.95 2.373 73.36 1.486 0.0 5.29
Bugs/Dirt Average 120.68 2.358 79.62 1.597 0.0 5.23
Group Average 120.82 2.365 76.49 1.541 0.0 5.26
Std. Deviation 0.14 0.007 3.13 0.056 0.0 0.03
Detection Distance (ft) Detection TTC (s) Braking Distance (ft) Braking TTC (s) Impact Speed (mph) Separation Distance (ft)
Baseline Average 129.04 2.518 77.01 1.549 0.0 0.61
Bugs/Dirt Average 129.98 2.549 76.90 1.554 0.0 1.83
Group Average 129.51 2.534 76.95 1.551 0.0 1.22
Std. Deviation 0.47 0.015 0.06 0.003 0.0 0.61
Hyundai Santa Fe
Toyota RAV4
Buick Enclave
Stamped Bugs/Dirt 35 mph
47 | P a g e
EFFECT OF ENVIRONMENTAL FACTORS ON
ADAS SENSOR PERFORMANCE
Drivers must exercise additional caution when utilizing lane keeping assistance and automatic emergency
braking systems in inclement weather as performance may be adversely affected. Additionally, drivers should
account for additional stopping distance that may be required depending on rainfall intensity, speed, vehicle
condition, etc.
In total, lane keeping assistance and automatic emergency braking systems can significantly enhance safety
when utilized properly. Drivers must understand system limitations in adverse conditions and regularly clean
areas around sensors to ensure optimal performance.
IX. KEY FINDINGS
1. In general, evaluated lane keeping assistance and automatic emergency braking systems were
influenced by simulated rainfall.
a. In terms of lane keeping performance, 69 percent of test runs conducted with simulated
rainfall resulted in the test vehicle crossing the lane marker on the roadway.
b. In aggregate, 17 and 33 percent of test runs conducted with simulated rainfall resulted in a
collision for test speeds of 25 and 35 mph, respectively.
2. In general, evaluated lane keeping assistance and automatic emergency braking systems were
minimally influenced by a dirty windshield.
a. While minor differences were noted with respect to baseline conditions, lane keeping
assistance performance was not negatively influenced by a dirty windshield.
b. No test runs conducted with a dirty windshield resulted in a collision for either 25mph or
35mph test speeds.
X. SUMMARY RECOMMENDATIONS
1. Drivers should understand the limitations of ADAS and remain engaged behind the wheel as these
systems are an aide, not a replacement for an engaged driver.
2. Drivers must use extra caution and avoid system overreliance, particularly in adverse weather
conditions.
3. To ensure optimal system performance, keep areas around cameras and radar sensors clean. The
owner’s manual will describe the location of sensors and recommended cleaning procedures.

48 | P a g e
EFFECT OF ENVIRONMENTAL FACTORS ON
ADAS SENSOR PERFORMANCE
XI. REFERENCES
[1] A. Benson, B. Tefft, A. M. Svancara and W. Horrey, "Potential Reduction in Crashes, Injuries, and
Deaths from Large-Scale Deployment of Advanced Driver Assistance Systems," AAA Foundation for
Traffic Safety, 2018.
[2] Insurance Institute of Highway Safety, "Real-world benefits of crash avoidance technologies," December
2020. [Online]. Available: https://www.iihs.org/media/259e5bbd-f859-42a7-bd54-
3888f7a2d3ef/shuYZQ/Topics/ADVANCED%20DRIVER%20ASSISTANCE/IIHS-real-world-CA-
benefits.pdf. [Accessed 3 March 2021].
[3] B. Hurd, "2020 sales wrap-up: The good and the bad of an ugly year," Autoblog, 5 January 2021.
[Online]. Available: https://www.autoblog.com/2021/01/05/2020-year-end-auto-sales/. [Accessed 10
March 2021].
[4] SAE International, "Taxonomy and Definitions for Terms Related to Driving Automation Systems for On-
Road Motor Vehicles," 2018-06.

49 | P a g e
EFFECT OF ENVIRONMENTAL FACTORS ON
ADAS SENSOR PERFORMANCE
APPENDIX
VIN Location Date 12/7/2020
Make Vehicle Width Weather Overcast
Model Vehicle Length Temp 61 deg F
Trim Mileage Notes
Tire Size Left Front
Manufacturer Right Front
Perf. Code Left Rear
Dot Number Right Rear
VIN Location Date 12/8/2020
Make Vehicle Width Weather Sunny
Model Vehicle Length Temp 77 deg F
Trim Mileage
Tire Size Left Front
Manufacturer Right Front
Perf. Code Left Rear
Dot Number Right Rear
VIN Location Date 12/9/2020
Make Vehicle Width Weather Sunny
Model Vehicle Length Temp 64 deg F
Trim Mileage Notes
Tire Size Left Front
Manufacturer Right Front
Perf. Code Left Rear
Dot Number Right Rear
VIN Location Date 12/10/2020
Make Vehicle Width Weather Sunny
Model Vehicle Length Temp 63 deg F
Trim Mileage Notes
Tire Size Left Front
Manufacturer Right Front
Perf. Code Left Rear
Dot Number Right Rear
99H 8.6mm
3320 8.4mm
235/50/R19 8.5mm
Pirelli 8.4mm
Tiguan 185in
4motion 623
Tire Information Tire Tread Depth
3620 7.8mm
Test Vehicle Information Test Information
3VV2B7AX5MM00313 Autoclub Speedway
Volkswagen 72in
Michelin 7.6mm
100H 7.7mm
548
Tire Information Tire Tread Depth
225/60/R18 7.5mm
Test Vehicle Information Test Information
4T3D6RFVMU009000 Autoclub Speedway
Toyota 73in
Rav4 Hybrid 181in
Limited AWD
107H 9.6mm
3820 9.6mm
255/55/R20 8mm
Continental 8mm
Enclave Avenir 204in
FWD 1SP 2,051
Tire Information Tire Tread Depth
0419 7.3mm
Test Vehicle Information Test Information
5GAERDKW7MJ100019 Autoclub Speedway
Buick 79in
Hankook 6.0mm
104H 7.2mm
11,686
Tire Information Tire Tread Depth
235/55/R17 6.5mm
Test Vehicle Information Test Information
5NMS2CAD0KH117098 Autoclub Speedway
Hyundai 74in
Santa Fe 188in


![[PPT]Wireless Sensor Networks - University of Florida · Web viewOutline Introduction Wireless Sensor Networks Applications Factors Influencing Sensor Network Design Sensor Node Components](https://img.pdfslide.us/doc/110x75/5b408bbe7f8b9a91078d5cbb/pptwireless-sensor-networks-university-of-web-viewoutline-introduction-wireless.jpg)