Embed Size (px)
Citation preview
T.RENUKA* et al. ISSN: 2250–3676
[IJESAT] INTERNATIONAL JOURNAL OF ENGINEERING SCIENCE & ADVANCED TECHNOLOGY Volume-2, Issue-6, 1614 – 1625
IJESAT | Nov-Dec 2012
Available online @ http://www.ijesat.org 1614
MODELING OF UPFC WITH SIX PULSE SPWM BASED VSC AND
ITS POWER FLOW STUDY
T.Renuka1, D.Rambabu2 1Assistant Professor, EEE Department, Rao and Naidu Engineering College, Ongole, AP, India,
[email protected] 2 Junior Telecom Officer, BSNL, AP, India, [email protected]
Abstract
One of the main reasons of the voltage instability is the reactive power limit of the system. To improve system reactive power handling capacity Flexible AC Transmission Systems (FACTS) is the best solution which can prevent voltage instability. In this paper one of the FACTS devices Unified Power Flow Controllers (UPFC) is designed with six pulse Sinusoidal Pulse Width Modulation (SPWM) based Voltage Source Converter (VSC); this can remain all the advantages of the ideal switch and eliminate its disadvantages. This model is designed in Matlab/Simulink software and characteristics are analyzed. UPFC power flow equations are developed for this model and total generation, total load and line losses are evaluated by using Newton-Raphson method power flow program which is developed in MATLAB of the standard IEEE 30 bus system. Index Terms: Flexible AC Transmission Systems (FACTS), Unified Power Flow Controllers (UPFC), Voltage Source
Converter (VSC), Sinusoidal Pulse Width Modulation (SPWM), Newton-Raphson method.
--------------------------------------------------------------------- *** ---------------------------- --------------------------------------------
1. INTRODUCTION
Flexible AC Transmission Systems (FACTS) based on power electronics offer an opportunity to improve controllability, stability, and power transfer capability of AC transmission systems [1]. In general, FACTS controllers can be classified into two different generations. The first generation is based on the line-commutated thyristor devices with only gate turn-on but no gate turn-off capability. These are Static Var Compensator (SVC) and Thyristor Controlled Series Capacitor (TCSC). The second generation of FACTS controllers is based on self-commutated voltage sourced converters (VSC), which utilize thyristors/transistors with gate turn-off capability. In general there are many VSC based FACTS controllers, among all these types the Convertible Series Compensator (CSC) is the most versatile FACTS device, which can be operated as Static Synchronous Compensator (STATCOM), which is a shunt type controller, Static Series Compensator (SSSC), which is a series type controller and the Unified Power Flow Controller (UPFC), a combined series-shunt type controller [1]. Among these devices, UPFC is the most powerful; it can provide full dynamic control of the parameters of a transmission line: bus voltage, line impedance and phase angle.
2. BASIC OPERATION OF UPFC
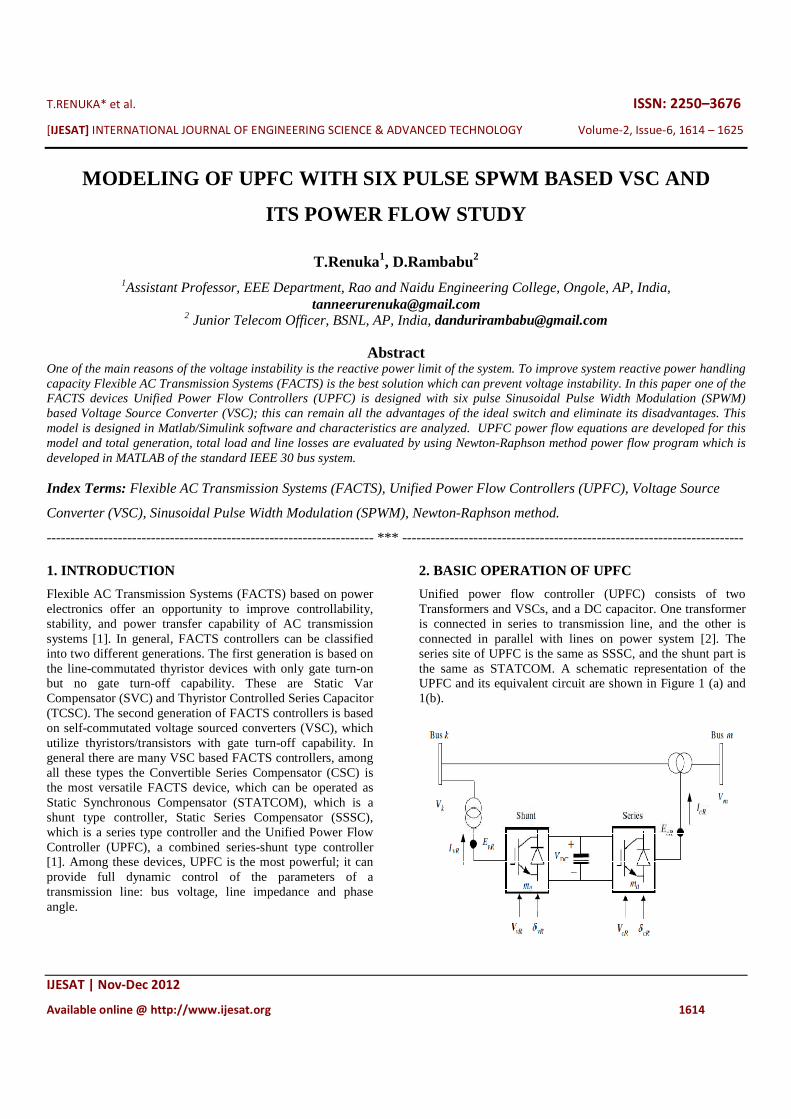
Unified power flow controller (UPFC) consists of two Transformers and VSCs, and a DC capacitor. One transformer is connected in series to transmission line, and the other is connected in parallel with lines on power system [2]. The series site of UPFC is the same as SSSC, and the shunt part is the same as STATCOM. A schematic representation of the UPFC and its equivalent circuit are shown in Figure 1 (a) and 1(b).
T.RENUKA* et al. ISSN: 2250–3676
[IJESAT] INTERNATIONAL JOURNAL OF ENGINEERING SCIENCE & ADVANCED TECHNOLOGY Volume-2, Issue-6, 1614 – 1625
IJESAT | Nov-Dec 2012
Available online @ http://www.ijesat.org 1615
Fig.1 (a)
Fig.1 (b)
Figure 1. Unified power flow controller (UPFC) system: (a) two back-to-back Voltage Source Converters, with one VSC connected to the AC network using a shunt transformer and the second VSC connected to the AC network using a series transformer; (b) UPFC equivalent circuit. UPFC can control both reactive power and active power flow, because DC capacitor has two connections to a power system, and the active power can go through DC capacitor. Two injection voltages are E�� and E�� , both voltage sources can inject active and reactive power independently. But the sum of the two injecting active power should be zero. In a three phase UPFC, suitable expressions for the two voltage sourcesE��
� , E��
� and constraint equation would be:
�� = ��
(cos �� +j sin��
) (1)
� = �
(cos � +j sin�
) (2)
Re {- ��
��∗ + ��
��
∗ } = 0 (3)
Where ρ indicates phase quantities a, b, and c. V��
� and ��
are the parameters of the voltage source representing the shunt converter. V��
� is the voltage magnitude which will give maximum and minimum limits. �
� is the phase angle we may
take any value between 0 and 2π radians. V��
� and �
� are the parameters of the voltage source representing the series converter. The voltage magnitude of the output voltage
V��
� provides voltage regulation, and the phase angle �
� determines the mode of power flow control. The power flow equations of the UPFC are derived by using its equivalent circuit shown in figure (b). 2.1 Six pulse converter
Fig.2. Basic six pulse converter circuit A Six pulse VSC shown in figure (2) requires the generation of three square wave voltages using the three poles A, B, and C. If v�,v� and v� are the three square wave voltages and the corresponding fundamental components are v�,�, v�,� and v�,�. After solving the equations for v�,v� and v�, the sum of three voltages in equation is ��+�� + � = ��� ∑ 2/ !∞
"#� [sin (nθ) +sin n (θ-1200)
+sin n (θ+1200)] (3)
The three square wave voltages are a combination of a fundamental and odd harmonic component. The fundamental component is a set of three phase positive sequence voltages. Among the harmonic components, the n=6k+1 components are in positive sequence; the n=6k-1 components are in negative sequence, where k=1, 2, 3 and so on; by substituting equation (3) in equation (1) and after some complex operations, the active and reactive power equations for the converter and bus k are $% = �%
&'%% + ���%['%�cos ((%-(� ) + +%�sin ((% −
(� )] + � �%['%�cos ((%- � ) + +%�sin ((% - � ) ] +
���%['� cos ((% - ��) + +� sin ((% - �� ) ] (4)
2% = - �%&+%% + ���%['%�sin ((%-(� ) − +%�cos ((% −
(� )] + � �%['%�sin ((%- � ) - +%�cos ((% - � ) ] +
���%['� sin ((% - ��) - +� cos ((% - �� ) ] (5)
T.RENUKA* et al. ISSN: 2250–3676
[IJESAT] INTERNATIONAL JOURNAL OF ENGINEERING SCIENCE & ADVANCED TECHNOLOGY Volume-2, Issue-6, 1614 – 1625
IJESAT | Nov-Dec 2012
Available online @ http://www.ijesat.org 1616
At bus m:
$� = ��&'�� + ���% ['%� cos ((� − (%) + +%� sin ((� −
(%)] + � ��['��cos ((� - � ) + +��sin ((� - � ) ] (6)
Q6 = - V6& B66 + V6V8 [ G86 sin ( : 6 − : 8 ) - B86 cos
( : 6 − : 8)] + V��V6[G66sin (: 6 - δ��) - B66cos (: 6 - δ��)
] (7)
For Series converter: P�� = V��
& G66 + V��V8[G86cos (� -: 8) + B86Sin (� -: 8)]
+ V��V6 [G66cos ( � -: 6) + B66sin (� -: 6 )] (8
Q�� = -V��& B66 + V��V8 [ G86 sin (� - : 8 ) - B86cos (� -
: 8)] + � �� ['��sin ( � -(�) - +��<=> (� -(� )] (9)
For Shunt converter: $� = - ��
& '� + ���% [ '� cos ( �� - (% ) +
+�Sin (�� -(%)], (10)
Q�� = V��& B�� + V��V8[G��sin (δ�� -: 8) –
B��Sin (� -: 8)], (11)
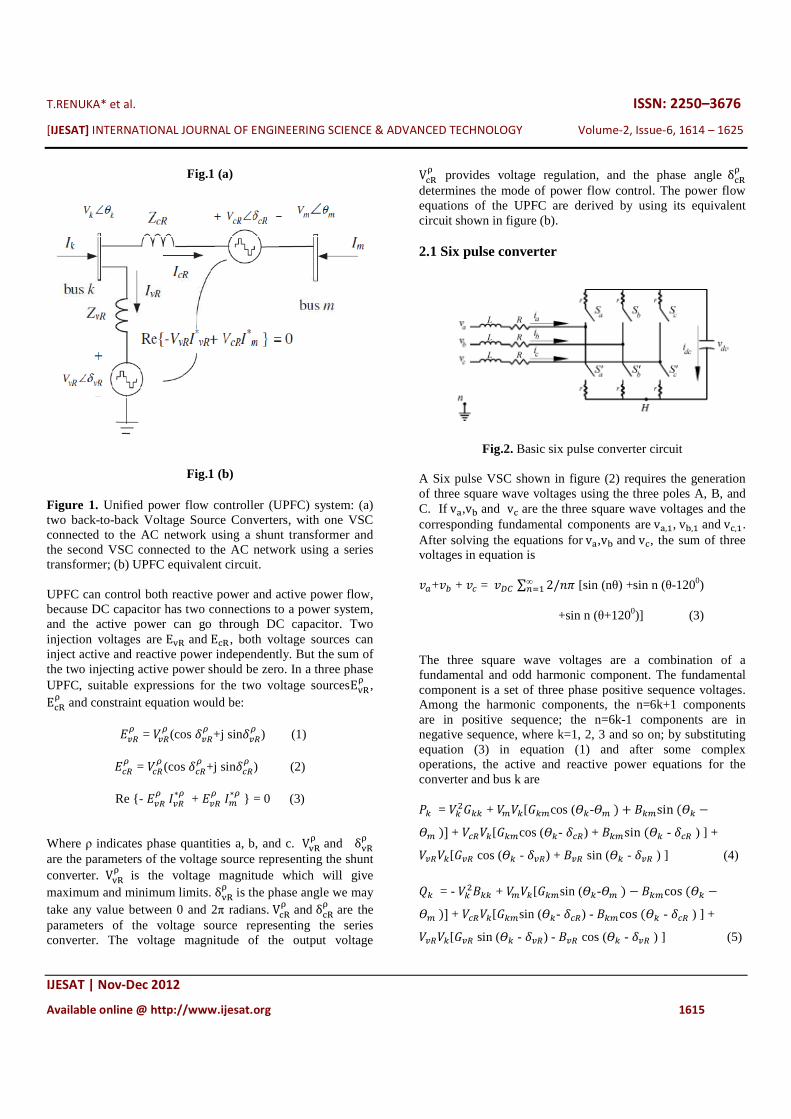
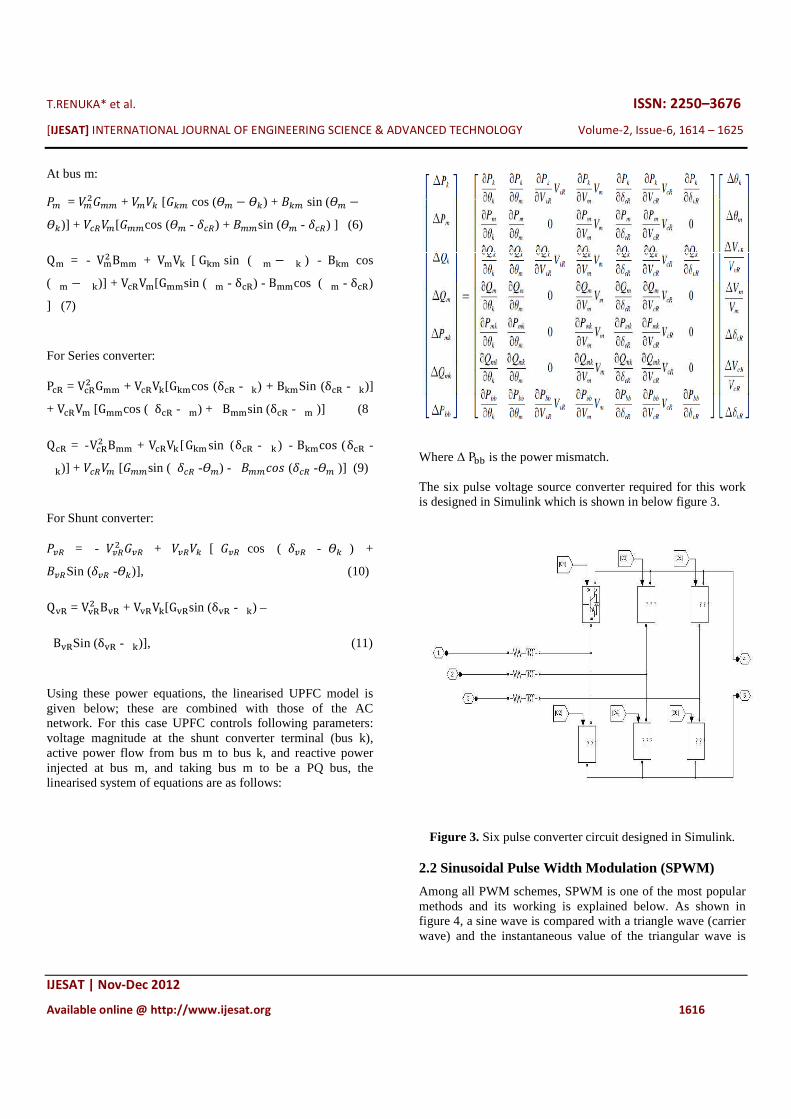
Using these power equations, the linearised UPFC model is given below; these are combined with those of the AC network. For this case UPFC controls following parameters: voltage magnitude at the shunt converter terminal (bus k), active power flow from bus m to bus k, and reactive power injected at bus m, and taking bus m to be a PQ bus, the linearised system of equations are as follows:
Where ∆ P�� is the power mismatch. The six pulse voltage source converter required for this work is designed in Simulink which is shown in below figure 3.
Figure 3. Six pulse converter circuit designed in Simulink.
2.2 Sinusoidal Pulse Width Modulation (SPWM)
Among all PWM schemes, SPWM is one of the most popular methods and its working is explained below. As shown in figure 4, a sine wave is compared with a triangle wave (carrier wave) and the instantaneous value of the triangular wave is
T.RENUKA* et al. ISSN: 2250–3676
[IJESAT] INTERNATIONAL JOURNAL OF ENGINEERING SCIENCE & ADVANCED TECHNOLOGY Volume-2, Issue-6, 1614 – 1625
IJESAT | Nov-Dec 2012
Available online @ http://www.ijesat.org 1617
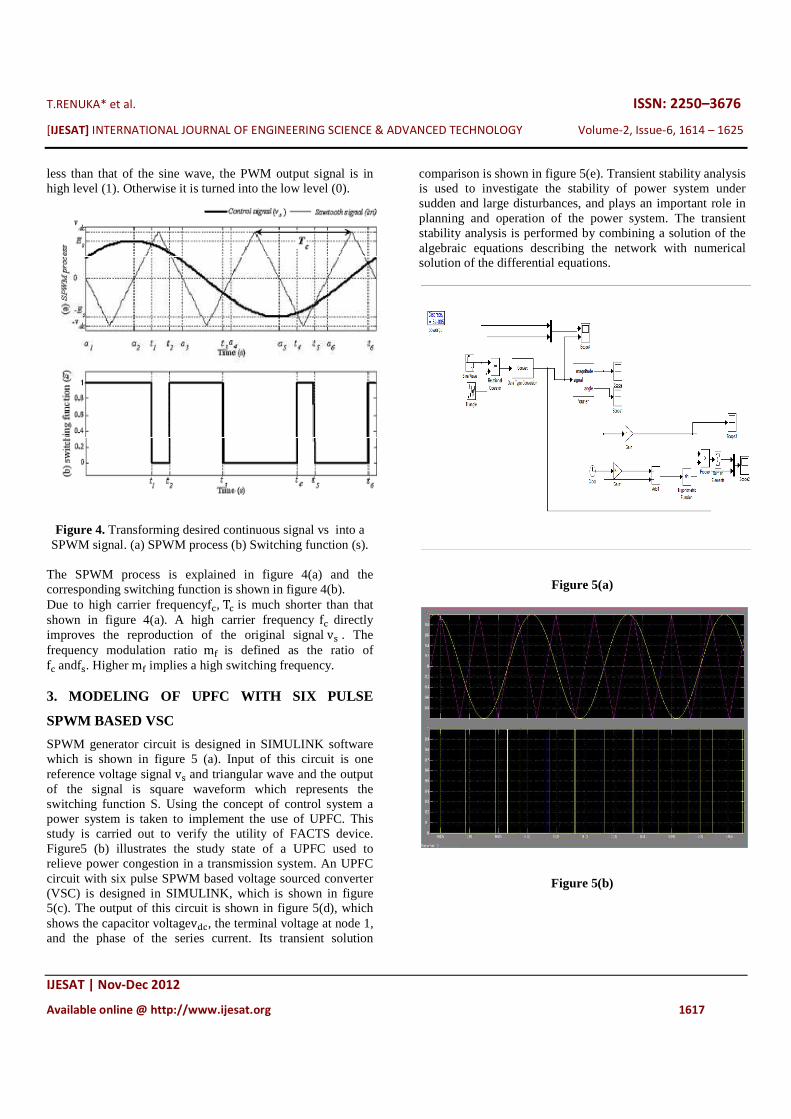
less than that of the sine wave, the PWM output signal is in high level (1). Otherwise it is turned into the low level (0).
Figure 4. Transforming desired continuous signal vs into a
SPWM signal. (a) SPWM process (b) Switching function (s). The SPWM process is explained in figure 4(a) and the corresponding switching function is shown in figure 4(b). Due to high carrier frequencyf�, T� is much shorter than that shown in figure 4(a). A high carrier frequency f� directly improves the reproduction of the original signalvA . The frequency modulation ratio mC is defined as the ratio of f� andfA. Higher mC implies a high switching frequency. 3. MODELING OF UPFC WITH SIX PULSE
SPWM BASED VSC
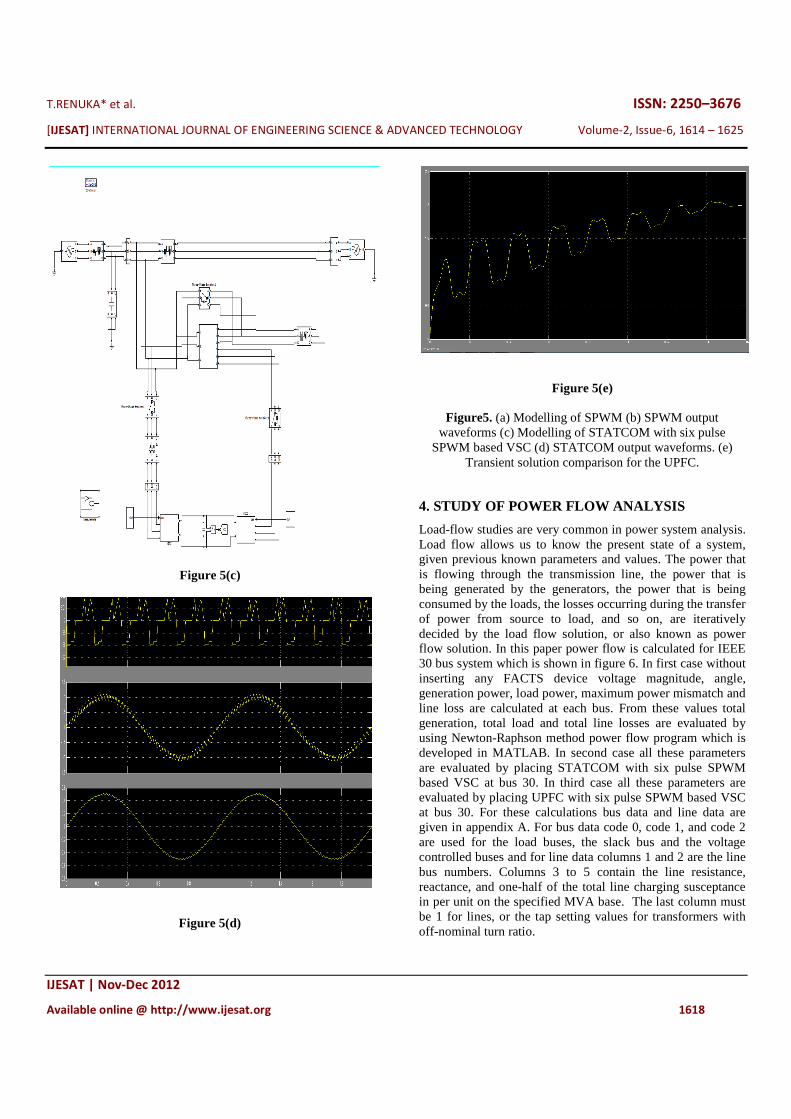
SPWM generator circuit is designed in SIMULINK software which is shown in figure 5 (a). Input of this circuit is one reference voltage signal vA and triangular wave and the output of the signal is square waveform which represents the switching function S. Using the concept of control system a power system is taken to implement the use of UPFC. This study is carried out to verify the utility of FACTS device. Figure5 (b) illustrates the study state of a UPFC used to relieve power congestion in a transmission system. An UPFC circuit with six pulse SPWM based voltage sourced converter (VSC) is designed in SIMULINK, which is shown in figure 5(c). The output of this circuit is shown in figure 5(d), which shows the capacitor voltagevD�, the terminal voltage at node 1, and the phase of the series current. Its transient solution
comparison is shown in figure 5(e). Transient stability analysis is used to investigate the stability of power system under sudden and large disturbances, and plays an important role in planning and operation of the power system. The transient stability analysis is performed by combining a solution of the algebraic equations describing the network with numerical solution of the differential equations.
Figure 5(a)
Figure 5(b)
T.RENUKA* et al. ISSN: 2250–3676
[IJESAT] INTERNATIONAL JOURNAL OF ENGINEERING SCIENCE & ADVANCED TECHNOLOGY Volume-2, Issue-6, 1614 – 1625
IJESAT | Nov-Dec 2012
Available online @ http://www.ijesat.org 1618
Figure 5(c)
Figure 5(d)
Figure 5(e)
Figure5. (a) Modelling of SPWM (b) SPWM output
waveforms (c) Modelling of STATCOM with six pulse SPWM based VSC (d) STATCOM output waveforms. (e)
Transient solution comparison for the UPFC.
4. STUDY OF POWER FLOW ANALYSIS
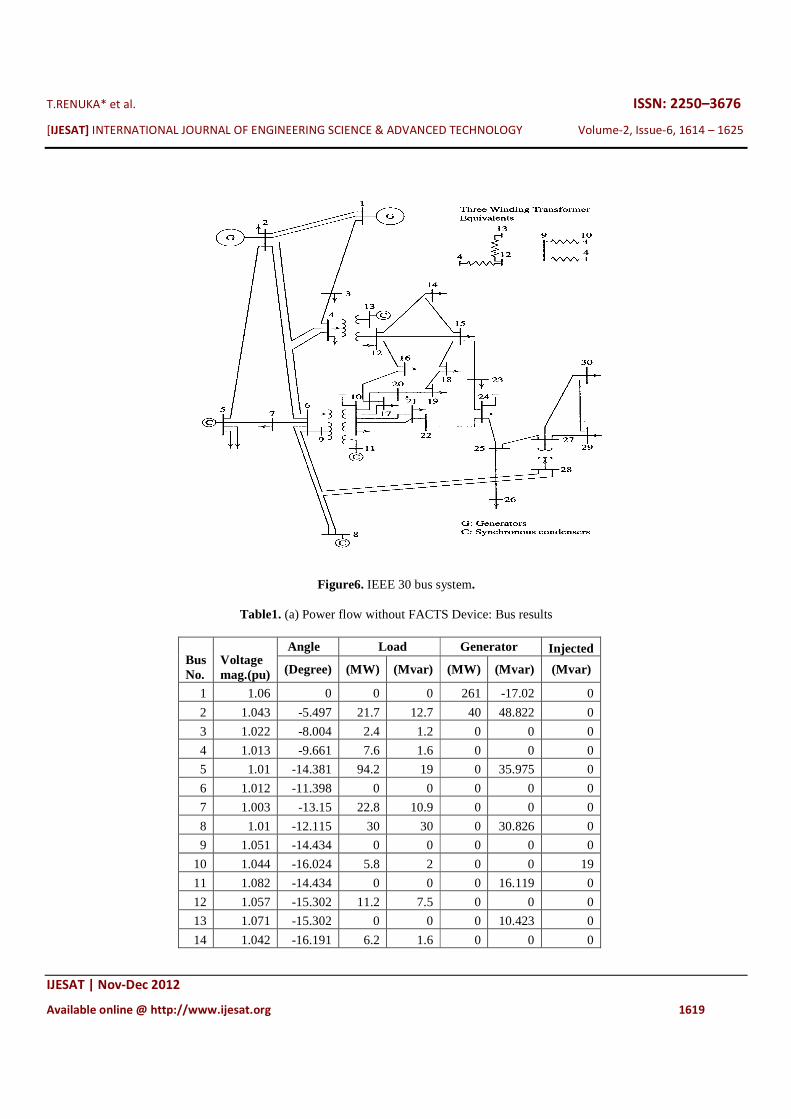
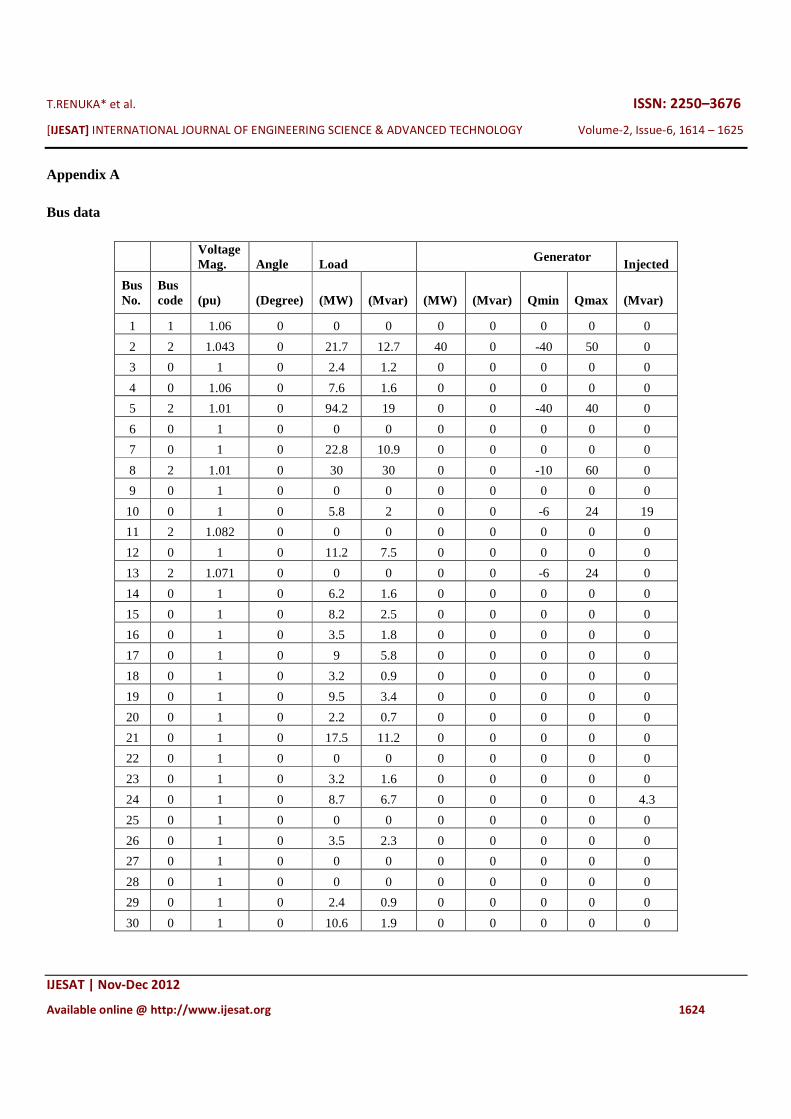
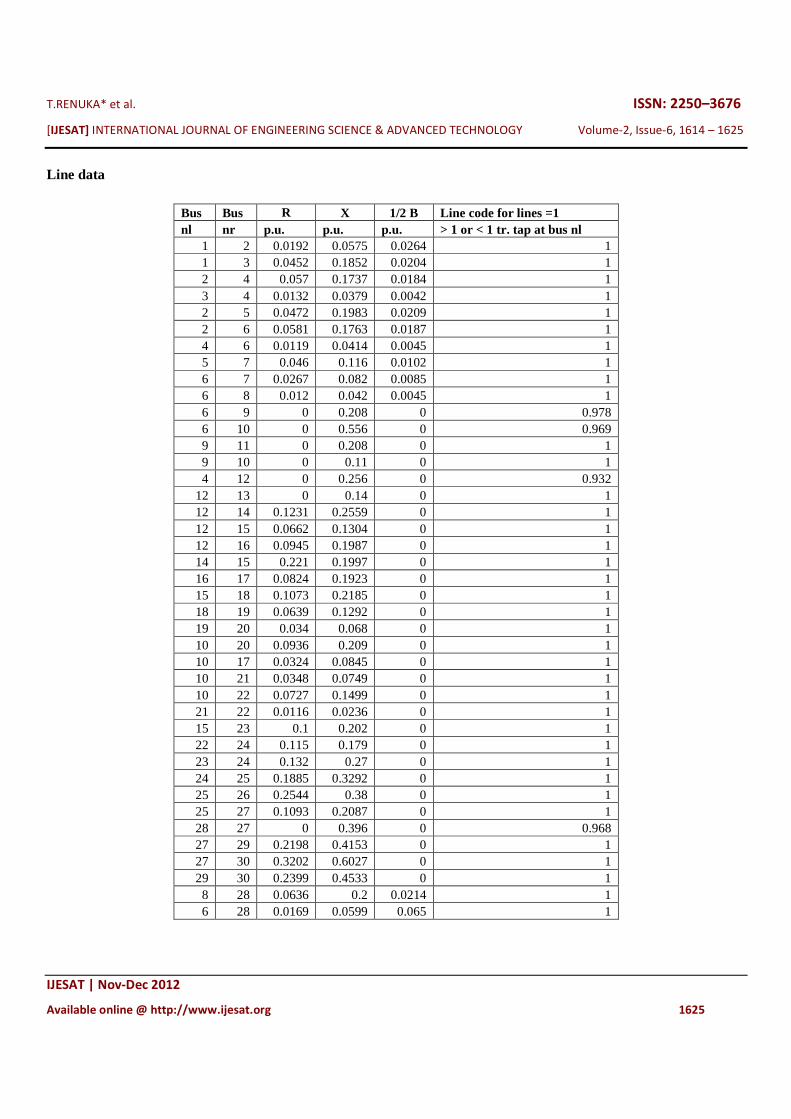
Load-flow studies are very common in power system analysis. Load flow allows us to know the present state of a system, given previous known parameters and values. The power that is flowing through the transmission line, the power that is being generated by the generators, the power that is being consumed by the loads, the losses occurring during the transfer of power from source to load, and so on, are iteratively decided by the load flow solution, or also known as power flow solution. In this paper power flow is calculated for IEEE 30 bus system which is shown in figure 6. In first case without inserting any FACTS device voltage magnitude, angle, generation power, load power, maximum power mismatch and line loss are calculated at each bus. From these values total generation, total load and total line losses are evaluated by using Newton-Raphson method power flow program which is developed in MATLAB. In second case all these parameters are evaluated by placing STATCOM with six pulse SPWM based VSC at bus 30. In third case all these parameters are evaluated by placing UPFC with six pulse SPWM based VSC at bus 30. For these calculations bus data and line data are given in appendix A. For bus data code 0, code 1, and code 2 are used for the load buses, the slack bus and the voltage controlled buses and for line data columns 1 and 2 are the line bus numbers. Columns 3 to 5 contain the line resistance, reactance, and one-half of the total line charging susceptance in per unit on the specified MVA base. The last column must be 1 for lines, or the tap setting values for transformers with off-nominal turn ratio.
T.RENUKA* et al. ISSN: 2250–3676
[IJESAT] INTERNATIONAL JOURNAL OF ENGINEERING SCIENCE & ADVANCED TECHNOLOGY Volume-2, Issue-6, 1614 – 1625
IJESAT | Nov-Dec 2012
Available online @ http://www.ijesat.org 1619
Figure6. IEEE 30 bus system.
Table1. (a) Power flow without FACTS Device: Bus results
Bus No.
Voltage mag.(pu)
Angle Load Generator Injected
(Degree) (MW) (Mvar) (MW) (Mvar) (Mvar)
1 1.06 0 0 0 261 -17.02 0
2 1.043 -5.497 21.7 12.7 40 48.822 0
3 1.022 -8.004 2.4 1.2 0 0 0
4 1.013 -9.661 7.6 1.6 0 0 0
5 1.01 -14.381 94.2 19 0 35.975 0
6 1.012 -11.398 0 0 0 0 0
7 1.003 -13.15 22.8 10.9 0 0 0
8 1.01 -12.115 30 30 0 30.826 0
9 1.051 -14.434 0 0 0 0 0
10 1.044 -16.024 5.8 2 0 0 19
11 1.082 -14.434 0 0 0 16.119 0
12 1.057 -15.302 11.2 7.5 0 0 0
13 1.071 -15.302 0 0 0 10.423 0
14 1.042 -16.191 6.2 1.6 0 0 0
T.RENUKA* et al. ISSN: 2250–3676
[IJESAT] INTERNATIONAL JOURNAL OF ENGINEERING SCIENCE & ADVANCED TECHNOLOGY Volume-2, Issue-6, 1614 – 1625
IJESAT | Nov-Dec 2012
Available online @ http://www.ijesat.org 1620
15 1.038 -16.278 8.2 2.5 0 0 0
16 1.045 -15.88 3.5 1.8 0 0 0
17 1.039 -16.188 9 5.8 0 0 0
18 1.028 -16.884 3.2 0.9 0 0 0
19 1.025 -17.052 9.5 3.4 0 0 0
20 1.029 -16.852 2.2 0.7 0 0 0
21 1.032 -16.468 17.5 11.2 0 0 0
22 1.033 -16.455 0 0 0 0 0
23 1.027 -16.662 3.2 1.6 0 0 0
24 1.022 -16.83 8.7 6.7 0 0 4.3
25 1.019 -16.424 0 0 0 0 0
26 1.001 -16.842 3.5 2.3 0 0 0
27 1.026 -15.912 0 0 0 0 0
28 1.011 -12.057 0 0 0 0 0
29 1.006 -17.136 2.4 0.9 0 0 0
30 0.995 -18.015 10.6 1.9 0 0 0
Total 283.4 126.2 301 125.1 23.3
Table1. (b) Power flow with STATCOM: Bus results
Bus No.
Voltage mag.(pu)
Angle Load Generator Injected
(Degree) (MW) (Mvar) (MW) (Mvar) (Mvar)
1 1.06 0 0 0 238.54 -13.72 0 2 1.043 -5.015 21.7 12.7 40 43.243 0 3 1.023 -7.252 2.4 1.2 0 0 0 4 1.015 -8.743 7.6 1.6 0 0 0 5 1.01 -13.566 94.2 19 0 35.013 0 6 1.014 -10.27 0 0 0 0 0 7 1.005 -12.148 22.8 10.9 0 0 0 8 1.01 -10.887 30 30 0 23.95 0 9 1.052 -13.051 0 0 0 0 0
10 1.045 -14.51 5.8 2 0 0 19 11 1.082 -13.051 0 0 0 15.699 0 12 1.058 -13.975 11.2 7.5 0 0 0 13 1.071 -13.975 0 0 0 10.204 0 14 1.043 -14.788 6.2 1.6 0 0 0 15 1.039 -14.801 8.2 2.5 0 0 0 16 1.045 -14.475 3.5 1.8 0 0 0 17 1.04 -14.707 9 5.8 0 0 0 18 1.029 -15.392 3.2 0.9 0 0 0 19 1.026 -15.553 9.5 3.4 0 0 0 20 1.03 -15.349 2.2 0.7 0 0 0
T.RENUKA* et al. ISSN: 2250–3676
[IJESAT] INTERNATIONAL JOURNAL OF ENGINEERING SCIENCE & ADVANCED TECHNOLOGY Volume-2, Issue-6, 1614 – 1625
IJESAT | Nov-Dec 2012
Available online @ http://www.ijesat.org 1621
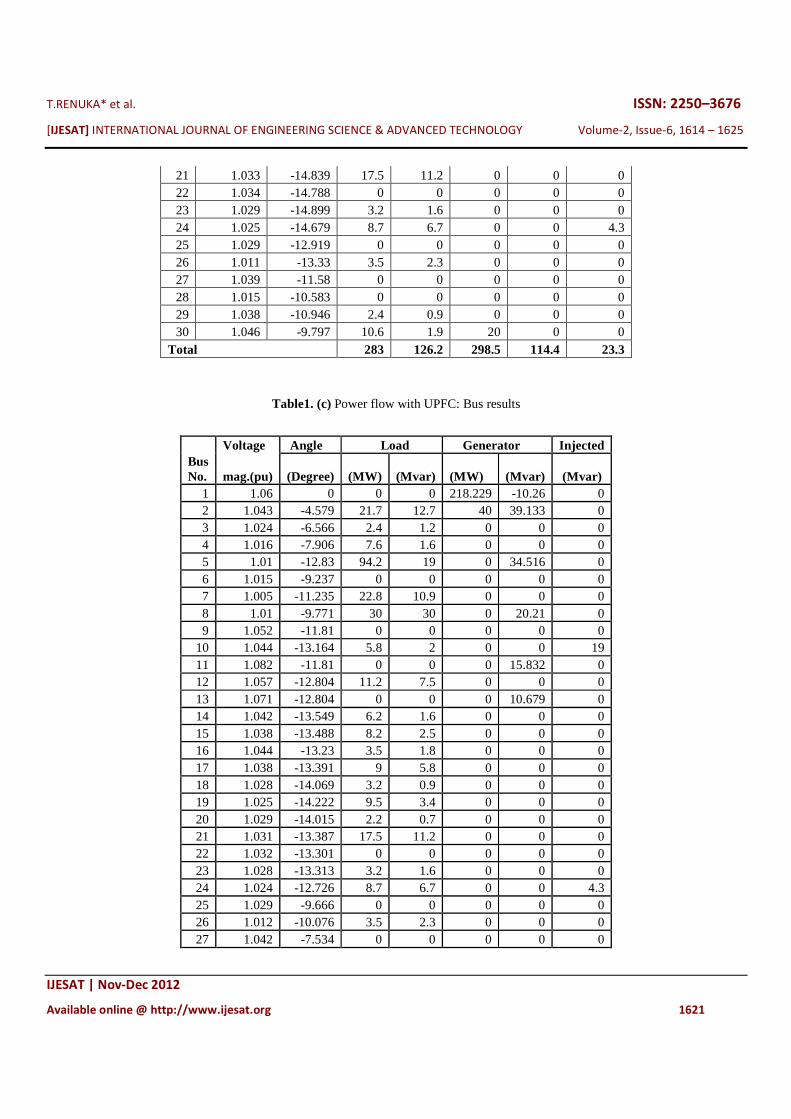
Table1. (c) Power flow with UPFC: Bus results
21 1.033 -14.839 17.5 11.2 0 0 0 22 1.034 -14.788 0 0 0 0 0 23 1.029 -14.899 3.2 1.6 0 0 0 24 1.025 -14.679 8.7 6.7 0 0 4.3 25 1.029 -12.919 0 0 0 0 0 26 1.011 -13.33 3.5 2.3 0 0 0 27 1.039 -11.58 0 0 0 0 0 28 1.015 -10.583 0 0 0 0 0 29 1.038 -10.946 2.4 0.9 0 0 0 30 1.046 -9.797 10.6 1.9 20 0 0
Total 283 126.2 298.5 114.4 23.3
Voltage Angle Load Generator Injected Bus No. mag.(pu) (Degree) (MW) (Mvar) (MW) (Mvar) (Mvar)
1 1.06 0 0 0 218.229 -10.26 0 2 1.043 -4.579 21.7 12.7 40 39.133 0 3 1.024 -6.566 2.4 1.2 0 0 0 4 1.016 -7.906 7.6 1.6 0 0 0 5 1.01 -12.83 94.2 19 0 34.516 0 6 1.015 -9.237 0 0 0 0 0 7 1.005 -11.235 22.8 10.9 0 0 0 8 1.01 -9.771 30 30 0 20.21 0 9 1.052 -11.81 0 0 0 0 0
10 1.044 -13.164 5.8 2 0 0 19 11 1.082 -11.81 0 0 0 15.832 0 12 1.057 -12.804 11.2 7.5 0 0 0 13 1.071 -12.804 0 0 0 10.679 0 14 1.042 -13.549 6.2 1.6 0 0 0 15 1.038 -13.488 8.2 2.5 0 0 0 16 1.044 -13.23 3.5 1.8 0 0 0 17 1.038 -13.391 9 5.8 0 0 0 18 1.028 -14.069 3.2 0.9 0 0 0 19 1.025 -14.222 9.5 3.4 0 0 0 20 1.029 -14.015 2.2 0.7 0 0 0 21 1.031 -13.387 17.5 11.2 0 0 0 22 1.032 -13.301 0 0 0 0 0 23 1.028 -13.313 3.2 1.6 0 0 0 24 1.024 -12.726 8.7 6.7 0 0 4.3 25 1.029 -9.666 0 0 0 0 0 26 1.012 -10.076 3.5 2.3 0 0 0 27 1.042 -7.534 0 0 0 0 0
T.RENUKA* et al. ISSN: 2250–3676
[IJESAT] INTERNATIONAL JOURNAL OF ENGINEERING SCIENCE & ADVANCED TECHNOLOGY Volume-2, Issue-6, 1614 – 1625
IJESAT | Nov-Dec 2012
Available online @ http://www.ijesat.org 1622
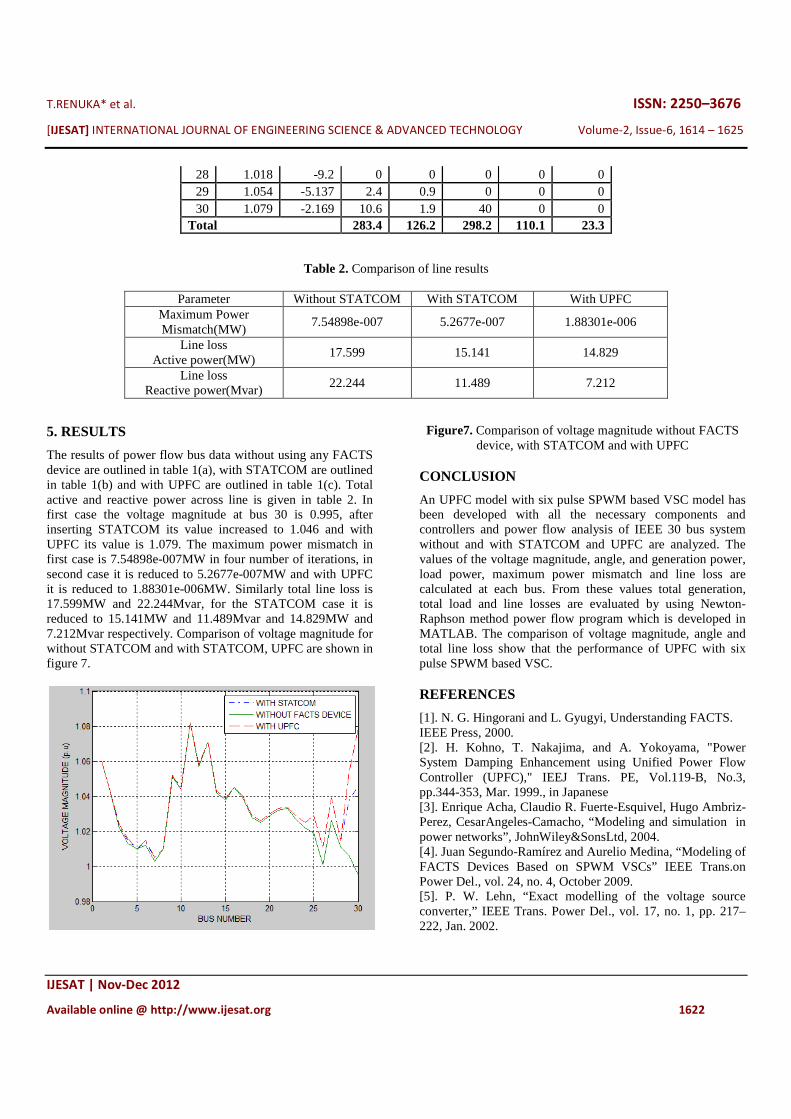
Table 2. Comparison of line results
Parameter Without STATCOM With STATCOM With UPFC
Maximum Power Mismatch(MW)
7.54898e-007 5.2677e-007 1.88301e-006
Line loss Active power(MW)
17.599 15.141 14.829
Line loss Reactive power(Mvar)
22.244 11.489 7.212
5. RESULTS
The results of power flow bus data without using any FACTS device are outlined in table 1(a), with STATCOM are outlined in table 1(b) and with UPFC are outlined in table 1(c). Total active and reactive power across line is given in table 2. In first case the voltage magnitude at bus 30 is 0.995, after inserting STATCOM its value increased to 1.046 and with UPFC its value is 1.079. The maximum power mismatch in first case is 7.54898e-007MW in four number of iterations, in second case it is reduced to 5.2677e-007MW and with UPFC it is reduced to 1.88301e-006MW. Similarly total line loss is 17.599MW and 22.244Mvar, for the STATCOM case it is reduced to 15.141MW and 11.489Mvar and 14.829MW and 7.212Mvar respectively. Comparison of voltage magnitude for without STATCOM and with STATCOM, UPFC are shown in figure 7.
Figure7. Comparison of voltage magnitude without FACTS device, with STATCOM and with UPFC
CONCLUSION
An UPFC model with six pulse SPWM based VSC model has been developed with all the necessary components and controllers and power flow analysis of IEEE 30 bus system without and with STATCOM and UPFC are analyzed. The values of the voltage magnitude, angle, and generation power, load power, maximum power mismatch and line loss are calculated at each bus. From these values total generation, total load and line losses are evaluated by using Newton-Raphson method power flow program which is developed in MATLAB. The comparison of voltage magnitude, angle and total line loss show that the performance of UPFC with six pulse SPWM based VSC. REFERENCES
[1]. N. G. Hingorani and L. Gyugyi, Understanding FACTS. IEEE Press, 2000. [2]. H. Kohno, T. Nakajima, and A. Yokoyama, "Power System Damping Enhancement using Unified Power Flow Controller (UPFC)," IEEJ Trans. PE, Vol.119-B, No.3, pp.344-353, Mar. 1999., in Japanese [3]. Enrique Acha, Claudio R. Fuerte-Esquivel, Hugo Ambriz- Perez, CesarAngeles-Camacho, “Modeling and simulation in power networks”, JohnWiley&SonsLtd, 2004. [4]. Juan Segundo-Ramírez and Aurelio Medina, “Modeling of FACTS Devices Based on SPWM VSCs” IEEE Trans.on Power Del., vol. 24, no. 4, October 2009. [5]. P. W. Lehn, “Exact modelling of the voltage source converter,” IEEE Trans. Power Del., vol. 17, no. 1, pp. 217–222, Jan. 2002.
28 1.018 -9.2 0 0 0 0 0 29 1.054 -5.137 2.4 0.9 0 0 0 30 1.079 -2.169 10.6 1.9 40 0 0
Total 283.4 126.2 298.2 110.1 23.3
T.RENUKA* et al. ISSN: 2250–3676
[IJESAT] INTERNATIONAL JOURNAL OF ENGINEERING SCIENCE & ADVANCED TECHNOLOGY Volume-2, Issue-6, 1614 – 1625
IJESAT | Nov-Dec 2012
Available online @ http://www.ijesat.org 1623
[6]. C. A. Canizares, “Power flow and transient stability models of FACTS controllers for voltage and angle stability studies,” in Proc. IEEE Power Eng. Soc. Winter Meeting, Singapore, Jan. 2000. [7]. Chun,L, Qirong, J., Xiaorong, X. and Zhonghong, W. “Rule-based control for STATCOM to increase power Proceedings 1998 International Conference on POWERCON, pp. 372–376. [8]. Hadi Saadat, “Power System Analysis”, WCB McGraw Hill, 1999. [9]. S. Panda and R. N. Patel, “Improving Power System Transient Stability with an Off–Centre Location of Shunt FACTS Devices”, Journal of Electrical Engineering, vol. 57, No. 6, 2006, pp. 365-368. [10]. P.Rao, M.L. Crow, Z.Young, “STATCOM control for power system voltage control application,” IEEE Trans. Power Delivery, No. 15, 2000, pp. 1311-1317. [11]. EMTDC User’s Guide 2003. [12]. Power System Blockset User’s Guide 2001,TEQSIM Int. Inc. [13]. H. Fujita, Y. Watanabe, and H. Akagi, “Transientanalysis of a unified power flow controller and applications to design of the DC link capacitor,”IEEE Trans. Power Electron., vol. 16, no. 5, pp. 735–740, Sep 2001. [14]. T. Renuka and Dr. P. Chandra sekhar, “Modeling of STATCOM with six pulse SPWM based VSC and its power flow study” in International Journal of Engineering and Technology, UK, Vol. 2, No.7, July 2012. Pp. 1197-1206. BIOGRAPHIES
T. Renuka was born on 4 April 1984 at Ongole, AP, India. She received B. Tech in Electrical and Electronics Engineering at JNTU Hyderabad 2005. From July 2005 she has been worked as Assistant Professor in various Engineering colleges. In the year 2010 she was joined M. Tech in Electrical Power Systems and completed in the year 2012 from JNTU Hyderabad. Present she is
working as Assistant Professor in Rao & Naidu Engineering college, Ongole, AP, India. Currently she is working on FACTS.
D. Rambabu was born on 28 July 1980 at Ongole, AP, India. He received B.E in Electronics at Andhra University 2001. He received his M. Tech in Communication systems. He has been worked as Assistant Professor in various Engineering colleges up to May 2009. Since May 2009 he is working as Junior Telecom Officer in
BSNL, which is a Government Telecom company in India. He is interested in the field of Antennas and also interested in Interdisciplinary research.
T.RENUKA* et al. ISSN: 2250–3676
[IJESAT] INTERNATIONAL JOURNAL OF ENGINEERING SCIENCE & ADVANCED TECHNOLOGY Volume-2, Issue-6, 1614 – 1625
IJESAT | Nov-Dec 2012
Available online @ http://www.ijesat.org 1624
Appendix A
Bus data
Voltage Mag.
Angle
Load
Generator Injected
Bus No.
Bus code
(pu)
(Degree)
(MW)
(Mvar)
(MW)
(Mvar)
Qmin
Qmax
(Mvar)
1 1 1.06 0 0 0 0 0 0 0 0
2 2 1.043 0 21.7 12.7 40 0 -40 50 0
3 0 1 0 2.4 1.2 0 0 0 0 0
4 0 1.06 0 7.6 1.6 0 0 0 0 0
5 2 1.01 0 94.2 19 0 0 -40 40 0
6 0 1 0 0 0 0 0 0 0 0
7 0 1 0 22.8 10.9 0 0 0 0 0
8 2 1.01 0 30 30 0 0 -10 60 0
9 0 1 0 0 0 0 0 0 0 0
10 0 1 0 5.8 2 0 0 -6 24 19
11 2 1.082 0 0 0 0 0 0 0 0
12 0 1 0 11.2 7.5 0 0 0 0 0
13 2 1.071 0 0 0 0 0 -6 24 0
14 0 1 0 6.2 1.6 0 0 0 0 0
15 0 1 0 8.2 2.5 0 0 0 0 0
16 0 1 0 3.5 1.8 0 0 0 0 0
17 0 1 0 9 5.8 0 0 0 0 0
18 0 1 0 3.2 0.9 0 0 0 0 0
19 0 1 0 9.5 3.4 0 0 0 0 0
20 0 1 0 2.2 0.7 0 0 0 0 0
21 0 1 0 17.5 11.2 0 0 0 0 0
22 0 1 0 0 0 0 0 0 0 0
23 0 1 0 3.2 1.6 0 0 0 0 0
24 0 1 0 8.7 6.7 0 0 0 0 4.3
25 0 1 0 0 0 0 0 0 0 0
26 0 1 0 3.5 2.3 0 0 0 0 0
27 0 1 0 0 0 0 0 0 0 0
28 0 1 0 0 0 0 0 0 0 0
29 0 1 0 2.4 0.9 0 0 0 0 0
30 0 1 0 10.6 1.9 0 0 0 0 0
T.RENUKA* et al. ISSN: 2250–3676
[IJESAT] INTERNATIONAL JOURNAL OF ENGINEERING SCIENCE & ADVANCED TECHNOLOGY Volume-2, Issue-6, 1614 – 1625
IJESAT | Nov-Dec 2012
Available online @ http://www.ijesat.org 1625
Line data
Bus Bus R X 1/2 B Line code for lines =1 nl nr p.u. p.u. p.u. > 1 or < 1 tr. tap at bus nl
1 2 0.0192 0.0575 0.0264 1 1 3 0.0452 0.1852 0.0204 1 2 4 0.057 0.1737 0.0184 1 3 4 0.0132 0.0379 0.0042 1 2 5 0.0472 0.1983 0.0209 1 2 6 0.0581 0.1763 0.0187 1 4 6 0.0119 0.0414 0.0045 1 5 7 0.046 0.116 0.0102 1 6 7 0.0267 0.082 0.0085 1 6 8 0.012 0.042 0.0045 1 6 9 0 0.208 0 0.978 6 10 0 0.556 0 0.969 9 11 0 0.208 0 1 9 10 0 0.11 0 1 4 12 0 0.256 0 0.932
12 13 0 0.14 0 1 12 14 0.1231 0.2559 0 1 12 15 0.0662 0.1304 0 1 12 16 0.0945 0.1987 0 1 14 15 0.221 0.1997 0 1 16 17 0.0824 0.1923 0 1 15 18 0.1073 0.2185 0 1 18 19 0.0639 0.1292 0 1 19 20 0.034 0.068 0 1 10 20 0.0936 0.209 0 1 10 17 0.0324 0.0845 0 1 10 21 0.0348 0.0749 0 1 10 22 0.0727 0.1499 0 1 21 22 0.0116 0.0236 0 1 15 23 0.1 0.202 0 1 22 24 0.115 0.179 0 1 23 24 0.132 0.27 0 1 24 25 0.1885 0.3292 0 1 25 26 0.2544 0.38 0 1 25 27 0.1093 0.2087 0 1 28 27 0 0.396 0 0.968 27 29 0.2198 0.4153 0 1 27 30 0.3202 0.6027 0 1 29 30 0.2399 0.4533 0 1 8 28 0.0636 0.2 0.0214 1 6 28 0.0169 0.0599 0.065 1