Embed Size (px)
Citation preview
Modeling neural patterning; exploring the gene regulatory networks in
developing zebrafish embryos
by
Charu Gaur
An Internship Report presented
in partial fulfillment of the requirements for the degree of
PROFESSIONAL SCIENCE MASTER
Major: Computational Biosciences Internship Guide: Dr. Ajay Chitnis
Technical Report No: 04-22
Arizona State University
Tempe, Arizona
December 2004
ii
Graduate College
Arizona State University
This is to certify that this report submitted by Charu Gaur has met the internship requirements
of the Professional Science Masters in Computational Biosciences Program at
Arizona State University
APPROVED:
Dr. Rosemary Renaut, Chair
Dr. Sudhir Kumar
Dr. Jeffrey Touchman
Supervisory Committee
ACCEPTED:
____________________________________ Department Chair
____________________________________
Date
iii
TABLE OF CONTENTS
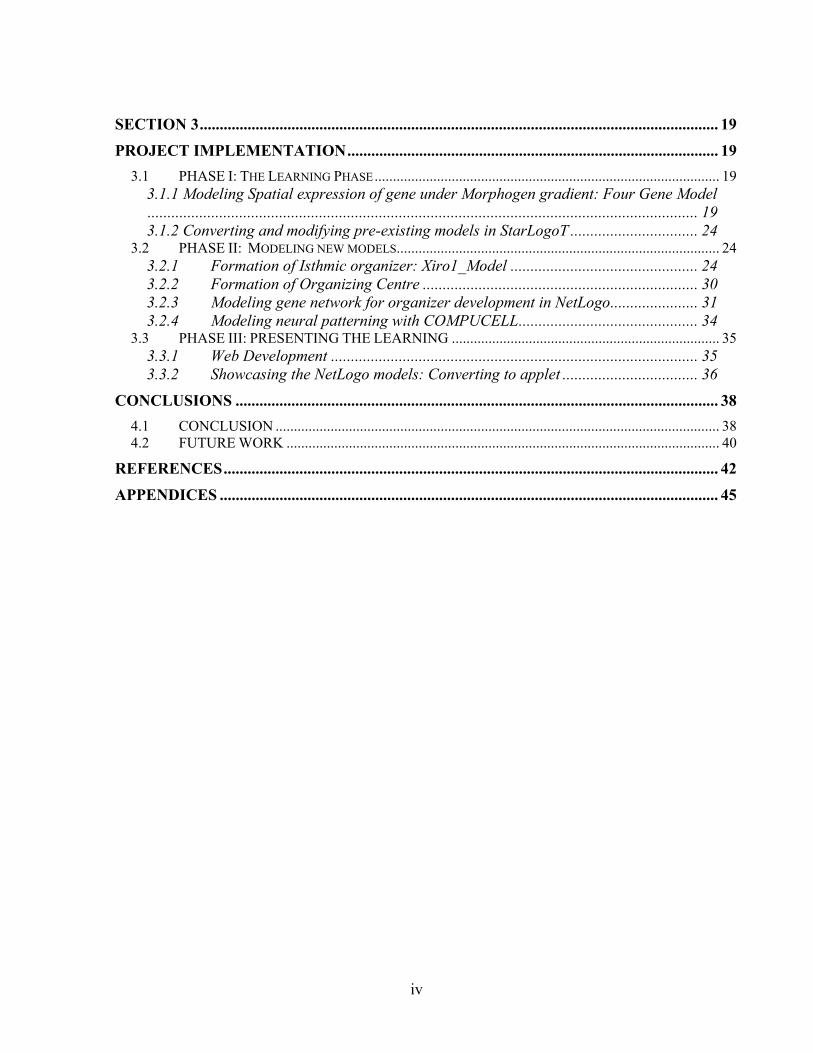
LIST OF FIGURES ..................................................................................................................... V
LIST OF TABLES ......................................................................................................................VI
LIST OF APPENDICES .......................................................................................................... VII
ACKNOWLEDGEMENT.......................................................................................................VIII
PREFACE....................................................................................................................................IX
ABSTRACT.................................................................................................................................XI
SECTION 1.................................................................................................................................... 1
INTRODUCTION......................................................................................................................... 1 1.1 ZEBRAFISH ............................................................................................................................... 1
1.1.1 Zebrafish as a model organism.......................................................................... 1 1.1.2 Zebrafish study in the lab................................................................................... 2
1.2 INTERNSHIP PROJECT TASKS .............................................................................................. 2 1.2.2 Studying Gene Regulatory Network (GRN) .............................................................. 4 1.2.3 Developing website for the lab.................................................................................. 4
SECTION 2.................................................................................................................................... 6
LITERATURE REVIEW............................................................................................................. 6 2.1 DEVELOPMENT ....................................................................................................................... 6 2.2 NEUROGENESIS....................................................................................................................... 6
2.2.1 The mid-hindbrain domain of the embryonic brain ........................................... 8 2.3 MORPHOGEN GRADIENTS AND GENE EXPRESSION ...................................................... 8 2.4 PATTERN FORMATION MECHANISMS............................................................................... 9
2.4.1 Autocatalysis and lateral inhibition .......................................................................... 9 2.4.2 Short range autocatalysis coupled with long-range inhibition............................... 11
2.5 MODELING AND VISUALIZATION TOOLS....................................................................... 14 2.5.1 NetLogo............................................................................................................ 14 2.5.2 Compucell ........................................................................................................ 16
2.6 GENE REGULATORY NETWORKS ..................................................................................... 17 2.6.1 NetBuilder ............................................................................................................... 17
iv
SECTION 3.................................................................................................................................. 19
PROJECT IMPLEMENTATION............................................................................................. 19 3.1 PHASE I: THE LEARNING PHASE.............................................................................................. 19
3.1.1 Modeling Spatial expression of gene under Morphogen gradient: Four Gene Model.......................................................................................................................................... 19 3.1.2 Converting and modifying pre-existing models in StarLogoT ................................ 24
3.2 PHASE II: MODELING NEW MODELS........................................................................................ 24 3.2.1 Formation of Isthmic organizer: Xiro1_Model ............................................... 24 3.2.2 Formation of Organizing Centre ..................................................................... 30 3.2.3 Modeling gene network for organizer development in NetLogo...................... 31 3.2.4 Modeling neural patterning with COMPUCELL............................................. 34
3.3 PHASE III: PRESENTING THE LEARNING ......................................................................... 35 3.3.1 Web Development ............................................................................................ 35 3.3.2 Showcasing the NetLogo models: Converting to applet .................................. 36
CONCLUSIONS ......................................................................................................................... 38 4.1 CONCLUSION ......................................................................................................................... 38 4.2 FUTURE WORK ...................................................................................................................... 40
REFERENCES............................................................................................................................ 42
APPENDICES ............................................................................................................................. 45
v
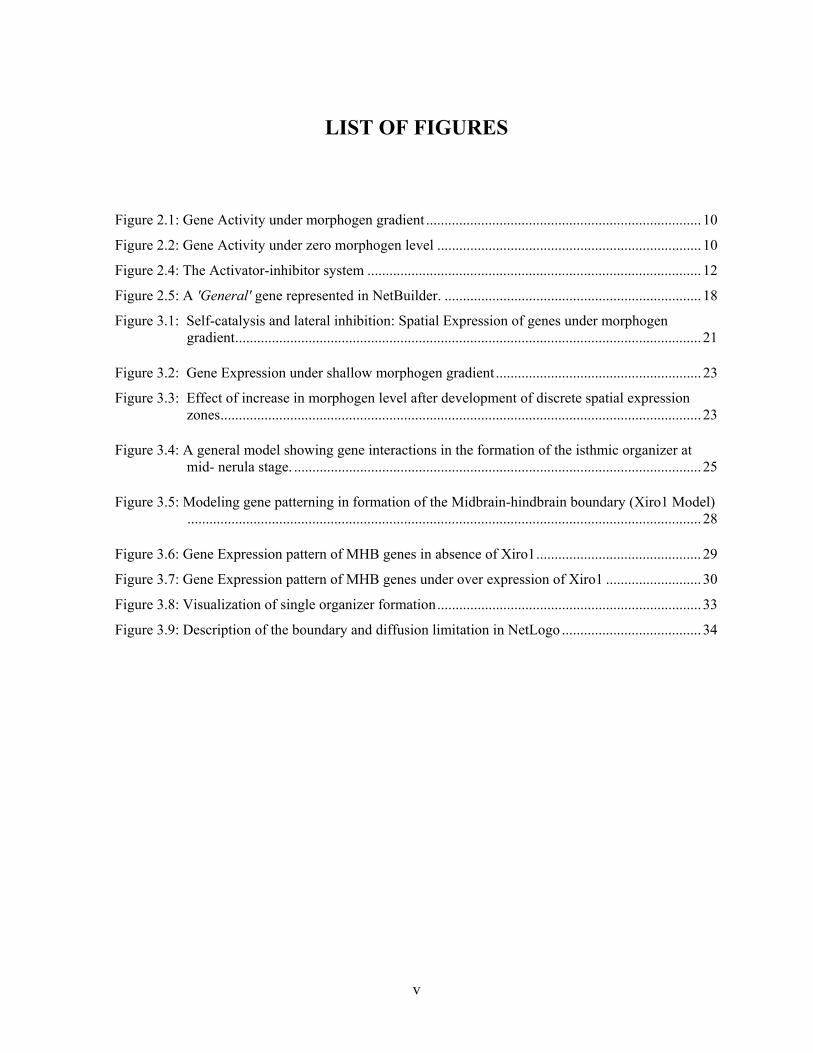
LIST OF FIGURES
Figure 2.1: Gene Activity under morphogen gradient ........................................................................... 10
Figure 2.2: Gene Activity under zero morphogen level ........................................................................ 10
Figure 2.4: The Activator-inhibitor system ........................................................................................... 12
Figure 2.5: A 'General' gene represented in NetBuilder. ...................................................................... 18
Figure 3.1: Self-catalysis and lateral inhibition: Spatial Expression of genes under morphogen gradient............................................................................................................................... 21
Figure 3.2: Gene Expression under shallow morphogen gradient ........................................................ 23
Figure 3.3: Effect of increase in morphogen level after development of discrete spatial expression zones................................................................................................................................... 23
Figure 3.4: A general model showing gene interactions in the formation of the isthmic organizer at
mid- nerula stage. ............................................................................................................... 25 Figure 3.5: Modeling gene patterning in formation of the Midbrain-hindbrain boundary (Xiro1 Model)
............................................................................................................................................ 28 Figure 3.6: Gene Expression pattern of MHB genes in absence of Xiro1............................................. 29
Figure 3.7: Gene Expression pattern of MHB genes under over expression of Xiro1 .......................... 30
Figure 3.8: Visualization of single organizer formation........................................................................ 33
Figure 3.9: Description of the boundary and diffusion limitation in NetLogo ...................................... 34
vi
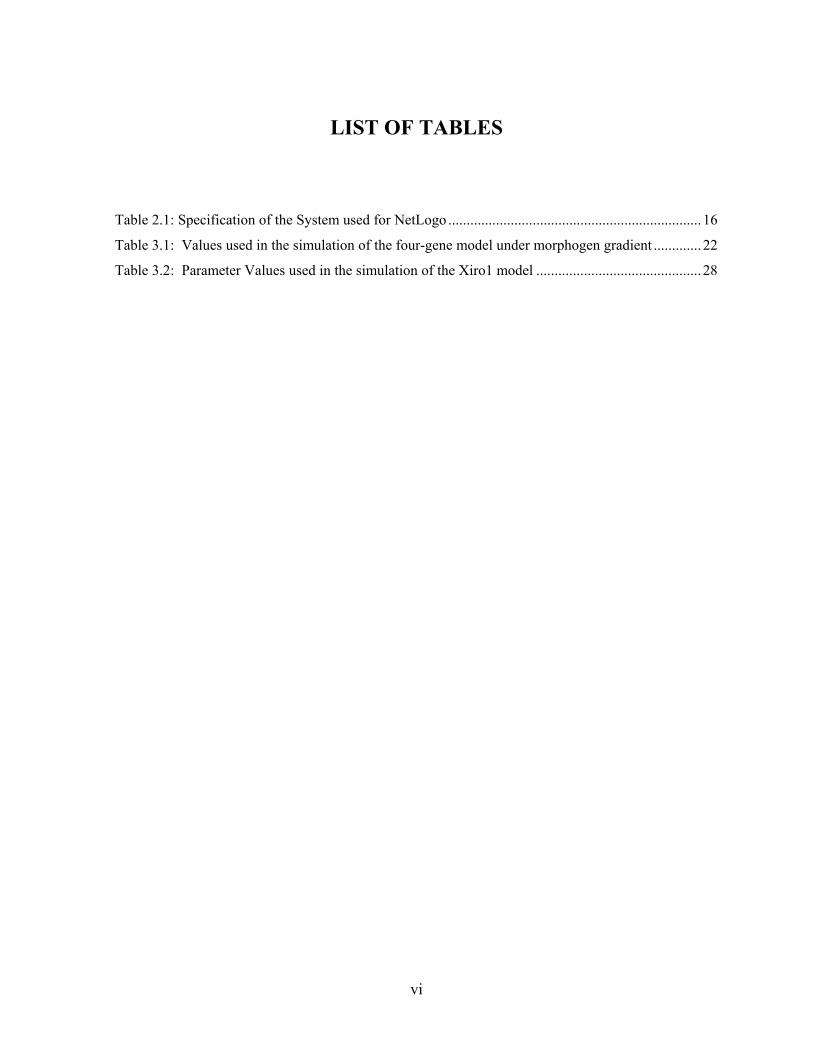
LIST OF TABLES
Table 2.1: Specification of the System used for NetLogo ..................................................................... 16
Table 3.1: Values used in the simulation of the four-gene model under morphogen gradient ............. 22
Table 3.2: Parameter Values used in the simulation of the Xiro1 model ............................................. 28
vii
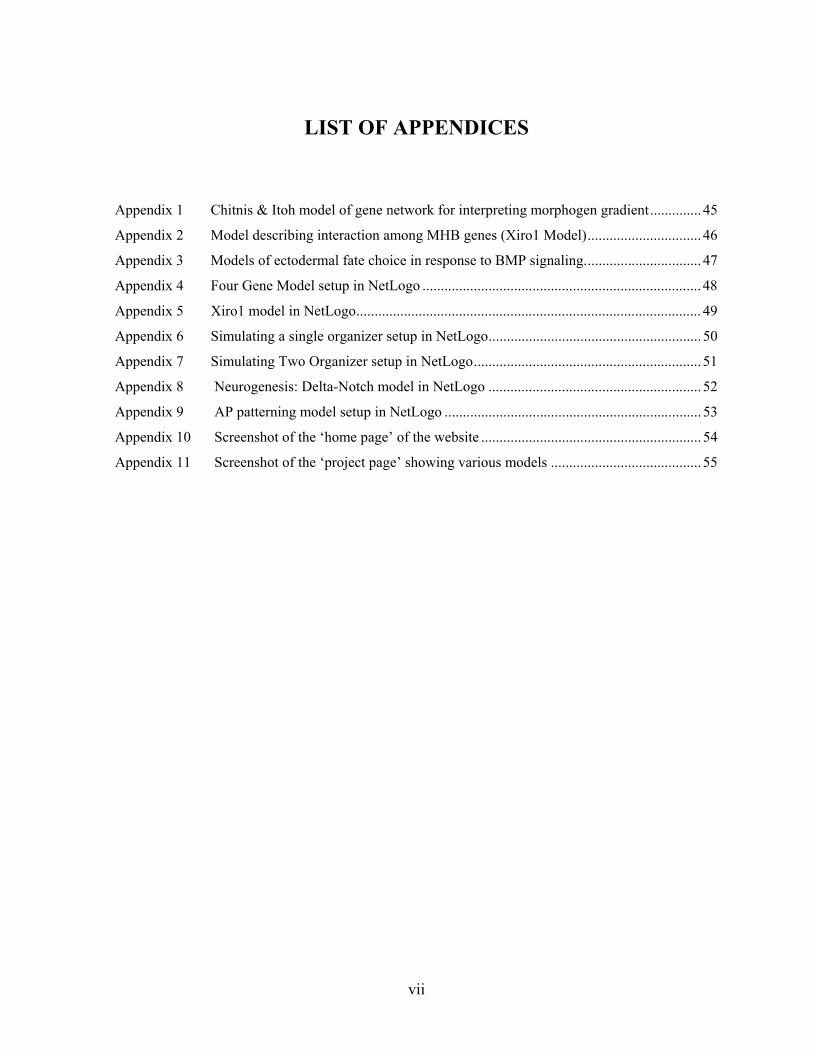
LIST OF APPENDICES
Appendix 1 Chitnis & Itoh model of gene network for interpreting morphogen gradient.............. 45
Appendix 2 Model describing interaction among MHB genes (Xiro1 Model)............................... 46
Appendix 3 Models of ectodermal fate choice in response to BMP signaling................................ 47
Appendix 4 Four Gene Model setup in NetLogo ............................................................................ 48
Appendix 5 Xiro1 model in NetLogo.............................................................................................. 49
Appendix 6 Simulating a single organizer setup in NetLogo.......................................................... 50
Appendix 7 Simulating Two Organizer setup in NetLogo.............................................................. 51
Appendix 8 Neurogenesis: Delta-Notch model in NetLogo .......................................................... 52
Appendix 9 AP patterning model setup in NetLogo ...................................................................... 53
Appendix 10 Screenshot of the ‘home page’ of the website ............................................................ 54
Appendix 11 Screenshot of the ‘project page’ showing various models ......................................... 55
viii
ACKNOWLEDGEMENT
I thank my guide, Dr Ajay Chitnis, for giving me an opportunity to become a part of the team
in the Unit of Vertebral and Neural Development, NICHD at NIH. It was indeed a privilege to get
exposure among a wide range of scientists, getting chance to attend lectures, seminars and workshops
at NIH during the course of internship. I also thank the other team members at the lab all of who
helped in completion of the project.
My gratitude also extends to my committee members including my program chair, Dr. Rosie
Renaut, for their guidance and knowledge during graduate courses and lectures that helped me in the
internship work.
In my pursuit to complete this degree and specifically this internship project I thank my
brothers, who extended their support always encouraged me. Thanks Shailesh, for helping me with
programming issues. Thanks to all my friends who have directly or indirectly made this report
possible.
Finally, I would like to thank all the people who helped me in arranging the internship. I
would particularly thank the International Student Organization (ISO) at ASU that worked promptly to
get my CPT document and my friend, Navin, who helped in arranging my accommodation and other
logistics at Maryland.
ix
PREFACE
This is an overview of my internship in the Chitnis lab at Vertebrate Neural Development
Unit, Laboratory of Molecular Genetics, NICHD, at NIH campus in Bethesda, Maryland. It gives an
insight about the internship program, the work environment and the work process.
Project Goal
The goal of the project was to design mathematical models to simulate and visualize
the experimental results or research work to understand the dynamics of the neural patterning
in the zebrafish-developing embryo.
Internship Requirements
The basic requirements for the internship at NICHD were having an understanding
and knowledge in some or all of the following areas:
Subject Knowledge: Mathematics, Molecular biology, and developmental biology.
Programming: C, C++, Java
Web Development: HTML, DHTML, Photoshop, Dream weaver, Style Sheet
Project Deliverables
• Develop NetLogo based models for anterior- posterior patterning in the zebrafish
neuroectoderm. This will involve modifying the preexisting models and creating new
models of early patterning events.
• Develop website to publish the models online and help the users to interact with it.
• Source code with detail annotations of the various models and the Gene regulatory
network made.
• Documentation if any
x
My Background
I have good knowledge in mathematics, biology and programming. Additionally
industry work as IT professional in the pharmaceutical sector and research work as research
assistant in bioinformatics area has honed my logical and technical skills in computational
biology. I joined the Professional Science Masters program in Computational Biosciences at
Arizona State University, Tempe, AZ, to learn and integrate mathematics, biology and
computers, and understand the new dimension that the amalgamation of these three areas. For
my internship I was looking to have such a cross-functional exposure. My internship at NIH
fulfilled this desire. The three months long summer internship stretched to the fall semester. I
feel happy to have gained valuable insights into building biological models and visualization
of it through computational representation.
Work Environment
The work environment was friendly, encouraging and it allowed me learn to several
technologies. There was NIH library; ongoing seminars and training sessions that we could
attend to acquire skills and knowledge on various subject areas. Apart from this a
collaborative outlook of the lab helped me to get valuable assistance of the other researchers
in the lab. A flexible work time gave me an opportunity to study all details at my own pace.
My internship project guide, Dr Ajay Chitnis was very cooperative and understanding in
letting me do tasks to the extent of my knowledge and promptly helping me whenever needed.
Skills Acquired
Understanding of mathematical models for modeling biological processes
Learning about genetic networks and biochemical processes in neurogenesis
Introduction to application programming environment for dynamic simulation and
visualization of models
xi
ABSTRACT
Neurogenesis is a complex process involving a lot of rearrangements and pattern
formation theories. Neural patterning involves division of the vertebrate neural tube into
discreet compartments along the anterior-posterior (AP) axis of the developing zebrafish
embryo. This process starts during early gastrulation and goes on till late neural stage. During
this process posteriorising factors acting in form of a morphogen gradient cause differential
spatial and temporal activation of the genes. In context of AP patterning in the zebrafish
neuroectoderm we investigated the formation of the isthmic organizer at the midbrain-hind
brain boundary and the gene networks involved in it.
We modeled the process by using Meinhardt’s equations that uses a system of partial
differential equation to model the effect of a system of genes in response to an external
morphogen gradient. To simulate the model NetLogo programming environment was used.
NetLogo helped us to visualize the models and see the effects of various factors that in turn
explained the various cell-cell interactions and in some cases the gene networks that act
together in neural development.
We also studied the gene networks involved in the formation of organizing centers.
We modeled the process based on Meinhardt theory of pattern formation by short-range
autocatalytic activator and long-range inhibitor. The study, however, could not be fully
completed due to the limitations of the tools used: NetBuilder and CompuCell. NetLogo also
posed certain limitations in modeling diffusion of substances under certain boundary
conditions, though we got some success in modeling single organizing center. However, in
general NetLogo modeling and simulations helped to enhance the understanding of the
various experimental studies in neural development. We built a website to showcase research
activities in the lab and get involvement of researchers worldwide. To be distributed on web
the NetLogo models were converted to applets that can run on any browser supporting JVM
1.4 or higher. The preexisting models made in StarLogoT, an earlier version of NetLogo only
operatable on MacOS, were modified and converted into NetLogo, to be stored as applets.
1
SECTION 1
INTRODUCTION
1.1 ZEBRAFISH 1.1.1 Zebrafish as a model organism
The zebrafish comes close to being the ideal model organism for studies at molecular
level; it appears to combine the best features that make experimentation easier. Some of the key
features are as listed below:
Zebrafish embryos develop externally and can be viewed and manipulated at all
stages.
The development is rapid, the organization of the embryo is simple and the embryo is
transparent. The latter makes it easier to view the processes taking place in the
embryo with naked eye.
It is amenable to genetic analysis and has a short generation interval (2-3 months).
It can produce more offspring in a shorter time. A female zebrafish lays up to 200
eggs per week.
It is easy to induce new mutations in zebrafish.
Much is known about the genome of zebrafish, dense genetic maps are available
which have been useful for the comparative mapping of human genes.
Comparative genomics shows that there is extensive similarity between the zebrafish and
human genomes. The zebrafish genome is 1700 million base pairs in length, about half the size
of the human genome. This similarity has the effect that many human developmental and disease
genes have counterparts in the zebrafish. Hence studying zebrafish and mutants can give insights
into human diseases and maybe their cure too.
2
1.1.2 Zebrafish study in the lab
The lab is focused on studying the neural development in zebrafish developing
embryos. These studies are done with the aim to get findings that may help in medicine and
pharmacology to develop better cures for developmental neural disorders in the newborns.
The lab uses an integrated interdisciplinary methodology to study the neural
development, the approach being to start with the phenomenon, or the process seen during neural
development, and then understand it by using the following disciplines:
• Genetic
• Molecular
• Cellular
• Computational
The Genetic level understanding involves the use of zebrafish mutants [5]. Mutants are
an easy way to find the genes of interest and then understand biochemically their function and
pathways of action. Molecular and cell biology approach involves designing experiments,
creating mutants, to study the particular process, and deriving conclusions based on the
observations and results. However, with numerous experimental results it becomes efficient and
helpful to model the system in order to understand the effect of various factors that are part of the
system and their behavior under given situations. The computational tools help to visualize these
models that assist with explaining the observed phenomenon as closely as possible. The lab has
in past tried to model the biological processes of neurogenesis computationally by using different
schemas of Meinhardt [2, 3, 20, 25]. The lab used the NetLogo programming environment for
simulation and visualization. NetLogo can model dynamic interactions that result in emergent
patterns. Its ease of operation and efficiency made it a preferred choice for use in the lab.
1.2 INTERNSHIP PROJECT TASKS Purpose
The morphogenesis (development process of from zygote stage to a full grown organism)
is a result of many sub processes all of which operate simultaneously or exclusively or
3
synergistically in a spatial and temporal scheme all of which are under genetic control. This
makes development of higher organisms a complex network of biochemical reactions .The aim
of the internship was to understand theses processes and to formulate models in a mathematical
precise way that describes essential steps - in spite of the appearing complexity of this process.
There were various aspects to my work, which I categorize under following tasks.
These will be presented in detail in subsequent sections of this report.
1.2.1 Modeling Neural Patterning in developing embryos
Stemple and Vincent [11] in their editorial review highlight the idea of modeling and
its use in understanding development. They state that, though modeling is not yet part of
mainstream development biology, it will soon be with the changing trend; now it is becoming an
acceptable additional tool that developmental biologists can use to predict embryonic behavior
and explore possible underlying mechanisms.
In my internship I got a chance to learn about modeling neurogenesis and
understanding the analysis based on the models. This involved studying the molecular biology
theory involved in the neural development of zebrafish and understanding the mechanism of
mathematical modeling of these processes. In addition it required me to learn the NetLogo
modeling environment for simulating and visualizing the models.
Creating New Models
The project involved creating NetLogo [15, 16, 17] models for anterior-posterior (AP)
patterning in the zebrafish neurogenesis process. One focus was on development of a model for
modeling the mid-brain hindbrain boundary formation gene interaction that helps in proper
positioning of the isthymic organizer (this organizer is involved in development of structures of
the mid-brain and hind-brain region). Another major task was development of models for
understanding formation of two basic organizing centers: one for the AP axis and the second for
the DV (dorso-ventral) axis. The organizing centers are the main managers that are involved in
proper positioning and spatial arrangement of various differentiated cells or tissues or organs.
4
Modification of Previous models
The internship involved extending the functionality of some of the past models to
incorporate certain specific patterning environments in formation of the different boundaries in
the brain.
The earlier models were developed in StartLogoT [18, 19] that only works on
Macintosh (MacOS) operating system. To make these models available on the web I was given
the task to convert them to NetLogo format so that they could be executed in windows
environment and distributed as applets over the web.
1.2.2 Studying Gene Regulatory Network (GRN)
Apart from visualizing the model in NetLogo and observing effects of different
parameters, it is of importance to understand the gene regulatory network (GRN) involved in the
modeled process. This is because the activation, or deactivation of the gene, works in principle at
the transcription level. For example deactivation of a gene means a repressor effect on the
transcription factor of the gene.
There are currently few freeware tools available for building a GRN. My internship
guide, Dr Chitnis had researched some of these tools and to start with the modeling we decided
to use NetBuilder [8, 9]. However, since it was being used for the first time we considered
exploring other tools in case NetBuilder was found insufficient to create models of our interest.
Later in this report I present the use of another tool CompuCell, because NetBuilder was found
in appropriate for our task. But, we could not even use CompuCell successfully because of
technical issues with the software in the windows environment.
1.2.3 Developing website for the lab
Web site development was included as an easy and efficient platform to showcase the
lab research work to a wide range of audiences and for interaction of researchers working in
similar areas across the globe. Previously, the lab has produced many exciting results and has
been at the forefront in using the computational modeling environment to visualize biological
experimentation in Zebrafish. The modeling in some cases has helped in manipulation of the
5
molecular biology experiments in addition to providing certain new insights to the results
observed at the bench. The website would contain information about the various NetLogo
models for the users to browse and appreciate the understanding of the experimental process in
neurogenesis as it happens. To achieve this all the models will be converted in Java applet form
so that they can run from the client browser. With the main idea being to spread a general
understanding of the theory of the neural development across a wide variety of readers, we
planned to develop the website in a non-technical manner with lots of movie clips and diagrams
for easy understanding.
6
SECTION 2
LITERATURE REVIEW
This section presents literature readings on the various topics that I covered as an intern
and the software applications and tools that I used. The internship project was in the context of
development biology. Having a very basic knowledge in this field, the literature study effectively
encouraged by my guide helped me to perform the tasks efficiently.
2.1 DEVELOPMENT
Development is a complex process and difficult to understand in entirety as a single step.
Hence researchers focus on a certain part of developmental processes and many such researchers
in combination have helped to give a panoramic view of the development process. One of the
main knowledge discoveries in human developmental biology has been by understanding the
morphogenesis in different vertebrate organisms. This is because the basic steps in
morphogenesis are conserved among vertebrates. Morphogenesis in general may be defined as
the process (growth and differentiation) by which living things develop organized structures to
become a fully functional organism. My internship lab, Chitnis lab, at NICHD used zebrafish as
the model organism to study neural development. The developmental process, in a crude sense,
is a sequential pattern formation schema based on cell-cell interactions, starting with more or less
homogenous conditions that have developed certain biases to give rise to spatial polarity.
2.2 NEUROGENESIS
Neurogenesis is the process of development of the nervous tissue and the nervous system.
The process is conserved in all vertebrates and takes place through a series of steps that include
neural induction and nerulation (cell differentiation and neural patterning).
As Chitnis and Itoh [10] report, distinctions that characterize the different compartments
of the nervous system begin to be established by early gastrulation. At this stage a diverse range
7
of cell-cell interactions and signaling mechanisms help divide the prospective neuro-ectoderm
into domains with distinct fate. The neural induction is based on signals that act in guiding
spatial and positional development. For example, BMP1 is a caudalizing signal that is present at
gastrula stage; to develop neural character we have BMP antagonists that act to maintain low-
level of BMP activity and promote neural development [28] (For a model of neural induction see
appendix 3). This simultaneously starts the process of neural patterning that completes at later
stages. Of course, these are not sufficient to promote neural character and other signals like FGF
are required. It is seen that acquisition of anterior character is closely linked with induction of
neural character.
Neural patterning is also a dynamic process and eventually leads to neural differentiation
when appearance of additional signaling centers, like the IsO (Isthmic Organizer), further
organize and differentiate the patterns established by at the shield stage [6, 27]. Neural patterning
involves division of the vertebrate neural tube into discrete compartments along the anterior-
posterior (AP) axis of the developing embryo. This process starts during early gastrulating and
goes on till late neural stage. Initial signals (antagonists to caudalizing factor BMP) induce
neural tissue with more rostral (forebrain-like) fate. Later the posteriorising factors act in the
form of a morphogen gradient and cause differential spatial and temporal response of the genes.
And, as Chitins and Itoh [10] report, differential exposure to caudalizing factors like Wnt2, FGF3,
retinoid signals and nodal signals subsequently transforms the neural plate to progressively more
caudal fates.
1 BMP (Bone Morphogenetic Proteins) are signaling proteins that are involved in a variety of developmental processes. They initiate promote and regulate bone development, growth, remodeling and repair. BMPs are also involved in prenatal development and postnatal growth of eye, heart, kidney, skin and other tissues [appendix 3]. 2 Wnt genes constitute a large family of highly conserved cysteine-rich, secreted glycoproteins that are involved in critical aspects of early embryonic development. Wnt genes and Wnt signaling are also implicated in cancer. Source: http://www.stanford.edu/~rnusse/wntwindow.html 3 FGF - Fibroblast Growth Factor: family of proteins that possess broad mitogenic and cell survival activities, and are involved in a variety of biological processes, including embryonic development, cell growth, morphogenesis, angiogenesis, tissue repair, tumor growth and invasion.
8
2.2.1 The mid-hindbrain domain of the embryonic brain
Galvic et al. [1] identify some of the unique genes and the regulatory framework in the
formation of the midbrain-hindbrain boundary (MHB). The midbrain-hindbrain domain (MH) of
the embryonic neural plate gives rise to crucial structures like the optic tectum (visual center),
cerebellum (balance), tegmentum and pons (involved for a large part in the control of social
behavior)[12]. Wurst and Bally-Cuif [12] report that at embryonic stages, the MH follows an
interesting mode of development: unlike other brain areas, it does not rely on segmentation but
rather responds to long range signaling activities originating from the midbrain-hindbrain
boundary (MHB). MHB cells, forming the so-called ‘Isthmic Organizer’ (IsO), secrete diffusible
factors of the Wnt and FGF families and control growth and patterning across the entire MH.
The IsO is considered the paradigm organizer of the vertebrate brain anlage. Thus, investigating
MH development is an important step towards understanding brain construction, as well as the
function of organizing centers.
In addition, the MH domain is molecularly subdivided at the level of the MHB into
rostral (Otx-positive) and caudal (Gbx-positive) domains, which will later acquire different fates.
We studied the research of Galvic et al. [1] and modeled the MHB formation scheme as
represented in their paper [see appendix 2].
Most of the process, in development, like the formation of midbrain-hindbrain boundary
(MHB), as discussed above, starts formation under the influence of certain substances that
influences or favors specific differentiation of cells in particular areas. These substances that play
the importance role in spatial and temporal patterning are termed morphogens.
2.3 MORPHOGEN GRADIENTS AND GENE EXPRESSION
Pages and Kerridge [4] in their research define morphogens as ‘form-generating
substances’ those are capable of organizing distinct territories into different tissue types [4]. In
their research on the morphogen gradient they nicely summarize two general mechanisms of
action of morphogens on the cells: concentration - dependant and sequential cell mechanisms.
9
The concentration dependant model describes how the morphogen, acting directly on the
cells, triggers a cascade of events and induces distinct cellular responses as genes respond
differently to morphogen gradient. In a cell genes that have their required morphogen level
present are activated, these genes along with the morphogen then trigger the activation of later
genes.
The sequential cell model describes morphogen acting indirectly through secondary
signaling events or relay mechanisms. The transcriptional factor (TF) is induced in a sequential
manner and the TF along with the signaling molecules allows the expression of a later set of
genes. As Pages and Kerridge [4] suggest, this model is like an off/on instruction, where specific
response of the cell depends on its prior transcriptional state.
Though scientists still debate which model truly describes the manner in which
morphogen acts, in reality it seems that either model or a combination of models may be true,
mostly depending upon the system under the study. In our studies we use the concentration
dependent scheme for modeling the action of morphogen.
2.4 PATTERN FORMATION MECHANISMS
In genes, it is exciting to understand how in development there is a generation of
differentiated structures from a more or less homogeneous zygote. Researchers, such as Hans
Meinhardt [3, 4] and Turing [14], have tried to capture these phenomenons in mathematical
equations, showing that there are certain common principles in the generation of these structures.
We further study these mathematical models and their underlying theories.
2.4.1 Autocatalysis and lateral inhibition
Studying the Activity of a single gene
Meinhardt [3,4] describes various schemes for pattern formation in biological system and
uses mathematical models to describe these schemes. I used Meinhardt’s program, ‘sp’ (works in
MS-DOS environment [25]), to understand his models and simulations. A basis to his idea can
be understood by the concept of a single gene that has an auto regulatory feedback on its own.
Such a gene under the influence of a graded distributed morphogen will be active in all the cells
10
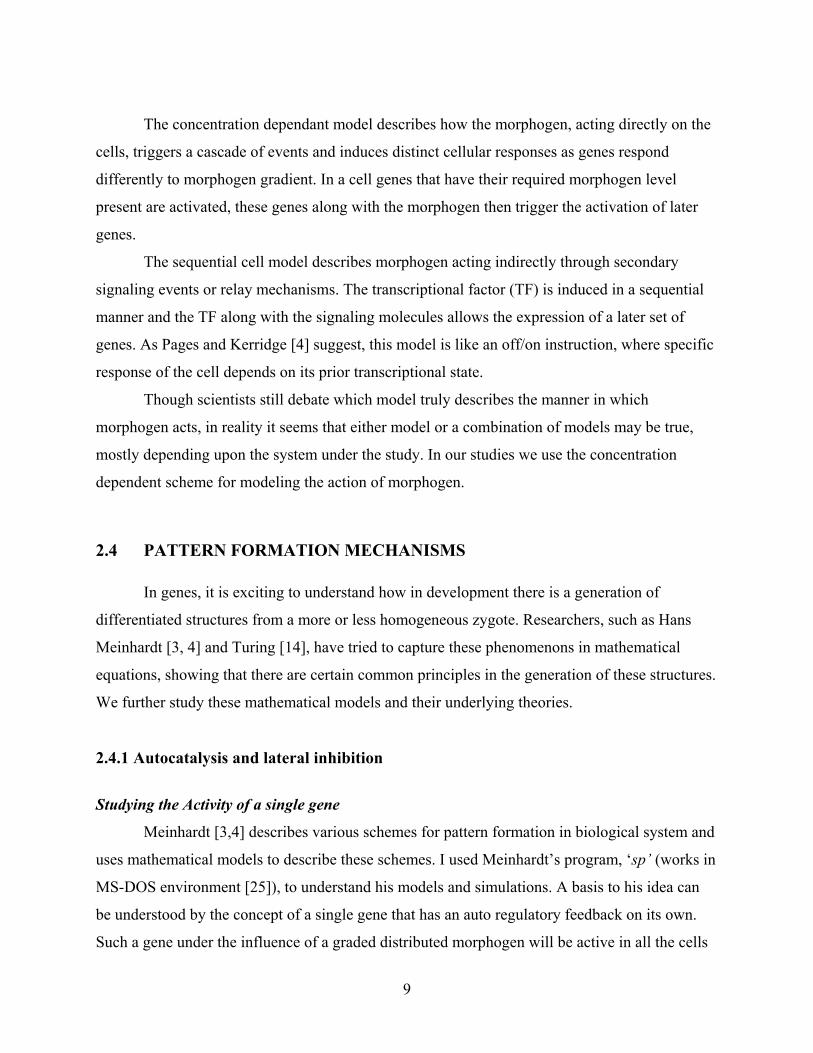
exposed above a threshold of morphogen. This will result in two regions as shown in the Figure
2.1: one with high activity (region above the threshold) and the other with low gene activity
(region below the threshold). Figure 2.1: Gene Activity under morphogen gradient The green line represents the morphogen gradient. Blue line represents the gene activity.
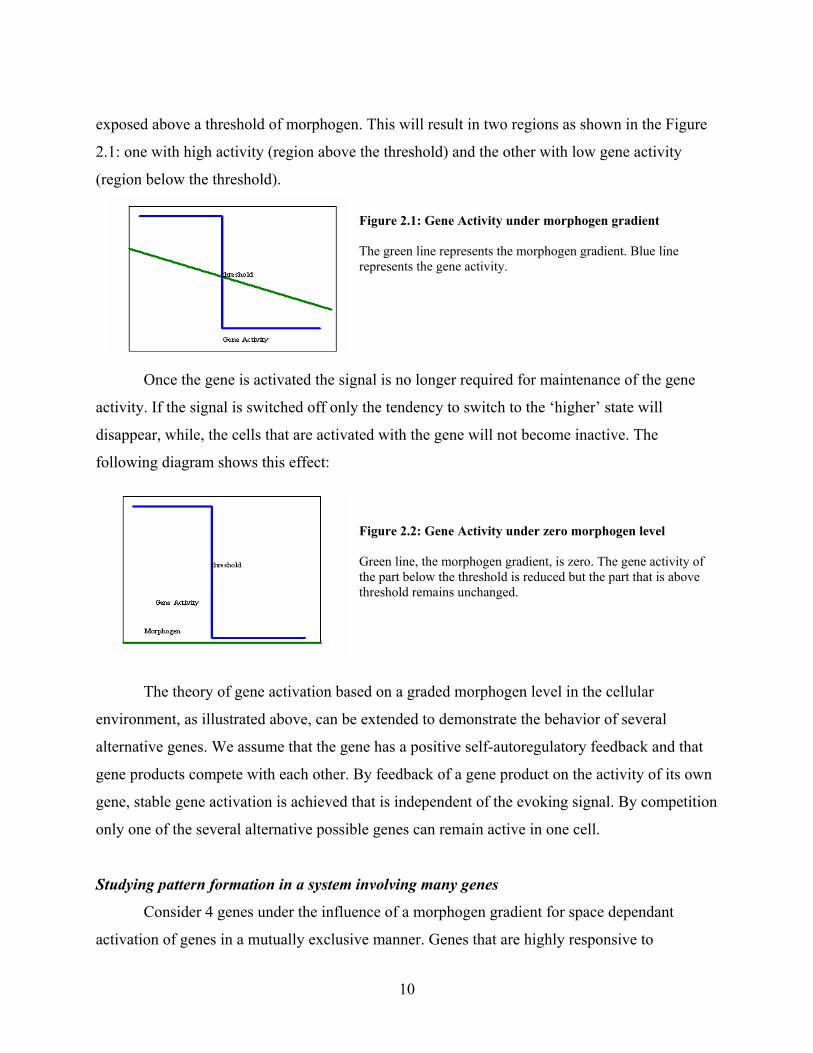
Once the gene is activated the signal is no longer required for maintenance of the gene
activity. If the signal is switched off only the tendency to switch to the ‘higher’ state will
disappear, while, the cells that are activated with the gene will not become inactive. The
following diagram shows this effect:
Figure 2.2: Gene Activity under zero morphogen level Green line, the morphogen gradient, is zero. The gene activity of the part below the threshold is reduced but the part that is above threshold remains unchanged.
The theory of gene activation based on a graded morphogen level in the cellular
environment, as illustrated above, can be extended to demonstrate the behavior of several
alternative genes. We assume that the gene has a positive self-autoregulatory feedback and that
gene products compete with each other. By feedback of a gene product on the activity of its own
gene, stable gene activation is achieved that is independent of the evoking signal. By competition
only one of the several alternative possible genes can remain active in one cell.
Studying pattern formation in a system involving many genes
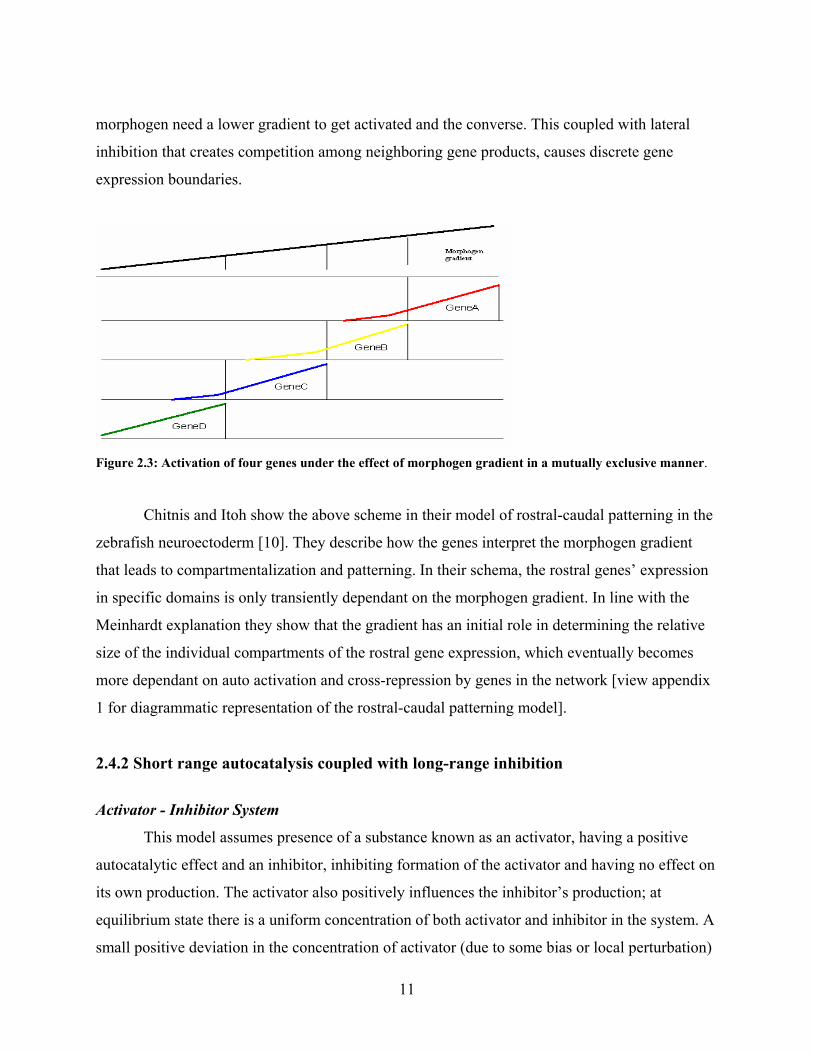
Consider 4 genes under the influence of a morphogen gradient for space dependant
activation of genes in a mutually exclusive manner. Genes that are highly responsive to
11
morphogen need a lower gradient to get activated and the converse. This coupled with lateral
inhibition that creates competition among neighboring gene products, causes discrete gene
expression boundaries.
Figure 2.3: Activation of four genes under the effect of morphogen gradient in a mutually exclusive manner.
Chitnis and Itoh show the above scheme in their model of rostral-caudal patterning in the
zebrafish neuroectoderm [10]. They describe how the genes interpret the morphogen gradient
that leads to compartmentalization and patterning. In their schema, the rostral genes’ expression
in specific domains is only transiently dependant on the morphogen gradient. In line with the
Meinhardt explanation they show that the gradient has an initial role in determining the relative
size of the individual compartments of the rostral gene expression, which eventually becomes
more dependant on auto activation and cross-repression by genes in the network [view appendix
1 for diagrammatic representation of the rostral-caudal patterning model].
2.4.2 Short range autocatalysis coupled with long-range inhibition
Activator - Inhibitor System
This model assumes presence of a substance known as an activator, having a positive
autocatalytic effect and an inhibitor, inhibiting formation of the activator and having no effect on
its own production. The activator also positively influences the inhibitor’s production; at
equilibrium state there is a uniform concentration of both activator and inhibitor in the system. A
small positive deviation in the concentration of activator (due to some bias or local perturbation)
12
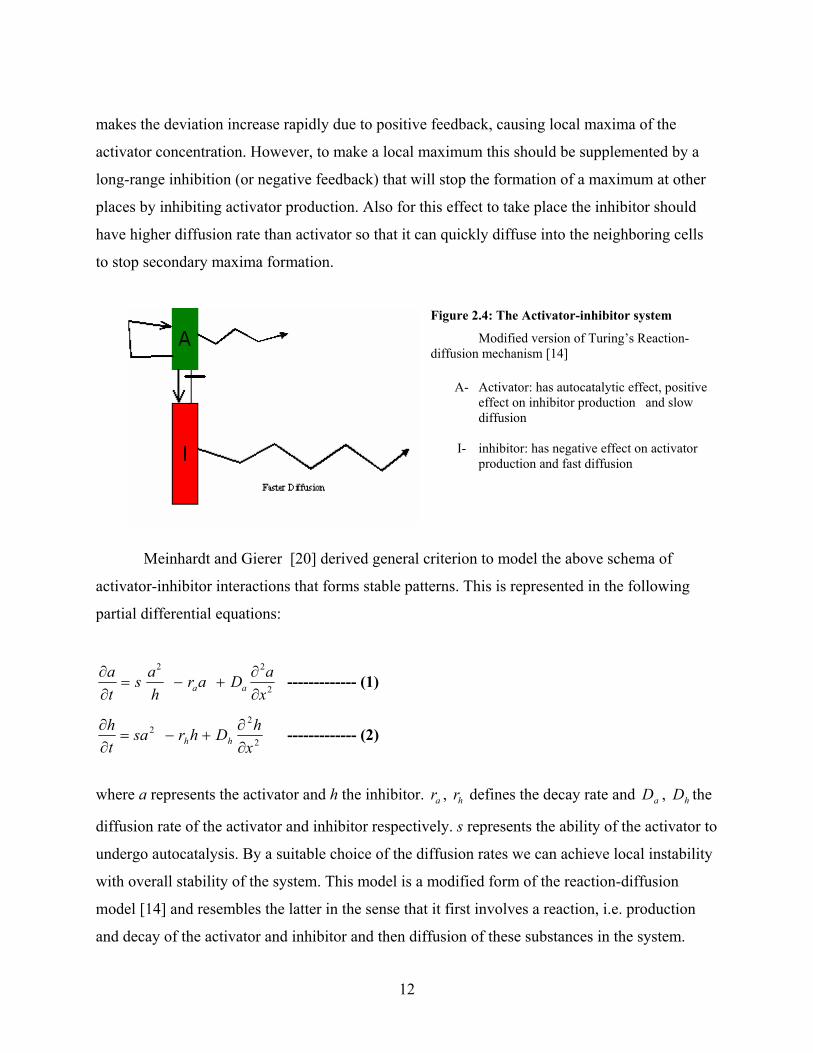
makes the deviation increase rapidly due to positive feedback, causing local maxima of the
activator concentration. However, to make a local maximum this should be supplemented by a
long-range inhibition (or negative feedback) that will stop the formation of a maximum at other
places by inhibiting activator production. Also for this effect to take place the inhibitor should
have higher diffusion rate than activator so that it can quickly diffuse into the neighboring cells
to stop secondary maxima formation.
Figure 2.4: The Activator-inhibitor system
Modified version of Turing’s Reaction-diffusion mechanism [14]
A- Activator: has autocatalytic effect, positive effect on inhibitor production and slow diffusion
I- inhibitor: has negative effect on activator production and fast diffusion
Meinhardt and Gierer [20] derived general criterion to model the above schema of
activator-inhibitor interactions that forms stable patterns. This is represented in the following
partial differential equations:
2
22
xaDar
has
ta
aa ∂∂
+−=∂∂ ------------- (1)
2
22
xhDhrsa
th
hh ∂∂
+−=∂∂ ------------- (2)
where a represents the activator and h the inhibitor. ar , hr defines the decay rate and aD , hD the
diffusion rate of the activator and inhibitor respectively. s represents the ability of the activator to
undergo autocatalysis. By a suitable choice of the diffusion rates we can achieve local instability
with overall stability of the system. This model is a modified form of the reaction-diffusion
model [14] and resembles the latter in the sense that it first involves a reaction, i.e. production
and decay of the activator and inhibitor and then diffusion of these substances in the system.
13
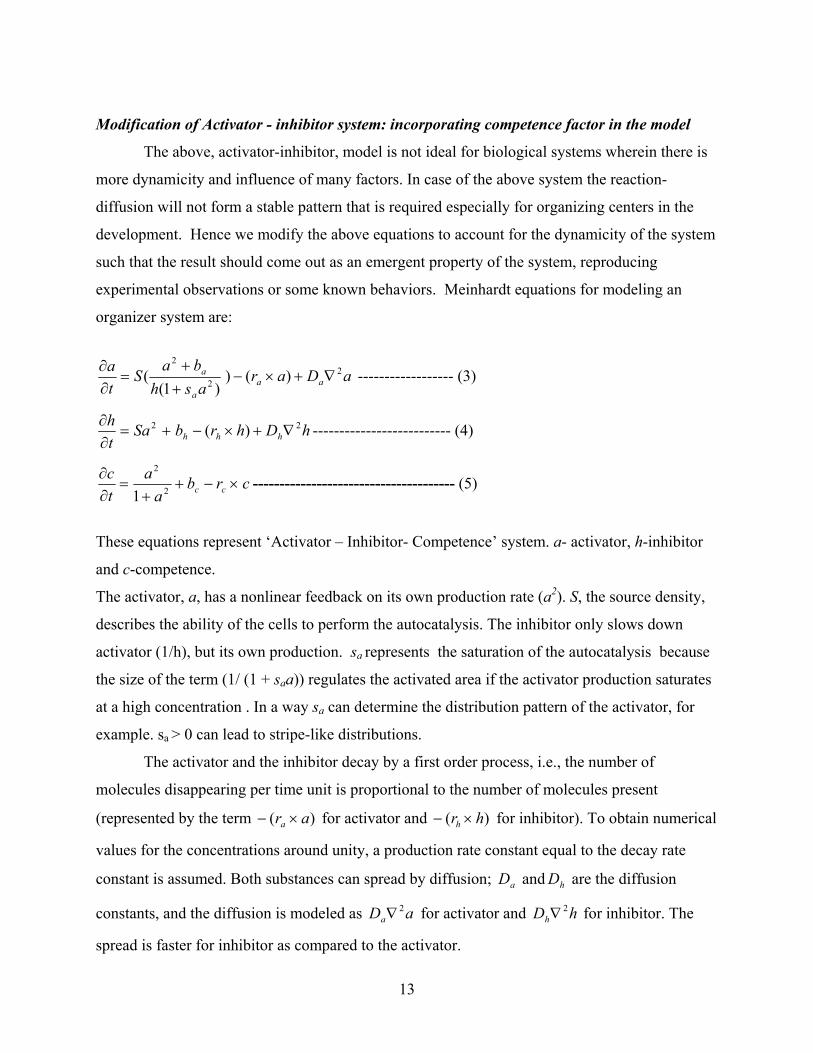
Modification of Activator - inhibitor system: incorporating competence factor in the model
The above, activator-inhibitor, model is not ideal for biological systems wherein there is
more dynamicity and influence of many factors. In case of the above system the reaction-
diffusion will not form a stable pattern that is required especially for organizing centers in the
development. Hence we modify the above equations to account for the dynamicity of the system
such that the result should come out as an emergent property of the system, reproducing
experimental observations or some known behaviors. Meinhardt equations for modeling an
organizer system are:
aDarash
baS
ta
aaa
a 22
2
)())1(
( ∇+×−++
=∂∂ ------------------ (3)
hDhrbSath
hhh22 )( ∇+×−+=
∂∂ -------------------------- (4)
crba
atc
cc ×−++
=∂∂
2
2
1-------------------------------------- (5)
These equations represent ‘Activator – Inhibitor- Competence’ system. a- activator, h-inhibitor
and c-competence.
The activator, a, has a nonlinear feedback on its own production rate (a2). S, the source density,
describes the ability of the cells to perform the autocatalysis. The inhibitor only slows down
activator (1/h), but its own production. sa represents the saturation of the autocatalysis because
the size of the term (1/ (1 + saa)) regulates the activated area if the activator production saturates
at a high concentration . In a way sa can determine the distribution pattern of the activator, for
example. sa > 0 can lead to stripe-like distributions.
The activator and the inhibitor decay by a first order process, i.e., the number of
molecules disappearing per time unit is proportional to the number of molecules present
(represented by the term )( ara ×− for activator and )( hrh ×− for inhibitor). To obtain numerical
values for the concentrations around unity, a production rate constant equal to the decay rate
constant is assumed. Both substances can spread by diffusion; aD and hD are the diffusion
constants, and the diffusion is modeled as aDa2∇ for activator and hDh
2∇ for inhibitor. The
spread is faster for inhibitor as compared to the activator.
14
ba , bh, bc are the basic activator, inhibitor and competence production respectively. The
small basic activator production (activator-independent) helps in initiating autocatalysis in areas
with low activator concentration. In contrast, the basic inhibitor production can suppress the
appearance of local secondary maxima.
The competence plays a role of suppressing formation of secondary maxima when the
embryo grows in size. This needs a feedback mechanism of the system on the competence
production .If source has steeper slope than inhibitor then no secondary maxima, also in the
system the competence should have time constant higher than the AI system. For pattern
formation a minimum size of field is required (visualized with Meinhardt’s ‘sp’ program [25]).
His program simulates how during growth a maximum emerges at the end of the field if some
critical size is exceeded. This then remains stable on further growth. Such a system has
properties of an organizing center. Results of many other schemas and simulations were also
presented on Meinhardt’s website [26].
To explore the various parameters in the above models and to see the results we need to
use computational tools. NetLogo is one such tool that achieves this in an effective and efficient
way.
2.5 MODELING AND VISUALIZATION TOOLS
To understand the dynamics and properties of a modeled system it is necessary to
simulate it with hypothesized factors and conditions. For achieving this many freeware tools and
applications are available. We discuss two of them: NetLogo and CompuCell, which were used
in this report.
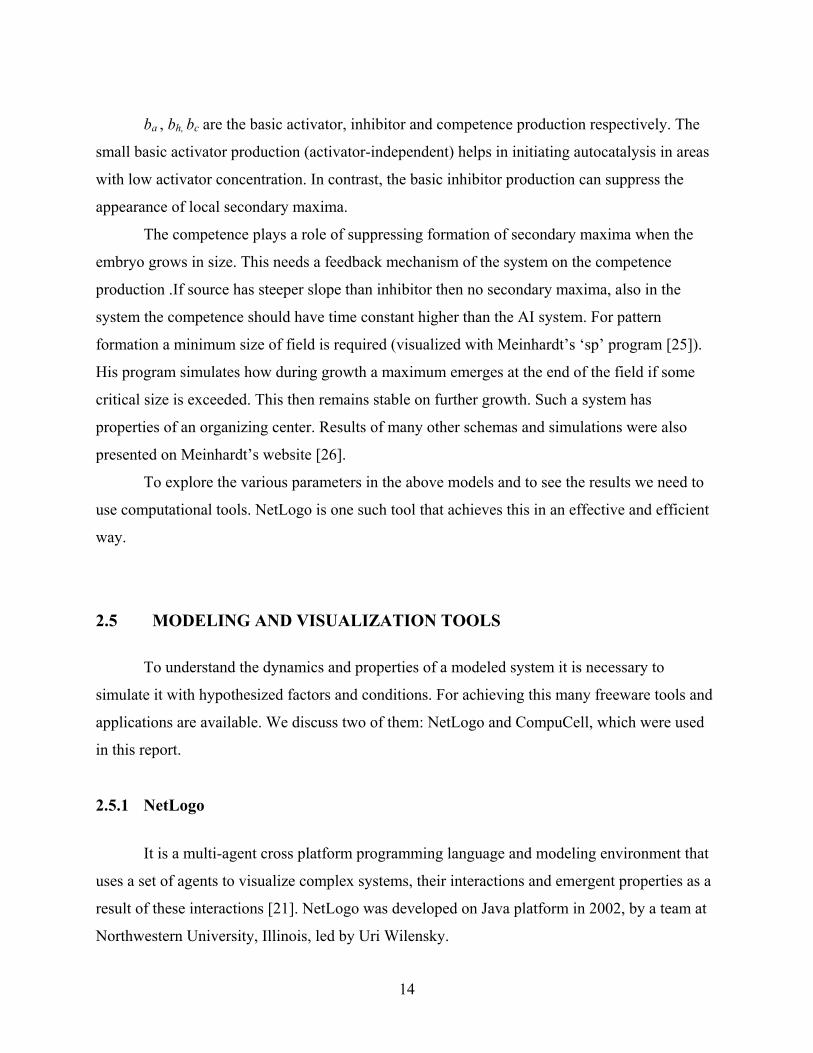
2.5.1 NetLogo
It is a multi-agent cross platform programming language and modeling environment that
uses a set of agents to visualize complex systems, their interactions and emergent properties as a
result of these interactions [21]. NetLogo was developed on Java platform in 2002, by a team at
Northwestern University, Illinois, led by Uri Wilensky.

15
The precursor of NetLogo was StarLogo that was originally developed by Daniel Bobrow
and Wallace Feurzeig at Bolt, Beranek and Newman, Inc. and Seymour Papert at MIT in 1960s.
Starlogo was modified into StartLogoT [18, 19] by the team at Northwestern University. The
StarlogoT programmable environment was good for studying emergent properties of complex
systems developing over time. NetLogo encompasses this basic characteristic along with some
additional features that make it a preferred tool for modeling biological systems.
Advantages of NetLogo
i. NetLogo is an easy to learn and use tool. It is fully programmable with a simple language
structure. There is no pre requisite of computer programming knowledge. This makes it a
preferred choice for biologists with no computer background.
ii. It is a freeware and standalone application that can easily be installed. The software and
documents can be downloaded from http://ccl.northwestern.edu/netlogo [21].
iii. NetLogo has a well-written documentation with built-in examples and tutorials that make
the learning faster. There is also a big user community networked by user-groups and
forums that provide additional advantage in learning.
iv. It offers an advantage over the earlier StartLogoT version in being cross platform. While
the latter could only operate on MacOS, NetLogo can operate on MacOS, Windows, and
linux among many other operating systems.
v. NetLogo models can easily be converted to applets, which offer an advantage for
distribution over the Internet. Also programs built in StartLogoT can be converted to
NetLogo using NetLogo version 1.3. NetLogo is continuously being modified and upgraded with each newer version offering
something more based on the user feedback. This makes it a more robust and efficient tool.
Modeling in NetLogo
In general models help to describe a system. However, with a tool like NetLogo that can
help visualize a given model, the task of learning from the models becomes much more efficient
and effective. NetLogo has 3 kinds of agent set: turtles, patches and observer. Each of these has
their own set of properties, functions and uses. A model can be built using these agents, which
16
can be programmed into the application. The modeler can specify how these agents interact with
each other using defined rules. Modelers can give instructions to hundreds of agents all operating
simultaneously. This makes it possible to explore the interactions among the agents (at micro-
level) and the patterns that emerge from such interactions (at macro level) [15, 16, 17].
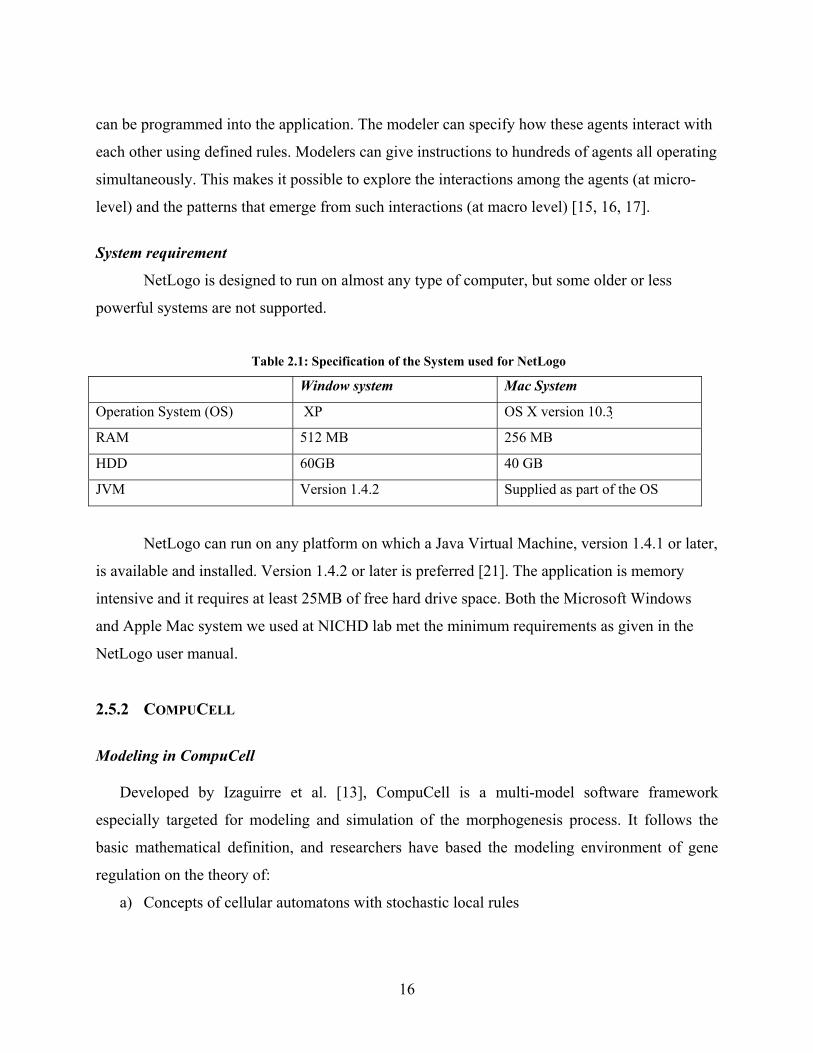
System requirement
NetLogo is designed to run on almost any type of computer, but some older or less
powerful systems are not supported.
Table 2.1: Specification of the System used for NetLogo
Window system Mac System
Operation System (OS) XP OS X version 10.3
RAM 512 MB 256 MB
HDD 60GB 40 GB
JVM Version 1.4.2 Supplied as part of the OS
NetLogo can run on any platform on which a Java Virtual Machine, version 1.4.1 or later,
is available and installed. Version 1.4.2 or later is preferred [21]. The application is memory
intensive and it requires at least 25MB of free hard drive space. Both the Microsoft Windows
and Apple Mac system we used at NICHD lab met the minimum requirements as given in the
NetLogo user manual.
2.5.2 COMPUCELL
Modeling in CompuCell
Developed by Izaguirre et al. [13], CompuCell is a multi-model software framework
especially targeted for modeling and simulation of the morphogenesis process. It follows the
basic mathematical definition, and researchers have based the modeling environment of gene
regulation on the theory of:
a) Concepts of cellular automatons with stochastic local rules
17
b) System of differential equations, including subcellular ordinary differential equations and
extracellular reaction-diffusion partial differential equations; the latter describe diffusible
morphogens.
The researchers state that the tool has a flexible computational environment for simulations
and simultaneous incorporation of growth and spatial patterning. If we can use this tool it will be
helpful to model the gene network involved in the formation of the organizing center. The model
for the development of the organizer needs to take into consideration both the growth of the
developing embryo and the spatial patterning.
System Requirement
CompuCell is a free software tool and has binaries both for Microsoft Windows and
Linux. The tool can be downloaded from the site: http://sourceforge.net/projects/compucell/
2.6 GENE REGULATORY NETWORKS
A Gene Regulatory networks (GRN) can be considered as a signaling network made of
on/off switches that are operating at gene level in the cell. A GRN dynamically controls the
expression of the genes in the cell by controlling whether and how fast the transcription of gene
to mRNA occurs.
2.6.1 NetBuilder
NetBuilder is a tool developed by the bioinformatics group at University of
Hertfordshire, Hatfield, UK, that can model a given GRN.
Modeling in NetBuilder
In NetBuilder a GRN is modeled as a system consisting of components made of genes,
cell surface receptors and other signaling molecules. The components send, receive and respond
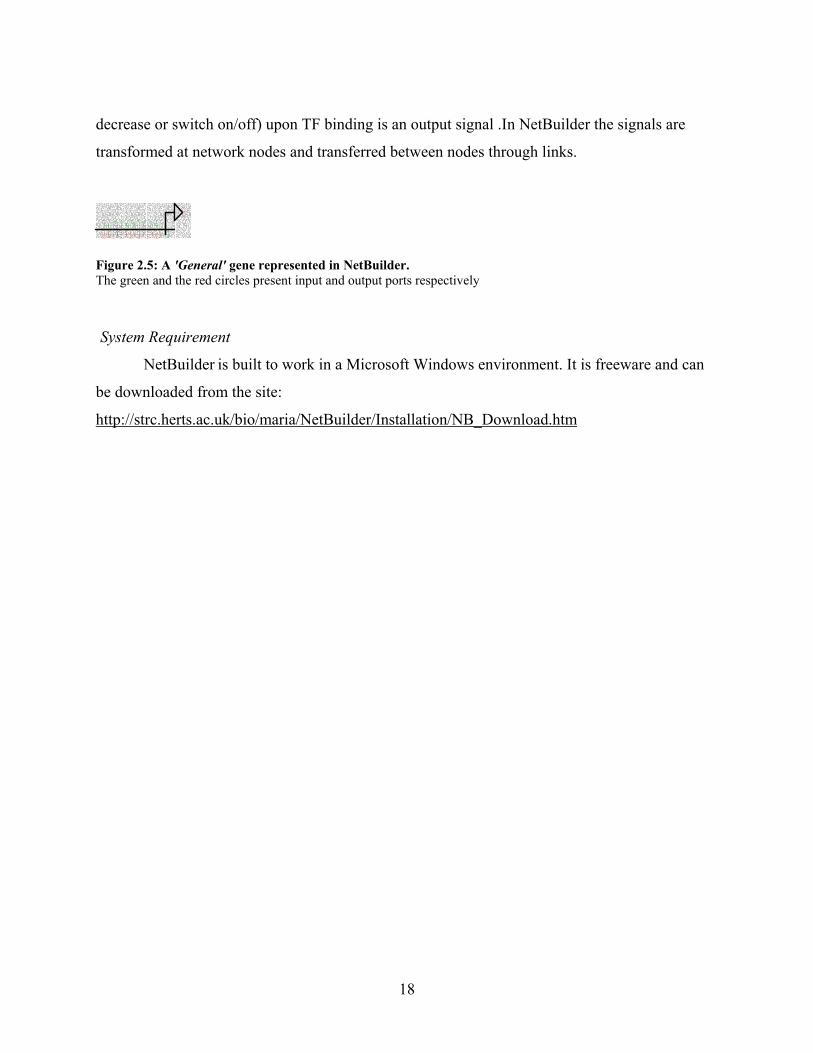
to signals [9]. In NetBuilder a gene is modeled to have input and output signals (see figure 2.5).
A gene responds to the input signals to modulate the output signals, for example binding of a
transcription factor (TF) to a gene is an input signal and the transcription rate change (increase,
18
decrease or switch on/off) upon TF binding is an output signal .In NetBuilder the signals are
transformed at network nodes and transferred between nodes through links.
Figure 2.5: A 'General' gene represented in NetBuilder. The green and the red circles present input and output ports respectively System Requirement
NetBuilder is built to work in a Microsoft Windows environment. It is freeware and can
be downloaded from the site:
http://strc.herts.ac.uk/bio/maria/NetBuilder/Installation/NB_Download.htm
19
SECTION 3
PROJECT IMPLEMENTATION
This section is divided into three phases each of which involved implementation of a
specific task.
3.1 PHASE I: THE LEARNING PHASE
My first task was to understand the modeling environment and programming methods for
both NetLogo and StarLogoT; and convert the programs made in the past in the lab in StarLogoT
to NetLogo. I used NetLogo version 2.0.2. It was easy and quick to learn. With resources
available in form of tutorials, built-in examples, models from user community, and discussions
forums it took me no time to understand the programming. The concepts used in most of the
models made in StarLogoT were based on Meinhardt’s schemas and equations describing
processes in biological systems. I started out with understanding a basic spatial patterning model,
Four-gene model, and then converted the Four-gene program along with other models made in
StarLogoT to NetLogo.
3.1.1 Modeling Spatial expression of gene under Morphogen gradient: Four Gene
Model
The Four Gene model represents a concept that we can correlate to processes occurring
during AP patterning, somatogenesis and other neurogenesis processes in Zebrafish; shown by
Chitnis and Itoh [10] in their model of rostral-caudal gene patterning.
The model also provides a basic understanding of the concepts of morphogen gradient,
occurrence of differential gene expression under the effect of gradient, and the modeling of the
process as a system of differential equations using the Meinhardt [2] theory of self-activation and
lateral inhibition. These concepts are important to know as different manipulating of them can
achieve patterns. The model is based on the Meinhardt gene activation model [2,3,20] and is
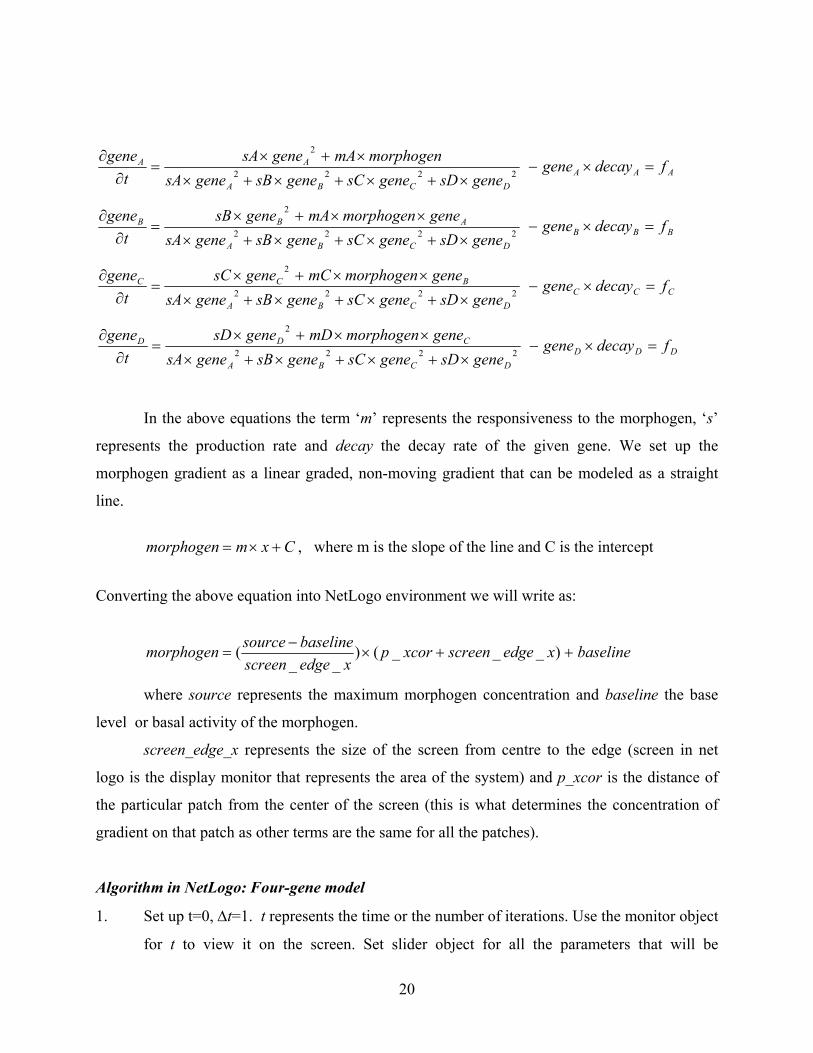
represented by the following non-linear system of partial differential equations:
20
AAADCBA
AA fdecaygenegenesDgenesCgenesBgenesA
morphogenmAgenesAt
gene=×−
×+×+×+××+×
=∂
∂2222
2
BBBDCBA
ABB fdecaygenegenesDgenesCgenesBgenesA
genemorphogenmAgenesBt
gene=×−
×+×+×+×××+×
=∂
∂2222
2
CCCDCBA
BCC fdecaygenegenesDgenesCgenesBgenesA
genemorphogenmCgenesCt
gene=×−
×+×+×+×
××+×=
∂∂
2222
2
DDDDCBA
CDD fdecaygenegenesDgenesCgenesBgenesA
genemorphogenmDgenesDt
gene=×−
×+×+×+×
××+×=
∂∂
2222
2
In the above equations the term ‘m’ represents the responsiveness to the morphogen, ‘s’
represents the production rate and decay the decay rate of the given gene. We set up the
morphogen gradient as a linear graded, non-moving gradient that can be modeled as a straight
line.
Cxmmorphogen +×= , where m is the slope of the line and C is the intercept
Converting the above equation into NetLogo environment we will write as:
baselinexedgescreenxcorpxedgescreen
baselinesourcemorphogen ++×−
= )___()__
(
where source represents the maximum morphogen concentration and baseline the base
level or basal activity of the morphogen.
screen_edge_x represents the size of the screen from centre to the edge (screen in net
logo is the display monitor that represents the area of the system) and p_xcor is the distance of
the particular patch from the center of the screen (this is what determines the concentration of
gradient on that patch as other terms are the same for all the patches).
Algorithm in NetLogo: Four-gene model
1. Set up t=0, ∆t=1. t represents the time or the number of iterations. Use the monitor object
for t to view it on the screen. Set slider object for all the parameters that will be
21
manipulated to carry out simulations. These are the production rates(s), decay rates
(decay) and morphogen sensitivity (m) for each of the genes (view appendix 4 for a
screenshot of the model setup). For the morphogen set up sliders for the source (max
morphogen) and the baseline.
2. Set the initial level of the gene parameters. Set up the morphogen gradient.
3. Set the new level of gene at time t=t+1. The general equation for modeling this is:
genefttgenetgene ×∆+=+ )()1( where genef is substituted by the equations shown above
for each gene, equivalently Euler’s method of integration with step size 1.
4. Increment t= t+1 for the next iteration
5. Repeat step 4 and 5. Stop once a stable pattern is reached (i.e. no more change is seen in
the pattern).
Result
The simulations based on the above algorithm give the following result
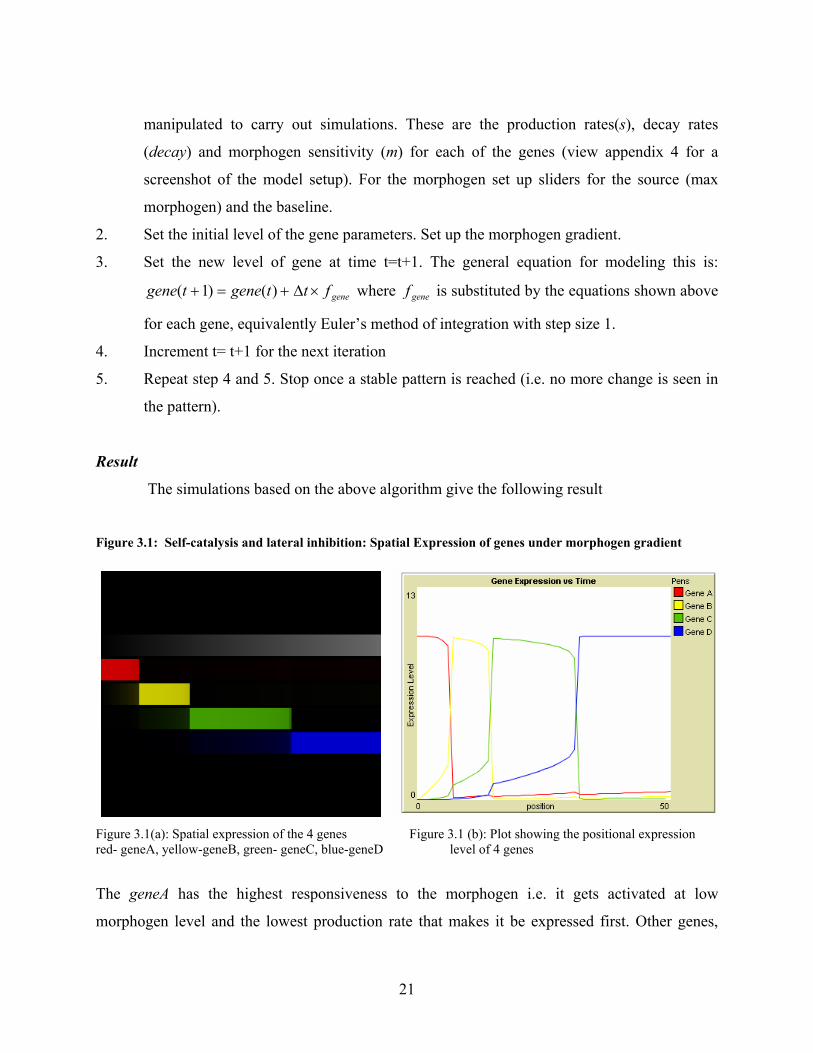
Figure 3.1: Self-catalysis and lateral inhibition: Spatial Expression of genes under morphogen gradient
Figure 3.1(a): Spatial expression of the 4 genes Figure 3.1 (b): Plot showing the positional expression red- geneA, yellow-geneB, green- geneC, blue-geneD level of 4 genes
The geneA has the highest responsiveness to the morphogen i.e. it gets activated at low
morphogen level and the lowest production rate that makes it be expressed first. Other genes,
22
geneB, geneC and geneD have relatively lower responsiveness to morphogen but higher
production rate in order i.e. mA>mB>mC>mD and sA<sB<sC<sD.
Table 3.1: Values used in the simulation of the four-gene model under morphogen gradient
Gene Parameter
A
B
C
D
Production Rate (s) 1.5 2.4 3.4 4.3
Decay Rate (decay) 0.1 0.1 0.1 0.1
Importance of Morphogen (m) 2.1 1.75 1.30 .95
Max. Morphogen (source) 4.6
Morphogen baseline 0
Observation
Once a stable gene spatial pattern is formed, it remains unchanged if we then lower or
switch off the morphogen. We also simulate the pattern so formed under following conditions.
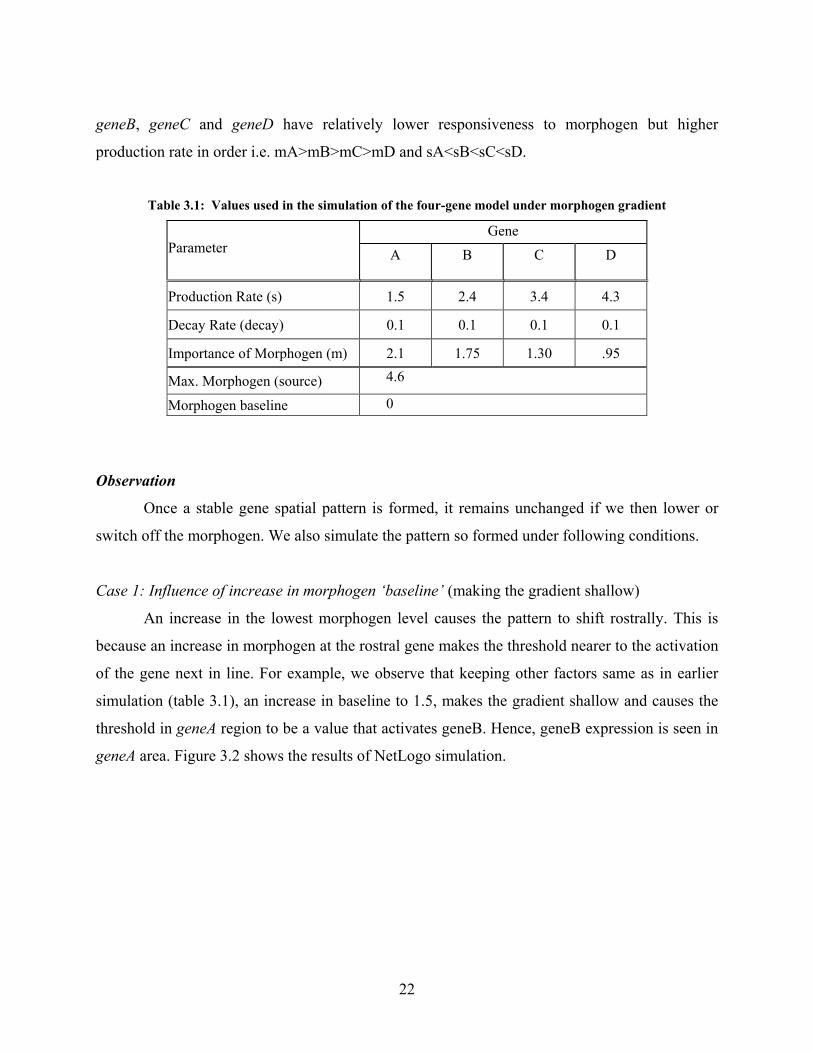
Case 1: Influence of increase in morphogen ‘baseline’ (making the gradient shallow)
An increase in the lowest morphogen level causes the pattern to shift rostrally. This is
because an increase in morphogen at the rostral gene makes the threshold nearer to the activation
of the gene next in line. For example, we observe that keeping other factors same as in earlier
simulation (table 3.1), an increase in baseline to 1.5, makes the gradient shallow and causes the
threshold in geneA region to be a value that activates geneB. Hence, geneB expression is seen in
geneA area. Figure 3.2 shows the results of NetLogo simulation.
23
Figure 3.2: Gene Expression under shallow morphogen gradient
Figure 3.2 (a): Spatial expression of the 4 genes Figure 3.2 (b): Plot showing the positional expression level
The gene A (red bar) is missing and all genes have moved rostrally
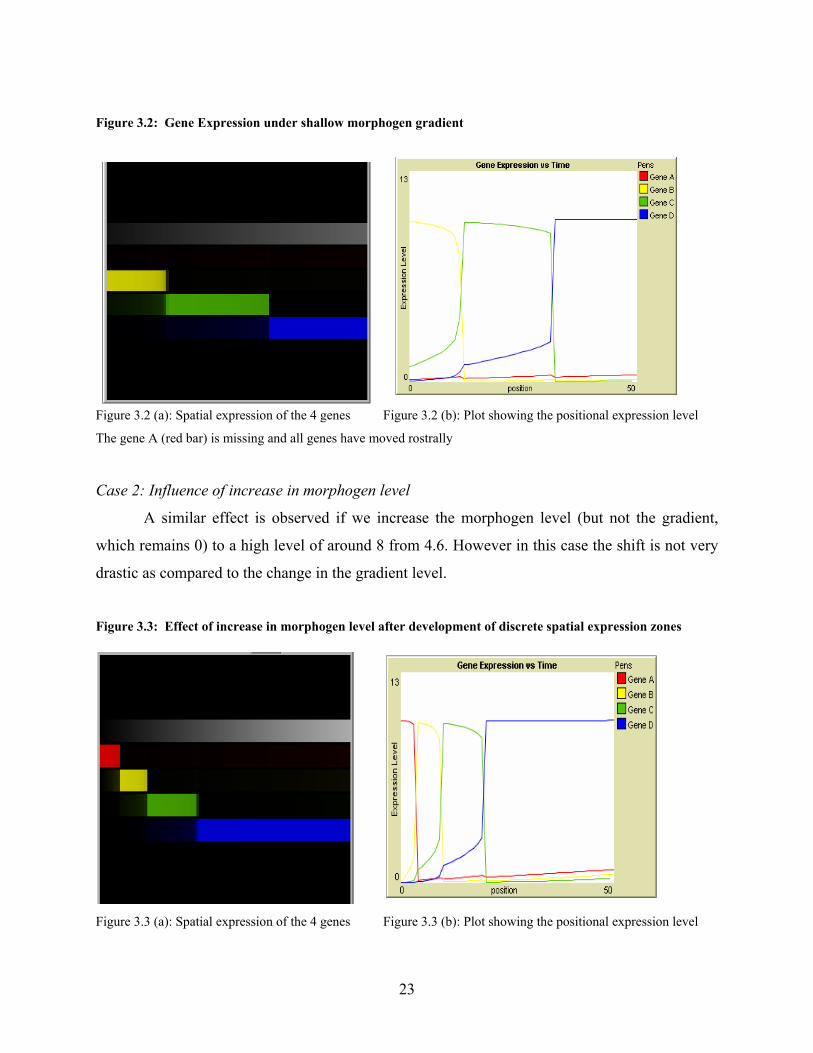
Case 2: Influence of increase in morphogen level
A similar effect is observed if we increase the morphogen level (but not the gradient,
which remains 0) to a high level of around 8 from 4.6. However in this case the shift is not very
drastic as compared to the change in the gradient level.
Figure 3.3: Effect of increase in morphogen level after development of discrete spatial expression zones
Figure 3.3 (a): Spatial expression of the 4 genes Figure 3.3 (b): Plot showing the positional expression level
24
Inference
Under the influence of the morphogen when the change from one gene to the next occurs
in a concentration-dependant manner, particular genes remain active at a particular position
initially because of morphogen gradient and later because of self activation and cross repression.
Hence, though local morphogen concentration determines which gene becomes activated at
particular position, the cells have to remember what they learned to maintain the pattern at later
stages when the morphogen signal is no longer present. For a sharp mutually exclusive spatial
pattering the condition: sA<sB<sC<sD must be satisfied.
The above model was explored in various forms in past in the lab. These involved the
study of somatogenesis, Delta-Notch signaling [22].
3.1.2 Converting and modifying pre-existing models in StarLogoT
The earlier models made in StarLogoT were required to be converted to NetLogo to save
the models as applets for display on the website.
This required installation of NetLogo version 1.3 on the Mac system (Apple machine).
NetLogo1.3 has inbuilt functionality for backward integration with StarLogoT. The converted
models were then imported to NetLogo2.0.2 application on windows machine and all of the
syntax errors were fixed. Though there was not a real need to convert the models into
NetLogo2.0.2 version as version 1.3 also has capability to save the model as applet; we did the
conversion for future variations in the models that may require the additional functionalities only
provided in the newer version (i.e. version 2.0.2).
3.2 PHASE II: MODELING NEW MODELS
3.2.1 Formation of Isthmic organizer: Xiro1_Model
This model is based on the research conducted by Glavic et al. on Midbrain-hindbrain
boundary (MHB) formation [1]. In their research the researchers show how homeoprotein,
Xenopus Iro gene, Xiro1, is involved in the formation of the isthmic organizer (IsO) that patterns
the midbrain hindbrain domain.
25
Galvic et al. [1] represent a schema that describes the interactions of Xiro1 with other
genes at the MHB boundary (refer appendix 2 for the model). Xiro1 has a different role to play at
different stages, viz: gastrula, late gastrula (or early nerula) and mid nerula. Considering the
dynamicity of these systems it is imprecise to model the entire system and find a mathematical
description of the process. However, if we modularize the process then we can model them
assuming their independence. Hence we model the mid neural stage in the MHB boundary
formation, involving the positioning of isthmic organizer. The interactions at this stage are
shown in the diagram below.
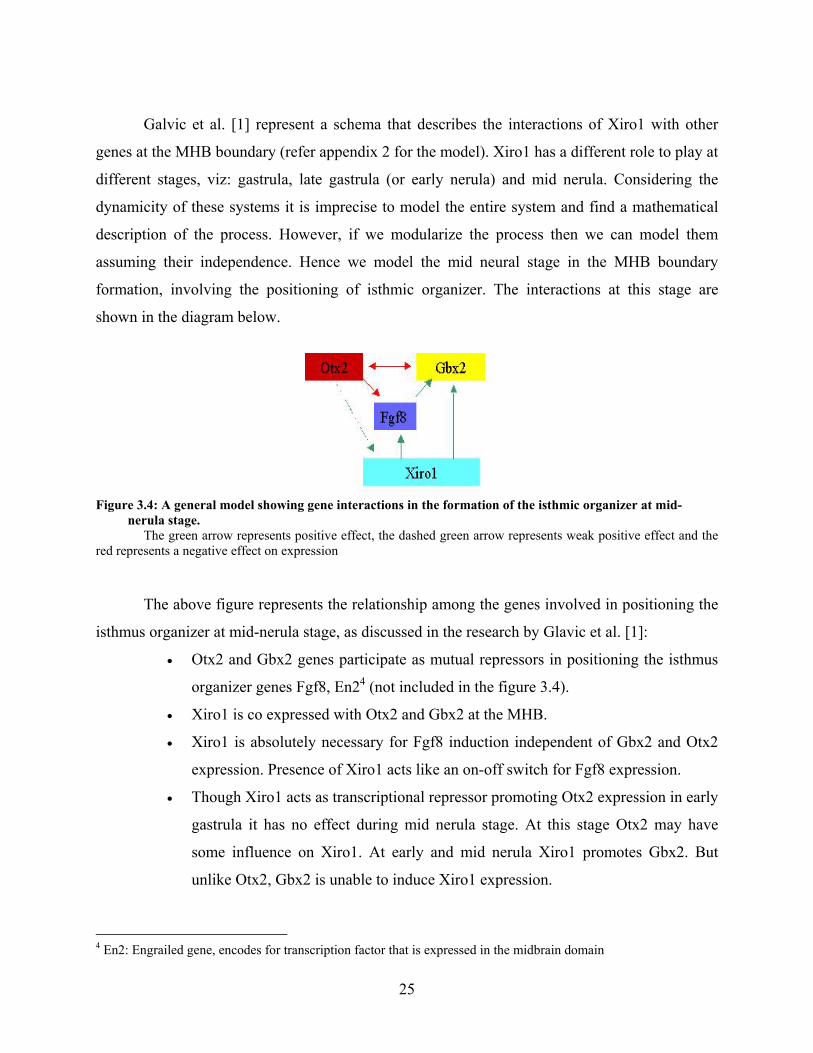
Figure 3.4: A general model showing gene interactions in the formation of the isthmic organizer at mid-
nerula stage. The green arrow represents positive effect, the dashed green arrow represents weak positive effect and the red represents a negative effect on expression
The above figure represents the relationship among the genes involved in positioning the
isthmus organizer at mid-nerula stage, as discussed in the research by Glavic et al. [1]:
• Otx2 and Gbx2 genes participate as mutual repressors in positioning the isthmus
organizer genes Fgf8, En24 (not included in the figure 3.4).
• Xiro1 is co expressed with Otx2 and Gbx2 at the MHB.
• Xiro1 is absolutely necessary for Fgf8 induction independent of Gbx2 and Otx2
expression. Presence of Xiro1 acts like an on-off switch for Fgf8 expression.
• Though Xiro1 acts as transcriptional repressor promoting Otx2 expression in early
gastrula it has no effect during mid nerula stage. At this stage Otx2 may have
some influence on Xiro1. At early and mid nerula Xiro1 promotes Gbx2. But
unlike Otx2, Gbx2 is unable to induce Xiro1 expression.
4 En2: Engrailed gene, encodes for transcription factor that is expressed in the midbrain domain
26
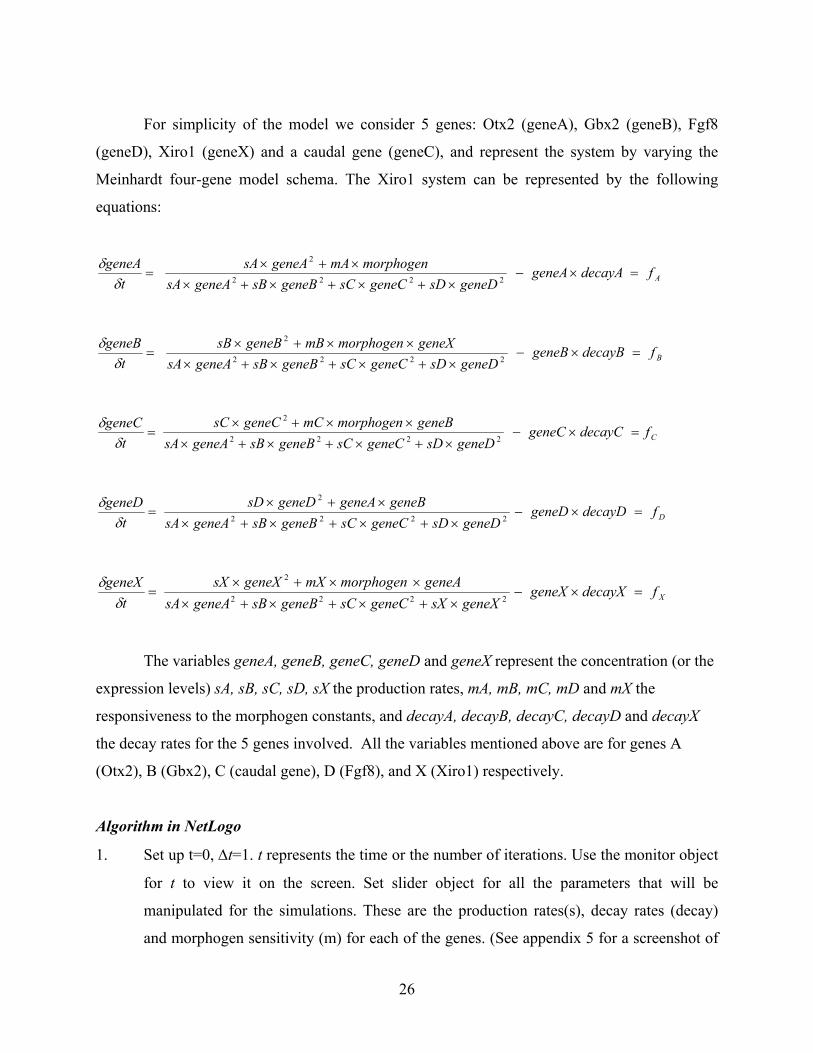
For simplicity of the model we consider 5 genes: Otx2 (geneA), Gbx2 (geneB), Fgf8
(geneD), Xiro1 (geneX) and a caudal gene (geneC), and represent the system by varying the
Meinhardt four-gene model schema. The Xiro1 system can be represented by the following
equations:
AfdecayAgeneAgeneDsDgeneCsCgeneBsBgeneAsA
morphogenmAgeneAsAt
geneA=×−
×+×+×+××+×
= 2222
2
δδ
BfdecayBgeneBgeneDsDgeneCsCgeneBsBgeneAsA
geneXmorphogenmBgeneBsBt
geneB=×−
×+×+×+×××+×
= 2222
2
δδ
CfdecayCgeneCgeneDsDgeneCsCgeneBsBgeneAsA
geneBmorphogenmCgeneCsCt
geneC=×−
×+×+×+×××+×
= 2222
2
δδ
DfdecayDgeneDgeneDsDgeneCsCgeneBsBgeneAsA
geneBgeneAgeneDsDt
geneD=×−
×+×+×+××+×
= 2222
2
δδ
XfdecayXgeneXgeneXsXgeneCsCgeneBsBgeneAsA
geneAmorphogenmXgeneXsXt
geneX=×−
×+×+×+×××+×
= 2222
2
δδ
The variables geneA, geneB, geneC, geneD and geneX represent the concentration (or the
expression levels) sA, sB, sC, sD, sX the production rates, mA, mB, mC, mD and mX the
responsiveness to the morphogen constants, and decayA, decayB, decayC, decayD and decayX
the decay rates for the 5 genes involved. All the variables mentioned above are for genes A
(Otx2), B (Gbx2), C (caudal gene), D (Fgf8), and X (Xiro1) respectively.
Algorithm in NetLogo
1. Set up t=0, ∆t=1. t represents the time or the number of iterations. Use the monitor object
for t to view it on the screen. Set slider object for all the parameters that will be
manipulated for the simulations. These are the production rates(s), decay rates (decay)
and morphogen sensitivity (m) for each of the genes. (See appendix 5 for a screenshot of
27
the model setup). For the morphogen set up sliders for the source (max morphogen) and
the baseline.
2. Set up on-off switch to represent presence or absence of Xiro1 in the system.
3. Set the initial level of the gene parameters. Set up the morphogen gradient.
4. Set the concentration of gene under the condition that Xiro1 is present.
geneAfttgeneAtgeneA ×∆+=+ )()1( ……. (Gbx2)
geneBfttgeneBtgeneB ×∆+=+ )()1( ……. (Otx2)
geneCfttgeneCtgeneC ×∆+=+ )()1( ……. (caudal gene)
geneDfttgeneDtgeneD ×∆+=+ )()1( ……. (Fgf8)
geneXfttgeneXtgeneX ×∆+=+ )()1( ……. (Xiro1)
where genef is substituted by the equations shown above for each gene
If Xiro1 is absent (i.e. the switch is off) then fgf8 (geneD) is not produced, and Gbx2
(geneB) production lowers. However, Otx2 (geneA) and caudal gene (geneC) expression
is not affected directly by Xiro1. Under this condition geneA and geneC remain
unchanged and we set the concentration of geneB, geneD and geneX as:
decayBgeneBgeneDsDgeneCsCgeneBsBgeneAsA
morphogenmBgeneBsBgeneBgeneB ×−×+×+×+×
×+×+= 2222
2
0=geneD
0=geneX
5. Increment t for next iteration
Repeat step 4 and 5. Stop once a stable pattern is reached (i.e. no more change is seen in
the pattern).
The model so developed simulated the gene interaction and helped in the study of the
emergent properties and analysis of the effect of variation in the parameters (or the genes)
involved.
28
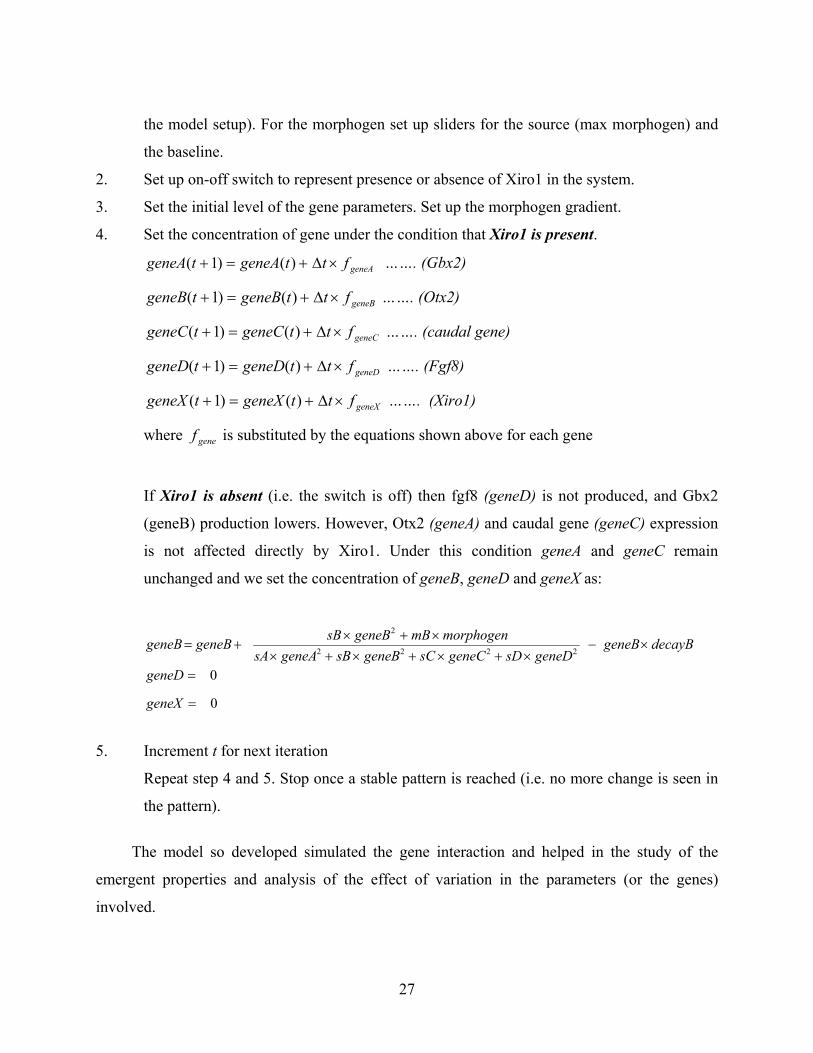
Result Figure 3.5: Modeling gene patterning in formation of the Midbrain-hindbrain boundary (Xiro1 Model)
Fig 3.5 (a): Spatial expression of the MHB genes Fig 3.5 (b): Plot of expression level of MHB genes
corresponding to a given position in (a). We made the field size = 50
Table 3.2: Parameter Values used in the simulation of the Xiro1 model
Gene Parameter A
(Otx2) B
(Gbx2) C
(caudal ) D
(fgf8) X
(Xiro1) Production Rate (s) 1.1 1.6 2.4 2.1 2
Decay Rate (decay) 0.1 0.1 0.1 0.1 0.1
Importance of Morphogen (m) 2.6 1.95 1.25 1.55 2
Max. Morphogen (source) 7
Morphogen baseline 0
The result of the NetLogo mathematical model is in close proximity to the experimental
based model [see appendix 2] as represented by Glavic et al. [1]. This affirmed the correct
hypothesis for modeling the system. However, the system modeled only the mid-nerula stage
wherein we brutally assumed the presence of a certain level of Otx2 and Xiro1 already present in
29
the system. The model developed was not fully robust to model the development of the Isthmic
organizer from the start to the end stage of its formation i.e. the gastrula stage to the mid-nerula
stage.
Observations
The Xiro1 model was simulated to test if the observations that were reported by the
researchers in their Xiro1 molecular experiments could also be seen in the modeled system.
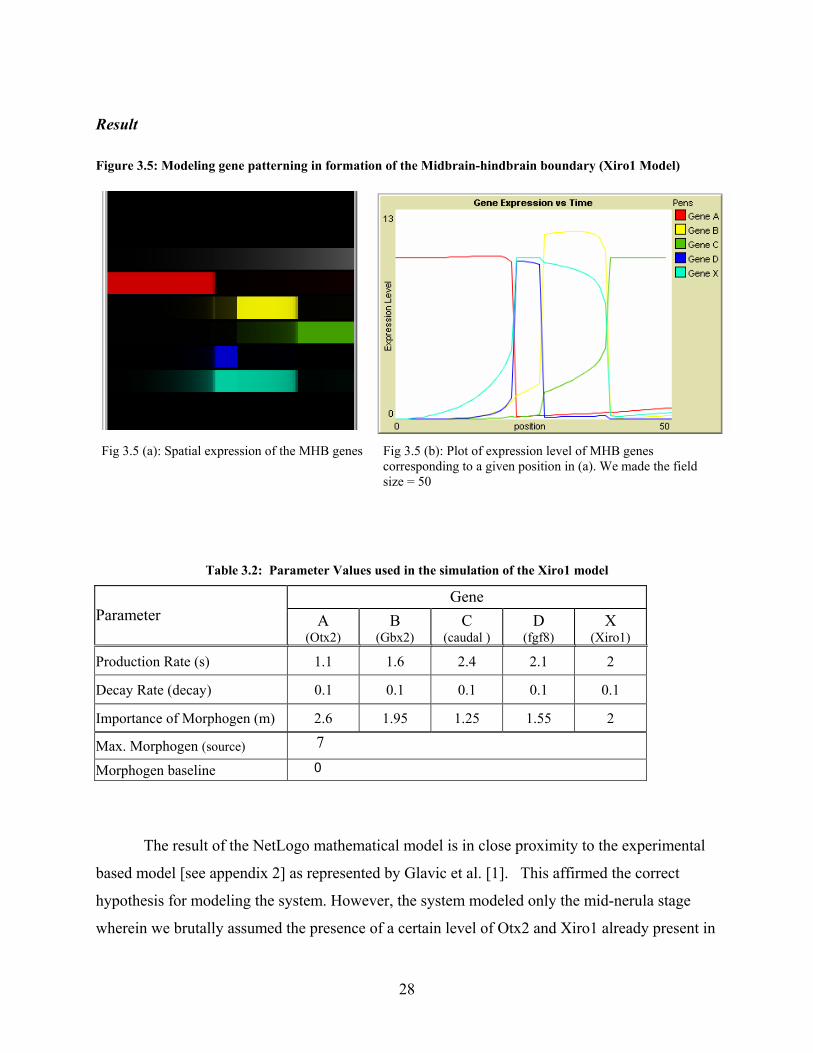
Case 1: Xiro1 is switched off Figure 3.6: Gene Expression pattern of MHB genes in absence of Xiro1
Fig 3.6 (a): Spatial expression of the MHB genes Fig 3.6 (b): Plot of expression level of MHB genes corresponding to a given position in (a)
In our model we remove Xiro1 from the system by changing the on/off switch from on to
off position before we start simulation of the model. As hypothesized there is no expression of
Fgf8 (geneD), since Xiro1 acts as an on/off switch for stimulating Fgf8 production and also there
is very low expression of Gbx8 (geneB). This is consistent with the observations reported by
Glavic et al. [1].
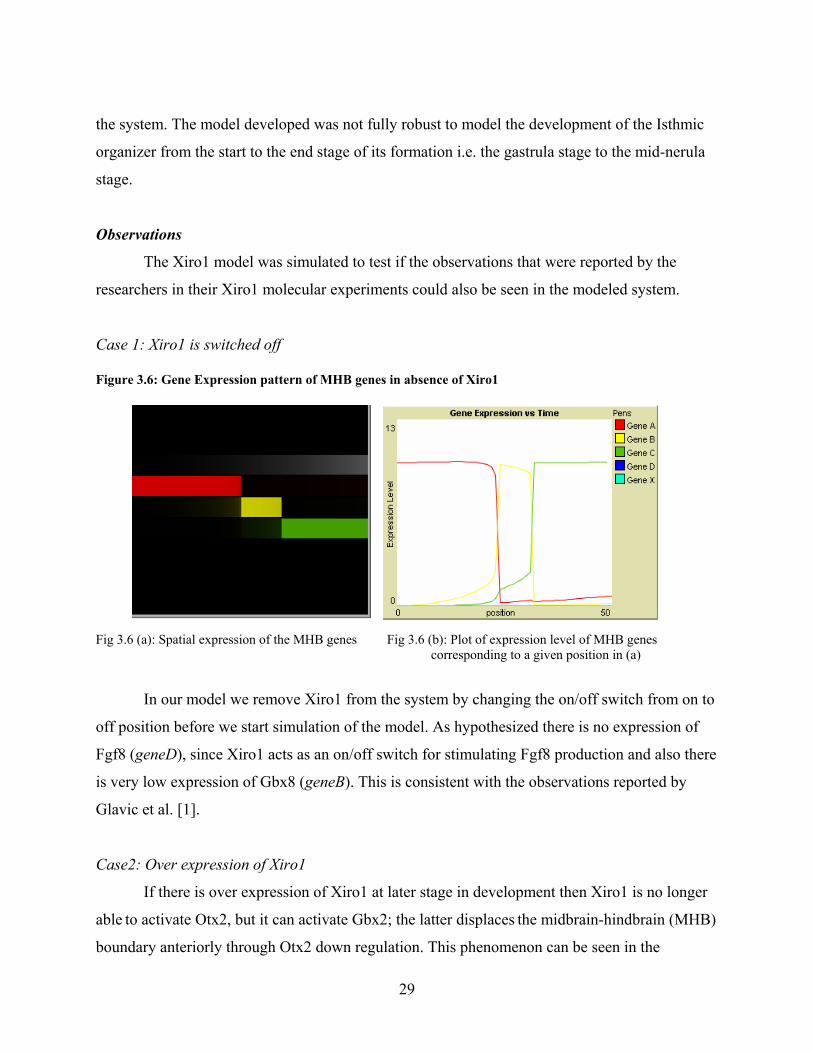
Case2: Over expression of Xiro1
If there is over expression of Xiro1 at later stage in development then Xiro1 is no longer
able to activate Otx2, but it can activate Gbx2; the latter displaces the midbrain-hindbrain (MHB)
boundary anteriorly through Otx2 down regulation. This phenomenon can be seen in the
30
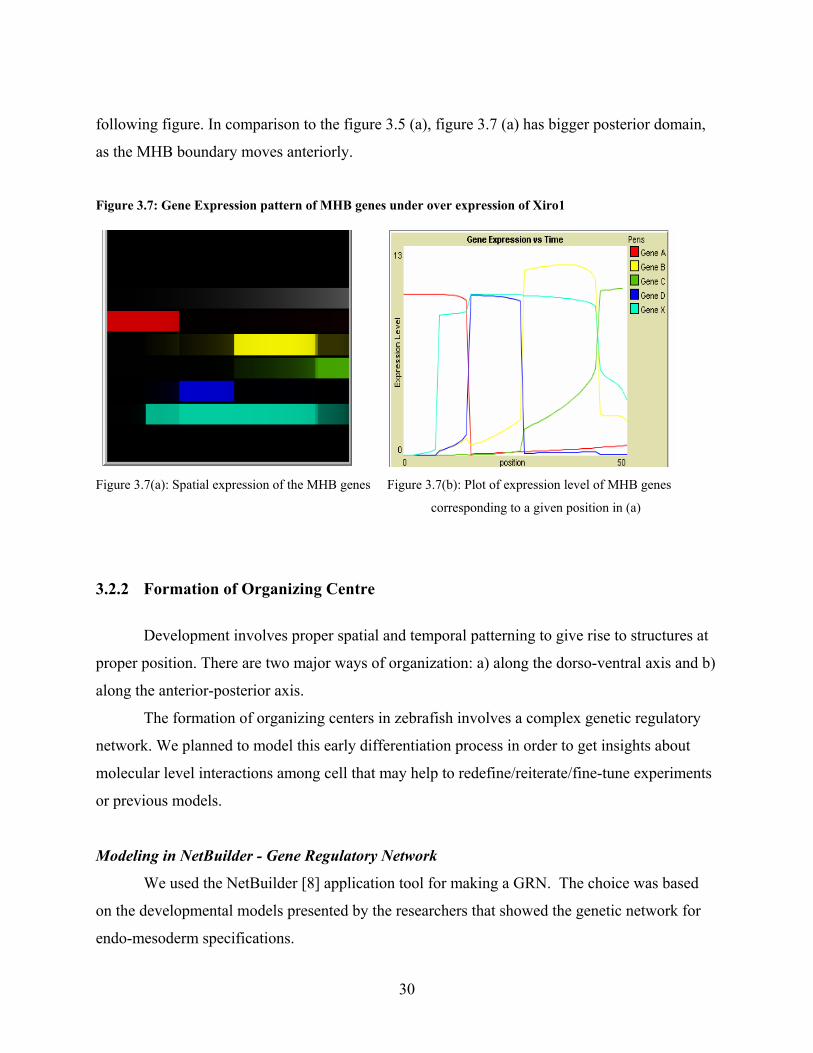
following figure. In comparison to the figure 3.5 (a), figure 3.7 (a) has bigger posterior domain,
as the MHB boundary moves anteriorly.
Figure 3.7: Gene Expression pattern of MHB genes under over expression of Xiro1
Figure 3.7(a): Spatial expression of the MHB genes Figure 3.7(b): Plot of expression level of MHB genes
corresponding to a given position in (a)
3.2.2 Formation of Organizing Centre
Development involves proper spatial and temporal patterning to give rise to structures at
proper position. There are two major ways of organization: a) along the dorso-ventral axis and b)
along the anterior-posterior axis.
The formation of organizing centers in zebrafish involves a complex genetic regulatory
network. We planned to model this early differentiation process in order to get insights about
molecular level interactions among cell that may help to redefine/reiterate/fine-tune experiments
or previous models.
Modeling in NetBuilder - Gene Regulatory Network
We used the NetBuilder [8] application tool for making a GRN. The choice was based
on the developmental models presented by the researchers that showed the genetic network for
endo-mesoderm specifications.
31
In NetBuilder GRN is modeled as a signaling network, in which the components
(gene/promoter/transcription factor) respond to signals. For the component gene the input signal
is the transcription factor that binds to the gene and modulates the transcription rate (output
signal). Network nodes do this transformation.
NetBuilder a failure
After making a few simple test models we could not generate the required model. It is
useful to understand the gene regulation at the genomic level but initially we were more
interested in the visualization of the cellular automata and their interaction, which assists in
forming organizer regions in the zebrafish embryo. NetBuilder did not have this capability. It
could only make a model of Gene network that can be simulated to see the affect of switching on
or off certain signals in the pathway.
Additionally, the program was not very user friendly and it was tedious to set up a
genetic network.
3.2.3 Modeling gene network for organizer development in NetLogo
In Zebrafish there are two organizing centers that form tissue polarity during
morphogenesis. We modeled the formation of these organizing centers based on the Meinhardt’s
theory of activator-inhibitor systems involving reaction-diffusion mechanism and competence
factor. The reaction involves an activator inhibitor system with autocatalysis where an activator
has positive affect autocatalytic effect on its own production and also that of an inhibitor while
an inhibitor does not have any effect on its production though it inhibits activator production.
Diffusion involves activator and inhibitor diffusion in the system with a short range diffusing
activator and a long range diffusing inhibitor. Together with feedback on the source density only
one maximum is formed.
Modeling a single organizing center: Dorso-ventral organizer
The neural tube of zebrafish embryos is, like that of other vertebrates, highly polarized
along its dorso-ventral axis. In the spinal cord, sensory neurons form at dorsal aspects, whereas
32
motor neurons and the floor plate develop at ventro-lateral and ventral positions, respectively,
and interneurons occupy intermediate regions [23].
In Zebrafish neurogenesis patterning it is observed that the regeneration of the organizing
centre can occur. To capture this, we model the component, competence, in the system. It acts
same as source density, however, per se, it is formed by the activator system.
Activator – Inhibitor - Competence system: Meinhardt’s theory was used as a basis to model this
system for zebrafish [7]. We represented the system by the following set of equations:
aDdecayaasaturationi
bacompetence
ta
aaa 2
2
2
))1(
( ∇+×−×+
+=
∂∂
iDdecayibacompetenceti
iii22 )( ∇+×−+×=
∂∂
competencec decaycompetenceba
accompetence ×−++
= 2
2
1*
a-activator, i- inhibitor
ba , bi, bc basic activator , inhibitor and competence production
Da and Di diffusion rates of activator and inhibitor
In terms of the above equations the crucial condition for pattern formation is that the
diffusion of the inhibitor is much higher than that of the activator i.e. the condition Di >> Da
must be fulfilled [7]. As shown by Granero et al. [24] the inhibitor must diffuse at least 7 times
faster than the activator.
Algorithm in Netlogo
1. Set up sliders for the user-defined parameters: decay rates (decay), diffusion rates for
the activator and inhibitor. (See appendix 6 for a screenshot of the model setup).
2. Setup a boundary condition for the system. The system components within the
boundary interact with each other.
3. Set the initial conditions. The decay rate and basic production rate are kept constant.
33
4. Set up the concentration change in the A-I-C system (reaction change) and then
diffuse the activator and the inhibitor based on the strength of diffusion rate values.
5. Repeat step 4 till some stable pattern is observed.
Result
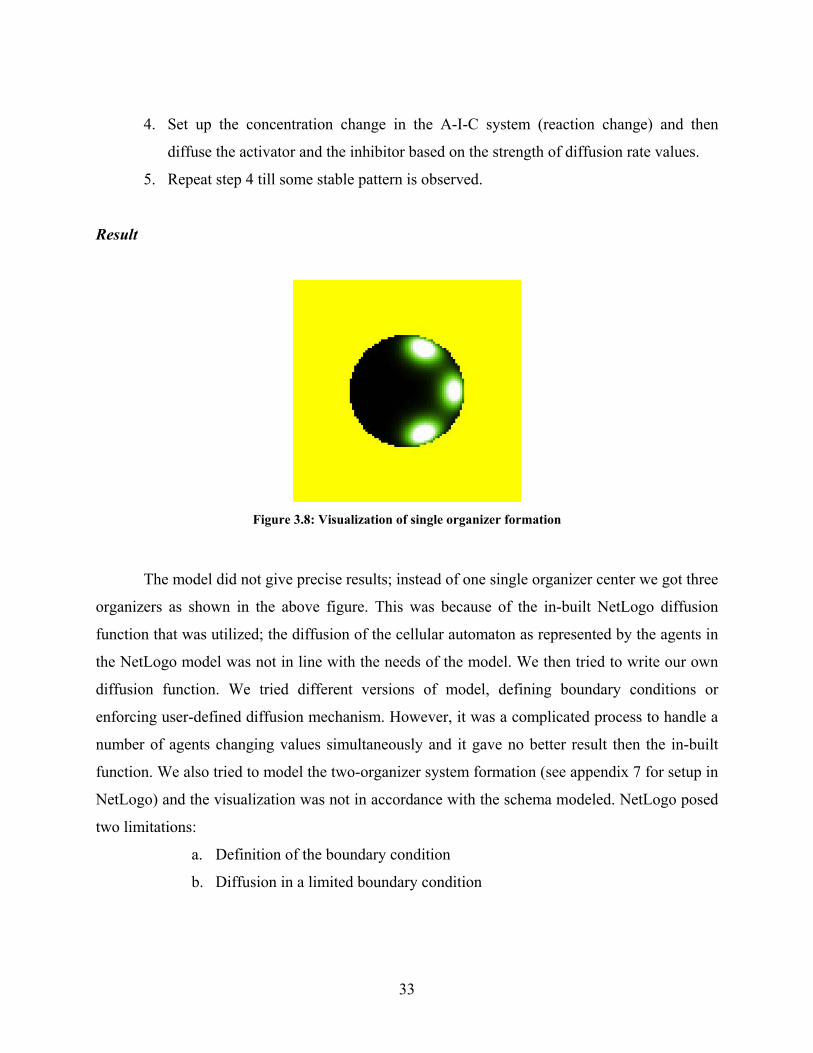
Figure 3.8: Visualization of single organizer formation
The model did not give precise results; instead of one single organizer center we got three
organizers as shown in the above figure. This was because of the in-built NetLogo diffusion
function that was utilized; the diffusion of the cellular automaton as represented by the agents in
the NetLogo model was not in line with the needs of the model. We then tried to write our own
diffusion function. We tried different versions of model, defining boundary conditions or
enforcing user-defined diffusion mechanism. However, it was a complicated process to handle a
number of agents changing values simultaneously and it gave no better result then the in-built
function. We also tried to model the two-organizer system formation (see appendix 7 for setup in
NetLogo) and the visualization was not in accordance with the schema modeled. NetLogo posed
two limitations:
a. Definition of the boundary condition
b. Diffusion in a limited boundary condition
34
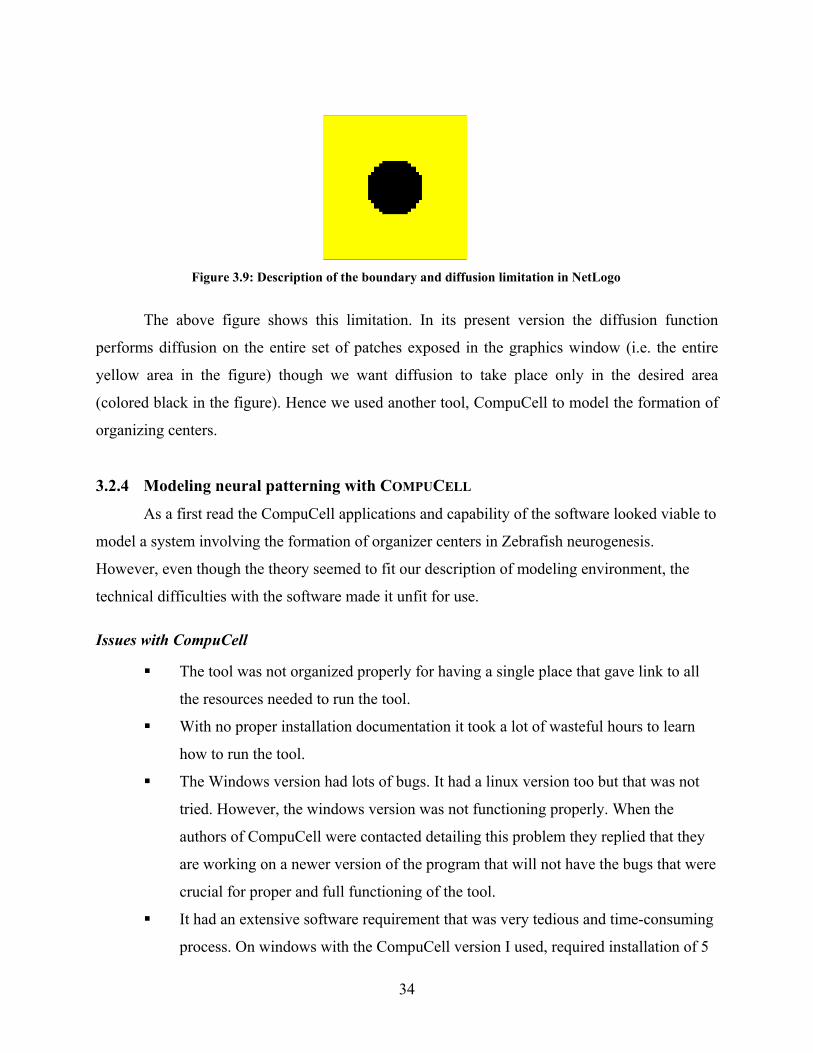
Figure 3.9: Description of the boundary and diffusion limitation in NetLogo
The above figure shows this limitation. In its present version the diffusion function
performs diffusion on the entire set of patches exposed in the graphics window (i.e. the entire
yellow area in the figure) though we want diffusion to take place only in the desired area
(colored black in the figure). Hence we used another tool, CompuCell to model the formation of
organizing centers.
3.2.4 Modeling neural patterning with COMPUCELL
As a first read the CompuCell applications and capability of the software looked viable to
model a system involving the formation of organizer centers in Zebrafish neurogenesis.
However, even though the theory seemed to fit our description of modeling environment, the
technical difficulties with the software made it unfit for use.
Issues with CompuCell
The tool was not organized properly for having a single place that gave link to all
the resources needed to run the tool.
With no proper installation documentation it took a lot of wasteful hours to learn
how to run the tool.
The Windows version had lots of bugs. It had a linux version too but that was not
tried. However, the windows version was not functioning properly. When the
authors of CompuCell were contacted detailing this problem they replied that they
are working on a newer version of the program that will not have the bugs that were
crucial for proper and full functioning of the tool.
It had an extensive software requirement that was very tedious and time-consuming
process. On windows with the CompuCell version I used, required installation of 5
35
different software packages. Some of the tools were difficult to obtain s no proper
links for the appropriate version(s) to be downloaded were available. One of the
requirements was installation of the .NET framework. Luckily, I had a student copy
of the software application with me else it would have been difficult to run
CompuCell. And these requirements were not exhaustively documented. Even after
installation of all the requirements as per information available from user groups the
program was not able to run properly.
Due to the above reasons our work on CompuCell tool was stalled. In September a new
bug-free version of CompuCell as a standalone program was launched. However, this newer
version has not been tried due to time constraints.
3.3 PHASE III: PRESENTING THE LEARNING
My final task was to make a dynamic website for the Chitnis lab at Unit of Vertebrate
and Neural Development, NICHD. Though I started coding during the last part of my internship
the process of collecting information started quite early. During free time and breaks my guide
would explain to me the contents and the basic design of the website. Infact, it was quite an
experience to take down notes while he used to give me detail explanations about the various
aspects he wanted to present on the web. The notes where then organized into prototype web
pages that were subsequently modified based on suggestions of my guide and other lab
researchers.
The basic idea behind making the website was to showcase the research activities of the
lab to other researchers and students, for generating their interest, which might help in
collaborative work in future.
3.3.1 Web Development
As a first step to website development I made a prototype of the various feature content
pages that were needed. Once the prototype was approved I compiled the information into a fully
functional website (view appendix 10,11 for screen shots of the web pages).
36
Software used: Microsoft FrontPage, Dreamweaver, Photoshop for making pictures for
the website, NetLogo 2.0.2 for converting models to applet
The programming mainly involved HTML, JavaScript and style sheets (for giving a
uniform look to all the pages).
3.3.2 Showcasing the NetLogo models: Converting to applet
The applet requires Java 1.4.1 or higher to run. It will not run on Windows 95 or Mac OS
8 or 9. Mac users must have OS X 10.2.6 or higher and use a browser that supports Java 1.4
applets. On other operating systems, one may obtain the latest Java plug-in from Sun's Java site
(http://java.sun.com/getjava/download.html).
To convert to applet the model file and the file NetLogoLite.jar must all be in the same
directory. One can create a separate model folder and can make applets by copying
NetLogoLite.jar from the directory in which NetLogo is installed into the directory where models
are placed. A number of models depicting various processes involved in neural development
were converted into applets. Among these two of the models, made by earlier intern Ei-Ei Gaw
[22] need mention as they relate to the models and Meinhardt schemas as presented in this report
and were used in our study.
i) Delta Notch signaling model
This model is based on the idea of autocatalysis and lateral inhibition (as seen earlier in
the four-gene, model). In developing embryo cells express an “activator” that promotes neural
fate and drives its own expression. When the level of activator exceeds some defined threshold
cells become neurons; however, all cells that initially express activator do not become neurons
because of lateral inhibition provided by delta-notch signaling. The signaling process stimulates
her5 gene expression and the latter acts as an inhibitor, inhibiting activator in neighboring cells.
5 Her – Her genes are family of receptors that are involved in signaling pathways. In development they are expressed during somatogenesis in the nodal network.
37
There were many different versions made of this model that helped in understanding
various aspects and models. For display on the website, the model was converted into applet and
interactive help buttons were added [see appendix 8].
ii.) AP Patterning model
This model is to explore how gene expression patterns may form under the influence of a
morphogen gradient. Here there is slight modification in determination of the morphogen
gradient; it is not calculated as a simple straight-line distribution but as a function of the
morphogen and tcf36 gene expression levels. The effective morphogen gradient is proportional to
morphogen and inversely proportional to tcf3 [see appendix 9 for the model setup in NetLogo].
The above models were studied as they were supposed to be modified, incorporating
growth and formation of organizer center that would influence the gene expression as an
emergent property. However, since the modeling of growth and organizer center formation was
not achieved in NetLogo, we could not do the integration and modification in the above models.
6 Tcf3 (Transcription factor 3) – homeobox gene involved as transcriptional repressor for axis induction in early embryo. Involved in a form of pre-B-cell acute lymphoblastic leukemia.
38
SECTION 4
CONCLUSIONS
4.1 CONCLUSION
The process of neural development, from a mathematical perspective, is seen as a
combination of various sub processes; and for modeling, each of these processes is hypothesized
to be independent. Identifying the various factors, and their parameters, influencing the model or
the biological process follows this. For example modeling the process of neurogenesis might
involve identifying how a uniform environment in the embryo breaks symmetry and develops
specific differentiated neural cells and tissues. From a biological perspective the same study may
involve investigating what genes are promoting and suppressing each other, and how the proteins
they encode interact. My internship was an effort to understand both the aspects and use them in
a synergistic manner to improve understanding of the neural development process at molecular
level.
We have studied various models that can be matched to different processes involved in
the development. The reaction-diffusion mechanism forms patterns that are transient since they
depend on the size and the geometry of the fields. Since both size and geometry change during
development this model can be used in describing formation of a morphogen gradient wherein
the graded concentration profiles are created by reaction-diffusion mechanisms and provide
positional information for the cells [2, 26].
The mechanism of autocatalysis and lateral inhibition plays a role both at early and late
stages in the development. During initial stages of development this schema is involved in
initiating the pattern formation. During later stages it again plays an essential role in allowing the
spacing of repetitive structures such as in the somatogenesis (formation of somites) process in
zebrafish. This mechanism was explored in the four-gene model and allows the selection of a
small region out of a larger possible area. This type of pattern formation is based on competition
and external influences. For example the presence of graded morphogen gradient can determine
which region will dominate over others.
39
We next studied the formation of an organizing center that is a primary step in correct
development process. The development of such a center involves generation of polarity from a
more or less homogeneous medium. A reaction in which a short-range autocatalysis is coupled
with a long-range inhibition in presence of competence factor (helps in suppressing secondary
maxima) is able to generate such a pattern in a very reliable and stable way. The mechanism also
accounts for the re-establishment of an “organizing centre” after its unspecific induction.
There are two basic primary organizing centers involved in development in zebrafish.
The first one is along the anterior-posterior (AP) axis that is used for orientation, and the second
one is along the dorso-ventral axis, which is required to organize the dimension perpendicular to
the AP axis. For the developing organism it is essential that both patterns not be parallel to each
other. In my internship, models representing development of the organizer centers could not be
achieved due to the shortcomings of the programs NetBuilder and CompuCell, which were
utilized for modeling and visualization of the system. NetBuilder models a system of cells and
tries to stimulate the gene network. However, our studies were not exactly at the genomic level
hence it was not suited to model the emergence of two different organizing systems. The system
also could not be modeled with CompuCell: a tool made specifically to model and simulate
morphogenesis process, due to bugs in the windows version of the tool. In the NetLogo
environment we achieved partial success in developing a basic model for a single organizer
center. Enhancement of the basic model to incorporate dynamics of growth of the region was
hampered by the limitation of the tool as it did not have a relaxed definition of the in-built
diffusion function and boundary condition as needed by the model describing the formation of
the organizer center.
The mechanisms of pattern formation during development discussed above do not
represent an exhaustive and self-sufficient list to model a complete set of processes involved in
neural development. The intention of this internship was to gain knowledge about neural
developmental process, understand the basics of pattern formation during neural development
using models to study the emergent property, and compare the latter to the observations as seen
in the experimental work. The internship introduced me to the NetLogo programming
environment for observing new results or appreciating the known ones during simulation of the
model.
40
The models developed in NetLogo where found, by computer simulation, to be able to
account in a quantitative way for some initially chosen basic experimental observations. Though
some of the models were not close to the biological system being modeled (e.g.: organizer center
development model), once a model consistent with the experimental observations was
developed, it was also found often to be able to account for additional phenomenon for which it
was not originally designed (e.g.: Four-gene model- observations found for the effect of
removing morphogen at various stages). This of course, does not prove the validity of the model.
However, it does suggest that the models are close to the development process in the biological
system and can help in unveiling of some emergent properties that may not be observed on
experimental desk. The possibilities that can be explored using mathematical and computational
tools in study of developmental biology are many and future work in this area is required to
understand and explore various biological systems and experimental studies all of which aim in
benefiting the human life.
4.2 FUTURE WORK
Some of the work presented in this report, tried for the first time, is at a basic level. These
models can be enhanced to study further details about the neural development processes and
involved gene networks. Basically we have used the Meinhardt equations with little adjustments
to suit our precise model. I feel in future that it may, additionally, be required to understand the
modeling based on theories by other researchers.
Our model of Xiro1 gene, describes the formation of the isthmic organizer (the mid-brain
hindbrain boundary), and shows how the spatial pattering takes place at the mid- neural stage.
This model is made for the interactions at the final stage (the process starts at the gastrula stage)
and takes into account only the major genes; those play a role in the positioning of the isthmic
organizer. The model can be modified and made more robust by incorporating temporal
patterning, i.e. modeling the gene interaction from gastrula stage and letting the system evolve
and grow over time so that the final result that we observe at the nerula stage is an emergent
property of the system. Also the model can be modified to incorporate additional genes like En2
that also play a role in the midbrain hindbrain boundary formation.
41
In the organizer model we were unable to exactly achieve the formation of an organizer
center in NetLogo environment. Future work may involve overcoming the limitations of the
NetLogo environment by exploring various diffusion functions. Though we tried to write our
own diffusion functions the search and effort was not exhaustive. While modeling organizer
region it is important to account for the growth in the size of the regions. This is important in
order to get insight into how cell growth plays a role in pattern formation. We did try to achieve
this but the efforts were not successful. With the new version of CompuCell, for windows
system, being launched one may retry forming the organizer model in this application to explore
how the organizing center leads to specific polarity and patterning during development. One may
also try the Linux version that is bug-free and on which we may get in-built model examples.
The developed website was mostly a static collection of web pages that gave information
about the lab. Apart from exploring the models online, there was not much interaction with the
users. Future work may involve making the website can be made more dynamic and interactive
by incorporating feedback forms, online discussion groups. However, due to time constraints this
feature was not added. Also, in achieving this security issues had to be checked with the NIH IT
division, which would have required a good amount of time. In future the functionality of the
website can be extended by not only making it a showcase of lab activities, but also a
information board wherein various news/upcoming events/seminars can be posted for lab users
and other researchers. To achieve this authorized lab users may be given the administrator access
to update content on the site or, if it is possible (by crosschecking with the IT department about
the server access), one can create the updating of news or posting of events dynamically.
Future work in mathematical modeling of biological processes can play a vital role in
enhancing the understandings of the animal system and the learning can be used to improve
experimental design for molecular level studies. Additionally development of computational
tools for visualization of the model such that the modeling environment acts like a biological
system can help in making the virtual models close to the real system.
42
REFERENCES
1. Glavic A, Gomez-Skarmeta JL, Mayor R. (2002). The homeoprotein Xiro1 is required for
midbrain-hindbrain boundary formation. Development. 2002 Apr; 129(7): 1609-21
2. Meinhardt, Hans. Models of Biological Pattern formation. (1982) Academic Press, London
3. Meinhardt, Hans. The Algorithm beauty of seashells. (1995)
4. Pages F and Kerridge S. (2000) Morphogen gradients. A question of time or concentration? Trends in Genetics.2000 Jan; 16(1): 40-4.
5. Kim, C-H, Oda T, Itoh M, Jiang D, Artinger KB, Chandrasekharappa SC, Driever W, Chitnis AB. Repressor activity of Headless/Tcf3 is essential for vertebrate head formation, Nature.2000 Oct 19; 407:913-6.
6. Wilson SW, Houart C. Early steps in the development of the forebrain. Dev Cell. 2004 Feb; 6(2): 167-81
7. Meinhardt H. Organizer and axes formation as a self-organizing process. Int J Dev Biol. 2001; 45(1): 177-88.
8. Davidson EH, Rast JP, Oliveri P, Ransick A, Calestani C, Yuh CH, Minokawa T, Amore G, Hinman V, Arenas-Mena C, Otim O, Brown CT, Livi CB, Lee PY, Revilla R, Rust AG, Pan Z, Schilstra MJ, Clarke PJ, Arnone MI, Rowen L, Cameron RA, McClay DR, Hood L, Bolouri H. A genomic regulatory network for development. Science.2002 Mar 1; 295(5560): 1669-78.
9. Schilstra, MJ and Bolouri, H. Modelling the regulation of Gene Expression in Genetic Regulatory Networks (NetBuilder Theory) Biocomputation group, Science & Technology Research Centre,University of Hertfordshire, UK
10. Chitnis AB, Itoh M. (2004). Exploring alternative models of rostral–caudal patterning in the zebrafish neurectoderm with computer simulations. Curr Opin Genet Dev.2004 Aug; 14 (4): 415-21.
11. Stemple DL, Vincent JP. Pattern formation and developmental mechanisms: super-models of development. Curr Opin Genet Dev. 2004 Aug; 14(4): 325-7.
43
12. Wurst W, Bally-Cuif L. Neural plate patterning: upstream and downstream of the isthmic organizer. Nat Rev Neurosci. 2001 Feb; 2(2): 99-108.
13. Izaguirre JA, Chaturvedi R, Huang C, Cickovski T, Coffland J, Thomas G, Forgacs G, Alber M, Hentschel G, Newman SA, Glazier JA. CompuCell, a multi-model framework for simulation of morphogenesis. Bioinformatics. 2004 May 1; 20(7): 1129-37. Epub 2004 Feb 05.
14. Turing AM. The Chemical Basis of Morphogenesis. Philosophical Transactions of the Royal Society B (London), 237, 37--72, 1952.
15. Tisue, S., & Wilensky, U. NetLogo: Design and Implementation of a Multi-Agent Modeling Environment. SwarmFest, Ann Arbor, May 9 - 11, 2004.
16. Tisue, S., & Wilensky, U. NetLogo: A Simple Environment for Modeling Complexity. International Conference on Complex Systems, Boston, May 16 - 21, 2004.
17. Wilensky, U. Modeling Nature' s Emergent Patterns with Multi-agent Languages. Proceedings of EuroLogo 2002. Linz, Austria.
18. Wilensky, U. Modeling Emergent Phenomena with StarLogoT . CONCORD.org, Winter 2000.
19. Wilensky, U. & Reisman, K. Learning Biology through Constructing and Testing Computational Theories - an Embodied Modeling Approach. Proceedings of the Second International Conference on Complex Systems. Nashua, 1998, NH: New England Complex Systems Institute.
20. Meinhardt, H. and Gierer, A. Application of a theory of biological pattern formation based on lateral inhibition. J.Cell Sci. 1974 15,321-346.
21. Wilensky, U. (2002). NetLogo. Center for Connected Learning and Computer-Based Modeling. Northwestern University, Evanston, IL. http://ccl.northwestern.edu/netlogo/.
22. Gaw E, Chitnis AB. Simulating gene expression patterns of neurogenesis, somatogenesis and morphogenesis during early zebrafish embryo development. Internship report, Jan 2004, CBS program, Arizona Stage University.
44
23. Blader P, Strahle U. Zebrafish developmental genetics and central nervous system development. Hum Mol Genet. 2000 Apr 12;9(6):945-51.
24. Granero M.I.,Porati A, Zanacca D. (1977). A bifurcation analysis of pattern formation in a
diffusion governed morphogenetic field. J. Math. Biology.1977; 4, 21-27
25. Meinhardt H. “ SP program for modeling simulation”. Free software tool available with the book “The Algorithmic beauty of sea shells”
26. Max-Planck-Institut für Entwicklungsbiologie, “Meinhardt webpage” http://www.eb.tuebingen.mpg.de/dept4/meinhardt/biuprog.html (Sept 2004)
27. Meinhardt H. Models of biological pattern formation: common mechanism in plant and animal development. Int J Dev Biol. 1996 Feb; 40(1): 123-34.
28. Wilson PA, Hemmati-Brivanlou A. Vertebrate neural induction: inducers, inhibitors and a new synthesis. Neuron. 1997 May; 18, 699–710.
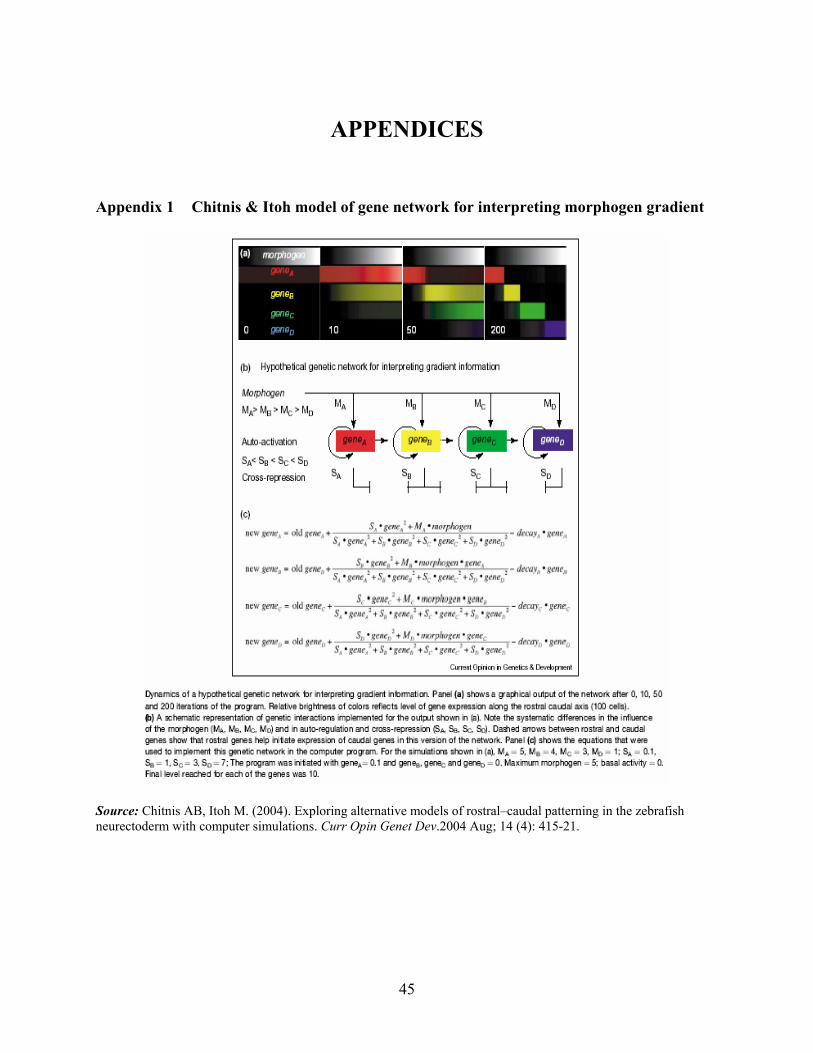
45
APPENDICES
Appendix 1 Chitnis & Itoh model of gene network for interpreting morphogen gradient
Source: Chitnis AB, Itoh M. (2004). Exploring alternative models of rostral–caudal patterning in the zebrafish neurectoderm with computer simulations. Curr Opin Genet Dev.2004 Aug; 14 (4): 415-21.
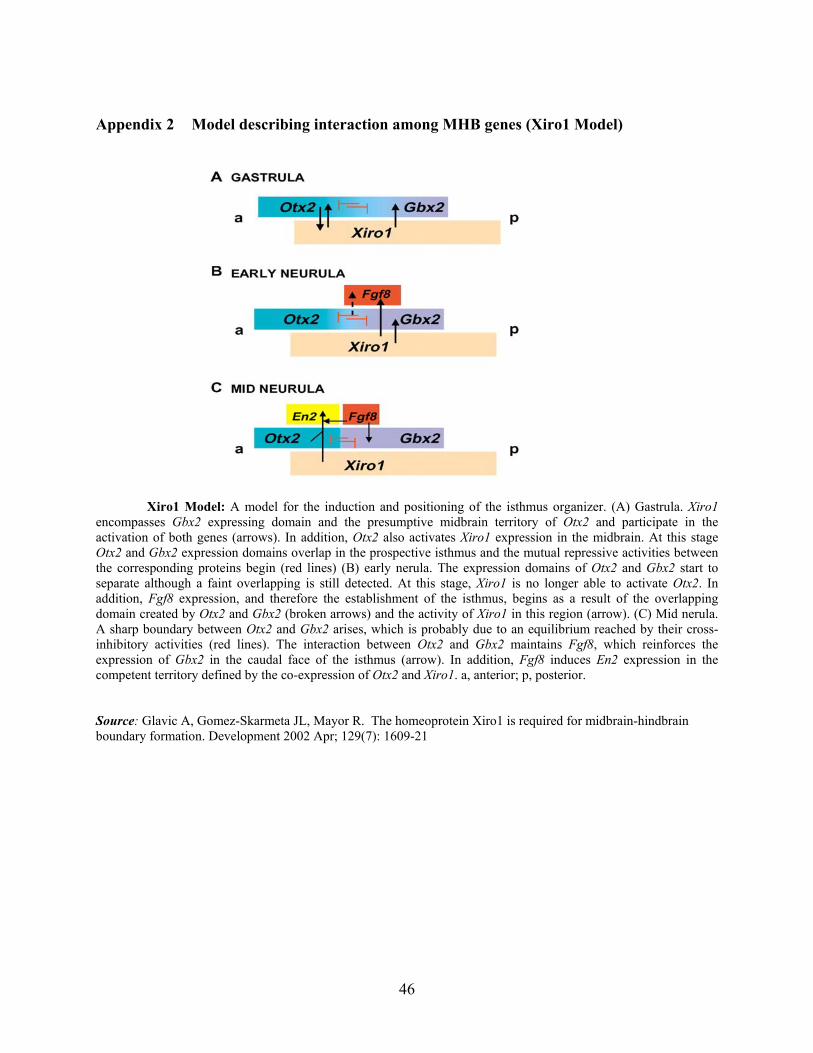
46
Appendix 2 Model describing interaction among MHB genes (Xiro1 Model)
Xiro1 Model: A model for the induction and positioning of the isthmus organizer. (A) Gastrula. Xiro1
encompasses Gbx2 expressing domain and the presumptive midbrain territory of Otx2 and participate in the activation of both genes (arrows). In addition, Otx2 also activates Xiro1 expression in the midbrain. At this stage Otx2 and Gbx2 expression domains overlap in the prospective isthmus and the mutual repressive activities between the corresponding proteins begin (red lines) (B) early nerula. The expression domains of Otx2 and Gbx2 start to separate although a faint overlapping is still detected. At this stage, Xiro1 is no longer able to activate Otx2. In addition, Fgf8 expression, and therefore the establishment of the isthmus, begins as a result of the overlapping domain created by Otx2 and Gbx2 (broken arrows) and the activity of Xiro1 in this region (arrow). (C) Mid nerula. A sharp boundary between Otx2 and Gbx2 arises, which is probably due to an equilibrium reached by their cross-inhibitory activities (red lines). The interaction between Otx2 and Gbx2 maintains Fgf8, which reinforces the expression of Gbx2 in the caudal face of the isthmus (arrow). In addition, Fgf8 induces En2 expression in the competent territory defined by the co-expression of Otx2 and Xiro1. a, anterior; p, posterior.
Source: Glavic A, Gomez-Skarmeta JL, Mayor R. The homeoprotein Xiro1 is required for midbrain-hindbrain boundary formation. Development 2002 Apr; 129(7): 1609-21
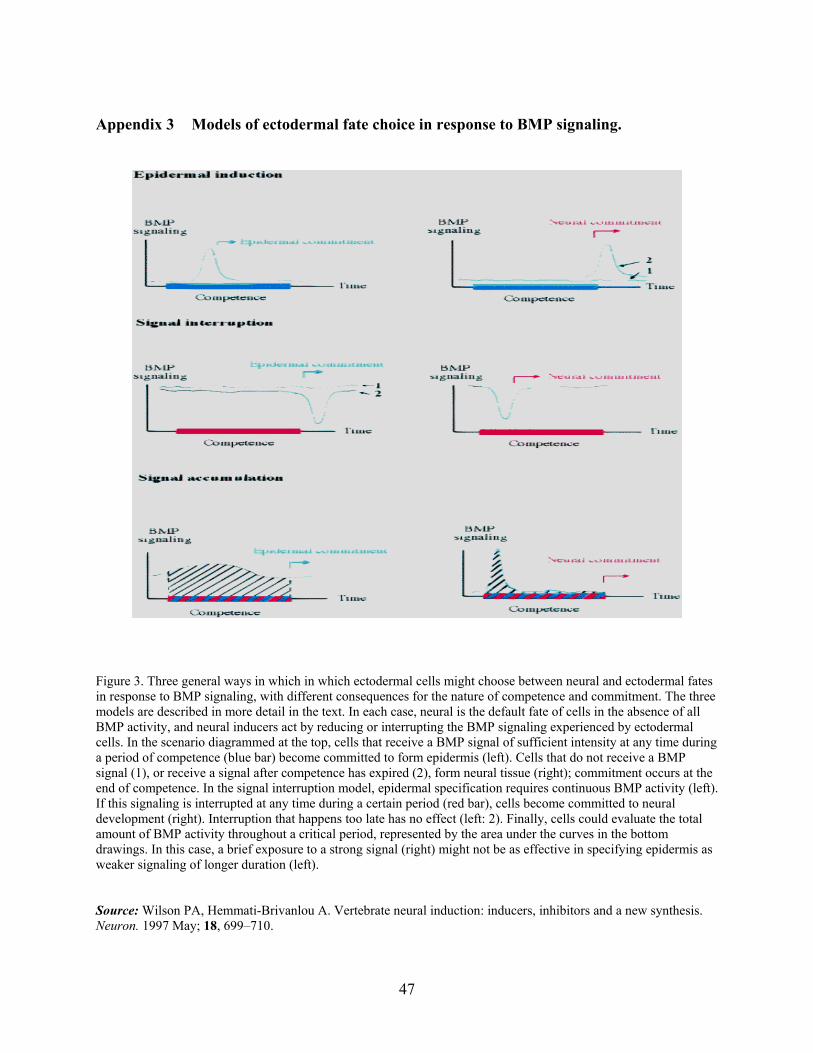
47
Appendix 3 Models of ectodermal fate choice in response to BMP signaling.
Figure 3. Three general ways in which in which ectodermal cells might choose between neural and ectodermal fates in response to BMP signaling, with different consequences for the nature of competence and commitment. The three models are described in more detail in the text. In each case, neural is the default fate of cells in the absence of all BMP activity, and neural inducers act by reducing or interrupting the BMP signaling experienced by ectodermal cells. In the scenario diagrammed at the top, cells that receive a BMP signal of sufficient intensity at any time during a period of competence (blue bar) become committed to form epidermis (left). Cells that do not receive a BMP signal (1), or receive a signal after competence has expired (2), form neural tissue (right); commitment occurs at the end of competence. In the signal interruption model, epidermal specification requires continuous BMP activity (left). If this signaling is interrupted at any time during a certain period (red bar), cells become committed to neural development (right). Interruption that happens too late has no effect (left: 2). Finally, cells could evaluate the total amount of BMP activity throughout a critical period, represented by the area under the curves in the bottom drawings. In this case, a brief exposure to a strong signal (right) might not be as effective in specifying epidermis as weaker signaling of longer duration (left). Source: Wilson PA, Hemmati-Brivanlou A. Vertebrate neural induction: inducers, inhibitors and a new synthesis. Neuron. 1997 May; 18, 699–710.
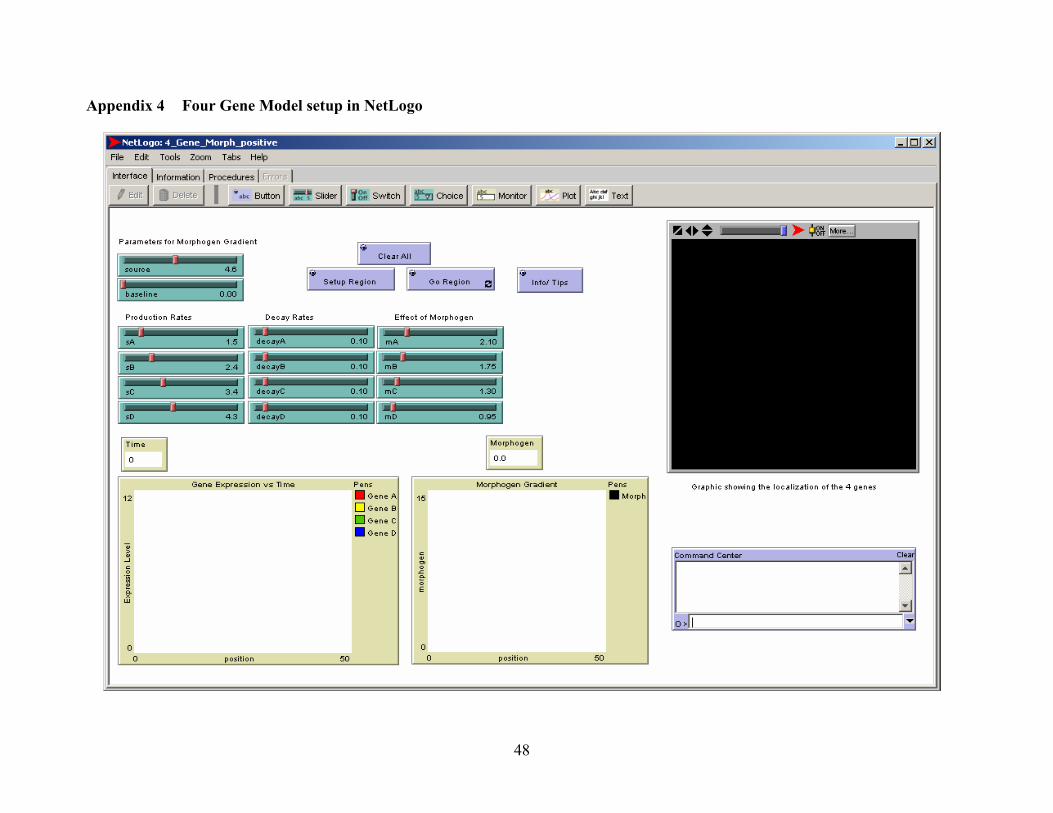
48
Appendix 4 Four Gene Model setup in NetLogo
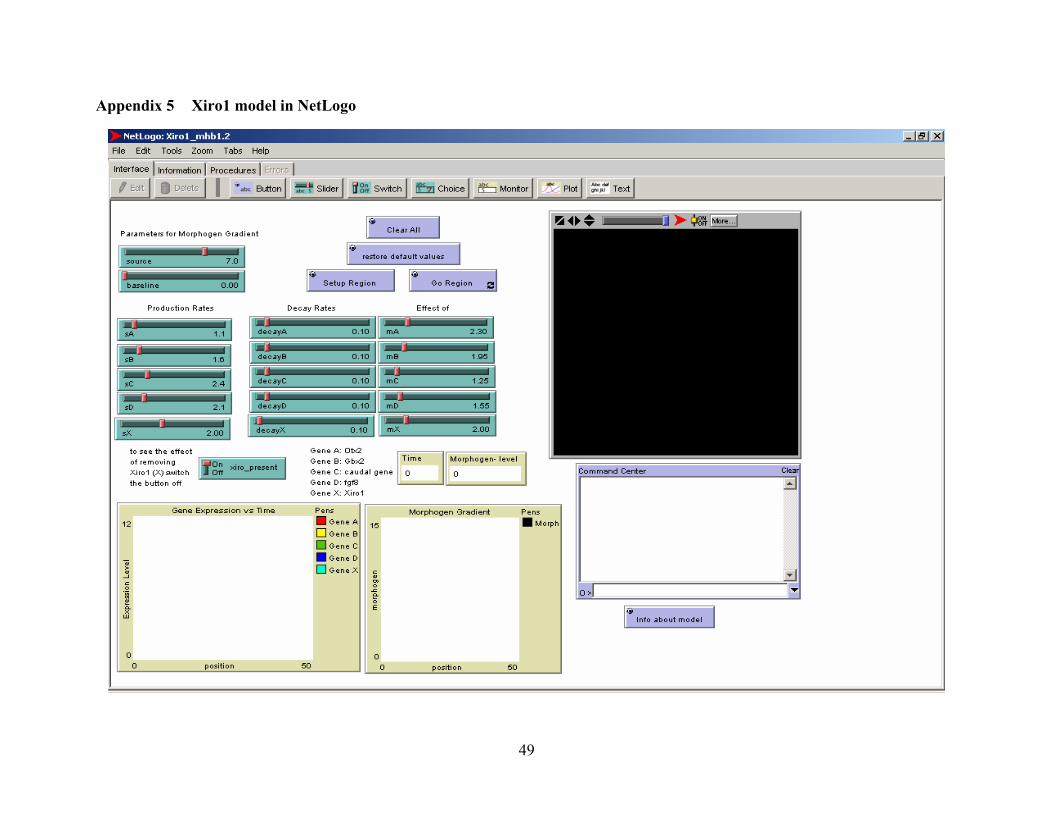
49
Appendix 5 Xiro1 model in NetLogo
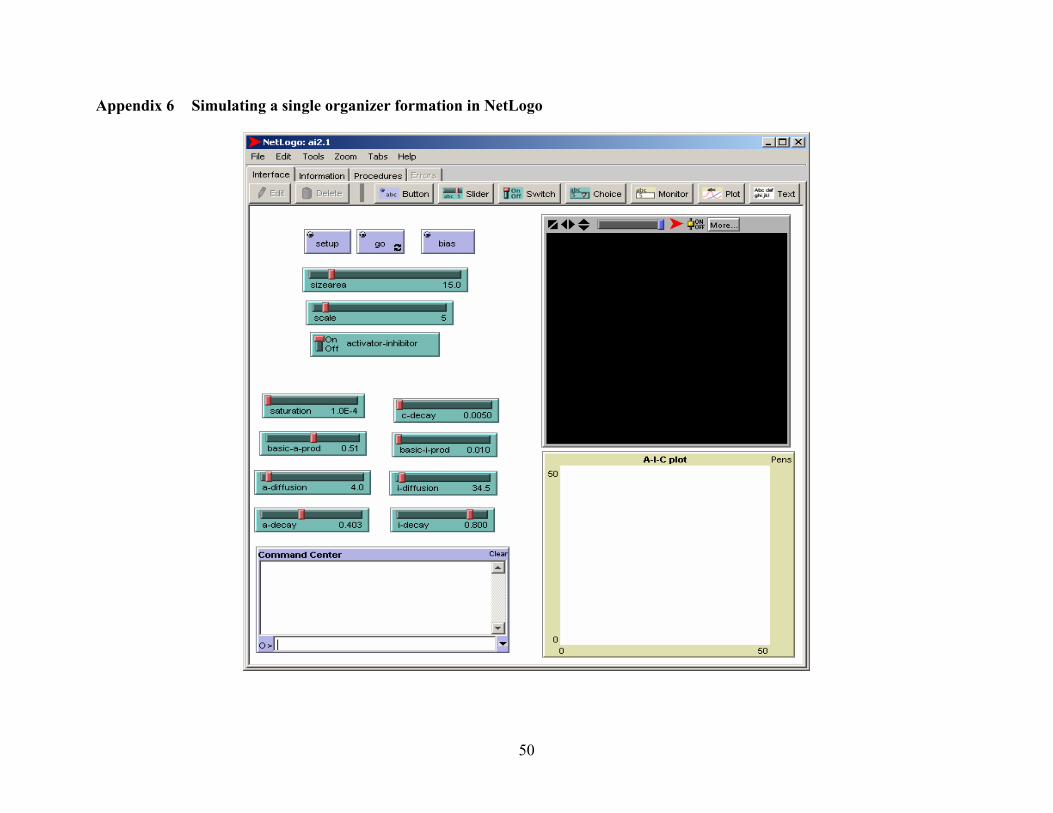
50
Appendix 6 Simulating a single organizer formation in NetLogo
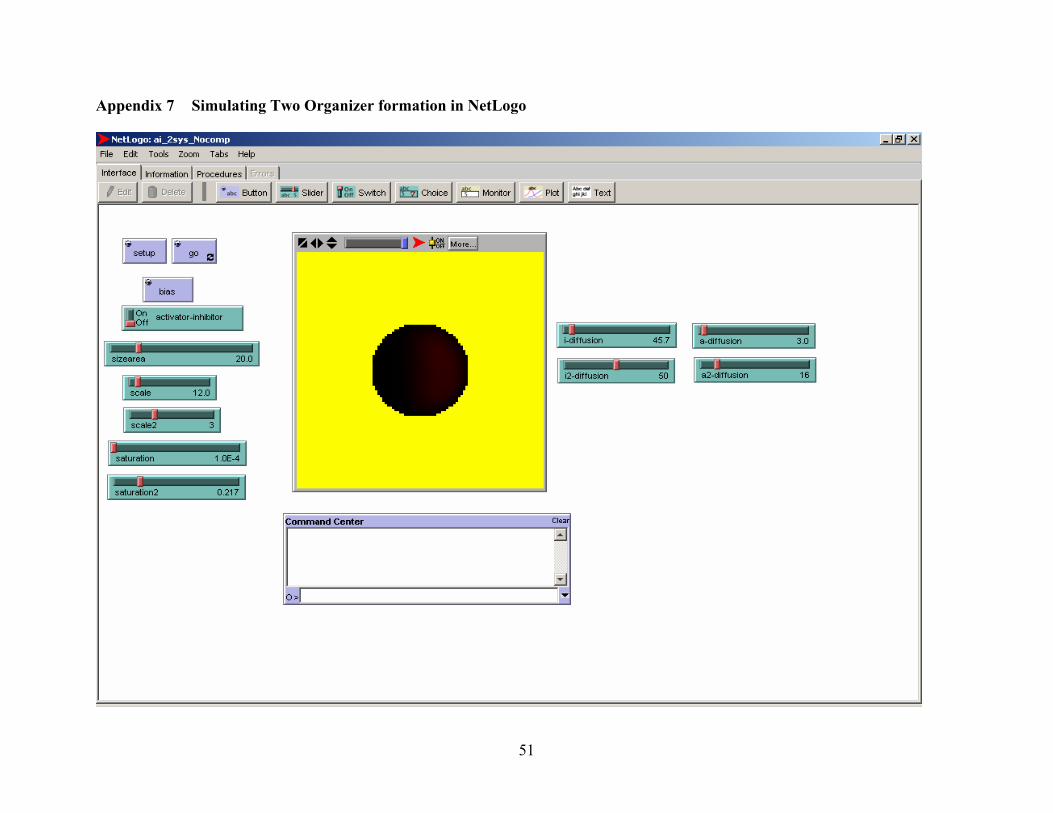
51
Appendix 7 Simulating Two Organizer formation in NetLogo
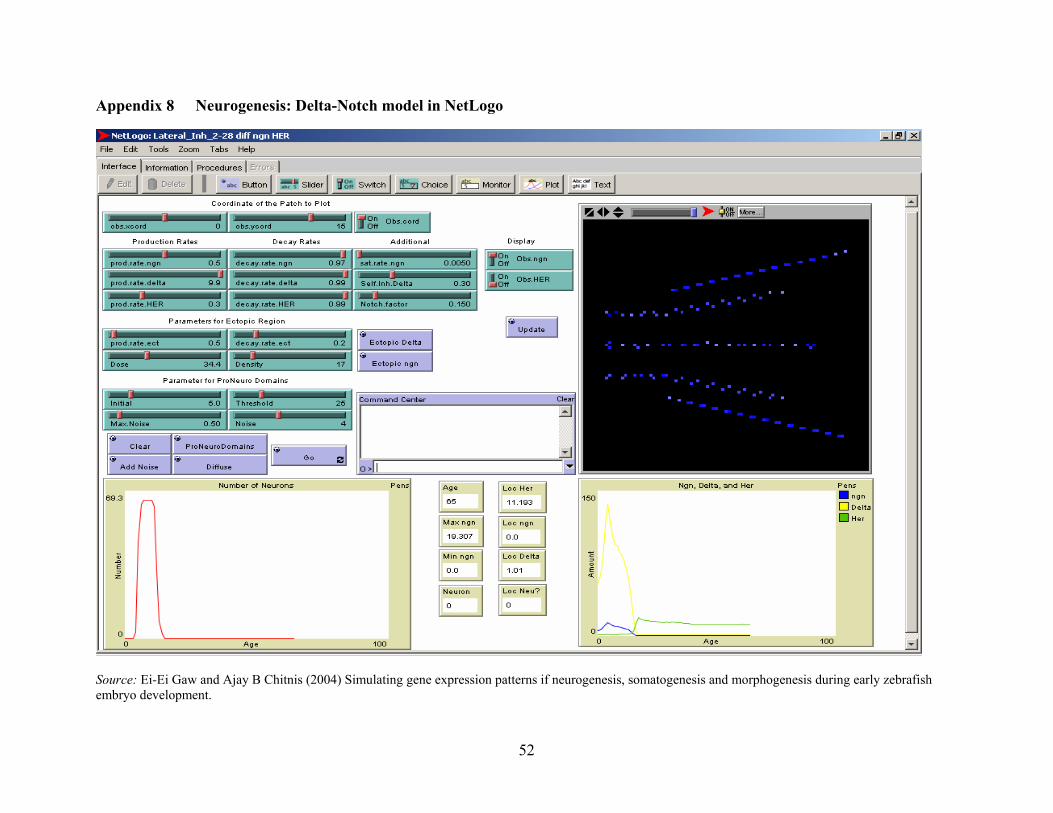
52
Appendix 8 Neurogenesis: Delta-Notch model in NetLogo
Source: Ei-Ei Gaw and Ajay B Chitnis (2004) Simulating gene expression patterns if neurogenesis, somatogenesis and morphogenesis during early zebrafish embryo development.
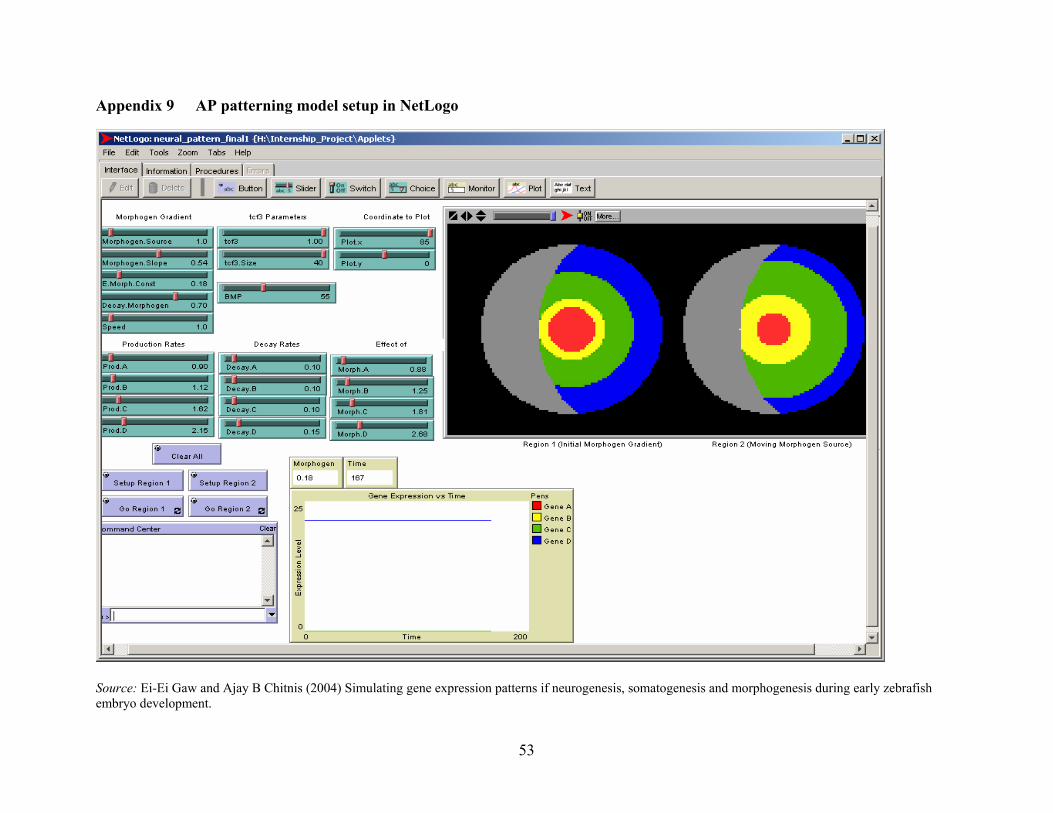
53
Appendix 9 AP patterning model setup in NetLogo
Source: Ei-Ei Gaw and Ajay B Chitnis (2004) Simulating gene expression patterns if neurogenesis, somatogenesis and morphogenesis during early zebrafish embryo development.
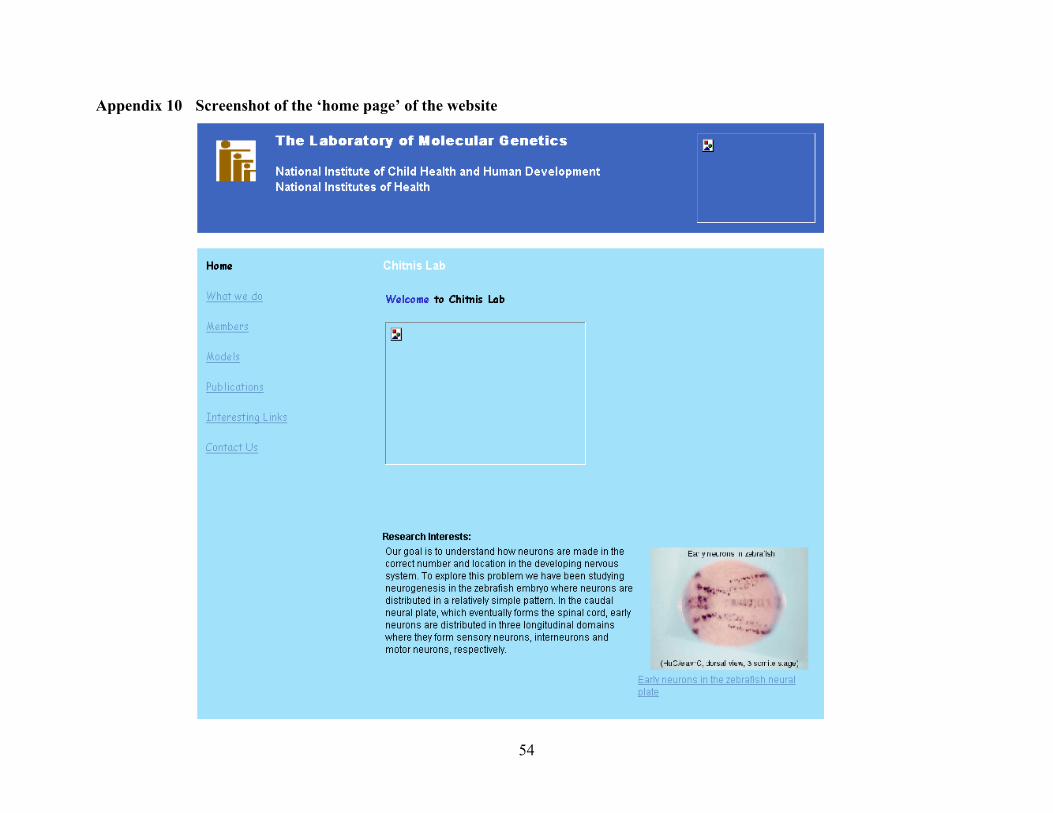
54
Appendix 10 Screenshot of the ‘home page’ of the website
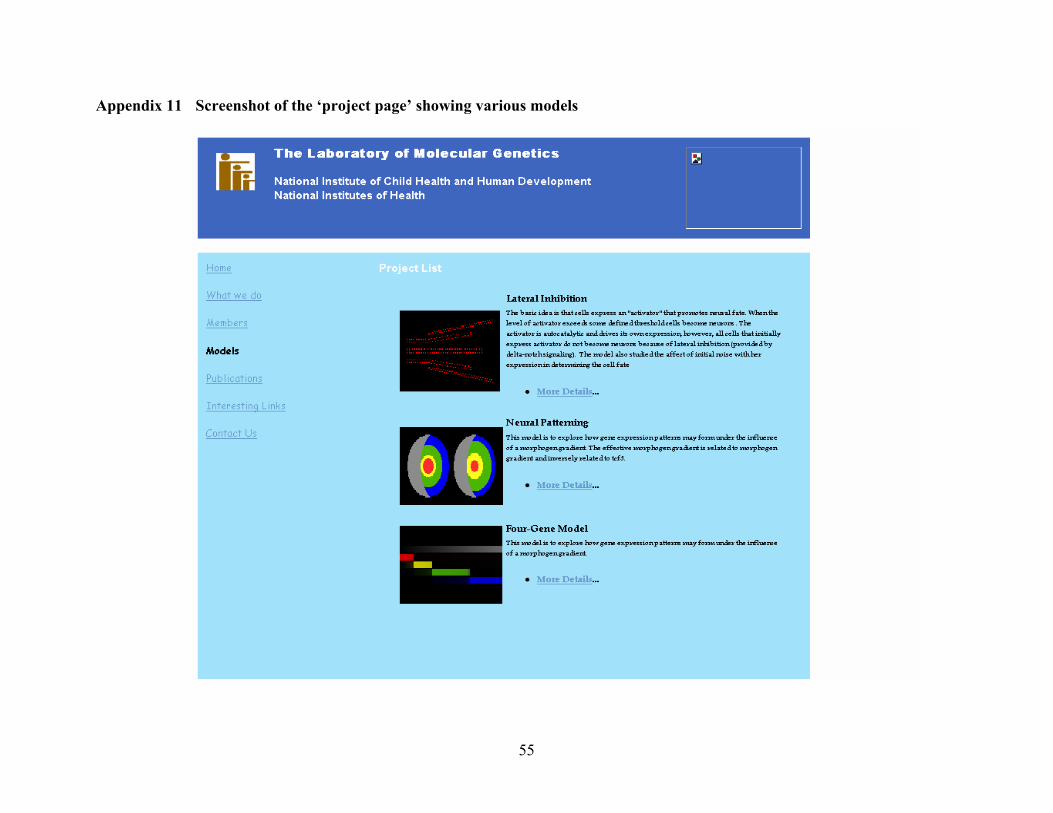
55
Appendix 11 Screenshot of the ‘project page’ showing various models