Embed Size (px)
Citation preview
A hierarchical unsupervised growing neural network for clustering gene
expression patternsJavier Herrero, Alfonso Valencia & Joaquin Dopazo
Seminar “Neural Networks in Bioinformatics” by Barbara Hammer
Presentation by Nicolas NeubauerJanuary, 25th, 2003
25.1.2002 SOTA 2
Topics
• IntroductionIntroduction– MotivationMotivation– RequirementsRequirements
• Parent Techniques and their Problems
• SOTA
• Conclusion
25.1.2002 SOTA 3
Motivation
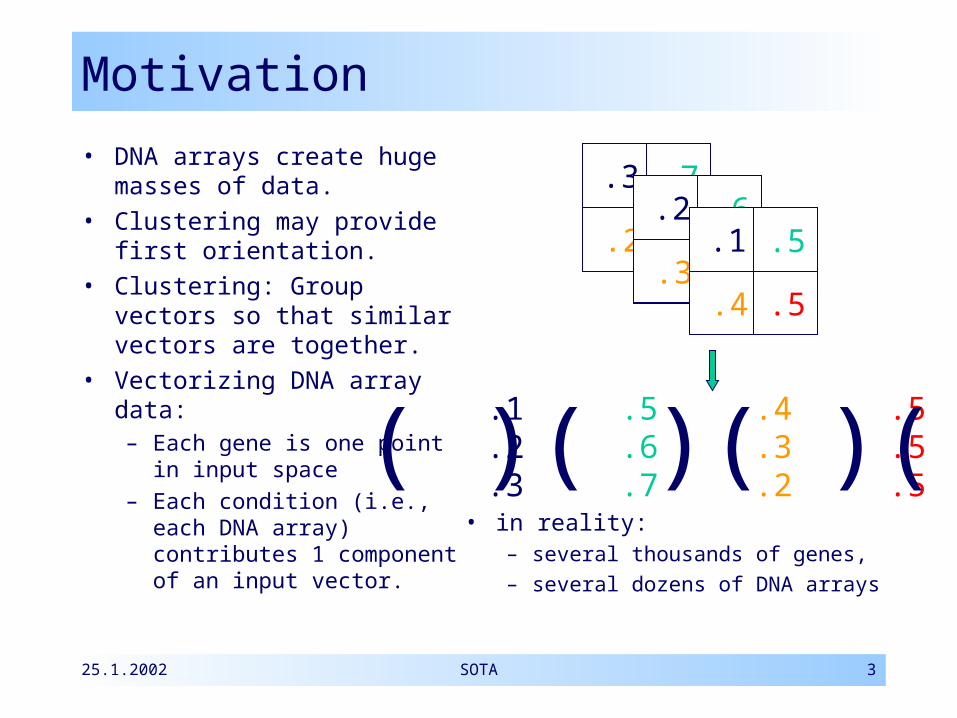
• DNA arrays create huge masses of data.
• Clustering may provide first orientation.
• Clustering: Group vectors so that similar vectors are together.
• Vectorizing DNA array data:– Each gene is one point
in input space– Each condition (i.e.,
each DNA array) contributes 1 component of an input vector.
• in reality: – several thousands of genes,– several dozens of DNA arrays
.3 .7
.2 .5.2 .6
.3 .5.1 .5
.4 .5
.1 .5 .4 .5
.2 .6 .3 .5
.3 .7 .2 .5( )( )( )( )
25.1.2002 SOTA 4
Requirements
• Clustering algorithm should……be tolerant to noise…capture high-level (inter-cluster) relations…be able to scale topology based on
• topology of input data• users’ required level of detail
• Clustering is based on similarity measure – Biological sense of distance function must
be validated
25.1.2002 SOTA 5
Topics
• Introduction
• Parent Techniques and their ProblemsParent Techniques and their Problems– Hierarchical ClusteringHierarchical Clustering– SOMSOM
• SOTA
• Conclusion
25.1.2002 SOTA 6
Hierarchical Clustering
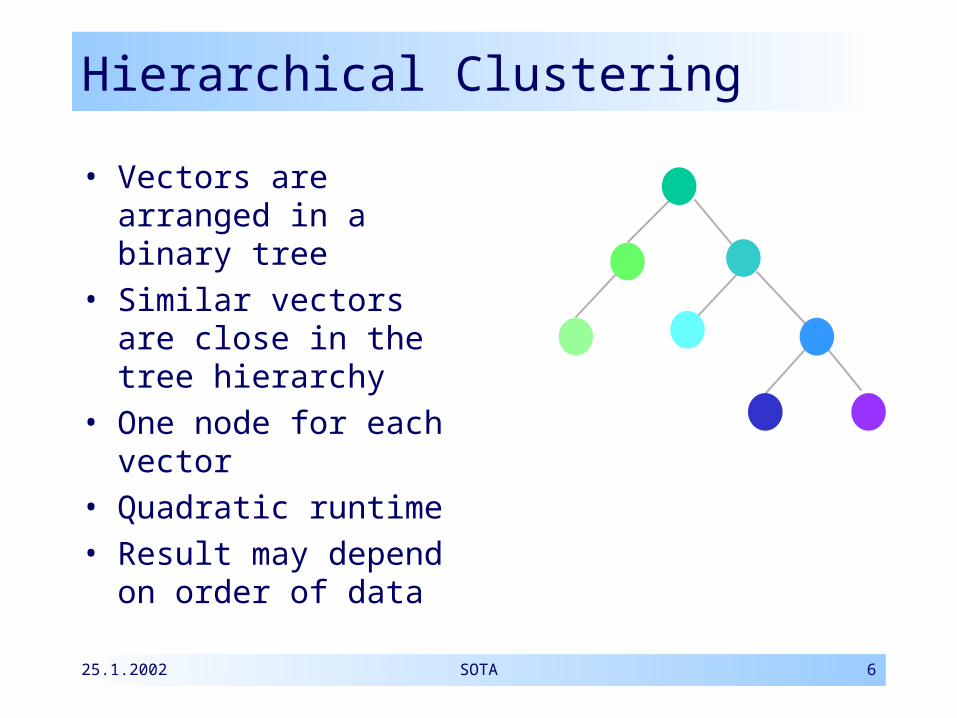
• Vectors are arranged in a binary tree
• Similar vectors are close in the tree hierarchy
• One node for each vector
• Quadratic runtime• Result may depend
on order of data
25.1.2002 SOTA 7
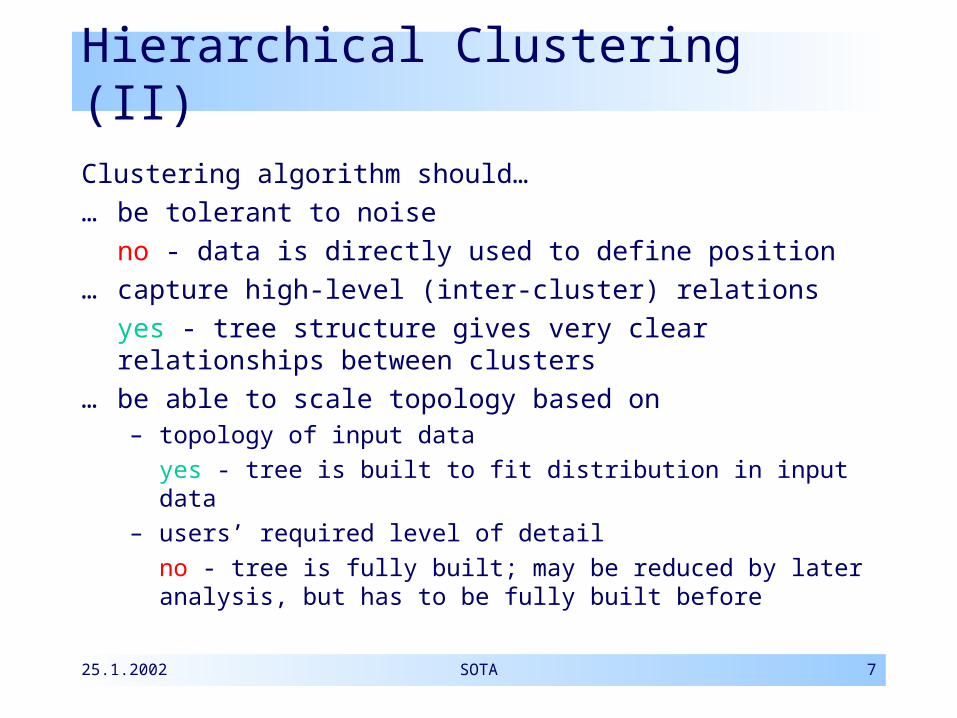
Hierarchical Clustering (II)
Clustering algorithm should…… be tolerant to noise no - data is directly used to define position… capture high-level (inter-cluster) relations yes - tree structure gives very clear relationships
between clusters… be able to scale topology based on
– topology of input data yes - tree is built to fit distribution in input data– users’ required level of detail no - tree is fully built; may be reduced by later analysis,
but has to be fully built before
25.1.2002 SOTA 8
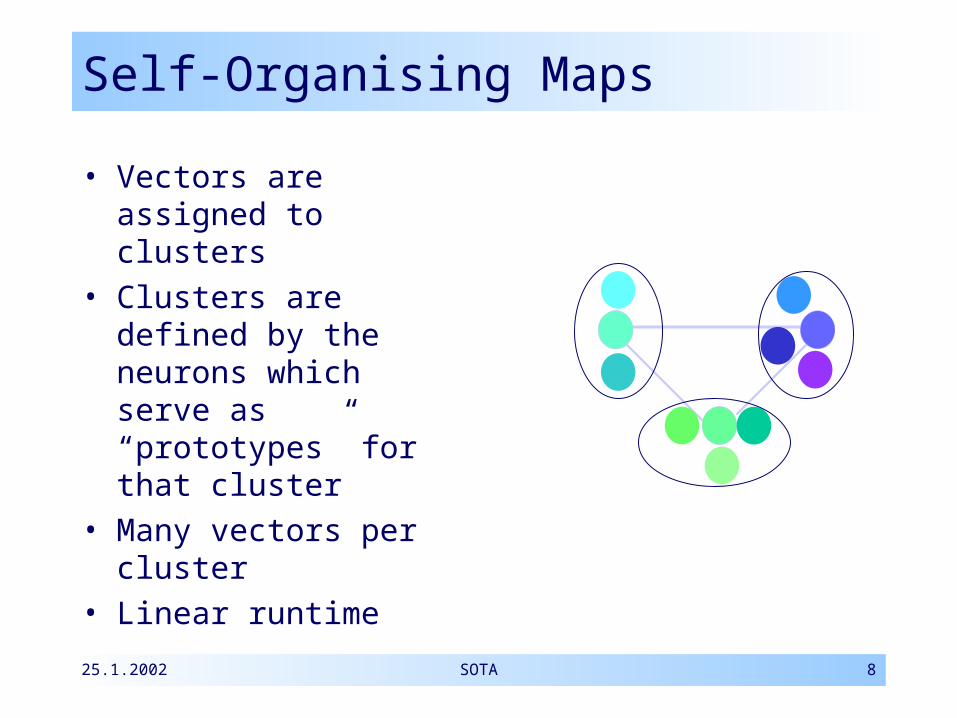
Self-Organising Maps
• Vectors are assigned to clusters
• Clusters are defined by the neurons which serve as “prototypes” for that cluster
• Many vectors per cluster
• Linear runtime
25.1.2002 SOTA 9
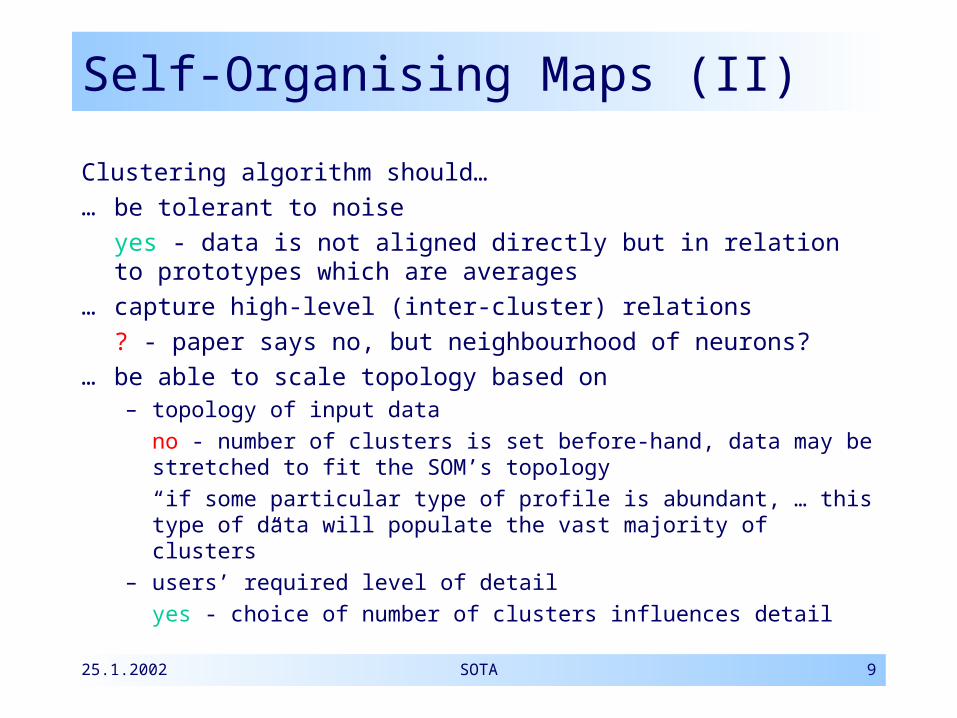
Self-Organising Maps (II)
Clustering algorithm should…… be tolerant to noise yes - data is not aligned directly but in relation to
prototypes which are averages… capture high-level (inter-cluster) relations ? - paper says no, but neighbourhood of neurons?… be able to scale topology based on
– topology of input data no - number of clusters is set before-hand, data may be
stretched to fit the SOM’s topology “if some particular type of profile is abundant, … this type
of data will populate the vast majority of clusters”– users’ required level of detail yes - choice of number of clusters influences detail
25.1.2002 SOTA 10
Topics
• Introduction
• Parent Techniques and their Problems
• SOTASOTA– Growing Cell StructureGrowing Cell Structure– Learning AlgorithmLearning Algorithm– Distance MeasuresDistance Measures– Abortion CriteriaAbortion Criteria
• Conclusion
25.1.2002 SOTA 11
SOTA Overview
• SOTA stands for self-organising tree algorithm
• SOTA combines best things from hierarchical clustering and SOMs:– Align clusters in a hierarchical structure– Use cluster prototypes created in a SOM-like
way
• New idea: Growing Cell Structures– Topology is built up incrementally as data
requires it
25.1.2002 SOTA 12
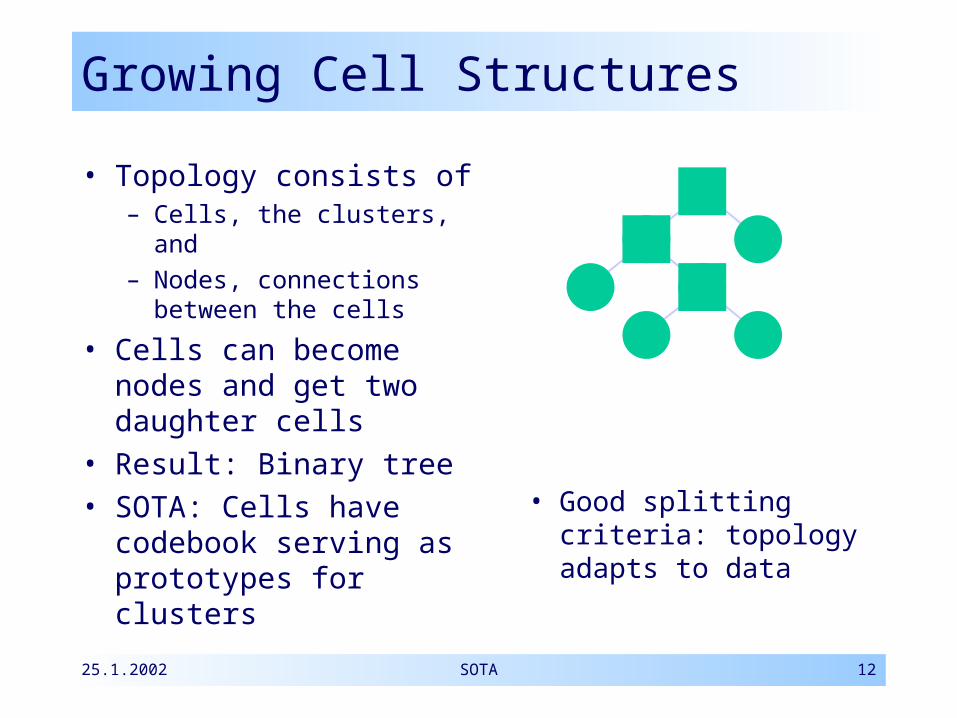
Growing Cell Structures
• Topology consists of– Cells, the clusters, and– Nodes, connections
between the cells
• Cells can become nodes and get two daughter cells
• Result: Binary tree• SOTA: Cells have
codebook serving as prototypes for clusters
• Good splitting criteria: topology adapts to data
25.1.2002 SOTA 13
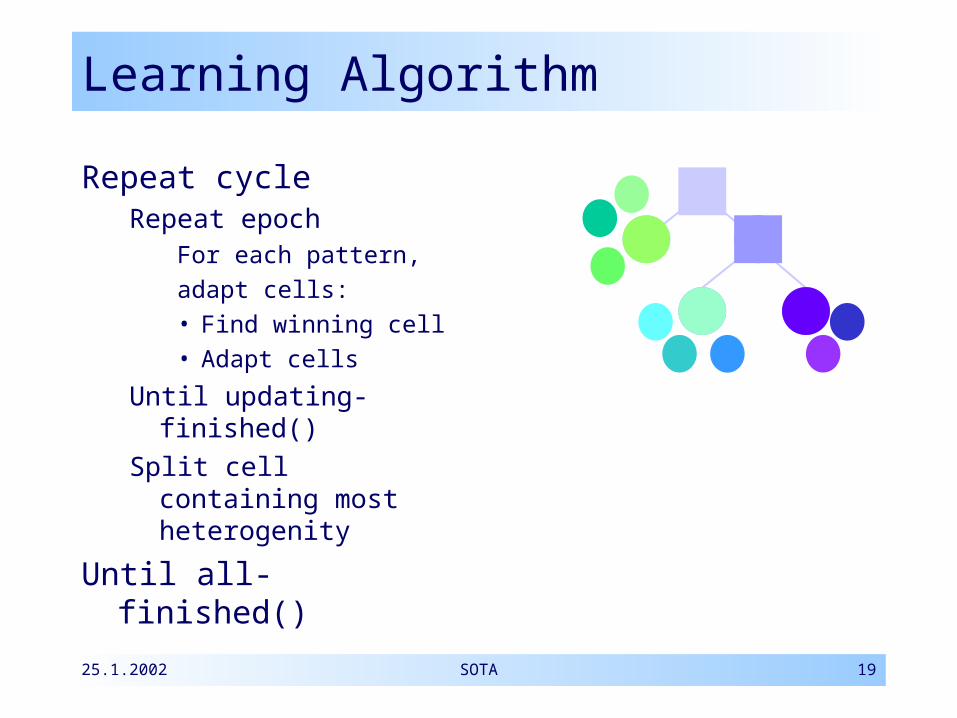
Learning Algorithm
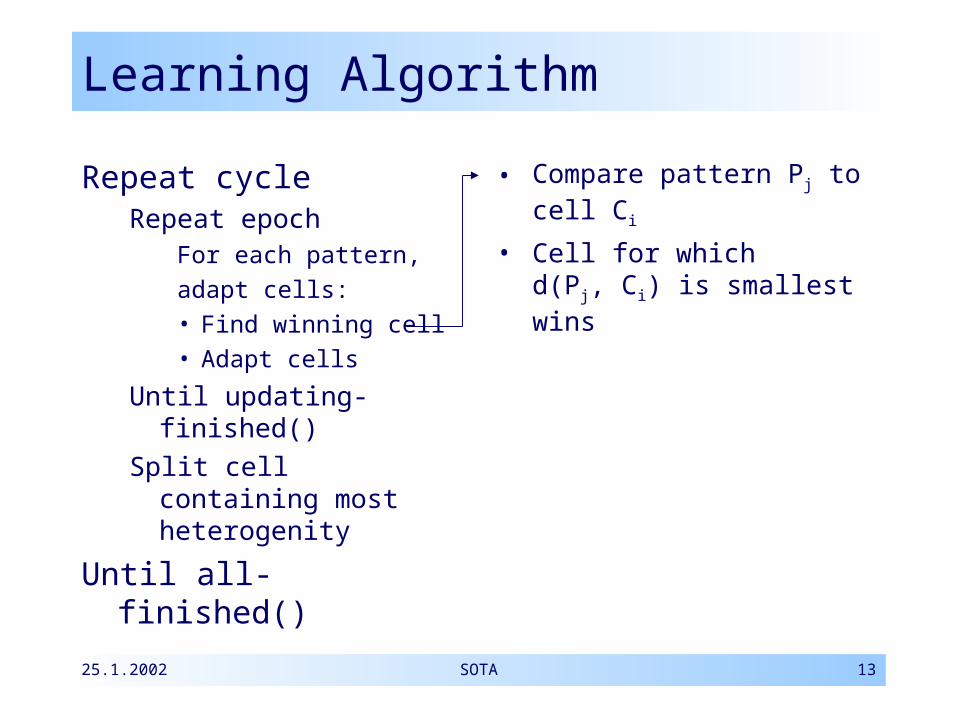
Repeat cycle Repeat epoch
For each pattern,adapt cells:• Find winning cell• Adapt cells
Until updating-finished()Split cell containing
most heterogenity
Until all-finished()
• Compare pattern Pj to cell Ci
• Cell for which d(Pj, Ci) is smallest wins
25.1.2002 SOTA 14
Learning Algorithm
Repeat cycle Repeat epoch
For each pattern,adapt cells:• Find winning cell• Adapt cells
Until updating-finished()Split cell containing
most heterogenity
Until all-finished()
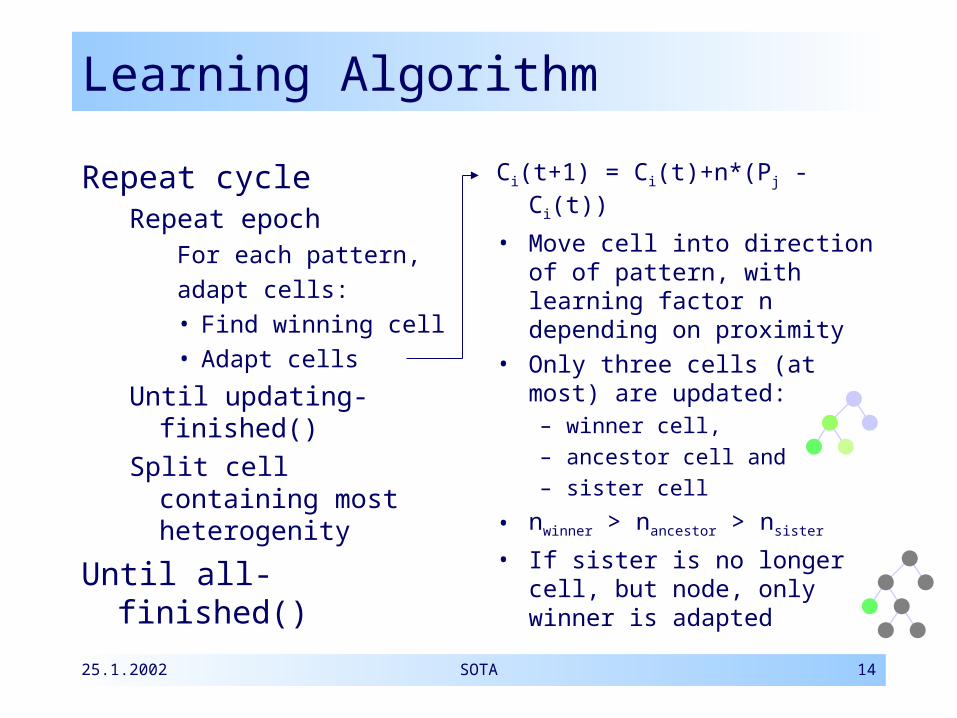
Ci(t+1) = Ci(t)+n*(Pj - Ci(t))
• Move cell into direction of of pattern, with learning factor n depending on proximity
• Only three cells (at most) are updated: – winner cell, – ancestor cell and – sister cell
• nwinner > nancestor > nsister
• If sister is no longer cell, but node, only winner is adapted
25.1.2002 SOTA 15
Learning Algorithm
Repeat cycle Repeat epoch
For each pattern,adapt cells:• Find winning cell• Adapt cells
Until updating-finished()Split cell containing
most heterogenity
Until all-finished()
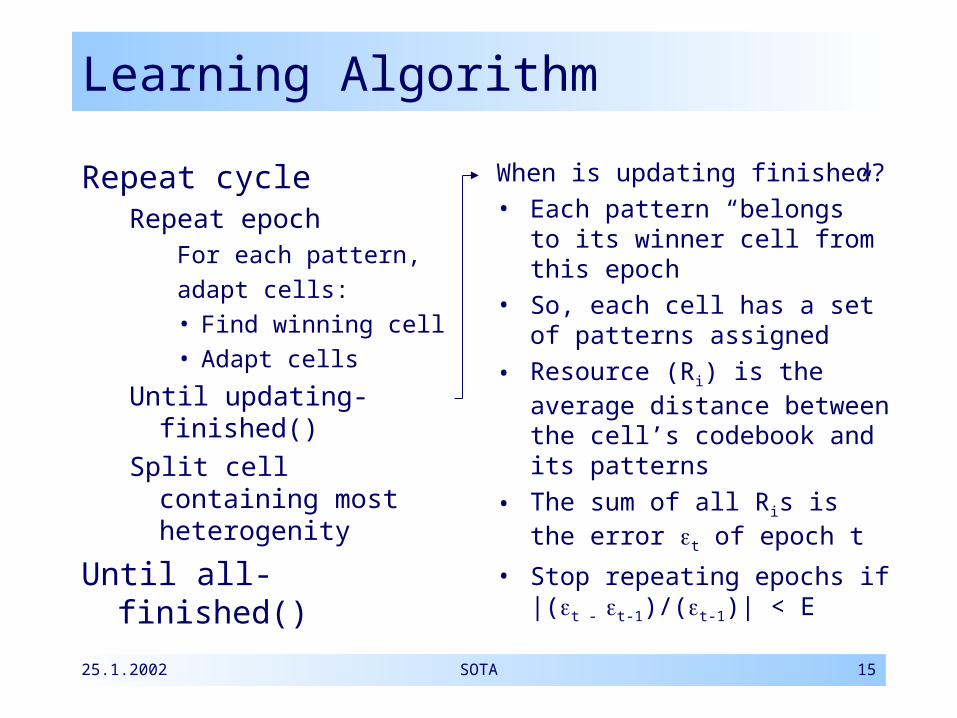
When is updating finished?• Each pattern “belongs” to
its winner cell from this epoch
• So, each cell has a set of patterns assigned
• Resource (Ri) is the average distance between the cell’s codebook and its patterns
• The sum of all Ris is the error t of epoch t
• Stop repeating epochs if|(t - t-1)/(t-1)| < E
25.1.2002 SOTA 16
Learning Algorithm
Repeat cycle Repeat epoch
For each pattern,adapt cells:• Find winning cell• Adapt cells
Until updating-finished()Split cell containing
most heterogenity
Until all-finished()
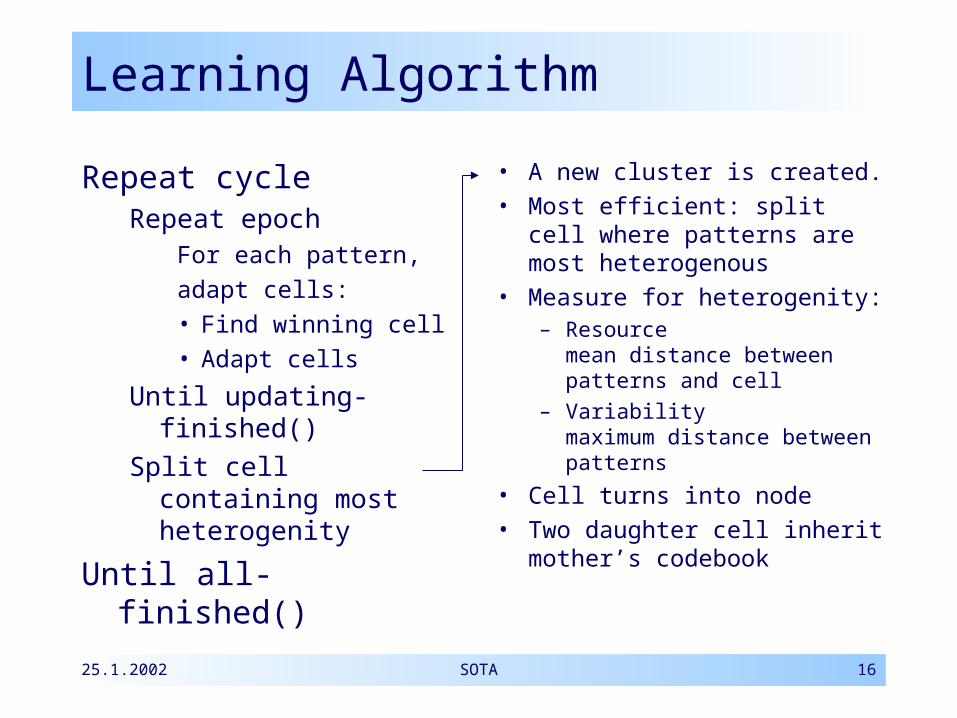
• A new cluster is created.• Most efficient: split cell
where patterns are most heterogenous
• Measure for heterogenity:– Resource
mean distance between patterns and cell
– Variabilitymaximum distance between patterns
• Cell turns into node• Two daughter cell inherit
mother’s codebook
25.1.2002 SOTA 17
Learning Algorithm
Repeat cycle Repeat epoch
For each pattern,adapt cells:• Find winning cell• Adapt cells
Until updating-finished()Split cell containing
most heterogenity
Until all-finished()
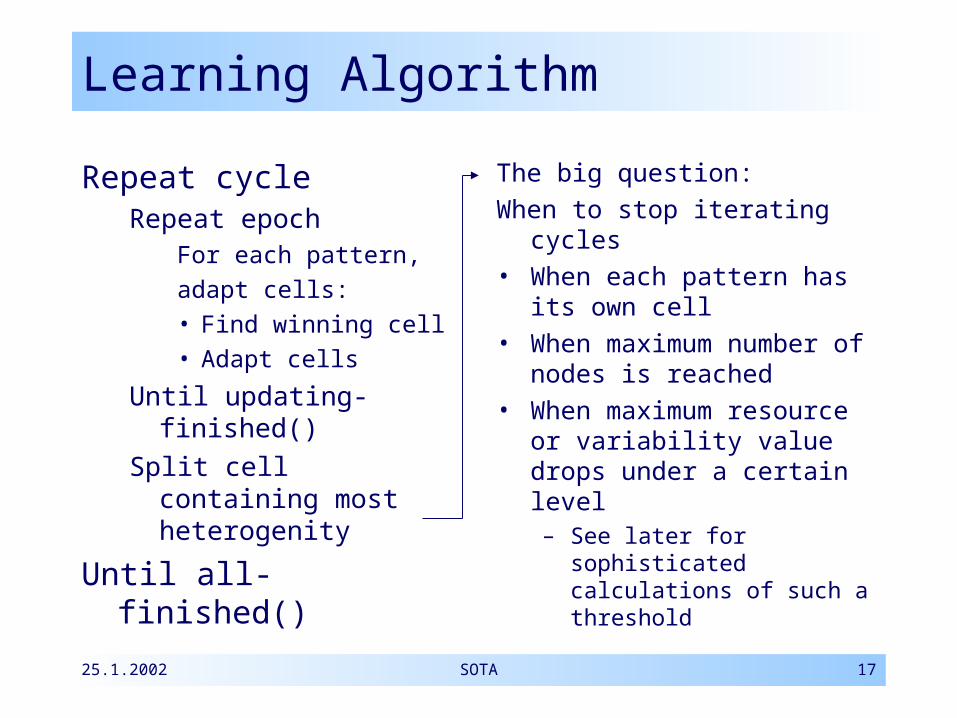
The big question:When to stop iterating cycles• When each pattern has its
own cell • When maximum number
of nodes is reached• When maximum resource
or variability value drops under a certain level– See later for sophisticated
calculations of such a threshold
25.1.2002 SOTA 18
Learning Algorithm
Repeat cycle Repeat epoch
For each pattern,adapt cells:• Find winning cell• Adapt cells
Until updating-finished()Split cell containing
most heterogenity
Until all-finished()
25.1.2002 SOTA 19
Learning Algorithm
Repeat cycle Repeat epoch
For each pattern,adapt cells:• Find winning cell• Adapt cells
Until updating-finished()Split cell containing
most heterogenity
Until all-finished()
25.1.2002 SOTA 20
Distance Measures
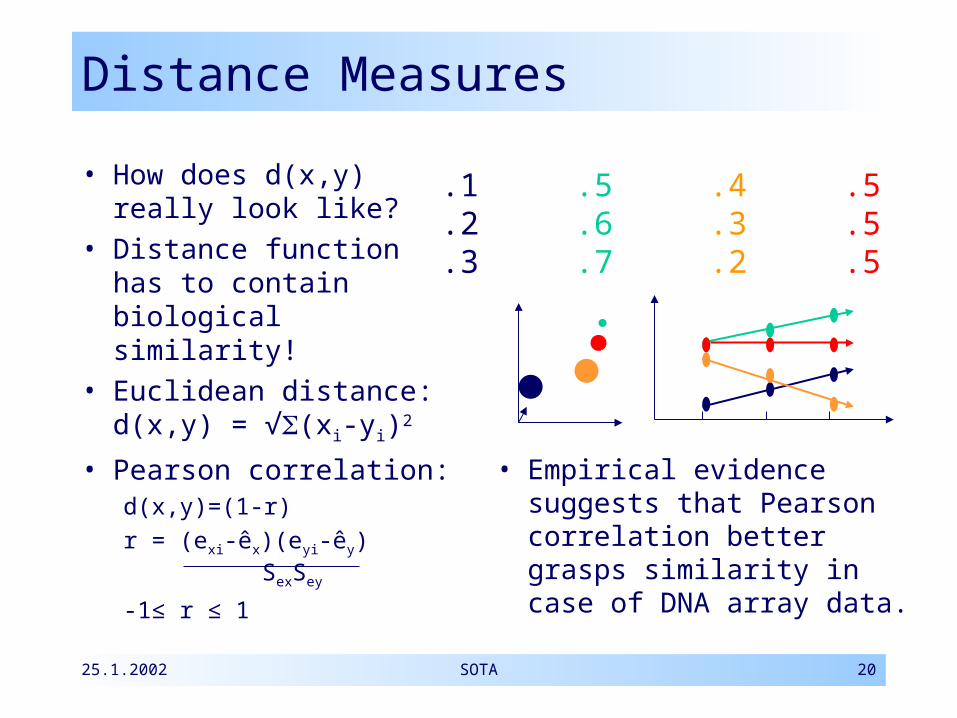
• How does d(x,y) really look like?
• Distance function has to contain biological similarity!
• Euclidean distance:d(x,y) = √(xi-yi)2
• Pearson correlation:d(x,y)=(1-r)r = (exi-êx)(eyi-êy)
SexSey
-1≤ r ≤ 1
.1 .5 .4 .5
.2 .6 .3 .5
.3 .7 .2 .5
• Empirical evidence suggests that Pearson correlation better grasps similarity in case of DNA array data.
25.1.2002 SOTA 21
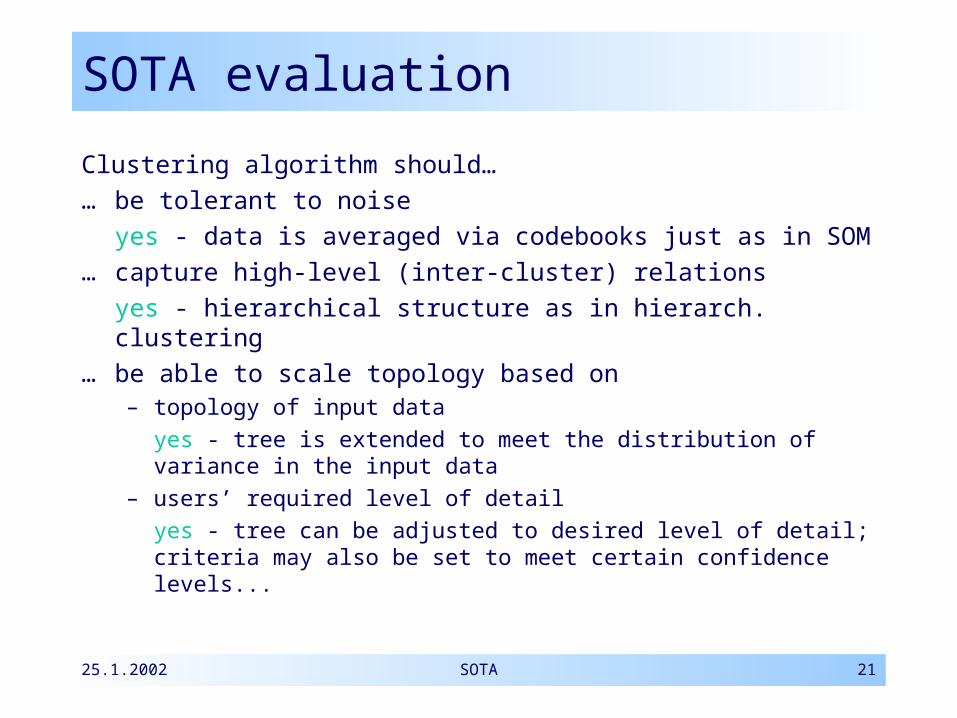
SOTA evaluation
Clustering algorithm should…… be tolerant to noise yes - data is averaged via codebooks just as in SOM… capture high-level (inter-cluster) relations yes - hierarchical structure as in hierarch. clustering… be able to scale topology based on
– topology of input data yes - tree is extended to meet the distribution of variance
in the input data– users’ required level of detail yes - tree can be adjusted to desired level of detail; criteria
may also be set to meet certain confidence levels...
25.1.2002 SOTA 22
Abortion Criteria
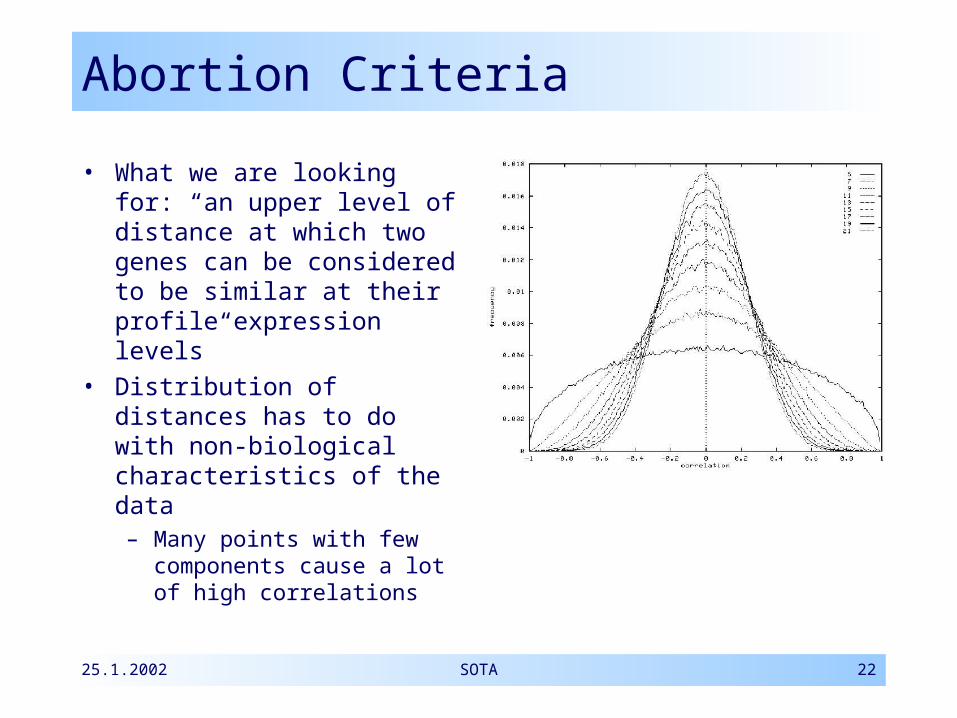
• What we are looking for: “an upper level of distance at which two genes can be considered to be similar at their profile expression levels”
• Distribution of distances has to do with non-biological characteristics of the data– Many points with few
components cause a lot of high correlations
25.1.2002 SOTA 23
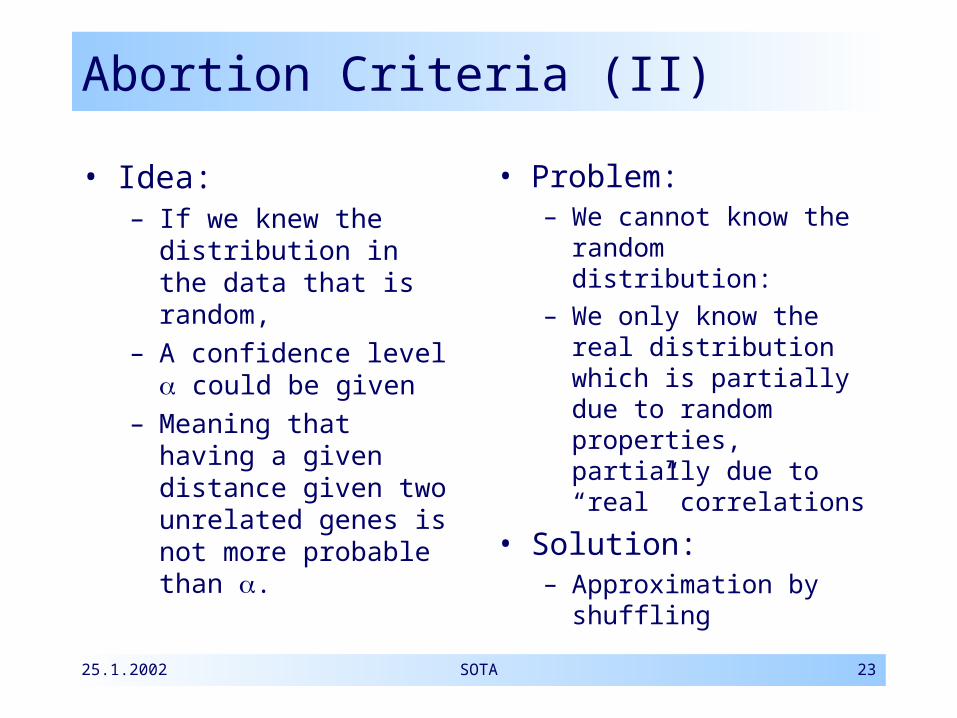
Abortion Criteria (II)
• Idea: – If we knew the
distribution in the data that is random,
– A confidence level could be given
– Meaning that having a given distance given two unrelated genes is not more probable than .
• Problem:– We cannot know the
random distribution:– We only know the real
distribution which is partially due to random properties, partially due to “real” correlations
• Solution:– Approximation by
shuffling
25.1.2002 SOTA 24
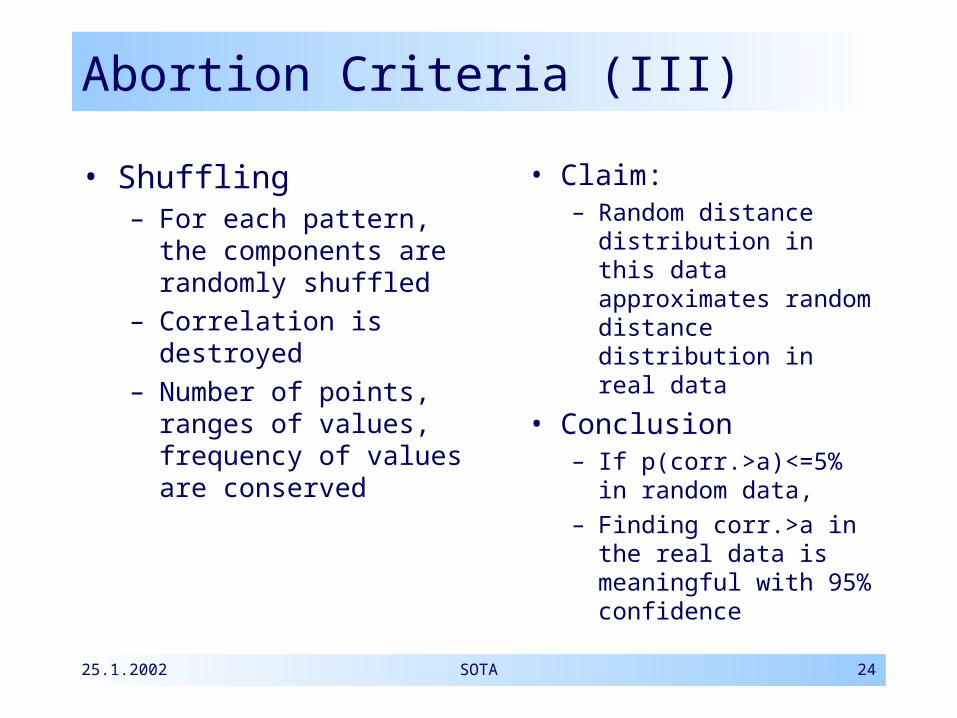
Abortion Criteria (III)
• Shuffling– For each pattern, the
components are randomly shuffled
– Correlation is destroyed
– Number of points, ranges of values, frequency of values are conserved
• Claim:– Random distance
distribution in this data approximates random distance distribution in real data
• Conclusion– If p(corr.>a)<=5%
in random data,– Finding corr.>a in
the real data is meaningful with 95% confidence
25.1.2002 SOTA 25
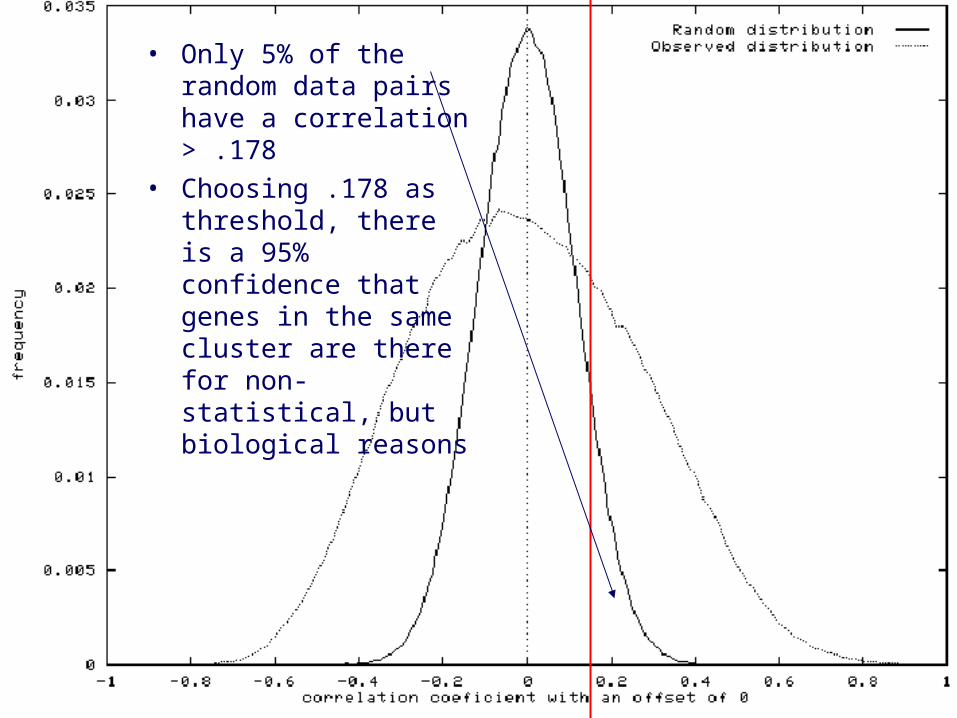
• Only 5% of the random data pairs have a correlation > .178
• Choosing .178 as threshold, there is a 95% confidence that genes in the same cluster are there for non-statistical, but biological reasons
25.1.2002 SOTA 26
Topics
• Introduction
• Parent Techniques and their Problems
• SOTA
• ConclusionConclusion– Additional nice propertiesAdditional nice properties– Summary of differences compared to parent Summary of differences compared to parent
techniquestechniques
25.1.2002 SOTA 27
Additional properties
• As patterns do not have to be compared to each other, runtime is approximately linear in the number of patterns– Like SOM– Hierarchical clustering uses a distance
matrix relating each pattern to each other pattern
• The cell’s vectors approach very closely the average of the assigned data points
25.1.2002 SOTA 28
Summary of SOTA
• Compared to SOMs– SOTA builds up a
topology that reflects higher-order relations
– Level of detail can be defined very flexible
• Nicer topological properties
• Adding of new data into an existing tree would be problematic(?)
• Compared to standard hierarchical clustering– SOTA is more robust
to noise– Has better runtime
properties– Has a more flexible
concept of cluster