Embed Size (px)
Citation preview
Cellular/Molecular
Gene Expression Changes in the Course of Neural ProgenitorCell Differentiation
Ulf Gurok,1,2 Christine Steinhoff,1 Bettina Lipkowitz,1 H.-Hilger Ropers,1 Constance Scharff,1 and Ulrike A. Nuber1
1Max Planck Institute for Molecular Genetics, 14195 Berlin, Germany, and 2Freie Universitat Berlin, Fachbereich Biologie, Chemie, Pharmazie, 14195 Berlin,Germany
The molecular changes underlying neural progenitor differentiation are essentially unknown. We applied cDNA microarrays with 13,627clones to measure dynamic gene expression changes during the in vitro differentiation of neural progenitor cells that were isolated fromthe subventricular zone of postnatal day 7 mice and grown in vitro as neurospheres. In two experimental series in which we withdrewepidermal growth factor and added the neurotrophins Neurotrophin-4 or BDNF, four time points were investigated: undifferentiatedcells grown as neurospheres, and cells 24, 48, and 96 hr after differentiation. Expression changes of selected genes were confirmed bysemiquantitative RT-PCR. Ten different groups of gene expression dynamics obtained by cluster analysis are described. To correlateselected gene expression changes to the localization of respective proteins, we performed immunostainings of cultured neurospheres andof brain sections from adult mice. Our results provide new insights into the genetic program of neural progenitor differentiation and givestrong hints to as yet unknown cellular communications within the adult subventricular zone stem cell niche.
Key words: development; differentiation; hybridization; ventricle; stem cell; microarray; subventricular zone; rostral migratory stream;neurosphere
IntroductionAdult neural progenitor/stem cells in rodents and primates arewell characterized in two brain regions: the subventricular zone(SVZ) of the lateral ventricles and the subgranular cell layer of thehippocampal dentate gyrus (McKay, 1997; Eriksson et al., 1998;Kornack and Rakic, 1999; Gage, 2000; Temple 2001; Alvarez-Buylla et al., 2002; Sanai et al., 2004). Stem cells in the adult SVZare self-renewing and give rise to neurons that incorporate asinterneurons into the olfactory bulb. Within the rodent SVZ,four major cell types have been described: ependymal cells liningthe lateral ventricle, astrocytes (type B cells), and rapidly dividingtransit-amplifying type C cells that generate neuroblasts (type Acells) (Doetsch et al., 1997). SVZ neuroblasts migrate as chains inthe rostral migratory stream (RMS) to the olfactory bulb throughtunnels formed by type B astrocytes (Lois et al., 1996; Peretto etal., 1997; Wichterle et al., 1997). The identity of the SVZ stem cellhas been controversial. Originally proposed to correspond to arare population of relatively quiescent cells (Morshead et al.,1994), ciliated ependymal cells were later suggested to representthe SVZ stem cell (Johansson et al., 1999). Findings of othergroups, however, indicate that SVZ astrocytes (type B cells) areneural stem cells (Chiasson et al., 1999; Doetsch et al., 1999a,b;Laywell et al., 2000; Capela and Temple, 2002).
Cultured cells from the adult subventricular zone form floatingmulticellular spheres, so-called neurospheres, in the presence of epi-dermal growth factor (EGF) or basic fibroblast growth factor (bFGF)under appropriate conditions (Reynolds and Weiss, 1992; Richardset al., 1992; Morshead et al., 1994). These cells self-renew and aremultipotent as they give rise to neuronal, astrocytic, and oligonden-drocytic cells (Reynolds and Weiss, 1992). Doetsch et al. (2002) sug-gested that most of the EGF-responsive neurosphere-forming cellscorrespond to the rapidly dividing Distal-less homeobox 2-positivetype C cells. Morshead and van der Kooy (2003) proposed that pre-cursors of these cells give rise to neurospheres.
In principle, the in vitro differentiation of neurosphere-forming cells includes five steps: (1) cessation of proliferation, (2)attachment of the neurosphere, (3) detachment of cells from theneurosphere cell cluster, (4) migration of these cells away fromthe sphere, and (5) their actual differentiation into different celltypes. These steps are comparable with adult neurogenesis ofrodents in vivo; however, few of the underlying molecularchanges are known. To learn more about the early and probablydecisive mechanisms of this process, we have studied dynamicgene expression changes during the first 4 d of in vitro neuro-sphere differentiation with cDNA microarrays. We identifiedgenes with relevant expression changes during this process andclassified the results according to functional categories. Expres-sion changes of selected genes were confirmed by semiquantita-tive RT-PCR. Because neurosphere cultures are not homoge-neous (Suslov et al., 2002) and give rise to different cell types invitro, we performed immunostainings to assign some of the mostinteresting results to specific cell types. We correlate our findingswith the in vivo situation in the SVZ by staining tissue sections ofadult mouse brains.
Received Dec. 2, 2003; revised April 26, 2004; accepted May 14, 2004.This work was supported by Deutsche Forschungsgemeinschaft Grant SFB577. We thank Andrew Fanous for
technical assistance and Isabelle Caille for support in establishing neurosphere cultures.Correspondence should be addressed to Ulrike A. Nuber, Max Planck Institute for Molecular Genetics, Human
Molecular Genetics, Ihnestrasse 73, Berlin 14195, Germany. E-mail: [email protected]:10.1523/JNEUROSCI.0809-04.2004
Copyright © 2004 Society for Neuroscience 0270-6474/04/245982-21$15.00/0
5982 • The Journal of Neuroscience, June 30, 2004 • 24(26):5982– 6002
Our study revealed genes known or suggested to play a role inneurogenesis, but in addition revealed many new interestinggenes with potential relevance for the maintenance, migration,and differentiation of neural progenitor cells.
Materials and MethodsFor the nomenclature of mouse genes and proteins, we followed the guide-lines of the international committee on standardized genetic nomenclaturefor mice (http://www.informatics.jax.org/mgihome/nomen/).
Cell culture. Neural progenitor cells were prepared from postnatalday 7 (P7) CD1 mice (Charles River, Wilmington, MA). Cells obtainedfrom 10 animals were used for each series [BDNF and Neurotrophin-4(NT4), see below]. Briefly, animals were killed, and tissue including thesubventricular zone was dissected out from frontal sections. The tissuewas digested with Accumax (PAA Laboratories, Coelbe, Germany) for 10min at 37°C, fragmented with a cell strainer (40 �m; BD Falcon, Heidel-berg, Germany), and plated out in suspension cell flasks (Nunc, Wiesba-den, Germany) at 50,000 –100,000 cells per milliliter in DMEM/F12 (1:1)with Glutamax, B27, HEPES (10 mM), insulin (20 �g/ml), penicillin (100U/ml), streptomycin (100 U/ml), fungizone (2.5 �g/ml), and humanrecombinant EGF (20 ng/ml) (all from Invitrogen, Karlsruhe, Germany).Cells were incubated at 37°C in 5% CO2. After 8 –11 d in culture, neuro-spheres were dissociated by incubation with Accumax, as above, followedby careful trituration, and replated at 50,000 –100,000 cells per milliliter.For differentiation, tertiary spheres were used after 27 d in culture.Spheres were plated out in cell culture dishes coated with poly-L-lysine(Sigma, Munich, Germany) in the same medium without EGF, but withhuman recombinant BDNF or NT4 (20 ng/ml; Promega, Mannheim,Germany). For immunofluorescence analysis, spheres were grown onpoly-L-lysine-coated coverslips.
For differentiation in Matrigel, spheres were resuspended in ice-cold Ma-trigel (200 �l; BD Biosciences, Heidelberg, Germany) diluted with 75 �l ofL15-medium (Sigma) and spread on coverslips. After incubation at 37°C for30 min, Neurobasal medium supplemented with B27, HEPES (10 mM),penicillin (100 U/ml), streptomycin (100 U/ml), fungizone (2.5 �g/ml), glu-tamine (2 mM), and human recombinant EGF (20 ng/ml) (all from Invitro-gen) was added, and cells were incubated for 3 d at 37°C in 5% CO2.
Pictures of cultured cells were taken with an Axiovert 100 microscope(Zeiss, Oberkochen, Germany) and a digital CCD camera DSC-S75(Sony, Tokyo, Japan).
Generation of cDNA microarrays. Murine cDNA clones (n � 10,080;arrayTAG clone collection) were purchased from LION Bioscience (Hei-delberg, Germany), and 3510 murine cDNA clones representing brain-expressed transcripts were obtained from the resource center of the Ger-man Human Genome Project (RZPD Berlin). Clone inserts wereamplified under standard conditions. Primers Lion 3� (TCG AGC GGCCGC CCG GGC AGG T) and Lion 5� (AGC GTG GTC GCG GCC GAGGT) were used for clones from LION bioscience, and primers M13for(GTA AAA CGA CGG CCA G) and M13rev (CAG GAA ACA GCT ATGAC) were used for RZPD clones. Primers were obtained from MWGBiotech (Ebersberg, Germany). In addition, 34 plant cDNA sequencesand 3 murine cDNA sequences were amplified with specific primers. AllPCR products were evaluated by agarose gel electrophoresis. PurifiedPCR products were resuspended in 8 �l of 3� SSC and printed onCorning GAPS II slides by using a robotic spotting device (SDDC-2 Mi-croArrayer, ESI, Toronto, Canada/ChipWriter Pro, Bio-Rad, Munich, Ger-many) with SMP3 pins from TeleChem International (Sunnyvale, CA).
RNA isolation and microarray hybridization. Total RNA was isolatedwith Trizol reagent (Invitrogen). Microarray labeling and hybridizationreactions were performed using the 3DNA Array 50 Expression ArrayDetection kit (Genisphere, Hatfield, PA) according to the manufactur-er’s instructions. Briefly, 20 �g of total RNA of undifferentiated anddifferentiated cells (24, 48, or 96 hr) was reverse transcribed using prim-ers with a specific capture sequence. The two cDNA samples were pooledand hybridized to the microarrays in a humidified chamber at 42°C for 16hr. Dye-swap repeats were performed for each time point. Thus, sixarrays were used for each series (NT4 and BDNF). Slides were washed atroom temperature in 2� SSC/0.2% SDS for 10 min, 2� SSC for 10 min,
and 0.2� SSC for 10 min. Bound cDNA was visualized by hybridizationwith 3DNA (dendrimers specific for respective capture sequences conju-gated to either Cy3 or Cy5) in a humidified chamber at 42°C for 3 hr.Subsequently, slides were washed as before.
Image acquisition and data analysis. Fluorescence intensities of Cy3 andCy5 were measured separately at 532 and 635 nm with a laser scanner (Af-fymetrix 428 Array Scanner, Affymetrix). The resulting 16-bit data files wereimported into Microarray Suite image analysis software (version 2.0), whichruns as an extension of IPLab Spectrum software (Scanalytics, Fairfax, VA).Raw spot intensities of Cy3 and Cy5 were locally background subtracted bythe MicroArray Suite software. Empty spots and spots carrying plant genesequences were excluded from further analysis. Each dye swap experimentwas normalized by applying variance stabilization (Huber et al., 2002) usingthe vsn package of bioconductor (http://www.bioconductor.org). Means ofnormalized log-products and log-ratios of each dye swap experiment pairwere used for further analysis. Normalization procedures were performedusing R (http://cran.R-project.org).
Identification of differentially expressed genes and cluster analysis. First,the dataset was reduced to 454 clones that showed an estimated foldchange of at least 2.0 at one differentiation time-point in both experi-ments (BDNF and NT4).
The threshold of estimated 2.0-fold change was determined by a sta-tistical analysis aimed at minimizing the percentage of false positives. Todo so, a variance estimation using a pooled estimate of the variance overall genes of three self-to-self comparisons with RNA from undifferenti-ated cells was performed. A similar approach has been described by Sa-batti et al. (2002). To use a robust variance measurement, we determinedthe median of absolute deviation (MAD) as variance estimator. TheMAD in all three independent experiments of self-to-self comparisonwas very similar: 0.297 � 0.021. On the basis of this analysis, we canassume a rate of 2% false positives when applying a universal threshold of2.17-fold change. A rate of 5% false positives can be assumed whenapplying a threshold of 1.8-fold. We therefore chose to consider all genesabove a 2.0-fold change as relevant. Thus, we can assume a false positiverate between 2 and 5%, which we consider tolerable.
Of the clones shown in Table 1, we sequence-verified those that werepresent only once on the array. If a gene was represented by more cloneson the array, which showed comparable expression changes, we did notsequence-verify. In this case, one representative clone is listed in Table 1.
Of the 454 clones, 441 clones showing a consistent upregulation ordownregulation at the three differentiation time points were included ina cluster analysis. We clustered the 441 datasets, each representing asingle time course, by applying the k-means algorithm and using a re-fined Euclidean distance measure. Ten cluster centers were randomlydefined. The distance was defined as the weighted sum of k-means as-signment and a similarity of shapes between cluster centers (gradient).The distance measure ( D) was defined as follows: D(x,y) � a d1(x,y) �(1 � a) d2(x,y), where a � 0.5, x,y � two gene profiles to be compared, d1represents the Euclidean distance between x and y, and d2 represents thegradient of x and y. These calculations and the respective visualizationwere performed using MATLAB (version 6.0.0.88, release 12,MathWorks).
Reverse transcription and semiquantitative PCR. Two micrograms oftotal RNA from each of the four time points were reverse-transcribedinto cDNA by incubation with 5 �l of Deoxyribonucleoside triphosphatesolution (dNTPs) (10 mM of dATP, dCTP, dTTP, dGTP each), 2.5 �l ofrandom primer (500 ng/�l), nuclease-free water, 10 �l of Moloney mu-rine leukemia virus (M-MLV) 5� reaction buffer, 2 �l of RNasin, and800 U of M-MLV RT (all from Promega) for 1 hr at 37°C. PCR reactionswere performed using equal amounts of cDNA as template, 2.5 �l ofdNTPs (2 mM each), 2.5 �l of 10� reaction buffer, 1.5 �l of each primer(10 pmol/�l), water, and 2 �l of Red Taq (Promega). Amplificationsconsisted of 21–26 cycles (94°C for 45 sec, 54�57°C for 60 sec, and 72°Cfor 90 sec). PCR products were visualized by agarose electrophoresis.Gene-specific primers and annealing temperatures are provided as sup-plementary material.
Gurok et al. • Neural Progenitor Cell Differentiation J. Neurosci., June 30, 2004 • 24(26):5982– 6002 • 5983

Immunofluorescence. Cells were grown on coverslips, fixed by sequen-tial incubation in ice-cold methanol (5 min) and acetone (30 sec), andstored at �20°C. Cryostat sections (10 �m) of brains from 3-month-oldCD1 mice were placed on glass slides, fixed in �20°C cold acetone for 10min, and air dried. If not used immediately, slides were stored at �80°Cuntil use. Cells used for galactosyl cerebroside (GALC) staining werefixed in 4% paraformaldehyde/PBS.
Sections and coverslips were treated with Triton X-100 (0.1% in PBS)for 5 min (except for GALC staining), washed with PBS three times (5min each), and blocked with 5% donkey serum (Dianova, Hamburg,Germany) in PBS for 30 min at room temperature. Primary antibodieswere applied for 16 hr at 4°C or for 45 min at room temperature. PBSwithout primary antibody was used as a negative control. The followingprimary antibodies were used: tubulin-�-III (1:150; Upstate, Charlottes-ville, VA), glial fibrillary acidic protein (GFAP) (polyclonal, 1:100; SantaCruz Biotechnology, Santa Cruz, CA), GFAP (1:100, MAB3402 mono-clonal; Chemicon, Temecula, CA), nestin (1:100; Transduction Labora-tories, Lexington, KY), Ki-67 (1:100; Dako Cytomation, Hamburg, Ger-many), protein tyrosine phosphatase, nonreceptor type substrate 1(PTPNS1) (1:200; BD Biosciences), CD47 antigen (CD47) (1:200; BDBiosciences), FABP7 (1:100; kindly provided by T. Mueller, C. Birch-meier, MDC, Berlin, Germany), pleiotrophin (1:100; R & D Systems,Minneapolis, MN), HUC/D (1:100; Molecular Probes, Eugene, OR),CD24 antigen (CD24) (1:100; Santa Cruz Biotechnology), poly-sialylated neural cell adhesion molecule (PSA-NCAM) (1:100;AbCys, Paris, France), galactosylceramidase (GALC) (1:100; Roche). Afterthree washes in PBS (15 min each), secondary antibodies coupled to Cy3or fluorescein isothiocyanate (Dianova) were applied for 30 min at roomtemperature. Specimens were then washed three times in PBS (15 mineach), rinsed briefly in water, dehydrated in ethanol, and air dried. Amounting medium containing 4�,6�-diamidino-2-phenylindole (DAPI)nuclear stain was used. Immunofluorescence was documented with aZeiss Axioskop epifluorescence microscope (Zeiss) or with a Leica DMIRE2 (Leica, Wetzlar, Germany).
ResultsIn vitro differentiation of neurosphere cellsSoon after the transfer of neurospheres into poly-L-lysine-coateddishes with a medium that contained no EGF, but did containBDNF or NT4, they attached to the plate. By 24 hr a few cells hadmigrated out of the spheres. This number increased with time,and migrating cells underwent morphological changes (Fig. 1).Cells in close proximity to the sphere appeared as large flat glia-like cells, and they were immunopositive for the astrocyte markerGFAP (Fig. 2). In contrast, some cells that migrated farther awayfrom the sphere acquired a neuronal morphology with small cellbodies and long, slim processes. These stained positive for theneuron-specific marker tubulin-�-III (Fig. 2). Most cells withinthe spheres were positive for GFAP; however, after 96 hr thecompact sphere structure had frequently loosened up, and someof these cells had changed their morphology as well. Few cellsinside the spheres produced tubulin-�-III after induction of dif-ferentiation, whereas most differentiating cells were GFAP posi-tive. Very few cells were positive for the oligodendrocyte markerGALC (data not shown).
To test for cell proliferation, we immunostained with an an-tibody against Ki-67, a marker for dividing cells (Gerdes et al.,1983). Before induction of differentiation, some cells within neu-rospheres were positive for Ki-67; however, 24 hr after inductionof differentiation, no more dividing cells were found (Fig. 2). Thisis in line with our microarray results (see Gene expressionchanges related to cell proliferation). We also immunostained thecells for nestin, a marker present in neuroepithelial precursorcells. Before and after induction of differentiation, neurosphereclusters were nestin-positive; however, cells that had migratedaway from the spheres no longer expressed nestin (Fig. 2).
Gene expression changes: general findingsWe performed cDNA microarray co-hybridizations with cDNAsamples derived from cells of two experimental series (BDNF andNT4). Neurosphere cells were kept in culture for two passagesand then pooled and redistributed before differentiation witheither BDNF or NT4. Cells were harvested at time points 0 (un-differentiated cells), 24, 48, and 96 hr after induction of differen-tiation. For each series, three co-hybridizations, 0 versus 24 hr, 0versus 48 hr, and 0 versus 96 hr were performed and repeatedwith fluorescent dyes swapped to compensate for dye-specificeffects. The six resulting single datasets per series were subjectedto further analysis that involved a normalization step (see Mate-rials and Methods), resulting in three datasets per series, one foreach co-hybridization (24, 48, and 96 hr). To identify relevant dif-ferentially expressed genes, all clones with more than twofold esti-mated differences in expression in at least one of the three datasetswere considered for further evaluation. This threshold is based on astatistical analysis as described in Materials and Methods.
Seven hundred twenty-two clones of the BDNF experimentand 624 clones of the NT4 experiment fulfilled this criterion.Eighty-three percent of the clones from the BDNF series showedat least a 1.6-fold estimated change in the NT4 experiment, and84% of the clones from the NT4 series showed at least a 1.6-foldestimated change in the BDNF experiment. Four hundred fifty-four clones exhibited relevant (more than twofold) expressionchanges under both conditions. Of these, 97.1% were consis-tently upregulated (271 clones) or downregulated (170 clones) atthe three time points (negative or positive log ratio of signalintensity) compared with undifferentiated cells in both series.Thirteen clones (2.9%) showed an upregulation at one time pointand subsequent downregulation or vice versa (e.g., phosphoglu-cose isomerase 1) (Table 1, metabolism, NT4 series). The overlapof results from these two independent experiments suggests thatthe neurotrophins BDNF and NT4, both of which bind to theTrkB receptor, lead to mostly overlapping gene expressionchanges. All further analyses were limited to the 454 clones of the
Figure 1. Photographs depicting morphological changes in the course of neural progenitorcell differentiation in vitro. Undifferentiated neurospheres before and cells at 24, 48, and 96 hrafter induction of differentiation are shown. Scale bar, 50 �m.
5984 • J. Neurosci., June 30, 2004 • 24(26):5982– 6002 Gurok et al. • Neural Progenitor Cell Differentiation

intersection list, thus concentrating only on the commonalitiesassociated with the TrkB receptor activation in the two experi-mental series. They were grouped into 10 different categories(Table 1) (see below).
The complete dataset (MIAMI standards) including remainingclones with relevant expression changes, which are not listed in thesegroups, can be found on our homepage (http://www.molgen.mpg.de/�dna_microarrays/neural_differentiation/neural.html).
To extract the dynamic behavior of the relevant gene expres-sion changes in the course of neural progenitor differentiation,cluster analysis was performed using the 441 consistently upregu-lated or downregulated clones from the intersection list (see Ma-terials and Methods). We grouped the 441 clones into 10 clustersthat show a similar onset and course of transcriptional changes
(Fig. 3A): clusters 1–5 containing upregu-lated and clusters 6 –10 containing down-regulated genes, both in the BDNF andNT4 series. With the exception of clusters7 and 8, there is a large fraction of clones ineach cluster that occur in both series (Fig.3B, Table 1). Most genes fall into clustersthat display only slight expression changes(clusters 2, 4, 5, 6, 7, 10). Clusters 1 and 3contain strongly upregulated genes, andclusters 8 and 9 contain strongly down-regulated genes. Concerning the dynam-ics, genes that change late in expression arefound especially in cluster 2. Genes thatchange very early (between time point 0and 24 hr) are found in two of the fourclusters with strongest changes (clusters 1and 9); in addition, they are found in clus-ter 6. Downregulated genes of the func-tional category “chromatin-associatedcomponents and nuclear factors,” in par-ticular, fall into clusters 6 and 10, whichcontain slightly decreasing transcript lev-els. Cluster 9 includes numerous cell cycle-related genes. Cluster 2 (late upregulatedtranscripts) contains many genes that lo-calize to the cell membrane or are found incellular extensions. Apart from these find-ings, single clusters do not preferentiallycontain genes of a certain category. The 10genes with highest expression changes atone time point were Igfbp2 (16.28/25.79)(highest fold-change in BDNF experi-ment/highest fold-change in NT4 experi-ment), 6330403K07Rik (10.91/14.01),PDZ-binding kinase (10.49/7.24), Cdc2/p34 (10.07/9.49), Igfbp4 (9.87/8.85),Fxyd1/Plm (7.85/7.77), Cyclin D1(6.36/7.69), Complement component 3(7.61/6.89), Cdc20 (7.10/6.96), and an ESTadjacent to cadherin 13 (6.69/5.87).
Cell type-specific geneexpression changesWe investigated very early differentiationstages of neurosphere cells to determine thebasic molecular changes that underlie theconversion of the progenitor cell toward acell that enters a differentiation process. In
vitro, neurosphere cells differentiate into three major types of cells:neurons, astrocytes, and oligodendrocytes (Reynolds and Weiss,1992). In addition to a functional categorization, we also screenedour data for cell type-specific genes and found expression changesthat already point to a cellular specification. Several genes typical forneurons and oligodendrocytes were found, all of them upregulated,and many only at a late time point of differentiation (96 hr). With theexception of the myelin basic protein gene in the NT4 series, none ofthem falls into cluster 1. Two genes characteristic for astrocytes werefound: S100B is upregulated, deiodinase iodothyronine type II isdownregulated.
Concerning oligodendrocyte-specific genes, we found an in-creased expression of many myelin components. Of note is thetemporal sequence of myelin component upregulation: tran-
Figure 2. Immunofluorescence microscopy of undifferentiated neurospheres and of cells at 24, 48, and 96 hr after induction ofdifferentiation. Cells were immunolabeled with antibodies against tubulin-�-III, Ki-67, Nestin, PTPNS1 (SHPS-1), CD47, FABP7,Pleiotrophin (all red), and GFAP (green). Nuclei are stained blue. Note the different staining of undifferentiated neurosphereclusters and differentiating cells. Scale bar, 100 �m.
Gurok et al. • Neural Progenitor Cell Differentiation J. Neurosci., June 30, 2004 • 24(26):5982– 6002 • 5985

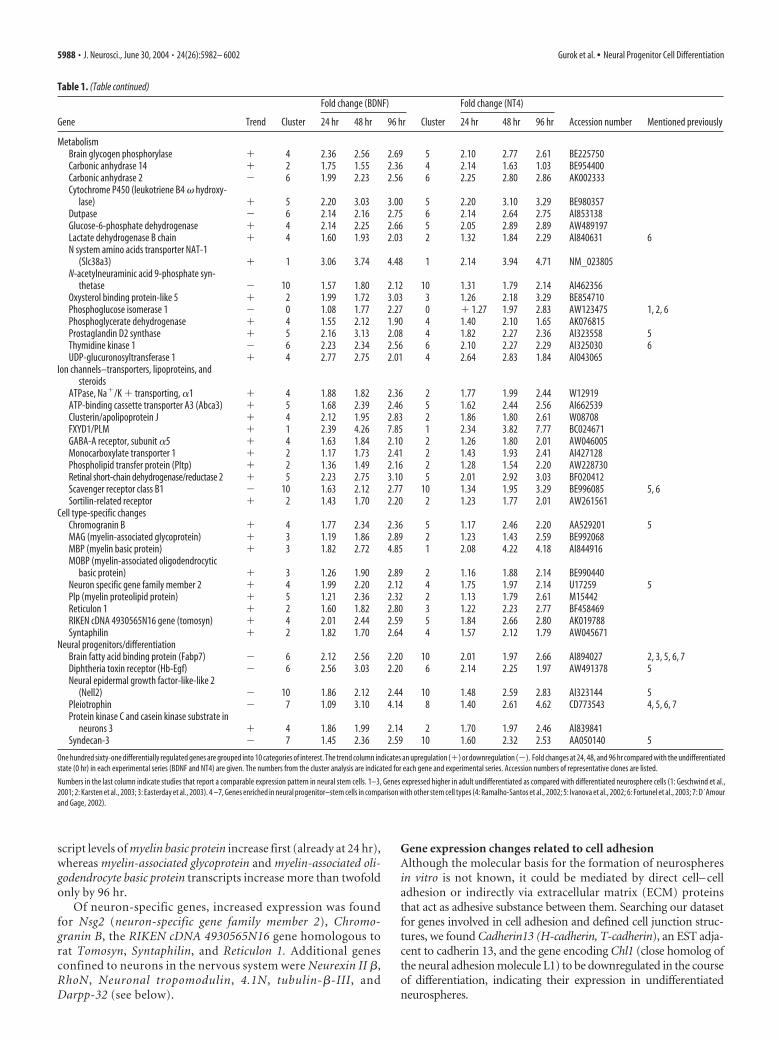
Table 1. Gene expression changes in neural progenitor cells during differentiation
Fold change (BDNF) Fold change (NT4)
Accession number Mentioned previouslyGene Trend Cluster 24 hr 48 hr 96 hr Cluster 24 hr 48 hr 96 hr
Cell– cell adhesionCadherin 13 � 7 1.35 2.97 3.10 7 1.12 3.03 3.42 NM_019707 1, 5, 6EST adjacent to cadherin 13 � 9 1.52 4.90 6.69 8 1.45 4.48 5.87 AW121058 1, 5, 6Cd24 � 2 1.57 1.73 2.23 2 1.49 1.82 2.39 AW553321 4, 6Close homolog of the neural adhesion
molecule L1 � 6 1.88 2.36 2.36 7 1.65 2.77 2.80 AI528777 5Epithelial membrane protein 3 � 2 1.31 1.14 2.39 2 1.12 1.26 2.05 AW912730Neurexin II � 4 1.77 1.86 2.03 4 1.72 2.03 1.99 BE286506Plakophilin-4 (p0071 protein) � 5 1.84 3.00 3.35 5 1.58 3.10 3.49 AI837226
Extracellular matrix components and cell–matrix interaction
Adamts10 � 2 1.52 1.70 2.44 2 1.60 1.72 2.01 BG064835AE binding protein 1 � 2 1.25 1.16 2.97 4 1.58 2.27 2.03 BF118240Collagen IX �3 � 4 2.16 2.12 1.72 4 2.08 1.82 1.60 AV006866 5Collagen XVIII � 10 1.36 1.68 2.51 10 1.38 1.68 2.01 U03714 6Complement component 1 q � � 4 2.29 2.48 2.75 5 2.01 2.56 3.19 AW208835Complement component 3 � 1 2.27 7.24 7.61 1 1.55 4.31 6.89 AI790152Complement component 4 � 1 4.10 5.47 6.17 1 3.60 6.23 6.17 BE369103Complement component factor i � 3 1.42 2.18 3.32 3 1.07 2.44 3.06 BG072327Extracellular matrix protein 2 (Sparc-like 1) � 5 2.25 3.19 3.49 5 1.63 3.06 3.56 W36427Inter-� trypsin inhibitor heavy chain 3 � 3 2.12 2.46 4.31 3 1.82 3.29 4.06 NM_008407Laminin receptor 1 � 10 1.31 1.67 2.03 10 1.57 1.63 2.39 W13846 6Serpina3 � 2 1.39 1.39 2.29 4 2.03 1.55 1.68 BE200266SH3 domain protein 4 (Vinexin/ SCAM-1) � 3 1.03 1.70 3.39 2 1.17 1.75 2.18 AW540876Tenascin C � 7 1.62 2.53 2.36 6 2.12 2.25 1.72 AI157473 2, 4, 5, 6Tissue inhibitor of metalloproteinase 2 � 4 2.20 2.41 3.16 5 1.79 2.72 2.92 W41950 5Tissue inhibitor of metalloproteinase 3 � 4 2.44 1.88 1.95 4 1.80 2.01 2.14 AA712082 2
CytoskeletonActinin, �1 (Striamin) � 5 2.18 2.89 2.92 5 1.67 2.59 2.48 BE688759Active BCR-related gene � 5 1.72 3.10 3.16 5 1.75 3.03 2.72 BF449832Adducin 3 � 4 1.75 1.97 2.18 4 1.82 2.23 2.18 AA500258Arhgap18 � 6 2.20 2.86 2.53 10 1.90 2.20 2.77 BG071822Arhgap5 � 4 1.49 2.03 1.48 2 1.23 1.38 2.03 NM_009706 5Cdc42 effector protein 4 � 3 1.42 2.48 3.16 3 1.48 2.16 2.94 AI844806 6N-chimerin � 6 1.97 2.80 2.86 10 2.18 2.36 3.29 BG088668Coronin actin binding protein 1C � 10 1.40 1.99 2.08 10 1.46 1.93 2.18 AW455561Cysteine-rich protein 1 � 4 1.75 2.39 2.29 4 2.08 2.12 2.18 W18400 5Dynein, axonemal, heavy polypeptide 7 � 4 3.00 1.79 2.80 4 2.53 3.42 1.86 BG292586Dynein, cytoplasmic, light chain 2B � 2 1.54 1.68 2.05 2 1.52 1.31 2.16 BG083926Ezrin (villin 2) � 4 2.25 1.93 2.44 2 1.82 2.05 2.53 AA139292 6Gelsolin � 1 3.00 4.71 6.05 1 2.69 4.35 6.11 AI848142Kinesin heavy chain member 5B � 4 1.70 2.10 2.16 2 1.40 1.46 2.29 AI892690 4Leucine-rich repeat (in FLII) interacting
protein 1 � 8 1.86 1.23 2.92 10 1.40 2.10 3.06 AI461880 2, 4, 6Neuronal protein 4.1 � 2 1.60 1.70 2.16 2 1.32 1.80 2.41 AW049949Plexin B3 � 4 1.31 2.05 1.99 4 1.51 2.41 2.16 BE136019Rac GTPase-activating protein 1 � 10 1.70 2.05 1.82 10 1.80 1.92 2.10 AB030252 1, 2, 5, 6S100 calcium binding protein A1 � 4 1.49 1.95 2.36 2 1.27 1.73 2.36 AK012578 2S100 calcium-binding protein A4 � 5 1.88 2.41 2.72 5 1.77 2.66 3.32 X05835S100 calcium-binding protein A6 � 3 1.84 2.32 3.19 5 1.90 2.36 3.10 AK008241 2S100 protein � polypeptide neural � 5 1.70 2.80 3.74 3 1.22 2.72 3.90 AI835699Sperm-associated antigen 6 � 2 1.23 1.49 2.64 2 1.19 1.75 2.03 NM_015773Thymosin, �10 � 6 2.12 2.27 2.61 6 2.29 2.23 2.61 BE135516 5, 6Transgelin 3 � 3 1.32 2.12 2.59 2 1.30 2.01 2.59 AI426007Tropomodulin 2 � 4 1.72 2.20 2.56 5 1.57 2.34 2.41 BB462768 5Tubulin, �3/7 � 2 1.11 1.49 2.36 2 1.35 1.88 2.59 NM_009446 4Tubulin, �3 � 4 1.86 1.67 2.10 4 1.65 2.29 1.97 AK014302 5, 6Tubulin, �4 � 5 1.34 2.86 2.89 5 1.54 3.06 2.86 AI849897 5
Cell proliferationCdc20 � 9 3.63 6.55 7.10 9 6.69 5.81 6.96 C87100Cdc2a � 9 5.53 4.66 10.07 9 5.93 9.49 8.41 AW990601 1, 2, 4, 6Chromatin assembly factor 1 subunit C
(Rbbp4) � 10 1.49 1.92 2.23 10 1.42 1.75 2.39 AA139889Cyclin B1 � 6 3.71 3.35 3.94 6 3.32 3.97 3.03 AI131574 2, 4Cyclin D1 � 9 5.37 7.69 6.36 9 5.26 6.23 7.69 BE995549 1, 2, 3, 4, 5, 6Cyclin D2 � 9 2.25 4.62 4.53 7 1.93 4.62 2.94 NM_009829 1, 2, 3, 5, 7DNA polymerase �1 � 8 2.05 1.40 2.53 6 1.79 2.53 2.36 AI851668 4, 6DNA polymerase � subunit 4 � 7 1.38 2.20 2.01 10 1.39 1.73 2.05 AK010477DNA replication licensing factor MCM3 � 6 2.92 3.60 4.53 8 3.46 4.01 3.67 BE200058 6DNA replication licensing factor MCM6 � 10 1.45 1.73 2.01 10 1.32 1.73 2.66 BE854336 2
(Table continues)
5986 • J. Neurosci., June 30, 2004 • 24(26):5982– 6002 Gurok et al. • Neural Progenitor Cell Differentiation

Table 1. (Table continued)
Fold change (BDNF) Fold change (NT4)
Accession number Mentioned previouslyGene Trend Cluster 24 hr 48 hr 96 hr Cluster 24 hr 48 hr 96 hr
Fusion 1 (Tusc2) � 8 1.30 1.45 3.53 7 1.80 3.53 1.82 AA672013Kinesin family member 23 � 7 1.73 2.86 3.86 6 3.03 2.94 3.03 AA792884PDZ-binding kinase � 9 5.21 6.69 10.49 9 5.93 7.24 6.62 AW538537 1, 3Pituitary tumor-transforming protein 1/
Securin � 6 2.77 4.22 2.36 6 3.00 4.10 3.29 AA014315 2, 5Signal transduction
Calcium/calmodulin-dependent proteinkinase II � � 9 3.78 4.81 5.10 8 3.16 4.39 6.05 AI849170 5
Calmodulin 1 � 4 1.67 1.95 2.08 4 1.30 2.29 2.05 BG076172Calmodulin-dependent calcineurin A sub-
unit, � � 10 1.92 1.95 2.44 6 1.58 2.08 1.63 AI528006CDP-diacylglycerol synthase 2 � 2 1.30 1.23 2.72 2 1.06 1.31 2.44 AA407759Cornichon-like (Cnil) � 6 2.03 3.06 2.77 10 1.90 2.59 3.03 AI854642DARPP-32 (Ppp1r1b) � 3 1.23 1.67 2.86 3 1.23 1.70 3.60 BF582544Deiodinase iodothyronine type II � 10 1.38 1.77 2.75 10 1.31 1.86 3.22 AF096875Deltex 1 homolog (Drosophila) � 4 1.58 1.90 2.12 4 1.09 2.23 1.46 U38252 5, 6Endothelial differentiation gene 3 � 4 1.86 2.05 2.80 5 1.72 2.25 2.64 BE950940Immediate early response 3 (Ier3, IEX-1) � 6 2.56 2.44 2.92 6 1.86 2.41 1.79 BF681888 6Insulin-like growth factor binding protein 2 � 9 1.93 7.85 16.28 9 2.86 9.21 25.79 AI303805 4, 5, 6Insulin-like growth factor binding protein 4 � 9 2.23 5.58 9.87 8 2.08 4.44 8.85 W08013Insulin-like growth factor binding protein 5 � 1 3.29 4.39 4.48 1 3.32 3.60 4.39 W13388 5, 6, 7Latent transforming growth factor �
binding protein 4 � 4 1.43 1.86 2.01 2 1.43 1.58 2.05 AA051293Membrane protein, palmitoylated (Emp55) � 2 1.34 1.42 2.08 2 1.26 1.49 2.20 AI528528Neurotensin receptor 2 � 5 2.32 3.49 3.82 5 2.51 3.10 2.92 NM_008747 5Nuclear receptor subfamily 4, group A,
member 1 (TR3) � 6 1.86 2.56 3.32 7 1.58 2.51 2.14 AA118943Phosphodiesterase 2A, cGMP-stimulated � 10 1.42 1.68 2.32 7 1.38 2.25 1.73 BC029810Phospholipase A2, group VII � 4 1.54 1.88 2.12 2 1.34 2.16 2.32 AA183265 4Phospholipase C � � 4 1.90 2.32 2.34 4 2.12 3.00 2.25 AI892312 5Protein kinase C � � 6 2.12 2.80 2.59 6 2.01 2.59 1.75 BF658909Ptpns1 (Shps-1) � 1 2.61 4.76 4.48 1 2.27 3.71 4.39 D87968Regulator of G-protein signaling 16 � 6 2.64 2.36 3.82 8 2.97 3.03 3.97 AI876531Regulator of G-protein signaling 2 � 2 1.09 1.34 2.66 2 1.17 1.70 2.44 BF100893Thyroid hormone receptor interactor 6 � 2 1.39 1.57 2.94 3 1.28 1.90 3.19 AW763698TNF receptor-associated factor 1 � 3 1.20 1.62 3.22 5 1.01 2.72 2.41 BG064103TNF receptor superfamily, member 21 � 7 1.32 2.14 2.89 10 1.54 1.48 2.53 AI552031
Chromatin-associated components and nu-clear factors
1700012H05Rik (similar to HNRNP G) � 4 1.84 2.08 1.92 4 1.77 1.86 2.14 AV2126153110024A21Rik � 3 1.35 1.88 2.92 5 1.39 2.23 2.34 NM_0242156330403K07Rik � 1 6.23 8.17 10.91 1 3.97 7.32 14.01 AI430680 7BC031407 (similar to Hs. p66 �) � 3 1.25 2.08 2.92 3 1.12 1.63 3.39 BC038221Bhlhb2 (Stra13) � 10 1.84 2.12 2.27 10 1.31 2.29 2.39 BI686559 5DAN, neuroblastoma suppression of tu-
morigenicity 1 � 4 1.95 2.10 3.03 3 1.62 2.29 3.16 BE956620ENSMUSG00000013419 � 2 1.46 1.86 2.53 4 1.43 2.10 1.77 BF456106Etv5 (Ets-related transcription factor) � 6 2.05 2.94 3.90 6 2.77 3.06 2.77 AW825959Fosb (FBJ osteosarcoma oncogene B) � 10 1.72 1.93 2.23 7 1.23 2.14 1.88 AI846927H2A histone family member X � 10 1.86 2.01 1.80 10 1.82 1.65 2.03 AW228881 4, 5, 6H2A histone family member Z � 10 1.92 2.16 2.36 10 1.72 2.27 2.29 AI605727 1, 3, 4, 5, 6H2Bc � 5 1.55 2.36 2.92 3 1.16 2.39 3.32 AI154951HFH-4 (Foxj1) � 4 1.90 1.86 2.29 4 2.12 2.12 1.95 AW125647High mobility group box 2 � 6 1.97 2.29 2.61 10 1.72 2.16 2.27 AI385899 2, 4, 6Hnrpa1 � 10 1.52 1.72 2.23 10 1.51 1.73 2.05 AA986885 4, 6Hnrpk � 4 1.65 2.20 2.20 4 1.75 1.95 2.23 AI528097 6Inhibitor of DNA binding 4 � 1 2.39 3.86 3.86 1 2.29 3.42 4.06 AI894046 5, 7Karyopherin (importin) �-2 subunit � 10 2.12 2.08 2.32 6 2.36 2.32 2.51 BG066442 6Lrrc8 � 5 1.88 3.19 2.53 4 2.34 2.23 2.12 AA620138Meiosis expressed gene 1 � 1 3.46 4.31 4.48 1 3.29 4.31 5.00 BF011293Oligodendrocyte transcription factor 2 � 10 1.49 1.80 2.29 10 1.57 1.84 2.46 AB038697 2Paternally expressed gene 3 (Peg3) � 8 1.54 1.55 2.97 10 1.36 1.84 2.32 W77030 5Snrp1c � 4 2.05 2.29 2.72 5 1.95 2.41 2.59 W13021Sterol regulatory element binding factor 1
(Srebf1) � 4 2.08 2.41 2.64 5 1.80 2.44 2.94 AI386259Thymopoietin � 10 1.54 2.10 2.03 6 1.82 2.64 2.03 AA734516 4, 6Transcription factor 12 � 10 1.32 1.70 2.03 10 1.34 1.68 2.25 W80054 4, 5, 6YB-1 (Nsep1) � 10 1.40 1.75 2.01 10 1.46 1.63 2.25 AI325280Zdhhc9 � 5 1.35 2.48 2.05 2 1.42 1.84 2.16 AI317353
(Table continues)
Gurok et al. • Neural Progenitor Cell Differentiation J. Neurosci., June 30, 2004 • 24(26):5982– 6002 • 5987
script levels of myelin basic protein increase first (already at 24 hr),whereas myelin-associated glycoprotein and myelin-associated oli-godendrocyte basic protein transcripts increase more than twofoldonly by 96 hr.
Of neuron-specific genes, increased expression was foundfor Nsg2 (neuron-specific gene family member 2), Chromo-granin B, the RIKEN cDNA 4930565N16 gene homologous torat Tomosyn, Syntaphilin, and Reticulon 1. Additional genesconfined to neurons in the nervous system were Neurexin II �,RhoN, Neuronal tropomodulin, 4.1N, tubulin-�-III, andDarpp-32 (see below).
Gene expression changes related to cell adhesionAlthough the molecular basis for the formation of neurospheresin vitro is not known, it could be mediated by direct cell– celladhesion or indirectly via extracellular matrix (ECM) proteinsthat act as adhesive substance between them. Searching our datasetfor genes involved in cell adhesion and defined cell junction struc-tures, we found Cadherin13 (H-cadherin, T-cadherin), an EST adja-cent to cadherin 13, and the gene encoding Chl1 (close homolog ofthe neural adhesion molecule L1) to be downregulated in the courseof differentiation, indicating their expression in undifferentiatedneurospheres.
Table 1. (Table continued)
Fold change (BDNF) Fold change (NT4)
Accession number Mentioned previouslyGene Trend Cluster 24 hr 48 hr 96 hr Cluster 24 hr 48 hr 96 hr
MetabolismBrain glycogen phosphorylase � 4 2.36 2.56 2.69 5 2.10 2.77 2.61 BE225750Carbonic anhydrase 14 � 2 1.75 1.55 2.36 4 2.14 1.63 1.03 BE954400Carbonic anhydrase 2 � 6 1.99 2.23 2.56 6 2.25 2.80 2.86 AK002333Cytochrome P450 (leukotriene B4 � hydroxy-
lase) � 5 2.20 3.03 3.00 5 2.20 3.10 3.29 BE980357Dutpase � 6 2.14 2.16 2.75 6 2.14 2.64 2.75 AI853138Glucose-6-phosphate dehydrogenase � 4 2.14 2.25 2.66 5 2.05 2.89 2.89 AW489197Lactate dehydrogenase B chain � 4 1.60 1.93 2.03 2 1.32 1.84 2.29 AI840631 6N system amino acids transporter NAT-1
(Slc38a3) � 1 3.06 3.74 4.48 1 2.14 3.94 4.71 NM_023805N-acetylneuraminic acid 9-phosphate syn-
thetase � 10 1.57 1.80 2.12 10 1.31 1.79 2.14 AI462356Oxysterol binding protein-like 5 � 2 1.99 1.72 3.03 3 1.26 2.18 3.29 BE854710Phosphoglucose isomerase 1 � 0 1.08 1.77 2.27 0 � 1.27 1.97 2.83 AW123475 1, 2, 6Phosphoglycerate dehydrogenase � 4 1.55 2.12 1.90 4 1.40 2.10 1.65 AK076815Prostaglandin D2 synthase � 5 2.16 3.13 2.08 4 1.82 2.27 2.36 AI323558 5Thymidine kinase 1 � 6 2.23 2.34 2.56 6 2.10 2.27 2.29 AI325030 6UDP-glucuronosyltransferase 1 � 4 2.77 2.75 2.01 4 2.64 2.83 1.84 AI043065
Ion channels–transporters, lipoproteins, andsteroids
ATPase, Na�/K � transporting, �1 � 4 1.88 1.82 2.36 2 1.77 1.99 2.44 W12919ATP-binding cassette transporter A3 (Abca3) � 5 1.68 2.39 2.46 5 1.62 2.44 2.56 AI662539Clusterin/apolipoprotein J � 4 2.12 1.95 2.83 2 1.86 1.80 2.61 W08708FXYD1/PLM � 1 2.39 4.26 7.85 1 2.34 3.82 7.77 BC024671GABA-A receptor, subunit �5 � 4 1.63 1.84 2.10 2 1.26 1.80 2.01 AW046005Monocarboxylate transporter 1 � 2 1.17 1.73 2.41 2 1.43 1.93 2.41 AI427128Phospholipid transfer protein (Pltp) � 2 1.36 1.49 2.16 2 1.28 1.54 2.20 AW228730Retinal short-chain dehydrogenase/reductase 2 � 5 2.23 2.75 3.10 5 2.01 2.92 3.03 BF020412Scavenger receptor class B1 � 10 1.63 2.12 2.77 10 1.34 1.95 3.29 BE996085 5, 6Sortilin-related receptor � 2 1.43 1.70 2.20 2 1.23 1.77 2.01 AW261561
Cell type-specific changesChromogranin B � 4 1.77 2.34 2.36 5 1.17 2.46 2.20 AA529201 5MAG (myelin-associated glycoprotein) � 3 1.19 1.86 2.89 2 1.23 1.43 2.59 BE992068MBP (myelin basic protein) � 3 1.82 2.72 4.85 1 2.08 4.22 4.18 AI844916MOBP (myelin-associated oligodendrocytic
basic protein) � 3 1.26 1.90 2.89 2 1.16 1.88 2.14 BE990440Neuron specific gene family member 2 � 4 1.99 2.20 2.12 4 1.75 1.97 2.14 U17259 5Plp (myelin proteolipid protein) � 5 1.21 2.36 2.32 2 1.13 1.79 2.61 M15442Reticulon 1 � 2 1.60 1.82 2.80 3 1.22 2.23 2.77 BF458469RIKEN cDNA 4930565N16 gene (tomosyn) � 4 2.01 2.44 2.59 5 1.84 2.66 2.80 AK019788Syntaphilin � 2 1.82 1.70 2.64 4 1.57 2.12 1.79 AW045671
Neural progenitors/differentiationBrain fatty acid binding protein (Fabp7) � 6 2.12 2.56 2.20 10 2.01 1.97 2.66 AI894027 2, 3, 5, 6, 7Diphtheria toxin receptor (Hb-Egf) � 6 2.56 3.03 2.20 6 2.14 2.25 1.97 AW491378 5Neural epidermal growth factor-like-like 2
(Nell2) � 10 1.86 2.12 2.44 10 1.48 2.59 2.83 AI323144 5Pleiotrophin � 7 1.09 3.10 4.14 8 1.40 2.61 4.62 CD773543 4, 5, 6, 7Protein kinase C and casein kinase substrate in
neurons 3 � 4 1.86 1.99 2.14 2 1.70 1.97 2.46 AI839841Syndecan-3 � 7 1.45 2.36 2.59 10 1.60 2.32 2.53 AA050140 5
One hundred sixty-one differentially regulated genes are grouped into 10 categories of interest. The trend column indicates an upregulation (�) or downregulation (�). Fold changes at 24, 48, and 96 hr compared with the undifferentiatedstate (0 hr) in each experimental series (BDNF and NT4) are given. The numbers from the cluster analysis are indicated for each gene and experimental series. Accession numbers of representative clones are listed.
Numbers in the last column indicate studies that report a comparable expression pattern in neural stem cells. 1–3, Genes expressed higher in adult undifferentiated as compared with differentiated neurosphere cells (1: Geschwind et al.,2001; 2: Karsten et al., 2003; 3: Easterday et al., 2003). 4 –7, Genes enriched in neural progenitor–stem cells in comparison with other stem cell types (4: Ramalho-Santos et al., 2002; 5: Ivanova et al., 2002; 6: Fortunel et al., 2003; 7: D´Amourand Gage, 2002).
5988 • J. Neurosci., June 30, 2004 • 24(26):5982– 6002 Gurok et al. • Neural Progenitor Cell Differentiation

The most striking decrease, approximately sixfold at 96 hr,was seen in the case of the EST adjacent to cadherin 13. In addi-tion, a cadherin 13 clone showed a strong transcript decrease.Cadherin 13 is a glycosylphosphatidyl inositol (GPI)-linkedmembrane protein that can mediate homophilic cell– cell adhe-sion (for review, see Takeuchi and Ohtsuki, 2001). Moreover,anti-adhesive properties and a function in cell cycle regulationhave been reported (Takeuchi et al., 2000; Huang et al., 2003;Ivanov et al., 2004). Chl1 belongs to the L1 family of neural rec-ognition molecules and promotes neurite outgrowth and neuro-nal survival and enhances integrin-mediated cell migration (Hill-enbrand et al., 1999; Buhusi et al., 2003).
Some genes of the cell adhesion category were upregulated,suggesting a role in cellular contacts between differentiating cells:Cd24, Emp3, Neurexin II, and Plakophilin-4. The first two fall into
cluster 2, which contains very late gene expression changes. Noneof them belongs to cluster 1. CD24 is a membrane-anchoredglycoprotein expressed in the SVZ by neuroblasts (type A cells),in the SVZ ependymal cells, and in the brain parenchyma bydifferentiated neurons (Calaora et al., 1996; Doetsch et al., 2002).It binds to L1 on neighboring cells and has been shown to influ-ence neurite outgrowth. The Neurexin II cDNA clone on ourarray shows highest similarity to a Neurexin II � variant (forreview, see Missler and Sudhof, 1998). � Neurexins have beenimplicated in heterophilic cell– cell adhesion and assembly ofpresynaptic terminals (Dean et al., 2003). The gene encodingPlakophilin-4 (p0071 protein/Nprap), an intracellular plaqueprotein at adherens junctions and desmosomes in epithelial cells,shows gradually increasing transcript levels (cluster 5). The Emp3(Hnmp-1) product belongs to the PMP22 family of tetra-
Figure 3. A, Clusters of clones with similar expression changes over time. The dynamic behavior of the 441 clones that are consistently upregulated or downregulated in both the BDNF and theNT4 series is shown separately. For each series, 10 clusters were found. Clusters 1–5 contain upregulated clones; clusters 6 –10 contain downregulated clones. The x-axis depicts the three time pointsof differentiation. The y-axis shows relative fold changes; that is, expression changes referred to the undifferentiated state (0 hr). These relative numbers are estimated logarithmic fold changes andtherefore not identical to the estimated fold changes listed in Table 1. The logarithmic values allow a better graphic presentation. Note that y-axis values at 24 hr, which are different from the value0, indicate that the expression of a clone changed already between 0 and 24 hr. B, Numbers of clones contained in each cluster of the NT4 and BDNF series.
Gurok et al. • Neural Progenitor Cell Differentiation J. Neurosci., June 30, 2004 • 24(26):5982– 6002 • 5989
spanning membrane proteins and is thought to be involved incell– cell interactions and cell proliferation. The Sh3 domain pro-tein 4 (vinexin) binds vinculin and localizes to sites of cell–matrixinteractions (focal adhesions) and at cell– cell adhesions. It will beof interest to investigate the upregulated genes on the proteinlevel to assign them to specific cell types.
Gene expression changes related to extracellularmatrix componentsECM molecules serve as a scaffold for the aggregation of cellswithin tissues. In addition, they constitute a cellular microenvi-ronment that influences cell behavior, including cell migrationand differentiation. These processes are controlled in part by bi-ologically active molecules such as growth factors, which arestored in the ECM.
Our study revealed three transcripts encoding ECM proteinsthat are downregulated in differentiated cells compared with un-differentiated, floating cells: Tenascin C, Collagen XVIII, andLaminin receptor 1.
Tenascin C is present in the SVZ, RMS, and olfactory bulb.Specifically, it corresponds to GFAP-positive processes that formthe tunnel through which SVZ neuroblasts migrate (Jankovskiand Sotelo, 1996). In the embryonic brain, it is expressed by radialglial cells (Malatesta et al., 2003). Tenascin mediates adhesion ofcells, either increasing or decreasing it (Jones and Jones, 2000).Collagen XVIII is a basement membrane component. One splicevariant is expressed in brain (Muragaki et al., 1995; Saarela et al.,1998; Sertie et al., 2000). The downregulation of the gene encod-ing Laminin receptor 1 is in line with its expression in undiffer-entiated, mitotically active progenitor and tumor cells in contrastto differentiated forms of these cells (for review, see Menard et al.,1997).
ECM genes that were upregulated in our study encode theAdipocyte enhancer binding protein 1 (Aortic carboxypeptidase-like protein), Extracellular matrix protein 2 (Sparcl1, Mast9,Hevin), Collagen IX � 3, an extracellular metalloprotease (Ad-amts10), and several inhibitors of proteinases that participate inECM degradation: TIMP2, TIMP3, Serpina3k, and Inter-� tryp-sin inhibitor heavy chain 3.
The increased expression of these inhibitors suggests a stabi-lization of certain ECM components of differentiating cells. Inadult rats TIMP3 is localized in the SVZ, the rostral migratorystream, and the olfactory bulb. It has been discussed as a mediatorof neuronal migration by regulating axon guidance and processoutgrowth (Jaworski and Fager, 2000).
Gene expression changes of complement componentsComplement regulatory proteins and receptors are expressed byneurons and glial cells of the CNS (Nataf et al., 1999; Thomas etal., 2000; Yu et al., 2002; Jauneau et al., 2003). We found increasedexpression during neurosphere differentiation of four genes be-longing to the complement cascade. These genes encode C3 andC4 precursors, the C1qb component, and Complement factor Iprecursor, which inactivates C3b and C4b. C3 and C4 belong tocluster 1, which contains strongly upregulated genes.
Gene expression changes related to the actin cytoskeletonWe found many differentially expressed genes, mostly upregu-lated, that are involved in morphological changes expected totake place during the switch from a round neurosphere cell that isheld in a floating cell ball to an adherent cell that extends cellularprocesses. The building and breakdown of actin filaments (actinturnover) at the cellular periphery is an indispensable event for
the establishment of cellular protrusions, including the extensionof dendrites and axons. Furthermore, it is important for the ex-tension of leading edges as one mechanism of neuronal migra-tion. Many factors control actin turnover at these structures: up-stream acting key mediators including Rho family GTPases,plexins, which regulate axon guidance through these GTPases,and actin-binding and actin-remodeling proteins (Meyer andFeldman, 2002; Small et al., 2002).
A member of the Rho family GTPases, Rho7 (RhoN), andgenes coding for proteins that influence GTPase activity, e.g.,PlexinB3, Arhgap5, MgcRacgap, Active bcr-related gene, and Cdc42effector protein 4 gene increased in expression, whereas Arhgap18and N-chimerin decreased. Several genes the products of whichdirectly or indirectly bind actin, some of which influence actinpolymerization, were upregulated: Non-muscle � actinin 1,Cysteine-rich protein 1 (Crp1), Coronin actin binding protein 1C,Gelsolin (ADF/brevin), Neuronal tropomodulin (tropomodulin 2),and an EST homologous to the human actin binding LIM protein1 and similar to Caenorhabditis elegans UNC-115. Prothymosin �10 transcripts decreased.
An increase in transcription was also observed for three genesencoding proteins implicated in the linkage of actin to the cellmembrane: Ezrin (Villin2), Neuronal protein 4.1, and Adducin 3(Gamma adducin). Ezrin localizes to fine, peripheral astrocyticprocesses but not to neurons (Derouiche and Frotscher, 2001). Afunction in neuronal development, however, was proposed onthe basis of its localization at neuronal growth cone filopodia andperikarya in vitro (Goslin et al., 1989; Birgbauer et al., 1991; Pa-glini et al., 1998) and on its neuronal localization in the chickembryo (Everett and Nichol, 1990; Takahashi et al., 1999). Ad-ducin is important for the regulation of membrane ruffling andcell motility. It localizes to dendritic spines of neurons and isassociated with regions of morphogenetic cell movement in thechick embryo (Matsuoka et al., 1998; Akai and Storey, 2002).
Furthermore, four genes encoding calcium-binding proteinsof the S100 family increase in expression: S100A1, S100A4,S100A6, and S100B. Calcium-binding proteins of this family ex-ert multiple intracellular functions (regulation of enzyme activi-ties, modification of the actin cytoskeleton, calcium homeostasis,cell growth, and differentiation). Several of them also have extra-cellular functions, including regulatory effects on neural cells (forreview, see Donato, 2003). All but one of the identified S100 genes(S100A6/Calcyclin) promote neurite extension as an extracellulareffect. Furthermore, S100A4 regulates metastasis and is intracel-lularly present at the leading edge of lamellipodia where it inter-acts with Myosin heavy chain IIA (Kim and Helfman, 2003).S100B is strongly expressed by astrocytes, and the secreted formalso influences neuronal survival.
Gene expression changes related to the tubulin cytoskeletonBesides the actin cytoskeleton, components of the microtubulefilament system changed in expression during neurosphere dif-ferentiation. All of them were upregulated and, with one excep-tion, changed late in our experiments (none above twofold before48 hr). They include the tubulin-�-III, �-4, �-3/7 genes and theSperm-associated antigen 6 (Spag6). Furthermore, they encodemicrotubule motor proteins, the cytoplasmic dynein 2B lightchain, the axonemal dynein heavy polypeptide 7, and the kinesinheavy chain member 5B.
SPAG6 is found in motile structures (motor cilia and flagella)that contain an axoneme (“9 � 2” structure) built from nineouter microtubule pairs and one inner microtubule pair (calledthe central apparatus) together with dyneins and is required for
5990 • J. Neurosci., June 30, 2004 • 24(26):5982– 6002 Gurok et al. • Neural Progenitor Cell Differentiation
their structural integrity and function (Sapiro et al., 2002).Within the axoneme, SPAG6 is localized to the central apparatus.Of CNS cells, ependymal cells lining the ventricles carry multiplemotor cilia. Type B SVZ astrocytes often have a single cilium witha “9 � 0” microtubule structure. Both types of cilia extend intothe lateral ventricle space (Doetsch et al., 1997, 1999). The latterstructure is found in sensory cilia and in the unique motile mono-cilia of embryonic node cells (Brody et al., 2000).
Microtubule motor proteins fulfill a specialized function inmotor cilia and flagella. In addition, these proteins mediate thetransport of cargos along microtubules, including synaptic vesi-cle transport within axons.
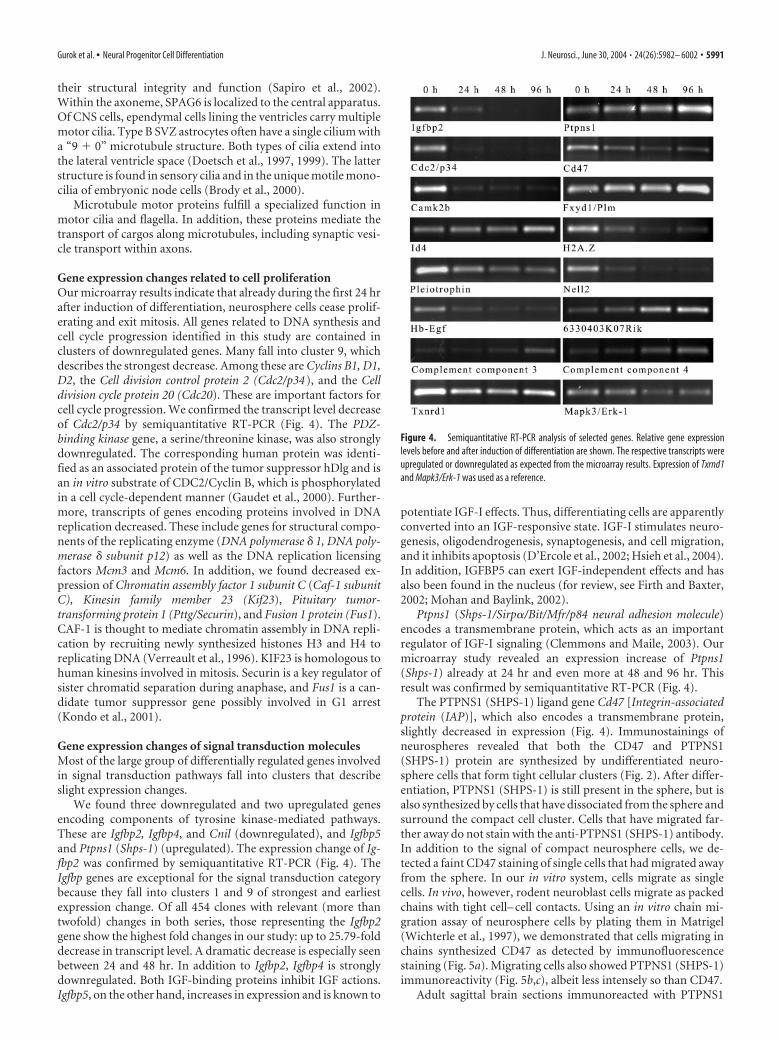
Gene expression changes related to cell proliferationOur microarray results indicate that already during the first 24 hrafter induction of differentiation, neurosphere cells cease prolif-erating and exit mitosis. All genes related to DNA synthesis andcell cycle progression identified in this study are contained inclusters of downregulated genes. Many fall into cluster 9, whichdescribes the strongest decrease. Among these are Cyclins B1, D1,D2, the Cell division control protein 2 (Cdc2/p34), and the Celldivision cycle protein 20 (Cdc20). These are important factors forcell cycle progression. We confirmed the transcript level decreaseof Cdc2/p34 by semiquantitative RT-PCR (Fig. 4). The PDZ-binding kinase gene, a serine/threonine kinase, was also stronglydownregulated. The corresponding human protein was identi-fied as an associated protein of the tumor suppressor hDlg and isan in vitro substrate of CDC2/Cyclin B, which is phosphorylatedin a cell cycle-dependent manner (Gaudet et al., 2000). Further-more, transcripts of genes encoding proteins involved in DNAreplication decreased. These include genes for structural compo-nents of the replicating enzyme (DNA polymerase � 1, DNA poly-merase � subunit p12) as well as the DNA replication licensingfactors Mcm3 and Mcm6. In addition, we found decreased ex-pression of Chromatin assembly factor 1 subunit C (Caf-1 subunitC), Kinesin family member 23 (Kif23), Pituitary tumor-transforming protein 1 (Pttg/Securin), and Fusion 1 protein (Fus1).CAF-1 is thought to mediate chromatin assembly in DNA repli-cation by recruiting newly synthesized histones H3 and H4 toreplicating DNA (Verreault et al., 1996). KIF23 is homologous tohuman kinesins involved in mitosis. Securin is a key regulator ofsister chromatid separation during anaphase, and Fus1 is a can-didate tumor suppressor gene possibly involved in G1 arrest(Kondo et al., 2001).
Gene expression changes of signal transduction moleculesMost of the large group of differentially regulated genes involvedin signal transduction pathways fall into clusters that describeslight expression changes.
We found three downregulated and two upregulated genesencoding components of tyrosine kinase-mediated pathways.These are Igfbp2, Igfbp4, and Cnil (downregulated), and Igfbp5and Ptpns1 (Shps-1) (upregulated). The expression change of Ig-fbp2 was confirmed by semiquantitative RT-PCR (Fig. 4). TheIgfbp genes are exceptional for the signal transduction categorybecause they fall into clusters 1 and 9 of strongest and earliestexpression change. Of all 454 clones with relevant (more thantwofold) changes in both series, those representing the Igfbp2gene show the highest fold changes in our study: up to 25.79-folddecrease in transcript level. A dramatic decrease is especially seenbetween 24 and 48 hr. In addition to Igfbp2, Igfbp4 is stronglydownregulated. Both IGF-binding proteins inhibit IGF actions.Igfbp5, on the other hand, increases in expression and is known to
potentiate IGF-I effects. Thus, differentiating cells are apparentlyconverted into an IGF-responsive state. IGF-I stimulates neuro-genesis, oligodendrogenesis, synaptogenesis, and cell migration,and it inhibits apoptosis (D’Ercole et al., 2002; Hsieh et al., 2004).In addition, IGFBP5 can exert IGF-independent effects and hasalso been found in the nucleus (for review, see Firth and Baxter,2002; Mohan and Baylink, 2002).
Ptpns1 (Shps-1/Sirp�/Bit/Mfr/p84 neural adhesion molecule)encodes a transmembrane protein, which acts as an importantregulator of IGF-I signaling (Clemmons and Maile, 2003). Ourmicroarray study revealed an expression increase of Ptpns1(Shps-1) already at 24 hr and even more at 48 and 96 hr. Thisresult was confirmed by semiquantitative RT-PCR (Fig. 4).
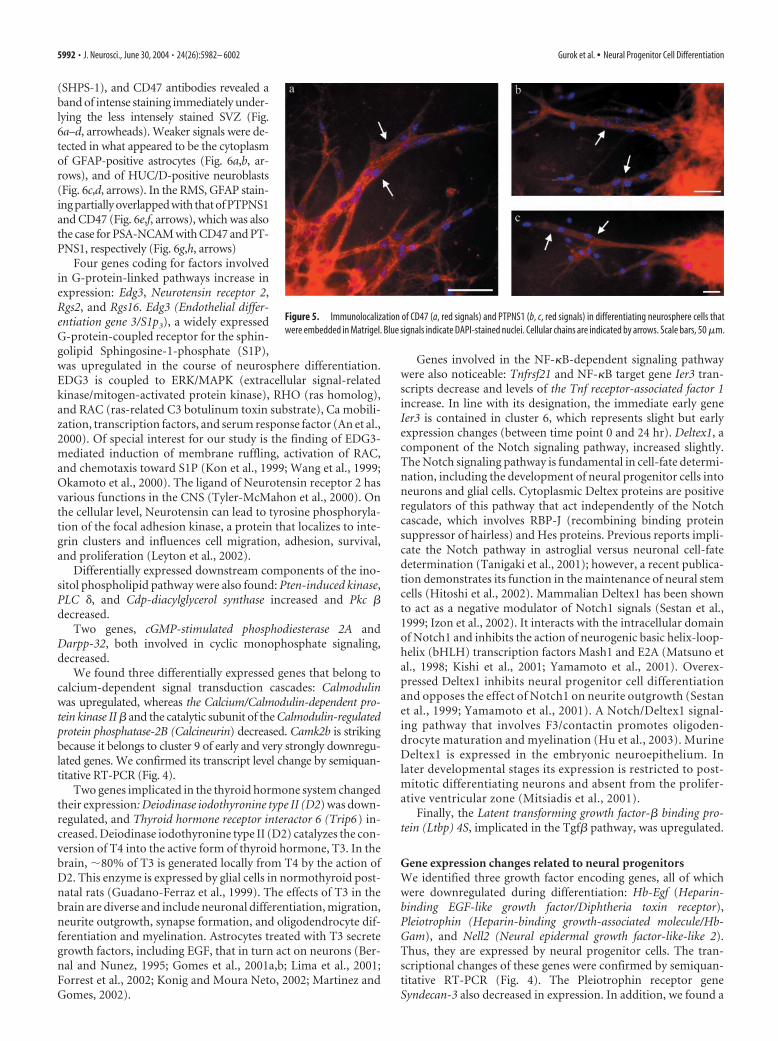
The PTPNS1 (SHPS-1) ligand gene Cd47 [Integrin-associatedprotein (IAP)], which also encodes a transmembrane protein,slightly decreased in expression (Fig. 4). Immunostainings ofneurospheres revealed that both the CD47 and PTPNS1(SHPS-1) protein are synthesized by undifferentiated neuro-sphere cells that form tight cellular clusters (Fig. 2). After differ-entiation, PTPNS1 (SHPS-1) is still present in the sphere, but isalso synthesized by cells that have dissociated from the sphere andsurround the compact cell cluster. Cells that have migrated far-ther away do not stain with the anti-PTPNS1 (SHPS-1) antibody.In addition to the signal of compact neurosphere cells, we de-tected a faint CD47 staining of single cells that had migrated awayfrom the sphere. In our in vitro system, cells migrate as singlecells. In vivo, however, rodent neuroblast cells migrate as packedchains with tight cell– cell contacts. Using an in vitro chain mi-gration assay of neurosphere cells by plating them in Matrigel(Wichterle et al., 1997), we demonstrated that cells migrating inchains synthesized CD47 as detected by immunofluorescencestaining (Fig. 5a). Migrating cells also showed PTPNS1 (SHPS-1)immunoreactivity (Fig. 5b,c), albeit less intensely so than CD47.
Adult sagittal brain sections immunoreacted with PTPNS1
Figure 4. Semiquantitative RT-PCR analysis of selected genes. Relative gene expressionlevels before and after induction of differentiation are shown. The respective transcripts wereupregulated or downregulated as expected from the microarray results. Expression of Txrnd1and Mapk3/Erk-1 was used as a reference.
Gurok et al. • Neural Progenitor Cell Differentiation J. Neurosci., June 30, 2004 • 24(26):5982– 6002 • 5991
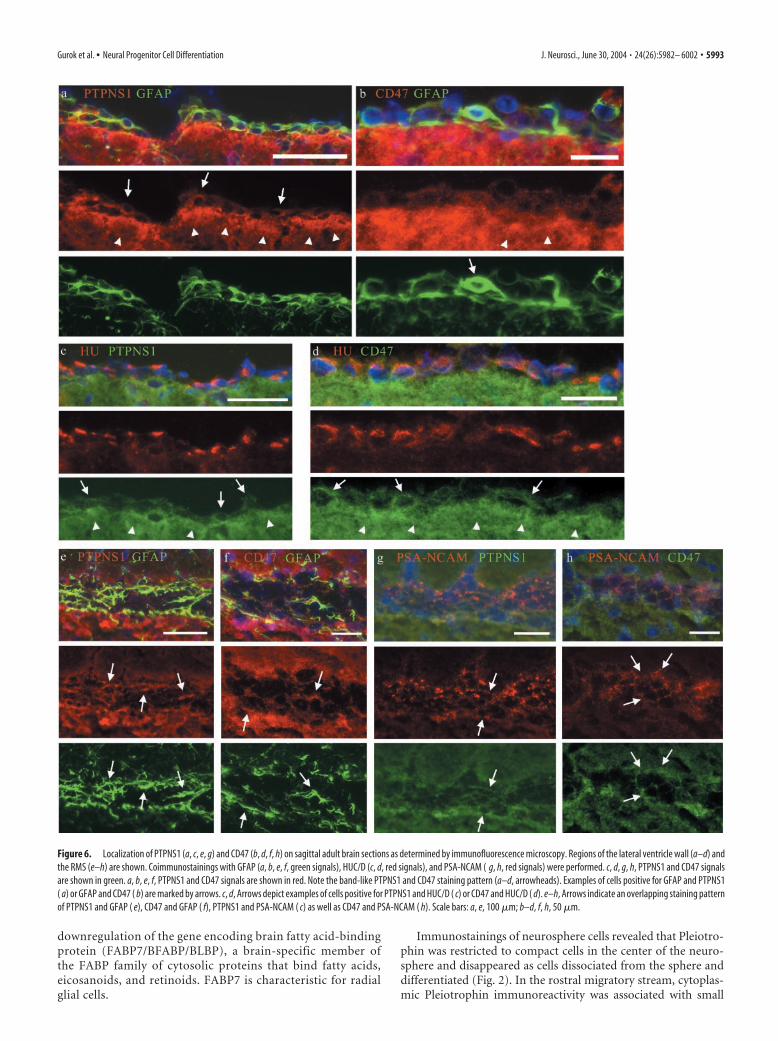
(SHPS-1), and CD47 antibodies revealed aband of intense staining immediately under-lying the less intensely stained SVZ (Fig.6a–d, arrowheads). Weaker signals were de-tected in what appeared to be the cytoplasmof GFAP-positive astrocytes (Fig. 6a,b, ar-rows), and of HUC/D-positive neuroblasts(Fig. 6c,d, arrows). In the RMS, GFAP stain-ing partially overlapped with that of PTPNS1and CD47 (Fig. 6e,f, arrows), which was alsothe case for PSA-NCAM with CD47 and PT-PNS1, respectively (Fig. 6g,h, arrows)
Four genes coding for factors involvedin G-protein-linked pathways increase inexpression: Edg3, Neurotensin receptor 2,Rgs2, and Rgs16. Edg3 (Endothelial differ-entiation gene 3/S1p3), a widely expressedG-protein-coupled receptor for the sphin-golipid Sphingosine-1-phosphate (S1P),was upregulated in the course of neurosphere differentiation.EDG3 is coupled to ERK/MAPK (extracellular signal-relatedkinase/mitogen-activated protein kinase), RHO (ras homolog),and RAC (ras-related C3 botulinum toxin substrate), Ca mobili-zation, transcription factors, and serum response factor (An et al.,2000). Of special interest for our study is the finding of EDG3-mediated induction of membrane ruffling, activation of RAC,and chemotaxis toward S1P (Kon et al., 1999; Wang et al., 1999;Okamoto et al., 2000). The ligand of Neurotensin receptor 2 hasvarious functions in the CNS (Tyler-McMahon et al., 2000). Onthe cellular level, Neurotensin can lead to tyrosine phosphoryla-tion of the focal adhesion kinase, a protein that localizes to inte-grin clusters and influences cell migration, adhesion, survival,and proliferation (Leyton et al., 2002).
Differentially expressed downstream components of the ino-sitol phospholipid pathway were also found: Pten-induced kinase,PLC �, and Cdp-diacylglycerol synthase increased and Pkc �decreased.
Two genes, cGMP-stimulated phosphodiesterase 2A andDarpp-32, both involved in cyclic monophosphate signaling,decreased.
We found three differentially expressed genes that belong tocalcium-dependent signal transduction cascades: Calmodulinwas upregulated, whereas the Calcium/Calmodulin-dependent pro-tein kinase II � and the catalytic subunit of the Calmodulin-regulatedprotein phosphatase-2B (Calcineurin) decreased. Camk2b is strikingbecause it belongs to cluster 9 of early and very strongly downregu-lated genes. We confirmed its transcript level change by semiquan-titative RT-PCR (Fig. 4).
Two genes implicated in the thyroid hormone system changedtheir expression: Deiodinase iodothyronine type II (D2) was down-regulated, and Thyroid hormone receptor interactor 6 (Trip6) in-creased. Deiodinase iodothyronine type II (D2) catalyzes the con-version of T4 into the active form of thyroid hormone, T3. In thebrain, �80% of T3 is generated locally from T4 by the action ofD2. This enzyme is expressed by glial cells in normothyroid post-natal rats (Guadano-Ferraz et al., 1999). The effects of T3 in thebrain are diverse and include neuronal differentiation, migration,neurite outgrowth, synapse formation, and oligodendrocyte dif-ferentiation and myelination. Astrocytes treated with T3 secretegrowth factors, including EGF, that in turn act on neurons (Ber-nal and Nunez, 1995; Gomes et al., 2001a,b; Lima et al., 2001;Forrest et al., 2002; Konig and Moura Neto, 2002; Martinez andGomes, 2002).
Genes involved in the NF-�B-dependent signaling pathwaywere also noticeable: Tnfrsf21 and NF-�B target gene Ier3 tran-scripts decrease and levels of the Tnf receptor-associated factor 1increase. In line with its designation, the immediate early geneIer3 is contained in cluster 6, which represents slight but earlyexpression changes (between time point 0 and 24 hr). Deltex1, acomponent of the Notch signaling pathway, increased slightly.The Notch signaling pathway is fundamental in cell-fate determi-nation, including the development of neural progenitor cells intoneurons and glial cells. Cytoplasmic Deltex proteins are positiveregulators of this pathway that act independently of the Notchcascade, which involves RBP-J (recombining binding proteinsuppressor of hairless) and Hes proteins. Previous reports impli-cate the Notch pathway in astroglial versus neuronal cell-fatedetermination (Tanigaki et al., 2001); however, a recent publica-tion demonstrates its function in the maintenance of neural stemcells (Hitoshi et al., 2002). Mammalian Deltex1 has been shownto act as a negative modulator of Notch1 signals (Sestan et al.,1999; Izon et al., 2002). It interacts with the intracellular domainof Notch1 and inhibits the action of neurogenic basic helix-loop-helix (bHLH) transcription factors Mash1 and E2A (Matsuno etal., 1998; Kishi et al., 2001; Yamamoto et al., 2001). Overex-pressed Deltex1 inhibits neural progenitor cell differentiationand opposes the effect of Notch1 on neurite outgrowth (Sestanet al., 1999; Yamamoto et al., 2001). A Notch/Deltex1 signal-ing pathway that involves F3/contactin promotes oligoden-drocyte maturation and myelination (Hu et al., 2003). MurineDeltex1 is expressed in the embryonic neuroepithelium. Inlater developmental stages its expression is restricted to post-mitotic differentiating neurons and absent from the prolifer-ative ventricular zone (Mitsiadis et al., 2001).
Finally, the Latent transforming growth factor-� binding pro-tein (Ltbp) 4S, implicated in the Tgf� pathway, was upregulated.
Gene expression changes related to neural progenitorsWe identified three growth factor encoding genes, all of whichwere downregulated during differentiation: Hb-Egf (Heparin-binding EGF-like growth factor/Diphtheria toxin receptor),Pleiotrophin (Heparin-binding growth-associated molecule/Hb-Gam), and Nell2 (Neural epidermal growth factor-like-like 2).Thus, they are expressed by neural progenitor cells. The tran-scriptional changes of these genes were confirmed by semiquan-titative RT-PCR (Fig. 4). The Pleiotrophin receptor geneSyndecan-3 also decreased in expression. In addition, we found a
Figure 5. Immunolocalization of CD47 (a, red signals) and PTPNS1 (b, c, red signals) in differentiating neurosphere cells thatwere embedded in Matrigel. Blue signals indicate DAPI-stained nuclei. Cellular chains are indicated by arrows. Scale bars, 50 �m.
5992 • J. Neurosci., June 30, 2004 • 24(26):5982– 6002 Gurok et al. • Neural Progenitor Cell Differentiation
downregulation of the gene encoding brain fatty acid-bindingprotein (FABP7/BFABP/BLBP), a brain-specific member ofthe FABP family of cytosolic proteins that bind fatty acids,eicosanoids, and retinoids. FABP7 is characteristic for radialglial cells.
Immunostainings of neurosphere cells revealed that Pleiotro-phin was restricted to compact cells in the center of the neuro-sphere and disappeared as cells dissociated from the sphere anddifferentiated (Fig. 2). In the rostral migratory stream, cytoplas-mic Pleiotrophin immunoreactivity was associated with small
Figure 6. Localization of PTPNS1 (a, c, e, g) and CD47 (b, d, f, h) on sagittal adult brain sections as determined by immunofluorescence microscopy. Regions of the lateral ventricle wall (a–d) andthe RMS (e–h) are shown. Coimmunostainings with GFAP (a, b, e, f, green signals), HUC/D (c, d, red signals), and PSA-NCAM ( g, h, red signals) were performed. c, d, g, h, PTPNS1 and CD47 signalsare shown in green. a, b, e, f, PTPNS1 and CD47 signals are shown in red. Note the band-like PTPNS1 and CD47 staining pattern (a–d, arrowheads). Examples of cells positive for GFAP and PTPNS1( a) or GFAP and CD47 ( b) are marked by arrows. c, d, Arrows depict examples of cells positive for PTPNS1 and HUC/D ( c) or CD47 and HUC/D ( d). e–h, Arrows indicate an overlapping staining patternof PTPNS1 and GFAP ( e), CD47 and GFAP ( f), PTPNS1 and PSA-NCAM ( c) as well as CD47 and PSA-NCAM ( h). Scale bars: a, e, 100 �m; b–d, f, h, 50 �m.
Gurok et al. • Neural Progenitor Cell Differentiation J. Neurosci., June 30, 2004 • 24(26):5982– 6002 • 5993
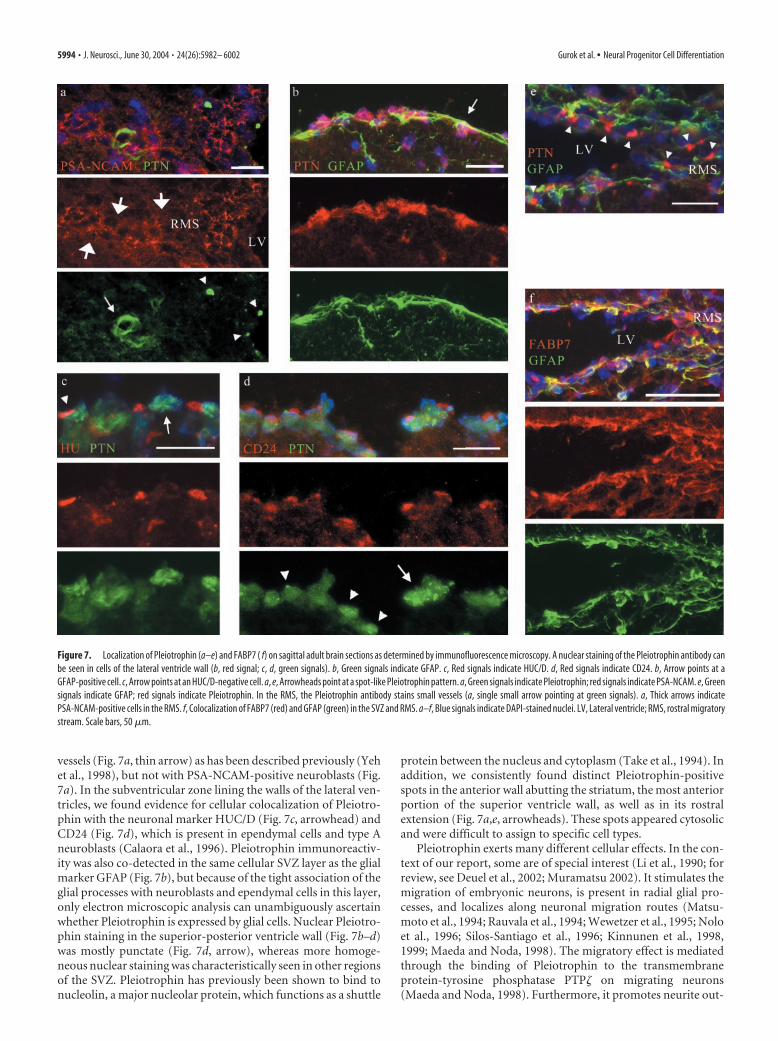
vessels (Fig. 7a, thin arrow) as has been described previously (Yehet al., 1998), but not with PSA-NCAM-positive neuroblasts (Fig.7a). In the subventricular zone lining the walls of the lateral ven-tricles, we found evidence for cellular colocalization of Pleiotro-phin with the neuronal marker HUC/D (Fig. 7c, arrowhead) andCD24 (Fig. 7d), which is present in ependymal cells and type Aneuroblasts (Calaora et al., 1996). Pleiotrophin immunoreactiv-ity was also co-detected in the same cellular SVZ layer as the glialmarker GFAP (Fig. 7b), but because of the tight association of theglial processes with neuroblasts and ependymal cells in this layer,only electron microscopic analysis can unambiguously ascertainwhether Pleiotrophin is expressed by glial cells. Nuclear Pleiotro-phin staining in the superior-posterior ventricle wall (Fig. 7b–d)was mostly punctate (Fig. 7d, arrow), whereas more homoge-neous nuclear staining was characteristically seen in other regionsof the SVZ. Pleiotrophin has previously been shown to bind tonucleolin, a major nucleolar protein, which functions as a shuttle
protein between the nucleus and cytoplasm (Take et al., 1994). Inaddition, we consistently found distinct Pleiotrophin-positivespots in the anterior wall abutting the striatum, the most anteriorportion of the superior ventricle wall, as well as in its rostralextension (Fig. 7a,e, arrowheads). These spots appeared cytosolicand were difficult to assign to specific cell types.
Pleiotrophin exerts many different cellular effects. In the con-text of our report, some are of special interest (Li et al., 1990; forreview, see Deuel et al., 2002; Muramatsu 2002). It stimulates themigration of embryonic neurons, is present in radial glial pro-cesses, and localizes along neuronal migration routes (Matsu-moto et al., 1994; Rauvala et al., 1994; Wewetzer et al., 1995; Noloet al., 1996; Silos-Santiago et al., 1996; Kinnunen et al., 1998,1999; Maeda and Noda, 1998). The migratory effect is mediatedthrough the binding of Pleiotrophin to the transmembraneprotein-tyrosine phosphatase PTP� on migrating neurons(Maeda and Noda, 1998). Furthermore, it promotes neurite out-
Figure 7. Localization of Pleiotrophin (a–e) and FABP7 ( f) on sagittal adult brain sections as determined by immunofluorescence microscopy. A nuclear staining of the Pleiotrophin antibody canbe seen in cells of the lateral ventricle wall (b, red signal; c, d, green signals). b, Green signals indicate GFAP. c, Red signals indicate HUC/D. d, Red signals indicate CD24. b, Arrow points at aGFAP-positive cell. c, Arrow points at an HUC/D-negative cell. a, e, Arrowheads point at a spot-like Pleiotrophin pattern. a, Green signals indicate Pleiotrophin; red signals indicate PSA-NCAM. e, Greensignals indicate GFAP; red signals indicate Pleiotrophin. In the RMS, the Pleiotrophin antibody stains small vessels (a, single small arrow pointing at green signals). a, Thick arrows indicatePSA-NCAM-positive cells in the RMS. f, Colocalization of FABP7 (red) and GFAP (green) in the SVZ and RMS. a–f, Blue signals indicate DAPI-stained nuclei. LV, Lateral ventricle; RMS, rostral migratorystream. Scale bars, 50 �m.
5994 • J. Neurosci., June 30, 2004 • 24(26):5982– 6002 Gurok et al. • Neural Progenitor Cell Differentiation

growth, likely mediated through another receptor, Syndecan-3(Raulo et al., 1994). Syndecan-3 is a transmembrane proteogly-can that binds to extracellular ligands and regulates signaling andcytoskeletal organization during developmental processes. It islocalized to axons in the developing brain and to oligodendrocyteprogenitors (Kinnunen et al., 1998; Hsueh and Sheng, 1999; Win-kler et al., 2002) (for review, see Rapraeger, 2001).
Antibodies against FABP7 stain the neurosphere as well as thecell body and cellular processes of differentiating cells close to thecell cluster (Fig. 2). In the brain, FABP7 was found in the SVZ andalong the RMS. The FABP signals coincided entirely with theGFAP staining, which strongly suggests that SVZ astrocytes syn-thesize FABP7 (Fig. 7f). Because the monoclonal GFAP antibodythat we used is known to specifically recognize type B cells (neu-rogenic astrocytes) but not type C cells (transit-amplifying cells)(Doetsch et al., 2002), we conclude that FABP7 is expressed bytype B cells.
FABPs are believed to play a role in the cellular solubilization,transport, and metabolism of their ligands, and the spatiotempo-ral production of mouse Fabp7 mRNA and protein correlateswith differentiation of neuronal and glial cells (Feng et al., 1994;Kurtz et al., 1994). At embryonic day 10 (E10), it is expressed inthe CNS columnar neuroepithelium, and from E12 to E14 be-comes enriched in radial glial cell bodies at the ventricular sur-face, which extend FABP7-positive radial processes through theventricular wall to the pial surface. This expression parallels theappearance of a broad layer of MAP2-positive neuronal cells inthe intermediate zone of the ventricular wall. At later stages,FABP7 is no longer present in the ventricular zone; it is restrictedto cells attached to the pial surface. This change in expressionreflects a transition from radial glial cells to astrocytes. In theadult CNS, FABP7 has been detected in Bergmann glial cells ofthe cerebellum, in radial glial cells spanning the granule cell layerof the hippocampus, in the glia limitans, and in some astrocytesthroughout the CNS. The application of anti-FABP7 antibodiesto primary cell cultures led to an inhibition of glial and neuronaldifferentiation but did not show any effect on cell proliferation oradhesion (Feng et al., 1994).
Hb-Egf had transcriptional changes characteristic of cluster 6,with the strongest downregulation occurring at 48 hr. HB-EGFexists as a membrane-bound form (proHB-EGF) that is growthinhibitory. Through ectodomain shedding, a secreted form(sHB-EGF) is generated. The secreted form acts as a mitogen formultipotent neural progenitor cells in vitro as well as in vivo,particularly within the SVZ, and enhances neuronal survival(Kornblum et al., 1999; Caric et al., 2001; Jin et al., 2002, 2003). Insitu hybridization studies on the expression of Hb-Egf in postna-tal brain are contradictory. Nakagawa et al. (1998) found highlevels within proliferative regions including the subventricularzone; Kornblum et al. (1999) did not. Caric et al. (2001) reportedHb-Egf expression in several migration pathways within the CNS.
Nell2 belongs to cluster 10, showing steadily increasing down-regulation with time. It encodes a glycoprotein found in therough endoplasmic reticulum and is secreted into the extracellu-lar space (Kuroda et al., 1999). Immunocytochemical studies re-vealed its presence in brain, but not in peripheral tissues, andexpression by neurons, but not by glial cells. NELL2 protein isabundant in the hippocampus and cerebral cortex, and moderatelevels are found in the olfactory bulb (Oyasu et al., 2000). In theembryonic rat, Nell2 mRNA is detected in ventricular and differ-entiating zone of the spinal cord, medulla, and pons (Kim et al.,2002). In chick embryos, transcripts are found in the spinal cordventricular zone and differentiating areas, whereas in the CNS
Nell2 mRNA is restricted to postmitotic neurons as they startdifferentiation (Nelson et al., 2002).
Gene expression changes of chromatin-associatedcomponents and transcription factorsThe change of an undifferentiated progenitor cell to a specializedcell type requires switches in gene expression that alter the pat-tern of inactive and active genes of these two cellular states. Thisswitch in gene expression involves changes of chromatin statesthat differ in the accessibility of genomic DNA regions for tran-scription regulatory factors. In addition, the expression of indi-vidual transcription factors that positively or negatively controlcertain target genes is involved in this process. Strikingly, alldownregulated genes in this category fall into clusters 6 and 10,with the exception of Fosb in the NT4 experiment. Both of theseclusters represent the slightest gene expression changes of ourstudy. Within cluster 6, genes decrease the most from time point0 to 24 hr; genes of cluster 10 show a continuous downregulationover time. In parallel, most of the upregulated genes in this cate-gory are found in cluster 4, which describes slight alterations withthe highest change between time point 0 and 24 hr. Exceptionsare Id4 and Meiosis expressed gene 1; both fall into cluster 1, whichcontains the strongest upregulated genes.
Among the differentially expressed genes encoding chromatinand chromatin-associated proteins Histone 2Az (H2A.Z), Histone2Ax (H2A.X), the high mobility group gene Hmgb2 (formerlyHmg2), and Thymopoietin (Lap2) were downregulated, whereastranscript levels of Histone 2B increased. The downregulation ofHistone 2Az was confirmed by semiquantitative RT-PCR (Fig. 4).
Among the transcription factors with relevant expressionchanges were five that decreased in expression. Three of these,Transcription factor 12 (Htf4/Heb/Reb), Stra13 (bHlhb2/Clast5/Sharp2/Dec1), and Olig2, belong to the helix-loop-helix class.Furthermore, we found a downregulation of Etv5 (Erm) that be-longs to the PEA3 group of transcription factors, Fosb, and Yb-1.
Increasing mRNA levels of eight transcription factors wereidentified. These include four genes encoding zinc finger proteinsrelated to transcription: the RIKEN cDNA 3110024A21 gene,ENSMUSG00000013419, and genes encoding ZDHHC9, andDAN (neuroblastoma suppressor of tumorigenicity 1, N03). Fur-thermore, the bHLH-leucine zipper transcription factor Srebp-1,Id4, a negative regulator of HLH transcription factors, an ESTsimilar to the human p66 � encoding gene, and the forkheadtranscriptional activator Foxj1 (Hfh-4/Fkhl13/Hnf-3) were up-regulated. The transcript level increase of Id4 was confirmed bysemiquantitative RT-PCR. Finally, we found a distinct increase inthe Meiosis expressed gene 1 expression. Its product associatesspecifically with meiotic chromosomes (Steiner et al., 1999); therelevance with respect to neural differentiation is unclear.
Our finding of an altered expression of H2A.X has to belooked at with caution, because the coding sequence of this genediffers only slightly from the 10 H2A1 and the single H2A2 vari-ants, in contrast to H2A.Z, which differs considerably. Therefore,a cross-hybridization of H2A1, H2A2, and H2A.X transcripts canoccur.
Hmgb2 is widely expressed during embryogenesis but exhibitstissue-restricted expression in the adult (Ronfani et al., 2001). Ofnote is its localization to the SVZ and intermediate zone at E17but reported absence in the adult brain. Blockage of Hmgb2 ex-pression with antisense oligonucleotides inhibits cell division(Yamazaki et al., 1995).
Htf4 belongs to the E-protein family of bHLH transcriptionfactors that are widely expressed (Zhang et al., 1995) and de-
Gurok et al. • Neural Progenitor Cell Differentiation J. Neurosci., June 30, 2004 • 24(26):5982– 6002 • 5995

creases during neural differentiation (Klein et al., 1993; Neumanet al., 1993). Stra13 belongs to a distinct bHLH class similar to theHes class. Its product acts as a transcriptional repressor at E-boxsequence elements and promotes neuronal but inhibits mesoder-mal and endodermal differentiation (Boudjelal et al., 1997; Sunand Taneja, 2000; St. Pierre et al., 2002). Olig2 is a transcriptionfactor that acts as a key mediator of oligodendrocyte specifica-tion. It is important for the self-renewal of cultured neurospherecells and their differentiation into neurons and oligodendrocytes(Hack et al., 2004). Oligodendrocyte precursors, differentiatedoligodendrocytes, and also neural progenitor cells express Olig2(Lu et al., 2000; Takebayashi et al., 2000; Zhou et al., 2000; Tekki-Kessaris et al., 2001; Karsten et al., 2003).
Inhibitor of DNA binding proteins act through the formationof heterodimers with E-protein bHLH factors, thereby sequester-ing them from bHLH factors that require E-proteins such asmembers of the Mash, Neurogenin, NeuroD, and Olig family(Norton, 2000). In this way, they inhibit the differentiation ofprogenitor cells into neurons and oligodendrocytes. Of interest isalso the elevated transcript level of an EST similar to the humanp66 � encoding gene. The latter belongs to a new family of potenttranscriptional repressors interacting with the methyl-CpG-binding proteins MBD2 and MBD3 (Brackertz et al., 2002).
In the context of our findings concerning genes for motor ciliaand flagella components (see Gene expression changes related tothe tubulin cytoskeleton), the slight upregulation of the forkheadtranscriptional activator Foxj1 is of special interest. Foxj1 is ex-pressed in tissues containing cells with motor cilia and flagellasuch as testis, oviduct, lung, and brain (Clevidence et al., 1993;Hackett et al., 1995; Lim et al., 1997; Murphy et al., 1997). It ispresent in motor cilia and flagella as well as in the unique motilemonocilium of the embryonic node, but not in sensory cilia(Brody et al., 2000). The failure of directed left–right determina-tion in Foxj1 (Hfh-4) null mice, which is normally regulated byembryonic node cells, indicates a Foxj1 (Hfh-4)-based defect oftheir motile monocilium (Brody et al., 2000).
Erm is expressed in various tissues at different developmentalstages (Chotteau-Lelievre et al., 1997). Erm expression becomesrestricted to cells lining the ventricles rather than differentiatingcells of the neural wall as neural development proceeds.
Gene expression changes related to metabolismSome of the genes with differential expression encode proteinsinvolved in cellular metabolism. The downregulated genes werefound in clusters 6 and 10 describing very slight expressionchanges. With the exception of Nat-1, none of the upregulatedgenes belongs to cluster 1, which contains strongly and very earlyincreasing transcripts. Most of the genes of this category are re-lated to glucose and energy metabolism, for example, Lactatedehydrogenase, Glucose-6-phosphate dehydrogenase, Phosphoglyc-erate dehydrogenase, and Brain glycogen phosphorylase. The latteris present in astrocytes and ependymal cells, but rarely found inneurons of the rat brain (Pfeiffer-Guglielmi et al., 2003).
Other differentially regulated genes identified are involved inamino acid transport (N system amino acids transporter Nat-1),carbon dioxide transport and acid-base balance (Carbonic anhy-drase 2 and 14), and nucleic acid metabolism (Thymidine kinase1, Dutpase). Thymidine kinase 1 is known to be present in pro-liferating cells with a peak in S phase. It is low in resting cells,which is in line with the decreased proliferation in our differen-tiation culture (see Gene expression changes related to cellproliferation).
An interesting gene that was downregulated is Phosphoglucose
isomerase 1 (Gpi1). GPI1 plays a central role in both glycolysis andgluconeogenesis; however, it is also known as Autocrine motilityfactor or Neuroleukin and seems to fulfill several functions. Pu-rified Neuroleukin from Bacillus stearothermophilus promotesneurite outgrowth of rat EGF-responsive neural embryonic pro-genitor cells (Sun et al., 1999).
Several genes coding for enzymes involved in steroid metab-olism were also identified, all of them with increasing expressionlevels: UDP-glucuronosyltransferase 1, Oxysterol binding protein 2,Prostaglandin D2 synthase, the Leukotriene B4 �-hydroxylase(CYP4F14), and Retinal short-chain dehydrogenase/reductase 2.
Gene expression changes related to ion channels,transporters, and lipoproteinsIn addition, some genes encoding ion channels, transporters, andlipoproteins were differentially regulated, most of them upregu-lated. An exception was the Fxyd1 gene, which belongs to cluster1 (strongly and very early increasing genes). It encodes a regulatorof the Na,K-ATPase (Crambert and Geering, 2003). The GABA-Areceptor �-5 subunit slightly increased, but only by 96 hr. Increas-ing transcripts of the genes Na, K transporting ATPase subunit �,the Abca3 transporter, and the Monocarboxylate transporter 1 werealso detected. Of the genes related to lipoproteins, Lipid transferprotein II (Pltp) expression increases. PLTP is an important reg-ulator of plasma high-density lipoprotein (HDL) levels and HDLparticle distribution and is secreted by neurons, microglia, andastrocytes (Vuletic et al., 2003).
A slight and late increase is also noted for the gene encodingsorLA/LR11, a protein with features typical for low density li-poprotein receptor family and the Vps10p domain receptor fam-ily, which is present in neurons (Jacobsen et al., 1996; Motoi et al.,1999). On the other hand, transcript levels of Scavenger receptorclass B1, encoding a lysosomal membrane protein that can bindHDL, decrease. Finally, gene expression of the Apolipoprotein Jincreases.
DiscussionThe transition of multipotent neural progenitor cells into differ-entiated neuronal and glial cells involves complex gene expres-sion changes of which only few are known to date.
To learn more about very early and probably decisive tran-scriptional changes, we compared the gene expression of undif-ferentiated neurosphere cells from the SVZ of P7 mice with cellsat 24, 48, and 96 hr after induction of differentiation using BDNFor NT4. This time course allows us to ascertain the onset of tran-scriptional changes and follow subsequent alterations. Previ-ously, neurosphere cells have only been compared with one cel-lular state after induction of differentiation using large scaleexpression methods. Geschwind et al. (2001) investigated undif-ferentiated neurosphere cells from P0 mouse cortex and cellsdifferentiated for 24 hr using a combination of representationaldifference analysis and microarrays. Karsten et al. (2003) com-pared progenitor cells from prenatal day 1 and cells that weredifferentiated for 24 hr. Easterday et al. (2003) compared P1 cor-tical neuropheres differentiated for 24 hr with three differentundifferentiated neurosphere populations from mice. Cells de-rived from the striatum of rat embryos were used in two otherdifferentiation studies by Zhou et al. (2001) and Wen et al.(2002).
We have provided detailed information on many genes inResults. Our discussion therefore covers selected new and impor-tant aspects. Almost all of the differentially expressed genesshowed consistent upregulation or downregulation throughout
5996 • J. Neurosci., June 30, 2004 • 24(26):5982– 6002 Gurok et al. • Neural Progenitor Cell Differentiation

the time course. From an upregulation or downregulation at 24or 48 hr, one can therefore usually assume a further increase ordecrease at later time points for the vast majority of genes; how-ever, we also identified genes that change only 96 hr after differ-entiation was initiated. Thus, by comparing undifferentiated cellswith cells at only one early time point of differentiation, e.g., 24hr, not all relevant transcriptional changes can be identified.
We describe 10 major patterns (clusters) of gene expressionchanges in the course of neural progenitor differentiation. Thehighest expression changes were found for downregulated genes.Of these, cluster 9 contains strong and very early expressionchanges, most of which involved genes with a role in cell prolif-eration; however, most clusters do not correspond to single func-tional gene categories.
A comparison of in vitro differentiation steps with biologicalprocesses in vivo is shown in Table 2.
Molecular profile of neural progenitor cellsBecause differentiated neuronal and glial cells were not investi-gated independently, we cannot correlate expression changes tocell types, except for the known cell type-specific genes; however,we can assign the downregulated genes to the undifferentiatedneurosphere state, although spheres are also heterogeneous. Thisapproach has been used successfully previously to identify a mo-lecular profile of neural progenitor cells by comparing only twostates (undifferentiated vs differentiated) (Geschwind et al., 2001;Easterday et al., 2003; Karsten et al., 2003). Several genes withhigher expression in progenitor cells that were reported in one ofthese studies were also identified by us. They include the cellcycle-related genes Cyclin B1, D1, D2, Cdc2a, and PDZ-bindingkinase. Other genes that decreased in expression at 24 hr in ourstudy and the above-mentioned studies are Fabp7, Gpi, Hmgb2,Lrrfip1, Mcm6, Olig2, Pttg1, Tnc, Racgap1, Histone H2A.Z, andCadherin 13 (T-cadherin).
Almost no overlap exists between genes that we identified and
those found by Zhou et al. (2001) and Wen et al. (2002). Thesegroups compared undifferentiated neurosphere cells from thestriatum of rat embryos with differentiated cells. Only a DNApolymerase subunit was found by us and Zhou et al. (2001) andthe Siva-1 (CD27) gene (not listed in Table 1) was found by usand by Wen et al. (2002).
In addition, many of the genes that we identified have beenfound previously to be specific to or enriched in neural stem–progenitor cells derived from embryonic (Ivanova et al., 2002;D’Amour and Gage, 2003; Fortunel et al., 2003) or adult(Ramalho-Santos et al., 2002) tissue by comparing their microar-ray profiles with those of other stem cell types (Table 1).
Many of the genes downregulated during differentiation arelocalized to the neural stem cell compartments. Thus, they arecharacteristic for neural progenitor cells in vivo and their expres-sion is maintained under in vitro conditions. We detected theCD47, PTPNS1 (SHPS-1), Pleiotrophin, and FABP7 proteins inthe SVZ and RMS of adult mouse brain sections by immuno-staining. Among other cell types, all of them were found to beexpressed by GFAP-positive cells in this region. In addition, someof our identified genes have been reported previously to be ex-pressed within neural germinal zones. These are Tenascin C(Jankovski and Sotelo, 1996), Hb-Egf (Nakagawa et al., 1998),Nell2 (Kim et al., 2002), Transcription factor 12 (Uittenbogaardand Chiaramello, 2002), Cyclin D1, Cyclin D2 (Geschwind et al.,2001), and Lrrfip1, Hmg2b, Racgap1, Olig2, Fabp7, and Pttg1(Karsten et al., 2003).
Similarities to radial glial cellsFrom our microarray data and immunostaining results we no-ticed that the undifferentiated neurosphere cells share certainmarkers with radial glial cells, namely FABP7, Tenascin C, Nes-tin, and Pleiotrophin. During embryonic brain development, ra-dial glial cells appear in the ventricular zone and extend a longradial process to the pia (for review, see Parnavelas and Nadara-
Table 2. Comparison of in vitro and in vivo findings
In vitro differentiation steps of neuro-sphere cells In vitro gene expression changes Adult SVZ and RMS compartment Similarities and differences
Cessation of proliferation All genes involved in DNA replication and cellcycle progression are downregulated (seeTable 1)
Type B and C cells are dividing cells. Neuroblasts(type A cells) divide as they migrate alongthe RMS. They exit the cell cycle after differ-entiation.
Different timing of cell cycle exit
Attachment of neurosphere cells topoly-L-lysine
Extracellular matrix components are upregu-lated and downregulated (e.g. Tenascin C;see Table 1)
All SVZ cell types make contact with the extra-cellular matrix. Changes among the threecompartments (SVZ, RMS, OB) are likely toinvolve ECM components.
Tenascin C is present in the SVZ, RMS,and olfactory bulb
Detachment of cells from the neuro-sphere cell cluster
Genes encoding cell– cell adhesion moleculesthat are downregulated (see Table 1). Ptpns1and Cd47, which regulate cell aggregation,are differentially expressed.
All cell types in the SVZ and RMS are tightlypacked and form many cell– cell contacts.Cells detach from the SVZ niche on entry intothe RMS. Within the RMS, neuroblasts mi-grate in homotypic cellular chains. In theolfactory bulb, they lose these cellular con-tacts and migrate as individual cells.
Similar cell– cell adhesion systemsare likely used: proteins synthe-sized by the cells in vitro are alsofound in the SVZ in vivo (our im-munostainings of brain sections)
Cellular migration away from the cellcluster. On poly-L-lysine, cells mi-grated as single cells; in Matrigel,chain migration was observed.
Genes involved in actin cytoskeleton turnoverare important for leading edge extension inmigrating cells (see Table 1), Ptpns1 andCd47, which have been previously shown toregulate cell migration.
Within the RMS, neuroblasts migrate in cellularchains; in the olfactory bulb, they migrate asindividual cells.
Similar modes of cell migration
Differentiation into astrocytes, neurons,and oligodendrocytes
Transcription factors, which are key regulators ofcell-type specification and lineage restriction(see Table 1). Several cell type-specific genesare upregulated (see Results).
Type B cells give rise to type C cells, which inturn generate type A cells. Type A cells differ-entiate into olfactory bulb interneurons.
Similar changes are likely to occur
Gurok et al. • Neural Progenitor Cell Differentiation J. Neurosci., June 30, 2004 • 24(26):5982– 6002 • 5997

jah, 2001; Campbell and Gotz, 2002; Tamamaki, 2002). Theydisappear from this region during the first 2 postnatal weeks(Tramontin et al., 2003). In contrast to songbirds, radial glial cellsare absent from the intact adult mammalian SVZ (Alvarez-Buyllaet al., 2002). Mammalian radial glial cells transform into matureastrocytes but also give rise to neurons in vitro and in vivo (Mala-testa et al., 2000; Miyata et al., 2001; Noctor et al., 2001; Tama-maki et al., 2001; Heins et al., 2002). In the adult mammalianSVZ, astrocytes serve as stem cells. These cells and radial glial cellsshow an overlapping but not identical expression of molecularmarkers. Both express Nestin and Vimentin (Doetsch et al.,1997). In contrast to primates, radial glial cells of rodents do notexpress GFAP, with the exception of Bergmann radial glial cells ofthe cerebellum (Levitt and Rakic, 1980; Choi, 1981; Rakic, 1995;Sancho-Tello et al., 1995; Hatten, 1999), whereas SVZ adult stemcells (type B cells) are GFAP positive (Doetsch et al., 1997).FABP7, Tenascin C, Pleiotrophin, RC1, RC2, and GLAST areadditional proteins synthesized by radial glial cells (Malatesta etal., 2003). Tenascin C is also present in the adult SVZ and atelongated astrocytes in the RMS (Jankovski and Sotelo, 1996).This localization strongly indicates that adult neural progenitorcells synthesize Tenascin C.
It has recently been suggested that there is a continuum of aneural stem cell compartment that links radial glial cells to astro-cytes, which serve as neural stem cells in the adult mammalianbrain (Alvarez-Buylla et al., 2001; Doetsch, 2003; Goldman, 2003;Gotz, 2003; Tramontin et al., 2003). The expression of GFAP,Nestin, FABP7, Tenascin C, and Pleiotrophin by our neuro-sphere cells places them between radial glial cells and SVZ astro-cytes and could be explained by a transitional state from radialglial cells to SVZ astrocytes, because they were isolated at P7. Ofinterest in this context is our finding of FABP7 expression by SVZand RMS astrocytes and of Pleiotrophin expression by differentcell types in the SVZ, apparently also by SVZ astrocytes, of adultmice (Fig. 7), indicating that not only radial glial cells and possi-bly cells in a transitional state but also neural progenitor cells inthe adult brain share these markers. Although one has to interpretthe presence of molecular markers with caution because theymight specify a cellular state rather than lineage, our results areconsistent with the proposed lineage relationship of radial glialcells and adult SVZ stem cells.
Cellular interactions within the SVZ and RMSIt is essentially unknown how the various cells in the SVZ stemcell niche and the RMS communicate through cell– cell contactsor locally secreted factors. We found that undifferentiated neu-rosphere cells express Hb-Egf, and the secreted form of the re-spective protein stimulates neural progenitor cell proliferationand enhances neuronal survival (Kornblum et al., 1999). Hb-Egfhas also been detected in several migration pathways (Caric et al.,2001). HB-EGF could therefore act as an autocrine factor on theneural progenitor cells themselves and at the same time supportthe survival of migrating neuroblasts. We also found that thePleiotrophin gene is expressed by undifferentiated neurospherecells. Moreover, Pleiotrophin appears to be expressed by differentcell types, including astrocytes and neuronal cells, in the SVZ.Several features of this protein in the embryonic brain corre-spond well to the situation in the adult SVZ–RMS compartment.Pleiotrophin is known to stimulate the migration of embryonicneurons in vitro, and it has been localized to radial glial processesalong which embryonic neurons migrate (Maeda and Noda,1998). We conclude that Pleiotrophin is secreted by neural pro-
genitor cells, which as outlined above, share similarities with ra-dial glial cells.
Finally, we found that the transmembrane proteins PTPNS1(SHPS-1) and CD47, which can bind each other through theirextracellular domains, are both produced by undifferentiatedneurosphere cells. Moreover, an enrichment of these proteins atthe interface of SVZ cells and the underlying extracellular spacewas noticed. In addition, we localized CD47 and PTPNS1 toGFAP-positive astrocytes and neuronal cells in the SVZ andRMS. In view of the very tight cellular contacts in this brainregion, a clear assignment to the membrane of specific cell types,however, must await analysis by electron microscopy. SHPS-1and CD47 are a cell– cell communication and signal transductionsystem with multiple functions in immune cells (Han et al., 2000;Oldenborg et al., 2000; Seiffert et al., 2001). In the brain, SHPS-1and CD47 are associated with synapses, and SHPS-1 (P84) hasbeen shown to promote neurite outgrowth (Chuang and Lagen-aur, 1990; Mi et al., 2000). Two aspects of the CD47-SHPS-1system are especially interesting. First, they are involved in IGF-Ireceptor signaling, and we found striking expression changes ofgenes encoding IGF-I modulating proteins (IGFBPs), which in-dicate that very early in differentiation neurosphere cells are con-verted into an IGF-responsive state. Second, the CD47-SHPS-1system regulates cell aggregation and migration. This functionhas not been described for neural cells so far, but has been de-scribed for immune and melanoma cells (Babic et al., 2000; Liu etal., 2002; Motegi et al., 2003). The reported localization in tightlyassociated neurosphere cells, cells migrating as chains in vitro,and in the SVZ and RMS would be compatible with a role incell– cell/cell–matrix contact and migration. Further investiga-tions on the CD47-SHPS-1-system are underway in a separatestudy.
In summary, we have provided a dataset of dynamic geneexpression changes during the first 96 hr of postnatal neural pro-genitor differentiation. In addition to the investigation of tran-script levels, we could correlate selected proteins to the cells thatproduce them. Our analysis has identified many new candidatemolecules and confirmed several others that likely play impor-tant roles during the maintenance, differentiation, and migrationof precursors in the SVZ. For several, the functional profile inother cellular systems strongly suggests a plausible role also in theSVZ; for others we have shown an association with cell types inthe SVZ. Thus, our data should serve as a basis for future analysesof the molecular and cellular dissection of SVZ function in adultneurogenesis.
ReferencesAkai J, Storey K (2002) Expression of gamma-adducin is associated with
regions of morphogenetic cell movement in the chick embryo. Mech Dev119 [Suppl 1]:S191–S195.
Alvarez-Buylla A, Garcia-Verdugo JM, Tramontin AD (2001) A unified hy-pothesis on the lineage of neural stem cells. Nat Rev Neurosci 2:287–293.
Alvarez-Buylla A, Seri B, Doetsch F (2002) Identification of neural stem cellsin the adult vertebrate brain. Brain Res Bull 57:751–758.
An S, Zheng Y, Bleu T (2000) Sphingosine 1-phosphate-induced cell prolif-eration, survival, and related signaling events mediated by G protein-coupled receptors Edg3 and Edg5. J Biol Chem 275:288 –296.
Babic I, Schallhorn A, Lindberg FP, Jirik FR (2000) SHPS-1 induces aggre-gation of Ba/F3 pro-B cells via an interaction with CD47. J Immunol164:3652–3658.
Bernal J, Nunez J (1995) Thyroid hormones and brain development. Eur JEndocrinol 133:390 –398.
Birgbauer E, Dinsmore JH, Winckler B, Lander AD, Solomon F (1991) As-sociation of ezrin isoforms with the neuronal cytoskeleton. J Neurosci Res30:232–241.
5998 • J. Neurosci., June 30, 2004 • 24(26):5982– 6002 Gurok et al. • Neural Progenitor Cell Differentiation
Boudjelal M, Taneja R, Matsubara S, Bouillet P, Dolle P, Chambon P (1997)Overexpression of Stra13, a novel retinoic acid-inducible gene of the basichelix-loop-helix family, inhibits mesodermal and promotes neuronal dif-ferentiation of P19 cells. Genes Dev 11:2052–2065.
Brackertz M, Boeke J, Zhang R, Renkawitz R (2002) Two highly related p66proteins comprise a new family of potent transcriptional repressors inter-acting with MBD2 and MBD3. J Biol Chem 277:40958 – 40966.
Brody SL, Yan XH, Wuerffel MK, Song SK, Shapiro SD (2000) Ciliogenesisand left-right axis defects in forkhead factor HFH-4-null mice. Am JRespir Cell Mol Biol 23:45–51.
Buhusi M, Midkiff BR, Gates AM, Richter M, Schachner M, Maness PF(2003) Close homolog of L1 is an enhancer of integrin-mediated cellmigration. J Biol Chem 278:25024 –25031.
Calaora V, Chazal G, Nielsen PJ, Rougon G, Moreau H (1996) mCD24 ex-pression in the developing mouse brain and in zones of secondary neuro-genesis in the adult. Neuroscience 73:581–594.
Campbell K, Gotz M (2002) Radial glia: multi-purpose cells for vertebratebrain development. Trends Neurosci 25:235–238.
Capela A, Temple S (2002) LeX/ssea-1 is expressed by adult mouse CNSstem cells, identifying them as nonependymal. Neuron 35:865– 875.
Caric D, Raphael H, Viti J, Feathers A, Wancio D, Lillien L (2001) EGFRsmediate chemotactic migration in the developing telencephalon. Devel-opment 128:4203– 4216.
Chiasson BJ, Tropepe V, Morshead CM, van der Kooy D (1999) Adultmammalian forebrain ependymal and subependymal cells demonstrateproliferative potential, but only subependymal cells have neural stem cellcharacteristics. J Neurosci 19:4462– 4471.
Choi BH (1981) Radial glia of developing human fetal spinal cord: Golgi,immunohistochemical and electron microscopic study. Brain Res227:249 –267.
Chotteau-Lelievre A, Desbiens X, Pelczar H, Defossez PA, de Launoit Y(1997) Differential expression patterns of the PEA3 group transcriptionfactors through murine embryonic development. Oncogene 15:937–952.
Chuang W, Lagenaur CF (1990) Central nervous system antigen P84 canserve as a substrate for neurite outgrowth. Dev Biol 137:219 –232.
Clemmons DR, Maile LA (2003) Minireview: integral membrane proteinsthat function coordinately with the insulin-like growth factor I receptor toregulate intracellular signaling. Endocrinology 144:1664 –1670.
Clevidence DE, Overdier DG, Tao W, Qian X, Pani L, Lai E, Costa RH (1993)Identification of nine tissue-specific transcription factors of the hepato-cyte nuclear factor 3/forkhead DNA-binding-domain family. Proc NatlAcad Sci USA 90:3948 –3952.
Crambert G, Geering K (2003) FXYD proteins: new tissue-specific regula-tors of the ubiquitous Na,K-ATPase. Sci STKE 2003:RE1.
D’Amour KA, Gage FH (2003) Genetic and functional differences betweenmultipotent neural and pluripotent embryonic stem cells. Proc Natl AcadSci USA 100 [Suppl 1G]:11866 –11872.
Dean C, Scholl FG, Choih J, DeMaria S, Berger J, Isacoff E, Scheiffele P(2003) Neurexin mediates the assembly of presynaptic terminals. NatNeurosci 6:708 –716.
D’Ercole AJ, Ye P, O’Kusky JR (2002) Mutant mouse models of insulin-likegrowth factor actions in the central nervous system. Neuropeptides36:209 –220.
Derouiche A, Frotscher M (2001) Peripheral astrocyte processes: monitor-ing by selective immunostaining for the actin-binding ERM proteins. Glia36:330 –341.
Deuel TF, Zhang N, Yeh HJ, Silos-Santiago I, Wang ZY (2002) Pleiotrophin:a cytokine with diverse functions and a novel signaling pathway. ArchBiochem Biophys 397:162–171.
Doetsch F (2003) A niche for adult neural stem cells. Curr Opin Genet Dev13:543–550.
Doetsch F, Garcia-Verdugo JM, Alvarez-Buylla A (1997) Cellular composi-tion and three-dimensional organization of the subventricular germinalzone in the adult mammalian brain. J Neurosci 17:5046 –5061.
Doetsch F, Caille I, Lim DA, Garcia-Verdugo JM, Alvarez-Buylla A (1999a)Subventricular zone astrocytes are neural stem cells in the adult mamma-lian brain. Cell 97:703–716.
Doetsch F, Garcia-Verdugo JM, Alvarez-Buylla A (1999b) Regeneration of agerminal layer in the adult mammalian brain. Proc Natl Acad Sci USA96:11619 –11624.
Doetsch F, Petreanu L, Caille I, Garcia-Verdugo JM, Alvarez-Buylla A (2002)
EGF converts transit-amplifying neurogenic precursors in the adult braininto multipotent stem cells. Neuron 36:1021–1034.
Donato R (2003) Intracellular and extracellular roles of S100 proteins. Mi-crosc Res Tech 60:540 –551.
Easterday MC, Dougherty JD, Jackson RL, Ou J, Nakano I, Paucar AA, Roo-bini B, Dianati M, Irvin DK, Weissman IL, Terskikh AV, Geschwind DH,Kornblum HI (2003) Neural progenitor genes. Germinal zone expres-sion and analysis of genetic overlap in stem cell populations. Dev Biol264:309 –322.
Eriksson PS, Perfilieva E, Bjork-Eriksson T, Alborn AM, Nordborg C, Peter-son DA, Gage FH (1998) Neurogenesis in the adult human hippocam-pus. Nat Med 4:1313–1317.
Everett AW, Nichol KA (1990) Ezrin immunoreactivity in neuron sub-populations: cellular distribution in relation to cytoskeletal proteins insensory neurons. J Histochem Cytochem 38:1137–1144.
Feng L, Hatten ME, Heintz N (1994) Brain lipid-binding protein (BLBP): anovel signaling system in the developing mammalian CNS. Neuron12:895–908.
Firth SM, Baxter RC (2002) Cellular actions of the insulin-like growth factorbinding proteins. Endocr Rev 23:824 – 854.
Forrest D, Reh TA, Rusch A (2002) Neurodevelopmental control by thyroidhormone receptors. Curr Opin Neurobiol 12:49 –56.
Fortunel NO, Otu HH, Ng HH, Chen J, Mu X, Chevassut T, Li X, Joseph M,Bailey C, Hatzfeld JA, Hatzfeld A, Usta F, Vega VB, Long PM, LibermannTA, Lim B (2003) Comment on “’Stemness’: transcriptional profiling ofembryonic and adult stem cells” and “a stem cell molecular signature.”Science 302:393.
Gage FH (2000) Mammalian neural stem cells. Science 287:1433–1438.Gaudet S, Branton D, Lue RA (2000) Characterization of PDZ-binding ki-
nase, a mitotic kinase. Proc Natl Acad Sci USA 97:5167–5172.Gerdes J, Schwab U, Lemke H, Stein H (1983) Production of a mouse
monoclonal antibody reactive with a human nuclear antigen associatedwith cell proliferation. Int J Cancer 31:13–20.
Geschwind DH, Ou J, Easterday MC, Dougherty JD, Jackson RL, Chen Z,Antoine H, Terskikh A, Weissman IL, Nelson SF, Kornblum HI (2001)A genetic analysis of neural progenitor differentiation. Neuron 29:325–339.
Goldman S (2003) Glia as neural progenitor cells. Trends Neurosci26:590 –596.
Gomes ML, de Mattos DM, de Souza Freitas R, Bezerra RJ, Bernardo-Filho M(2001a) Study of the toxicological effect of mitomycin C in mice: alter-ation on the biodistribution of radiopharmaceuticals used for renal eval-uations. Hum Exp Toxicol 20:193–197.
Gomes FC, Lima FR, Trentin AG, Moura Neto V (2001b) Thyroid hormonerole in nervous system morphogenesis. Prog Brain Res 132:41–50.
Goslin K, Birgbauer E, Banker G, Solomon F (1989) The role of cytoskeletonin organizing growth cones: a microfilament-associated growth conecomponent depends upon microtubules for its localization. J Cell Biol109:1621–1631.
Gotz M (2003) Glial cells generate neurons—master control within CNSregions: developmental perspectives on neural stem cells. Neuroscientist9:379 –397.
Guadano-Ferraz A, Escamez MJ, Rausell E, Bernal J (1999) Expression oftype 2 iodothyronine deiodinase in hypothyroid rat brain indicates animportant role of thyroid hormone in the development of specific pri-mary sensory systems. J Neurosci 19:3430 –3439.
Hack MA, Sugimori M, Lundberg C, Nakafuku M, Gotz M (2004) Region-alization and fate specification in neurospheres: the role of Olig2 andPax6. Mol Cell Neurosci 25:664 – 678.
Hackett BP, Brody SL, Liang M, Zeitz ID, Bruns LA, Gitlin JD (1995) Pri-mary structure of hepatocyte nuclear factor/forkhead homologue 4 andcharacterization of gene expression in the developing respiratory andreproductive epithelium. Proc Natl Acad Sci USA 92:4249 – 4253.
Han X, Sterling H, Chen Y, Saginario C, Brown EJ, Frazier WA, Lindberg FP,Vignery A (2000) CD47, a ligand for the macrophage fusion receptor, par-ticipates in macrophage multinucleation. J Biol Chem 275:37984–37992.
Hatten ME (1999) Central nervous system neuronal migration. Annu RevNeurosci 22:511–539.
Heins N, Malatesta P, Cecconi F, Nakafuku M, Tucker KL, Hack MA,Chapouton P, Barde YA, Gotz M (2002) Glial cells generate neurons: therole of the transcription factor Pax6. Nat Neurosci 5:308 –315.
Hillenbrand R, Molthagen M, Montag D, Schachner M (1999) The closehomologue of the neural adhesion molecule L1 (CHL1): patterns of ex-
Gurok et al. • Neural Progenitor Cell Differentiation J. Neurosci., June 30, 2004 • 24(26):5982– 6002 • 5999

pression and promotion of neurite outgrowth by heterophilic interac-tions. Eur J Neurosci 11:813– 826.
Hitoshi S, Alexson T, Tropepe V, Donoviel D, Elia AJ, Nye JS, Conlon RA,Mak TW, Bernstein A, van der Kooy D (2002) Notch pathway moleculesare essential for the maintenance, but not the generation, of mammalianneural stem cells. Genes Dev 16:846 – 858.
Hsieh J, Aimone JB, Kaspar BK, Kuwabara T, Nakashima K, Gage FH (2004)IGF-I instructs multipotent adult neural progenitor cells to become oli-godendrocytes. J Cell Biol 164:111–122.
Hsueh YP, Sheng M (1999) Regulated expression and subcellular localiza-tion of syndecan heparan sulfate proteoglycans and the syndecan-bindingprotein CASK/LIN-2 during rat brain development. J Neurosci19:7415–7425.
Hu QD, Ang BT, Karsak M, Hu WP, Cui XY, Duka T, Takeda Y, Chia W,Sankar N, Ng YK, Ling EA, Maciag T, Small D, Trifonova R, Kopan R,Okano H, Nakafuku M, Chiba S, Hirai H, Aster JC, et al. (2003) F3/contactin acts as a functional ligand for Notch during oligodendrocytematuration. Cell 115:163–175.
Huang ZY, Wu Y, Hedrick N, Gutmann DH (2003) T-cadherin-mediatedcell growth regulation involves G2 phase arrest and requires p21(CIP1/WAF1) expression. Mol Cell Biol 23:566 –578.
Huber W, Von Heydebreck A, Sultmann H, Poustka A, Vingron M (2002)Variance stabilization applied to microarray data calibration and to thequantification of differential expression. Bioinformatics 18 [Suppl1]:S96 –S104.
Ivanov D, Philippova M, Tkachuk V, Erne P, Resink T (2004) Cell adhesionmolecule T-cadherin regulates vascular cell adhesion, phenotype and mo-tility. Exp Cell Res 293:207–218.
Ivanova NB, Dimos JT, Schaniel C, Hackney JA, Moore KA, Lemischka IR(2002) A stem cell molecular signature. Science 298:601– 604.
Izon DJ, Aster JC, He Y, Weng A, Karnell FG, Patriub V, Xu L, Bakkour S,Rodriguez C, Allman D, Pear WS (2002) Deltex1 redirects lymphoidprogenitors to the B cell lineage by antagonizing Notch1. Immunity16:231–243.
Jacobsen L, Madsen P, Moestrup SK, Lund AH, Tommerup N, Nykjaer A,Sottrup-Jensen L, Gliemann J, Petersen CM (1996) Molecular charac-terization of a novel human hybrid-type receptor that binds the alpha2-macroglobulin receptor-associated protein. J Biol Chem 271:31379–31383.
Jankovski A, Sotelo C (1996) Subventricular zone-olfactory bulb migratorypathway in the adult mouse: cellular composition and specificity as deter-mined by heterochronic and heterotopic transplantation. J Comp Neurol371:376 –396.
Jauneau AC, Ischenko A, Chan P, Fontaine M (2003) Complement compo-nent anaphylatoxins upregulate chemokine expression by human astro-cytes. FEBS Lett 537:17–22.
Jaworski DM, Fager N (2000) Regulation of tissue inhibitor ofmetalloproteinase-3 (Timp-3) mRNA expression during rat CNS devel-opment. J Neurosci Res 61:396 – 408.
Jin K, Mao XO, Sun Y, Xie L, Jin L, Nishi E, Klagsbrun M, Greenberg DA(2002) Heparin-binding epidermal growth factor-like growth factor:hypoxia-inducible expression in vitro and stimulation of neurogenesis invitro and in vivo. J Neurosci 22:5365–5373.
Jin K, Sun Y, Xie L, Batteur S, Mao XO, Smelick C, Logvinova A, GreenbergDA (2003) Neurogenesis and aging: FGF-2 and HB-EGF restore neuro-genesis in hippocampus and subventricular zone of aged mice. Aging Cell2:175–183.
Johansson CB, Momma S, Clarke DL, Risling M, Lendahl U, Frisen J (1999)Identification of a neural stem cell in the adult mammalian central ner-vous system. Cell 96:25–34.
Jones FS, Jones PL (2000) The tenascin family of ECM glycoproteins: struc-ture, function, and regulation during embryonic development and tissueremodeling. Dev Dyn 218:235–259.
Karsten SL, Kudo LC, Jackson R, Sabatti C, Kornblum HI, Geschwind DH(2003) Global analysis of gene expression in neural progenitors revealsspecific cell-cycle, signaling, and metabolic networks. Dev Biol261:165–182.
Kim EJ, Helfman DM (2003) Characterization of the metastasis-associatedprotein, S100A4. Roles of calcium binding and dimerization in cellularlocalization and interaction with myosin. J Biol Chem 278:30063–30073.
Kim H, Ha CM, Choi J, Choi EJ, Jeon J, Kim C, Park SK, Kang SS, Kim K, LeeBJ (2002) Ontogeny and the possible function of a novel epidermal
growth factor-like repeat domain-containing protein, NELL2, in the ratbrain. J Neurochem 83:1389 –1400.
Kinnunen A, Kinnunen T, Kaksonen M, Nolo R, Panula P, Rauvala H (1998)N-syndecan and HB-GAM (heparin-binding growth-associated mole-cule) associate with early axonal tracts in the rat brain. Eur J Neurosci10:635– 648.
Kinnunen A, Niemi M, Kinnunen T, Kaksonen M, Nolo R, Rauvala H (1999)Heparan sulphate and HB-GAM (heparin-binding growth-associatedmolecule) in the development of the thalamocortical pathway of rat brain.Eur J Neurosci 11:491–502.
Kishi N, Tang Z, Maeda Y, Hirai A, Mo R, Ito M, Suzuki S, Nakao K, KinoshitaT, Kadesch T, Hui C, Artavanis-Tsakonas S, Okano H, Matsuno K (2001)Murine homologs of deltex define a novel gene family involved in verte-brate Notch signaling and neurogenesis. Int J Dev Neurosci 19:21–35.
Klein ES, Simmons DM, Swanson LW, Rosenfeld MG (1993) Tissue-specific RNA splicing generates an ankyrin-like domain that affects thedimerization and DNA-binding properties of a bHLH protein. Genes Dev7:55–71.
Kon J, Sato K, Watanabe T, Tomura H, Kuwabara A, Kimura T, Tamama K,Ishizuka T, Murata N, Kanda T, Kobayashi I, Ohta H, Ui M, Okajima F(1999) Comparison of intrinsic activities of the putative sphingosine1-phosphate receptor subtypes to regulate several signaling pathways intheir cDNA-transfected Chinese hamster ovary cells. J Biol Chem274:23940 –23947.
Kondo M, Ji L, Kamibayashi C, Tomizawa Y, Randle D, Sekido Y, Yokota J,Kashuba V, Zabarovsky E, Kuzmin I, Lerman M, Roth J, Minna JD(2001) Overexpression of candidate tumor suppressor gene FUS1 iso-lated from the 3p21.3 homozygous deletion region leads to G1 arrest andgrowth inhibition of lung cancer cells. Oncogene 20:6258 – 6262.
Konig S, Moura Neto V (2002) Thyroid hormone actions on neural cells.Cell Mol Neurobiol 22:517–544.
Kornack DR, Rakic P (1999) Continuation of neurogenesis in the hip-pocampus of the adult macaque monkey. Proc Natl Acad Sci USA96:5768 –5773.
Kornblum HI, Zurcher SD, Werb Z, Derynck R, Seroogy KB (1999) Multi-ple trophic actions of heparin-binding epidermal growth factor (HB-EGF) in the central nervous system. Eur J Neurosci 11:3236 –3246.
Kuroda S, Oyasu M, Kawakami M, Kanayama N, Tanizawa K, Saito N, Abe T,Matsuhashi S, Ting K (1999) Biochemical characterization and expres-sion analysis of neural thrombospondin-1-like proteins NELL1 andNELL2. Biochem Biophys Res Commun 265:79 – 86.
Kurtz A, Zimmer A, Schnutgen F, Bruning G, Spener F, Muller T (1994) Theexpression pattern of a novel gene encoding brain-fatty acid binding pro-tein correlates with neuronal and glial cell development. Development120:2637–2649.
Laywell ED, Rakic P, Kukekov VG, Holland EC, Steindler DA (2000) Iden-tification of a multipotent astrocytic stem cell in the immature and adultmouse brain. Proc Natl Acad Sci USA 97:13883–13888.
Levitt P, Rakic P (1980) Immunoperoxidase localization of glial fibrillaryacidic protein in radial glial cells and astrocytes of the developing rhesusmonkey brain. J Comp Neurol 193:815– 840.
Leyton J, Garcia-Marin L, Jensen RT, Moody TW (2002) Neurotensincauses tyrosine phosphorylation of focal adhesion kinase in lung cancercells. Eur J Pharmacol 442:179 –186.
Li YS, Milner PG, Chauhan AK, Watson MA, Hoffman RM, Kodner CM,Milbrandt J, Deuel TF (1990) Cloning and expression of a developmen-tally regulated protein that induces mitogenic and neurite outgrowth ac-tivity. Science 250:1690 –1694.
Lim L, Zhou H, Costa RH (1997) The winged helix transcription factorHFH-4 is expressed during choroid plexus epithelial development in themouse embryo. Proc Natl Acad Sci USA 94:3094 –3099.
Lima FR, Gervais A, Colin C, Izembart M, Neto VM, Mallat M (2001) Reg-ulation of microglial development: a novel role for thyroid hormone.J Neurosci 21:2028 –2038.
Liu Y, Buhring HJ, Zen K, Burst SL, Schnell FJ, Williams IR, Parkos CA(2002) Signal regulatory protein (SIRPalpha), a cellular ligand for CD47,regulates neutrophil transmigration. J Biol Chem 277:10028 –10036.
Lois C, Garcia-Verdugo JM, Alvarez-Buylla A (1996) Chain migration ofneuronal precursors. Science 271:978 –981.
Lu QR, Yuk D, Alberta JA, Zhu Z, Pawlitzky I, Chan J, McMahon AP, StilesCD, Rowitch DH (2000) Sonic hedgehog–regulated oligodendrocyte
6000 • J. Neurosci., June 30, 2004 • 24(26):5982– 6002 Gurok et al. • Neural Progenitor Cell Differentiation
lineage genes encoding bHLH proteins in the mammalian central nervoussystem. Neuron 25:317–329.
Maeda N, Noda M (1998) Involvement of receptor-like protein tyrosinephosphatase zeta/RPTPbeta and its ligand pleiotrophin/heparin-bindinggrowth-associated molecule (HB-GAM) in neuronal migration. J CellBiol 142:203–216.
Malatesta P, Hartfuss E, Gotz M (2000) Isolation of radial glial cells byfluorescent-activated cell sorting reveals a neuronal lineage. Development127:5253–5263.
Malatesta P, Hack MA, Hartfuss E, Kettenmann H, Klinkert W, Kirchhoff F,Gotz M (2003) Neuronal or glial progeny: regional differences in radialglia fate. Neuron 37:751–764.
Martinez R, Gomes FC (2002) Neuritogenesis induced by thyroidhormone-treated astrocytes is mediated by epidermal growth factor/mitogen-activated protein kinase-phosphatidylinositol 3-kinase path-ways and involves modulation of extracellular matrix proteins. J BiolChem 277:49311– 49318.
Matsumoto K, Wanaka A, Takatsuji K, Muramatsu H, Muramatsu T, To-hyama M (1994) A novel family of heparin-binding growth factors,pleiotrophin and midkine, is expressed in the developing rat cerebralcortex. Brain Res Dev Brain Res 79:229 –241.
Matsuno K, Eastman D, Mitsiades T, Quinn AM, Carcanciu ML, OrdentlichP, Kadesch T, Artavanis-Tsakonas S (1998) Human deltex is a conservedregulator of Notch signaling. Nat Genet 19:74 –78.
Matsuoka Y, Li X, Bennett V (1998) Adducin is an in vivo substrate forprotein kinase C: phosphorylation in the MARCKS-related domain in-hibits activity in promoting spectrin-actin complexes and occurs in manycells, including dendritic spines of neurons. J Cell Biol 142:485– 497.
McKay R (1997) Stem cells in the central nervous system. Science276:66 –71.
Menard S, Castronovo V, Tagliabue E, Sobel ME (1997) New insights intothe metastasis-associated 67 kD laminin receptor. J Cell Biochem67:155–165.
Meyer G, Feldman EL (2002) Signaling mechanisms that regulate actin-based motility processes in the nervous system. J Neurochem 83:490 –503.
Mi ZP, Jiang P, Weng WL, Lindberg FP, Narayanan V, Lagenaur CF (2000)Expression of a synapse-associated membrane protein, P84/SHPS-1, andits ligand, IAP/CD47, in mouse retina. J Comp Neurol 416:335–344.
Missler M, Sudhof TC (1998) Neurexins: three genes and 1001 products.Trends Genet 14:20 –26.
Mitsiadis TA, Gayet O, Zhang N, Carroll P (2001) Expression of Deltex1during mouse embryogenesis: comparison with Notch1, 2 and 3 expres-sion. Mech Dev 109:399 – 403.
Miyata T, Kawaguchi A, Okano H, Ogawa M (2001) Asymmetric inheri-tance of radial glial fibers by cortical neurons. Neuron 31:727–741.
Mohan S, Baylink DJ (2002) IGF-binding proteins are multifunctional andact via IGF-dependent and -independent mechanisms. J Endocrinol175:19 –31.
Morshead CM, van der Kooy D (2003) Adult multipotential, self-renewingneurospheres in vitro are the clonal derivatives of relatively quiescentneural stem cells in vivo. Soc Neurosci Abstr 29:28.13.
Morshead CM, Reynolds BA, Craig CG, McBurney MW, Staines WA, Moras-sutti D, Weiss S, van der Kooy D (1994) Neural stem cells in the adultmammalian forebrain: a relatively quiescent subpopulation of sub-ependymal cells. Neuron 13:1071–1082.
Motegi S, Okazawa H, Ohnishi H, Sato R, Kaneko Y, Kobayashi H, TomizawaK, Ito T, Honma N, Buhring HJ, Ishikawa O, Matozaki T (2003) Role ofthe CD47-SHPS-1 system in regulation of cell migration. EMBO J22:2634 –2644.
Motoi Y, Aizawa T, Haga S, Nakamura S, Namba Y, Ikeda K (1999) Neuro-nal localization of a novel mosaic apolipoprotein E receptor, LR11, in ratand human brain. Brain Res 833:209 –215.
Muragaki Y, Timmons S, Griffith CM, Oh SP, Fadel B, Quertermous T, OlsenBR (1995) Mouse Col18a1 is expressed in a tissue-specific manner asthree alternative variants and is localized in basement membrane zones.Proc Natl Acad Sci USA 92:8763– 8767.
Muramatsu T (2002) Midkine and pleiotrophin: two related proteins in-volved in development, survival, inflammation and tumorigenesis. J Bio-chem (Tokyo) 132:359 –371.
Murphy DB, Seemann S, Wiese S, Kirschner R, Grzeschik KH, Thies U(1997) The human hepatocyte nuclear factor 3/fork head gene FKHL13:genomic structure and pattern of expression. Genomics 40:462– 469.
Nakagawa T, Sasahara M, Hayase Y, Haneda M, Yasuda H, Kikkawa R, Hi-gashiyama S, Hazama F (1998) Neuronal and glial expression ofheparin-binding EGF-like growth factor in central nervous system of pre-natal and early-postnatal rat. Brain Res Dev Brain Res 108:263–272.
Nataf S, Stahel PF, Davoust N, Barnum SR (1999) Complement anaphyla-toxin receptors on neurons: new tricks for old receptors? Trends Neurosci22:397– 402.
Nelson BR, Matsuhashi S, Lefcort F (2002) Restricted neural epidermalgrowth factor-like like 2 (NELL2) expression during muscle and neuronaldifferentiation. Mech Dev 119 [Suppl 1]:S11–S19.
Neuman T, Keen A, Knapik E, Shain D, Ross M, Nornes HO, Zuber MX(1993) ME1 and GE1: basic helix-loop-helix transcription factors ex-pressed at high levels in the developing nervous system and in morpho-genetically active regions. Eur J Neurosci 5:311–318.
Noctor SC, Flint AC, Weissman TA, Dammerman RS, Kriegstein AR (2001)Neurons derived from radial glial cells establish radial units in neocortex.Nature 409:714 –720.
Nolo R, Kaksonen M, Rauvala H (1996) Developmentally regulated neuriteoutgrowth response from dorsal root ganglion neurons to heparin-binding growth-associated molecule (HB-GAM) and the expression ofHB-GAM in the targets of the developing dorsal root ganglion neurites.Eur J Neurosci 8:1658 –1665.
Norton JD (2000) ID helix-loop-helix proteins in cell growth, differentia-tion and tumorigenesis. J Cell Sci 113:3897–3905.
Okamoto H, Takuwa N, Yokomizo T, Sugimoto N, Sakurada S, ShigematsuH, Takuwa Y (2000) Inhibitory regulation of Rac activation, membraneruffling, and cell migration by the G protein-coupled sphingosine-1-phosphate receptor EDG5 but not EDG1 or EDG3. Mol Cell Biol20:9247–9261.
Oldenborg PA, Zheleznyak A, Fang YF, Lagenaur CF, Gresham HD, LindbergFP (2000) Role of CD47 as a marker of self on red blood cells. Science288:2051–2054.
Oyasu M, Kuroda S, Nakashita M, Fujimiya M, Kikkawa U, Saito N (2000)Immunocytochemical localization of a neuron-specific thrombospondin-1-like protein, NELL2: light and electron microscopic studies in the rat brain.Brain Res Mol Brain Res 76:151–160.
Paglini G, Kunda P, Quiroga S, Kosik K, Caceres A (1998) Suppression ofradixin and moesin alters growth cone morphology, motility, and processformation in primary cultured neurons. J Cell Biol 143:443– 455.
Parnavelas JG, Nadarajah B (2001) Radial glial cells. Are they really glia?Neuron 31:881– 884.
Peretto P, Merighi A, Fasolo A, Bonfanti L (1997) Glial tubes in the rostralmigratory stream of the adult rat. Brain Res Bull 42:9 –21.
Pfeiffer-Guglielmi B, Fleckenstein B, Jung G, Hamprecht B (2003) Immu-nocytochemical localization of glycogen phosphorylase isozymes in ratnervous tissues by using isozyme-specific antibodies. J Neurochem85:73– 81.
Rakic P (1995) Radial versus tangential migration of neuronal clones in thedeveloping cerebral cortex. Proc Natl Acad Sci USA 92:11323–11327.
Ramalho-Santos M, Yoon S, Matsuzaki Y, Mulligan RC, Melton DA (2002)“Stemness”: transcriptional profiling of embryonic and adult stem cells.Science 298:597– 600.
Rapraeger AC (2001) Molecular interactions of syndecans during develop-ment. Semin Cell Dev Biol 12:107–116.
Raulo E, Chernousov MA, Carey DJ, Nolo R, Rauvala H (1994) Isolation ofa neuronal cell surface receptor of heparin binding growth-associatedmolecule (HB-GAM). Identification as N-syndecan (syndecan-3). J BiolChem 269:12999 –13004.
Rauvala H, Vanhala A, Castren E, Nolo R, Raulo E, Merenmies J, Panula P(1994) Expression of HB-GAM (heparin-binding growth-associatedmolecules) in the pathways of developing axonal processes in vivo andneurite outgrowth in vitro induced by HB-GAM. Brain Res Dev Brain Res79:157–176.
Reynolds BA, Weiss S (1992) Generation of neurons and astrocytes fromisolated cells of the adult mammalian central nervous system. Science255:1707–1710.
Richards LJ, Kilpatrick TJ, Bartlett PF (1992) De novo generation of neuro-nal cells from the adult mouse brain. Proc Natl Acad Sci USA89:8591– 8595.
Ronfani L, Ferraguti M, Croci L, Ovitt CE, Scholer HR, Consalez GG, BianchiME (2001) Reduced fertility and spermatogenesis defects in mice lack-ing chromosomal protein Hmgb2. Development 128:1265–1273.
Gurok et al. • Neural Progenitor Cell Differentiation J. Neurosci., June 30, 2004 • 24(26):5982– 6002 • 6001
Saarela J, Rehn M, Oikarinen A, Autio-Harmainen H, Pihlajaniemi T (1998)The short and long forms of type XVIII collagen show clear tissue speci-ficities in their expression and location in basement membrane zones inhumans. Am J Pathol 153:611– 626.
Sabatti C, Karsten SL, Geschwind DH (2002) Thresholding rules for recoveringa sparse signal from microarray experiments. Math Biosci 176:17–34.
Sanai N, Tramontin AD, Quinones-Hinojosa A, Barbaro NM, Gupta N, Kun-war S, Lawton MT, McDermott MW, Parsa AT, Manuel-Garcia VerdugoJ, Berger MS, Alvarez-Buylla A (2004) Unique astrocyte ribbon in adulthuman brain contains neural stem cells but lacks chain migration. Nature427:740 –744.
Sancho-Tello M, Valles S, Montoliu C, Renau-Piqueras J, Guerri C (1995)Developmental pattern of GFAP and vimentin gene expression in ratbrain and in radial glial cultures. Glia 15:157–166.
Sapiro R, Kostetskii I, Olds-Clarke P, Gerton GL, Radice GL, Strauss IJ (2002)Male infertility, impaired sperm motility, and hydrocephalus in mice defi-cient in sperm-associated antigen 6. Mol Cell Biol 22:6298–6305.
Seiffert M, Brossart P, Cant C, Cella M, Colonna M, Brugger W, Kanz L,Ullrich A, Buhring HJ (2001) Signal-regulatory protein alpha (SIRPal-pha) but not SIRPbeta is involved in T-cell activation, binds to CD47 withhigh affinity, and is expressed on immature CD34(�)CD38(�) hemato-poietic cells. Blood 97:2741–2749.
Sertie AL, Sossi V, Camargo AA, Zatz M, Brahe C, Passos-Bueno MR (2000)Collagen XVIII, containing an endogenous inhibitor of angiogenesis andtumor growth, plays a critical role in the maintenance of retinal structure andin neural tube closure (Knobloch syndrome). Hum Mol Genet 9:2051–2058.
Sestan N, Artavanis-Tsakonas S, Rakic P (1999) Contact-dependent inhibitionof cortical neurite growth mediated by notch signaling. Science 286:741–746.
Silos-Santiago I, Yeh HJ, Gurrieri MA, Guillerman RP, Li YS, Wolf J, SniderW, Deuel TF (1996) Localization of pleiotrophin and its mRNA in sub-populations of neurons and their corresponding axonal tracts suggestsimportant roles in neural-glial interactions during development and inmaturity. J Neurobiol 31:283–296.
Small JV, Stradal T, Vignal E, Rottner K (2002) The lamellipodium: wheremotility begins. Trends Cell Biol 12:112–120.
Steiner R, Ever L, Don J (1999) MEIG1 localizes to the nucleus and binds tomeiotic chromosomes of spermatocytes as they initiate meiosis. Dev Biol216:635– 645.
St. Pierre B, Flock G, Zacksenhaus E, Egan SE (2002) Stra13 homodimersrepress transcription through class B E-box elements. J Biol Chem277:46544 – 46551.
Sun H, Taneja R (2000) Stra13 expression is associated with growth arrestand represses transcription through histone deacetylase (HDAC)-dependent and HDAC-independent mechanisms. Proc Natl Acad SciUSA 97:4058 – 4063.
Sun YJ, Chou CC, Chen WS, Wu RT, Meng M, Hsiao CD (1999) The crystalstructure of a multifunctional protein: phosphoglucose isomerase/auto-crine motility factor/neuroleukin. Proc Natl Acad Sci USA 96:5412–5417.
Suslov ON, Kukekov VG, Ignatova TN, Steindler DA (2002) Neural stemcell heterogeneity demonstrated by molecular phenotyping of clonal neu-rospheres. Proc Natl Acad Sci USA 99:14506 –14511.
Takahashi M, Yamagata M, Noda M (1999) Specific expression of ezrin, acytoskeletal-membrane linker protein, in a subset of chick retinotectaland sensory projections. Eur J Neurosci 11:545–558.
Take M, Tsutsui J, Obama H, Ozawa M, Nakayama T, Maruyama I, Arima T,Muramatsu T (1994) Identification of nucleolin as a binding protein formidkine (MK) and heparin-binding growth associated molecule (HB-GAM). J Biochem (Tokyo) 116:1063–1068.
Takebayashi H, Yoshida S, Sugimori M, Kosako H, Kominami R, NakafukuM, Nabeshima Y (2000) Dynamic expression of basic helix-loop-helixOlig family members: implication of Olig2 in neuron and oligodendro-cyte differentiation and identification of a new member, Olig3. Mech Dev99:143–148.
Takeuchi T, Ohtsuki Y (2001) Recent progress in T-cadherin (CDH13,H-cadherin) research. Histol Histopathol 16:1287–1293.
Takeuchi T, Misaki A, Liang SB, Tachibana A, Hayashi N, Sonobe H, OhtsukiY (2000) Expression of T-cadherin (CDH13, H-Cadherin) in humanbrain and its characteristics as a negative growth regulator of epidermalgrowth factor in neuroblastoma cells. J Neurochem 74:1489 –1497.
Tamamaki N (2002) Radial glias and radial fibers: what is the function ofradial fibers? Anat Sci Int 77:2–11.
Tamamaki N, Nakamura K, Okamoto K, Kaneko T (2001) Radial glia is aprogenitor of neocortical neurons in the developing cerebral cortex. Neu-rosci Res 41:51– 60.
Tanigaki K, Nogaki F, Takahashi J, Tashiro K, Kurooka H, Honjo T (2001)Notch1 and Notch3 instructively restrict bFGF-responsive multipotentneural progenitor cells to an astroglial fate. Neuron 29:45–55.
Tekki-Kessaris N, Woodruff R, Hall AC, Gaffield W, Kimura S, Stiles CD,Rowitch DH, Richardson WD (2001) Hedgehog-dependent oligoden-drocyte lineage specification in the telencephalon. Development128:2545–2554.
Temple S (2001) The development of neural stem cells. Nature 414:112–117.Thomas A, Gasque P, Vaudry D, Gonzalez B, Fontaine M (2000) Expression
of a complete and functional complement system by human neuronalcells in vitro. Int Immunol 12:1015–1023.
Tramontin AD, Garcia-Verdugo JM, Lim DA, Alvarez-Buylla A (2003) Postna-tal development of radial glia and the ventricular zone (VZ): a continuum ofthe neural stem cell compartment. Cereb Cortex 13:580–587.
Tyler-McMahon BM, Boules M, Richelson E (2000) Neurotensin: peptidefor the next millennium. Regul Pept 93:125–136.
Uittenbogaard M, Chiaramello A (2002) Expression of the bHLH transcrip-tion factor Tcf12 (ME1) gene is linked to the expansion of precursor cellpopulations during neurogenesis. Gene Expr Patterns 1:115–121.
Verreault A, Kaufman PD, Kobayashi R, Stillman B (1996) Nucleosome as-sembly by a complex of CAF-1 and acetylated histones H3/H4. Cell87:95–104.
Vuletic S, Jin LW, Marcovina SM, Peskind ER, Moller T, Albers JJ (2003)Widespread distribution of PLTP in human CNS: evidence for PLTPsynthesis by glia and neurons, and increased levels in Alzheimer’s disease.J Lipid Res 44:1113–1123.
Wang F, Van Brocklyn JR, Hobson JP, Movafagh S, Zukowska-Grojec Z,Milstien S, Spiegel S (1999) Sphingosine 1-phosphate stimulates cell mi-gration through a G(i)-coupled cell surface receptor. Potential involve-ment in angiogenesis. J Biol Chem 274:35343–35350.
Wen T, Gu P, Minning TA, Wu Q, Liu M, Chen F, Liu H, Huang H (2002)Microarray analysis of neural stem cell differentiation in the striatum ofthe fetal rat. Cell Mol Neurobiol 22:407– 416.
Wewetzer K, Rauvala H, Unsicker K (1995) Immunocytochemical localiza-tion of the heparin-binding growth-associated molecule (HB-GAM) inthe developing and adult rat cerebellar cortex. Brain Res 693:31–38.
Wichterle H, Garcia-Verdugo JM, Alvarez-Buylla A (1997) Direct evidencefor homotypic, glia-independent neuronal migration. Neuron18:779 –791.
Winkler S, Stahl RC, Carey DJ, Bansal R (2002) Syndecan-3 and perlecan aredifferentially expressed by progenitors and mature oligodendrocytes andaccumulate in the extracellular matrix. J Neurosci Res 69:477– 487.
Yamamoto S, Nagao M, Sugimori M, Kosako H, Nakatomi H, Yamamoto N,Takebayashi H, Nabeshima Y, Kitamura T, Weinmaster G, Nakamura K,Nakafuku M (2001) Transcription factor expression and Notch-dependent regulation of neural progenitors in the adult rat spinal cord.J Neurosci 21:9814 –9823.
Yamazaki F, Nagatsuka Y, Shirakawa H, Yoshida M (1995) Repression ofcell cycle progression by antisense HMG2 RNA. Biochem Biophys ResCommun 210:1045–1051.
Yeh HJ, He YY, Xu J, Hsu CY, Deuel TF (1998) Upregulation of pleiotro-phin gene expression in developing microvasculature, macrophages, andastrocytes after acute ischemic brain injury. J Neurosci 18:3699 –3707.
Yu JX, Bradt BM, Cooper NR (2002) Constitutive expression of proinflam-matory complement components by subsets of neurons in the centralnervous system. J Neuroimmunol 123:91–101.
Zhang Y, Flejter WL, Barcroft CL, Riviere M, Szpirer J, Szpirer C, Bina M(1995) Localization of the human HTF4 transcription factors 4 gene(TCF12) to chromosome 15q21. Cytogenet Cell Genet 68:235–238.
Zhou FC, Duguid JR, Edenberg HJ, McClintick J, Young P, Nelson P (2001)DNA microarray analysis of differential gene expression of 6-year-old ratneural striatal progenitor cells during early differentiation. Restor NeurolNeurosci 18:95–104.
Zhou Q, Wang S, Anderson DJ (2000) Identification of a novel family ofoligodendrocyte lineage-specific basic helix-loop-helix transcription fac-tors. Neuron 25:331–343.
6002 • J. Neurosci., June 30, 2004 • 24(26):5982– 6002 Gurok et al. • Neural Progenitor Cell Differentiation