Embed Size (px)
Citation preview
Modeling and simulation of microbial enhanced oilrecovery including interfacial area
David Landa-Marbán†, Florin A. Radu† and Jan M. Nordbotten†
Abstract
The focus of this paper is the derivation of a non-standard model for micro-bial enhanced oil recovery (MEOR) that includes the interfacial area (IFA)between the oil and water. We consider the continuity equations for water andoil, a balance equation for the oil-water interface and advective-dispersivetransport equations for bacteria, nutrients and surfactants. Surfactants lowerthe interfacial tension (IFT), which improves the oil recovery. Therefore,we include in the model parameterizations of the IFT reduction and residualoil saturation as a function of the surfactant concentration. We consider forthe first time in context of MEOR, the role of IFA in enhanced oil recovery(EOR). The motivation to include the IFA in the model is to reduce the hys-teresis in the capillary pressure relationship, include the effects of observedbacteria migration towards the oil-water interface and biological productionof surfactants at the oil-water interface. An efficient and robust linearizationscheme was implemented, in which we use an implicit scheme that consid-ers a linear approximation of the capillary pressure gradient, resulting in anefficient and stable scheme. A comprehensive, 2D implementation based ontwo-point flux approximation (TPFA) has been achieved. Illustrative numer-ical simulations are presented. We give an explanation of the differences inthe oil recovery profiles obtained when we consider the IFA and MEOR ef-fects. The model can also be used to design new experiments in order to gaina better understanding and optimization of MEOR.
Keywords Bacteria · Interfacial area · Interfacial tension · Microbial en-hanced oil recovery · Surfactant
†Department of Mathematics, University of Bergen, Bergen, Norway ([email protected],[email protected], [email protected])
1
arX
iv:1
612.
0466
3v1
[ph
ysic
s.fl
u-dy
n] 1
4 D
ec 2
016
List of SymbolsA Cross sectional areaaow Specific IFACb, Cn, Cs Bacterial, nutrient and surfactant concentrationC∗n Critical nutrient concentration for metabolismd1 Bacterial decay rate coefficientDeff
b , Deffn , Deff
s Effective diffusion coefficientsEow Production rate of specific IFAeow Strength of change of specific IFAF Source/sink termg Gravityg1,max Maximum bacterial growth rate coefficientk, ko, kw Absolute, oil and water effective permeabilitieska Diffusion coefficient for the chemotaxiskr,o, kr,w Oil and water relative permeabilitieskow Interfacial permeabilityKb/n, Ks/n Half saturation constants for producing bacteria and surfactantsKa Half saturation constant for producing surfactantsl1, l2, l3 Fitting parameters for modeling the reduction of IFTL Length of porous mediumNB Bond numberNCa Capillary numberNT Trapping numberp, po, pw Average, oil and water pressurepv Number of pore volume injectedQT Water injection rateso, sw Oil and water saturationsor, smin
or , smaxor Residual oil saturation, minimum and maximum
swi Irreducible water saturations∗w Effective water saturationT1, T2 Fitting parameters for modeling the residual oil saturationu, uΣ Volumetric and total flow rate per areavg Settling velocity of bacteriavow Interfacial velocityVp Pore volumeW Width of porous mediumYs/b, Ys/n Surfactant yield coefficients per unit bacteria and nutrientα0 Angle of flow relative to the horizontalα1, α2, α3, α4 Parameters for the IFA relationαb,L, αn,L, αs,L Longitudinal dispersivitiesαb,T , αn,T , αs,T Transverse dispersivitiesδ Dirac delta∆t Time step∆x Space stepλo, λw Oil and water mobilitiesµ Viscosityµs,max Maximum specific biomass production rateφ Porosityρ Densityσ , σmin, σmax IFT, minimum and maximumθ Contact angle
2
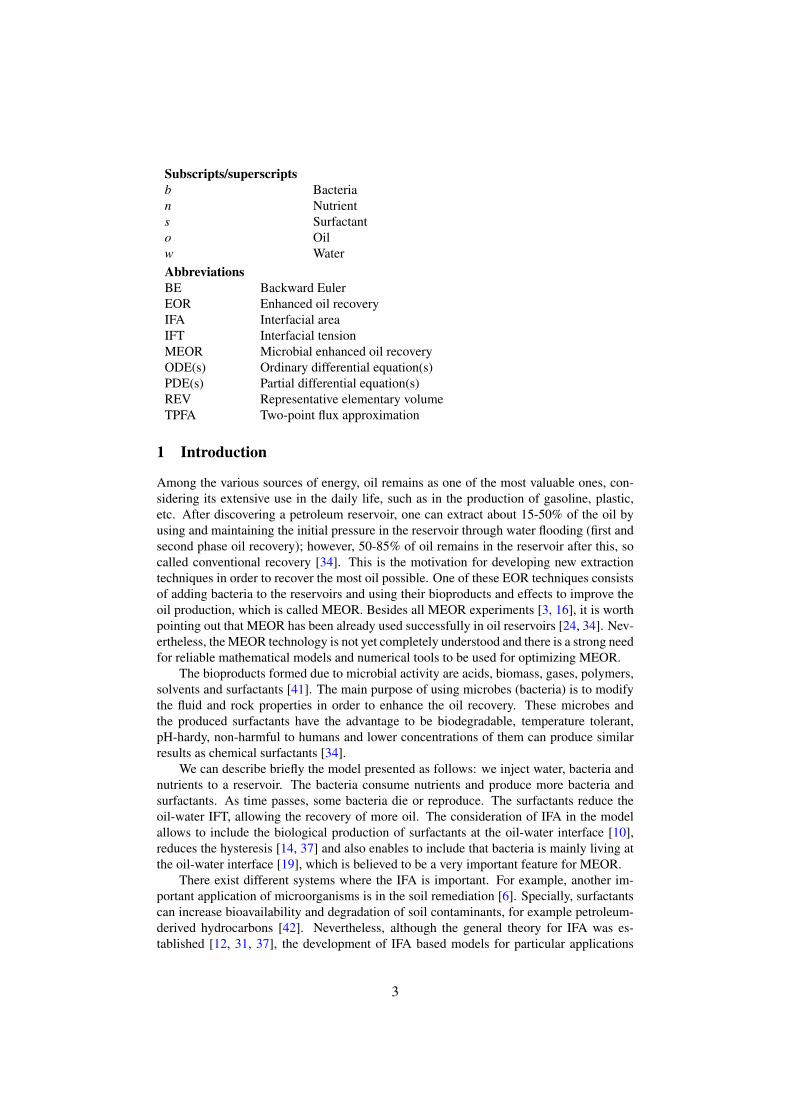
Subscripts/superscriptsb Bacterian Nutrients Surfactanto Oilw WaterAbbreviationsBE Backward EulerEOR Enhanced oil recoveryIFA Interfacial areaIFT Interfacial tensionMEOR Microbial enhanced oil recoveryODE(s) Ordinary differential equation(s)PDE(s) Partial differential equation(s)REV Representative elementary volumeTPFA Two-point flux approximation
1 Introduction
Among the various sources of energy, oil remains as one of the most valuable ones, con-sidering its extensive use in the daily life, such as in the production of gasoline, plastic,etc. After discovering a petroleum reservoir, one can extract about 15-50% of the oil byusing and maintaining the initial pressure in the reservoir through water flooding (first andsecond phase oil recovery); however, 50-85% of oil remains in the reservoir after this, socalled conventional recovery [34]. This is the motivation for developing new extractiontechniques in order to recover the most oil possible. One of these EOR techniques consistsof adding bacteria to the reservoirs and using their bioproducts and effects to improve theoil production, which is called MEOR. Besides all MEOR experiments [3, 16], it is worthpointing out that MEOR has been already used successfully in oil reservoirs [24, 34]. Nev-ertheless, the MEOR technology is not yet completely understood and there is a strong needfor reliable mathematical models and numerical tools to be used for optimizing MEOR.
The bioproducts formed due to microbial activity are acids, biomass, gases, polymers,solvents and surfactants [41]. The main purpose of using microbes (bacteria) is to modifythe fluid and rock properties in order to enhance the oil recovery. These microbes andthe produced surfactants have the advantage to be biodegradable, temperature tolerant,pH-hardy, non-harmful to humans and lower concentrations of them can produce similarresults as chemical surfactants [34].
We can describe briefly the model presented as follows: we inject water, bacteria andnutrients to a reservoir. The bacteria consume nutrients and produce more bacteria andsurfactants. As time passes, some bacteria die or reproduce. The surfactants reduce theoil-water IFT, allowing the recovery of more oil. The consideration of IFA in the modelallows to include the biological production of surfactants at the oil-water interface [10],reduces the hysteresis [14, 37] and also enables to include that bacteria is mainly living atthe oil-water interface [19], which is believed to be a very important feature for MEOR.
There exist different systems where the IFA is important. For example, another im-portant application of microorganisms is in the soil remediation [6]. Specially, surfactantscan increase bioavailability and degradation of soil contaminants, for example petroleum-derived hydrocarbons [42]. Nevertheless, although the general theory for IFA was es-tablished [12, 31, 37], the development of IFA based models for particular applications
3
remains a current challenge. In this work we will derive for the first time a mathematicalmodel for MEOR which includes IFA. It is worth to be mentioned that further develop-ments of the present model, which are considering a formal upscaling from pore to coreand in this way better describe the evolution of the micro scale are possible but beyond theaim of this study [32, 7, 28].
Mathematical models for MEOR are based on coupled nonlinear partial differentialequations (PDEs) and ordinary differential equations (ODEs), which are very difficult tobe solved. Therefore, it is necessary to use advanced numerical methods and simulationsto predict the behavior on time of the unknowns in this complex system. For example,in [30] they used a semi-implicit finite difference technique and in [25] they used ComsolMultiphysics, that is a commercial PDE solver using finite elements together with variable-step back differentiation and Newton method. Even though it is possible to buy commercialsoftware in the petroleum industry for simulation, it is preferable to do the discretizationof the equations and write an own code to perform numerical simulations, in order toimplement new relations that are not included in the commercial ones.
Most of the MEOR models are based on non-realistic simplifications (for example,only one transport equation for the bacteria is considered, hysteresis in the capillary pres-sure is neglected, the oil-water interfacial area is not included, numerical simulations arejust made in 1D [18, 30, 25]). In this general context, the objective of the research reportedin the present article was to develop and implement (in a 2D porous media) an accuratenumerical simulator for MEOR.
To summarize, the new contributions of this paper are
• the development of a multidimensional comprehensive mathematical model forMEOR, which includes bacteria, nutrients, surfactants and two-phase flow.
• the inclusion of the role of IFA in MEOR.
• the inclusion of the tendency of bacteria to move to the oil-water interface.
• the inclusion of the biological production of surfactants at the oil-water interface.
The paper is structured as follows
• Reservoir modeling. We introduce the basic concepts, ideas and equations for mod-eling MEOR. In addition, we explain the new phenomena we can model in MEORwhen we include the IFA.
• Discretization and implementation. We explain the techniques we used for the dis-cretization, namely finite differences and TPFA for the spatial discretization andbackward Euler (BE) for the time discretization. We also describe the algorithm weused for numerically solving the mathematical model for MEOR.
• Results and discussion. We present the results of the numerical experiments bystudying the effects of the new relations we proposed for modeling MEOR.
• Conclusion and future work.
4
2 Reservoir modeling
Let us consider a porous medium filled with water and oil. We assume that the fluids areimmiscible and incompressible. For knowing the amount of a phase in the representativeelement volume (REV), we introduce the saturation of phase α (for oil α = o and forwater α = w) given by the ratio of volume of phase α (in REV) over the volume of voids(in REV). In the case where the porous medium is just filled with two fluids, we have thatso + sw = 1.
In the oil-water interface there is a surface free energy due to natural electrical forces,which attract the molecules to the interior of each phase and to the contact surface [12].The IFT keeps the fluids separated and it is defined by the quantity of work needed toseparate a surface of unit area from both fluids.
Capillary pressure pc is the difference in pressure between two immiscible phases offluids occupying similar pores due to IFT between the phases [5]. It is known that pc is nota well-defined function because to one value of water saturation, corresponds more thanone value of pc, due to pc being dependent on the history. It means that different saturationvalues are expected during imbibition as in drainage. This phenomenon occurring in manyporous media systems is called hysteresis.
We write Darcy’s law and the mass conservation equations for each α phase (α = o, w)
∂ (φsα)
∂ t+∇ ·uα =
Fα
ρα
uα =−λα k(∇pα −ρα g), (1)
where φ is the porosity, uα the volumetric flow rate per area, Fα the source/sink term, ρα
the density, k the absolute permeability and λα =kr,αµα
the phase mobility, with kr,α therelative permeability and µα the viscosity. In this work we consider that the porosity doesnot change over time. Defining the average pressure p = 1
2 (pw + po), λΣ = λo +λw andλ∆ = λo−λw, using sw+so = 1 and pw− po = pc, we can reformulate the problem solvingfor p and sw
Pressure equation −∇ · (k(λΣ∇p+12
λ∆∇pc− (λwρw +λoρo)g)) = ∑α=w,o
Fα
ρα
.
Saturation equation φ∂ sw
∂ t−∇ · (λwk(∇(p− 1
2pc)−ρwg)) =
Fw
ρw.
(2)
An extended description of the previous equations can be found e.g. in [33] and [15].
2.1 IFA
Considering a porous medium filled with two fluids, the surface where they make contactis called IFA. Mathematically, we compute the specific IFA aow as a ratio of the IFA in theREV over the volume of REV. For understanding better the importance of aow in the oilrecovery, let us consider Fig. 1, where we observe that splitting the square in four pieces,the IFA increases by a factor of 2. Then, we can recover faster the oil in the zones withlarger IFA.
5
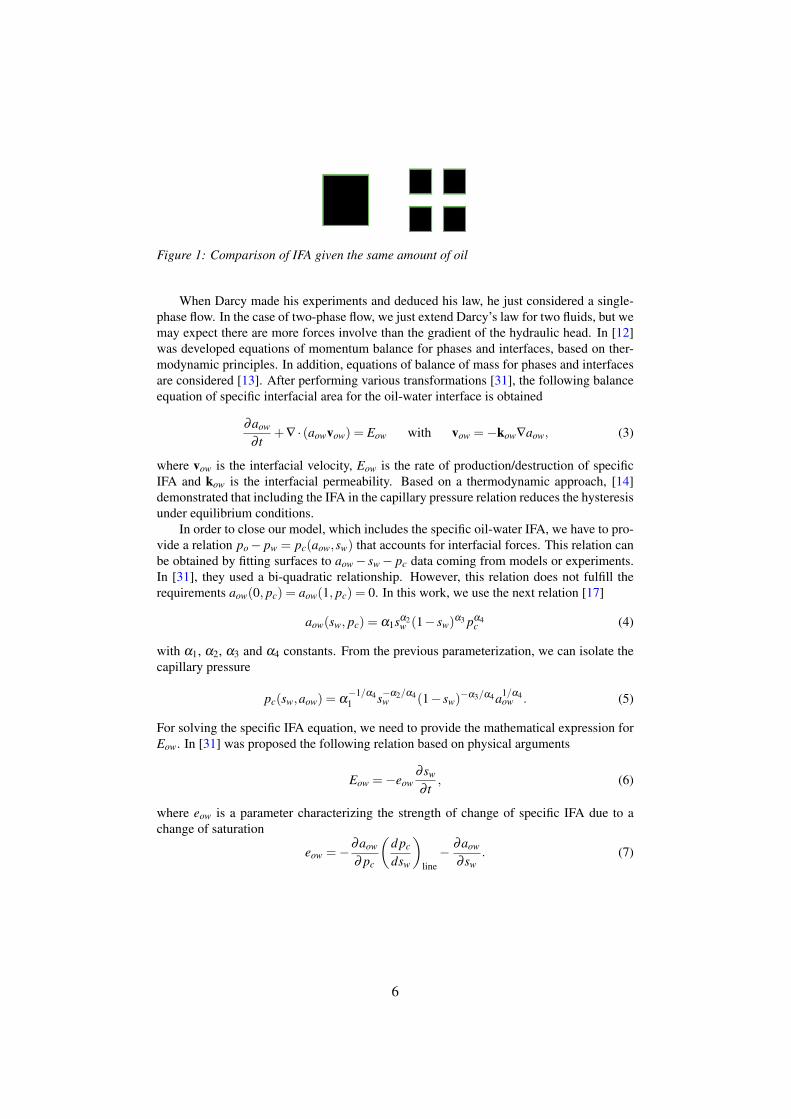
Figure 1: Comparison of IFA given the same amount of oil
When Darcy made his experiments and deduced his law, he just considered a single-phase flow. In the case of two-phase flow, we just extend Darcy’s law for two fluids, but wemay expect there are more forces involve than the gradient of the hydraulic head. In [12]was developed equations of momentum balance for phases and interfaces, based on ther-modynamic principles. In addition, equations of balance of mass for phases and interfacesare considered [13]. After performing various transformations [31], the following balanceequation of specific interfacial area for the oil-water interface is obtained
∂aow
∂ t+∇ · (aowvow) = Eow with vow =−kow∇aow, (3)
where vow is the interfacial velocity, Eow is the rate of production/destruction of specificIFA and kow is the interfacial permeability. Based on a thermodynamic approach, [14]demonstrated that including the IFA in the capillary pressure relation reduces the hysteresisunder equilibrium conditions.
In order to close our model, which includes the specific oil-water IFA, we have to pro-vide a relation po− pw = pc(aow,sw) that accounts for interfacial forces. This relation canbe obtained by fitting surfaces to aow− sw− pc data coming from models or experiments.In [31], they used a bi-quadratic relationship. However, this relation does not fulfill therequirements aow(0, pc) = aow(1, pc) = 0. In this work, we use the next relation [17]
aow(sw, pc) = α1sα2w (1− sw)
α3 pα4c (4)
with α1, α2, α3 and α4 constants. From the previous parameterization, we can isolate thecapillary pressure
pc(sw,aow) = α−1/α41 s−α2/α4
w (1− sw)−α3/α4a1/α4
ow . (5)
For solving the specific IFA equation, we need to provide the mathematical expression forEow. In [31] was proposed the following relation based on physical arguments
Eow =−eow∂ sw
∂ t, (6)
where eow is a parameter characterizing the strength of change of specific IFA due to achange of saturation
eow =−∂aow
∂ pc
(d pc
dsw
)line− ∂aow
∂ sw. (7)
6
The path(
d pcdsw
)line
is in general unknown, but in the main drainage and imbibition
curves, pc is a known function of sw. In addition, it is possible to compute this derivativefor eow = 0. For all other paths, we interpolate using these three values of eow [31].
Experimental investigations focused on simultaneously measuring pc, sw and aow areoften difficult, expensive and subject to limitations, thus only a few have been reported inthe literature, indicating a need for further experimental studies characterizing the relation-ship aow(sw, pc) [9, 38].
2.2 Transport equations
For describing the movement of bacteria, nutrients and surfactants, we consider the fol-lowing transport equations (β = b,n,s)
∂ (Cβ φsw)
∂ t−∇ ·
(Dβ φsw∇Cβ −uwCβ −δbβ (vaCb +vgφCb)
)= Rβ , (8)
where the reaction rate terms are given by [18, 25]
Rb = g1φswCb−d1φswCb−Rs
Ys/bRn =−
Rs
Ys/n−YnφswCb Rs = µsφswCb (9)
and in the general case the dispersion coefficients are given by
Dβ ,i j = δi jαβ ,T |u|+(αβ ,L−αβ ,T )uiu j
|u|+δi jDeff
β, (10)
where the fluid velocity of the aqueous phase is given by u = uwφsw
. In the previous equa-tions, Cb, Cn, Cs are the concentrations of bacteria, nutrients and surfactants, αβ ,L thelongitudinal dispersivity, αβ ,T the transverse dispersivity, Deff
βthe effective diffusion coef-
ficients of bacteria, nutrients and surfactants in the water phase and δi j the Dirac delta. Weconsider that the bacteria, nutrients and surfactants live on the water, so their transport dueto the convection is given by the term uwCβ . We include gravity effects on the bacteria con-sidering the settling velocity of bacteria vg. For including that the bacteria has a tendencyto live in the oil-water interface [19], we add the chemotactic velocity va in the bacteriatransport equation. We propose the following expression for the chemotactic velocity
va = ka∇aow, (11)
where ka is a diffusive term. It is for the first time when such a chemotaxis term is includedin the modeling transport of bacteria in two-phase porous media. Including the chemotaxisin MEOR models is important because besides the external constrains, it also determinesthe distribution of bacteria in the soil [11, 8].
Let us analyses the reaction terms for the transport equations. For modeling the growthof bacteria, we use the Monod-type model [20]
g1 = g1maxCn
Kb/n +Cn, (12)
7
where g1max is the observed maximum growth rate and Kb/n the half saturation constant,being the nutrient concentration level when g1 =
12 g1max. On the other hand, we consider
a linear death of bacteria, given by d1. Due to nutrients and bacteria being involved inthe generation of surfactants, we introduce the surfactant yield coefficients 1
Ys/b+ 1
Ys/n= 1.
For the nutrients consumed for bacteria, we consider the yield coefficient Yn, which weincluded in the Rn term. In the absence of IFA, one relation for the production rate ofsurfactants is given by [23]
µs(Cn) = µs maxCn−C∗n
Ks/n +Cn−C∗n, (13)
where µs max is the maximum specific biomass production rate, and C∗n the critical nutrientconcentration for metabolism term, that models a need of minimum Cn for obtaining sur-factants. One of the characteristics that a surfactant should have is biological productionat the oil-water interface [10]. In order to consider this effect in our model, we considerthe production rate of surfactant as a function of the nutrient concentration and IFA. To ourknowledge, there are not experimental studies to deduce a mathematical relation of the sur-factant production in function of the IFA; therefore, we need experiments for µ(Cn,aow).Given the mathematical characteristics of the Monod-type function, we propose the fol-lowing expression for the production rate of surfactants
µs(Cn,aow) = µs maxaow
Ka +aow
Cn−C∗nKs/n +Cn−C∗n
, (14)
where Ka is the half saturation constant.The pressure, saturation and IFA equations are coupled with these transport equations
under the assumptions that the two-phase flows are incompressible and immiscible, bothviscosities are constants, the presence of dissolved salt in the wetting phase is neglectedand the system is isothermal [25].
2.3 IFT
One of the main objectives of applying MEOR is to reduce the sor via surfactant effecton the oil-water IFT. There exist several experiments showing the impact of surfactants inreducing the IFT [44]. Common initial IFT values are of the order of 10−2 mN/m and weaim to lower this value≤ 10−3 mN/m [45]. One mathematical model for the IFT reductionis given by [30]
σ = σ0− tanh(l3Cs− l2)+1+ l1− tanh(−l2)+1+ l1
, (15)
where σ0 is the initial IFT, l1, l2 and l3 are fitting parameters, which define the efficiencyof the surfactant, moderating the concentration where the IFT drops dramatically and theminimal IFT achieved after the surfactant action [30].
When the surfactant concentration increases, the IFT and pc decrease. For consideringthis effect in our model, we include the dependence of the Cs in Eq. 5, resulting in thefollowing capillary pressure expression
pc(sw,aow,Cs,φ ,k) = σ(Cs)√
φ
||k||α−1/α41 s−α2/α4
w (1− sw)−α3/α4a1/α4
ow (16)
where we also include the porosity and permeability. Then, the IFA becomes
aow(sw, pc,Cs,φ ,k) = α1sα2w (1− sw)
α3
(pc
σ(Cs)
√||k||
φ
)α4
. (17)
8
2.4 Trapping number
The residual oil saturation after water flooding is believed to be distributed through thepores in the petroleum reservoir in the form of immobile globules, being the capillary andviscous interactions the main forces acting on these globules [10]. The capillary numberNCa relates the surface tension and viscous forces acting in the interface, the bond numberrelates the buoyancy to capillary forces and the trapping number NT quantifies the forcebalance. Then, the mathematical expressions for these numbers are given by [35]
NCa =uwµw
σ cosθNB =
(ρw−ρn)gkkr,w
σ cosθNT =
√N2
Ca +2NCaNB sinα0 +N2B, (18)
where θ is the contact angle between the oil-water interface and α0 is the angle of flowrelative to the horizontal. At the end of water flooding, the capillary number is in the range10−6 to 10−7 [10]. In order to increase the capillary number, from Eq. 18 we observe thatincreasing the flow rate, the water viscosity or lowering the IFT are the three possibilities.In [25], they stated that MEOR could improve the oil extraction if we can obtain a capillarynumber between 10−5 and 10−1.
2.5 Residual oil saturation
For relating the residual oil saturation and the capillary number, we use the followingrelation ([26])
sor = min(sor,smin
or +(smaxor − smin
or )[1+(T1NT)T2 ]
1T2−1)
, (19)
where sminor and smax
or are the maximum and minimum residual oil saturation and both T1 andT2 are fitting parameters estimated from the experimental data.
Giving the mathematical expressions for the IFT reduction, the trapping number andthe residual oil saturation reduction, we can account in the model the effect of the surfac-tants in improving the oil recovery.
2.6 Two-phase flow model with transport equations including IFA
In summary, we propose the next set of equations as the first complete model for MEORincluding IFA effects
9
Pressure−∇ · (k(λΣ∇p+ 1
2 λ∆∇pc− (λwρw +λoρo)g)) = ∑α=w,n
Fα
ρα
Saturationφ
∂ sw∂ t −∇ · (λwk(∇(p− 1
2 pc)−ρog)) = Fwρw
Interfacial area∂aow
∂ t −∇ · (aowkow∇aow) = ( ∂aow∂ pc
( d pcdsw
)line +∂aow∂ sw
) ∂ sw∂ t
Bacterial concentration∂ (Cbφsw)
∂ t −∇ · (Dbφsw∇Cb−uwCb− ka∇ao,wCb−vgφCb) =
(g1maxCn
Kb/n+Cn−d1)φswCb− Rs
Ys/b
Nutrient concentration∂ (Cnφsw)
∂ t −∇ · (Dnφsw∇Cn−uwCn) =− RsYs/n−YnφswCb
Surfactant concentration∂ (Csφsw)
∂ t −∇ · (Dsφsw∇Cs−uwCs) = µs maxaow
Ka+aow
Cn−C∗nKs/n+Cn−C∗n
φswCb
Relative permeabilitieskr,w(sw) = ( sw−swi
1−sor−swi)2 kr,o(sw) = ( 1−sw−sor
1−sor−swi)2
Capillary pressurepc(sw,aow,Cs,φ , ||k||) = σ(Cs)
√φ
||k||α−1/α41 s−α2/α4
w (1− sw)−α3/α4a1/α4
ow
Interfacial tensionσ = σ0
− tanh(l3∗Cs−l2)+1+l1− tanh(−l2)+1+l1
Trapping numberNCa =
uwµwσ cosθ
NB =(ρw−ρn)gkkr,w
σ cosθNT =
√N2
Ca +2NCaNB sinα0 +N2B
Residual oil saturationsor = min
(sor,smin
or +(smaxor − smin
or )[1+(T1NT )T2 ]
1T2−1).
3 Discretization and implementation
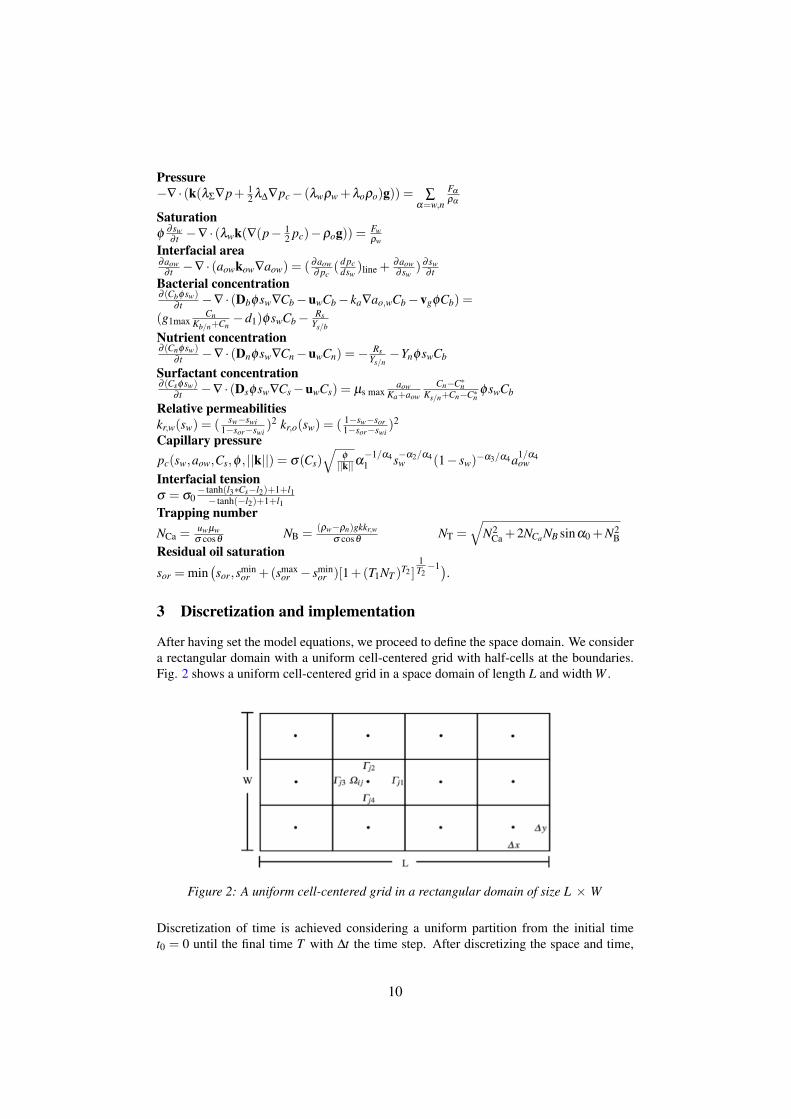
After having set the model equations, we proceed to define the space domain. We considera rectangular domain with a uniform cell-centered grid with half-cells at the boundaries.Fig. 2 shows a uniform cell-centered grid in a space domain of length L and width W .
Figure 2: A uniform cell-centered grid in a rectangular domain of size L × W
Discretization of time is achieved considering a uniform partition from the initial timet0 = 0 until the final time T with ∆t the time step. After discretizing the space and time,
10
now we discretize the derivatives and integrals. Considering an arbitrary function f (x,y),using its Taylor expansion we get the following approximation for the derivatives
∂ f∂x
=f (x+∆x,y)− f (x,y)
∆x+O(∆x)
∂ f∂x
=f (x+ ∆x
2 )− f (x− ∆x2 )
∆x+O(∆x2). (20)
The approximation of first order is used on the boundaries of the spatial domain and timederivatives while the second order approximation is used in the cell-centered grill. Todiscretize time derivatives ut(x, t) = F(u, t), we consider the BE method
un+1i = un
i +F(un+1i , tn+1)∆t +O(∆t). (21)
Finally, for approximating integrals, we use the midpoint rule∫Ωi j
f (x,y)dxdy≈ ∆x∆y fi j. (22)
In the previous section we developed a two-phase flow model for MEOR with transportequations including IFA effects. We are interested in the solution of this system. In orderto perform numerical simulations, it is necessary to discretize these equations. In thiswork, we used a cell-centered finite-volume method called TPFA. A detailed descriptionabout how to use and implement TPFA in MATLAB can be found in [1]. As we considera cell centered grid, we do not know the values of the parameters on the walls, so it isnecessary to use an approximation on the boundaries. Depending on the parameter, weshould consider different technique approximations, in order to get stability and correctresults [4]. Regarding the permeability of the medium, we approximate k by the harmonicmean [2]
ki+1/2 = 2(∆xi+1 +∆xi)
(∆xi+1
ki+1+
∆xi
ki
)−1
. (23)
The reason for considering this harmonic mean comes from the computation of an effectivepermeability when we consider a layered system with different values of permeability anda flux perpendicular to these layers, finding that the effective permeability of a system withtwo layers is given by the previous equation [33]. For the rest of the parameters that weneed to approximate on the walls, we simply use the average value
ξi+1/2 =ξi+1 +ξi
2. (24)
There are several algorithms to solve reactive transport models [25, 43, 29]. In this work,for solving the pressure, saturation and IFA equations, we use an implicit scheme. The useof these iterative formulations is very common, for example in [36] and [27] they solved theRichards equation using this technique. Regarding the two-phase flow, in [40] they solvedthe pressure and saturation equations using the same iterative scheme. The convergence ofthis implicit scheme can be followed from [39], [21] and [22].
Due to the capillary pressure is a function of the saturation and interfacial area, bothof them being unknowns, we use an inner iteration j in order to upgrade the values ofthe functions depending on the saturation and interfacial area and solve this system ofequations (pressure, saturation and IFA equations) until a stopping criterion is reached.For initializing the iteration, we consider the solution at the previous time step
pn+1,1i = pn
i , an+1,1wn,i = an
wn,i, sn+1,1w,i = sn
w,i, λn+1,1i = λ
ni , ∀i. (25)
11
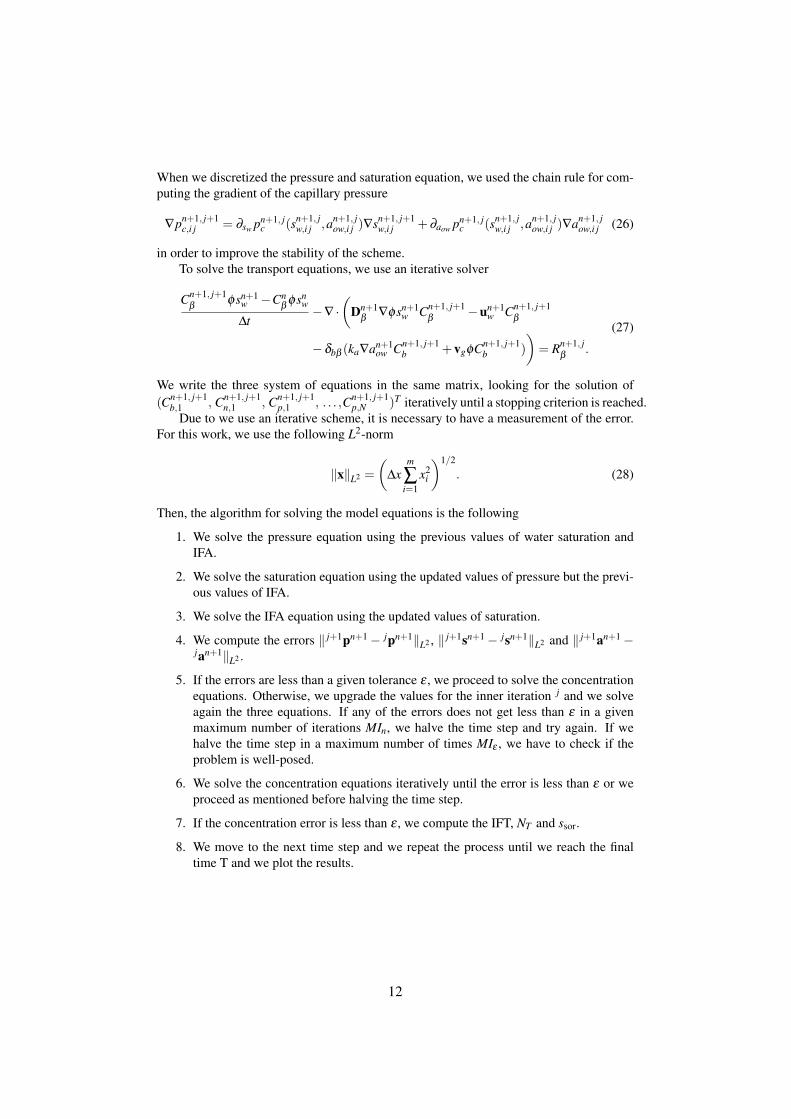
When we discretized the pressure and saturation equation, we used the chain rule for com-puting the gradient of the capillary pressure
∇pn+1, j+1c,i j = ∂sw pn+1, j
c (sn+1, jw,i j ,an+1, j
ow,i j )∇sn+1, j+1w,i j +∂aow pn+1, j
c (sn+1, jw,i j ,an+1, j
ow,i j )∇an+1, jow,i j (26)
in order to improve the stability of the scheme.To solve the transport equations, we use an iterative solver
Cn+1, j+1β
φsn+1w −Cn
βφsn
w
∆t−∇ ·
(Dn+1
β∇φsn+1
w Cn+1, j+1β
−un+1w Cn+1, j+1
β
−δbβ (ka∇an+1ow Cn+1, j+1
b +vgφCn+1, j+1b )
)= Rn+1, j
β.
(27)
We write the three system of equations in the same matrix, looking for the solution of(Cn+1, j+1
b,1 , Cn+1, j+1n,1 , Cn+1, j+1
p,1 , . . . ,Cn+1, j+1p,N )T iteratively until a stopping criterion is reached.
Due to we use an iterative scheme, it is necessary to have a measurement of the error.For this work, we use the following L2-norm
‖x‖L2 =
(∆x
m
∑i=1
x2i
)1/2
. (28)
Then, the algorithm for solving the model equations is the following
1. We solve the pressure equation using the previous values of water saturation andIFA.
2. We solve the saturation equation using the updated values of pressure but the previ-ous values of IFA.
3. We solve the IFA equation using the updated values of saturation.
4. We compute the errors ‖ j+1pn+1− jpn+1‖L2 , ‖ j+1sn+1− jsn+1‖L2 and ‖ j+1an+1−jan+1‖L2 .
5. If the errors are less than a given tolerance ε , we proceed to solve the concentrationequations. Otherwise, we upgrade the values for the inner iteration j and we solveagain the three equations. If any of the errors does not get less than ε in a givenmaximum number of iterations MIn, we halve the time step and try again. If wehalve the time step in a maximum number of times MIε , we have to check if theproblem is well-posed.
6. We solve the concentration equations iteratively until the error is less than ε or weproceed as mentioned before halving the time step.
7. If the concentration error is less than ε , we compute the IFT, NT and ssor.
8. We move to the next time step and we repeat the process until we reach the finaltime T and we plot the results.
12
4 Results and discussion
Following all previous work, we can finally perform numerical experiments to study theeffects of MEOR considering the oil-water IFA. In order to formulate the model, we con-sidered the next works: [25] (Transport equations), [31] and [17] (IFA), [30] (reduction ofIFT) and [26] (reduction of sor).
Using the best estimate of physical parameters from the existing experiments, we werenot able to obtain physically plausible results. We interpret this to be due to the disparateexperimental conditions used in the cited works, leading to results which are physically in-compatible. Thus the first conclusion of our work is that the existing experimental literaturefor MEOR and interfacial area is incomplete, and that dedicated experiments encompass-ing the full process of microbial growth, transport and surfactant production together withchanging IFA, new relations for the rate of production/destruction of IFA and new capillarypressure surfaces are needed.
In lieu of complete and compatible experimental data, we have thus conducted numer-ical simulations with what we deem plausible data, to highlight the dominating physicalprocesses in the system.We consider a porous medium of length L = 2 m and width W = 1 m. We set the initialwater saturation as sw(x,y,0) = 0.3+ 0.4 ∗ y. We inject water, bacteria and nutrients intothe left boundary and oil, water, bacteria, nutrients and surfactants flow out through theright boundary. There is not flux through the upper and bottom boundary. For the wa-ter and oil pressures, we take the same conditions as in [25]: pw(x,y,0) = 0.981 kPa andpo(x,y,0) = 9.417 kPa; leading to an average pressure of p(x,y,0) = 5.199 kPa and initialcapillary pressure of pc(x,y,0) = 8.436 kPa. On the left boundary, we have a flux boundarycondition QT/A=−2.78×10−5m s−1. Due to we inject water, the left boundary conditionfor the water saturation is sw(0,y, t) = 0.7. Regarding the right boundary condition for thewater saturation, we consider a Neumann condition with zero value. We choose the initialvalue and left boundary of IFA evaluating Eq. 17 with the initial and left values of watersaturation, capillary pressure, IFT, permeability and porosity respectively. We considerthat there is neither bacteria nor nutrients initially in the porous media and we inject themon the left boundary with a concentration of 0.5 kg m3. We also consider a no-flux bound-ary condition for the surfactant concentration on the left boundary. Regarding the relationpc(sw) in Eq. 7, we use Eq. 16 evaluating with the initial average IFA, IFT, permeabilityand porosity. Table 1 shows the value parameters used in the numerical simulations.
13
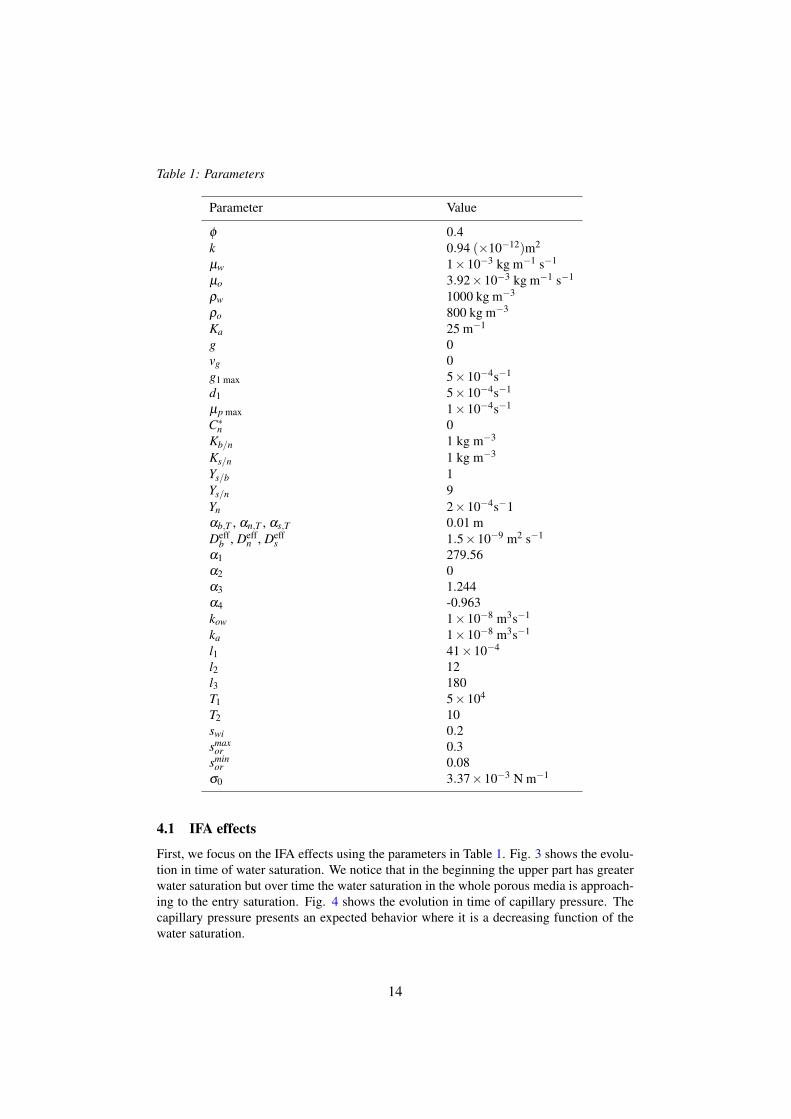
Table 1: Parameters
Parameter Value
φ 0.4k 0.94 (×10−12)m2
µw 1×10⁻³ kg m−1 s−1
µo 3.92×10⁻³ kg m−1 s−1
ρw 1000 kg m−3
ρo 800 kg m−3
Ka 25 m−1
g 0vg 0g1 max 5×10−4s−1
d1 5×10⁻⁴s−1
µp max 1×10⁻⁴s−1
C∗n 0Kb/n 1 kg m−3
Ks/n 1 kg m−3
Ys/b 1Ys/n 9Yn 2×10⁻⁴s−1αb,T , αn,T , αs,T 0.01 mDeff
b , Deffn , Deff
s 1.5×10⁻⁹ m2 s−1
α1 279.56α2 0α3 1.244α4 -0.963kow 1×10⁻⁸ m3s−1
ka 1×10⁻⁸ m3s−1
l1 41×10−4
l2 12l3 180T1 5×10⁴
T2 10swi 0.2smax
or 0.3smin
or 0.08σ0 3.37×10⁻³ N m−1
4.1 IFA effects
First, we focus on the IFA effects using the parameters in Table 1. Fig. 3 shows the evolu-tion in time of water saturation. We notice that in the beginning the upper part has greaterwater saturation but over time the water saturation in the whole porous media is approach-ing to the entry saturation. Fig. 4 shows the evolution in time of capillary pressure. Thecapillary pressure presents an expected behavior where it is a decreasing function of thewater saturation.
14
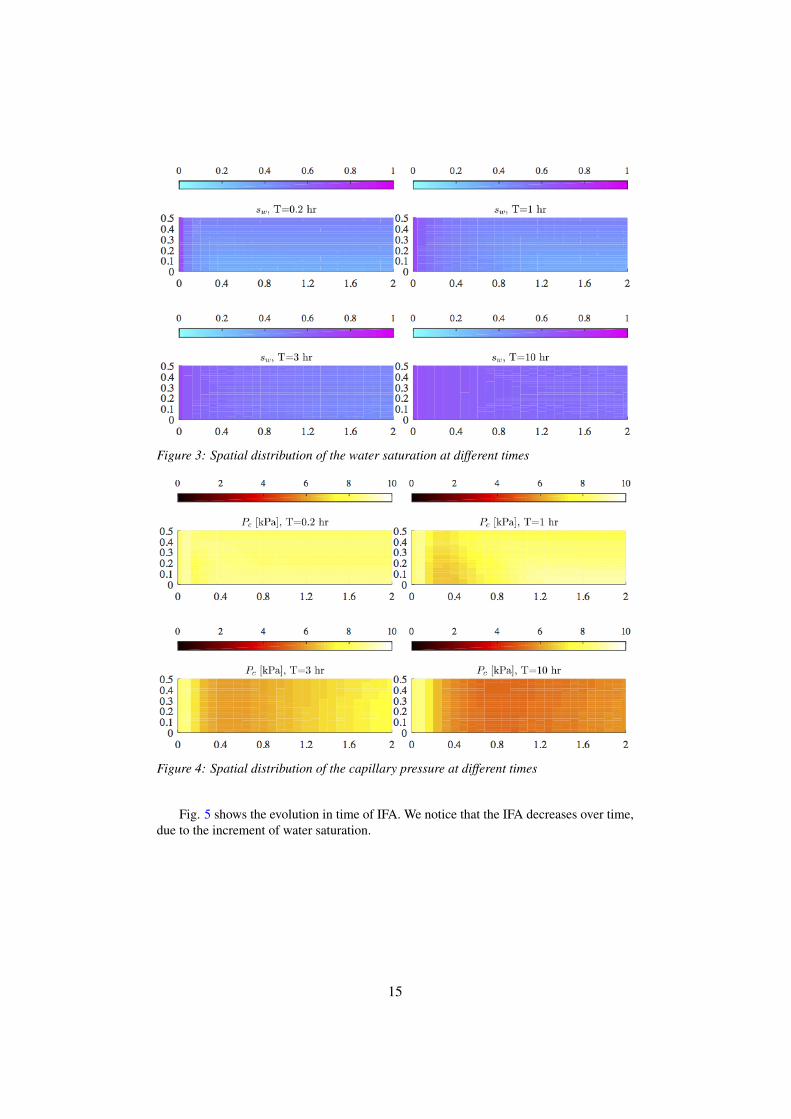
Figure 3: Spatial distribution of the water saturation at different times
Figure 4: Spatial distribution of the capillary pressure at different times
Fig. 5 shows the evolution in time of IFA. We notice that the IFA decreases over time,due to the increment of water saturation.
15
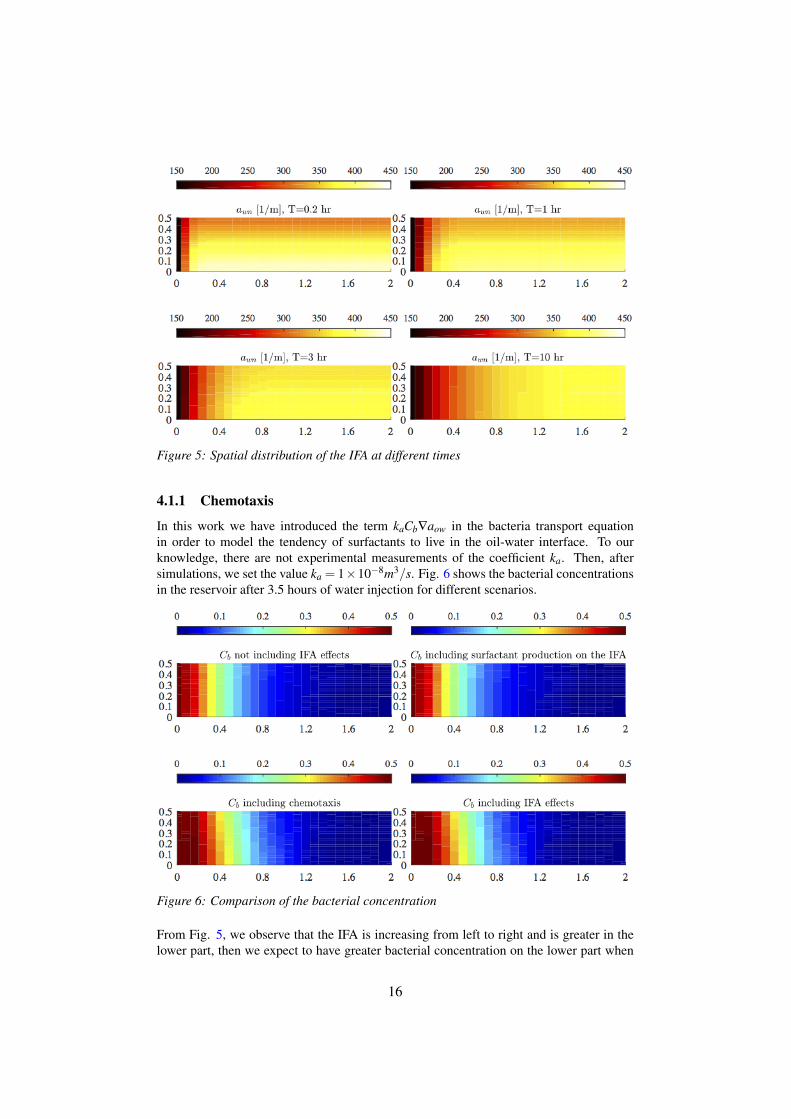
Figure 5: Spatial distribution of the IFA at different times
4.1.1 Chemotaxis
In this work we have introduced the term kaCb∇aow in the bacteria transport equationin order to model the tendency of surfactants to live in the oil-water interface. To ourknowledge, there are not experimental measurements of the coefficient ka. Then, aftersimulations, we set the value ka = 1×10⁻⁸m3/s. Fig. 6 shows the bacterial concentrationsin the reservoir after 3.5 hours of water injection for different scenarios.
Figure 6: Comparison of the bacterial concentration
From Fig. 5, we observe that the IFA is increasing from left to right and is greater in thelower part, then we expect to have greater bacterial concentration on the lower part when
16
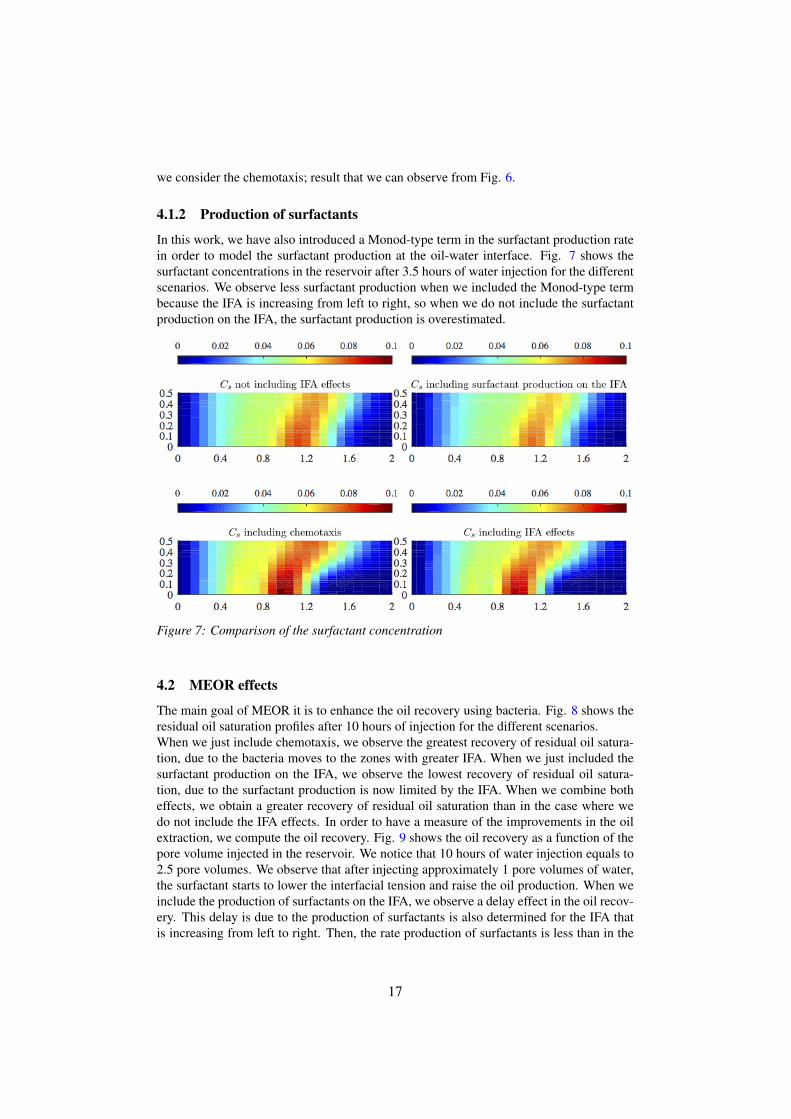
we consider the chemotaxis; result that we can observe from Fig. 6.
4.1.2 Production of surfactants
In this work, we have also introduced a Monod-type term in the surfactant production ratein order to model the surfactant production at the oil-water interface. Fig. 7 shows thesurfactant concentrations in the reservoir after 3.5 hours of water injection for the differentscenarios. We observe less surfactant production when we included the Monod-type termbecause the IFA is increasing from left to right, so when we do not include the surfactantproduction on the IFA, the surfactant production is overestimated.
Figure 7: Comparison of the surfactant concentration
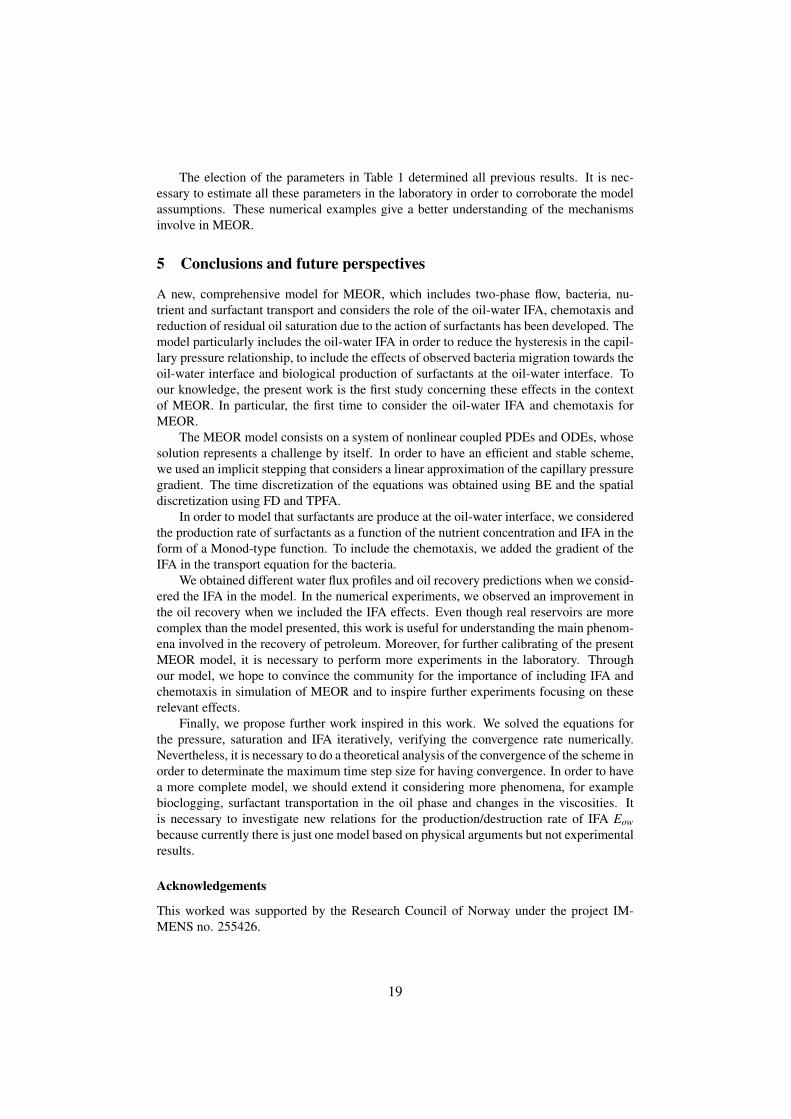
4.2 MEOR effects
The main goal of MEOR it is to enhance the oil recovery using bacteria. Fig. 8 shows theresidual oil saturation profiles after 10 hours of injection for the different scenarios.When we just include chemotaxis, we observe the greatest recovery of residual oil satura-tion, due to the bacteria moves to the zones with greater IFA. When we just included thesurfactant production on the IFA, we observe the lowest recovery of residual oil satura-tion, due to the surfactant production is now limited by the IFA. When we combine botheffects, we obtain a greater recovery of residual oil saturation than in the case where wedo not include the IFA effects. In order to have a measure of the improvements in the oilextraction, we compute the oil recovery. Fig. 9 shows the oil recovery as a function of thepore volume injected in the reservoir. We notice that 10 hours of water injection equals to2.5 pore volumes. We observe that after injecting approximately 1 pore volumes of water,the surfactant starts to lower the interfacial tension and raise the oil production. When weinclude the production of surfactants on the IFA, we observe a delay effect in the oil recov-ery. This delay is due to the production of surfactants is also determined for the IFA thatis increasing from left to right. Then, the rate production of surfactants is less than in the
17
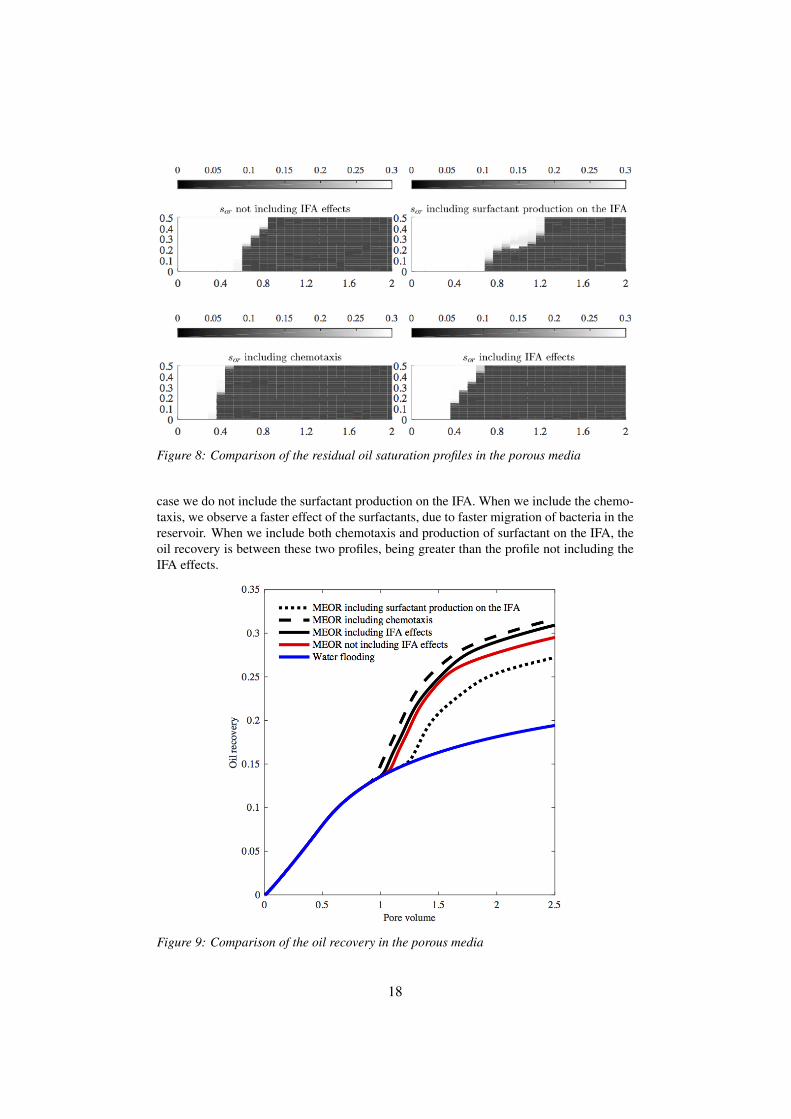
Figure 8: Comparison of the residual oil saturation profiles in the porous media
case we do not include the surfactant production on the IFA. When we include the chemo-taxis, we observe a faster effect of the surfactants, due to faster migration of bacteria in thereservoir. When we include both chemotaxis and production of surfactant on the IFA, theoil recovery is between these two profiles, being greater than the profile not including theIFA effects.
Figure 9: Comparison of the oil recovery in the porous media
18
The election of the parameters in Table 1 determined all previous results. It is nec-essary to estimate all these parameters in the laboratory in order to corroborate the modelassumptions. These numerical examples give a better understanding of the mechanismsinvolve in MEOR.
5 Conclusions and future perspectives
A new, comprehensive model for MEOR, which includes two-phase flow, bacteria, nu-trient and surfactant transport and considers the role of the oil-water IFA, chemotaxis andreduction of residual oil saturation due to the action of surfactants has been developed. Themodel particularly includes the oil-water IFA in order to reduce the hysteresis in the capil-lary pressure relationship, to include the effects of observed bacteria migration towards theoil-water interface and biological production of surfactants at the oil-water interface. Toour knowledge, the present work is the first study concerning these effects in the contextof MEOR. In particular, the first time to consider the oil-water IFA and chemotaxis forMEOR.
The MEOR model consists on a system of nonlinear coupled PDEs and ODEs, whosesolution represents a challenge by itself. In order to have an efficient and stable scheme,we used an implicit stepping that considers a linear approximation of the capillary pressuregradient. The time discretization of the equations was obtained using BE and the spatialdiscretization using FD and TPFA.
In order to model that surfactants are produce at the oil-water interface, we consideredthe production rate of surfactants as a function of the nutrient concentration and IFA in theform of a Monod-type function. To include the chemotaxis, we added the gradient of theIFA in the transport equation for the bacteria.
We obtained different water flux profiles and oil recovery predictions when we consid-ered the IFA in the model. In the numerical experiments, we observed an improvement inthe oil recovery when we included the IFA effects. Even though real reservoirs are morecomplex than the model presented, this work is useful for understanding the main phenom-ena involved in the recovery of petroleum. Moreover, for further calibrating of the presentMEOR model, it is necessary to perform more experiments in the laboratory. Throughour model, we hope to convince the community for the importance of including IFA andchemotaxis in simulation of MEOR and to inspire further experiments focusing on theserelevant effects.
Finally, we propose further work inspired in this work. We solved the equations forthe pressure, saturation and IFA iteratively, verifying the convergence rate numerically.Nevertheless, it is necessary to do a theoretical analysis of the convergence of the scheme inorder to determinate the maximum time step size for having convergence. In order to havea more complete model, we should extend it considering more phenomena, for examplebioclogging, surfactant transportation in the oil phase and changes in the viscosities. Itis necessary to investigate new relations for the production/destruction rate of IFA Eowbecause currently there is just one model based on physical arguments but not experimentalresults.
Acknowledgements
This worked was supported by the Research Council of Norway under the project IM-MENS no. 255426.
19
References
[1] Aarnes, J.E., Gimse, T., Lie, K.-A.: An Introduction to the Numerics of Flow in PorousMedia using Matlab. In: Hasle, G., Lie, K.-A., Quak, E. (eds.) Geometric Modelling,Numerical Simulation, and Optimization: Applied Mathematics at SINTEF. pp. 265–306. Springer, Heidelberg (2007)
[2] Aavatsmark, I.: An introduction to multipoint flux approximations for quadrilateralgrids. Comput. Geosci. (2002). doi:10.1023/A:1021291114475
[3] Armstrong, R.T., Wildenschild, D.: Microbial Enhanced Oil Recovery inFractional-Wet Systems: A Pore-Scale Investigation. Transp. Porous Media (2012).doi:10.1007/s11242-011-9934-3
[4] Aziz, K., Settari, A.: Petroleum Reservoir Simulation. Springer Netherlands (1979)
[5] Bahadori, A., Nwaoha, C., Clark, M.W.: Dictionary of Oil, Gas and PetrochemicalProcessing. CRC Press (2014)
[6] Bollag, J.M.: Interactions of Soil Components and Microorganisms and their Ef-fects on Soil Remediation. Revista de la ciencia del suelo y nutrición vegetal (2008).doi:10.4067/S0718-27912008000400006
[7] Bringedal, C., Berre, I., Pop, I.S., Radu, F.A.: Upscaling of Non-isothermal Re-active Porous Media Flow with Changing Porosity. Transp. Porous Media (2016).doi:10.1007/s11242-015-0530-9
[8] Centler, F., Thullner, M.: Chemotactic preferences govern competition and patternformation in simulated two-strain microbial communities. Frontiers in Microbiology(2015). doi:10.3389/fmicb.2015.00040
[9] Chen, D., Pyrak-Nolte, L.J., Griffin, J., Giordano, N.J.: Measurement of inter-facial area per volume for drainage and imbibition. Water Resour. Res. (2007).doi:10.1029/2007WR006021
[10] Donaldson, E.C., Chilingarian, G.V., Yen, T.F.: Enhanced Oil Recovery, II: Processesand Operations. Elsevier (1989)
[11] Gharasoo, M., Centler, F., Fetzer, I., Thullner, M.: How the chemotactic characteris-tics of bacteria can determine their population patterns. Soil Biology and Biochemistry(2014). doi:10.1016/j.soilbio.2013.11.019
[12] Hassanizadeh, S.M., Gray, W.G.: Mechanics and thermodynamics of multiphaseflow in porous media including interphase boundaries. Water Resour. Res. (1990).doi:10.1016/0309-1708(90)90040-B
[13] Hassanizadeh, S.M., Gray, W.G.: Toward an improved description of the physics oftwo-phase flow. Adv. Water Resour. (1993). doi:10.1016/0309-1708(93)90029-F
[14] Hassanizadeh, S.M., Gray, W.G.: Thermodynamic basis of capillary pressure inporous media. Water Resour. Res. (1993). doi:10.1029/93WR01495
[15] Helmig, R.: Multiphase Flow and Transport Processes in the Subsurface: A Contri-bution to the Modeling of Hydrosystems. Springer (1997)
20
[16] Hommel, J., Lauchnor, E., Phillips, A., Gerlach, R., Cunningham, A.B., Helmig,R., Ebigbo, A., Class, H.: A revised model for microbially induced calcite precipita-tion: Improvements and new insights based on recent experiments. Water Resour. Res.(2015). doi:10.1002/2014WR016503
[17] Joekar-Niasar, V., Hassanizadeh, S.M.: Uniqueness of specific interfacial area-capillary pressure-saturation relationship under non-equilibrium conditions in two-phase porous media flow. Transp. Porous Media (2012). doi:10.1007/s11242-012-9958-3
[18] Kim, S.B.: Numerical analysis of bacteria transport in saturated porous media. Hy-drol. Process (2006) doi:10.1002/hyp.5930
[19] Kosaric, N., Varder-Sukan, F.: BIOSURFACTANTS: Production and Utilization-Processes, Technologies, and Economics. CRC Press (2015)
[20] Kovárová-Kovar, K., Egli, T.: Growth Kinetics of Suspended Microbial Cells: FromSingle-Substrate-Controlled Growth to Mixed-Substrate Kinetics. Microbiology andMolecular Biology Reviews 62(3), 646–666 (1998)
[21] Kumar, K., Pop, I.S., Radu, F.A.: Convergence analysis of mixed numeri-cal schemes for reactive flow in a porous medium. SIAM J. Num. Anal. (2013).doi:10.1137/120880938
[22] Kumar, K., Pop, I.S., Radu, F.A.: Convergence analysis for a conformal discretizationof a model for precipitation and dissolution in porous media", Numerische Mathematik(2014). doi:0.1007/s00211-013-0601-1
[23] Lacerda, E., Da Silva, C.M., Priimenko, V.I., Pires, A.P.: Microbial EOR: aquantitative prediction of recovery factor. Society of Petroleum Engineers (2012).doi:10.2118/153866-MS
[24] Lazar, I., Petrisor, I.G., Yen, T.F.: Microbial Enhanced Oil Recovery (MEOR).Petroleum Science and Technology (2007). doi:10.1080/10916460701287714
[25] Li, J., Liu, J., Trefry, M.G., Park, J., Liu, K., Haq, B., Johnston, C.D., Volk, H.: Inter-actions of Microbial-Enhanced Oil Recovery Processes. Transp. Porous Media (2011).doi:10.1007/s11242-010-9669-6
[26] Li, Y., Abriola, L.M., Phelan, T.J., Ramsburg, C.A., Pennell, K.D.: Experimental andnumerical validation of the total trapping number for prediction of DNAPL mobiliza-tion. Environ. Sci. Technol. (2007). doi:10.1021/es070834i
[27] List, F., Radu, F.A.: A study on iterative methods for solving Richards’ equation.Comput. Geosci. (2016). doi:10.1007/s10596-016-9566-3
[28] Musuuza, J.L., Attinger, S., Radu, F.A.: An extended stability criterion fordensity-driven flows in homogeneous porous media. Adv. Water Resour. (2009).doi:10.1016/j.advwatres.2009.01.012
[29] Nick, H.M., Raoof, A., Centler, F., Thullner, M., Regnier, P.: Reactive dispersive con-taminant transport in coastal aquifers: Numerical simulation of a reactive Henry prob-lem. Journal of Contaminant Hydrology (2013). doi:10.1016/j.jconhyd.2012.12.005
[30] Nielsen, S.M., Nesterov, I., Shapiro, A.A.: Microbial enhanced oil recovery—amodeling study of the potential of spore-forming bacteria", Comput. Geosci. (2015).doi:10.1007/s10596-015-9526-3
21
[31] Niessner, J., Hassanizadeh, S.M.: A model for two-phase flow in porousmedia including fluid-fluid interfacial area. Water Resour. Res. (2008).doi:10.1029/2007WR006721
[32] van Noorden, T.L., Pop, I.S., Ebigbo, A., Helmig, R.: An upscaled model for biofilmgrowth in a thin strip. Water Resour. Res. (2010). doi:10.1029/2009WR008217
[33] Nordbotten, J.M., Celia, M.A.: Geological storage of CO2: modeling approaches forlarge-scale simulation. John Wiley And Sons (2011)
[34] Patel, I., Borgohain, S.,Kumar, M., Rangarajan, V., Somasundaran, P., Sen, R.: Re-cent developments in microbial enhanced oil recovery. Renewable and Sustainable En-ergy Reviews (2015). doi:10.1016/j.rser.2015.07.135
[35] Pennell, K.D., Pope, G.A., Abriola, L.M.: Influence of viscous and buoyancy forceson the mobilization of residual tetrachloroethylene during surfactant flushing. Environ.Sci. Technol. (1996). doi:10.1021/es9505311
[36] Pop, I.S., Radu, F., Knabner, P.: Mixed finite elements for theRichards’equation: linearization procedure. J. Comput. and Appl. Math. (2004).doi:10.1016/j.cam.2003.04.008
[37] Pop, I.S., van Duijn, C.J., Hassanizadeh, S.M.: Horizontal redistribution of fluids in aporous medium: The role of interfacial area in modeling hysteresis. Adv. Water Resour.(2009). doi:10.1016/j.advwatres.2008.12.006
[38] Porter, M.L., Wildenschild, D., Grant, G., Gerhard, J.I.: Measurement andprediction of the relationship between capillary pressure, saturation, and inter-facial area in a NAPL-water-glass bead system. Water Resour. Res. (2010).doi:10.1029/2009WR007786
[39] Radu, F.A., Pop, I.S., Attinger, S.: Analysis of an Euler implicit - mixed finite elementscheme for reactive solute transport in porous media. Numerical Methods for PartialDifferential Equations (2010). doi:10.1002/num.20436
[40] Radu, F.A., Nordbotten, J.M., Pop, I.S., Kumar, K.: A robust linearization scheme forfinite volume based discretizations for simulation of two-phase flow in porous media. J.Comput. and Appl. Math. (2015). doi:10.1016/j.cam.2015.02.051
[41] Sen, R.: Biotechnology in petroleum recovery: The microbial EOR. Progress in En-ergy and Combustion Science. (2008). doi:10.1016/j.pecs.2008.05.001
[42] Viramontes-Ramos, S., Portillo-Ruiz, M.C., Ballinas-Casarrubias, M.L., Torres-Muñoz, J.V., Rivera-Chavira, B.E., Nevárez-Moorillón, G.V.: Selection ofbiosurfactan/bioemulsifier-producing bacteria from hydrocarbon-contaminated soil.Brazilian Journal of Microbiology (2010). doi:10.1590/S1517-83822010000300017
[43] van Wijngaarden, W.K., Vermolen, F.J., van Meurs, G.A.M., Vuik, C.: Modelling Bi-ogrout: A New Ground Improvement Method Based on Microbial-Induced CarbonatePrecipitation. Transp. Porous Media (2011). doi:10.1007/s11242-010-9691-8
[44] Wu, Z., Yue, X., Cheng, T., Yu, J., Yang, H.: Effect of viscosity and interfa-cial tension of surfactant-polymer flooding on oil recovery in high-temperature andhigh-salinity reservoirs. Journal of Petroleum Exploration and Production Technology(2014). doi:10.1007/s13202-013-0078-6
22

[45] Yuan, C.D., Pu, W.F., Wang, X.C., Sun, L., Zhang, Y.C., Cheng, S.: Effects of In-terfacial Tension, Emulsification, and Surfactant Concentration on Oil Recovery in Sur-factant Flooding Process for High Temperature and High Salinity Reservoirs. EnergyFuels (2015). doi:10.1021/acs.energyfuels.5b01393
23