Embed Size (px)
Citation preview
i
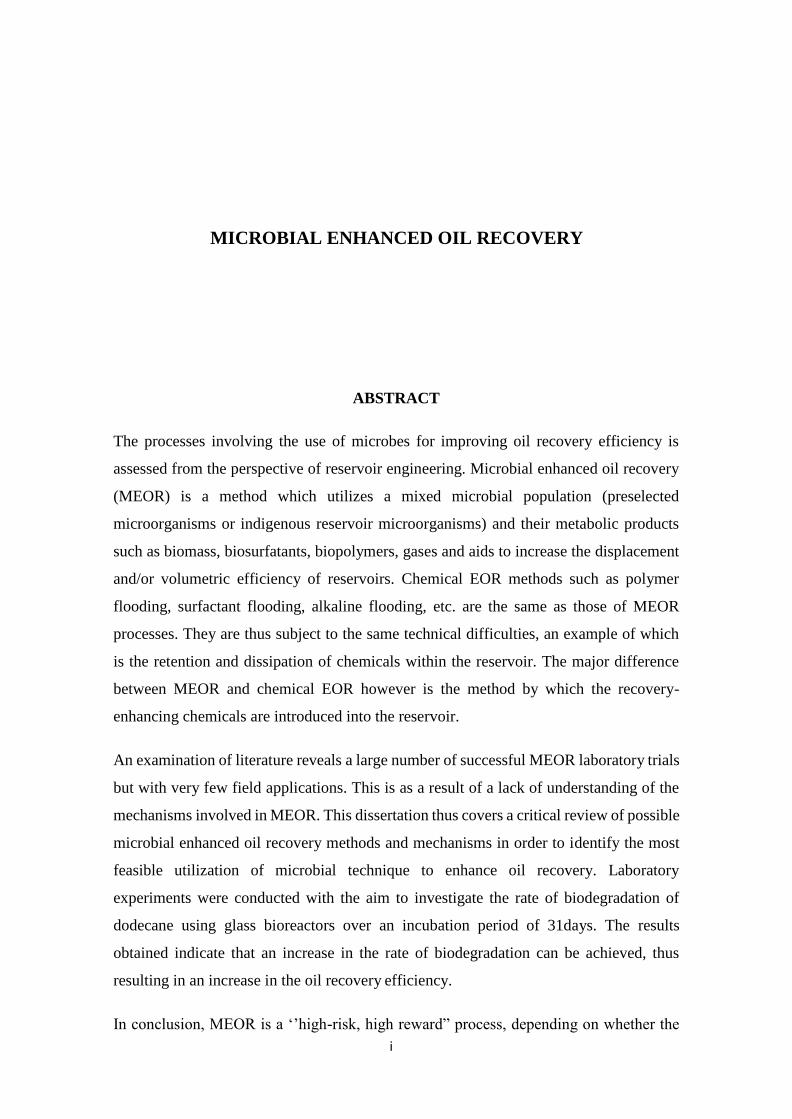
MICROBIAL ENHANCED OIL RECOVERY
ABSTRACT
The processes involving the use of microbes for improving oil recovery efficiency is
assessed from the perspective of reservoir engineering. Microbial enhanced oil recovery
(MEOR) is a method which utilizes a mixed microbial population (preselected
microorganisms or indigenous reservoir microorganisms) and their metabolic products
such as biomass, biosurfatants, biopolymers, gases and aids to increase the displacement
and/or volumetric efficiency of reservoirs. Chemical EOR methods such as polymer
flooding, surfactant flooding, alkaline flooding, etc. are the same as those of MEOR
processes. They are thus subject to the same technical difficulties, an example of which
is the retention and dissipation of chemicals within the reservoir. The major difference
between MEOR and chemical EOR however is the method by which the recovery-
enhancing chemicals are introduced into the reservoir.
An examination of literature reveals a large number of successful MEOR laboratory trials
but with very few field applications. This is as a result of a lack of understanding of the
mechanisms involved in MEOR. This dissertation thus covers a critical review of possible
microbial enhanced oil recovery methods and mechanisms in order to identify the most
feasible utilization of microbial technique to enhance oil recovery. Laboratory
experiments were conducted with the aim to investigate the rate of biodegradation of
dodecane using glass bioreactors over an incubation period of 31days. The results
obtained indicate that an increase in the rate of biodegradation can be achieved, thus
resulting in an increase in the oil recovery efficiency.
In conclusion, MEOR is a ‘’high-risk, high reward” process, depending on whether the

ii
microorganisms can produce oil recovery-enhancing chemicals by utilizing the residual
oil within the reservoir as a carbon source. The high risk in this context refers to the severe
constraints that the microbial system must satisfy in order to utilize an in situ carbon
source. The rewards however is that the logistical cost and difficulty in implementing the
process is similar to those of implementing a waterflood.
iii
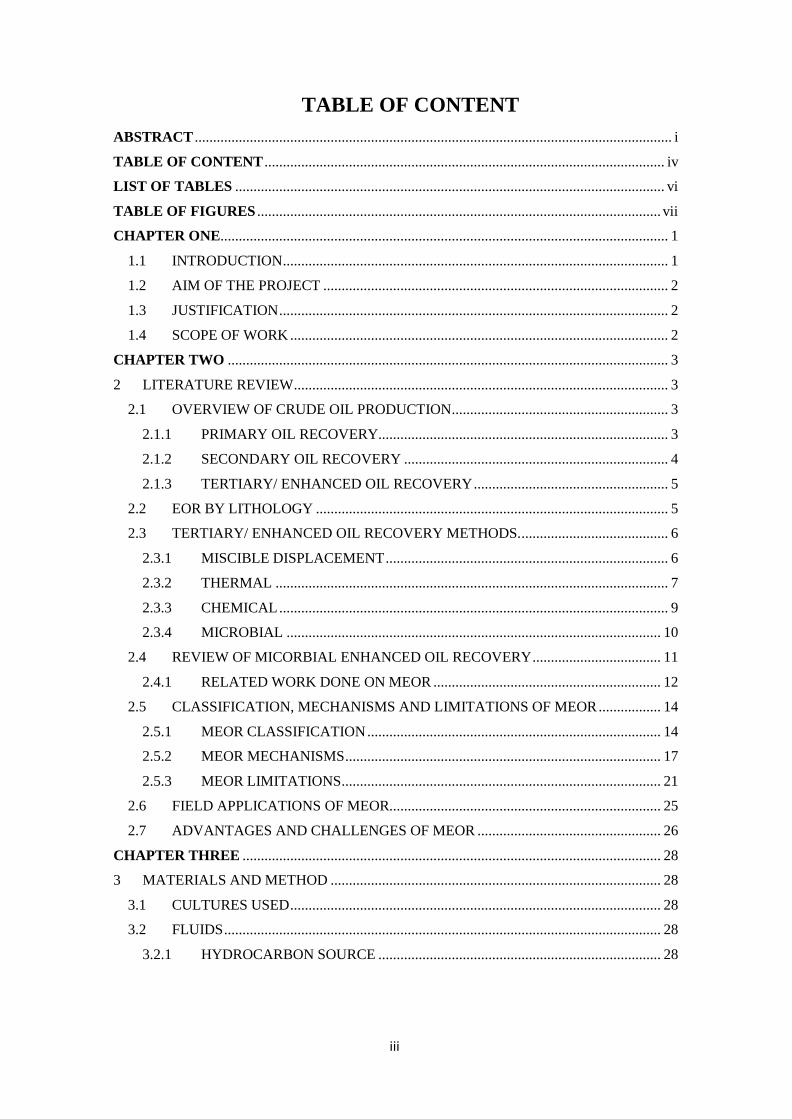
TABLE OF CONTENT
ABSTRACT .................................................................................................................................. i
TABLE OF CONTENT ............................................................................................................. iv
LIST OF TABLES ..................................................................................................................... vi
TABLE OF FIGURES .............................................................................................................. vii
CHAPTER ONE .......................................................................................................................... 1
1.1 INTRODUCTION ......................................................................................................... 1
1.2 AIM OF THE PROJECT .............................................................................................. 2
1.3 JUSTIFICATION .......................................................................................................... 2
1.4 SCOPE OF WORK ....................................................................................................... 2
CHAPTER TWO ........................................................................................................................ 3
2 LITERATURE REVIEW ...................................................................................................... 3
2.1 OVERVIEW OF CRUDE OIL PRODUCTION ........................................................... 3
2.1.1 PRIMARY OIL RECOVERY............................................................................... 3
2.1.2 SECONDARY OIL RECOVERY ........................................................................ 4
2.1.3 TERTIARY/ ENHANCED OIL RECOVERY ..................................................... 5
2.2 EOR BY LITHOLOGY ................................................................................................ 5
2.3 TERTIARY/ ENHANCED OIL RECOVERY METHODS. ........................................ 6
2.3.1 MISCIBLE DISPLACEMENT ............................................................................. 6
2.3.2 THERMAL ........................................................................................................... 7
2.3.3 CHEMICAL .......................................................................................................... 9
2.3.4 MICROBIAL ...................................................................................................... 10
2.4 REVIEW OF MICORBIAL ENHANCED OIL RECOVERY ................................... 11
2.4.1 RELATED WORK DONE ON MEOR .............................................................. 12
2.5 CLASSIFICATION, MECHANISMS AND LIMITATIONS OF MEOR ................. 14
2.5.1 MEOR CLASSIFICATION ................................................................................ 14
2.5.2 MEOR MECHANISMS ...................................................................................... 17
2.5.3 MEOR LIMITATIONS ....................................................................................... 21
2.6 FIELD APPLICATIONS OF MEOR.......................................................................... 25
2.7 ADVANTAGES AND CHALLENGES OF MEOR .................................................. 26
CHAPTER THREE .................................................................................................................. 28
3 MATERIALS AND METHOD .......................................................................................... 28
3.1 CULTURES USED ..................................................................................................... 28
3.2 FLUIDS ....................................................................................................................... 28
3.2.1 HYDROCARBON SOURCE ............................................................................. 28
iv
3.2.2 DEIONISED WATER ........................................................................................ 29
3.3 GLASS BIOREACTORS ........................................................................................... 29
3.4 EXPERIMENTAL PROCEDURE ............................................................................. 29
3.4.1 MINERAL SOLUTION PREPARATION ......................................................... 29
3.4.2 PREPARATION OF UNCONSOLIDATED SAND .......................................... 30
3.4.3 MICROBIAL GROWTH EXPERIMENTS ....................................................... 30
3.4.4 SAMPLE ANALYSIS ........................................................................................ 30
CHAPTER 4 .............................................................................................................................. 36
4 RESULTS AND DISCUSSION ......................................................................................... 36
4.1 DODECANE DEGRADATION ................................................................................. 36
4.2 TOTAL SUSPENDED SOLIDS PRODUCTION ...................................................... 37
4.3 DISSOLVED OXYGEN ............................................................................................. 38
4.4 BIOFILM THICKNESS ............................................................................................. 39
4.5 MICROBIAL KINETICS. .......................................................................................... 40
4.6 BIOMASS YIELD COEFFICIENT YX/S .................................................................... 41
4.7 PROSPECTS FOR INDIVIDUAL MEOR MECHANISMS ..................................... 42
CHAPTER 5 .............................................................................................................................. 43
5 CONCLUSION AND RECOMMENDATIONS ................................................................ 43
REFERENCES ............................................................................................................................ 44
APPENDICES ........................................................................................................................... 53
v
LIST OF TABLES
Table 2.2.1: Microbial groups and their bioproducts formed ...................................................... 17
Table 2.2.2 : Permeability variations with lithology [64] ............................................................ 23
Table 3.1: Properties of the used fluids ....................................................................................... 28
Table 3.2: The compositions of the mineral solution .................................................................. 29
Table A.1: Day 0 Calibration ...................................................................................................... 54
Table A.2: Day 0 GC sample analysis ........................................................................................ 54
Table A.3: Day 8 Calibration Values .......................................................................................... 55
Table A.4: Day 8 GC Sample Analysis ....................................................................................... 55
Table A.5: Day 15 Calibration Values ........................................................................................ 56
Table A.6: Day 15 GC Sample Analysis ..................................................................................... 56
Table A.7: Day 23 Calibration Values ........................................................................................ 57
Table A.8: Day 23 GC Sample Analysis ..................................................................................... 57
Table A.9: Day 31 Calibration Values ........................................................................................ 58
vi
TABLE OF FIGURES
Figure 2.1: Waterflooding process ................................................................................................ 5
Figure 2.2: EOR field projects by lithology .................................................................................. 6
Figure 2.3: Viscous fingering ........................................................................................................ 7
Figure 2.4: Steam injection process .............................................................................................. 8
Figure 2.5: Steam assisted gravity drainage. ................................................................................. 8
Figure 2.6: In situ Combustion process ......................................................................................... 9
Figure 2.7: Surfactant flooding ................................................................................................... 10
Figure 2.8: Cyclic microbial oil recovery ................................................................................... 15
Figure 2.9: Microbial flooding recovery ..................................................................................... 16
Figure 2.10: Illustration of Selective plugging ............................................................................ 16
Figure 2.11: Residual oil saturation as a function of capillary number ....................................... 19
Figure 2.12: Range of pressures in various biological systems .................................................. 22
Figure 3.1: Mineral Solution on magnetic stirrer ........................................................................ 30
Figure 3.2:pH measurement ........................................................................................................ 31
Figure 3.3:Dissolved oxygen measurement ................................................................................ 31
Figure 3.4:Vacuum Filtration Process ......................................................................................... 32
Figure 3.5:Total Suspended solids on the filter paper ................................................................. 32
Figure 3.6: Liquid-Liquid extraction using Hexane .................................................................... 33
Figure 3.7:Examples of chromatograms. .................................................................................... 33
Figure 3.8: Example of Calibration curve. .................................................................................. 35
Figure 4.1: Dodecane concentration vs Time .............................................................................. 37
Figure 4.2: TSS concentration vs. Time ...................................................................................... 37
Figure 4.3: Dodecane concentration and TSS vs. Time .............................................................. 38
Figure 4.4: Growth on the hydrocarbon surface. ......................................................................... 39
Figure 4.5: Dissolved oxygen concentration vs. Time ................................................................ 39
Figure 4.6: Comparison between the heights of biofilm formed. ................................................ 40
Figure 4.7: Biofilm height vs. Time ............................................................................................ 40
Figure 4.8: Growth rate curve ..................................................................................................... 41
1
1.1 INTRODUCTION
CHAPTER ONE
Crude oil exists worldwide in an intricate network of oil reservoirs. This oil is brought to
surface facilities through production wells, using existent oil recovery technologies. As
defined by the Society of Petroleum Engineers (SPE), primary and secondary recovery
methods are used to target oil which can be produced due to viscous and capillary forces
in the in the reservoir [1, 2]. Primary recovery occurs due to the overburden pressure of
the earth on the oil bearing formation [3]. Overtime, the primary production rate
decreases, and some of the production wells are transformed to injection wells. Secondary
recovery however involves implementing either water flooding or gas flooding
techniques to boost the pressure in the reservoir. These injected fluids (water or gas) help
fracture the oil-bearing formation, and enhance the flow rate of oil and gas towards the
wellhead. Whereas primary recovery produces between 5-10% of the original oil in place,
secondary recovery produces between 10-40% of the total reserves [4]. Two-thirds of the
initial oil in place however remains in the reservoir after these conventional recovery
techniques have been applied.
The energy demand across the globe is increasing as a result of the increase in the
population. In order to meet these rising energy demands throughout the world, it is
therefore necessary that more attention be focused on techniques for recovering more
fraction of the initial oil in place from hydrocarbon reservoirs after secondary recovery.
The method by which this is achieved is termed tertiary recovery, also known as
Enhanced Oil Recovery (EOR). This implies that the target for EOR methods is
significant (two-thirds of the total reserves). EOR however has a close relationship with
the prevailing oil price and the general economics associated with the technique.
Classification of EOR methods are based on the oil displacement mechanism [5, 6]. These
methods alter the viscous and capillary forces between the oil, rock surface and injected
fluid. The classification of EOR include thermal methods (heat injection), miscible gas
injection (solvent injection), chemical methods (injection of surfactant/polymer) and
microbial (injection of microorganism). Microbial enhanced oil recovery (MEOR) is in
the research and development stage, and that is the purpose of this project.
2
MEOR refers to the use of microorganisms and their metabolic by-products to extract the
residual oil from reservoirs. Metabolic by-products include a range of compounds
produced through microbial metabolism, an example of which is biosurfactant. The
produced biosurfactant reduces the interfacial tension at the oil-rock interface, thereby
increasing the oil recovery efficiency [7]
1.2 AIM OF THE PROJECT
There are various mechanisms by which MEOR operates. This research work presents a
broad overview of EOR technologies, with focus on Microbial Enhanced Oil Recovery
(MEOR), its mechanisms and the rate of biodegradation of hydrocarbon, field
applications and its’ challenges.
1.3 JUSTIFICATION
MEOR has obtained very few applications in the oil industry. Considering that MEOR is
a novel technology still in the R & D phase. This research work was therefore carried out
in order to add to the already existing body of knowledge on the subject matter, so as to
increase the application of MEOR in depleting oilfields. This investigation has been
carried out by potential investigation of the rate of biodegradation of hydrocarbons, with
the aim of gaining more insight to the mechanisms of MEOR. In this research work,
dodecane represents the hydrocarbon used, and the microbial activity is subjected to
aerobic conditions. Mineral water is used to stimulate the microbial growth.
1.4 SCOPE OF WORK
This research work is limited to laboratory experiments to investigate the rate of
biodegradation of dodecane under aerobic conditions. The research work terminates with
additional study to investigate which MEOR mechanism plays a major role in
biodegradation of hydrocarbon
3
CHAPTER TWO
2 LITERATURE REVIEW
2.1 OVERVIEW OF CRUDE OIL PRODUCTION
In the late nineteenth century, the demand for crude oil began to increase as a result of
the invention of the internal combustion engine, and has come to be one of the most
significant commodities traded worldwide. Modern civilization is thus heavily dependent
on crude oil and its byproducts. Conventional and unconventional hydrocarbons will most
likely remain the major component in the energy mix. One of the major aims of the
petroleum industry is to sustain the world’s energy demand, by a guaranteed flow of
hydrocarbon fluids, and at the same time, make profits.
Crude oil is produced by creating pressure gradients within the reservoir which results in
the migration of oil through the interconnected pore spaces towards one or more
production wells. This production is characterised by three main phases. They include
production buildup, constant peak production, and production decline. An in-depth
understanding of the various recovery mechanisms is essential in order to sustain the
required production levels over the period of the lifecycle of the oilfield. Primary recovery
which utilizes the natural reservoir pressure has a short lifecycle, and a maximum
recovery factor of 20%. Secondary recovery depends on the injection of artificial water
or gas, and this increases the primary recovery factor by 15 to 20% [8]. Tertiary or
enhanced oil recovery processes are implemented in order to maximize hydrocarbon
recovery beyond secondary recovery method. It has a recovery factor of approximately
60%, thus has the potential of significantly contributing to the much-desired energy
supply.
2.1.1 PRIMARY OIL RECOVERY
Oil is present in the interconnected pore spaces within the reservoir rocks which are
beneath the earth’s surface. In this recovery process, production is dependent on the
natural pressure of the reservoir. This natural pressure in the reservoir causes oil to flow
up production wells, and its origin is form the following forces:
Expanding force of high-pressure natural gas
Buoyant force of underground flowing water (aquifer drive)
Gravitational force
4
A displacement force as a result of compaction of unconsolidated reservoir rocks.
Depending on the properties and composition of the reservoir, the above mentioned forces
can act either concurrently, or progressively. It is believed that the expanding forces of
high-pressure natural gas has a greater contribution to oil production. However in inclined
reservoirs, gravitational force is more effective, as it enhances oil drainage [9]. As
hydrocarbon fluids flow up the production wells to the surface, the initial pressure of the
reservoir continually decreases, until a point where pumping or artificial lift is required
to sustain the production rate. As the pressure in the reservoir falls below the bubble point
pressure, some gas bubbles are released form the solution. These bubbles are initially
trapped within the pores of the reservoir, and their expansion results in displacement of
oil (dissolved gas drive) [10]. This is not always the case, as in some reservoirs, the gas
bubbles coalesce, forming large pockets of continuous gas phase which flows to the upper
part of the reservoir. As the reservoir pressure continues to decrease, the gas cap expands,
thereby displacing more oil (gas cap drive).
2.1.2 SECONDARY OIL RECOVERY
As the reservoir pressure reduces during primary recovery, it gets to a critical point where
the initial pressure of the reservoir is no longer sufficient to act as to act as a natural force
resulting in the movement of hydrocarbons towards the production wells. It becomes
necessary at this point to provide the reservoir with external energy, by injecting water
(waterflooding) so as to maintain or increase the reservoir pressure
2.1.2.1 Waterflooding
Waterflooding is the most commonly explored secondary oil recovery technology for
conventional and/or heavy oil reservoirs. This is as a result of availability of water, its
simplicity, and cost-effectiveness. In the case of heavy oil reservoirs, thermal energy is
combined with the injection water, although this is regarded as a tertiary oil recovery
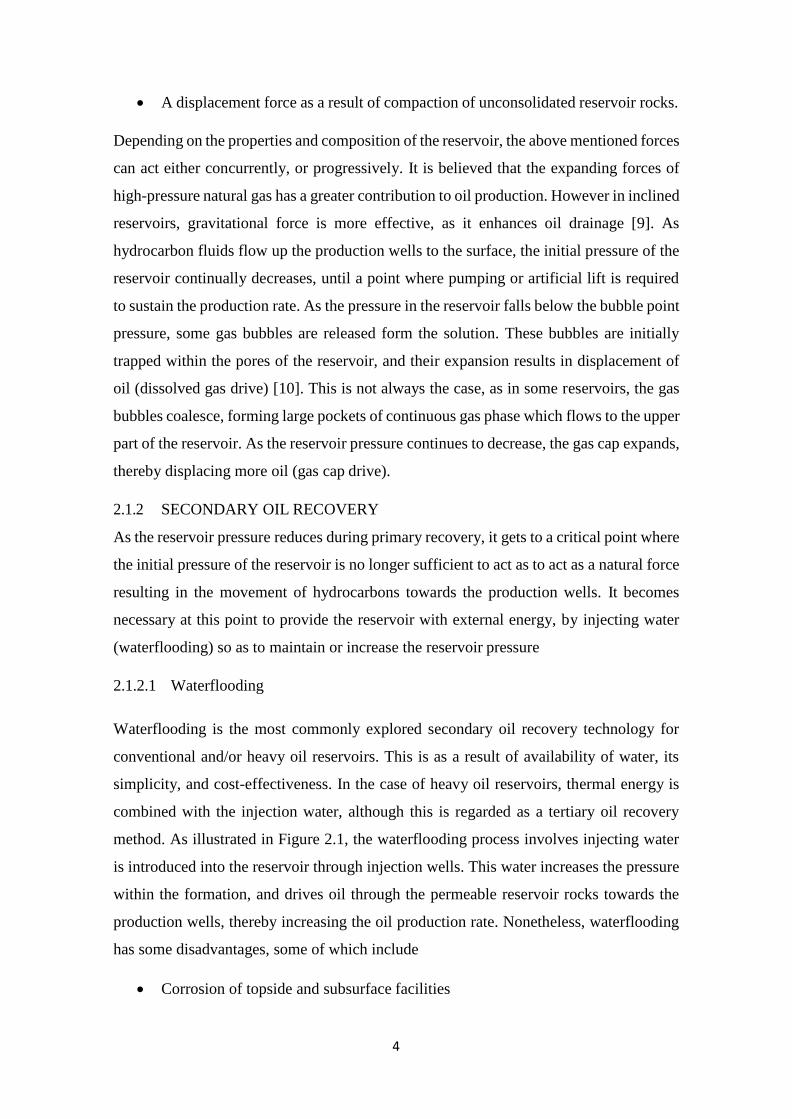
method. As illustrated in Figure 2.1, the waterflooding process involves injecting water
is introduced into the reservoir through injection wells. This water increases the pressure
within the formation, and drives oil through the permeable reservoir rocks towards the
production wells, thereby increasing the oil production rate. Nonetheless, waterflooding
has some disadvantages, some of which include
Corrosion of topside and subsurface facilities
5
The injected water may react with the formation water, thereby resulting in the
damage of the formation.
Figure 2.1: Waterflooding process. Adapted from [11]
2.1.3 TERTIARY/ ENHANCED OIL RECOVERY
Approximately two thirds of the original oil in place is economically unrecoverable after
the implementation of primary and secondary recovery techniques [12]. It is the desire of
operators of depleting oilfields to maximize the cost-effective recovery of unrecoverable
oil after the natural pressure of the reservoir is depleted, and secondary recovery
techniques have been implemented. Tertiary oil recovery, often termed enhanced oil
recovery in the ideal sense means reducing the unrecoverable oil and/or increasing the
sweep (volumetric) efficiency (residence time). It involves injecting a fluid into the
reservoir in order to increase the amount of oil produced by the traditional primary and
secondary production methods. Thus, the target for EOR processes is this substantial
volume of residual oil in the reservoir and it involves employing physical, chemical or
thermal mechanisms so as to improve the microscopic oil displacement [13].
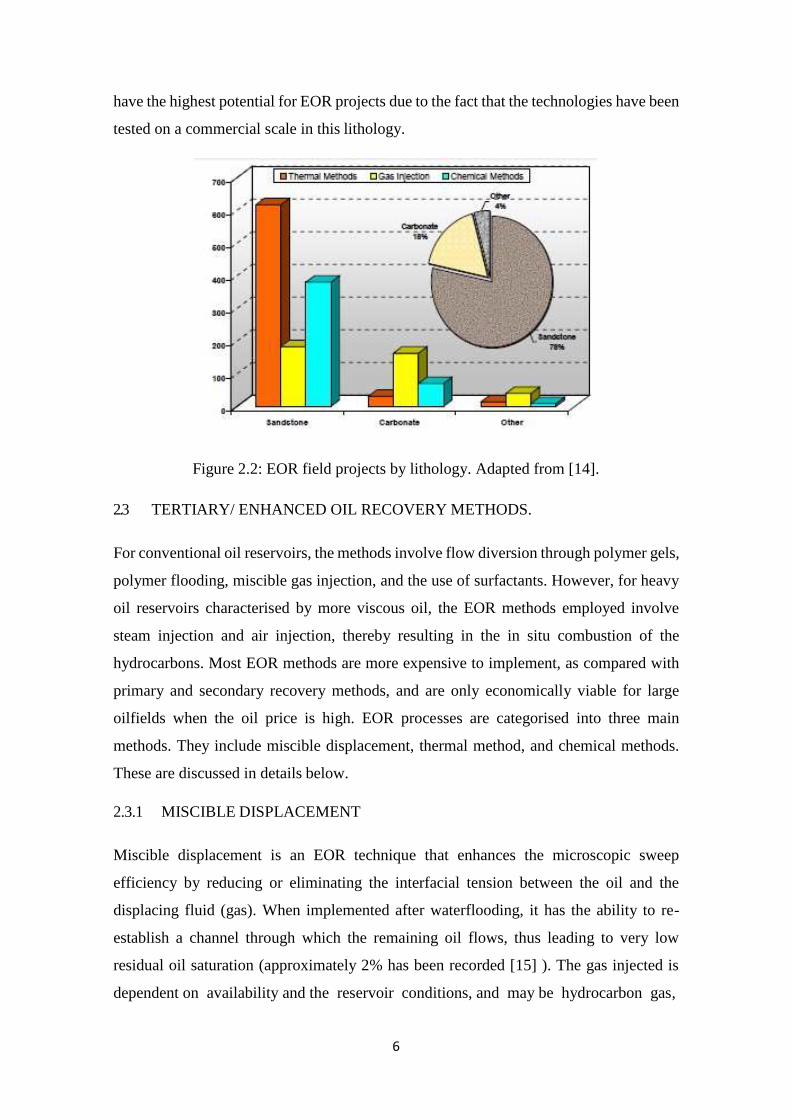
2.2 EOR BY LITHOLOGY
Reservoir lithology is a very important variable in determining the applicability of
specific EOR techniques. From Figure 2.2 below, most EOR applications have been in
sandstone reservoirs in comparison with other lithologies. Sandstone reservoirs generally
6
have the highest potential for EOR projects due to the fact that the technologies have been
tested on a commercial scale in this lithology.
Figure 2.2: EOR field projects by lithology. Adapted from [14].
2.3 TERTIARY/ ENHANCED OIL RECOVERY METHODS.
For conventional oil reservoirs, the methods involve flow diversion through polymer gels,
polymer flooding, miscible gas injection, and the use of surfactants. However, for heavy
oil reservoirs characterised by more viscous oil, the EOR methods employed involve
steam injection and air injection, thereby resulting in the in situ combustion of the
hydrocarbons. Most EOR methods are more expensive to implement, as compared with
primary and secondary recovery methods, and are only economically viable for large
oilfields when the oil price is high. EOR processes are categorised into three main
methods. They include miscible displacement, thermal method, and chemical methods.
These are discussed in details below.
2.3.1 MISCIBLE DISPLACEMENT
Miscible displacement is an EOR technique that enhances the microscopic sweep
efficiency by reducing or eliminating the interfacial tension between the oil and the
displacing fluid (gas). When implemented after waterflooding, it has the ability to re-
establish a channel through which the remaining oil flows, thus leading to very low
residual oil saturation (approximately 2% has been recorded [15] ). The gas injected is
dependent on availability and the reservoir conditions, and may be hydrocarbon gas,
7
nitrogen or CO2. At a low temperature and pressure, CO2 is miscible with oil, and requires
a regular supply source. Previous applications have been on fields with close proximity
with the natural source of CO2 [16, 17] . The use of CO2 can lead to corrosion of the steel
pipes and this problem can be overcome by careful design of wells, flowlines and facilities
[18]. Nitrogen requires reservoirs with high pressures, and additional equipment for its
separation from air. As a result, it is not widely used [16]. Hydrocarbon gas is usually
obtainable from the oilfield itself or neighbouring fields, and is employed in fields where
there is no available market for the hydrocarbon gas [15, 16, 19, 20].
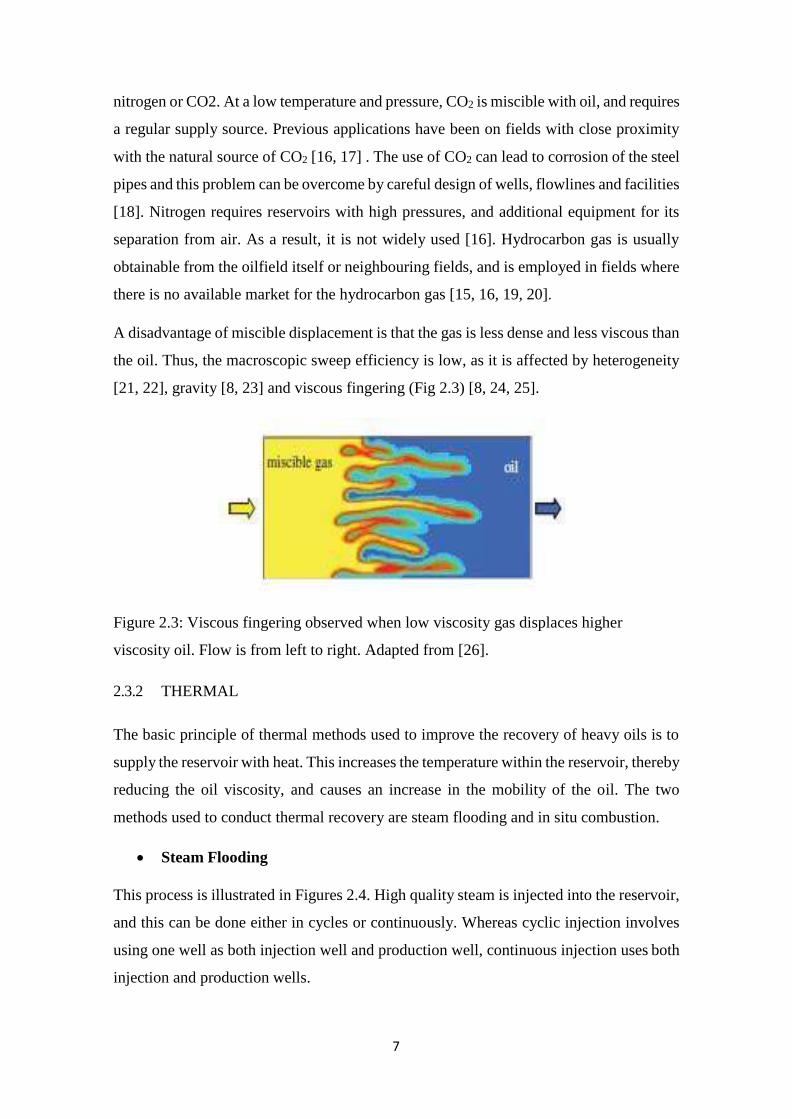
A disadvantage of miscible displacement is that the gas is less dense and less viscous than
the oil. Thus, the macroscopic sweep efficiency is low, as it is affected by heterogeneity
[21, 22], gravity [8, 23] and viscous fingering (Fig 2.3) [8, 24, 25].
Figure 2.3: Viscous fingering observed when low viscosity gas displaces higher
viscosity oil. Flow is from left to right. Adapted from [26].
2.3.2 THERMAL
The basic principle of thermal methods used to improve the recovery of heavy oils is to
supply the reservoir with heat. This increases the temperature within the reservoir, thereby
reducing the oil viscosity, and causes an increase in the mobility of the oil. The two
methods used to conduct thermal recovery are steam flooding and in situ combustion.
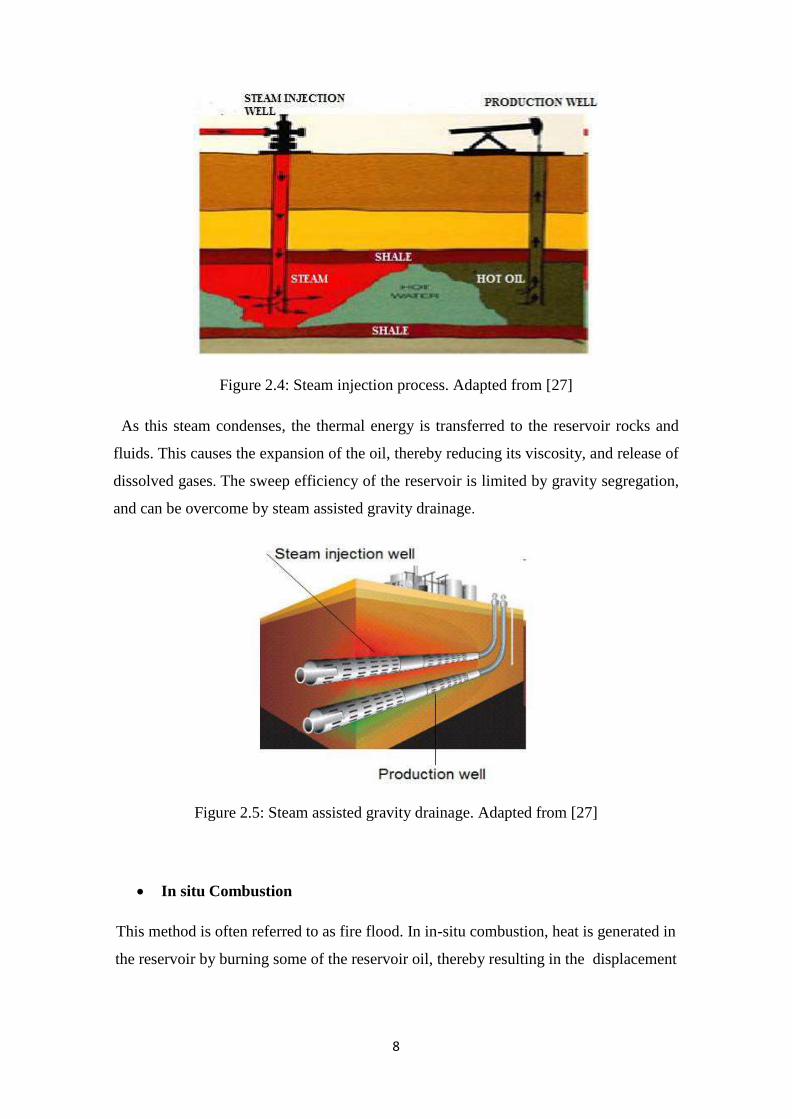
Steam Flooding
This process is illustrated in Figures 2.4. High quality steam is injected into the reservoir,
and this can be done either in cycles or continuously. Whereas cyclic injection involves
using one well as both injection well and production well, continuous injection uses both
injection and production wells.
8
Figure 2.4: Steam injection process. Adapted from [27]
As this steam condenses, the thermal energy is transferred to the reservoir rocks and
fluids. This causes the expansion of the oil, thereby reducing its viscosity, and release of
dissolved gases. The sweep efficiency of the reservoir is limited by gravity segregation,
and can be overcome by steam assisted gravity drainage.
Figure 2.5: Steam assisted gravity drainage. Adapted from [27]
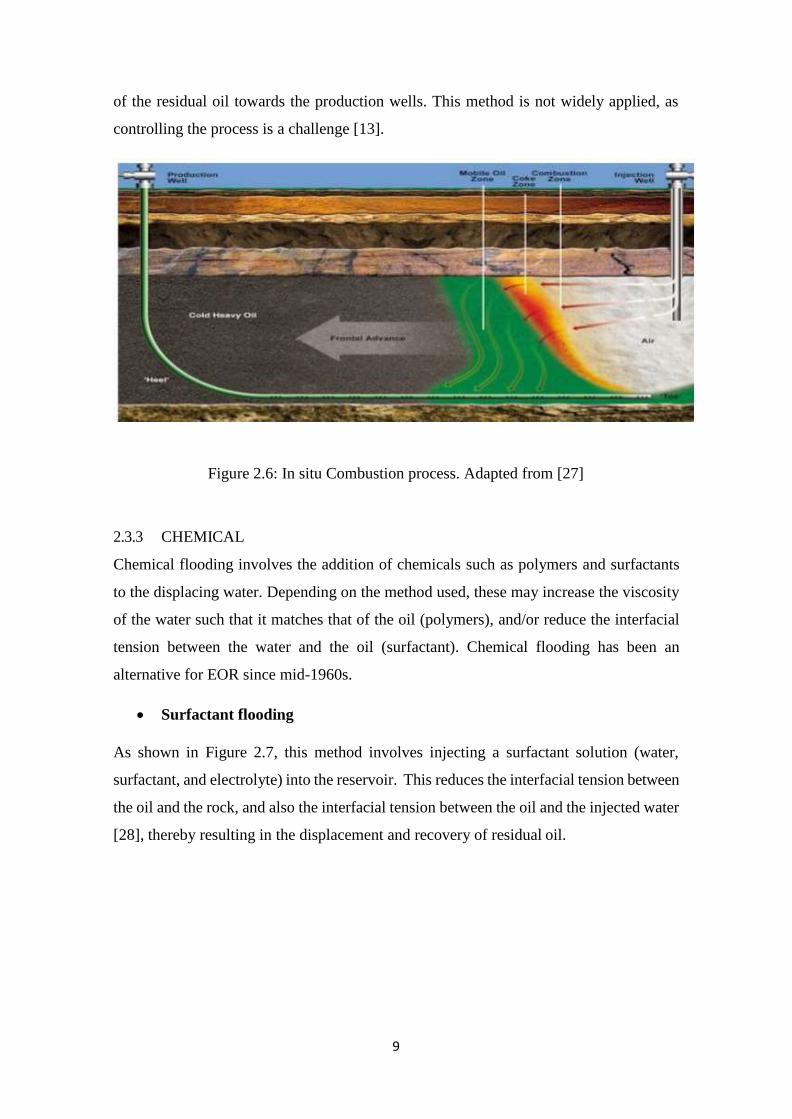
In situ Combustion
This method is often referred to as fire flood. In in-situ combustion, heat is generated in
the reservoir by burning some of the reservoir oil, thereby resulting in the displacement
9
of the residual oil towards the production wells. This method is not widely applied, as
controlling the process is a challenge [13].
Figure 2.6: In situ Combustion process. Adapted from [27]
2.3.3 CHEMICAL
Chemical flooding involves the addition of chemicals such as polymers and surfactants
to the displacing water. Depending on the method used, these may increase the viscosity
of the water such that it matches that of the oil (polymers), and/or reduce the interfacial
tension between the water and the oil (surfactant). Chemical flooding has been an
alternative for EOR since mid-1960s.
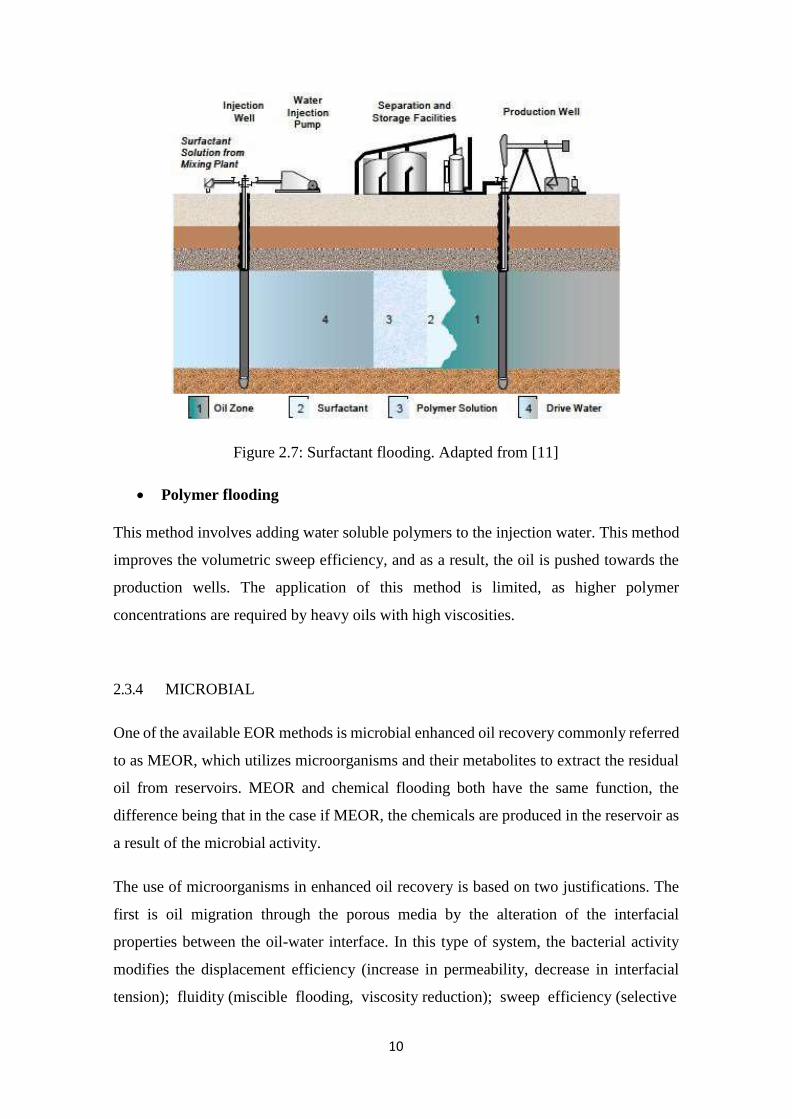
Surfactant flooding
As shown in Figure 2.7, this method involves injecting a surfactant solution (water,
surfactant, and electrolyte) into the reservoir. This reduces the interfacial tension between
the oil and the rock, and also the interfacial tension between the oil and the injected water
[28], thereby resulting in the displacement and recovery of residual oil.
10
Figure 2.7: Surfactant flooding. Adapted from [11]
Polymer flooding
This method involves adding water soluble polymers to the injection water. This method
improves the volumetric sweep efficiency, and as a result, the oil is pushed towards the
production wells. The application of this method is limited, as higher polymer
concentrations are required by heavy oils with high viscosities.
2.3.4 MICROBIAL
One of the available EOR methods is microbial enhanced oil recovery commonly referred
to as MEOR, which utilizes microorganisms and their metabolites to extract the residual
oil from reservoirs. MEOR and chemical flooding both have the same function, the
difference being that in the case if MEOR, the chemicals are produced in the reservoir as
a result of the microbial activity.
The use of microorganisms in enhanced oil recovery is based on two justifications. The
first is oil migration through the porous media by the alteration of the interfacial
properties between the oil-water interface. In this type of system, the bacterial activity
modifies the displacement efficiency (increase in permeability, decrease in interfacial
tension); fluidity (miscible flooding, viscosity reduction); sweep efficiency (selective
11
plugging, mobility control); and the natural force (reservoir pressure). The second
rationale is referred to as upgrading. In this scenario, heavy oils are degraded into light
oils as a result of the microbial activity in the reservoir. It can also result in the removal
of heavy metals, as well as sulphur from heavy oils.
In order to sustain the growth and metabolism of these microbes, nutrients of different
types are injected into the reservoir. Whereas some processes utilize fermentable
carbohydrate such as molasses as the nutrient, some others require water containing a
source of phosphates, vitamins and nitrates, so as to enable the growth of anaerobic
bacteria. The microorganisms employed in MEOR are generally anaerobic extremophiles
[29, 30]. These bacteria are usually non-pathogenic, hydrocarbon-utilizing, and occur
naturally in petroleum reservoirs. Bacillus strains cultured with glucose mineral salt are
the most common bacteria used in MEOR technologies, especially when reduction in the
oil viscosity is not the main aim of the operation [31].
2.4 REVIEW OF MICORBIAL ENHANCED OIL RECOVERY
Microbial enhanced oil recovery (MEOR) is a process which utilizes microorganisms to
improve the recovery of oil from the reservoir. These microorganisms may be indigenous
to the reservoir, or are present in the drilling mud or injection water which are introduced
through the wellbore into the reservoir. They feed on the hydrocarbons, undergo
metabolism, and produce by-products such as gases, organic acids, polymers,
Biosurfactants and biomass. These by-products help reduce the viscosity of the oil,
thereby enhancing its flow. Whereas primary and secondary recovery methods recover
up to 35 – 45% of the original oil in place, MEOR helps increase production by 5- 15%.
The idea of MEOR was put forward first by Beckman in 1926, when he suggested that
microorganisms can help improve the oil production rate form porous media ref.
However, it was not until a series of laboratory investigations by Zobell in the 1940s that
any serious considerations was given to the process [32]. Based on the method of
implementation, MEOR can be classified as either cyclic, microbial flooding or selective
plugging recovery [33]. Microbial enhanced oil recovery has many unique advantages.
It has low toxicity, is less dependent on crude oil prices and consumes low amounts of
energy [34] . Also microbial growth occurs at an exponential rate, hence additional
volumes of oil can be produced at cheap rates. In spite of existing disagreements by some
groups[19], continuous research in addition to a number of successful field applications
12
confirm that MEOR is thus a viable alternative in improving the hydrocarbon recovery
efficiencies from reservoirs [35, 36].
2.4.1 RELATED WORK DONE ON MEOR
In 1926, after Beckham postulated that microorganisms could be used to increase the
amount of oil recovered from reservoirs, very little consideration was given to the process,
as the ability of microorganisms to use hydrocarbons was viewed as a biological curiosity.
In the late 1940s, Zobell and his research team from Russia began conducting research in
university laboratories. The results obtained from these laboratory experiments showed
that certain microorganisms, together with adequate nutrients and reservoir conditions
such as temperature, pressure, salinity and dissolved gases and produce biopolymers,
biosurfactants, acids and gases as their metabolic byproducts. Zobell further discussed
and patented the mechanisms behind which oil is released form porous sand columns by
utilizing the byproducts of the microorganisms (refer to Table 2.1 below).
Experimental results obtained by Zobell and his team laid the foundation upon which
other researchers worldwide began to their own experiments. In the USSR, Kuznetsov
concluded that bacteria which is capable of degrading oil to form gases (H2, CH4, N2, and
CO2) are present in oil deposits. His work led to the authentication of the technology of
activation of reservoir microorganisms, which was later developed by Ivanov and his
research team [37].
Between the 1960s and 1970s, a significant number of research activities were carried out
in certain European countries such as Hungary, Poland and former Czechoslovakia [38,
39]. Based on the results obtained, some field trials were carried out in these countries,
and these were done by injecting certain preselected bacteria (Pseudomonas,
Micrococcus, Peprococcus, Mycobacterium, Bacillus, etc.) based on their ability to
produce large amounts of acids, solvents, polymers, gases, surfactants and biomass. The
oil recovery efficiency is however increased by either one or a combination of
mechanisms such as selective plugging, interfacial tension reduction, gas production or
biomass formation [40]. The results obtained from some of these field trials produced
different results from what was obtained from laboratory experiments. This deviation in
results was attributed to the lack of proper understanding of the physical and chemical
processes which occur within the reservoir where in situ metabolism occurs [41].
According to Hitzman [37], a number of reasons have been identified for these observed
13
variations. An important factor he reported was the changing environment that normally
occurs within the reservoir which is difficult to simulate in the laboratory using core
samples and reactors. These changes in the reservoir occur as a result of the interaction
of the exponentially growing microorganisms in the reservoir. Another reason he pointed
out for the failure of field trials is the inadequate consideration of the prevailing
conditions of the reservoir [42]. These conditions include pH, salinity, temperature,
pressure, nutrients and dissolved oxygen. Another reason he identified is insufficient
knowledge on the growth of microorganisms in hydrocarbons under anaerobic conditions.
However, recent research has proven that bacteria have the ability to metabolize the
hydrocarbons in an anaerobic environment [43]. It has been suggested that careful
planning can help overcome some of the problems associated with MEOR field
applications [44].
Studies carried out between 1970 and 2000 have verified the basic nature of existence of
indigenous microorganisms in hydrocarbon reservoirs, and the reservoir characteristics
necessary for successful MEOR applications [37]. Research about MEOR is still on
going, and this is because of the increasing oil prices and increase in the number of
matured oilfields. Some recent studies include the works of McInerney et al, 2002; Bryant
and Lockhart, 2002; Brown et al. 2002; Kowalski et al, 2006; Lazar et al. 2007; Kaster et
al. 2009 and Rudyk and Sogaard, 2011. These studies were attempts to eliminate the
variations in laboratory experiments and field applications of MEOR.
Research into area of MEOR modelling is increasing rapidly. It has been observed that a
mathematical model can be used to predict the most important parameters and their
relationships for the successful application of MEOR [45]. Development of mathematical
models for MEOR is however a challenging task as a result of dynamic physical and
chemical variables that govern the activities of the microbes in reservoirs. Microbial
activity has however been successfully modelled mathematically in the work of Monod
[46]. Following his publication of his research work, several other mathematical models
have been developed to simulate MEOR processes. Examples include models that
incorporate the effect of salinity on interfacial tension reduction and adsorption of
microorganisms [37], models for changes in relative permeability [47, 48], and basic
equations for the adsorption and diffusion of microorganisms [49, 50].
14
In conclusion, the ability of microbes to enhance oil recovery is not questionable, rather
the challenge is how to apply this ability in an economic and practical manner obtain
results which can be transferred from laboratory scale to field applications. Research
projects to support MEOR have been carried out worldwide in countries such as US,
China, Russia, Canada, Hungary, Norway, Great Britain, Poland, Czech Republic,
Germany, Bulgaria and Australia. It is pertinent to recognise the role of the US
Department of Energy (DOE), which funded a number of MEOR projects and organised
various international symposia. MEOR technologies today are fit for application as the
demand for oil rises and the production remains constant or decreases. However despite
the extensive history of MEOR activities, MEOR technologies have gained very little
acceptance by the oil industry. This may be attributed to the fact that most available
literature on MEOR is based on laboratory experiments or field applications with
insufficient duration, and little collaboration between reservoir engineers,
microbiologists, geologists, and owner operators. Many researchers have made
recommendations necessary to validate MEOR as a feasible method to improve oil
recovery efficiencies, and until these tests are carried out, MEOR may not attain a highly
desirable recognition in the oil industry.
2.5 CLASSIFICATION, MECHANISMS AND LIMITATIONS OF MEOR
2.5.1 MEOR CLASSIFICATION
The main aim of microbial enhanced oil recovery is to reduce the viscous and capillary
forces in heavy oil reservoirs, by the use of microorganisms, thereby increasing the
amount of oil produced form the reservoir. The methods in which these microorganisms
are introduced into the reservoir vary. MEOR is however classified based on the method
in which the microorganisms are introduced into the reservoir. The first method, the
microorganisms and their bio-products are cultured on surface facilities and are injected
into the target zones in the reservoir. This method is referred to as surface MEOR. The
second method however entails the injection of nutrients into the reservoir to stimulate
indigenous microorganisms in the reservoir. This method is referred to as underground
MEOR.
According to the implementation method, underground MEOR is classified as follows:
Cyclic Microbial Recovery (huff and puff)
Microbial Flooding Recovery
15
Selective Plugging Recovery
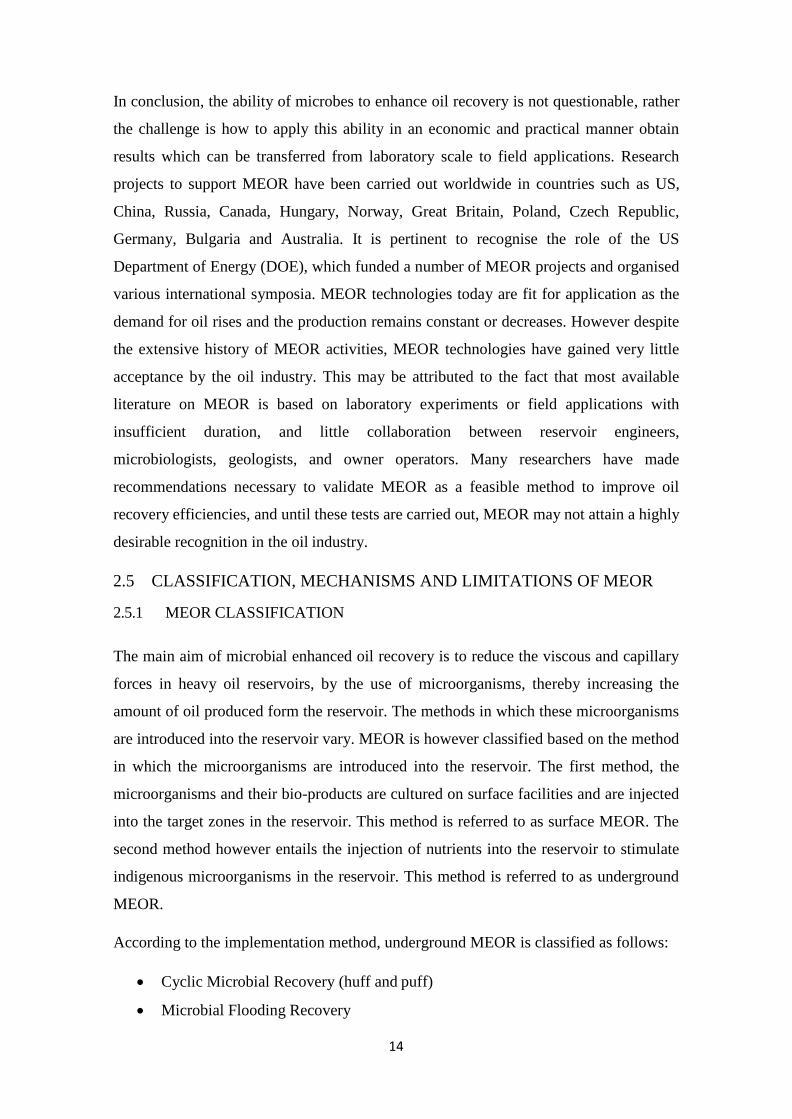
Cyclic microbial recovery is a single well simulation method in which microorganisms
together with some nutrients are injected into an oil reservoir through a single well. Upon
completion of the injection, the well is shut in for a period of 3-5 days. During this period,
the microorganisms feed on the nutrients, grow and produce metabolites. The metabolites
produced however vary, depending on the microorganisms used, and may be surfactants,
acids or gases such as hydrogen, methane and carbondioxide. After this period is the oil
production stage, and this may take several weeks or months. This method eliminates the
need for continual injection. However when production rate starts to decrease, the whole
process is repeated with a new supply of microorganisms and the nutrients. The area in
the reservoir which is covered by these microorganisms is however limited by the rate of
injection and the rate at which the microbial process progresses [51].
Figure 2.8: Cyclic microbial oil recovery Adapted from [52]
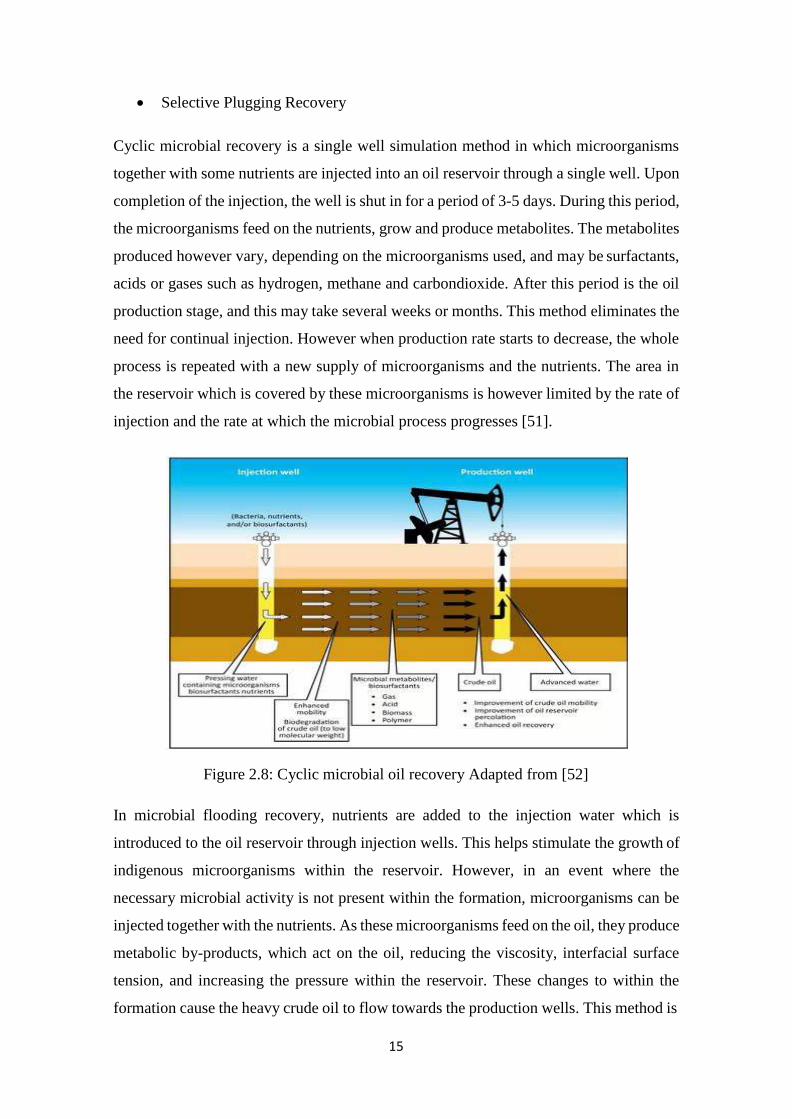
In microbial flooding recovery, nutrients are added to the injection water which is
introduced to the oil reservoir through injection wells. This helps stimulate the growth of
indigenous microorganisms within the reservoir. However, in an event where the
necessary microbial activity is not present within the formation, microorganisms can be
injected together with the nutrients. As these microorganisms feed on the oil, they produce
metabolic by-products, which act on the oil, reducing the viscosity, interfacial surface
tension, and increasing the pressure within the reservoir. These changes to within the
formation cause the heavy crude oil to flow towards the production wells. This method is
16
most probably less expensive, as microbial growth is stimulated in larger portions of the
reservoir where the residual oil (carbon source) is located.
Figure 2.9: Microbial flooding recovery. Adapted from [8]
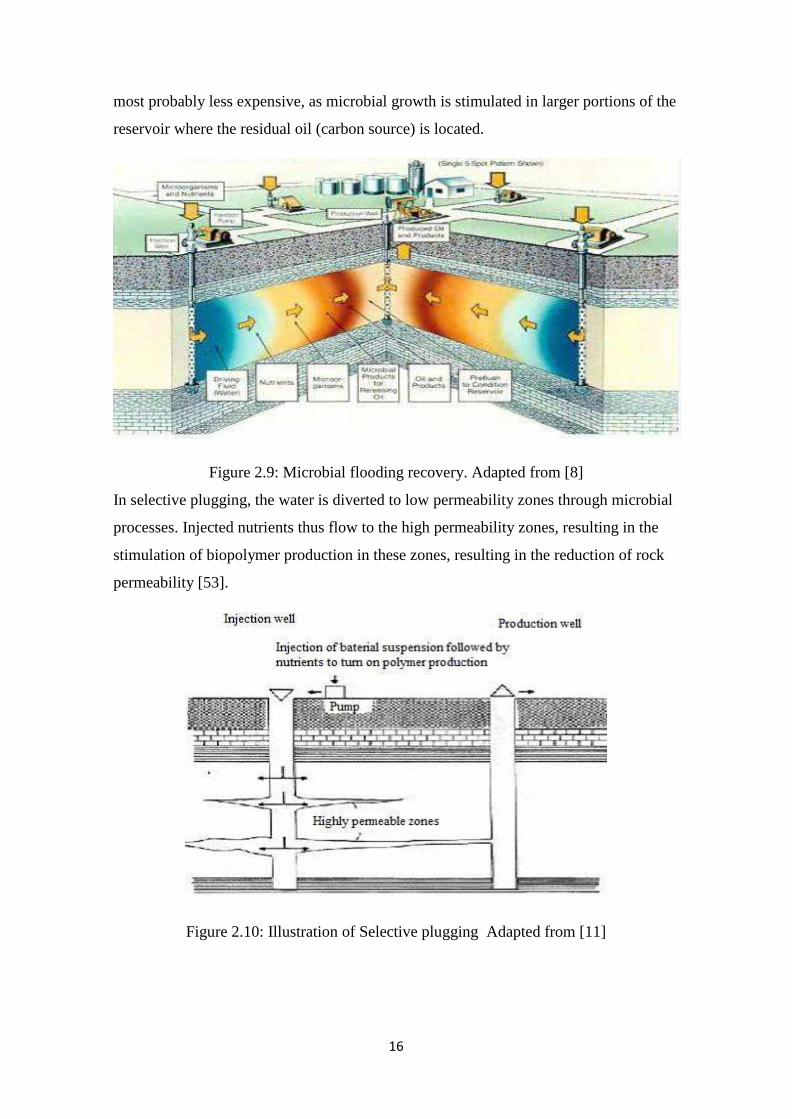
In selective plugging, the water is diverted to low permeability zones through microbial
processes. Injected nutrients thus flow to the high permeability zones, resulting in the
stimulation of biopolymer production in these zones, resulting in the reduction of rock
permeability [53].
Figure 2.10: Illustration of Selective plugging Adapted from [11]
17
2.5.2 MEOR MECHANISMS
In order for MEOR to be generally accepted in the petroleum industry as a sustainable
technology, it is imperative that the mechanisms behind the process be understood.
Microbial activity within the reservoir results in chemical changes of the formation fluids.
Improvements in the oil recovery factor as a result of the microbial activities can be
achieved through several mechanisms such as selective plugging by microorganisms and
their metabolites, reduction in the interfacial tension at the oil-water interface by
surfactant production, acid production which enhances the absolute permeability of the
rock and reduction in the oil viscosity by gas production. It is believed however, that the
first two mechanisms have the largest effects on improving oil recovery [11, 48, 54-56].
Microorganism have the capacity to produce large quantities of the same type of
compounds as those used in conventional EOR methods, the only difference between both
oil recovery enhancement methods being the means by which these compounds are
introduced into the reservoir [51]. Different microbial groups, their metabolites and
applications in MEOR are summarised in Table 2.1[31]
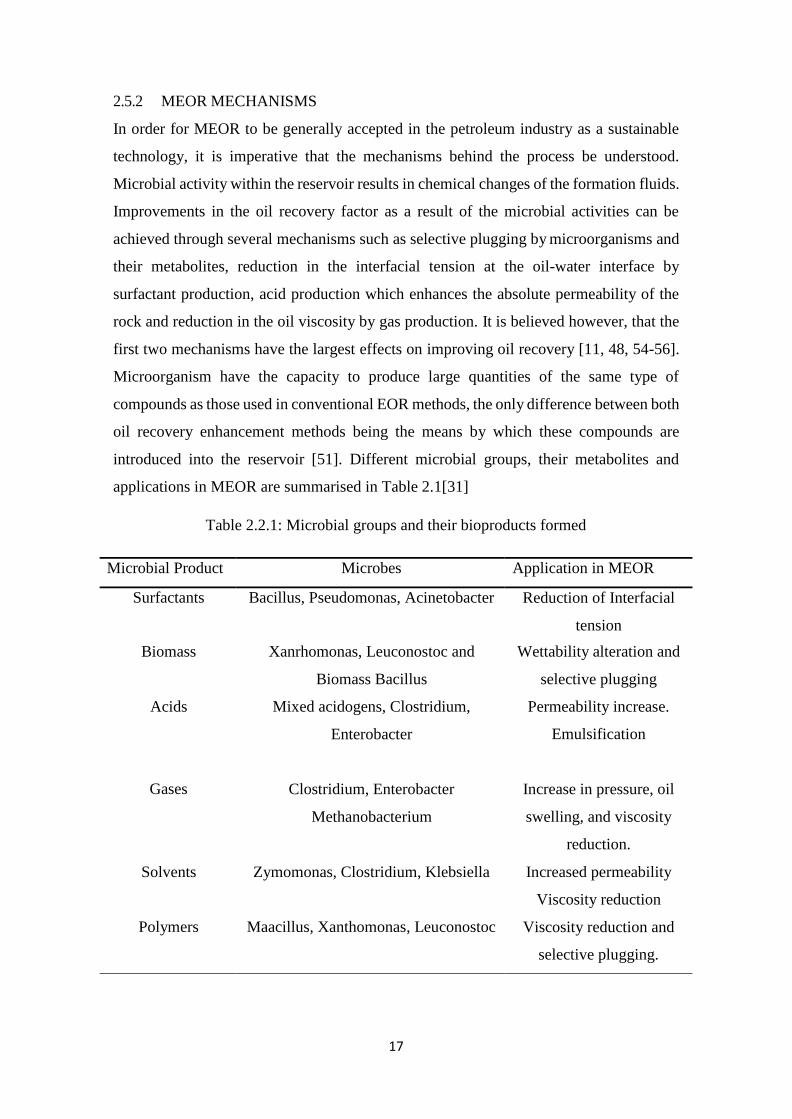
Table 2.2.1: Microbial groups and their bioproducts formed
Microbial Product Microbes Application in MEOR
Surfactants Bacillus, Pseudomonas, Acinetobacter Reduction of Interfacial
tension
Biomass Xanrhomonas, Leuconostoc and
Biomass Bacillus
Wettability alteration and
selective plugging
Acids Mixed acidogens, Clostridium,
Enterobacter
Permeability increase.
Emulsification
Gases
Clostridium, Enterobacter
Methanobacterium
Increase in pressure, oil
swelling, and viscosity
reduction.
Solvents Zymomonas, Clostridium, Klebsiella Increased permeability
Viscosity reduction
Polymers Maacillus, Xanthomonas, Leuconostoc Viscosity reduction and
selective plugging.
18
2.5.2.1 Biosurfactant Application
Chemical surfactants are toxic and expensive compounds that are non-biodegradable ref.
An increasing concern about protecting the environment has led to the development of
cost- effective bioprocesses for the production of biosurfactant. Biosurfactants are
efficient alternatives to chemical surface-active agents, as they possess better
characteristics, such as high biodegradability, low toxicity, ease of application, and high
tolerance under extreme conditions of temperature, pH, and salinity. There are three main
ways for the application of biosurfactants in oil recovery.
I. Injection of microorganisms capable of producing biosurfactants into the reservoir
via the wellbore, with subsequent growth and multiplication of the
microorganisms within the reservoir.
II. Injection of nutrients into the reservoir, which is capable of stimulating the growth
of indigenous biosurfactant producing microorganisms.
III. Ex-situ production of biosurfactants, and subsequent injection into the reservoir.
Biosurfactants improve oil recovery by reducing the interfacial tension and altering the
wettability of the porous media. A reduction in the interfacial tension at the oil-rock
results in a reduction in the capillary forces that trap interface residual oil in the porous
rocks thereby causing additional oil to be displaced from the capillary network.
2.5.2.1.1 Requirements to mobilize oil by IFT reduction.
Residual oil exists as globules within the pore spaces in the reservoir. After primary and
secondary recovery from the reservoir, the pressure gradient required to transport these
globules through the pore throats is insufficient, and the viscous force promoting flow is
opposed by capillary forces acting on the globule. In this situation, a correlating parameter
is the capillary number Nca. This is defined as the ratio of viscous to capillary forces, and
is expressed mathematically as:
Nca
u
Equation 2.1
Where u is the velocity (m/s), µ is the viscosity (Pa.s), and is the interfacial tension
(N/m). The larger the capillary number, the lower the viscosity of the oil, thus the greater
the possibility of mobilization of residual oil. Surfactants reduce the interfacial tension,
thereby increasing the capillary number. As illustrated in Figure2.11, core floods for
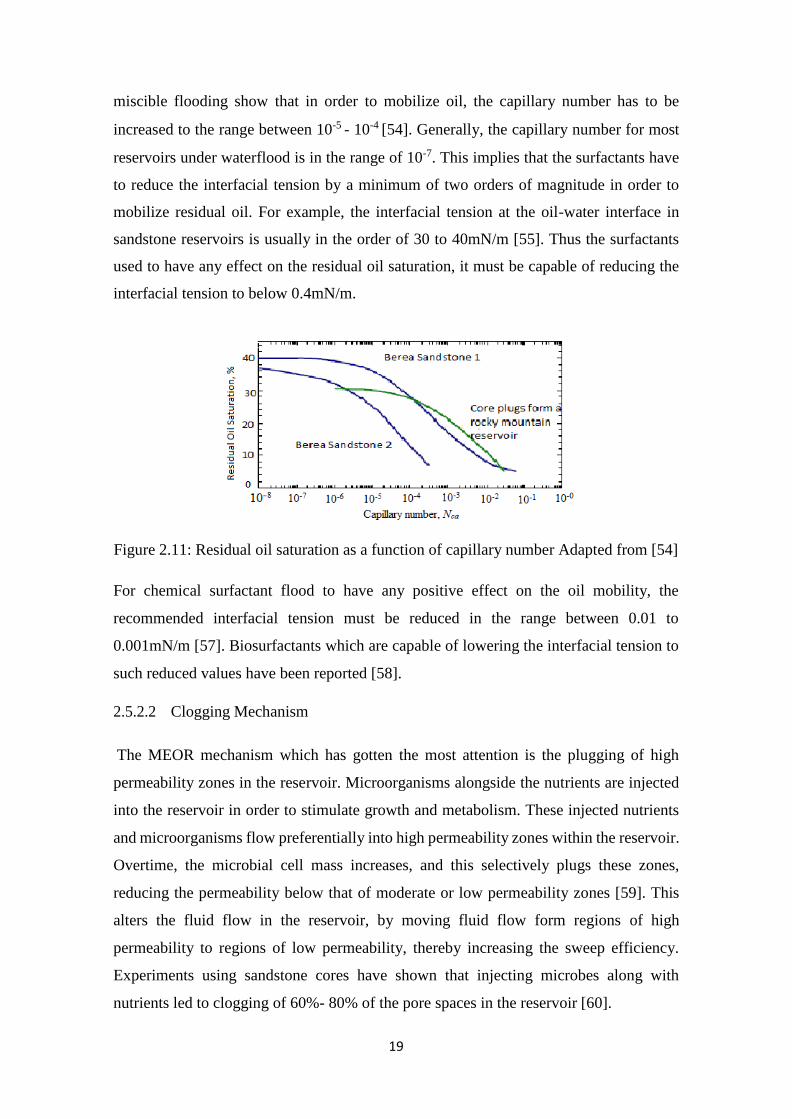
19
miscible flooding show that in order to mobilize oil, the capillary number has to be
increased to the range between 10-5 - 10-4 [54]. Generally, the capillary number for most
reservoirs under waterflood is in the range of 10-7. This implies that the surfactants have
to reduce the interfacial tension by a minimum of two orders of magnitude in order to
mobilize residual oil. For example, the interfacial tension at the oil-water interface in
sandstone reservoirs is usually in the order of 30 to 40mN/m [55]. Thus the surfactants
used to have any effect on the residual oil saturation, it must be capable of reducing the
interfacial tension to below 0.4mN/m.
Figure 2.11: Residual oil saturation as a function of capillary number Adapted from [54]
For chemical surfactant flood to have any positive effect on the oil mobility, the
recommended interfacial tension must be reduced in the range between 0.01 to
0.001mN/m [57]. Biosurfactants which are capable of lowering the interfacial tension to
such reduced values have been reported [58].
2.5.2.2 Clogging Mechanism
The MEOR mechanism which has gotten the most attention is the plugging of high
permeability zones in the reservoir. Microorganisms alongside the nutrients are injected
into the reservoir in order to stimulate growth and metabolism. These injected nutrients
and microorganisms flow preferentially into high permeability zones within the reservoir.
Overtime, the microbial cell mass increases, and this selectively plugs these zones,
reducing the permeability below that of moderate or low permeability zones [59]. This
alters the fluid flow in the reservoir, by moving fluid flow form regions of high
permeability to regions of low permeability, thereby increasing the sweep efficiency.
Experiments using sandstone cores have shown that injecting microbes along with
nutrients led to clogging of 60%- 80% of the pore spaces in the reservoir [60].
20
A critical analysis of the feasibility of this mechanism reveals that the oil recovery is a
function of the volume of the high permeability zone in relation to the overall pore volume
of the reservoir. The yield becomes more attractive as the volume of the high permeability
zones decreases. Reservoirs which have less than 6% of the total pore volume in the high-
permeability zones are better prospects for bacterial plugging [54].
2.5.2.3 Application of gases and solvents
As a result of metabolism of microorganisms within the reservoir, gases such as
carbondioxide, hydrogen, and methane are produced. These gases exist in a free gas phase
at low pressures in the reservoir. These gases produced have the ability to increase the oil
recovery based on mechanisms such as reduction in residual oil saturation,
repressurization and reduction in viscosity. However, it is necessary to state that if the
microorganisms feed on some oil to produce these gases, the viscosity of the residual oil
will be greater than that of the initial oil. This is because the microorganisms will feed
on the lighter fractions of the oil, and the produced microbial gas will be insoluble in the
remaining heavier fraction. This will result in an immobile residue of heavy oil, with
only gas flowing. Using microorganisms to convert immobile oil to flowing gas is not
within the scope of this research.
During the stationary growth phase, microbial process yields some solvents such as
ethanol, acetone, and butanol in smaller amounts. These dissolve in the oil, reducing its
viscosity and increasing its mobility ratio. Gases and solvents both have the ability to
dissolve carbonate rock, thus resulting in an increase in its porosity and permeability [61].
2.5.2.4 Biopolymers application
Certain bacteria have the ability to produce water soluble biopolymers which can increase
the oil recovery using the mechanism of selective plugging by cell growth [62]. These
biopolymers plug the high permeability zones in waterflooding operations, thus changing
the path of the water-flood to oil-rich regions in the reservoir and providing a better sweep
efficiency in the low permeability layers [28]. However, for this mechanism to be
successful in improving oil recovery, the biopolymers produced must not be degradable
by the indigenous microbes, else a more frequent injection of nutrients will be required
to sustain the required level of biopolymers within the reservoir [36].
21
2.5.3 MEOR LIMITATIONS
In order to achieve maximum results in any process, it is important that parameters
involved be outlined. Optimization of MEOR can be achieved once the detrimental
factors are identified and analysed. It is however important to be aware of the limiting,
rather than simply the beneficial factors of employing microbes in enhanced oil recovery.
One of the reasons why MEOR technology has not been widely accepted for field
applications is because of inadequate consideration of the prevailing conditions in the
reservoir, and the physiology of the microorganisms which are able to survive in these
conditions. The physical and chemical conditions of the reservoir determine the activities
of the microbes used in the MEOR process. These conditions include pH, temperature,
salinity, pore size, etc. These factors unarguably affect the growth of microorganisms,
their metabolism and survival within the reservoir, thereby reducing their ability to
produce metabolites in the desired amounts necessary for enhanced oil recovery. Some
of these factors which are considered as constraints to MEOR process are discussed
below.
Temperature
The in situ temperature to be considered in reservoir increases as it has become necessary
to explore deeper reservoirs. The average temperature gradient is 25⁰C for every 1000m
of burial [63]. The demand for hydrocarbon is on an increase, as a result of increase in
population. Oil companies are thus forced to drill to deeper into the earth’s surface. The
temperature gradients at these depths are considered inhospitable, and do not support
bacterial growth and their metabolism. MEOR however cannot be ruled out even at these
high temperatures, as cold water injection, which is a secondary oil recovery technique,
results in temperature drops within the well [64]. Depending on the temperature ranges
for survival, microbes are classified into three categories:
Psychrophiles (grow below 25⁰C)
Mesophiles ( grow between 25 - 40⁰C)
Thermophile (grow between 45 – 60⁰C)
Most oil reservoirs are situated at depths with temperatures higher than 37⁰C, and this is
considered as optimum temperature for bacterial growth and proliferation [65] .
22
Pressure
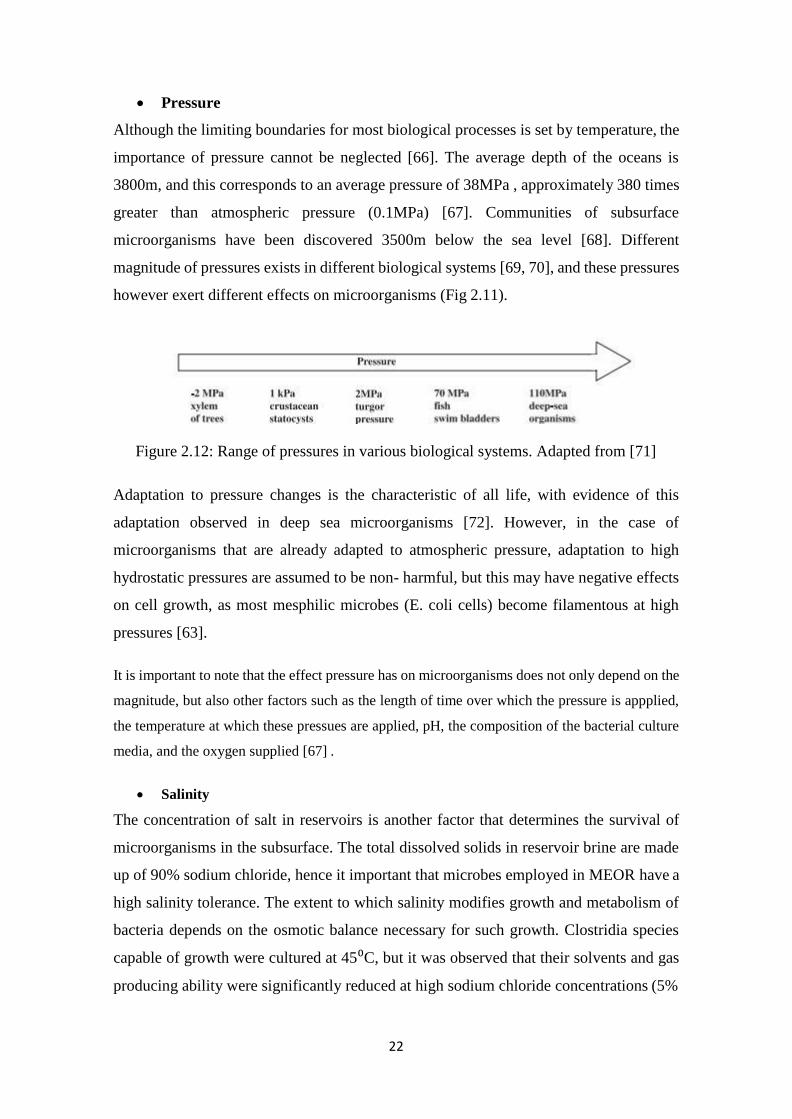
Although the limiting boundaries for most biological processes is set by temperature, the
importance of pressure cannot be neglected [66]. The average depth of the oceans is
3800m, and this corresponds to an average pressure of 38MPa , approximately 380 times
greater than atmospheric pressure (0.1MPa) [67]. Communities of subsurface
microorganisms have been discovered 3500m below the sea level [68]. Different
magnitude of pressures exists in different biological systems [69, 70], and these pressures
however exert different effects on microorganisms (Fig 2.11).
Figure 2.12: Range of pressures in various biological systems. Adapted from [71]
Adaptation to pressure changes is the characteristic of all life, with evidence of this
adaptation observed in deep sea microorganisms [72]. However, in the case of
microorganisms that are already adapted to atmospheric pressure, adaptation to high
hydrostatic pressures are assumed to be non- harmful, but this may have negative effects
on cell growth, as most mesphilic microbes (E. coli cells) become filamentous at high
pressures [63].
It is important to note that the effect pressure has on microorganisms does not only depend on the
magnitude, but also other factors such as the length of time over which the pressure is appplied,
the temperature at which these pressues are applied, pH, the composition of the bacterial culture
media, and the oxygen supplied [67] .
Salinity
The concentration of salt in reservoirs is another factor that determines the survival of
microorganisms in the subsurface. The total dissolved solids in reservoir brine are made
up of 90% sodium chloride, hence it important that microbes employed in MEOR have a
high salinity tolerance. The extent to which salinity modifies growth and metabolism of
bacteria depends on the osmotic balance necessary for such growth. Clostridia species
capable of growth were cultured at 45⁰C, but it was observed that their solvents and gas
producing ability were significantly reduced at high sodium chloride concentrations (5%
23
w/v) [73]. However, in order to adapt to the high concentrations of sodium chloride in
reservoirs, microorganisms have the ability to accumulate a variety of small organic
solutes in the cytoplasm. These organic solutes are referred to as osmolytes, and they have
the ability to maintain cell volume and turgor pressure – essential elements for cell
proliferation [74].
pH
pH is an important environmental factor that affects microbial activity. The optimum pH
for the growth of microbes is in the range of 5-8, and this is because nearly all microbial
metabolic reactions are enzymic [64]. However for microbial growth to be sustained, the
minimum and maximum pH possible is 2 and 9.5 respectively. The concentration of
dissolved carbondioxide, to a large extent, has an effect on the pH of a system. Reduction
in pH, caused by microbial growth, occurs either as a result of microbial respiration, or
the production of acids, which react in carbonate structures to form carbondioxide. A
reduction in the pH is reported to have occurred in all MEOR field trials [75].
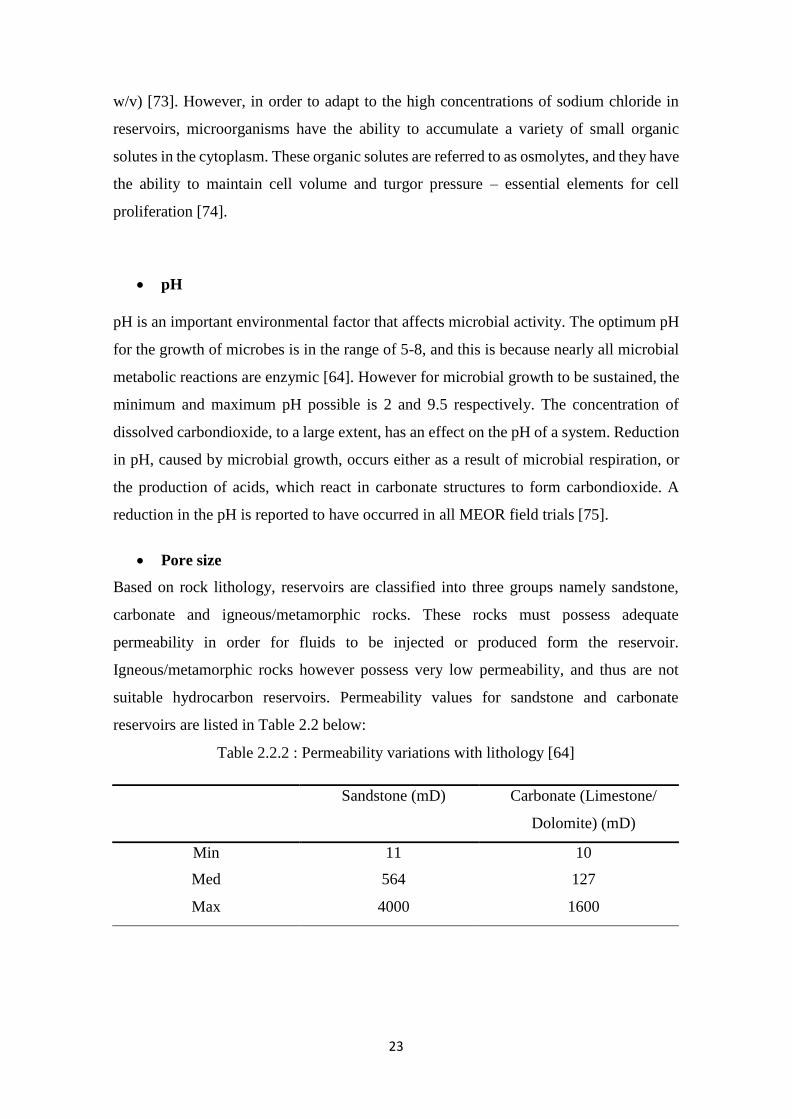
Pore size
Based on rock lithology, reservoirs are classified into three groups namely sandstone,
carbonate and igneous/metamorphic rocks. These rocks must possess adequate
permeability in order for fluids to be injected or produced form the reservoir.
Igneous/metamorphic rocks however possess very low permeability, and thus are not
suitable hydrocarbon reservoirs. Permeability values for sandstone and carbonate
reservoirs are listed in Table 2.2 below:
Table 2.2.2 : Permeability variations with lithology [64]
Sandstone (mD) Carbonate (Limestone/
Dolomite) (mD)
Min 11 10
Med 564 127
Max 4000 1600
24
It has been proven experimentally that reservoirs with permeability values of less than
100mD are constricting for the free movement of the microbes. MEOR is thus applicable
mainly in sandstone reservoirs.
A permeability of 100mD corresponds to a porosity of approximately 5µm. Bacteria are
unicellular, with dimensions of length of around 0.2-10 µm and width in the range of 0.5-
2.0 µm [60] .The use of microorganisms in MEOR is however limited to bacteria, as yeast
and other members of the Protista kingdom have widths larger than 5µm, and hence are
larger than the average reservoir pore space [64]. The pore size must be twice the size of
the bacteria in order for effective transportation to occur within the reservoir [76] . It has
thus been concluded that the pore size or the pore throat diameter is an important factor
in determining the microbial activity within the reservoir [77].
Dissolved Gases.
The dissolved gases that are of importance in MEOR are oxygen, carbondioxide,
hydrogen sulphide, methane, hydrogen and nitrogen. Of the above mentioned gases,
oxygen is the most significant, then carbondioxide, and hydrogen sulphide [63]. In terms
of oxygen usage, microbes are classified into four groups. They include:
I. Aerobic, which require oxygen for growth
II. Anaerobic, which do not require oxygen for growth
III. Microaerophilic, growth and metabolism is best sustained in small amounts of
oxygen
IV. Facultative Anaerobic, can survive under either aerobic or anaerobic conditions.
Aerobic microbes cannot be sustained in a hydrocarbon reservoir in which surface water
is not injected. This is because the dissolved oxygen tension will be too low to sustain the
growth and metabolism of these microbes. Dissolved oxygen concentration in reservoirs
is controlled by the use of deaerator towers or chemicals, and in some cases, a
combination of both. 6-8 ppm of dissolved oxygen is however considered to be corrosive
[32].
Whereas oxygen is required mainly as a hydrogen acceptor in the microbial cytochrome
system, carbondioxide and methane act as the main carbon source for the microbes. The
concentration of hydrogen sulphide in the reservoir is important as well. Sulphate ions
25
are converted into hydrogen sulphide by the action of sulphate reducing bacteria, thereby
forming sour hydrocarbons. This results in corrosion problems within the reservoir.
Nutrients
The availability of essential nutrients is a major requirement in order to sustain the growth
and metabolism of microbes used in the MEOR process. Organic carbon (fatty acids and
sugar) and mineral ions (e.g. calcium and phosphorus) are basic requirements for bacterial
growth, and they are usually transported in an aqueous phase in the reservoir. The nature
of the bioproducts from different bacteria is dependent on the nature and concentration of
the nutrient provided. Updegraff and Wren were the first to propose the use of molasses
as a substrate [76]. Molasses, which is a by-product of sugar, has been used in various
field applications as the carbon source for the microbes. Some microbes on the other hand
also utilize the oil as the carbon source. This is essentially beneficial in heavy oil
reservoirs, as it reduces the viscosity of the oil, thereby increasing its quality [78].
2.6 FIELD APPLICATIONS OF MEOR.
With a lot of research and various field trials, MEOR has been established to have great
potentials in improving the amount of oil extracted from reservoirs. Field tests run in the
US by the National Institute for Petroleum and Energy research were completed with an
increase in the amount of oil produced from flood water that was treated with
microorganisms at a reduced cost [79]. Cyclic microbial recovery technique have also
been implemented commercially on hundreds of wells, with the aim of controlling
paraffin deposition [80, 81]. Activities towards controlling the deposition of paraffin and
sludge in the bottom of tanks were carried out between 1986 and 1990, by MICRO-BAC
International Inc. in Austin, Texas [37]. Microbial permeability modification has been
conducted by Phillips Petroleum Company in the North Burbank Uni. Osage County,
Oklahoma [60]. As patented by Phillips, the MEOR method employed was using injecting
nutrients into the reservoir in order to stimulate the indigenous bacteria. The first injection
turned out unsuccessful, however the second showed a 20% decrease in permeability [79].
A method has successfully been established in Russia, based on the principle of
introducing some salts and oxygen along with injection water into the reservoirs, so as to
stimulate the indigenous microorganisms [82, 83].
In the last 20-30 years, China has been very active in MEOR, and is still active in this
field till today, and may be recognised as one of the leaders in this field [84]. Reservoir
26
engineers in China have reported on microbial simulation carried out in the Fuyu field.
The wells located in this field contained 18-23% paraffin. As a result of the microbial
stimulation, the viscosity reduced by 8.2% (from 45 to 36.8cP) and 42 out if a total of 44
wells responded positively [79]. There was also an increase in the CO2 content in the
production wells by 21%. Some of the wells sustained an increase in production for up to
357 days [79] . In Australia, a concept involving the use of ultra microbacteria generated
through nutrient manipulation has been developed. The outer cells of ultra microbacteria
possess some surface-active properties, which help reduce the interfacial tension of the
oil in the reservoir. This developed concept was successfully verified in increasing the
amount of oil produced from the Alton oil field in Queensland, Australia [42, 85]. In
Romania, successful MEOR field trials have been reported using both microbial flooding
and single well stimulation recovery technologies on a number of Romanian oilfields by
the injection of molasses into the reservoir [86]. A successful increase in the amount of
oil produced from carbonate reservoirs by utilizing molasses and inoculum as the nutrient
support has been reported in Germany [87]. This method was also used in MEOR
applications in oilfields in Russia.
Conducting successful MEOR applications on water floods, and the minimal cost of
MEOR is the foundation on which MEOR field experiments have been based after 1990.
Also technologies involving the use of ultrabacteria have the potential for increasing the
field applications of MEOR [37]. It is believed that as the demand for oil continues to
increase with an increase in the number of stripper wells, MEOR will gain the much
desired recognition as a means of tertiary oil recovery, and will be applied to more oil
fields across the world.
2.7 ADVANTAGES AND CHALLENGES OF MEOR.
Some of the major advantages of MEOR technologies in comparison with other EOR
technologies are listed below [37] :
1. It is a sufficient alternative before abandoning stripper wells, as the cost is
potentially low.
2. The bacteria and nutrients which are injected into the reservoirs are inexpensive
and easy to handle in the field.
27
3. Since the fluids injected into the reservoir are not petrochemicals as is the case
with chemical EOR technologies, their costs do not depend on the prevailing oil
prices.
4. In the case of carbonate oil reservoirs, MEOR technologies are suitable where
some EOR processes cannot be implemented.
5. Only slight modifications to the existing facilities on the field are required where
MEOR process is to be implemented. When compared with other EOR
technologies, it is less costly
6. Based on available statistical evaluation in the US, 81% of MEOR projects
resulted in the increase in the amount of oil produced with no recorded decrease
in the oil production as a result of the application of MEOR processes
7. As a result of the exponential growth of the microorganisms, the effect of their
activity within the reservoir increases overtime, whereas in EOR technologies, the
effect the additives have on the reservoir diminishes with time.
8. Microbes which are indigenous to the reservoir can be utilized, thereby
eliminating the possibility of adsorption and losses as a result of degradation.
9. The products of MEOR are biodegradable, thus will not accumulate in the
environment, so it is environmentally benign.
Irrespective of the above mentioned advantages, there are some problems surrounding
MEOR. A major challenge is reservoir heterogeneity and varying oil complexities. A
method which appears optimal for one reservoir may not necessarily be optimal for
another reservoir. Other challenges with MEOR include souring of wells by sulphate
reducing bacteria (SRB) and undesirable plugging of pores caused by large microbial
cells. Well souring can be reduced by using nitrate-reducing bacteria to get rid of the
SRBs. Unwanted plugging can be avoided as well by injecting microorganisms with one
tenth of the pore entry diameter.
Some technical and economic issues have also been identified. In the case of
neighbouring production wells with different owners, if one well is treated with MEOR,
it may lead to an increase in the oil recovery form the neighbouring wells, and this can
result in economic and legal issues.[32].
28
CHAPTER THREE
3 MATERIALS AND METHOD
MEOR experiments were carried out to complement the studies reported in this
dissertation. The experiments served as the basis for testing and improving considered
methods for field applications and additional experiments. Soil sample collected from
Aberdeen city was used to culture microorganisms, which were incubated for a total
period of 31 days. The ability of these microorganisms to degrade dodecane was tested,
and the results are detailed in Chapter 4 of this report. A brief outline of the experiments
is thus provided below.
3.1 CULTURES USED
A total of 5 enrichment cultures of bacteria isolated from soils sample were used in this
research. The bacteria were cultured aerobically at 27⁰C. Enrichment cultures were used
rather than pure cultures because it is almost impossible to maintain pure cultures in field
applications of a microbial oil recovery method.
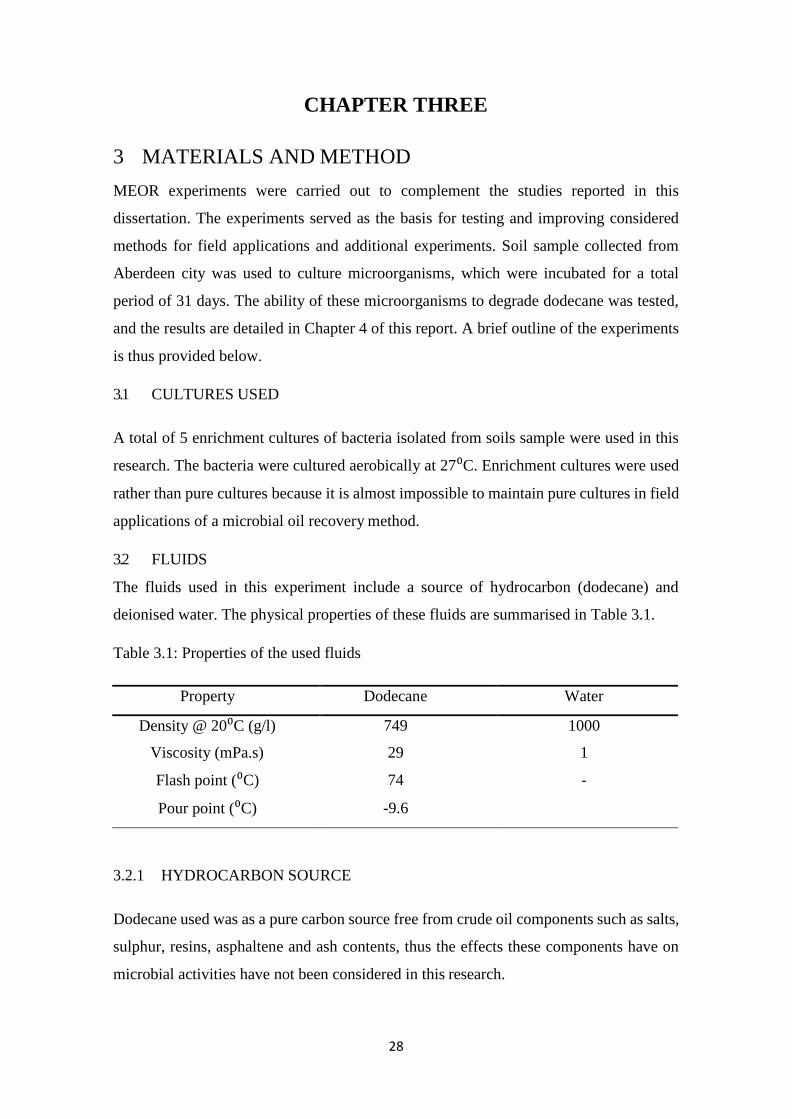
3.2 FLUIDS
The fluids used in this experiment include a source of hydrocarbon (dodecane) and
deionised water. The physical properties of these fluids are summarised in Table 3.1.
Table 3.1: Properties of the used fluids
Property Dodecane Water
Density @ 20⁰C (g/l) 749 1000
Viscosity (mPa.s) 29 1
Flash point (⁰C) 74 -
Pour point (⁰C) -9.6
3.2.1 HYDROCARBON SOURCE
Dodecane used was as a pure carbon source free from crude oil components such as salts,
sulphur, resins, asphaltene and ash contents, thus the effects these components have on
microbial activities have not been considered in this research.
29
3.2.2 DEIONISED WATER
Deionised water with a pH of 8 was used in the preparation of the mineral solution.
Deionised water was selected because it is free from contaminants such as lead, mercury
nitrates, phosphates, as well as pesticides.
3.3 GLASS BIOREACTORS
Ten glass bioreactors were used in this experiment. Five of them were used to culture
bacteria, and the other five were used for the control experiment.
3.4 EXPERIMENTAL PROCEDURE
The experimental procedure used in this research is as described below:
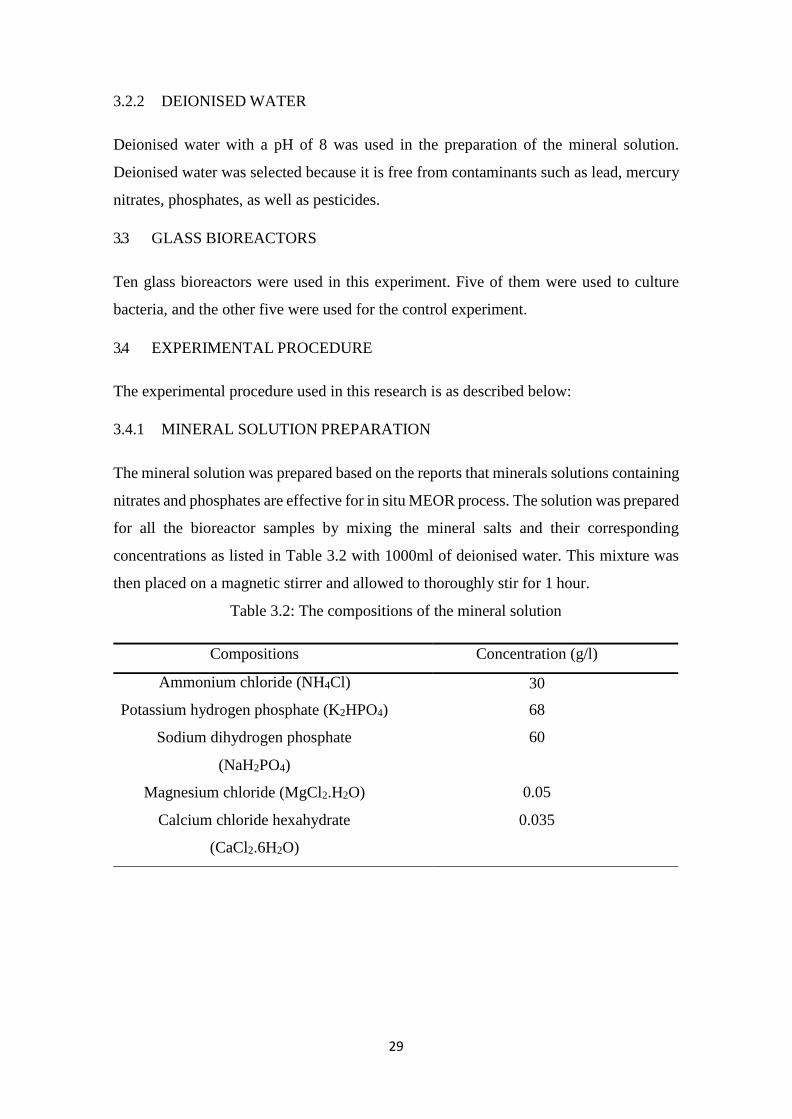
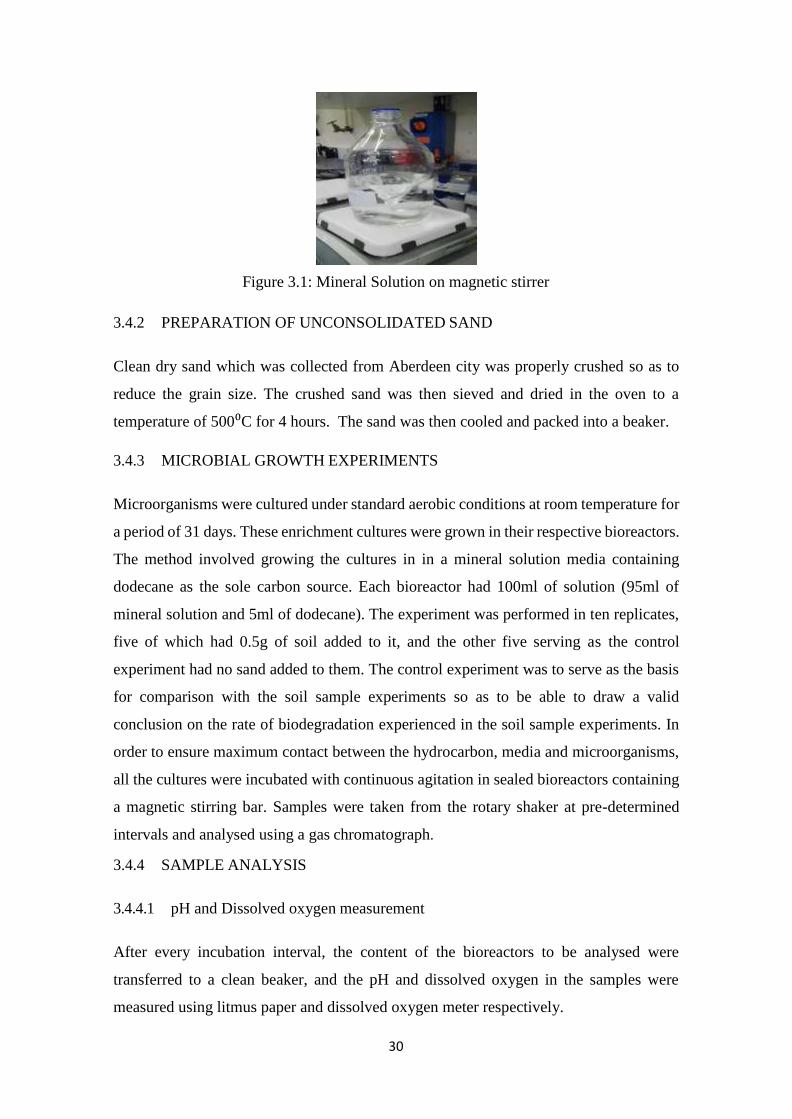
3.4.1 MINERAL SOLUTION PREPARATION
The mineral solution was prepared based on the reports that minerals solutions containing
nitrates and phosphates are effective for in situ MEOR process. The solution was prepared
for all the bioreactor samples by mixing the mineral salts and their corresponding
concentrations as listed in Table 3.2 with 1000ml of deionised water. This mixture was
then placed on a magnetic stirrer and allowed to thoroughly stir for 1 hour.
Table 3.2: The compositions of the mineral solution
Compositions Concentration (g/l)
Ammonium chloride (NH4Cl) 30
Potassium hydrogen phosphate (K2HPO4) 68
Sodium dihydrogen phosphate
(NaH2PO4)
60
Magnesium chloride (MgCl2.H2O) 0.05
Calcium chloride hexahydrate
(CaCl2.6H2O)
0.035
30
Figure 3.1: Mineral Solution on magnetic stirrer
3.4.2 PREPARATION OF UNCONSOLIDATED SAND
Clean dry sand which was collected from Aberdeen city was properly crushed so as to
reduce the grain size. The crushed sand was then sieved and dried in the oven to a
temperature of 500⁰C for 4 hours. The sand was then cooled and packed into a beaker.
3.4.3 MICROBIAL GROWTH EXPERIMENTS
Microorganisms were cultured under standard aerobic conditions at room temperature for
a period of 31 days. These enrichment cultures were grown in their respective bioreactors.
The method involved growing the cultures in in a mineral solution media containing
dodecane as the sole carbon source. Each bioreactor had 100ml of solution (95ml of
mineral solution and 5ml of dodecane). The experiment was performed in ten replicates,
five of which had 0.5g of soil added to it, and the other five serving as the control
experiment had no sand added to them. The control experiment was to serve as the basis
for comparison with the soil sample experiments so as to be able to draw a valid
conclusion on the rate of biodegradation experienced in the soil sample experiments. In
order to ensure maximum contact between the hydrocarbon, media and microorganisms,
all the cultures were incubated with continuous agitation in sealed bioreactors containing
a magnetic stirring bar. Samples were taken from the rotary shaker at pre-determined
intervals and analysed using a gas chromatograph.
3.4.4 SAMPLE ANALYSIS
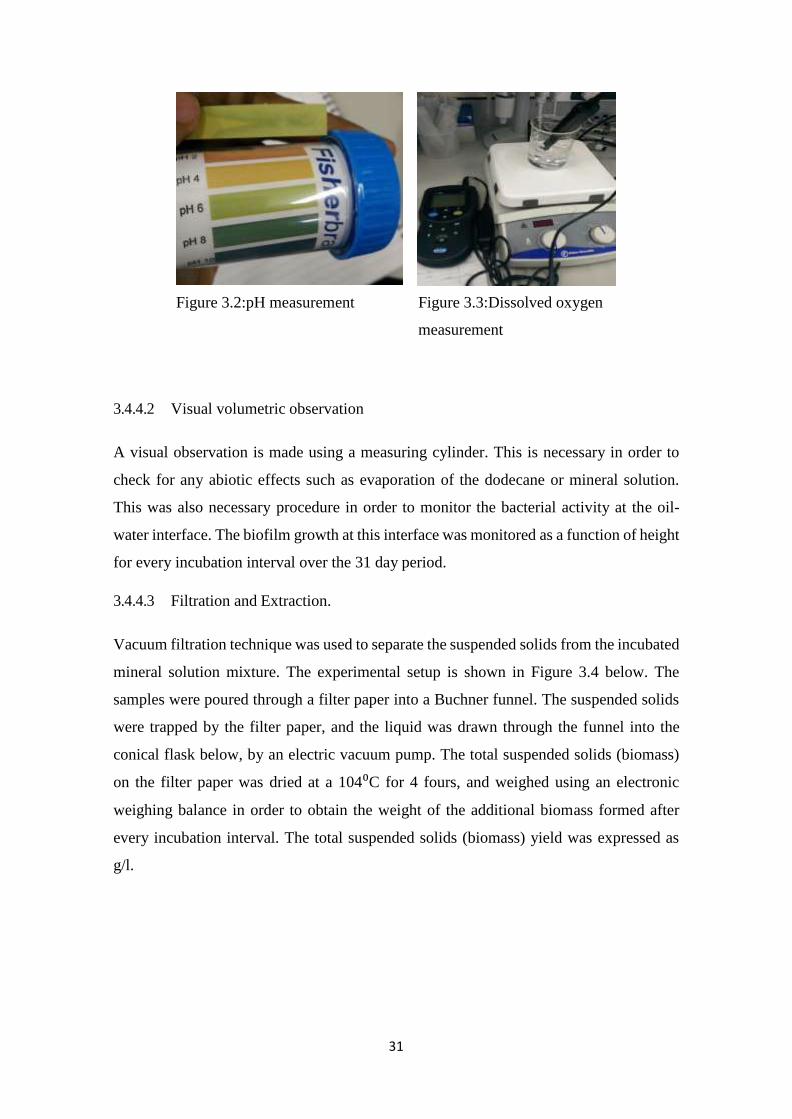
3.4.4.1 pH and Dissolved oxygen measurement
After every incubation interval, the content of the bioreactors to be analysed were
transferred to a clean beaker, and the pH and dissolved oxygen in the samples were
measured using litmus paper and dissolved oxygen meter respectively.
31
Figure 3.2:pH measurement Figure 3.3:Dissolved oxygen
measurement
3.4.4.2 Visual volumetric observation
A visual observation is made using a measuring cylinder. This is necessary in order to
check for any abiotic effects such as evaporation of the dodecane or mineral solution.
This was also necessary procedure in order to monitor the bacterial activity at the oil-
water interface. The biofilm growth at this interface was monitored as a function of height
for every incubation interval over the 31 day period.
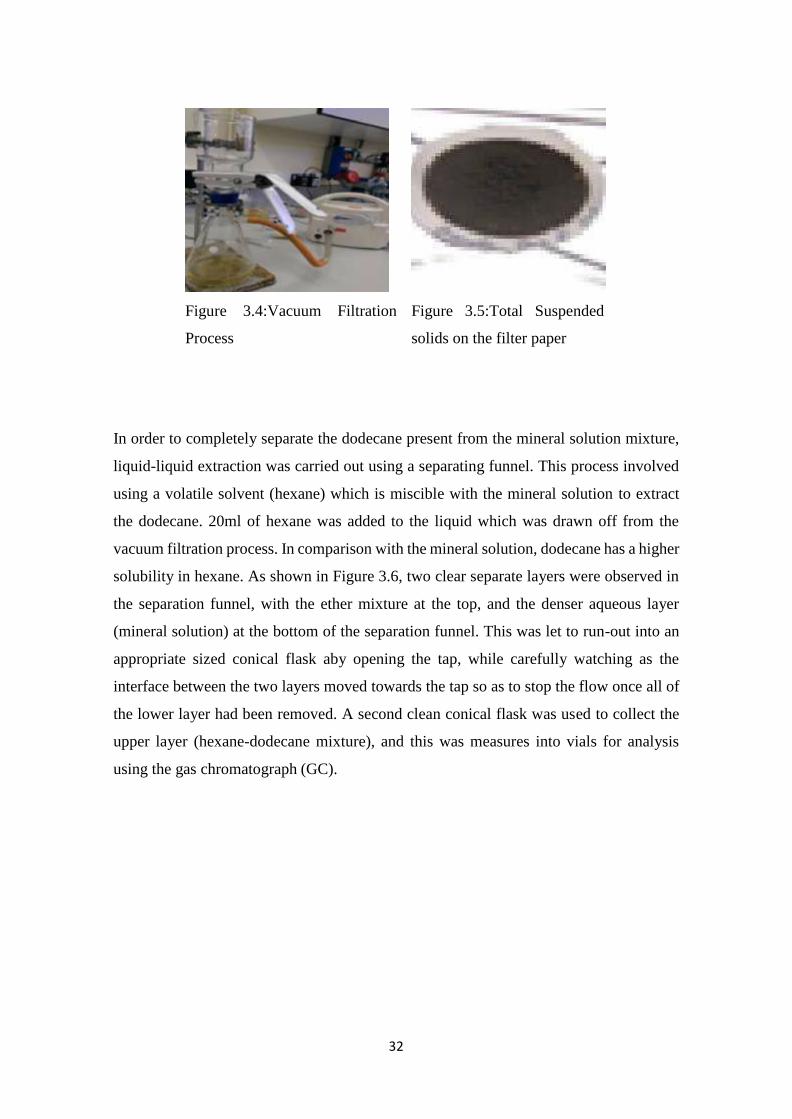
3.4.4.3 Filtration and Extraction.
Vacuum filtration technique was used to separate the suspended solids from the incubated
mineral solution mixture. The experimental setup is shown in Figure 3.4 below. The
samples were poured through a filter paper into a Buchner funnel. The suspended solids
were trapped by the filter paper, and the liquid was drawn through the funnel into the
conical flask below, by an electric vacuum pump. The total suspended solids (biomass)
on the filter paper was dried at a 104⁰C for 4 fours, and weighed using an electronic
weighing balance in order to obtain the weight of the additional biomass formed after
every incubation interval. The total suspended solids (biomass) yield was expressed as
g/l.
32
Figure 3.4:Vacuum Filtration
Process
Figure 3.5:Total Suspended
solids on the filter paper
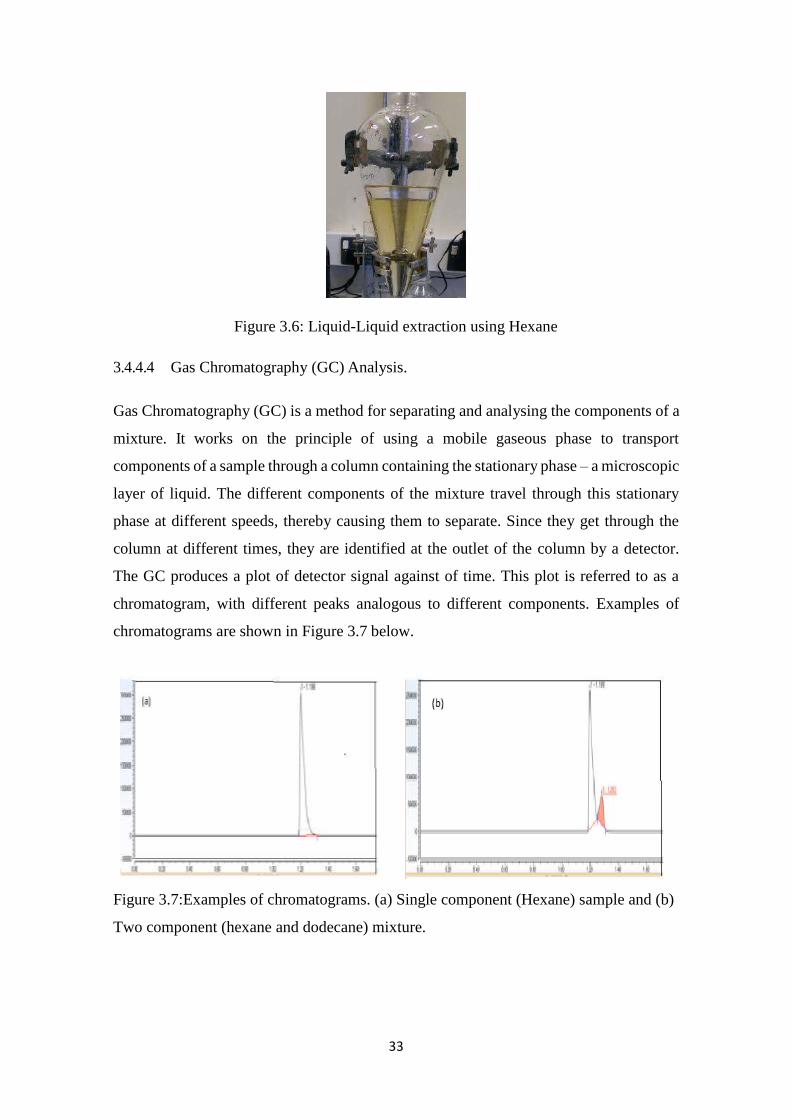
In order to completely separate the dodecane present from the mineral solution mixture,
liquid-liquid extraction was carried out using a separating funnel. This process involved
using a volatile solvent (hexane) which is miscible with the mineral solution to extract
the dodecane. 20ml of hexane was added to the liquid which was drawn off from the
vacuum filtration process. In comparison with the mineral solution, dodecane has a higher
solubility in hexane. As shown in Figure 3.6, two clear separate layers were observed in
the separation funnel, with the ether mixture at the top, and the denser aqueous layer
(mineral solution) at the bottom of the separation funnel. This was let to run-out into an
appropriate sized conical flask aby opening the tap, while carefully watching as the
interface between the two layers moved towards the tap so as to stop the flow once all of
the lower layer had been removed. A second clean conical flask was used to collect the
upper layer (hexane-dodecane mixture), and this was measures into vials for analysis
using the gas chromatograph (GC).
33
Figure 3.6: Liquid-Liquid extraction using Hexane
3.4.4.4 Gas Chromatography (GC) Analysis.
Gas Chromatography (GC) is a method for separating and analysing the components of a
mixture. It works on the principle of using a mobile gaseous phase to transport
components of a sample through a column containing the stationary phase – a microscopic
layer of liquid. The different components of the mixture travel through this stationary
phase at different speeds, thereby causing them to separate. Since they get through the
column at different times, they are identified at the outlet of the column by a detector.
The GC produces a plot of detector signal against of time. This plot is referred to as a
chromatogram, with different peaks analogous to different components. Examples of
chromatograms are shown in Figure 3.7 below.
Figure 3.7:Examples of chromatograms. (a) Single component (Hexane) sample and (b)
Two component (hexane and dodecane) mixture.

34
The GC profile of dodecane was monitored before and after incubation in the presence of
microbes. Microbial growth was predicted only when changes in the profile were
observed. The experimental protocol used in this analysis is as described below:
Calibration of GC.
Before analysing the composition of the samples, it was essential to carry out the
following:
1. Identify the retention time for each of the components to be analysed.
2. Generate a calibration curve, i.e. a curve which shows the relationship between
the peak areas on the chromatograms and the composition of the mixtures. The
calibration curve generated was then used to analyse the samples.
In order to complete the first task, GC analysis was performed for pure components
(hexane and dodecane). Each of these chromatograms contain only one large peak, with
the retention time described as the time at which these peaks were observed. Identifying
the retention times for hexane and dodecane was necessary in order to be successfully
identify these components in the mixture. Figure 3.8 shows a chromatogram of the toe-
component mixture. Knowing the retention times reveals that the first and second peaks
are hexane and dodecane respectively.
A calibration was generated by performing GC analysis of samples of known
concentrations. The concentrations used for the calibration are 20g/l, 50g/l, 100g/l, 200g/l
and 400g/l. An example of calibration curve plotted is shown in Figure 3.8. Two GC runs
were performed for each concentration. The peak areas obtained yielded high
reproducibility, hence the error bars in this experiment are reduced to a minimum.

35
Figure 3.8: Example of Calibration curve. The line indicates results of a least squares fit
to the experimental data.
6000
5000
4000
3000
2000
1000
0
y = 13.72x R² = 0.9933
0 50 100 150 200 250 300 350 400 450
Dodecane in Hexane (g/l)
Pea
k A
rea
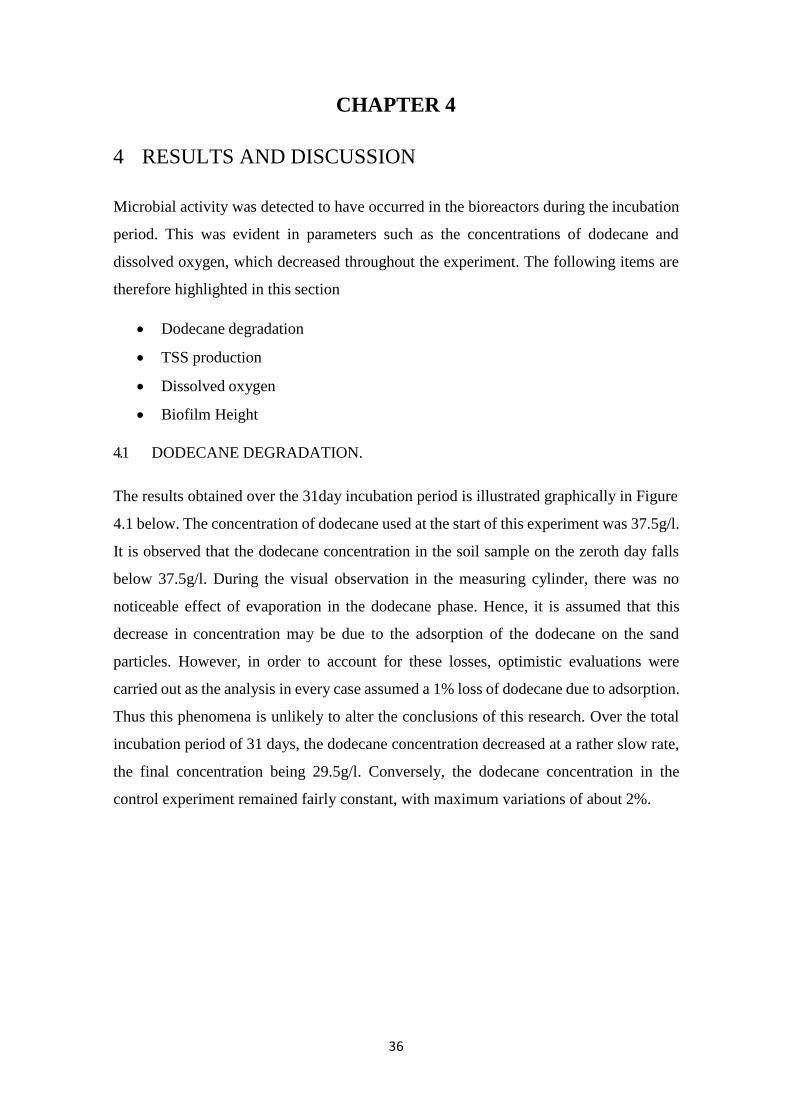
36
CHAPTER 4
4 RESULTS AND DISCUSSION
Microbial activity was detected to have occurred in the bioreactors during the incubation
period. This was evident in parameters such as the concentrations of dodecane and
dissolved oxygen, which decreased throughout the experiment. The following items are
therefore highlighted in this section
Dodecane degradation
TSS production
Dissolved oxygen
Biofilm Height
4.1 DODECANE DEGRADATION.
The results obtained over the 31day incubation period is illustrated graphically in Figure
4.1 below. The concentration of dodecane used at the start of this experiment was 37.5g/l.
It is observed that the dodecane concentration in the soil sample on the zeroth day falls
below 37.5g/l. During the visual observation in the measuring cylinder, there was no
noticeable effect of evaporation in the dodecane phase. Hence, it is assumed that this
decrease in concentration may be due to the adsorption of the dodecane on the sand
particles. However, in order to account for these losses, optimistic evaluations were
carried out as the analysis in every case assumed a 1% loss of dodecane due to adsorption.
Thus this phenomena is unlikely to alter the conclusions of this research. Over the total
incubation period of 31 days, the dodecane concentration decreased at a rather slow rate,
the final concentration being 29.5g/l. Conversely, the dodecane concentration in the
control experiment remained fairly constant, with maximum variations of about 2%.
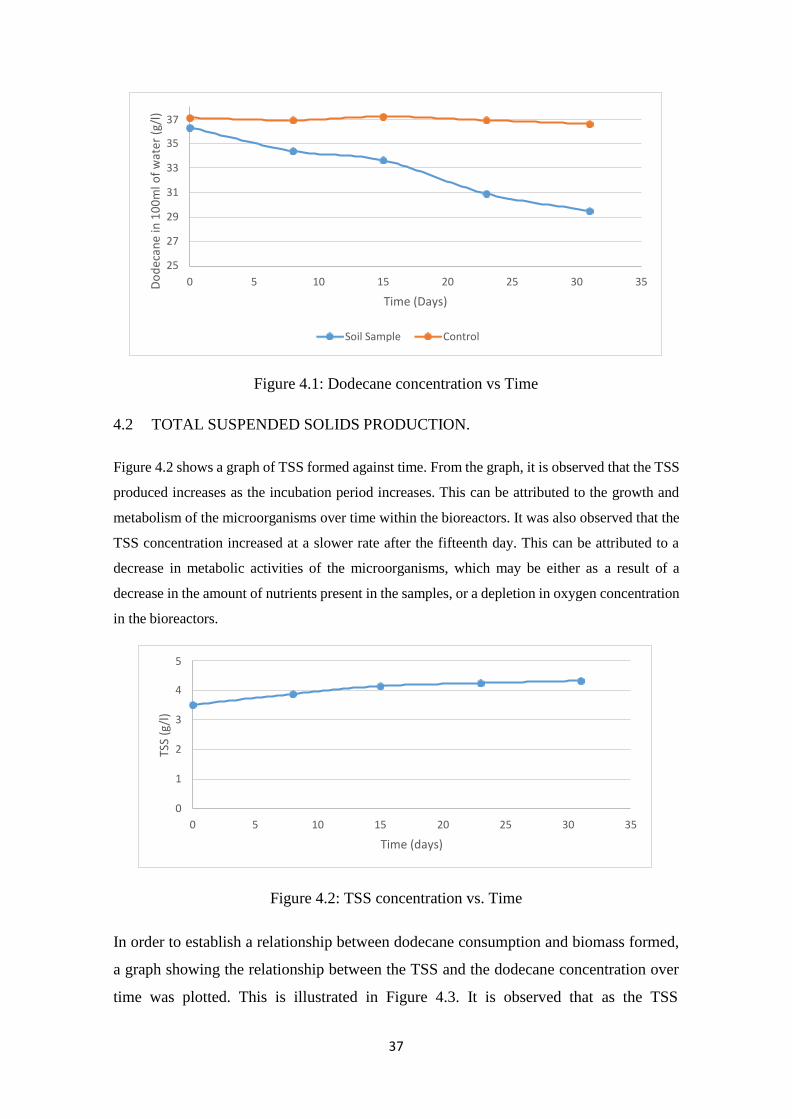
37
Figure 4.1: Dodecane concentration vs Time
4.2 TOTAL SUSPENDED SOLIDS PRODUCTION.
Figure 4.2 shows a graph of TSS formed against time. From the graph, it is observed that the TSS
produced increases as the incubation period increases. This can be attributed to the growth and
metabolism of the microorganisms over time within the bioreactors. It was also observed that the
TSS concentration increased at a slower rate after the fifteenth day. This can be attributed to a
decrease in metabolic activities of the microorganisms, which may be either as a result of a
decrease in the amount of nutrients present in the samples, or a depletion in oxygen concentration
in the bioreactors.
Figure 4.2: TSS concentration vs. Time
In order to establish a relationship between dodecane consumption and biomass formed,
a graph showing the relationship between the TSS and the dodecane concentration over
time was plotted. This is illustrated in Figure 4.3. It is observed that as the TSS
37
35
33
31
29
27
25
0 5 10 15 20 25 30 35
Time (Days)
Soil Sample Control
Do
dec
ane
in 1
00
ml o
f w
ater
(g/
l)
5
4
3
2
1
0
0 5 10 15 20 25 30 35
Time (days)
TSS
(g/l
)
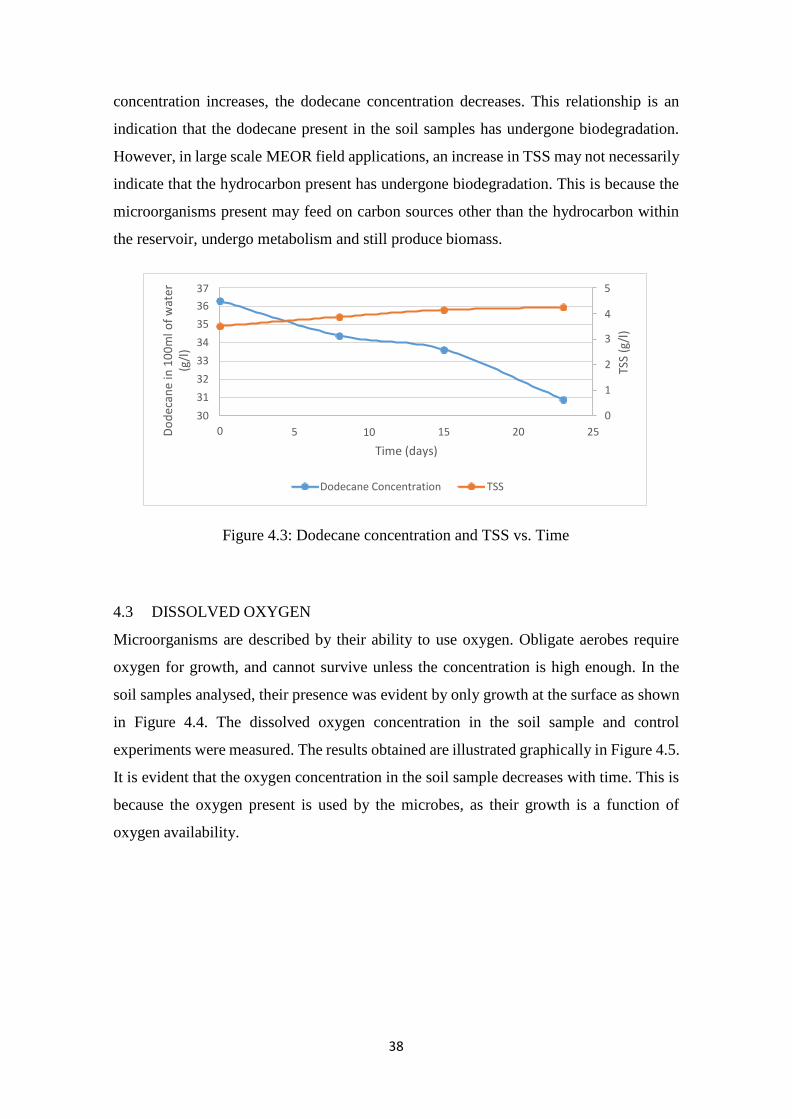
38
concentration increases, the dodecane concentration decreases. This relationship is an
indication that the dodecane present in the soil samples has undergone biodegradation.
However, in large scale MEOR field applications, an increase in TSS may not necessarily
indicate that the hydrocarbon present has undergone biodegradation. This is because the
microorganisms present may feed on carbon sources other than the hydrocarbon within
the reservoir, undergo metabolism and still produce biomass.
Figure 4.3: Dodecane concentration and TSS vs. Time
4.3 DISSOLVED OXYGEN
Microorganisms are described by their ability to use oxygen. Obligate aerobes require
oxygen for growth, and cannot survive unless the concentration is high enough. In the
soil samples analysed, their presence was evident by only growth at the surface as shown
in Figure 4.4. The dissolved oxygen concentration in the soil sample and control
experiments were measured. The results obtained are illustrated graphically in Figure 4.5.
It is evident that the oxygen concentration in the soil sample decreases with time. This is
because the oxygen present is used by the microbes, as their growth is a function of
oxygen availability.
37
36
35
34
33
32
31
30
5
4
3
2
1
0
0 5 10
Time (days)
15 20 25
Dodecane Concentration TSS
Do
dec
ane
in 1
00
ml o
f w
ater
(g
/l)
TSS
(g/l
)
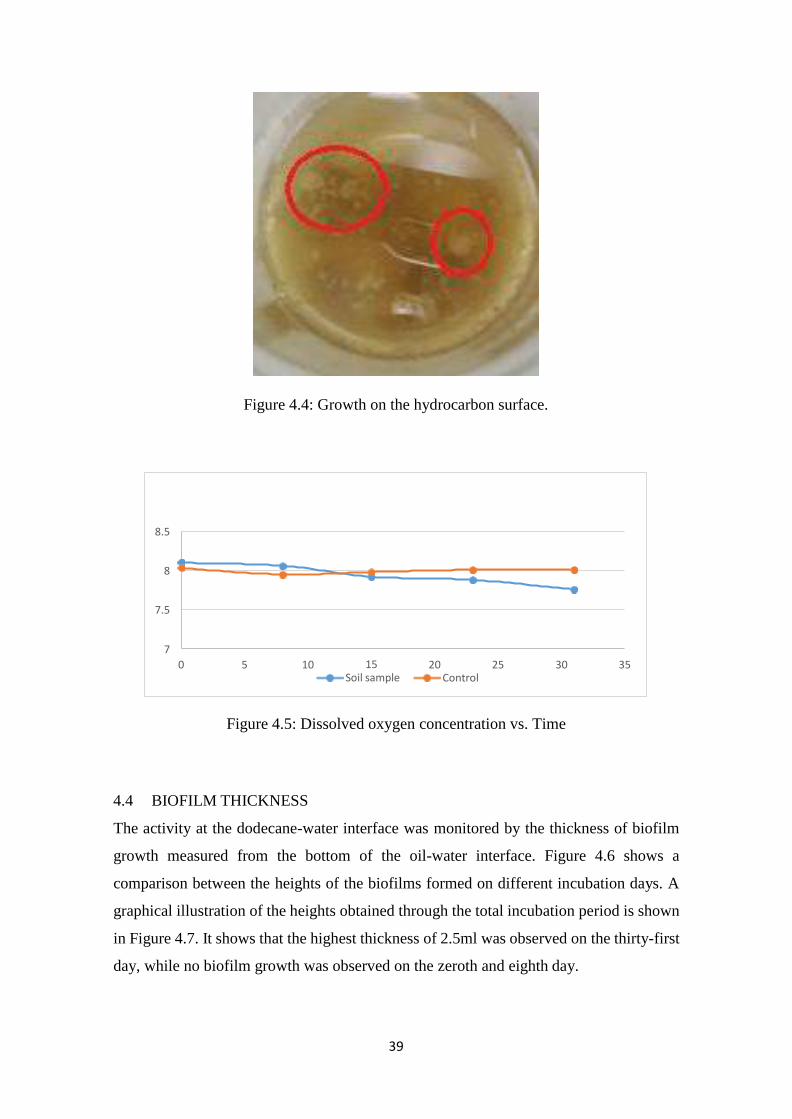
39
Figure 4.4: Growth on the hydrocarbon surface.
Figure 4.5: Dissolved oxygen concentration vs. Time
4.4 BIOFILM THICKNESS
The activity at the dodecane-water interface was monitored by the thickness of biofilm
growth measured from the bottom of the oil-water interface. Figure 4.6 shows a
comparison between the heights of the biofilms formed on different incubation days. A
graphical illustration of the heights obtained through the total incubation period is shown
in Figure 4.7. It shows that the highest thickness of 2.5ml was observed on the thirty-first
day, while no biofilm growth was observed on the zeroth and eighth day.
8.5
8
7.5
7
0 5 10 15 Soil sample
20 25 30 35 Control
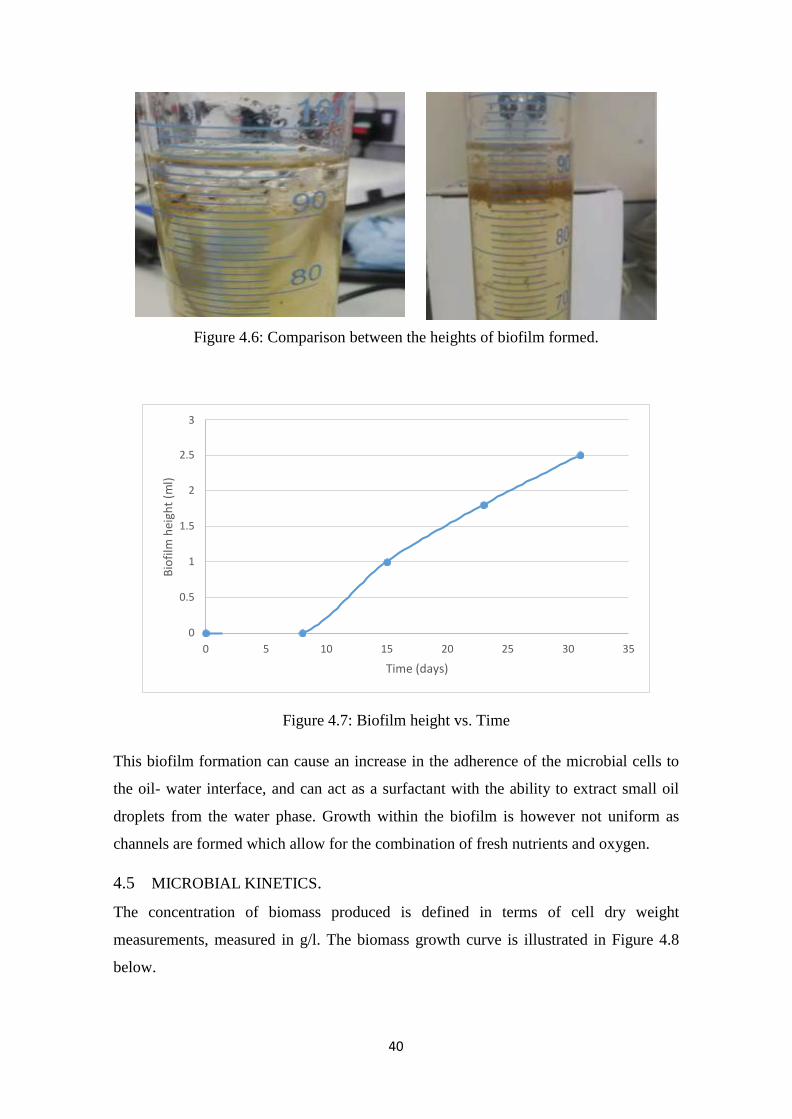
40
Figure 4.6: Comparison between the heights of biofilm formed.
Figure 4.7: Biofilm height vs. Time
This biofilm formation can cause an increase in the adherence of the microbial cells to
the oil- water interface, and can act as a surfactant with the ability to extract small oil
droplets from the water phase. Growth within the biofilm is however not uniform as
channels are formed which allow for the combination of fresh nutrients and oxygen.
4.5 MICROBIAL KINETICS.
The concentration of biomass produced is defined in terms of cell dry weight
measurements, measured in g/l. The biomass growth curve is illustrated in Figure 4.8
below.
3
2.5
2
1.5
1
0.5
0
0 5 10 15 20 25 30 35
Time (days)
Bio
film
hei
ght
(ml)
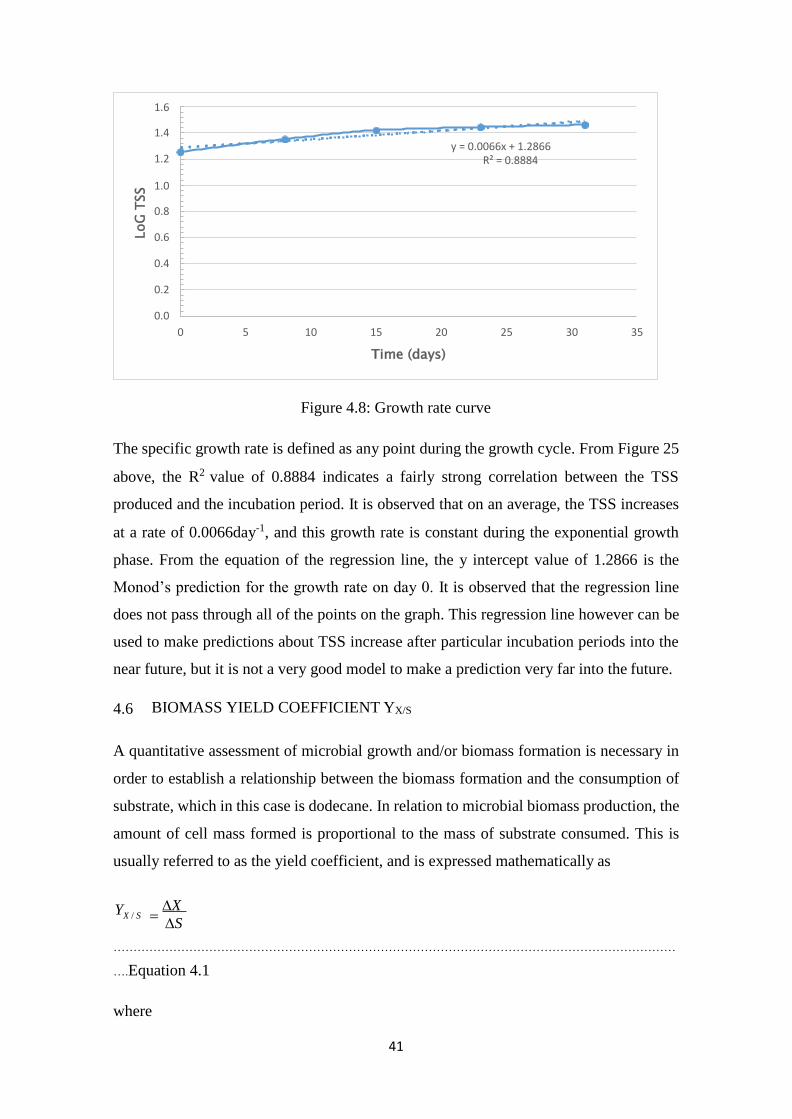
41
Figure 4.8: Growth rate curve
The specific growth rate is defined as any point during the growth cycle. From Figure 25
above, the R2 value of 0.8884 indicates a fairly strong correlation between the TSS
produced and the incubation period. It is observed that on an average, the TSS increases
at a rate of 0.0066day-1, and this growth rate is constant during the exponential growth
phase. From the equation of the regression line, the y intercept value of 1.2866 is the
Monod’s prediction for the growth rate on day 0. It is observed that the regression line
does not pass through all of the points on the graph. This regression line however can be
used to make predictions about TSS increase after particular incubation periods into the
near future, but it is not a very good model to make a prediction very far into the future.
4.6 BIOMASS YIELD COEFFICIENT YX/S
A quantitative assessment of microbial growth and/or biomass formation is necessary in
order to establish a relationship between the biomass formation and the consumption of
substrate, which in this case is dodecane. In relation to microbial biomass production, the
amount of cell mass formed is proportional to the mass of substrate consumed. This is
usually referred to as the yield coefficient, and is expressed mathematically as
YX / S
X
S
……………………………………………………………………………………………………………………………
….Equation 4.1
where
1.6
1.4
1.2 y = 0.0066x + 1.2866
R² = 0.8884
1.0
0.8
0.6
0.4
0.2
0.0
0 5 10 15 20 25 30 35
Time (days)
LoG
TSS
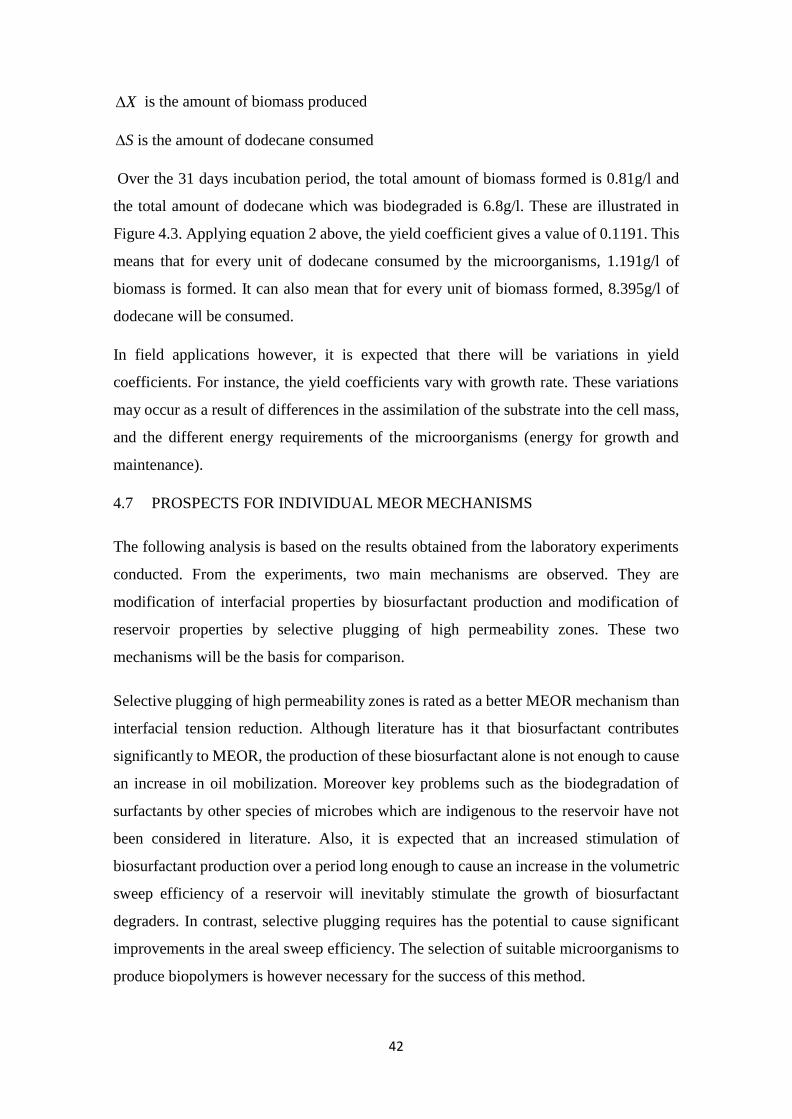
42
X is the amount of biomass produced
S is the amount of dodecane consumed
Over the 31 days incubation period, the total amount of biomass formed is 0.81g/l and
the total amount of dodecane which was biodegraded is 6.8g/l. These are illustrated in
Figure 4.3. Applying equation 2 above, the yield coefficient gives a value of 0.1191. This
means that for every unit of dodecane consumed by the microorganisms, 1.191g/l of
biomass is formed. It can also mean that for every unit of biomass formed, 8.395g/l of
dodecane will be consumed.
In field applications however, it is expected that there will be variations in yield
coefficients. For instance, the yield coefficients vary with growth rate. These variations
may occur as a result of differences in the assimilation of the substrate into the cell mass,
and the different energy requirements of the microorganisms (energy for growth and
maintenance).
4.7 PROSPECTS FOR INDIVIDUAL MEOR MECHANISMS
The following analysis is based on the results obtained from the laboratory experiments
conducted. From the experiments, two main mechanisms are observed. They are
modification of interfacial properties by biosurfactant production and modification of
reservoir properties by selective plugging of high permeability zones. These two
mechanisms will be the basis for comparison.
Selective plugging of high permeability zones is rated as a better MEOR mechanism than
interfacial tension reduction. Although literature has it that biosurfactant contributes
significantly to MEOR, the production of these biosurfactant alone is not enough to cause
an increase in oil mobilization. Moreover key problems such as the biodegradation of
surfactants by other species of microbes which are indigenous to the reservoir have not
been considered in literature. Also, it is expected that an increased stimulation of
biosurfactant production over a period long enough to cause an increase in the volumetric
sweep efficiency of a reservoir will inevitably stimulate the growth of biosurfactant
degraders. In contrast, selective plugging requires has the potential to cause significant
improvements in the areal sweep efficiency. The selection of suitable microorganisms to
produce biopolymers is however necessary for the success of this method.
43
CHAPTER 5
5 CONCLUSION AND RECOMMENDATIONS
MEOR is an eco-friendly, cost effective and highly attractive process which has diverse
advantages and great potential over other EOR chemical methods. However, there are
uncertainties in attaining the engineering design criteria for microbial processes
application, and this has resulted to its low acceptance in the petroleum industry.
The results obtained from the laboratory experiments indicate that dodecane is
biodegradable under aerobic conditions. Based on the observations, the prominent
recovery mechanism is selective plugging Thus in relation to oilfields, biodegradation has
a potential to be useful for MEOR if the crude oil present in the reservoir is used as the
sole carbon source. However, the growth rate value calculated from the results obtained
is not applicable in large scale oilfields. To overcome this limitation, it is recommended
that further laboratory research with specific reservoir conditions be carried out, after
which experiments must. Be carried out in the actual oil fields. Provisions should also be
made in the laboratory for the identification of the bioproducts formed. This will enable
allow for a better comparison of the oil recovery mechanisms.
44
REFERENCES
[1] Stosur, G.J., (2003). EOR: Past present and what the next 25 years may bring, SPE
International Improved Oil Recovery Conference in Asia Pacific,
[2] Stosur, G.J., Hite, J.R., Carnahan, N.F. and Miller, K., (2003). The alphabet soup of
IOR EOR and AOR: Effective communication requires a definition of terms, SPE
International Improved Oil Recovery Conference in Asia Pacific,
[3] Brown, L.R., (2010). Microbial enhanced oil recovery (MEOR), Current Opinion in
Microbiology, 13 (3), pp.316-320.
[4] Ollivier, B. and Magot, M., (2005). Petroleum Microbiology. ASM Press.
[5] Teigland, R. and Kleppe, J., (2006). EOR survey in the north sea, SPE/DOE
Symposium on Improved Oil Recovery,
[6] Wilkinson, J.R., Teletzke, G.F. and King, K.C., (2006). Opportunities and challenges
for enhanced recovery in the middle east, Abu Dhabi International Petroleum
Exhibition and Conference,
[7] Li, Q., Kang, C., Wang, H., Liu, C. and Zhang, C., (2002). Application of microbial
enhanced oil recovery technique to Daqing Oilfield, Biochemical Engineering
Journal, 11 (2–3), pp.197-199.
[8] Claridge, E., (1972). Prediction of recovery in unstable miscible flooding, Society of
Petroleum Engineers Journal, 12 (02), pp.143-155.
[9] Hagoort, J., (1980). Oil recovery by gravity drainage, Society of Petroleum Engineers
Journal, 20 (03), pp.139-150.
[10] Behrenbruch, P. and Mason, L., (1993). Optimal oilfield development of fields with
a small gas cap and strong aquifer, SPE Asia Pacific Oil and Gas Conference,
[11] Delshad, M., Asakawa, K., Pope, G.A. and Sepehrnoori, K., (2002). Simulations of
chemical and microbial enhanced oil recovery methods, SPE/DOE Improved Oil
Recovery Symposium,
45
[12] Brown, L., Vadie, A. and Stephens, J., (2002). Slowing production decline and
extending the economic life of an oil field: new MEOR technology, SPE Reservoir
Evaluation & Engineering, 5 (01), pp.33-41.
[13] Zitha, P., Felder, R., Zornes, D., Brown, K. and Mohanty, K., (2011). Increasing
Hydrocarbon Recovery Factors, SPE Technol.Updates,
[14] Manrique, E.J., Thomas, C.P., Ravikiran, R., Izadi Kamouei, M., Lantz, M., Romero,
J.L. and Alvarado, V., (2010). EOR: Current status and opportunities, SPE Improved
Oil Recovery Symposium,
[15] McGuire, P., Spence, A., Stalkup, F. and Cooley, M., (1995). Core acquisition and
analysis for optimization of the Prudhoe Bay miscible-gas project, SPE Reservoir
Engineering, 10 (02), pp.94-100.
[16] Alvarado, V. and Manrique, E., (2010). Enhanced oil recovery: an update
review, Energies, 3 (9), pp.1529-1575.
[17] Stalkup, F., (1978). Carbon Dioxide Miscible Flooding: Past Present And Outlook
for the Future, Journal of Petroleum Technology, 30 (08), pp.1,102-1,112.
[18] Stone, P., Steinberg, B. and Goodson, J., (1989). Completion Design for Waterfloods
and CO2 Floods, SPE Production Engineering, 4 (04), pp.365-370.
[19] Awan, A.R., Teigland, R. and Kleppe, J., (2008). A survey of North Sea enhanced-
oil-recovery projects initiated during the years 1975 to 2005, SPE Reservoir
Evaluation & Engineering, 11 (03), pp.497-512.
[20] McGuire, P., Spence, A. and Redman, R., (2000). Performance evaluation of a
mature miscible-gas flood at Prudhoe bay, Journal of Petroleum Technology, 52
(11), pp.64-66.
[21] Waggoner, J., Castillo, J. and Lake, L.W., (1992). Simulation of EOR processes in
stochastically generated permeable media, SPE Formation Evaluation, 7 (02),
pp.173-180.
46
[22] Araktingi, U.G. and Orr Jr, F., (1993). Viscous fingering in heterogeneous porous
media, SPE Advanced Technology Series, 1 (01), pp.71-80.
[23] Fayers, F.J. and Muggeridge, A.H., (1990). Extensions to Dietz theory and behavior
of gravity tongues in slightly tilted reservoirs, SPE Reservoir Engineering, 5 (4),
pp.487-494.
[24] Homsy, G.M., (1987). Viscous fingering in porous media, Annual Review of Fluid
Mechanics, 19 (1), pp.271-311.
[25] Christie, M. and Bond, D., (1987). Detailed simulation of unstable processes in
miscible flooding, SPE Reservoir Engineering, 2 (04), pp.514-522.
[26] Muggeridge, A., Cockin, A., Webb, K., Frampton, H., Collins, I., Moulds, T. and
Salino, P., (2013). Recovery rates, enhanced oil recovery and technological
limits, Philosophical Transactions.Series A, Mathematical, Physical, and
Engineering Sciences, 372 (2006), pp.20120320.
[27] Jelmert, T.A., Chang, N., Høier, L., Pwaga, S., Iluore, C., Hundseth, Ø, Perales, F.J.
and Idrees, M.U., (2010). Comparative Study of Different EOR
Methods, Norwegian University of Science & Technology, Trondheim, Norway,
[28] Rashedi, H., Yazdian, F. and Naghizadeh, S., (2012). Microbial Enhanced Oil
Recovery, Introduction to Enhanced Oil Recovery (EOR) Processes and
Bioremediation of Oil-Contaminated Sites (Ed.Romero-Zerón L), pp.71-88.
[29] Bryant, R.S. and Lindsey, R.P., (1996). World-wide applications of microbial
technology for improving oil recovery, SPE/DOE Improved Oil Recovery
Symposium,
[30] Brown, F., (1992). Microbes: The practical and environmental safe solution to
production problems enhanced production and enhanced oil recovery, Permian Basin
Oil and Gas Recovery Conference,
[31] Sen, R., (2008). Biotechnology in petroleum recovery: the microbial EOR, Progress
in Energy and Combustion Science, 34 (6), pp.714-724.
47
[32] Brown, L.R., (2010). Microbial enhanced oil recovery (MEOR), Current Opinion in
Microbiology, 13 (3), pp.316-320.
[33] Lazar, I., Petrisor, I. and Yen, T., (2007). Microbial enhanced oil recovery
(MEOR), Petroleum Science and Technology, 25 (11), pp.1353-1366.
[34] Kaster, K.M., Hiorth, A., Kjeilen-Eilertsen, G., Boccadoro, K., Lohne, A., Berland,
H., Stavland, A. and Brakstad, O.G., (2012). Mechanisms involved in microbially
enhanced oil recovery, Transport in Porous Media, 91 (1), pp.59-79.
[35] Al-Sulaimani, H., Joshi, S., Al-Wahaibi, Y., Al-Bahry, S., Elshafie, A. and Al-
Bemani, A., (2011). Microbial biotechnology for enhancing oil recovery: current
developments and future prospects, Biotechnol.Bioinf.Bioeng, 1 pp.147-158.
[36] Fujiwara, K., Sugai, Y., Yazawa, N., Ohno, K., Hong, C. and Enomoto, H., (2004).
Biotechnological approach for development of microbial enhanced oil recovery
technique, Studies in Surface Science and Catalysis, 151 pp.405-445.
[37] Lazar, I., Petrisor, I. and Yen, T., (2007). Microbial enhanced oil recovery
(MEOR), Petroleum Science and Technology, 25 (11), pp.1353-1366.
[38] Shestakova, N., Korshunova, A., Mikhailova, E., Sokolova, D.S., Tourova, T.,
Belyaev, S., Poltaraus, A. and Nazina, T., (2011). Characterization of the aerobic
hydrocarbon-oxidizing enrichments from a high-temperature petroleum reservoir by
comparative analysis of DNA-and RNA-derived clone libraries, Microbiology, 80
(1), pp.60-69.
[39] Lazar, I., (1991). Ch. A-1 MEOR Field Trials Carried Out Over the World During
the Last 35 Years, Developments in Petroleum Science, 31 pp.485-530.
[40] McInerney, M. and Sublette, K., (1997). Petroleum microbiology: biofouling,
souring and improved oil recovery, Manual of Environmental Microbiology,
pp.600-607.
[41] Jack, T., (1993). MORE to MEOR: an overview of microbially enhanced oil
recovery, Developments in Petroleum Science, 39 pp.7-16.
48
[42] Sheehy, A., (1991). Ch. R-1 Microbial Physiology and Enhanced Oil
Recovery, Developments in Petroleum Science, 31 pp.37-44.
[43] Kropp, K.G., Davidova, I.A. and Suflita, J.M., (2000). Anaerobic oxidation of n-
dodecane by an addition reaction in a sulfate-reducing bacterial enrichment
culture, Applied and Environmental Microbiology, 66 (12), pp.5393-5398.
[44] Maudgalya, S., Knapp, R.M., McInerney, M.J., Folmsbee, M. and Nagle, D.P.,
(2005). Tertiary oil recovery with microbial biosurfactant treatment of low-
permeability berea sandstone cores, SPE Production Operations Symposium,
[45] Marshall, S.L., (2008). Fundamental aspects of microbial enhanced oil recovery: A
Literature Survey,
[46] Monod, J., (1949). The growth of bacterial cultures, Annual Reviews in
Microbiology, 3 (1), pp.371-394.
[47] Al-Wahaibi, Y., Grattoni, C. and Muggeridge, A., (2006). Drainage and imbibition
relative permeabilities at near miscible conditions, Journal of Petroleum Science and
Engineering, 53 (3), pp.239-253.
[48] Nielsen, S.M., Shapiro, A.A., Michelsen, M.L. and Stenby, E.H., (2010). 1D
simulations for microbial enhanced oil recovery with metabolite
partitioning, Transport in Porous Media, 85 (3), pp.785-802.
[49] Chang, M., Chung, F., Bryant, R., Gao, H.W. and Burchfield, T., (1991). Modeling
and laboratory investigation of microbial transport phenomena in porous media, SPE
Annual Technical Conference and Exhibition,
[50] Islam, M., (1990). Mathematical modeling of microbial enhanced oil recovery, SPE
Annual Technical Conference and Exhibition,
[51] Bryant, S.L. and Lockhart, T.P., (2002). Reservoir engineering analysis of microbial
enhanced oil recovery, SPE Reservoir Evaluation & Engineering, 5 (05), pp.365-
374.
49
[52] Marchant, R. and Banat, I.M., (2012). Microbial biosurfactants: challenges and
opportunities for future exploitation, Trends in Biotechnology, 30 (11), pp.558-565.
[53] Raiders, R., Freeman, D., Jenneman, G., Knapp, R., McInerney, M. and Menzie, D.,
(1985). The use of microorganisms to increase the recovery of oil from cores, SPE
Annual Technical Conference and Exhibition,
[54] Gray, M., Yeung, A., Foght, J. and Yarranton, H.W., (2008). Potential microbial
enhanced oil recovery processes: A critical analysis, SPE Annual Technical
Conference and Exhibition,
[55] Chisholm, J., Kashikar, S., Knapp, R., Mclnerney, M., Menzies, D. and Silfanus, N.,
(1990). Microbial enhanced oil recovery: Interfacial tension and gas-induced
relative permeability effects, SPE Annual Technical Conference and Exhibition,
[56] Desouky, S., Abdel-Daim, M., Sayyouh, M. and Dahab, A., (1996). Modelling and
laboratory investigation of microbial enhanced oil recovery, Journal of Petroleum
Science and Engineering, 15 (2), pp.309-320.
[57] Lake, L.W. and Venuto, P.B., (1990). A niche for enhanced oil recovery in the
1990s, Oil & Gas Journal, 88 (17), pp.62-67.
[58] Brown, M.J., Moses, V., Robinson, J., Springham, D. and Bubela, B., (1985).
Microbial enhanced oil recovery: progress and prospects, Critical Reviews in
Biotechnology, 3 (2), pp.159-197.
[59] Torbati, H., Raiders, R., Donaldson, E., McInerney, M., Jenneman, G. and Knapp,
R., (1986). Effect of microbial growth on pore entrance size distribution in sandstone
cores, Journal of Industrial Microbiology, 1 (4), pp.227-234.
[60] Jenneman, G., Moffitt, P. and Young, G., (1996). Application of a microbial
selective-plugging process at the North Burbank unit: prepilot tests, SPE Production
& Facilities, 11 (01), pp.11-17.
[61] Bordoloi, N. and Konwar, B., (2008). Microbial surfactant-enhanced mineral oil
recovery under laboratory conditions, Colloids and Surfaces B: Biointerfaces, 63
(1), pp.73-82.
50
[62] Raiders, R.A., Knapp, R.M. and McInerney, M.J., (1989). Microbial selective
plugging and enhanced oil recovery, Journal of Industrial Microbiology, 4 (3),
pp.215-229.
[63] ZOBELL, C.E. and COBET, A.B., (1964). Filament Formation by Escherichia Coli
at Increased Hydrostatic Pressures, Journal of Bacteriology, 87 pp.710-719.
[64] Gregory, A.T., (1984). Fundamentals of microbial enhanced hydrocarbon recovery,
[65] Vermooten, J., Verweij, J. and Simmelink, H., (2004). Quality control, correction
and analysis of temperature borehole data in offshore Netherlands, Report A:
Quality Control and Correction of Temperature Borehole Data,
[66] Marquis, R.E., (1976). High-pressure microbial physiology, Adv.Microb.Physiol,
14 pp.159-241.
[67] Abe, F., (2007). Exploration of the effects of high hydrostatic pressure on microbial
growth, physiology and survival: perspectives from piezophysiology, Bioscience,
Biotechnology, and Biochemistry, 71 (10), pp.2347-2357.
[68] Szewzyk, U., Szewzyk, R. and Stenström, T., (1994). Thermophilic, anaerobic
bacteria isolated from a deep borehole in granite in Sweden. Proceedings of the
National Academy of Sciences, 91 (5), pp.1810-1813.
[69] Pelster, B. and Scheid, P., (1992). Countercurrent concentration and gas secretion in
the fish swim bladder, Physiological Zoology, pp.1-16.
[70] Whatmore, A.M. and Reed, R.H., (1990). Determination of turgor pressure in
Bacillus subtilis: a possible role for K+ in turgor regulation, Journal of General
Microbiology, 136 (12), pp.2521-2526.
[71] Bartlett, D., (2002). Pressure effects on in vivo microbial processes, Biochimica Et
Biophysica Acta (BBA)-Protein Structure and Molecular Enzymology, 1595 (1),
pp.367-381.
[72] Atkins, M.S., Teske, A.P. and Anderson, O.R., (2000). A Survey of Flagellate
Diversity at Four Deep‐Sea Hydrothermal Vents in the Eastern Pacific Ocean Using
51
Structural and Molecular Approaches, Journal of Eukaryotic Microbiology, 47 (4),
pp.400-411.
[73] Bryant, R.S. and Burchfield, T.E., (1989). Review of microbial technology for
improving oil recovery, SPE Reservoir Engineering, 4 (02), pp.151-154.
[74] Roberts, M.F., (2005). Organic compatible solutes of halotolerant and halophilic
microorganisms, Saline Systems, 1 (5), pp.1-30.
[75] Shibulal, B., Al-Bahry, S.N., Al-Wahaibi, Y.M., Elshafie, A.E., Al-Bemani, A.S.
and Joshi, S.J., (2014). Microbial Enhanced Heavy Oil Recovery by the Aid of
Inhabitant Spore-Forming Bacteria: An Insight Review, The Scientific World
Journal, 2014
[76] Updegraff, D.M., (1983). Plugging and penetration of petroleum reservoir rock by
microorganisms, Proceedings of the 1982 International Conference on Microbial
Enhancement of Oil Recovery, pp. 85.
[77] Fredrickson, J., McKinley, J., Bjornstad, B., Long, P., Ringelberg, D., White, D.,
Krumholz, L., Suflita, J., Colwell, F. and Lehman, R., (1997). Pore‐size constraints
on the activity and survival of subsurface bacteria in a late cretaceous shale‐
sandstone sequence, northwestern New Mexico, Geomicrobiology Journal, 14 (3),
pp.183-202.
[78] Cooper, D., Zajic, J., Gerson, D. and Manninen, K., (1980). Isolation and
identification of biosurfactants produced during anaerobic growth of Clostridium
pasteurianum, Journal of Fermentation Technology, 58 (1), pp.83-86.
[79] Bryant, R.S. and Lindsey, R.P., (1996). World-wide applications of microbial
technology for improving oil recovery, SPE/DOE Improved Oil Recovery
Symposium,
[80] Nelson, S.J. and Launt, P., (1991). Stripper well production increased with MEOR
treatment, Oil & Gas Journal, 89 (11),
52
[81] Brown, F., (1992). Microbes: The practical and environmental safe solution to
production problems enhanced production and enhanced oil recovery, Permian Basin
Oil and Gas Recovery Conference,
[82] Ivanov, M., Belyaev, S., Borzenkov, I., Glumov, I. and Ibatullin, R., (1993).
Additional oil production during field trials in Russia, Developments in Petroleum
Science, 39 pp.373-381.
[83] Rozanova, E., Borzenkov, I., Tarasov, A., Suntsova, L., Dong, C.L., Belyaev, S. and
Ivanov, M., (2001). Microbiological processes in a high-temperature oil
field, Microbiology, 70 (1), pp.102-110.
[84] Wang, X. and Donaldson, E., (1991). Advances in research, production and
application of hiopolymers used for EOR in China, Microbial Enhancement of Oil
Recovery-Recent Advances.Ed.by EC Donaldsomon, pp.467-481.
[85] Rashedi, H., Yazdian, F. and Naghizadeh, S., (2012). Microbial Enhanced Oil
Recovery, Introduction to Enhanced Oil Recovery (EOR) Processes and
Bioremediation of Oil-Contaminated Sites (Ed.Romero-Zerón L), pp.71-88.
[86] Lazar, I., Dobrota, S., Stefanescu, M., Sandulescu, L., Constantinescu, P., Morosanu,
C., Botea, N. and Iliescu, O., (1991). Ch. F-2 Preliminary Results of Some Recent
MEOR Field Trials in Romania, Developments in Petroleum Science, 31 pp.365-
385.
[87] Wagner, M., (1991). Ch. F-3 Microbial Enhancement of Oil Recovery from
Carbonate Reservoirs with Complex Formation Characteristics, Developments in
Petroleum Science, 31 pp.387-398.
53
APPENDICES
Appendix 1
CALCULATIONS USED IN PREPARATION OF SAMPLES FOR
CALIBRATION.
Density = mass
volume
Density of Dodecane=750g/l
Initial volume of Dodecane = 5ml = 0.005l
The mass of Dodecane equivalent to 0.005l is calculated using
Mass= density × volume
Mass = 750 × 0.005 = 3.75g
The concentration of Dodecane in 100ml of water is given as
Concentration = mass
total volume of water =
3.75 = 37.5g/l
0.1
Extraction was carried out using 20ml of hexane.
Concentration of Dodecane in 20ml of hexane = 3.75
= 187.5g/l 0.02
Appendix 2
CALIBRATION CALCULATIONS
In order to prepare the samples for the GC calibration. It was essential to determine the
volume of Dodecane present in 1ml of hexane.
For the first sample point 20g/l;
Concentration = mass
volume
Mass = concentration × volume = 20 × 0.02 = 0.4g
This implies that 20g/l of dodecane-hexane mixture contains 0.4g of dodecane.
The above calculation is repeated for subsequent sample points (50g/l, 100g/l, 200g/l, and
400g/l respectively).
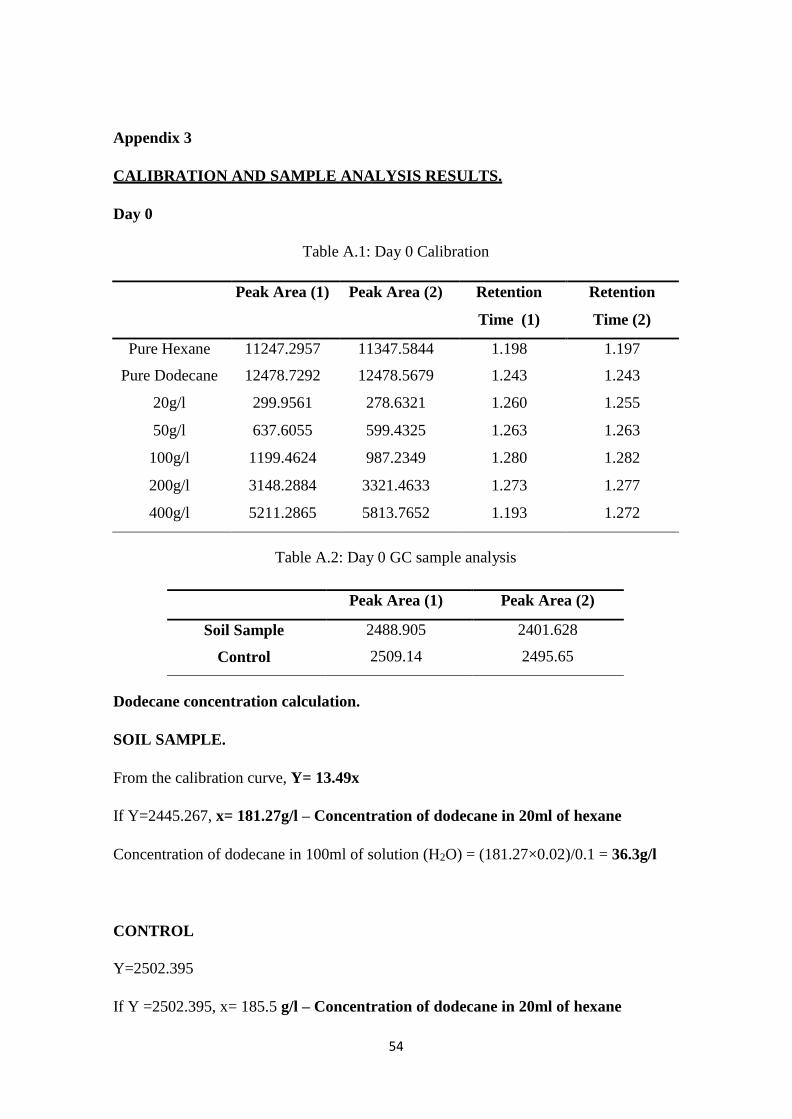
54
Appendix 3
CALIBRATION AND SAMPLE ANALYSIS RESULTS.
Day 0
Table A.1: Day 0 Calibration
Peak Area (1) Peak Area (2) Retention
Time (1)
Retention
Time (2)
Pure Hexane 11247.2957 11347.5844 1.198 1.197
Pure Dodecane 12478.7292 12478.5679 1.243 1.243
20g/l 299.9561 278.6321 1.260 1.255
50g/l 637.6055 599.4325 1.263 1.263
100g/l 1199.4624 987.2349 1.280 1.282
200g/l 3148.2884 3321.4633 1.273 1.277
400g/l 5211.2865 5813.7652 1.193 1.272
Table A.2: Day 0 GC sample analysis
Peak Area (1) Peak Area (2)
Soil Sample 2488.905 2401.628
Control 2509.14 2495.65
Dodecane concentration calculation.
SOIL SAMPLE.
From the calibration curve, Y= 13.49x
If Y=2445.267, x= 181.27g/l – Concentration of dodecane in 20ml of hexane
Concentration of dodecane in 100ml of solution (H2O) = (181.27×0.02)/0.1 = 36.3g/l
CONTROL
Y=2502.395
If Y =2502.395, x= 185.5 g/l – Concentration of dodecane in 20ml of hexane
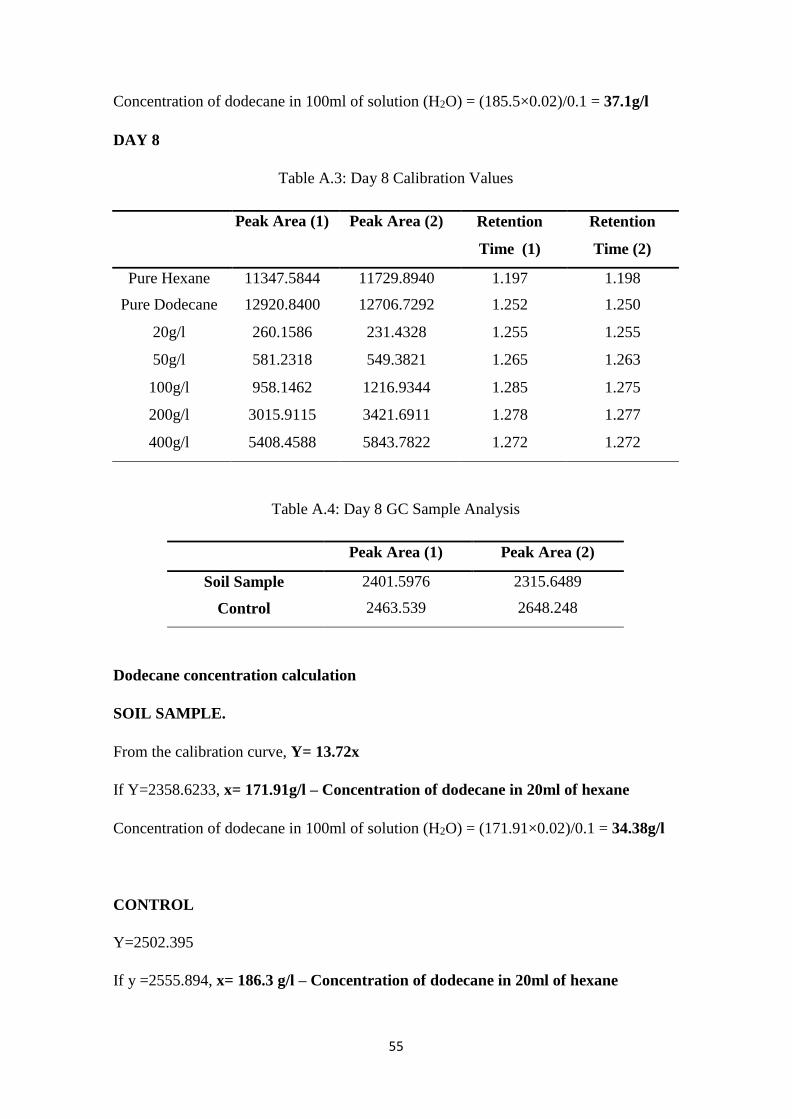
55
Concentration of dodecane in 100ml of solution (H2O) = (185.5×0.02)/0.1 = 37.1g/l
DAY 8
Table A.3: Day 8 Calibration Values
Peak Area (1) Peak Area (2) Retention
Time (1)
Retention
Time (2)
Pure Hexane 11347.5844 11729.8940 1.197 1.198
Pure Dodecane 12920.8400 12706.7292 1.252 1.250
20g/l 260.1586 231.4328 1.255 1.255
50g/l 581.2318 549.3821 1.265 1.263
100g/l 958.1462 1216.9344 1.285 1.275
200g/l 3015.9115 3421.6911 1.278 1.277
400g/l 5408.4588 5843.7822 1.272 1.272
Table A.4: Day 8 GC Sample Analysis
Peak Area (1) Peak Area (2)
Soil Sample 2401.5976 2315.6489
Control 2463.539 2648.248
Dodecane concentration calculation
SOIL SAMPLE.
From the calibration curve, Y= 13.72x
If Y=2358.6233, x= 171.91g/l – Concentration of dodecane in 20ml of hexane
Concentration of dodecane in 100ml of solution (H2O) = (171.91×0.02)/0.1 = 34.38g/l
CONTROL
Y=2502.395
If y =2555.894, x= 186.3 g/l – Concentration of dodecane in 20ml of hexane
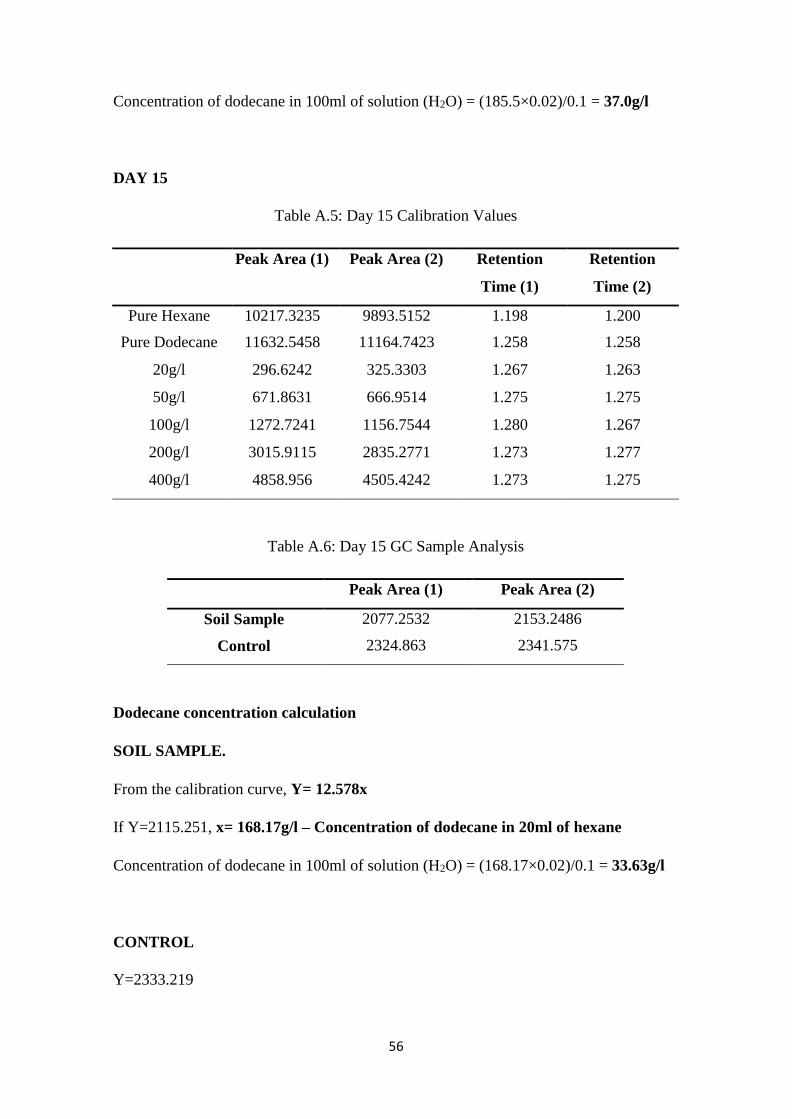
56
Concentration of dodecane in 100ml of solution (H2O) = (185.5×0.02)/0.1 = 37.0g/l
DAY 15
Table A.5: Day 15 Calibration Values
Peak Area (1) Peak Area (2) Retention
Time (1)
Retention
Time (2)
Pure Hexane 10217.3235 9893.5152 1.198 1.200
Pure Dodecane 11632.5458 11164.7423 1.258 1.258
20g/l 296.6242 325.3303 1.267 1.263
50g/l 671.8631 666.9514 1.275 1.275
100g/l 1272.7241 1156.7544 1.280 1.267
200g/l 3015.9115 2835.2771 1.273 1.277
400g/l 4858.956 4505.4242 1.273 1.275
Table A.6: Day 15 GC Sample Analysis
Peak Area (1) Peak Area (2)
Soil Sample 2077.2532 2153.2486
Control 2324.863 2341.575
Dodecane concentration calculation
SOIL SAMPLE.
From the calibration curve, Y= 12.578x
If Y=2115.251, x= 168.17g/l – Concentration of dodecane in 20ml of hexane
Concentration of dodecane in 100ml of solution (H2O) = (168.17×0.02)/0.1 = 33.63g/l
CONTROL
Y=2333.219
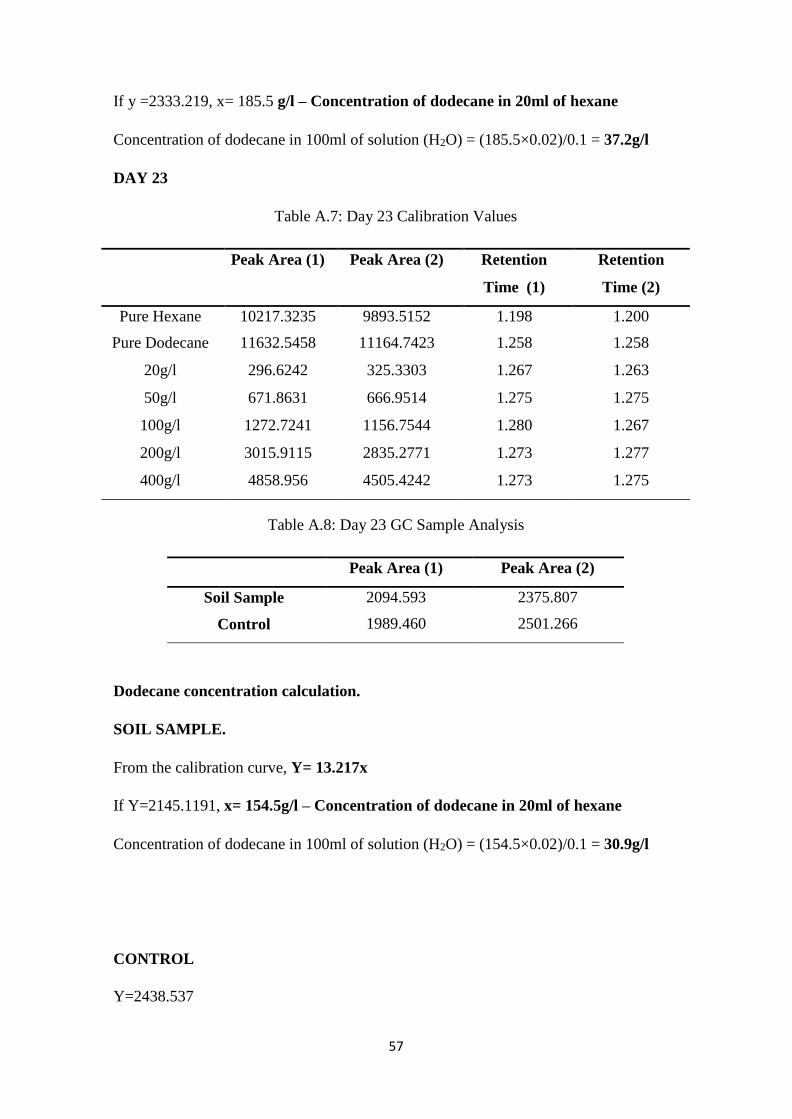
57
If y =2333.219, x= 185.5 g/l – Concentration of dodecane in 20ml of hexane
Concentration of dodecane in 100ml of solution (H2O) = (185.5×0.02)/0.1 = 37.2g/l
DAY 23
Table A.7: Day 23 Calibration Values
Peak Area (1) Peak Area (2) Retention
Time (1)
Retention
Time (2)
Pure Hexane 10217.3235 9893.5152 1.198 1.200
Pure Dodecane 11632.5458 11164.7423 1.258 1.258
20g/l 296.6242 325.3303 1.267 1.263
50g/l 671.8631 666.9514 1.275 1.275
100g/l 1272.7241 1156.7544 1.280 1.267
200g/l 3015.9115 2835.2771 1.273 1.277
400g/l 4858.956 4505.4242 1.273 1.275
Table A.8: Day 23 GC Sample Analysis
Peak Area (1) Peak Area (2)
Soil Sample 2094.593 2375.807
Control 1989.460 2501.266
Dodecane concentration calculation.
SOIL SAMPLE.
From the calibration curve, Y= 13.217x
If Y=2145.1191, x= 154.5g/l – Concentration of dodecane in 20ml of hexane
Concentration of dodecane in 100ml of solution (H2O) = (154.5×0.02)/0.1 = 30.9g/l
CONTROL
Y=2438.537
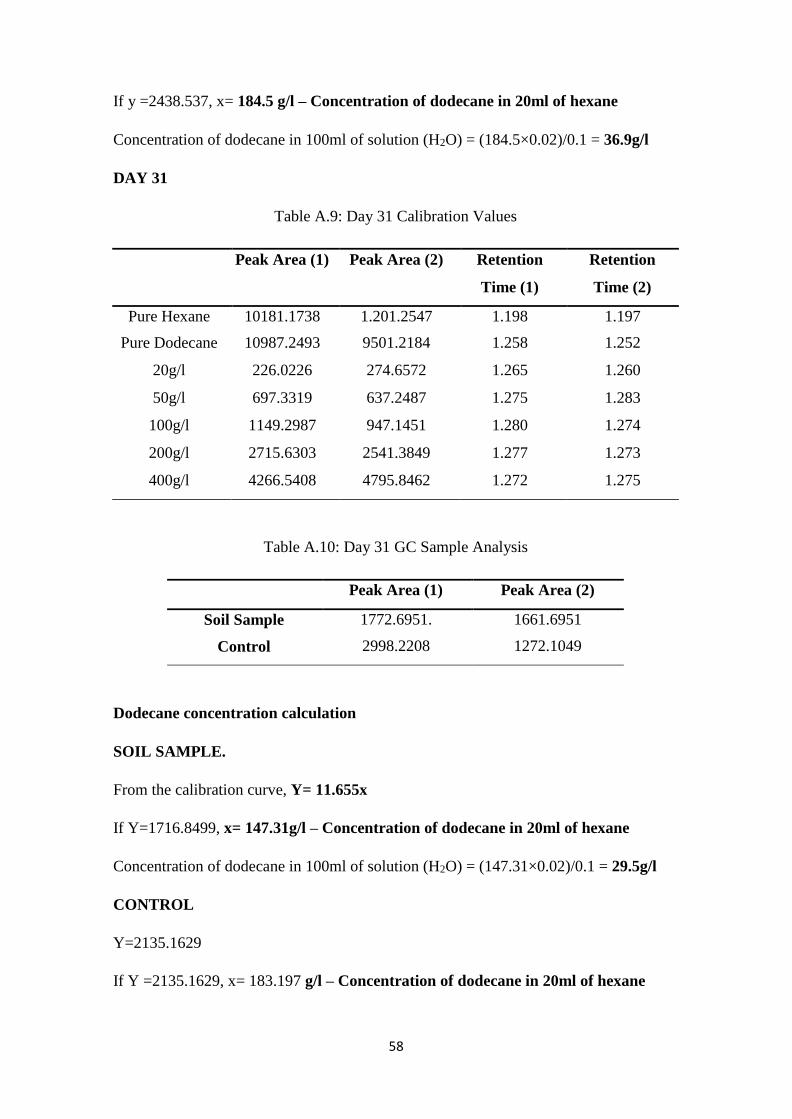
58
If y =2438.537, x= 184.5 g/l – Concentration of dodecane in 20ml of hexane
Concentration of dodecane in 100ml of solution (H2O) = (184.5×0.02)/0.1 = 36.9g/l
DAY 31
Table A.9: Day 31 Calibration Values
Peak Area (1) Peak Area (2) Retention
Time (1)
Retention
Time (2)
Pure Hexane 10181.1738 1.201.2547 1.198 1.197
Pure Dodecane 10987.2493 9501.2184 1.258 1.252
20g/l 226.0226 274.6572 1.265 1.260
50g/l 697.3319 637.2487 1.275 1.283
100g/l 1149.2987 947.1451 1.280 1.274
200g/l 2715.6303 2541.3849 1.277 1.273
400g/l 4266.5408 4795.8462 1.272 1.275
Table A.10: Day 31 GC Sample Analysis
Peak Area (1) Peak Area (2)
Soil Sample 1772.6951. 1661.6951
Control 2998.2208 1272.1049
Dodecane concentration calculation
SOIL SAMPLE.
From the calibration curve, Y= 11.655x
If Y=1716.8499, x= 147.31g/l – Concentration of dodecane in 20ml of hexane
Concentration of dodecane in 100ml of solution (H2O) = (147.31×0.02)/0.1 = 29.5g/l
CONTROL
Y=2135.1629
If Y =2135.1629, x= 183.197 g/l – Concentration of dodecane in 20ml of hexane
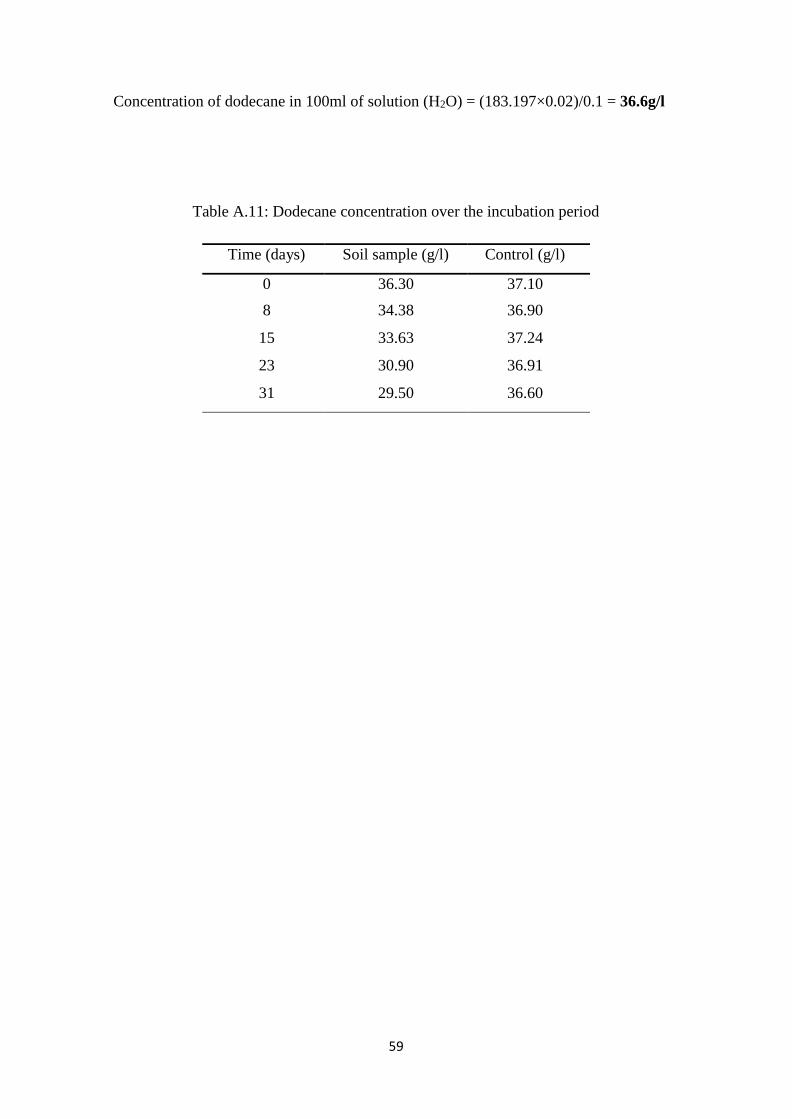
59
Concentration of dodecane in 100ml of solution (H2O) = (183.197×0.02)/0.1 = 36.6g/l
Table A.11: Dodecane concentration over the incubation period
Time (days) Soil sample (g/l) Control (g/l)
0 36.30 37.10
8 34.38 36.90
15 33.63 37.24
23 30.90 36.91
31 29.50 36.60