Embed Size (px)
Citation preview

AUTHORS
Dipl.-Ing. Stefan Hoffmannis in charge of Team Management
for the Advanced Diesel Combustion Development Group at the Hyundai
Motor Europe Technical Center GmbH in Rüsselsheim (Germany).
Dipl.-Ing. Michael Schrottis Senior Engineer in charge of
Development Projects for Diesel Engine Combustion at the Hyundai
Motor Europe Technical Center GmbH in Rüsselsheim (Germany).
Dipl.-Ing. Thorsten Huber is Product Manager Model-based
Calibration at the Etas GmbH in Stuttgart (Germany).
Dr.-Ing. Thomas Kruse is Product Manager Model-based
Calibration at the Etas GmbH in Stuttgart (Germany).
Model-based Methods for the Calibration of Modern Internal Combustion Engines
Design of Experiments
and model-based parameter
optimisation are the keys to
mastering complex engine
management systems. In the
following report, Hyundai
and Etas show how model-
based development methods
can sensibly support the
calibration of modern internal
combustion engines.
of Modern Internal Combustion Engines
DEVELOPMENT SIMULATION AND TEST
24

INCREASE IN THE CALIBRATION PARAMETERS
With CO2 and exhaust gas emissions limits getting tougher all the time, engine management systems are becom-ing increasingly complex in response. The result is a constant increase in the calibration parameters – such as charac-teristic curves and engine maps – that need to be optimised in the overall sys-tem. At the same time, strong competi-tion is forcing manufacturers to shorten development cycles and cut development costs. To be able to carry out engine cali-brations that ensure maximum ride comfort, high dynamics, and low emis-sions under these circumstances, there is a need for new computer-assisted calibration methods to complement con-ventional ones [1].
Engineers at the Hyundai Motor Europe Technical Center GmbH (HMETC) in Rüsselsheim, Germany were quick to recognise this need: in powertrain devel-opment, they have been making greater use of Design of Experiment (DoE) and model-based optimisation methods on top of increased automation levels since 2005. Acceptance of the initial solutions was severely hampered by their lack of user-friendliness and the fact that they did not cover all engine development process steps.
However, the introduction of the Etas Ascmo [2] software resolved this situa-tion: in addition to a program structure and user interface tailored to model-based ECU calibration, the software pro-vides helpful functions to support inex-perienced users. Examples include the
cleverly structured “ExpeDes” test plan editor, automatic model generation, and on-the-fl y extrapolation of target vari-ables for any driving cycle.
As an example, the following sections describe the use of this new solution in a preproduction engine project at the HMETC Powertrain Division. The description focuses on new methodical approaches and benefi ts.
PROJECT SCENARIO
The test candidate was a 2.0-l, four-cylin-der diesel engine with preproduction engine hardware and ECU software, COVER FIGURE. Fuel was supplied to the engine by means of a 1600 bar common-rail system with solenoid valve injectors. Fresh air was directed to the engine intake via a variable nozzle turbocharger (VNT) with downstream intercooler. In addition to a cooled exhaust gas return (EGR) line, a similarly cooled low-pressure EGR loop was installed. The engine delivered a maximum of 110 kW at 4000 rpm.
At the beginning of the tests, the exist-ing calibration already complied with the Euro 5 emissions standard. The objective was to use the DoE software to further reduce the engine’s fuel con-sumption. To do this, it was important to fi nd the optimal balance for the follow-ing calibration parameters:– air mass/EGR rate (mAir)– start of injection (SOI)– swirl fl ap position (swirl)– exhaust back pressure fl ap position for
low-pressure EGR control (LP_ExFl)– boost pressure (pBoost)– rail pressure (pRail).
The relevant target variables are listed below:– fuel consumption (CO2) – particulate mass (soot)– nitrous oxides (NOx)– hydrocarbons (HC)– carbon monoxide (CO)– combustion acoustics (dBA).All tests were conducted on the engine test bench, with subsequent in-vehicle verifi cation on the emissions chassis dynamometer.
During the basic measurement run, the test vehicle, a Hyundai ix35, attained the Euro 5 limit values in the New Euro-pean Driving Cycle (NEDC). This pro-vided the basis for determining the CO2
value to be used as a reference for the optimisation. As shown in FIGURE 1, the relevant operating points for optimisa-tion on the engine test bench were sup-plied by the dwell times of rpm and load in the NEDC.
PLANNING DATA ACQUISITION ON THE TEST BENCH
The DoE module used for test planning divides the workfl ow into eight user-friendly steps that can be processed sequentially or iteratively. A useful func-tion facilitates the compression, and therefore optimum distribution, of meas-uring points via selected input variables, FIGURE 2. In the case at hand, the meas-uring points were compressed in the vicinity of small air masses, because in addition to greater measuring inaccu-racy, less smooth physical dependency was also expected in this area due to high EGR rates.
FIGURE 1 Distribution and weighting of operating points in the NEDC test
04I2015 Volume 76 25

Another function allows users to divide the test plan into a variable num-ber of sections (“blocks”). Given a suffi -cient number of measuring points, each individual block offers optimum distri-bution for modelling. Furthermore, all blocks are complementary, meaning that no overlaps occur when they are com-bined. During live measurement on the test bench, it is therefore possible to quickly determine after each block has been run whether the requisite model quality has been achieved and the test run can be completed early. This can signifi cantly reduce the amount of time and effort required for measuring. In this case, seven blocks of equal size were formed. As an example, FIGURE 3 plots modelling accuracy for the smoke num-ber as a function of the number of mea-suring points used for model generation.
KEY ELEMENT: RAW DATA ANALYSIS
Once the measurement data has been gathered, the next phase is raw data analysis. This often proves to be the most important data evaluation step. As well as identifying faulty measure-ments and drifts, it also provides insight into optimisation potential. The DoE software supports this process very effi -ciently: interactive diagrams allow users to display calibration parameters and/or target variables in relation to each other and, for example, to isolate the areas in which target variables display their opti-mal values. Different isolated areas are highlighted in different colours and can
be limited to the intersection of the selected points. This facilitates the effec-tive visual evaluation of measurement data and the identifi cation of good parameter combinations. In this sample project, the calibration data limited in this way served as the starting point for optimisation.
AUTOMATED MODELLING
The core of Etas Ascmo is its user-friendly modelling function, which is largely automated. Unlike the model-based calibration tools available on the market until now, users are not required to select a specifi c type of model from a
large number of options. Instead, the tool suggests a single, particularly fl exi-ble and powerful model type for them based on Gaussian processes (GP). In GP models, specifi c optimisation methods are used to automatically determine, from a complete family of curves, the function that with the high-est degree of probability correctly maps the system behaviour represented by the measurement data [3]. This approach makes it possible to model even highly nonlinear behaviour by very complex systems to a high degree of accuracy and without overfi tting. To do this, users do not have to parameterise the model. For purposes of comparison and
Sta
rt o
f in
ject
ion
(SO
I) [
°CA
]
Air mass [mg/stroke]
240 260 280 300 320 340 360 380
Measuring point concentrationtoward lesser air masses
6
4
2
0
FIGURE 2 Experiment planning using local measuring point concentration
100 200 300 400 500 600 700
0.18
0.16
0.14
0.12
0.10
0.08
Filt
er s
mok
e nu
mbe
r (F
SN
) [-
]
ASC
Measuring points [-]
Stabilisation afteronly 300 measuring points
FIGURE 3 Model accuracy of Etas Ascmo model (ASC) versus data record size: mean error of global smoke number model (determined by means of verifi cation measurements, error bar = standard deviation obtained with fi ve repeat measurements)
DEVELOPMENT SIMULATION AND TEST
26

/// KINDLY SUPPORTED BY
PROGRAM AND REGISTRATION
www.ATZlive.comAbraham-Lincoln-Straße 4665189 Wiesbaden | Germany
Phone +49 611 7878-131Fax +49 611 [email protected]
Driver Assistance Systems
From Assistance to Automated Driving
1st International ATZ Conference
28 and 29 April 2015 | Frankfurt am Main | Germany
HIGH-LEVEL AUTOMATION Technical risks and
opportunitiesTHE CONNECTED CAR
Safe control of connected functionsBACKGROUND CONDITIONSLegal, social and economic
CUSTOMERS AND MARKETSUser-oriented strategies for
safety and comfort
www.ATZlive.de
/// SCIENTIFIC DIRECTORProf. Dr. Dr. Rolf Isermann
TU Darmstadt
Simultaneous InterpretingGerman and English
© Z
HU
DIF
ENG
/ISTO
CKPH
OTO
.CO
M
Driver Assistance SystemsFrom Assistance to Automated Driving
1st International ATZ Conference1st International ATZ Conference
28 and 29 April 2015
Frankfurt am Main | GermanyFrankfurt am Main | Germany
HIGH-LEVEL AUTOMATION Technical risks and opportunities
THE CONNECTED CARSafe control of connected functions
BACKGROUND CONDITIONSLegal, social and economic
CUSTOMERS AND MARKETSUser-oriented strategies for safety and comfort
/// SCIENTIFIC DIRECTOR
Prof. Dr. Dr. Rolf IsermannTU Darmstadt
special cases, the full range of classic polynomial models is also available.
In comparison to the extrapolation behaviour of polynomials, which tend to strongly diverge outside the mea-sured range, the extrapolation character-istics of the GP models are very lenient: within the extrapolation range, they slowly converge to the mean value of the measured data.
If users suspect that a target variable possesses a basic linear tendency, they can alternatively select a linear extrapola-tion behaviour. In this example, this per-mitted high-quality target variable fore-casts in the extrapolation area, which was close to the model’s defi nition range.
A critical issue for GP models is often the computing times and memory capac-ities required for processing large mea-suring ranges. However, the effi cient GP implementation allows to generate models from tens of thousands of mea-
suring points even on a standard PC in an acceptable time.
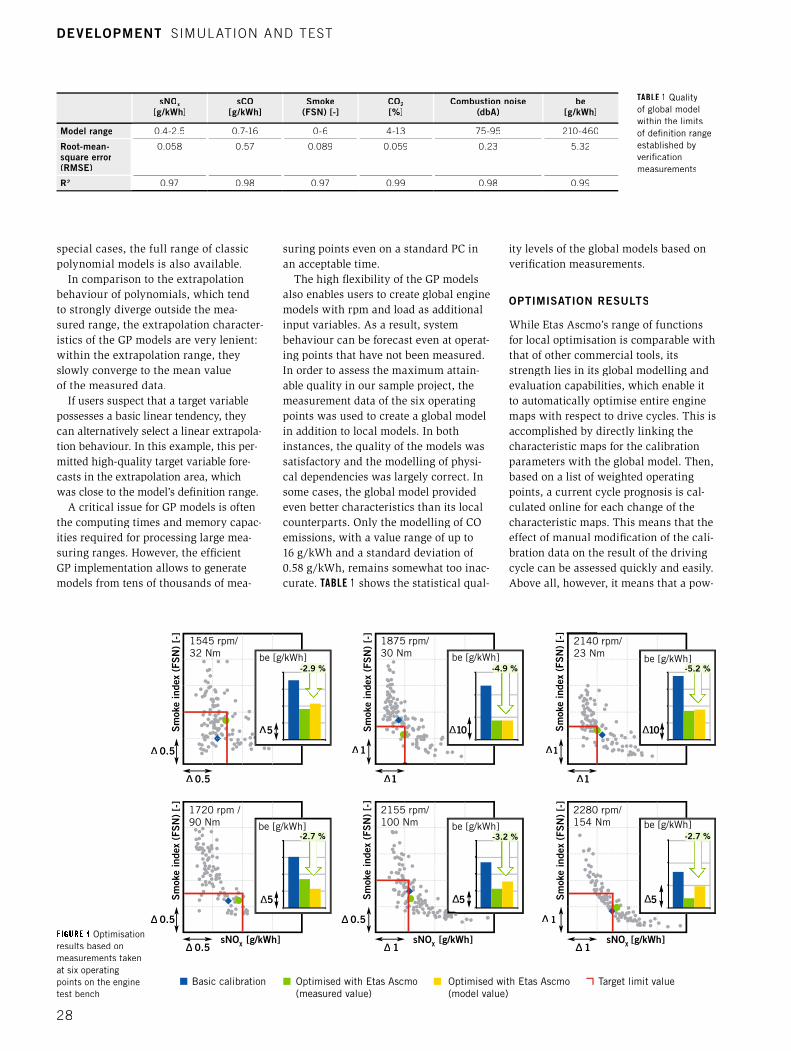
The high fl exibility of the GP models also enables users to create global engine models with rpm and load as additional input variables. As a result, system behaviour can be forecast even at operat-ing points that have not been measured. In order to assess the maximum attain-able quality in our sample project, the measurement data of the six operating points was used to create a global model in addition to local models. In both instances, the quality of the models was satisfactory and the modelling of physi-cal dependencies was largely correct. In some cases, the global model provided even better characteristics than its local counterparts. Only the modelling of CO emissions, with a value range of up to 16 g/kWh and a standard deviation of 0.58 g/kWh, remains somewhat too inac-curate. TABLE 1 shows the statistical qual-
ity levels of the global models based on verifi cation measurements.
OPTIMISATION RESULTS
While Etas Ascmo’s range of functions for local optimisation is comparable with that of other commercial tools, its strength lies in its global modelling and evaluation capabilities, which enable it to automatically optimise entire engine maps with respect to drive cycles. This is accomplished by directly linking the characteristic maps for the calibration parameters with the global model. Then, based on a list of weighted operating points, a current cycle prognosis is cal-culated online for each change of the characteristic maps. This means that the effect of manual modifi cation of the cali-bration data on the result of the driving cycle can be assessed quickly and easily. Above all, however, it means that a pow-
TABLE 1 Quality of global model within the limits of defi nition range established by verifi cation measurements
1545 rpm/32 Nm
1720 rpm /90 Nm
2155 rpm/100 Nm
2280 rpm/154 Nm
2140 rpm/23 Nm
1875 rpm/30 Nm
Sm
oke
inde
x (F
SN
) [-
] S
mok
e in
dex
(FS
N)
[-]
Sm
oke
inde
x (F
SN
) [-
]
Sm
oke
inde
x (F
SN
) [-
]
Sm
oke
inde
x (F
SN
) [-
]
Sm
oke
inde
x (F
SN
) [-
]
∆ 0.5
∆ 0.5 ∆1 ∆1
∆1∆1
∆ 0.5
∆ 0.5
∆ 0.5
∆ 1 ∆ 1
∆ 1
∆5
5 5 5
1010
-2.9 % -4.9 % -5.2 %
-2.7 % -2.7 %-3.2 %
be [g/kWh]
be [g/kWh] be [g/kWh] be [g/kWh]
be [g/kWh]be [g/kWh]
sNOX [g/kWh] sNOX [g/kWh] sNOX [g/kWh]
Basic calibration Optimised with Etas Ascmo (measured value)
Optimised with Etas Ascmo (model value)
Target limit value
FIGURE 4 Optimisation results based on measurements taken at six operating points on the engine test bench
sNOx
[g/kWh]sCO
[g/kWh]Smoke
(FSN) [-] CO2
[%]Combustion noise
(dbA) be
[g/kWh]
Model range 0.4-2.5 0.7-16 0-6 4-13 75-95 210-460
Root-mean-square error (RMSE)
0.058 0.57 0.089 0.059 0.23 5.32
R2 0.97 0.98 0.97 0.99 0.98 0.99
DEVELOPMENT SIMULATION AND TEST
28

erful optimiser can be used to automati-cally generate calibration data, which achieves minimal fuel consumption while staying within the cycle’s limit values and respecting local limit values and map smoothness. The optimisation results achieved in this way based on the analyses are summarised in FIGURE 4.
As in the software named Inca from Etas, the GUI can be toggled between a working page and a reference page, each with its own set of engine map data. Extending this to accommodate addi-tional pages for managing alternative data sets would be a useful extra feature.
During verifi cation on the dynamome-ter, the vehicle with optimised calibration achieved a 2.5 % reduction in fuel con-sumption compared to the base data, accompanied by slightly reduced smoke and NOx emissions. When we consider x emissions. When we consider x
that the base data version was mature to start with, we can see these increases for the impressive achievement they are. Moreover, the value measured is very close to the DoE model forecast. FIGURE 5shows the results of pre- and post-opti-misation cycle extrapolations. Using a variety of factors, the calculations were adjusted so as to fully correlate the out-put values with the results of the basic, pre-optimisation measurements obtained on the dynamometer.
SUMMARY
Overall, the evaluation had a very posi-tive outcome. Parti cularly in the area of engine calibration, the tool quickly achieved a high degree of acceptance among calibration engineers on account of its advanced task-centered function-ality and its user-friendliness. Whereas many publications on model-based optimisation have tended to emphasise the time and cost savings it delivers, the focus for HMETC was more on the measurable increase in quality and the improved documentation of calibration results.
REFERENCES[1] Klar, H.; Klages, B.; Gundel, D.; Kruse, T.; Huber, T.; Ulmer, H.: Neue Verfahren zur effizienten modellbasierten Motorapplikation [New methods for efficient model-based engine calibration]. 5th Inter-national Symposium for Development Methodology, Wiesbaden, 2013[2] Huber, T.; Kruse, T.; Lauff, U.: Modellbasierte Applikation komplexer Systeme [Model-based cali-bration of complex systems]. In: Hanser automotive, 10/2013, pp. 33-35[3] Bishop, C. M.: Pattern Recognition and Machine Learning. Springer, 2006
Pre-optimisation prognosis Values adjusted as per results of dynamometer pre-testing
Post-optimisation prognosis Forecast based on applied weightings and adjustment factors
Name Prognosis Change [%] Name Prognosis Change [%]
Soot [g/km]
NOX [g/km]
CO [g/km]
CO2 [g/km]
SFC [l/100 km]
Soot [g/km]
NOX [g/km]
CO [g/km]
CO2 [g/km]
SFC [l/100 km]
10
0%
Extras Extras
92%
92%
107%
97.5%
97.6%
Deviation Etas Ascmovs. in-vehicle measurement
Tendency
NOx [g/km] CO [g/km] CO2 [g/km]Soot [g/km] FC [l/100 km]
-3.7 % -4.0 % -12.5 % +0.2 % +0.3 %
+ + - ++ ++
Prognosis results Prognosis results
FIGURE 5 Prognosis based on cycle extrapolations before and after optimisation (partly screenshot)
04I2015 Volume 76 29