Embed Size (px)
Citation preview
Running head: MOBILITY RESEARCH CRITIQUE 1
Mobility Research Critique
Amy Bradley, Karilyn Bufka and Jessica Riley
Ferris State University
MOBILITY RESEARCH CRITIQUE 2
Abstract
Reduction of risks to improve patient safety has been a nursing topic well studied for several
years. This paper summarizes and critiques a primary research article regarding a mobility
protocols effect on patient outcomes. An analysis of the data was determined through research
critique guidelines provided by Nieswiadomy (2012). The ability to critique a research article is
an important aspect of nursing that ensures the data accumulated from the research is good
enough to be used in nursing practice.
Keywords: Research, mobility, patient outcomes, safety, critique
MOBILITY RESEARCH CRITIQUE 3
Mobility Research Critique
Research has become a large part of nursing with the push towards using evidence based
practice in healthcare settings. Being able to understand research and determine its strengths and
weaknesses is an important part of both nursing students and nurses alike. In this course we
performed a thorough critique of an article by Padula, Hughes, and Baumhover (2009) titled the
“Impact of a nurse-driven mobility protocol on functional decline in hospitalized older adults.”
Critique guidelines were provided by the Foundations of Nursing Research by Nieswiadomy
(2012).
Throughout this paper, the authors used critical thinking and the research process to
determine threats to internal and external validity. These threats can then be analyzed and help
determine if the article provides sound research that should be applied to healthcare settings or if
more research is needed. Each section was critiqued independently and those critiques helped
the authors determine if the article should be used as evidence to critique research articles with in
the future.
Purpose and Problem
Purpose Statement
Evidence
Padula et al. (2009) objective of the mobility article was "to determine the impact of
mobility protocol on functional decline in hospitalized patients" (p. 1). The purpose statement is
presented in title, the first sentence of the abstract and last sentence of the first paragraph in the
study as Nieswiadomy (2012) stated it should.
MOBILITY RESEARCH CRITIQUE 4
Support
The purpose statement is blatantly presented in title, the first sentence of the abstract and
last sentence of the first paragraph in the study as Nieswiadomy (2012) stated it would be (p.
300). This topic is important to the nursing profession to enhance positive patient outcomes.
Data obtained from several hospital facilities were collected regarding patient mobility after an
admission for acute medical illnesses. Detail for the diagnosis was omitted from the study. The
impact on mobility for those hospitalized was significantly high, "31% decline in ADL at
discharge" (Padula et al., 2009, p. 1). Subjects were screened by monitoring different variables
(age, gender, diagnosis, assistive devices, fall risk, restrictions), along with a Barthel Index, Get
Up and Go test, and a Mini-Mental State Examination (Padula et al., 2009, p. 3). After
intervening with a Genesis program, subjects showed to have a lowered fall-risk.
Analysis
The purpose is somewhat strong with some significant data to uphold its statement. It is
also feasible and ethical. This study has statistical documentation of how patients were
negatively affected during various hospitalizations. It gave support for positive outcomes after
implementing a prevention program but lacks content depth of the study.
Problem Statement
Evidence
The problem stated in the article is to determine the impact nurse-driven mobility has on
the functional status of patients and length of stay during acute hospitalization (Padula et al.,
2009). Padula et al. (2009) discuss the positive impact mobilization has on patient recovery and
continued independence when instituted during acute hospitalization.
MOBILITY RESEARCH CRITIQUE 5
Support
The research problem should include specific information about the population and
variables that are to be studied (Nieswiadomy, 2012). According to Nieswiadomy (2012) the
problem should be clearly stated early in the report in order to guide the reader and help
determine the importance of the research. “The feasibility and the significance of the study
should be apparent” (Nieswiadomy, 2012, p. 300).
Analysis:
The problem statement is weak and is not stated clearly in the reading. This can lead to
confusion with regards to the relationships between the different variables in the study. By
stating a clear problem it would “… help focus attention on the kinds of data that would have to
be collected to provide that answer” to the problem (Nieswiadomy, 2012, p. 34). The data
obtained from the research is strong enough to support the relevance of the study for the nursing
profession, making the study feasible and ethical.
Review of Literature
Evidence
The article does not contain a specific literature review section. However it is included in
the introduction. The sources are all relevant to the topic, appear to be critically appraised, and
cited correctly. Paraphrases are used as opposed to direct quotes. The sources are a mixture of
classic and current and most are primary sources. However, opposing theory and research is
lacking.

MOBILITY RESEARCH CRITIQUE 6
Support
Nieswiadomy (2012) states that research articles should contain a comprehensive review
of the literature with both supporting and opposing views. Most should be from primary sources
as opposed to secondary sources, where authors can misinterpret or leave out pertinent
information. Sources should be a mixture of classic and recent articles (within five years); using
paraphrasing as opposed to direct quotes (Nieswiadomy, 2012).
Analysis
Padula et al. (2009) have a fairly strong literature review. It may not be in its own
section, but it is easily distinguished in the introduction. They did not use direct quotes and
sources were a good mixture of classic and current. However, they did not reference sources that
were of opposing views and this would have given them an even stronger literature review. If
they were unable to find any opposing views they should have clearly stated that in the article.
Theoretical/Conceptual Model
Evidence
The authors utilized a conceptual model by applying a geriatric program called Geriatric
Friendly Environment through Nursing Evaluation and Specific Interventions for Successful
Healing (GENESIS) (Padula et al., 2009). “The GENESIS program includes a nurse-driven
mobility protocol; that specific protocol served as the intervention for [their] research” (Padula et
al., 2009, p. 327).
Support
According to Nieswiadomy (2012), conceptual models are primarily involved with the
significant impact nursing has on patient care and outcomes. “Common concepts identified in
nearly all of the nursing models are person, environment, health, and nursing” (Nieswiadomy,
MOBILITY RESEARCH CRITIQUE 7
2012, p. 85). Conceptual models tend to be intangible and difficult to utilize in experiments
because their concepts tend to be wide-ranging and inexact (Nieswiadomy, 2012). The
conceptual framework assists in the development and explanation of nursing concepts by
providing definitions for terms and variables used throughout the study (Nieswiadomy, 2012).
Analysis
The conceptual framework is weak and not stated plainly in the reading. The conceptual
framework was difficult to define and adding a heading is not required but may have aided the
reader with its distinction from the review of literature and purpose statement. There were no
definitions for terms or variables noted in the article, which also made it difficult for the reader to
understand the concepts and effectively evaluate the study findings.
Hypothesis and Research questions
Evidence
The hypothesis was clearly stated in the article: “Study hypothesis were as follows: (1)
older adults who participate in a mobility protocol will maintain or improve functional status
from admission to discharge and (2) older adults who participate in a mobility protocol will have
a reduced LOS” (Padula et al., 2009, p. 326).
Support
According to Nieswiadomy (2012) a hypothesis is an extremely important component
used to connect the cause and effect of research studies. It “is a statement of the predicted
relationship between two or more variables” (Nieswiadomy, 2012, p. 100). A hypothesis can be
classified several ways, including simple hypothesis, complex hypothesis, null hypothesis,
research hypothesis, nondirectional research hypothesis, and directional hypothesis. A simple
hypothesis is defined as the correlation between one cause and one effect, or one independent

MOBILITY RESEARCH CRITIQUE 8
variable and one dependent variable (Nieswiadomy, 2012). In contrast, “a complex hypothesis
concerns a relationship where two or more independent variables, or two or more dependent
variables, or both, are being examined in the same study” (Nieswiadomy, 2012, p. 101). The
null hypothesis foresees no correlation between the variables in a study and it is open to
statistical analysis. However, the research hypothesis expresses the expected findings from the
relationship between the variables and the research data (Nieswiadomy, 2012, p. 101). Lastly, a
hypothesis can be characterized as nondirectional or directional. A directional hypothesis is
when the relationship between the variables is forecasted or predicted and a nondirectional
hypothesis gives no explanation as to what kind of relationship exists between variables, just that
a relationship exists (Nieswiadomy, 2012).
Analysis
This article has two simple hypotheses that are clearly stated, easily found and are tied
directly to the study, which makes this a strong section of the study. However, there is no null
hypothesis clearly stated which leaves the reader open to assumptions when evaluating the
research data. The hypothesis contains a population and variables. The population in this study
is older adults. The two variables consist of mobility to maintain or improve functional status
from admission to discharge and mobility to have a reduced length of stay (Padula et al., 2009).
Nieswiadomy (2012) considers this to an example of a directional research hypothesis because it
“states the type and correlation or difference that the researcher expects to find” (p. 108). The
first hypothesis contains two predictions. One prediction is that the subject will maintain the
same level of mobility. The second prediction of the hypothesis suggests that the level of
functional status will show improvements, all of which can be empirically tested. Overall, this
section of the article would have been considered very strong had a null hypothesis been given.

MOBILITY RESEARCH CRITIQUE 9
.Research (Study) Design
Evidence
The research design as stated by Padula et al. (2009) is a nonequivalent control group
design. The independent variable was the mobility protocol and the dependent variables were
functional status and length of stay (Padula et al., 2009). The groups were two different floors at
The Miriam Hospital in Providence, Rhode Island. The inclusion criteria were a length of stay in
the hospital of three or more days, ability to understand English, no physical limitation that
would limit mobility, and intact cognitive ability. A research nurse screened the applicants.
Support
According to Nieswiadomy (2012), an experimental design observes cause-and-effect
relationships (how one variable affects another) and involves manipulating variables to
determine if there is a positive or negative affect on a population or individual. Nonexperimental
designs do not deal with manipulation of variables as the research is descriptive (Nieswiadomy,
2012). A quasi-experimental design is one in which current intact groups are used as opposed to
randomly assigned groups (Nieswiadomy, 2012). It is thought that by doing so, the natural
world is more closely mimicked than random assignments (Nieswiadomy, 2012). This is the
type of study of the article in question and more specifically it is a nonequivalent control group
design, which is a type of quasi-experimental design.
Internal validity in this type of study is threatened by history, testing, maturation, and
instrumentation change and selection bias (Nieswiadomy, 2012). Selection bias occurs when the
researchers attribute the changes to an experimental variable when they were actually due to
subject differences (Nieswiadomy, 2012). In a quasi-experimental design, randomization is not
MOBILITY RESEARCH CRITIQUE 10
present because the researcher is using a group that already exists. An example would be
choosing a classroom in a school or an entire unit of a hospital.
Control is required in research studies to help provide evidence that a variable is in some
way changing an outcome. If there is no control, the results of the study cannot be attributed to
the variable because there may be other factors that are interfering with the results. Control is
difficult in studies with humans because of ethical issues and is one of the reasons
nonexperimental designs are used (Nieswiadomy, 2012).
Analysis
This article had a weak experimental design and therefore the outcome could be affected.
The design was clearly stated and the independent and dependent variables were listed. This
design was appropriate for the study as the selection provided a viable population for the
research question. There are several types of experimental designs that could have been chosen,
but a quasi-experimental design is appropriate here because the subjects are not randomly
assigned (Nieswiadomy, 2012). The authors tried to control internal threats by having specific
inclusion criteria, but they are not successful due to the fact that the groups are not the same
(Padula et al., 2009). They clearly defined where the study was taking place and the selection of
the nursing units used was identified. They were on different floors of the hospital, which even
though seems necessary to control the staff and use of the mobility protocol, there may also be
factors of why they were placed on different floors. The patients in the control group may have
had secondary factors that limited them and could not be controlled for. All trials that use
humans as subjects are very difficult to control (Nieswiadomy, 2012). Knowing this and the
limitations of the study, researchers can view this study as limited but provides information that
may help future research and interventions with patients.
MOBILITY RESEARCH CRITIQUE 11
Sample and Sampling Methods
Evidence
The targeted population the researchers used was adults older than 60 years (Padula et al.,
2009). The sampling plan was a convenience sample of 84 subjects. Subjects were included in
the study if their length of stay was three or more days, fluent in the English language, the
absence of physical immobility, and they needed to be alert and oriented (Padula et al., 2009).
Subjects were excluded from the study if their score on a mini mental exam was less than 24.
Exclusions were also due to discharge prior required length of stay, transfer, procedure, and
anxiety. Thirty four subjects were lost or excluded leaving a total of 50 suitable subjects (Padula
et al., 2009, p. 327).
Support
A researcher can use multiple types of sampling. To select and assign subjects to groups,
it is important to interview participants to obtain accurate data. Researchers can use probability
or nonprobability types of sampling methods (Nieswiadomy, 2012). Probability sample methods
use “random selection process to obtain a sample from members or elements of a population”
(Nieswiadomy, 2012, p. 147). Examples of a probability sample methods include simple,
stratified, cluster, and systematic. Nonprobability sampling methods are “chosen from the
population by nonrandom methods” (Nieswiadomy, 2012, p. 152). Examples or nonprobability
samples are convenience, quota, and purposive. External validity may be affected because the
subject is aware of a study being conducted, the Hawthorne effect, or behavior from the
researching influencing the subject, the experimenter effect (Nieswiadomy, 2012, p. 117).
Internal validity may be affected by selection bias, history, maturation, testing, instrumentation
change, or mortality. Nonrandom methods are generally at risk for bias related to the inability to
MOBILITY RESEARCH CRITIQUE 12
“estimate the probability that each element of the population will be included in the sample”
(Nieswiadomy, 2012, p. 152). In fact, elements may be completely omitted from the sample.
Convenience samples may especially be at risk for sampling bias because they are frequently
used when there are financial or time restraints.
Analysis
The targeted and accessible population was identified. The researchers chose a
nonprobability sampling method (Padula et al., 2009), which is a convenience sample. The
sampling method and details were stated in the text. The sampling method was not appropriate
for the study because of the variety in population, threats to validity, and bias. The sample size
is not representative of the population. The central limit theorem recommends a sample size of
100 to ensure “sample values tend to be normally distributed around the population value”
(Nieswiadomy, 2012, p. 226). Sampling biases and dropout subjects are identified in the text.
Overall, this is a weak section due to the convenience sample.
Data Collection Methods
Evidence
The researchers used nominal levels of measurements in this study. An advance practice
nurse was trained on the instruments used prior to the study. Data to be collected included “age;
gender; primary diagnosis; use of assistive devices; fall risk assessment; presence of any
restrictions to mobility; use of occupational or physical therapy; length of stay; first and number
of times out of bed; and type of out-of-bed activity” (Padula et al., 2009, p. 328) using a
demographic sheet created especially for use during this study. In addition, a Barthel Index, Up
& Go test, and Mini-Mental examination were also used. Data was to be collected for two weeks

MOBILITY RESEARCH CRITIQUE 13
prior to admission in their home, assisted living, or nursing home. Data would be collected again
on admission and at discharge from the hospital.
Support
Nieswiadomy (2012) explains four different levels of measurement (nominal, ordinal,
interval, and ratio). Nominal categorizes the data in all ways possible. The data must be
different and should be calculated by adding the amount in each category (Nieswiadomy, 2012).
The ordinal level of measurement ranks the data in order as well as categorizing it
(Nieswiadomy, 2012). Interval takes actual numbers and places them in order. Ratio is the most
accurate way to calculate data. This data can be placed in order and into groups. In addition
there must be a zero point where “there is a total absence of the quantity being measured”
(Nieswiadomy, 2012, p. 165). Nieswiadomy (2012) states that for the data-collection process the
researcher must determine who they would like to involve in their team to collect data. A
location and time frame should be decided along with what data they are trying to collect. A
data collection method and instruments should be decided to gather information. Hawthorne
effects may be a risk to internal validity if the subject reacts in a differently because they have
knowledge of being observed (Nieswiadomy, 2012).
Analysis
Details of the qualifications of who was collecting the data were poorly demonstrated.
The information given for when data intake will take place is lacking time of day and expected
length of time for collection process (Padula et al., 2009). The level of measurement of the
instruments used in the study was not clearly explained in the text leaving the reader unsure if
the correct statistical test was performed, which is a threat to internal validity. There is also a
threat to external validity as the Hawthorne and researcher effects could play a role because the

MOBILITY RESEARCH CRITIQUE 14
subjects are aware of a study being conducted. Results may have been skewed if efforts have not
been made to prevent false effects on data. Overall, it is a weak section.
Instrument
Evidence
The authors used a demographic data collection sheet that was designed for this research
study to collect information such as age, gender, primary diagnosis, restrictions to mobility, use
of occupational or physical therapy, length of stay, first and number of times out of bed, and type
of activity (Padula et al., 2009). Since it was first developed, no information is available on
reliability and validity.
Two different instruments were chosen to measure functional status (Padula et al., 2009).
The first is the modified Barthel Index (BI). BI was used to determine “self-perceived level of
function at the time of admission, for 2 weeks prior to admission, and at discharge” (Padula, et
al., 2009, p. 328). Padula et al. (2009) state that the correlation coefficient with the Frail Elderly
Functional Assessment is 0.91, indicating that validity is high for the study. Reliability was not
mentioned.
The second instrument was the Get Up and Go test and it is “an objective assessment that
measures subjects’ ability to stand from an armchair, walk 3 m, turn around, return, and sit down
in the chair again” (Padula et al., 2009, p. 328). Padula et al. (2009) state that it has been found
to be both reliable and valid with the BI.
A Mini-Mental State Examination was used to test cognitive status. If the patient’s score
was less than 24, their significant other’s opinion on patient abilities was used (Padula et al.,
2009). Reliability and validity were not discussed.
MOBILITY RESEARCH CRITIQUE 15
Support
Instruments are required to collect data (Nieswiadomy, 2012) and therefore help
determine the outcome of a trial or study. Ensuring that the correct instrument is selected is
imperative and the instrument should measure what the authors are testing (Nieswiadomy, 2012).
An instrument must be reliable. Reliability is the consistency and stability of an instrument
(Nieswiadomy, 2012). For example, an automatic blood pressure cuff can only be reliable if it
measure the blood pressure the same as a manual cuff. Correlation coefficients are used to
determine the reliability and can range from -1.00 to +1.00, where closer to +/- 1.00 indicates
better reliability (Nieswiadomy, 2012). If the correlation coefficient is less than 0.7, it is
considered risky to use the instrument (Nieswiadomy, 2012).
There are different types of reliability. Stability reliability is concerned with the
instruments ability to stay consistent over time and uses the test-retest reliability, testing before
and during the study (Nieswiadomy, 2012). Equivalent reliability is when two different forms of
the instrument (or two different observers use a single instrument) get the same results
(Nieswiadomy, 2012). If two different forms of the instrument are used, it is considered
alternate forms reliability and when different observers but the same instrument are used it is
considered parallel forms reliability (Nieswiadomy, 2012). Internal consistency reliability is
concerned with the extent that the parts of the instrument are examining the same thing
(Nieswiadomy, 2012). For example, if a survey about pain is given, all questions should
measure pain, not another outcome such as anxiety.
Validity is the other important concern when determining if an instrument is appropriate
for a study. The level of validity shows how well the instrument gathers the data that it is
intended to gather (Nieswiadomy, 2012). Nieswiadomy (2012) states that “the greater the
MOBILITY RESEARCH CRITIQUE 16
validity of an instrument, the more confidence you can have that the instrument will obtain data
that will answer the research questions or test the research hypotheses” (p. 171). Face validity is
present when a preliminary test shows that the instrument measures what it is supposed to
measure and it is rarely used alone (Nieswiadomy, 2012). Content validity is an estimate of
whether or not the items present are sufficient to measure the concept (Nieswiadomy, 2012).
Criterion validity is “concerned with the extent to which an instrument corresponds to or is
correlated with some criterion measure of the variable of interest” (Nieswiadomy, 2012, p. 172).
It helps to predict responses now and in the future. Construct validity is the most difficult to
measure and it is a measure of how well the instrument measures the construct (a theory or
concept such as anxiety) determined by the author (Nieswiadomy, 2012).
Measuring reliability and validity are not easy. However, it is a very important step in
research studies. Without them, we would have no idea how accurate the study was and couldn’t
determine if the data measured was of use.
Analysis
Padula et al. (2009) had a section specifically for instruments, making it easy for the
reader. The description of the BI and the Get Up and Go test were fairly thorough, but the
section on the Mini Mental State Examination was lacking as reliability and validity were not
discussed. Both of the functional assessment tests had been conducted previously and the
correlation coefficient of the BI was given, indicating reliability (Padula et al., 2009). They also
state that the Get Up and Go test was found to be reliable and valid with BI (Padula et al., 2009),
but do not expand further on where they got that information. Reliability of the BI was not
mentioned except in relation to the other instrument. Specific types of reliability and validity
were not discussed for any of the instruments. The authors could have expanded this section. If
MOBILITY RESEARCH CRITIQUE 17
they would have described the types of validity and reliability, the outcome of the study would
be better explained and easier to utilize for other. A pilot study would have also been useful and
further improved the research paper. According to Nieswiadomy (2012), a pilot study is a
smaller version of the study and it helps determine that the instrument is measuring what the
authors intended it to do and allows them to change the instrument if needed.
Data Analysis (Descriptive and Inferential Statistics)
Descriptive Statistics
Evidence
Padula et al. (2009) used a mean of 80.4 years and a range of 62 to 97 years to represent
the population given. Percentages were calculated to determine the amount of patients that were
admitted from home, assisted living and nursing homes. Padula et al. 2009) gave two tables to
describe 'Nursing staff characteristics by unit for study period' (p. 327) and 'Barthel scores' to
illustrate evidence of significant improvement or decrease in discharge scores (p. 329).
Support
Descriptive statistics "organize and summarize numerical data gathered from samples"
(Nieswiadomy, 2012, p. 205). Measures should be taken to condense data by frequency
distributions, graphic presentations and percentages. Statistics that describe the average, typical,
or most common value for a group of data are better known as measure of central tendency
(Nieswiadomy, 2012). Calculations of the mode, median, and mean can be used to simplify
numbers and show the impact of the values.
Analysis
The types of descriptive statistics included in the research report are measures to
condense data and central tendency. The statistics were not appropriate for the level of

MOBILITY RESEARCH CRITIQUE 18
measurement of the variables because it was lacking significant data. The measures of central
tendency and variability were both presented (Padula et al., 2009). The demographic
characteristics of the subjects were clearly stated in the results. The descriptive statistics in this
study were stated within the text but was not utilized enough in the graphs to help the reader
understand the findings. The tables represent the data within the text. More tables and graphs
would allow the reader to visualize the significant differences in scores. A scatter plot could
have been used to represent the relationship between two variables. A contingency table could
have easily shown if a relationship between categories exist (Nieswiadomy, 2012, p. 217),
strengthening this section.
Inferential Statistics
Evidence
Padula et al. (2009) state that they “recruited a convenience sample of (N = 50) of adults
60 years or older who were admitted with medical diagnoses to 1 of 2 nursing units (n = 25
each)” (p.327). The fall-risk subjects studied showed scores for pre-admission P = 0.05,
admission (7.5 treatment vs. 9.5 control) P = 0.07, compared to (1.86 treatment vs. 2.4 control) P
= 0.04 after treatment. The control group function between preadmission to the time of
discharge was P = 0.006. Results for those testing in the Up and Go scored 1.16 on admission
vs. 1.04 at the time of discharge, 1.35 on admission, and 1.17 at discharge (control) (Padula et
al., 2009).
Support
Inferential statistics are "based on laws of probability” and that “the assumption that
chance (sampling error, random error) is the only explanation for relationships that are found in
research studies” (Nieswiadomy, 2012, p. 225). The purposes of inferential statistics are to test
MOBILITY RESEARCH CRITIQUE 19
predictions of results and estimate population parameters. The null hypothesis is when the
sample population chosen does not have correlation with the variables (Nieswiadomy, 2012). To
determine whether or not to reject the null hypothesis, if the p value attained is less than the set
level of significance (alpha), the researcher would be able to reject the null hypothesis
(Nieswiadomy, 2012, p. 233). Nieswiadomy (2012) also states “if small differences or low
correlations are found, chance is considered to be the reason” (p. 229-230). The null hypothesis
therefore would be accepted. The null hypothesis is rejected “if the results of the analysis show
the difference or correlation is too large to be the result of chance” (Nieswiadomy, 2012, p. 230).
There are two different types of errors when determining results. A type I error occurs when the
null hypothesis is false and it the researcher failed to reject it. The second type of error (type II)
is when it is failed to be rejected and the null hypothesis is actually false. A correct decision is
made when you reject a false null hypothesis (Nieswiadomy, 2012). A t test is a parametric test
that studies two groups to compare the difference between the mean values. The test compares
the means for small sample sizes of either independent (unrelated) or dependent (related)
samples (Nieswiadomy, 2012).
Analysis
The inferential statistics were presented in the report although it is difficult to determine
whether the appropriate tests were used because of lack of information. Calculated values,
including inferential statistics and level of significance, were available for the reader. The null
hypothesis was not clearly stated, which leaves the reader open to assumptions when evaluating
the research data.

MOBILITY RESEARCH CRITIQUE 20
Study Findings
Evidence
The study presented by Padula et al. (2009) found that the treatment group had a lower
fall-risk score than the control group on admission (7.5 treatment vs. 9.5 control; P=.07), but that
this score was not significant (p. 328). The treatment group was also found to have a lower
quantity of fall-risks during the study (1.86 treatment vs. 2.4 control; P=.04), which supports the
finding that the treatment group had lower fall-risk scores on admission (Padula et al., 2009, p.
328).
Padula et al.(2009) presented a table illustrating Barthel scores for the groups which
revealed the subjects’ beliefs regarding what they thought their functionality was two weeks
prior to admission, during admission and compared the scores with what the subjects felt their
functionality was after discharge. The treatment group showed a substantial improvement from
admission to discharge scores (P= .05), while the control group had no significant change (6.9)
(Padula et al., 2009). A considerable decrease in the function between preadmission and
discharge was shown by the control group (P=.006) (Padula et al., 2009). “Scores for the Up and
Go test improved slightly for both groups (1.16 admission vs. 1.04 discharge, treatment; 1.35
admission vs. 1.17 discharge, control) but were not significant” (Padula et al., 2009, 329).
Padula et al. (2009) indicated the treatment group had a substantially shorter length of
stay than the control group (4.96 days treatment vs. 8.72 days control; P< .001) despite the
treatment group being out of bed and to the chair less frequently (5.9 times treatment vs. 8.7
times control; P = .05) and ambulated in the room less (5.54 times treatment vs. 7.16 times
control; NS) than the control group. Even though the treatment group was less active than the
MOBILITY RESEARCH CRITIQUE 21
control they ambulated earlier (2.7 days treatment vs. 4.9 days control, P= .007) (Padula et al.,
2009).
Support
According to Nieswiadomy (2012) the study findings should be documented as
“empirical data or facts” (p. 247). The data should be obtained based on the examination of the
statistics gathered from the study and should clearly correlate with the hypotheses
(Nieswiadomy, 2012). The data can be reported both narratively and in the form of tables, but
the findings must be reported clearly and concisely (Nieswiadomy, 2012).
Analysis
Padula et al. (2009) provided a decent overview of their research findings. The study
findings were reported clearly, concisely, and objectively by using both a narrative form and by
using a table. The study findings were directly connected to the two hypotheses presented by the
study.
Study Discussion of Findings
Evidence
Padula et al. (2009) have interpreted their findings and related them to their two stated
hypotheses. The first hypothesis proposed that older adults who were involved with a mobility
protocol were able to sustain or increase their functional status during hospitalization. Their
research results support this hypothesis (Padula et al., 2009). The second hypothesis was also
supported by the research results and stated that older adults who partake in a mobility program
have a reduced length of stay.
The limitations of the research study were also discussed by Padula et al. (2009). It was
noted that the control group’s diminished functional level could have caused a longer length of
MOBILITY RESEARCH CRITIQUE 22
stay and possibly prevented early ambulation (Padula et al., 2009). These diminished functional
levels experienced by the control group could have been contributed by other things such as
acuity and other burdens of disease. Other factors were not explored in the study and there is
further research needed for the quantification of the impacts these diseases have on patients and
their functional levels (Padula et al., 2009). There is also some question as to the differences
between the groups’ baseline functional statuses, even though there was no significant
differences detected there is still the possibility that differences existed and had the possibility to
affect the study findings (Padula et al., 2009). Further exploration is also needed to examine the
results of the modified Get Up and Go test, which was used to objectively measure functional
ability, because it did not reveal any differences in functional capability that was recognized by
the Barthel Index (Padula et al., 2009). Lastly, the authors discussed how the presence of an
advanced practice nurse on the control unit could have affected the outcome of the results by
having a positive influence on patient mobility (Padula et al., 2009).
Support
According to Nieswiadomy (2012) the discussion of findings should examine the quality
of the study results, previous research on the topic, and any limitations that may interfere with
the findings. There should be no new information brought forth in this section because it could
take credibility away from the authors, making it appear they did more research after the findings
to make their findings more believable (Nieswiadomy, 2012). Nieswiadomy (2012) also points
out that a study should not overgeneralize, but the study should make assumptions that reflect the
correlation between the data, sample size, and sampling method. This section of a research study
should also discuss the theoretical framework of the study and how it applies to the study
findings (Nieswiadomy, 2012).

MOBILITY RESEARCH CRITIQUE 23
Analysis
The discussion of findings appears to be somewhat flimsy. The authors presented many
limitations found in their research study, but had failed to correlate them with the theoretical
framework which was inadequate in the study to begin with. The sample population for the
groups was weak and the authors’ tended to generalize their findings to all populations instead of
the populations they specifically studied. Lastly, the authors made no effort to suggest any
changes that could make the next research study stronger.
Study Conclusions, Implications, & Recommendations, Recommendations
Evidence
Padula et al. (2009) did include a conclusion however it was very short. The conclusion
stated that “findings suggest that early and ongoing ambulation in the hallway may be an
important contributor to maintaining functional status during hospitalization and to shortening
length of stay” (Padula et al., 2009, p. 330). The authors believed that their findings supported
previous research studies.
Support
According to Nieswiadomy (2012), a conclusion should be clearly stated to ensure that
the reader understands the findings of the study. Authors must be careful not to overgeneralize
the results of their study; considering the size of the sample versus the population is imperative
(Nieswiadomy, 2012). Implications of the study should also be clearly stated. Stating what
should happen with the findings can be included here. For example, if more research is needed
or nurses should change their practice based on the findings, would be included here
(Nieswiadomy, 2012). Recommendations for future research based on the findings should also
be addressed (Nieswiadomy, 2012).
MOBILITY RESEARCH CRITIQUE 24
Analysis
The conclusion of this article by Padula et al. (2009) is very short and does not cover all
of the required points. It leaves the reader with more questions than it concludes. The findings
are stated as above, but little expanding is done on the topic. This is a very weak section of the
article. Padula et al. (2009) do state that nurses should look at ambulation as a priority for an
implication of the study, but it is left at that. No recommendations for future research are
explained. This section could have been much stronger had they expanded implications and
added the recommendations.
Conclusion
Medical facilities are constantly striving to improve policies through evidence based
practice in order to provide the best possible outcomes for patients. This paper has analyzed a
research mobility article using guidelines provided by Nieswiadomy (2012). The analysis of the
mobility article included a thorough examination of its purpose, problem, review of literature,
theoretical/conceptual model, hypothesis/research questions, research design, sampling methods,
data collection methods, instruments, both descriptive and inferential data analysis, study
findings, and study discussion.
The mobility article that was evaluated in this paper did not cover all of the aspects
provided by Nieswiadomy (2012) to be considered a strong research article. After the authors
had systematically scrutinized the mobility article they found the article’s strengths lied in the
purpose, review of literature, hypotheses, research design, and the study findings. The other
areas of the article that seemed to be the most important parts of a good research study seemed to
be weak, these areas include the problem statement, theoretical/conceptual framework, sampling
method, data collection, instruments, data analysis, study of discussion findings, and the

MOBILITY RESEARCH CRITIQUE 25
conclusion, implication and recommendation. After reading the mobility article the authors were
left wanting more in many areas and feel that this article is a good base for more research that
would include an enhanced sample group with a stronger conceptual framework and a more
thorough explanation of the instruments in order to aid in a better understanding of the research
findings.
MOBILITY RESEARCH CRITIQUE 26
References
Nieswiadomy, R.M. (2012). Foundations of nursing research. (6th ed.). Upper Saddle River, NJ:
Pearson Education Inc.
Padula, C. A., Hughes, C., & Baumhover, L. (2009). Impact of a nurse-driven mobility protocol
on functional decline in hospital older adults. Journal of Nursing Care Quality, 24(4),
325-331. doi: 10.1097/NCQ.0b013e3181a4f79b
MOBILITY RESEARCH CRITIQUE 27
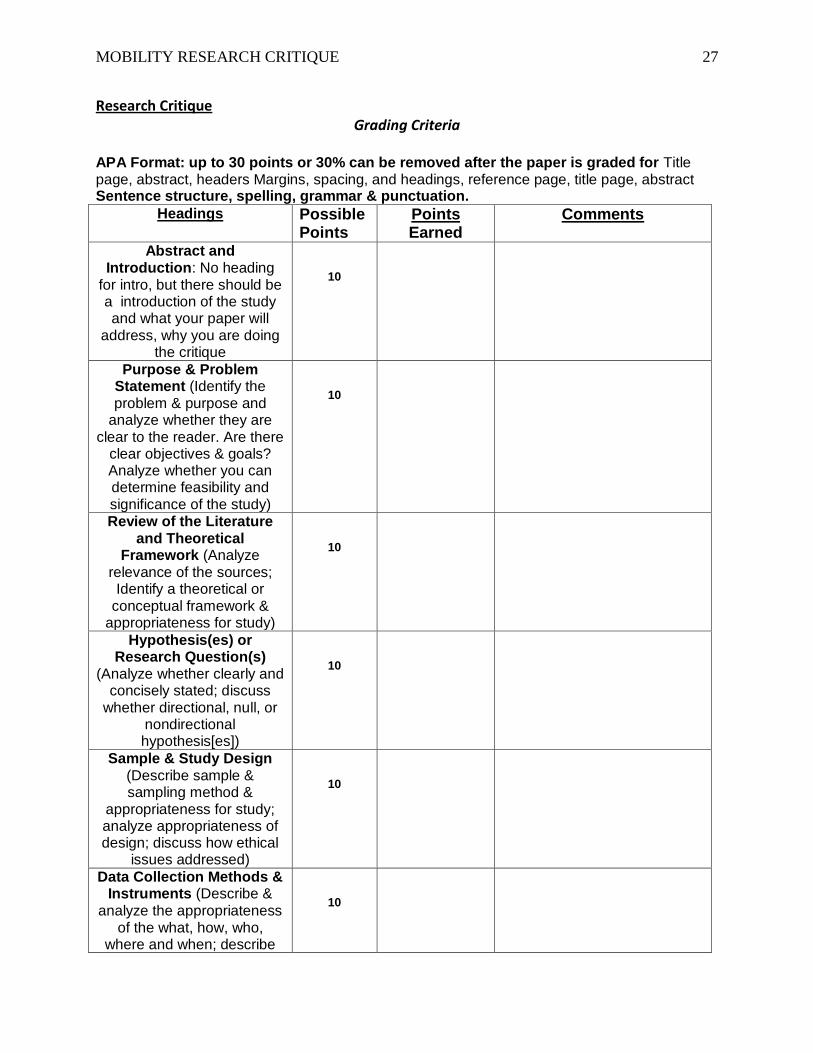
Research Critique Grading Criteria
APA Format: up to 30 points or 30% can be removed after the paper is graded for Title page, abstract, headers Margins, spacing, and headings, reference page, title page, abstract Sentence structure, spelling, grammar & punctuation.
Headings Possible Points
Points Earned
Comments
Abstract and Introduction: No heading
for intro, but there should be a introduction of the study and what your paper will
address, why you are doing the critique
10
Purpose & Problem Statement (Identify the problem & purpose and
analyze whether they are clear to the reader. Are there
clear objectives & goals? Analyze whether you can determine feasibility and significance of the study)
10
Review of the Literature and Theoretical
Framework (Analyze relevance of the sources; Identify a theoretical or
conceptual framework & appropriateness for study)
10
Hypothesis(es) or Research Question(s)
(Analyze whether clearly and concisely stated; discuss
whether directional, null, or nondirectional hypothesis[es])
10
Sample & Study Design (Describe sample & sampling method &
appropriateness for study; analyze appropriateness of design; discuss how ethical
issues addressed)
10
Data Collection Methods & Instruments (Describe &
analyze the appropriateness of the what, how, who,
where and when; describe
10
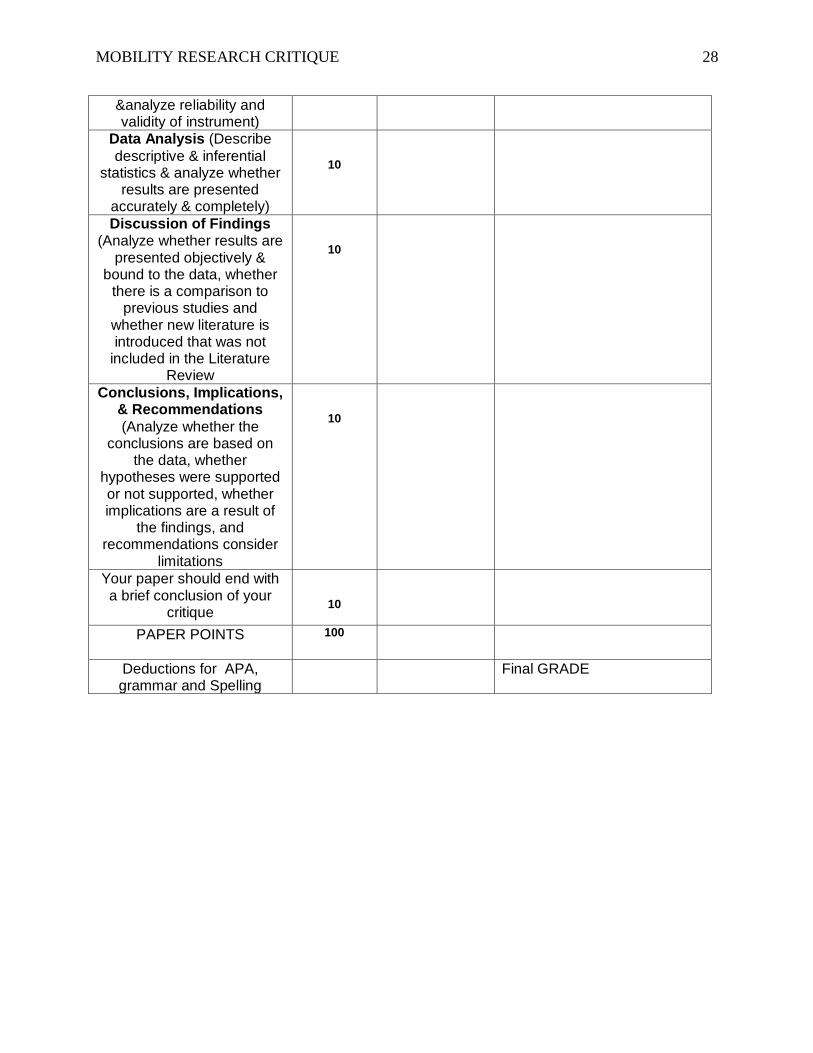
MOBILITY RESEARCH CRITIQUE 28
&analyze reliability and validity of instrument)
Data Analysis (Describe
descriptive & inferential statistics & analyze whether
results are presented accurately & completely)
10
Discussion of Findings (Analyze whether results are
presented objectively & bound to the data, whether
there is a comparison to previous studies and
whether new literature is introduced that was not
included in the Literature Review
10
Conclusions, Implications, & Recommendations
(Analyze whether the conclusions are based on
the data, whether hypotheses were supported or not supported, whether implications are a result of
the findings, and recommendations consider
limitations
10
Your paper should end with a brief conclusion of your
critique
10
PAPER POINTS 100
Deductions for APA, grammar and Spelling
Final GRADE


![Habermas's First Critique [I think] · Habermas's First Critique [I think]](https://img.pdfslide.us/doc/110x75/5aca735f7f8b9a5d718e228f/habermass-first-critique-i-think-s-first-critique-i-think.jpg)