Embed Size (px)
Citation preview
8/8/2019 Mobile Workforce Report, iPass, 24 Aug 2010
http://slidepdf.com/reader/full/mobile-workforce-report-ipass-24-aug-2010 1/11
The iPass Mobile Workorce Report ©2010 iPass Inc.
The iPass Mobile Workforce ReportUnderstanding Enterprise Mobility Trends and Mobile Usage
The Impact of an “Always Connected” Mobile Workforce
Corporate Headquarters
iPass Inc.
3800 Bridge Parkway
Redwood Shores, CA 94065
+1 650-232-4100
+1 650-232-4111 x
www.ipass.com
AUG, 24, 2010
8/8/2019 Mobile Workforce Report, iPass, 24 Aug 2010
http://slidepdf.com/reader/full/mobile-workforce-report-ipass-24-aug-2010 2/11
The iPass Mobile Workorce Report ©2010 iPass Inc. 2
Table of Contents
Executive Summary 3
Introduction 3
Mobile Workorce Productivity 3
Multi-Use Devices 4
Cloud Meets Mobile 4
Methodology 5
Mobile Workorce Survey Results 5
Always On, Always Connected 5
Multi-Use Devices 6
Wi-Fi Usage on the Smartphone 8
iPass Q2 Mobile Usage Data 9
Home Users 9
Business Travelers 9
Airports 10Conclusion 11
About iPass 11
8/8/2019 Mobile Workforce Report, iPass, 24 Aug 2010
http://slidepdf.com/reader/full/mobile-workforce-report-ipass-24-aug-2010 3/11
The iPass Mobile Workorce Report ©2010 iPass Inc. 3
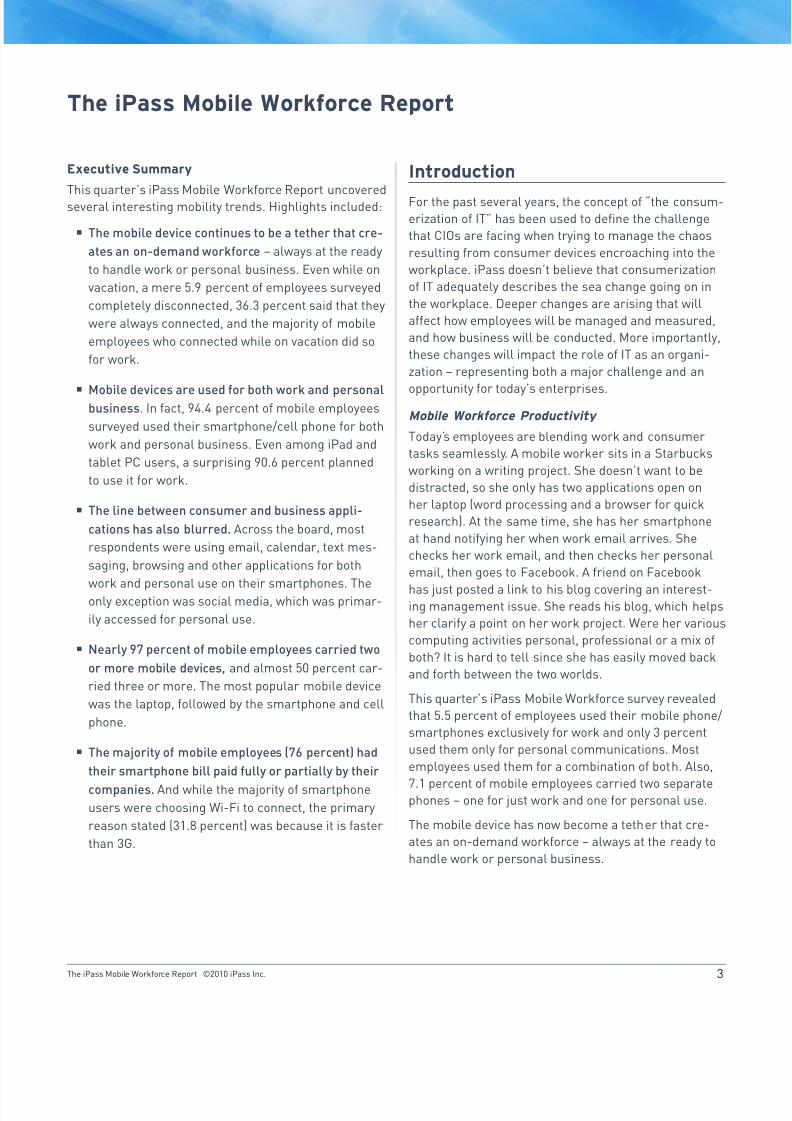
Executive Summary
This quarter’s iPass Mobile Workorce Report uncoveredseveral interesting mobility trends. Highlights included:
■ The mobile device continues to be a tether that cre-
ates an on-demand workforce − always at the ready
to handle work or personal business. Even while on
vacation, a mere 5.9 percent o employees surveyed
completely disconnected, 36.3 percent said that they
were always connected, and the majority o mobile
employees who connected while on vacation did so
or work.
■Mobile devices are used for both work and personalbusiness. In act, 94.4 percent o mobile employees
surveyed used their smartphone/cell phone or both
work and personal business. Even among iPad and
tablet PC users, a surprising 90.6 percent planned
to use it or work.
■ The line between consumer and business appli-
cations has also blurred. Across the board, most
respondents were using email, calendar, text mes-
saging, browsing and other applications or both
work and personal use on their smartphones. Theonly exception was social media, which was primar-
ily accessed or personal use.
■ Nearly 97 percent of mobile employees carried two
or more mobile devices, and almost 50 percent car-
ried three or more. The most popular mobile device
was the laptop, ollowed by the smartphone and cell
phone.
■ The majority of mobile employees (76 percent) had
their smartphone bill paid fully or partially by their
companies. And while the majority o smartphoneusers were choosing Wi-Fi to connect, the primary
reason stated (31.8 percent) was because it is aster
than 3G.
Introduction
For the past several years, the concept o “the consum-erization o IT” has been used to dene the challenge
that CIOs are acing when trying to manage the chaos
resulting rom consumer devices encroaching into the
workplace. iPass doesn’t believe that consumerization
o IT adequately describes the sea change going on in
the workplace. Deeper changes are arising that will
aect how employees will be managed and measured,
and how business will be conducted. More importantly,
these changes will impact the role o IT as an organi-
zation – representing both a major challenge and an
opportunity or today’s enterprises.
Mobile Workforce Productivity
Today’s employees are blending work and consumer
tasks seamlessly. A mobile worker sits in a Starbucks
working on a writing project. She doesn’t want to be
distracted, so she only has two applications open on
her laptop (word processing and a browser or quick
research). At the same time, she has her smartphone
at hand notiying her when work email arrives. She
checks her work email, and then checks her personal
email, then goes to Facebook. A riend on Facebook
has just posted a link to his blog covering an interest-ing management issue. She reads his blog, which helps
her clariy a point on her work project. Were her various
computing activities personal, proessional or a mix o
both? It is hard to tell since she has easily moved back
and orth between the two worlds.
This quarter’s iPass Mobile Workorce survey revealed
that 5.5 percent o employees used their mobile phone/
smartphones exclusively or work and only 3 percent
used them only or personal communications. Most
employees used them or a combination o both. Also,
7.1 percent o mobile employees carried two separatephones − one or just work and one or personal use.
The mobile device has now become a tether that cre-
ates an on-demand workorce − always at the ready to
handle work or personal business.
The iPass Mobile Workforce Report
8/8/2019 Mobile Workforce Report, iPass, 24 Aug 2010
http://slidepdf.com/reader/full/mobile-workforce-report-ipass-24-aug-2010 4/11
The iPass Mobile Workorce Report ©2010 iPass Inc. 4
Even while on vacation, a mere 5.9 percent o employ-
ees completely disconnected and 36.3 percent said that
they were always connected. The majority o mobile
employees who connected while on vacation did so or
work. An on-demand workorce delivers huge benets
to the enterprise in the area o increased workorce
productivity as well as in customer service, crisismanagement and day-to-day operations. It also allows
employees to stay connected with their personal and
proessional communities.
As workers mix personal and business activities, mea-
suring productivity o remote employees has become
a challenge. How should productivity be measured
or an employee who requently works remotely? Who
takes o at 4 pm to coach their child’s sports team,
who attends sta meetings while commuting, and who
considers end-o-day to mean midnight? As a result o
this ambiguity, there will be a shit in how organizationswill measure productivity going oward. It is still unclear
how to measure mobile productivity eectively, but
most analysts believe it will be easier than in the past.
According to Seth Siegel, a director at Deloitte Consult-
ing LLP:
“On the productivity side, the measures can be
trickier. Though many organizations value “sot”
benefts like improved morale and better work-
lie balance, the hard-nosed fnance types want to
see real perormance improvements. They want to
know that workers are getting their work done moreeectively – and that they’re not going to soccer
games or doing laundry. Fortunately, early leaders
in workplace innovation oer plenty o good advice
about the most important metrics – and how to track
them. They’ve been able to demonstrate that peror-
mance measurement in a web-enabled environment
can be easier to manage than in the good old days
o punch cards and time clocks. Indeed, their eorts
have been able to provide good evidence to suggest
that workers who have the reedom to work rom
anywhere at any time oten do just that – logging inmore hours and getting more accomplished than
their counterparts who come into the ofce every
day.” i
Multi-Use Devices
One o the issues with the consumerization o IT is
that the assumption is made that there is a signi-
cant technical dierence between a consumer and a
business device. Take or example, Apple’s iPad. An
analyst recently conveyed that he misjudged the iPad
when it was rst introduced. In recent discussions with
business customers, the analyst was amazed at how
seriously businesses were evaluating the iPad or tablet
devices or employees. This quarter’s iPass survey
conrmed this observation. According to survey results,
16.3 percent o mobile employees had an iPad or tablet
PC device, and an additional 33.2 percent planned to
purchase or receive one in the next six months. A
surprising 90.6 percent o those planned to use it or
work. iPass believes that Apple must evolve the iPad to
better meet the needs o the enterprise or other
vendors will essentially copy the orm actor and tailorit to the business environment.
Whether a device is targeted to the consumer or to a
business user is largely dependent on the applications
that are most oten used. And even these lines are not
drawn clearly. iPass survey results ound that people
used most applications or both work and personal use.
iPass believes that the new mobile workorce productiv-
ity market will mature in the next ve years with robust
tools or managing the prolieration o devices, measur-
ing productivity and return, structuring liability, mitigat-
ing risk, ensuring access, maintaining a level o controland containing costs. These challenges are not new to
IT, but will become exacerbated with increased mobility
and the prolieration o cloud computing.
Cloud Meets Mobile
Mobile broadband networks, multi-use devices and
cloud computing have orced businesses to move rom
the protection o their own private networks to the
unsecured open range. Employees now move transpar-
ently between the corporate network, campus roaming,
public and private Wi-Fi, broadband and their home
networks. They access data centers in the cloud that
bypass the company’s outmoded VPN and store privi-
leged business inormation on their unsecured mobile
devices. IDC recently estimated that 70 percent or more
o enterprise data now resides in some orm on mobile
devices, and remarkably, approximately three out o
our organizations lack comprehensive ormalized poli-
cies or dealing with mobile devices and data.ii
8/8/2019 Mobile Workforce Report, iPass, 24 Aug 2010
http://slidepdf.com/reader/full/mobile-workforce-report-ipass-24-aug-2010 5/11
The iPass Mobile Workorce Report ©2010 iPass Inc. 5
For IT, the old security model o building a moat around
the data center has broken down. IT can no longer
enorce a sae perimeter around their employees and
the company’s assets. While cloud computing is still
early on the adoption curve, it is hard to nd a CIO who
doesn’t have a cloud strategy. According to Inormation-
Week’s July 2010 Cloud and IT Stang Survey:
Three-fths o strategic IT managers responding to
our survey say their companies have either adopted
cloud services or plan to within the next 24 months.
By contrast, only about one-third o IT sta say this
is the case. That doesn’t mean we just happened to
survey IT sta and middle managers in companies
that are less likely than average to be moving unc-
tions to the public cloud. Rather, cloud providers
really are targeting line-o-business executives, who
in turn are insisting that their CIOs evaluate these
services and adopt where they make business sense.
The word may not have trickled down just yet, but all
operational managers and sta should be thinking
about the cloud’s long-term impact on their roles.iii
In the world o networks without borders, IT now needs
to be even more ocused on managing risk and not los-
ing sight o containing costs. The IT managers o the
uture will need real-time inormation to access and
optimize their networks, and will need to address the
question o how to secure a device they do not own.
At the same time, as more users and data-intensiveapplications shit outside the LAN, carriers have re-
sponded by moving away rom fat rate data plans to
usage-based data plans. O course there is more and
more ree Wi-Fi available, but when choice is presented
to the user, 34.8 percent o those surveyed admitted to
gravitating to the easiest route or connectivity − even i
it was not the most cost eective. IT managers will need
to ensure that their users stay productive without
incurring unnecessary costs.
Methodology
This quarter’s iPass Mobile Workorce Report is based
on inormation rom two sources:
■ Responses to the iPass survey o more than 1,100
mobile enterprise employees between July12 andJuly 30, 2010. 54 percent o respondents were rom
North America, 30 percent were rom Europe and
10 percent were rom Asia Pac. The survey respon-
dents were asked about their mobile productivity,
work habits and related experiences.
■ Enterprise mobile broadband usage data collected
by iPass across its user base o employees at 3,500
enterprises rom April 1 through June 30 o 2010.
iPass mobile employee defnition: any worker using any mobile device
(including laptop, netbook, smartphone, cellphone or tablet) who accesses
networks (other than the corporate LAN or WLAN) or work purposes.
Mobile Workforce Survey Results
Always On, Always Connected
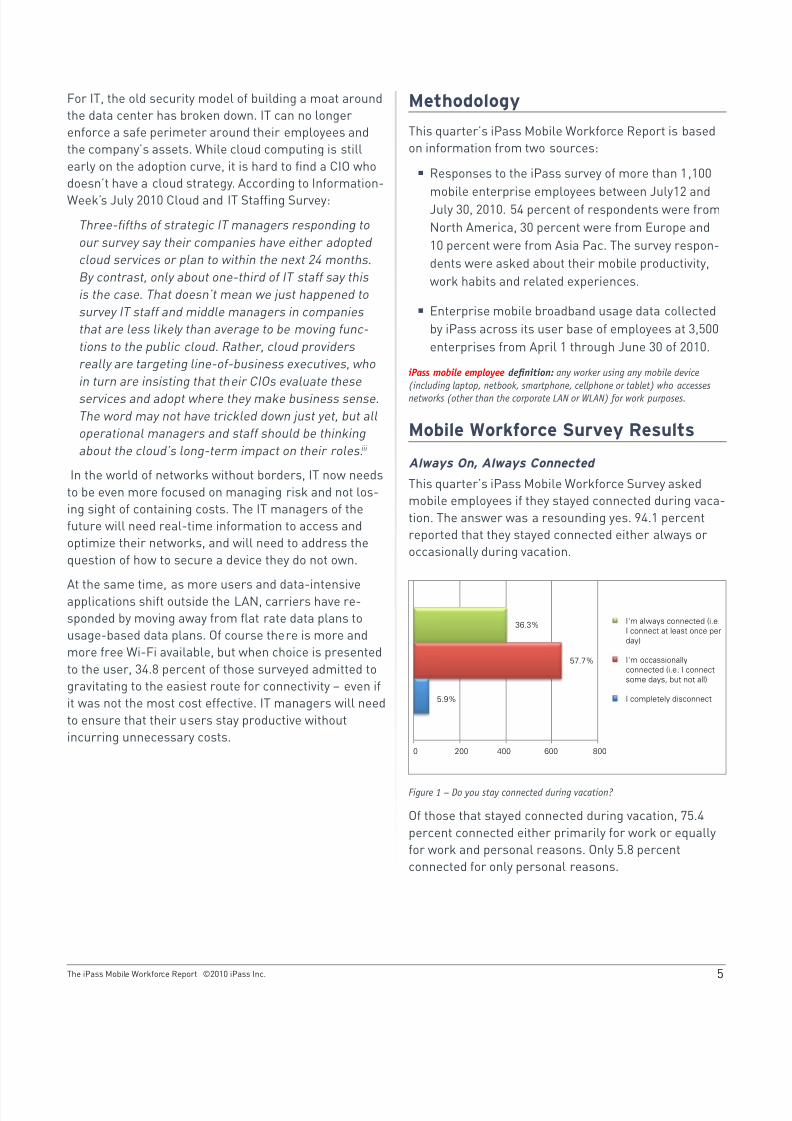
This quarter’s iPass Mobile Workorce Survey asked
mobile employees i they stayed connected during vaca-
tion. The answer was a resounding yes. 94.1 percent
reported that they stayed connected either always or
occasionally during vacation.
I'm always connected (i.e.
I connect at least once per
day)
I'm occassionally
connected (i.e. I connect
some days, but not all)
I completely disconnect
0 200 400 600 800
36.3%
57.7%
5.9%
Figure 1 – Do you stay connected during vacation?
O those that stayed connected during vacation, 75.4
percent connected either primarily or work or equally
or work and personal reasons. Only 5.8 percent
connected or only personal reasons.
8/8/2019 Mobile Workforce Report, iPass, 24 Aug 2010
http://slidepdf.com/reader/full/mobile-workforce-report-ipass-24-aug-2010 6/11
The iPass Mobile Workorce Report ©2010 iPass Inc. 6
8.7%
28.1%
38.6%
18.9%
5.8%
All personal
Mostly personal
Equal work and personal
Mostly workAll work
0 100 200 300 400 500
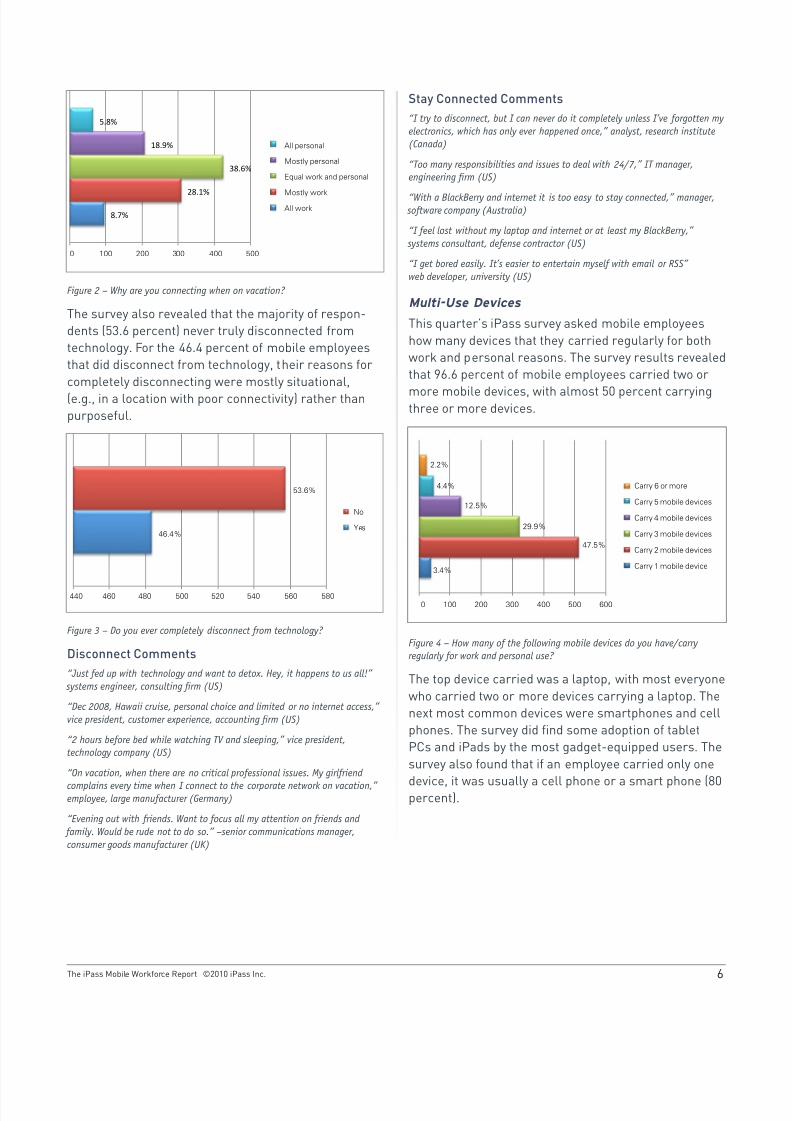
Figure 2 – Why are you connecting when on vacation?
The survey also revealed that the majority o respon-
dents (53.6 percent) never truly disconnected rom
technology. For the 46.4 percent o mobile employees
that did disconnect rom technology, their reasons or
completely disconnecting were mostly situational,
(e.g., in a location with poor connectivity) rather than
purposeul.
No
Yes
440 460 480 500 520 540 560 580
53.6%
46.4%
Figure 3 – Do you ever completely disconnect rom technology?
Disconnect Comments
“Just ed up with technology and want to detox. Hey, it happens to us all!”
systems engineer, consulting rm (US)
“Dec 2008, Hawaii cruise, personal choice and limited or no internet access,”
vice president, customer experience, accounting rm (US)
“2 hours beore bed while watching TV and sleeping,” vice president,
technology company (US)
“On vacation, when there are no critical proessional issues. My girlriend
complains every time when I connect to the corporate network on vacation,” employee, large manuacturer (Germany)
“Evening out with riends. Want to ocus all my attention on riends and
amily. Would be rude not to do so.” –senior communications manager,
consumer goods manuacturer (UK)
Stay Connected Comments
“I try to disconnect, but I can never do it completely unless I’ve orgotten my
electronics, which has only ever happened once,” analyst, research institute
(Canada)
“Too many responsibilities and issues to deal with 24/7,” IT manager,
engineering rm (US)
“With a BlackBerry and internet it is too easy to stay connected,” manager, sotware company (Australia)
“I eel lost without my laptop and internet or at least my BlackBerry,”
systems consultant, deense contractor (US)
“I get bored easily. It’s easier to entertain mysel with email or RSS”
web developer, university (US)
Multi-Use Devices
This quarter’s iPass survey asked mobile employees
how many devices that they carried regularly or both
work and personal reasons. The survey results revealed
that 96.6 percent o mobile employees carried two or
more mobile devices, with almost 50 percent carryingthree or more devices.
Carry 6 or more
Carry 5 mobile devices
Carry 4 mobile devices
Carry 3 mobile devices
Carry 2 mobile devices
Carry 1 mobile device
2.2%
4.4%
12.5%
29.9%
47.5%
3.4%
0 100 200 300 400 500 600
Figure 4 – How many o the ollowing mobile devices do you have/carry
regularly or work and personal use?
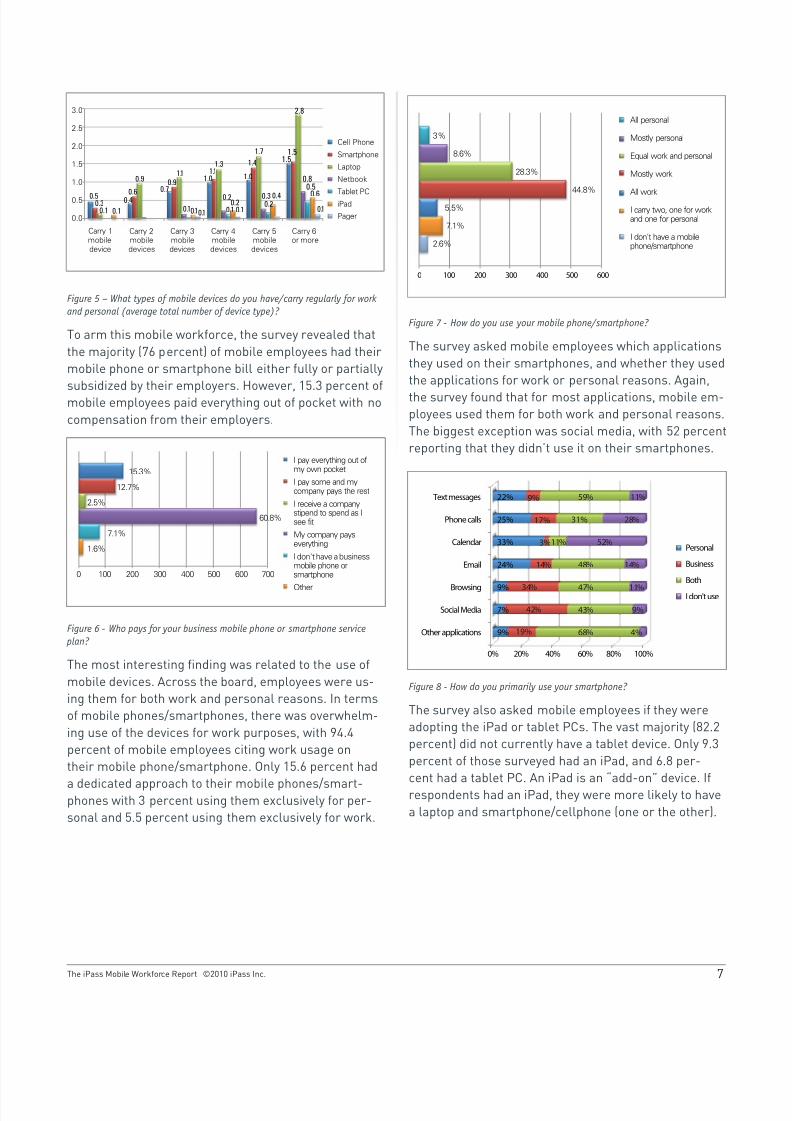
The top device carried was a laptop, with most everyone
who carried two or more devices carrying a laptop. The
next most common devices were smartphones and cell
phones. The survey did nd some adoption o tablet
PCs and iPads by the most gadget-equipped users. The
survey also ound that i an employee carried only one
device, it was usually a cell phone or a smart phone (80percent).
8/8/2019 Mobile Workforce Report, iPass, 24 Aug 2010
http://slidepdf.com/reader/full/mobile-workforce-report-ipass-24-aug-2010 7/11
The iPass Mobile Workorce Report ©2010 iPass Inc. 7
Carry 1mobiledevice
Carry 2mobiledevices
Carry 3mobiledevices
Carry 4mobiledevices
Carry 5mobiledevices
Carry 6or more
Cell Phone
Smartphone
Laptop
Netbook
Tablet PC
iPad
Pager
3.0
2.5
2.0
1.5
1.0
0.5
0.0
0.50.3
0.1 0.1
0.4 0.4
0.6
0.9
0.70.9
1.1
0.10.10.10.1
1.0 1.01.1
1.3
0.20.2
0.1 0.1
1.4
1.7
0.30.2
1.51.5
2.8
0.8
0.5
0.6
Figure 5 – What types o mobile devices do you have/carry regularly or work
and personal (average total number o device type)?
To arm this mobile workorce, the survey revealed that
the majority (76 percent) o mobile employees had their
mobile phone or smartphone bill either ully or partially
subsidized by their employers. However, 15.3 percent o
mobile employees paid everything out o pocket with no
compensation rom their employers.
I pay everything out ofmy own pocket
I pay some and mycompany pays the rest
I receive a companystipend to spend as Isee fit
My company payseverything
I don't have a businessmobile phone orsmartphone
Other
0 100 200 300 400 500 600 700
15.3%
12.7%
2.5%
60.8%
7.1%
1.6%
Figure 6 - Who pays or your business mobile phone or smartphone service
plan?
The most interesting nding was related to the use o
mobile devices. Across the board, employees were us-
ing them or both work and personal reasons. In terms
o mobile phones/smartphones, there was overwhelm-
ing use o the devices or work purposes, with 94.4
percent o mobile employees citing work usage on
their mobile phone/smartphone. Only 15.6 percent had
a dedicated approach to their mobile phones/smart-phones with 3 percent using them exclusively or per-
sonal and 5.5 percent using them exclusively or work.
All personal
Mostly personal
Equal work and personal
Mostly work
All work
I carry two, one for workand one for personal
I don't have a mobilephone/smartphone
3%
8.6%
28.3%
44.8%
5.5%
7.1%
2.6%
0 100 200 300 400 500 600
Figure 7 - How do you use your mobile phone/smartphone?
The survey asked mobile employees which applications
they used on their smartphones, and whether they used
the applications or work or personal reasons. Again,
the survey ound that or most applications, mobile em-ployees used them or both work and personal reasons.
The biggest exception was social media, with 52 percent
reporting that they didn’t use it on their smartphones.
Text messages
Phone calls
Calendar
Browsing
Social Media
Other applications
0% 20% 40% 60% 80% 100%
Personal
Business
Both
I don't use
22%
25%
33%
24%
9%
7%
9%
11%
28%
52%
14%
11%
9%
4%
59%
31%
11%
48%
47%
43%
68%
9%
17%
3%
14%
34%
42%
19%
Figure 8 - How do you primarily use your smartphone?
The survey also asked mobile employees i they were
adopting the iPad or tablet PCs. The vast majority (82.2
percent) did not currently have a tablet device. Only 9.3
percent o those surveyed had an iPad, and 6.8 per-
cent had a tablet PC. An iPad is an “add-on” device. I
respondents had an iPad, they were more likely to have
a laptop and smartphone/cellphone (one or the other).
8/8/2019 Mobile Workforce Report, iPass, 24 Aug 2010
http://slidepdf.com/reader/full/mobile-workforce-report-ipass-24-aug-2010 8/11
8
I have neither
I have both
I have a tablet PC
I have an iPad
0 200 400 600 800 1000
82.2%
1.7%
6.8%
9.3%
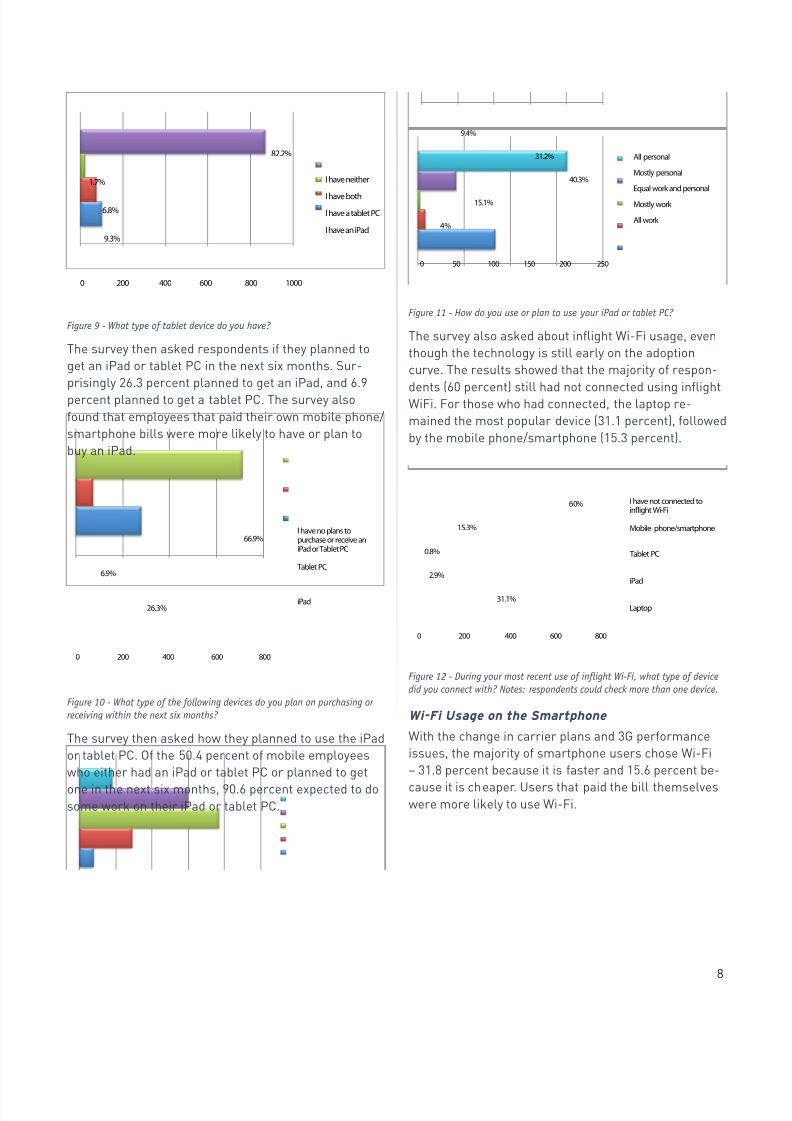
Figure 9 - What type o tablet device do you have?
The survey then asked respondents i they planned to
get an iPad or tablet PC in the next six months. Sur-
prisingly 26.3 percent planned to get an iPad, and 6.9
percent planned to get a tablet PC. The survey also
ound that employees that paid their own mobile phone/
smartphone bills were more likely to have or plan to
buy an iPad.
I have no plans topurchase or receive aniPad or Tablet PC
Tablet PC
iPad
66.9%
6.9%
26.3%
0 200 400 600 800
Figure 10 - What type o the ollowing devices do you plan on purchasing or
receiving within the next six months?
The survey then asked how they planned to use the iPad
or tablet PC. O the 50.4 percent o mobile employees
who either had an iPad or tablet PC or planned to get
one in the next six months, 90.6 percent expected to dosome work on their iPad or tablet PC.
All personal
Mostly personal
Equal work and personal
Mostly work
All work
0 50 100 150 200 250
9.4%
31.2%
40.3%
15.1%
4%
Figure 11 - How do you use or plan to use your iPad or tablet PC?
The survey also asked about infight Wi-Fi usage, even
though the technology is still early on the adoption
curve. The results showed that the majority o respon-
dents (60 percent) still had not connected using infightWiFi. For those who had connected, the laptop re-
mained the most popular device (31.1 percent), ollowed
by the mobile phone/smartphone (15.3 percent).
I have not connected toinight WiFi
Mobile phone/smartphone
Tablet PC
iPad
Laptop
0 200 400 600 800
60%
15.3%
0.8%
2.9%
31.1%
Figure 12 - During your most recent use o infight Wi-Fi, what type o device
did you connect with? Notes: respondents could check more than one device.
Wi-Fi Usage on the Smartphone
With the change in carrier plans and 3G perormance
issues, the majority o smartphone users chose Wi-Fi
– 31.8 percent because it is aster and 15.6 percent be-
cause it is cheaper. Users that paid the bill themselveswere more likely to use Wi-Fi.
8/8/2019 Mobile Workforce Report, iPass, 24 Aug 2010
http://slidepdf.com/reader/full/mobile-workforce-report-ipass-24-aug-2010 9/11
The iPass Mobile Workorce Report ©2010 iPass Inc. 9
0 50 100 150 200 250 300 350
15.6%
31.8%
10.4%
8.2%
10.5%
3.1%
7.2%
13.3%
Yes because it is cheaper
Yes because it is faster
Only when I travel/roam
Rarely
I don't often think about it
I don't, but I should
My smartphone doesn'thave WiFi
Never
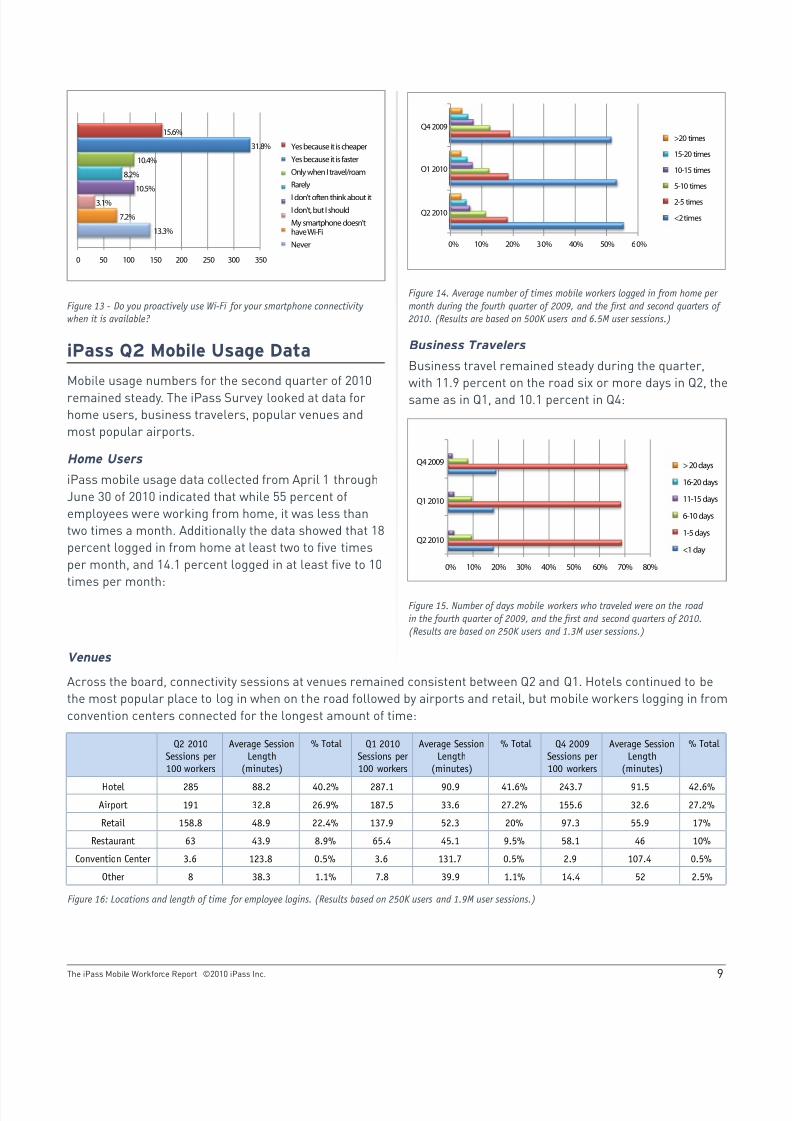
Figure 13 - Do you proactively use Wi-Fi or your smartphone connectivity
when it is available?
iPass Q2 Mobile Usage Data
Mobile usage numbers or the second quarter o 2010
remained steady. The iPass Survey looked at data orhome users, business travelers, popular venues and
most popular airports.
Home Users
iPass mobile usage data collected rom April 1 through
June 30 o 2010 indicated that while 55 percent o
employees were working rom home, it was less than
two times a month. Additionally the data showed that 18
percent logged in rom home at least two to ve times
per month, and 14.1 percent logged in at least ve to 10
times per month:
>20 times
1520 times
1015 times
510 times
25 times
<2 times
Q4 2009
Q1 2010
Q2 2010
0% 10% 20% 30% 40% 50% 60%
Figure 14. Average number o times mobile workers logged in rom home per
month during the ourth quarter o 2009, and the rst and second quarters o
2010. (Results are based on 500K users and 6.5M user sessions.)
Business Travelers
Business travel remained steady during the quarter,
with 11.9 percent on the road six or more days in Q2, the
same as in Q1, and 10.1 percent in Q4:
> 20 days
1620 days
1115 days
610 days
15 days
<1 day
Q4 2009
Q1 2010
Q2 2010
0% 10% 20% 30% 40% 50% 60% 70% 80%
Figure 15. Number o days mobile workers who traveled were on the road
in the ourth quarter o 2009, and the rst and second quarters o 2010.
(Results are based on 250K users and 1.3M user sessions.)
Q2 2010Sessions per100 workers
Average SessionLength
(minutes)
% Total Q1 2010Sessions per100 workers
Average SessionLength
(minutes)
% Total Q4 2009Sessions per100 workers
Average SessionLength
(minutes)
% Total
Hotel 285 88.2 40.2% 287.1 90.9 41.6% 243.7 91.5 42.6%
Airport 191 32.8 26.9% 187.5 33.6 27.2% 155.6 32.6 27.2%
Retail 158.8 48.9 22.4% 137.9 52.3 20% 97.3 55.9 17%
Restaurant 63 43.9 8.9% 65.4 45.1 9.5% 58.1 46 10%
Convention Center 3.6 123.8 0.5% 3.6 131.7 0.5% 2.9 107.4 0.5%
Other 8 38.3 1.1% 7.8 39.9 1.1% 14.4 52 2.5%
Figure 16: Locations and length o time or employee logins. (Results based on 250K users and 1.9M user sessions.)
Venues
Across the board, connectivity sessions at venues remained consistent between Q2 and Q1. Hotels continued to be
the most popular place to log in when on the road ollowed by airports and retail, but mobile workers logging in rom
convention centers connected or the longest amount o time:
8/8/2019 Mobile Workforce Report, iPass, 24 Aug 2010
http://slidepdf.com/reader/full/mobile-workforce-report-ipass-24-aug-2010 10/11
The iPass Mobile Workorce Report ©2010 iPass Inc. 10
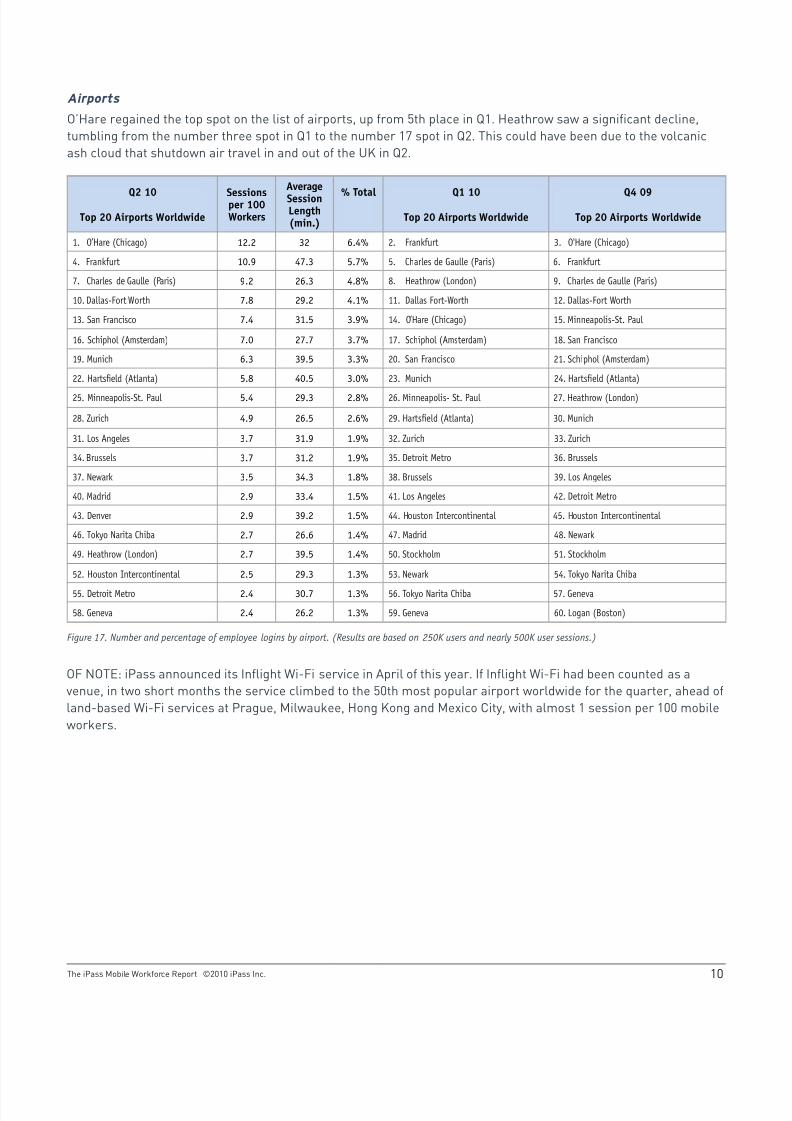
Airports
O’Hare regained the top spot on the list o airports, up rom 5th place in Q1. Heathrow saw a signicant decline,
tumbling rom the number three spot in Q1 to the number 17 spot in Q2. This could have been due to the volcanic
ash cloud that shutdown air travel in and out o the UK in Q2.
Q2 10
Top 20 Airports Worldwide
Sessionsper 100Workers
Average
SessionLength(min.)
% Total Q1 10
Top 20 Airports Worldwide
Q4 09
Top 20 Airports Worldwide
1. O’Hare (Chicago) 12.2 32 6.4% 2. Frankurt 3. O'Hare (Chicago)
4. Frankurt 10.9 47.3 5.7% 5. Charles de Gaulle (Paris) 6. Frankurt
7. Charles de Gaulle (Paris) 9.2 26.3 4.8% 8. Heathrow (London) 9. Charles de Gaulle (Paris)
10. Dallas-Fort Worth 7.8 29.2 4.1% 11. Dallas Fort-Worth 12. Dallas-Fort Worth
13. San Francisco 7.4 31.5 3.9% 14. O’Hare (Chicago) 15. Minneapolis-St. Paul
16. Schiphol (Amsterdam) 7.0 27.7 3.7% 17. Schiphol (Amsterdam) 18. San Francisco
19. Munich 6.3 39.5 3.3% 20. San Francisco 21. Schiphol (Amsterdam)
22. Hartsfeld (Atlanta) 5.8 40.5 3.0% 23. Munich 24. Hartsfeld (Atlanta)
25. Minneapolis-St. Paul 5.4 29.3 2.8% 26. Minneapolis- St. Paul 27. Heathrow (London)
28. Zurich 4.9 26.5 2.6% 29. Hartsfeld (Atlanta) 30. Munich
31. Los Angeles 3.7 31.9 1.9% 32. Zurich 33. Zurich
34. Brussels 3.7 31.2 1.9% 35. Detroit Metro 36. Brussels
37. Newark 3.5 34.3 1.8% 38. Brussels 39. Los Angeles
40. Madrid 2.9 33.4 1.5% 41. Los Angeles 42. Detroit Metro
43. Denver 2.9 39.2 1.5% 44. Houston Intercontinental 45. Houston Intercontinental
46. Tokyo Narita Chiba 2.7 26.6 1.4% 47. Madrid 48. Newark
49. Heathrow (London) 2.7 39.5 1.4% 50. Stockholm 51. Stockholm
52. Houston Intercontinental 2.5 29.3 1.3% 53. Newark 54. Tokyo Narita Chiba
55. Detroit Metro 2.4 30.7 1.3% 56. Tokyo Narita Chiba 57. Geneva
58. Geneva 2.4 26.2 1.3% 59. Geneva 60. Logan (Boston)
Figure 17. Number and percentage o employee logins by airport. (Results are based on 250K users and nearly 500K user sessions.)
OF NOTE: iPass announced its Infight Wi-Fi service in April o this year. I Infight Wi-Fi had been counted as a
venue, in two short months the service climbed to the 50th most popular airport worldwide or the quarter, ahead o
land-based Wi-Fi services at Prague, Milwaukee, Hong Kong and Mexico City, with almost 1 session per 100 mobile
workers.
8/8/2019 Mobile Workforce Report, iPass, 24 Aug 2010
http://slidepdf.com/reader/full/mobile-workforce-report-ipass-24-aug-2010 11/11
The iPass Mobile Workorce Report ©2010 iPass Inc.
Conclusion
Since iPass issued its rst Mobile Workorce Report in
February 2010, three key trends have emerged among
mobile workers:
■Redistribution of work across time and space. Mobile workers are checking in during downtime
and even on vacation. When they disconnect, it is
usually because they cannot connect.
■ Increased permeability of the boundary between
work and life. Most mobile workers are using their
mobile devices or both personal and business
reasons. This trend does not change, even with the
entry o new consumer devices like the iPad.
■ Increased availability of applications and services
in the cloud, as well as new orm actors like theiPad, is making it more dicult or IT to assume a
command and control posture as more and more
online work tasks can be accomplished outside o
the network perimeter.
While many o today’s vendors are catering to the
lucrative consumer market, according to IDC, one in
ve adults worldwide will be categorized as a mobile
worker by next year, meaning that or the long term,
better enterprise mobility services will be required to
meet the needs o the mobile worker. Today, workers
are bringing consumer technology into the workplace,
and both workers and their IT departments are guring
out how to best use them or work. But in many cases,
the current workarounds are both inconvenient and
ineective.
Changing platorms (e.g., rom iPhone to Android) is
airly seamless. Vendors who believe they can lock in
share are overestimating the loyalty o the consumer
market, and underestimating the power o the busi-
ness market. Devices that can easily and successully
be used or both business and personal reasons will
win the consumer and business dollar, as well as thehearts and minds o the mobile workorce.
iPass sees the next wave o innovation and the long
term market winners in mobility as those that take
consumer-ocused technology and eectively apply it to
the enterprise. Business users want a consumer device
with the necessary hooks into the workplace, since they
are increasingly comortable with blending work and
personal activities. iPass predicts that a new category
o services and tools will need to be established around
mobile workorce productivity.
About iPass
Founded in 1996, iPass (NASDAQ: IPAS) is a leading
provider o enterprise mobility services with 3,500 cus-
tomers, including more than 420 o the Forbes Global
2000. The company’s mission is to be the voice o the
enterprise in the market or mobility services by provid-
ing solutions that simply, smartly and openly acilitate
access rom any device on any network, while providing
the visibility and control necessary to contain spiraling
mobility costs, maximize mobile user productivity and
maintain security in a world where consumers drive en-
terprise IT. For more inormation, visit www.iPass.com
or the iPass blog, Smarter Connections, at: www.ipass.com/blog.
i Deloitte Consulting LLP, “Deloitte Debates: The Workplace o Tomorrow:
Productivity Engine or Sae Haven or Slackers?”, 2009
ii IDC , “Worldwide Mobile Security 2009–2013 Forecast and Analysis,”
April 2009
iii InormationWeek, “Changing Role o IT as Services Ascend,” July 10, 2010
iv IDC, Worldwide Mobile Worker Population, 2009-2013, February 2010
Corporate Headquarters
iPass Inc.
3800 Bridge Parkway
Redwood Shores, CA 94065
© Copyright 2009 iPass Inc. All rights reserved. iPass and the iPass logo are registered trademarks o iPass Inc. and iPassConnect is a trademark o iPass Inc. All other company
and product names may be trademarks o their respective companies. While every eort is made to ensure the inormation given is accurate, iPass does not accept liability or any
errors or mistakes which may arise. Specications and other inormation in this document may be subject to change without notice.
+1 650-232-4100
+1 650-232-4111 x
www.ipass.com