Embed Size (px)
Citation preview

8/18/2019 iPass 2012 Annual Report
http://slidepdf.com/reader/full/ipass-2012-annual-report 1/80
iPass Inc.
2012 ANNUAL REPORT
Wi-Fi for theGlobally Mobile

8/18/2019 iPass 2012 Annual Report
http://slidepdf.com/reader/full/ipass-2012-annual-report 2/80
iPASS INC. 2012 ANNUAL REPORT
8/18/2019 iPass 2012 Annual Report
http://slidepdf.com/reader/full/ipass-2012-annual-report 3/80
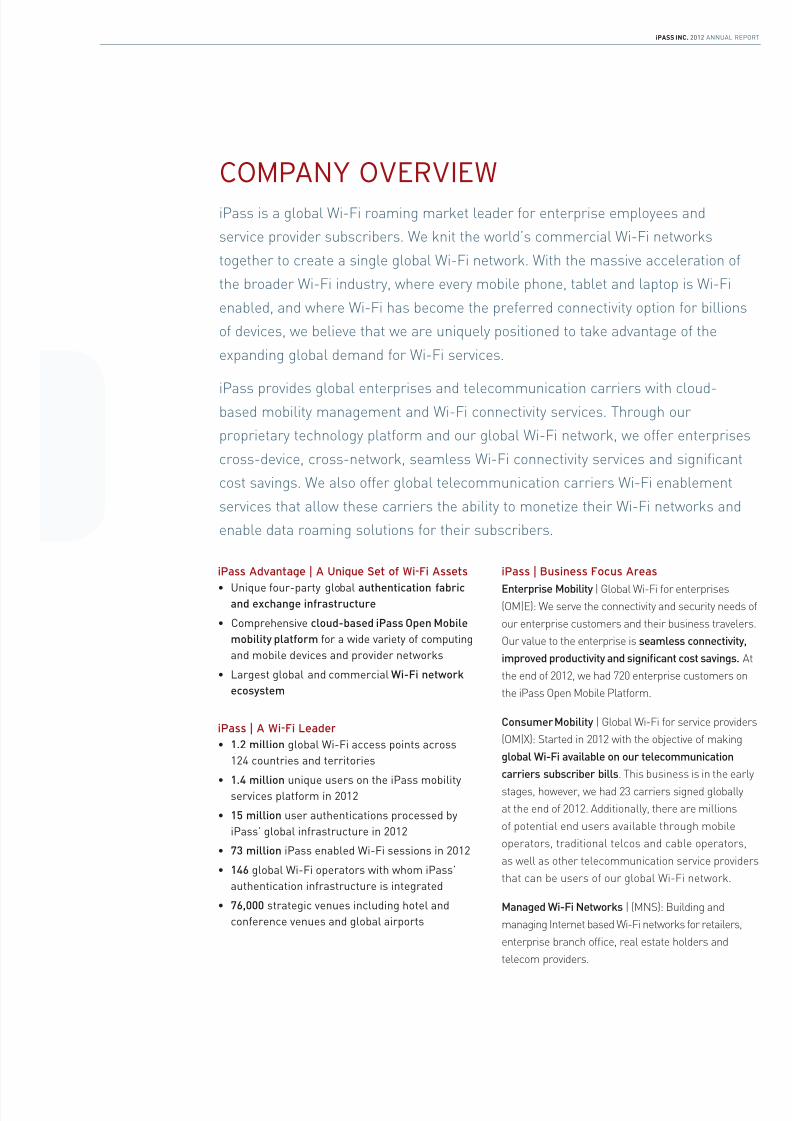
iPass Advantage | A Unique Set of Wi-Fi Assets
• Unique four-party global authentication fabricand exchange infrastructure
• Comprehensive cloud-based iPass Open Mobile
mobility platform for a wide variety of computing
and mobile devices and provider networks
• Largest global and commercial Wi-Fi network
ecosystem
iPass | A Wi-Fi Leader
• 1.2 million global Wi-Fi access points across
124 countries and territories
• 1.4 million unique users on the iPass mobilityservices platform in 2012
• 15 million user authentications processed by
iPass’ global infrastructure in 2012
• 73 million iPass enabled Wi-Fi sessions in 2012
• 146 global Wi-Fi operators with whom iPass’
authentication infrastructure is integrated
• 76,000 strategic venues including hotel and
conference venues and global airports
iPASS INC. 2012 ANNUAL REP
iPass is a global Wi-Fi roaming market leader for enterprise employees and
service provider subscribers. We knit the world’s commercial Wi-Fi networks
together to create a single global Wi-Fi network. With the massive acceleration of
the broader Wi-Fi industry, where every mobile phone, tablet and laptop is Wi-Fi
enabled, and where Wi-Fi has become the preferred connectivity option for billions
of devices, we believe that we are uniquely positioned to take advantage of the
expanding global demand for Wi-Fi services.
iPass provides global enterprises and telecommunication carriers with cloud-based mobility management and Wi-Fi connectivity services. Through our
proprietary technology platform and our global Wi-Fi network, we offer enterprise
cross-device, cross-network, seamless Wi-Fi connectivity services and significant
cost savings. We also offer global telecommunication carriers Wi-Fi enablement
services that allow these carriers the ability to monetize their Wi-Fi networks and
enable data roaming solutions for their subscribers.
COMPANY OVERVIEW
iPass | Business Focus Areas
Enterprise Mobility | Global Wi-Fi for enterprises(OM|E): We serve the connectivity and security needs
our enterprise customers and their business traveler
Our value to the enterprise is seamless connectivity,
improved productivity and significant cost savings. A
the end of 2012, we had 720 enterprise customers on
the iPass Open Mobile Platform.
Consumer Mobility | Global Wi-Fi for service provide
(OM|X): Started in 2012 with the objective of making
global Wi-Fi available on our telecommunication
carriers subscriber bills. This business is in the ear
stages, however, we had 23 carriers signed globally
at the end of 2012. Additionally, there are millions
of potential end users available through mobile
operators, traditional telcos and cable operators,
as well as other telecommunication service provide
that can be users of our global Wi-Fi network.
Managed Wi-Fi Networks | (MNS): Building and
managing Internet based Wi-Fi networks for retailers,
enterprise branch office, real estate holders and
telecom providers.
8/18/2019 iPass 2012 Annual Report
http://slidepdf.com/reader/full/ipass-2012-annual-report 4/80
iPASS INC. 2012 ANNUAL REPORT
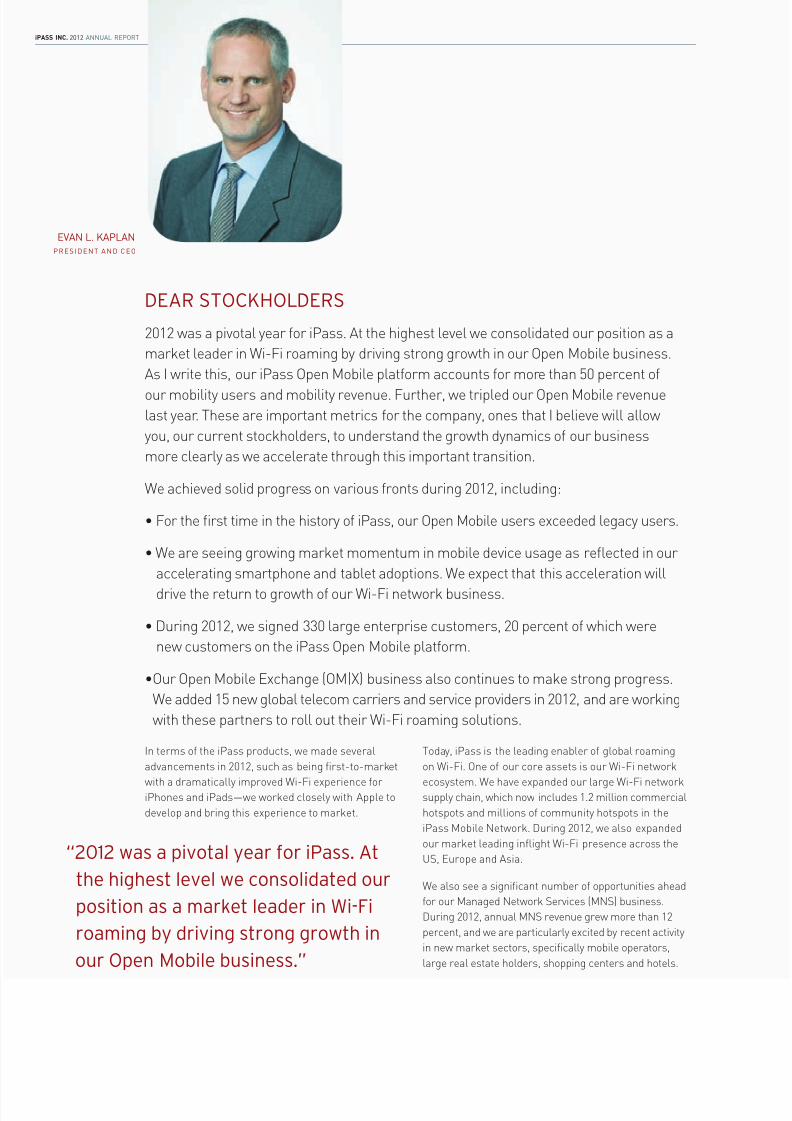
DEAR STOCKHOLDERS
2012 was a pivotal year for iPass. At the highest level we consolidated our position as a
market leader in Wi-Fi roaming by driving strong growth in our Open Mobile business.
As I write this, our iPass Open Mobile platform accounts for more than 50 percent of
our mobility users and mobility revenue. Further, we tripled our Open Mobile revenuelast year. These are important metrics for the company, ones that I believe will allow
you, our current stockholders, to understand the growth dynamics of our business
more clearly as we accelerate through this important transition.
We achieved solid progress on various fronts during 2012, including:
• For the first time in the history of iPass, our Open Mobile users exceeded legacy users.
• We are seeing growing market momentum in mobile device usage as reflected in our
accelerating smartphone and tablet adoptions. We expect that this acceleration will
drive the return to growth of our Wi-Fi network business.
• During 2012, we signed 330 large enterprise customers, 20 percent of which were
new customers on the iPass Open Mobile platform.
•Our Open Mobile Exchange (OM|X) business also continues to make strong progress.
We added 15 new global telecom carriers and service providers in 2012, and are working
with these partners to roll out their Wi-Fi roaming solutions.
In terms of the iPass products, we made several
advancements in 2012, such as being first-to-market
with a dramatically improved Wi-Fi experience foriPhones and iPads—we worked closely with Apple to
develop and bring this experience to market.
Today, iPass is the leading enabler of global roaming
on Wi-Fi. One of our core assets is our Wi-Fi network
ecosystem. We have expanded our large Wi-Fi networksupply chain, which now includes 1.2 million commercial
hotspots and millions of community hotspots in the
iPass Mobile Network. During 2012, we also expanded
our market leading inflight Wi-Fi presence across the
US, Europe and Asia.
We also see a significant number of opportunities ahead
for our Managed Network Services (MNS) business.
During 2012, annual MNS revenue grew more than 12
percent, and we are particularly excited by recent activity
in new market sectors, specifically mobile operators,
large real estate holders, shopping centers and hotels.
“2012 was a pivotal year for iPass. At
the highest level we consolidated our
position as a market leader in Wi-Fi
roaming by driving strong growth in
our Open Mobile business.”
EVAN L. KAPLAN
P R ESIDEN T A N D CEO
8/18/2019 iPass 2012 Annual Report
http://slidepdf.com/reader/full/ipass-2012-annual-report 5/80
iPASS INC. 2012 ANNUAL REP
We are living in an increasingly connected mobile
world. Wi-Fi is increasingly becoming the preferred
connectivity option and the number of Wi-Fi enabled
devices is rising rapidly. Wi-Fi build outs are growing
dramatically, data usage is increasing and consumersare developing a stronger preference for Wi-Fi con-
nectivity, especially when traveling. As the mobile
market continues to grow, iPass will continue to benefit
from the proliferation of mobile devices and mobile
apps, as well as from the growth of Wi-Fi networks and
data consumption.
Mobile operators can’t afford to keep up with the
explosion in data usage. In 2012, Strategy Analytics
estimated that there were approximately 1.7 million
commercial Wi-Fi venues world-wide. iPass as the
Wi-Fi roaming leader, has access to most of these
venues, twice as many as our next closest competitor.Going forward, many analysts expect the number of
commercial Wi-Fi venues to grow dramatically over
the next few years. iPass is uniquely positioned to take
advantage of this growing global demand for Wi-Fi.
As we move into 2013, we expect to see continued
strong growth in iPass Open Mobile revenue, driven
by greater adoption of iPass Wi-Fi by our user base,
acquiring new customers and the growth of deploy-
ment of Open Mobile on smartphones and tablets. In
2013 we will focus on creating value by:
1. Aggressively driving smartphone and tablet adop-tions with new customers and across our existing
base. Today approximately 30% of our Open Mobile
Wi-Fi network users are connecting from smart-
phones and tablets. This is the fastest growing part
of our business. By the end of the year, we intend to
expand that to more than 60% of our Open Mobile
Wi-Fi users representing the vast majority of our
Wi-Fi sessions and far outstripping our laptop users
and usage.
2. Ramping our OMX business: We are committed
to building traction for this service by focusing on
driving revenue growth through our existing partners
while continuing to add new carrier partners in
order to establish a dominant position in this new
exciting market.
3. Growing our network at a rapid pace: We intend to
continue to expand our leading global Wi-Fi presence
with the addition of substantial new commercial andcommunity footprint that we can make available to
our enterprise and service provider customers.
4. Completing migration to Open Mobile: We intend
to migrate a significant portion of our enterprise
base to our Open Mobile platform. By the end of the
year, we expect to have 90% of our customers on the
new platform.
From a bottom-line perspective, we intend to continue to
manage our resources wisely and invest in new product
initiatives. I am committed and confident about driving
our Open Mobile business forward, and I continue to
be optimistic about the company, our products and the
market we serve.
Thank you for your continued support. I look forward to
a successful 2013.
“We are living in an increasingly
connected mobile world. Wi-Fi is
increasingly becoming the preferredconnectivity option and the number of
Wi-Fi enabled devices is rising rapidly.”
EVAN L. KAPLAN
President and CEO

8/18/2019 iPass 2012 Annual Report
http://slidepdf.com/reader/full/ipass-2012-annual-report 6/80
iPASS INC. 2012 ANNUAL REPORT
8/18/2019 iPass 2012 Annual Report
http://slidepdf.com/reader/full/ipass-2012-annual-report 7/80
UNITED STATESSECURITIES AND EXCHANGE COMMISSION
Washington, D.C. 20549
Form 10-K(Mark One)
È ANNUAL REPORT PURSUANT TO SECTION 13 OR 15(d) OF THE SECURITIES EXCHANGE ACT OF 1934For the fiscal year ended December 31, 2012
OR
‘ TRANSITION REPORT PURSUANT TO SECTION 13 OR 15(d) OF THE SECURITIES EXCHANGE ACT OF1934
For the transition period from to
Commission File Number: 000-50327
iPass Inc.(Exact name of Registrant as specified in its charter)
Delaware 93-1214598(State or Other Jurisdiction
of Incorporation or Organization)(I.R.S. Employer
Identification No.)
3800 Bridge ParkwayRedwood Shores, California 94065
(Address of principal executive offices) (Zip Code)
Registrant’s telephone number, including area code: (650) 232-4100
Securities registered pursuant to Section 12(b) of the Act:Title of Each Class Name of Each Exchange on Which Registered
Common Stock, $0.001 Per Share Par Value NASDAQ Global Select Market
Securities registered pursuant to Section 12(g) of the Act:
None
Indicate by check mark if the registrant is a well-known seasoned issuer, as defined in Rule 405 of the Securities Act. Yes ‘ No È
Indicate by check mark if the registrant is not required to file reports pursuant to Section 13 or Section 15(d) of the Act. Yes ‘ No ÈIndicate by check mark whether the registrant (1) has filed all reports required to be filed by Section 13 or 15(d) of the Securities Exchange
Act of 1934 during the preceding 12 months (or for such shorter period that the registrant was required to file such reports), and (2) has beensubject to such filing requirements for the past 90 days. Yes È No ‘
Indicate by check mark whether the registrant has submitted electronically and posted on its corporate Web site, if any, every InteractiveData File required to be submitted and posted pursuant to Rule 405 of Regulation S-T (§ 232.405 of this chapter) during the preceding 12 months(or for such shorter period that the registrant was required to submit and post such files). Yes È No ‘
Indicate by check mark if disclosure of delinquent filers pursuant to Item 405 of Regulation S-K (§ 229.405 of this chapter) is not containedherein, and will not be contained, to the best of the registrant’s knowledge, in definitive proxy or information statements incorporated by referencein Part III of this form 10-K or any amendment to this Form 10-K. È
Indicate by check mark whether the registrant is a large accelerated filer, an accelerated filer, a non-accelerated filer, or a smaller reportingcompany. See the definitions of “large accelerated filer”, “accelerated filer” and “smaller reporting company” in Rule 12b-2 of the Exchange Act.(Check one):
Large accelerated filer ‘ Accelerated filer È
Non-accelerated filer ‘ (Do not check if a smaller reporting company) Smaller reporting company ‘Indicate by check mark whether the registrant is a shell company (as defined in Rule 12b-2 of the Act). Yes ‘ No È
Aggregate market value of the registrant’s common stock held by non-affiliates of the registrant, based upon the closing price of a share of the registrant’s common stock on June 29, 2012, as reported by the NASDAQ Global Select Market on that date: $123,301,469. Thedetermination of affiliate status for the purposes of this calculation is not necessarily a conclusive determination for other purposes. Thecalculation excludes approximately 8,727,041 shares held by directors, officers and stockholders whose ownership exceeded ten percent of theregistrant’s outstanding Common Stock as of June 30, 2012. Exclusion of these shares should not be construed to indicate that such personcontrols, is controlled by or is under common control with the registrant.
The number of shares outstanding of the Registrant’s Common Stock, $0.001 par value, as of February 28, 2013 was 61,821,210
DOCUMENTS INCORPORATED BY REFERENCE
Portions of the registrant’s definitive proxy statement in connection with our 2013 Annual Meeting of Stockholders to be filed with theSecurities and Exchange Commission not later than April 30, 2013, are incorporated by reference in Part III, Items 10, 11, 12, 13 and 14 of thisreport on Form 10-K.
8/18/2019 iPass 2012 Annual Report
http://slidepdf.com/reader/full/ipass-2012-annual-report 8/80
iPASS INC.
FORM 10-KFOR THE YEAR ENDED DECEMBER 31, 2012
TABLE OF CONTENTS
Page
PART I.Item 1. Business . . . . . . . . . . . . . . . . . . . . . . . . . . . . . . . . . . . . . . . . . . . . . . . . . . . . . . . . . . . . . . . . . . . . . 4
Item 1A. Risk Factors . . . . . . . . . . . . . . . . . . . . . . . . . . . . . . . . . . . . . . . . . . . . . . . . . . . . . . . . . . . . . . . . . . 11
Item 1B. Unresolved Staff Comments . . . . . . . . . . . . . . . . . . . . . . . . . . . . . . . . . . . . . . . . . . . . . . . . . . . . . 18
Item 2. Properties . . . . . . . . . . . . . . . . . . . . . . . . . . . . . . . . . . . . . . . . . . . . . . . . . . . . . . . . . . . . . . . . . . . . 18
Item 3. Legal Proceedings . . . . . . . . . . . . . . . . . . . . . . . . . . . . . . . . . . . . . . . . . . . . . . . . . . . . . . . . . . . . . 18
Item 4. Mine Safety Disclosures . . . . . . . . . . . . . . . . . . . . . . . . . . . . . . . . . . . . . . . . . . . . . . . . . . . . . . . . . 18
PART II.Item 5. Market For Registrant’s Common Equity, Related Stockholder Matters and Issuer Purchases of
Equity Securities . . . . . . . . . . . . . . . . . . . . . . . . . . . . . . . . . . . . . . . . . . . . . . . . . . . . . . . . . . . . . 19
Item 6. Selected Financial Data . . . . . . . . . . . . . . . . . . . . . . . . . . . . . . . . . . . . . . . . . . . . . . . . . . . . . . . . . 21Item 7. Management’s Discussion and Analysis of Financial Condition and Results of Operations . . . . 21
Item 7A. Quantitative and Qualitative Disclosures About Market Risk . . . . . . . . . . . . . . . . . . . . . . . . . . . . 34
Item 8. Financial Statements and Supplementary Data . . . . . . . . . . . . . . . . . . . . . . . . . . . . . . . . . . . . . . . 34
Item 9. Changes in and Disagreements With Accountants on Accounting and Financial Disclosure . . . . 35
Item 9A. Controls and Procedures . . . . . . . . . . . . . . . . . . . . . . . . . . . . . . . . . . . . . . . . . . . . . . . . . . . . . . . . . 35
Item 9B. Other Information . . . . . . . . . . . . . . . . . . . . . . . . . . . . . . . . . . . . . . . . . . . . . . . . . . . . . . . . . . . . . . 35
PART III.Item 10. Directors, Executive Officers and Corporate Governance . . . . . . . . . . . . . . . . . . . . . . . . . . . . . . . 36
Item 11. Executive Compensation . . . . . . . . . . . . . . . . . . . . . . . . . . . . . . . . . . . . . . . . . . . . . . . . . . . . . . . . 36
Item 12. Security Ownership of Certain Beneficial Owners and Management and Related Stockholder
Matters . . . . . . . . . . . . . . . . . . . . . . . . . . . . . . . . . . . . . . . . . . . . . . . . . . . . . . . . . . . . . . . . . . . . 36
Item 13. Certain Relationships and Related Transactions, and Director Independence . . . . . . . . . . . . . . . . 36
Item 14. Principal Accountant Fees and Services . . . . . . . . . . . . . . . . . . . . . . . . . . . . . . . . . . . . . . . . . . . . 36
PART IV.Item 15. Exhibits, Financial Statement Schedules . . . . . . . . . . . . . . . . . . . . . . . . . . . . . . . . . . . . . . . . . . . . 37
SIGNATURES . . . . . . . . . . . . . . . . . . . . . . . . . . . . . . . . . . . . . . . . . . . . . . . . . . . . . . . . . . . . . . . . . . . . . . . . . 64
INDEX TO EXHIBITS . . . . . . . . . . . . . . . . . . . . . . . . . . . . . . . . . . . . . . . . . . . . . . . . . . . . . . . . . . . . . . . . . . 67
2

8/18/2019 iPass 2012 Annual Report
http://slidepdf.com/reader/full/ipass-2012-annual-report 9/80
Disclosure Regarding Forward-Looking Statements
This annual report on Form 10-K contains forward-looking statements regarding future events and our
future results that are based on current expectations, estimates, forecasts, and projections about the industries in
which we operate and the beliefs and assumptions of our management. Words such as “expects,” “will,”
“anticipates,” “targets,” “goals,” “projects,” “intends,” “plans,” “believes,” “seeks,” “estimates,” “potential,”
variations of such words, and similar expressions are intended to identify forward-looking statements. In
addition, any statements which refer to projections of our future financial performance, our anticipated growthand trends in our business, and other characterizations of future events or circumstances, are forward-looking
statements. Readers are cautioned that these forward-looking statements are only predictions and are subject to
risks, uncertainties, and assumptions that are difficult to predict. Therefore, actual results may differ materially
and adversely from those expressed in any forward-looking statements. Readers are directed to risks and
uncertainties identified below, under “Item 1A. Risk Factors” and elsewhere herein, for factors that may cause
actual results to be different from those expressed in these forward-looking statements. Any forward-looking
statement speaks only as of the date on which it is made, and except as required by law, we undertake no
obligation to revise or update publicly any forward-looking statements for any reason.
3
8/18/2019 iPass 2012 Annual Report
http://slidepdf.com/reader/full/ipass-2012-annual-report 10/80
PART I
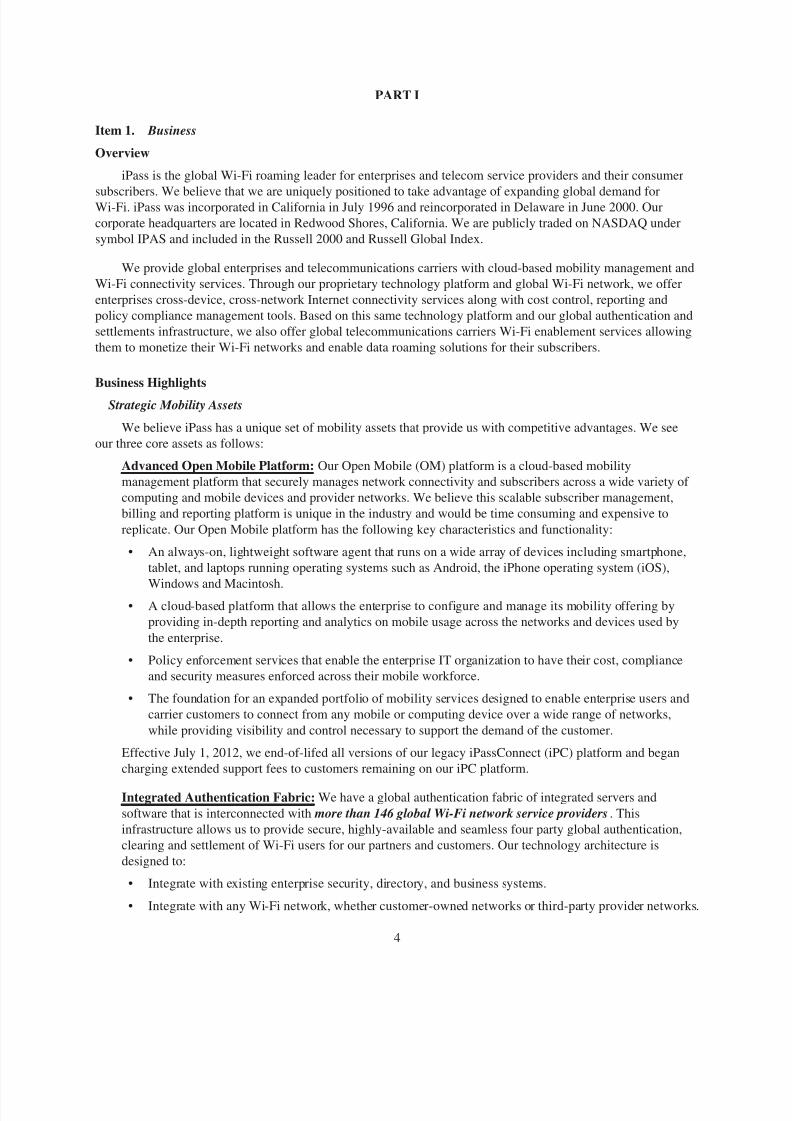
Item 1. Business
Overview
iPass is the global Wi-Fi roaming leader for enterprises and telecom service providers and their consumer
subscribers. We believe that we are uniquely positioned to take advantage of expanding global demand forWi-Fi. iPass was incorporated in California in July 1996 and reincorporated in Delaware in June 2000. Our
corporate headquarters are located in Redwood Shores, California. We are publicly traded on NASDAQ under
symbol IPAS and included in the Russell 2000 and Russell Global Index.
We provide global enterprises and telecommunications carriers with cloud-based mobility management and
Wi-Fi connectivity services. Through our proprietary technology platform and global Wi-Fi network, we offer
enterprises cross-device, cross-network Internet connectivity services along with cost control, reporting and
policy compliance management tools. Based on this same technology platform and our global authentication and
settlements infrastructure, we also offer global telecommunications carriers Wi-Fi enablement services allowing
them to monetize their Wi-Fi networks and enable data roaming solutions for their subscribers.
Business Highlights
Strategic Mobility Assets
We believe iPass has a unique set of mobility assets that provide us with competitive advantages. We see
our three core assets as follows:
Advanced Open Mobile Platform: Our Open Mobile (OM) platform is a cloud-based mobility
management platform that securely manages network connectivity and subscribers across a wide variety of
computing and mobile devices and provider networks. We believe this scalable subscriber management,
billing and reporting platform is unique in the industry and would be time consuming and expensive to
replicate. Our Open Mobile platform has the following key characteristics and functionality:
• An always-on, lightweight software agent that runs on a wide array of devices including smartphone,
tablet, and laptops running operating systems such as Android, the iPhone operating system (iOS),
Windows and Macintosh.• A cloud-based platform that allows the enterprise to configure and manage its mobility offering by
providing in-depth reporting and analytics on mobile usage across the networks and devices used by
the enterprise.
• Policy enforcement services that enable the enterprise IT organization to have their cost, compliance
and security measures enforced across their mobile workforce.
• The foundation for an expanded portfolio of mobility services designed to enable enterprise users and
carrier customers to connect from any mobile or computing device over a wide range of networks,
while providing visibility and control necessary to support the demand of the customer.
Effective July 1, 2012, we end-of-lifed all versions of our legacy iPassConnect (iPC) platform and began
charging extended support fees to customers remaining on our iPC platform.
Integrated Authentication Fabric: We have a global authentication fabric of integrated servers and
software that is interconnected with more than 146 global Wi-Fi network service providers. This
infrastructure allows us to provide secure, highly-available and seamless four party global authentication,
clearing and settlement of Wi-Fi users for our partners and customers. Our technology architecture is
designed to:
• Integrate with existing enterprise security, directory, and business systems.
• Integrate with any Wi-Fi network, whether customer-owned networks or third-party provider networks.
4
8/18/2019 iPass 2012 Annual Report
http://slidepdf.com/reader/full/ipass-2012-annual-report 11/80
• Embrace new access methods, devices, and applications.
• Facilitate innovation through third-party application development.
Global Wi-Fi Footprint: We have a Wi-Fi network footprint and supply chain that consists of more than
1.2 million commercial Wi-Fi hotspots in over 124 countries globally and across leading Wi-Fi venues,
including major airports, convention centers, airplanes, hotels, restaurants, retail and small business
locations. Our technology integration across multiple global network providers forms the basis of ournetwork services and we believe creates a unique cost advantage for our customers. We typically contract
with network service providers, integrate their networks into our global infrastructure, and monitor their
performance to ensure that our customers have a consistent and reliable end user experience.
Key iPass Market Statistics
We believe that iPass has a set of mobility assets at the confluence of the large and rapidly-growing global
Wi-Fi market, as evidenced below:
• 1.4 million: Unique users of iPass’ mobility services platform in 2012.
• 15 million: User authentications processed by iPass’ global infrastructure in 2012.
• 76,000: iPass hotel, conference venue and global airport hotspots.
• 73 million: iPass enabled Wi-Fi sessions in 2012.
• 25,000: iPass revenue generating managed network services endpoints in US locations.
• 29: iPass connectivity and authentication related patents.
Business Portfolio
Our business consists of two segments: (i) Mobility Services and (ii) Managed Network Services. Our
Mobility Services segment comprises two service offerings: (1) our Open Mobile Enterprise Services, and (2) our
Open Mobile Exchange.
Mobility Services
Open Mobile Enterprise Services (“iPass OME” or “OME”): iPass OME delivers enhanced network
mobility services, addressing large enterprises’ needs to manage their mobility economics, high speed
network connectivity requirements and proliferation of mobile devices, including the “bring-your-own-
device” trend. OME has evolved from our Enterprise Mobility Services offerings as we focus on our Open
Mobile business and migrate away from our legacy iPC services. OME consists primarily of our network
services and platform services, as follows:
Network Services: Our virtual network provides our enterprise and carrier customers access to more than
1.2 million global commercial Wi-Fi hotspots in over 124 countries globally and across leading Wi-Fi
venues. Our offerings span multiple geographies and are primarily focused on Wi-Fi access technologies.As such, we continue to wind down our legacy Dial-up and 3G connectivity options as we focus our efforts
on the Wi-Fi market.
Platform Services: Our cloud-based Open Mobile Platform enables enterprise users to connect from any
mobile device over a wide range of networks. These services allow our customers to effectively manage
their mobile workforces by controlling costs, enforcing compliance and ensuring security when workers
connect their mobile devices to the Internet and wireless networks. Effective July 1, 2012 we announced the
end-of-life of our legacy iPC platform.
5
8/18/2019 iPass 2012 Annual Report
http://slidepdf.com/reader/full/ipass-2012-annual-report 12/80
Open Mobile Exchange (“iPass OMX” or “OMX”): iPass OMX service offerings extend and enhance
core mobility and internet offerings by integrating our Open Mobile Platform technology and our worldwide
Wi-Fi Network, to allow global telecommunications carriers and service providers to seamlessly connect
their customers and subscribers to preferred global Wi-Fi networks. Our OMX platform consists of the
following three broad service areas:
Roam-in: Roam-in allows Wi-Fi providers to leverage their Wi-Fi network with “visiting” subscribers.
Accordingly, by joining the iPass network a Wi-Fi network operator makes their hotspots available to otherservice providers for commercial purposes.
Roam-out : Roam-out allows carriers and telecommunication service providers to provide their subscribers
with global Wi-Fi connectivity. To do so, a carrier provides its subscribers a Wi-Fi roaming service that
gives the subscriber access to the iPass global Wi-Fi network.
Wi-Fi Exchange: Exchange is an extensible, carrier-grade platform for Wi-Fi authentication and transaction
settlements. Our exchange allows Wi-Fi network operators and service providers who want to develop their
own private commercial relationships to access each other’s networks without building and managing the
actual interconnect, preferring to leverage the iPass exchange to optimize the interconnect topology and
reduce operational complexity.
Managed Network Services (“iPass MNS” or “MNS”)
iPass MNS provides customers with accelerated Wi-Fi and Wide Area Network solutions in the retail,
finance, healthcare, and carrier operator space throughout North America. In 2012, we launched a new managed
WLAN (Wireless Local Area Network) and Wi-Fi service that expands the MNS platform to enable enterprises,
venues, and retailers to deliver an in-store and in-office Wi-Fi experience to their employees and customers. Our
primary service offerings in our MNS business include:
Wi-Fi Cloud Connect : Our enterprise managed Wi-Fi offering is based on a controller-less platform that
provides fully-managed, secure and compliant Wi-Fi network access for standalone PCs, terminals and
handheld devices and tablets without the expense of a dedicated controller infrastructure.
Broadband Connect: Lies at the core of every one of our network solutions, and is designed to offer
centralized business-grade high-speed internet services, installation, and ongoing support.
MultiLink Connect and WAN Connect: Upgraded Broadband Connect products that provide a fully
managed, Internet-based IP VPN service that delivers reliable availability and scalable high-speed wide area
networking through our cloud-based monitoring and management technology platform.
Secure Web Gateway: Secure Web Gateway provides enterprises the flexibility to apply a centrally-
managed secure web gateway policy without the expense, concerns and delays attributed to scaling
corporate or provider internet egress circuits. Instead, traffic is routed directly from the endpoint to a cloud-
based global network of scanning systems optimized to deliver not only enterprise web security policy but
also eliminate performance impact to the endpoint, which allows iPass MNS customers to realize maximum
bandwidth potential at each endpoint.
Our Strategy
We intend to leverage our unique set of mobility assets across our business portfolio offerings to drive
growth in users, customers and Wi-Fi usage with an increasing focus on smartphone and tablet adoption,
delivering customer satisfaction via enhanced end user experience (both quality and engagement) across our
platform and network. We also intend to lead the consolidation of Wi-Fi global roaming via our OMX business
model, as well as scale our MNS business to embrace Wi-Fi as a core competitive offering.
6
8/18/2019 iPass 2012 Annual Report
http://slidepdf.com/reader/full/ipass-2012-annual-report 13/80
Our strategy consists of the following key elements and initiatives specific to our Mobility and MNS service
offerings:
Mobility Services Strategy
OME: Our key initiatives to increase Open Mobile platform penetration and Wi-Fi network usage are as
follows:
• Accelerate Adoption of Open Mobile on Smartphones and Tablets: We are focused on accelerating
smartphone and tablet user adoption of Open Mobile by simplifying the user activation process and
reducing the associated time and cost of customer deployments. We intend to continue to invest in
smartphone and tablet operating system development and integration of our end-user experience
findings to enhance the usability and to improve reliability of the network connection.
• Complete Open Mobile Migration: We are focused on completing the migration of most of our
legacy-customer installed base to the OM platform by the end of 2013. We plan on realizing this
migration with specific customer-related initiatives to reduce barriers to implementation and
deployment in both our enterprise and carrier customers. Our professional services deployment
organization is focused on decreasing migration friction and working with enterprise customers and
channel partners to drive more timely implementation and deployment of our Open Mobile platform.
We fully end-of-lifed our legacy iPC product, effective July 1, 2012, and will continue to encouragecustomers to migrate to Open Mobile or terminate their legacy services.
• Enhance Open Mobile User Experience: We are focused on enhancing the end-user experience on
our Open Mobile platform through innovative product features such as auto connect capabilities,
network quality assurance benchmarks, hotspot finder upgrades, and direct engagement and feedback
from our end-users.
• Focus on Large Multi-National Customers: We are focusing our sales efforts on large enterprise
customers, in particular, Fortune 1000 companies located in Europe and Asia where we believe our
value proposition is the strongest. We believe that the adoption of the Open Mobile platform at large
enterprises produces greater network user penetration, resulting in greater frequency-of-use of our
mobility platform and increased network usage.
OMX: We are focused on the following key initiatives in our OMX business:• Ramp OMX Revenue Growth: We are focused on growing our OMX revenue by working closely
with our existing OMX partners to onboard, develop, and rollout their integrated Wi-Fi roaming
offerings. We intend to continue to drive market awareness among carriers to ensure that they
proactively and aggressively promote the benefits of our OMX offerings.
• Continue to Sign New Carrier Partners: We believe global interest in the value proposition of our
OMX offering remains high and we intend to add new carrier and service provider partners as
customers for our OMX services. We believe that each new partner added enhances the value and
attractiveness of our offering as we create a scalable global solution.
MNS Strategy
Based on expected demand for our managed Wi-Fi service offerings, we are focused on the following keyinitiatives in our MNS business:
• Expand Portfolio of Offerings That Leverage Synergies with Wi-Fi Mobility Expertise: We
believe there are significant potential business synergies between our Mobility Services business lines
and MNS business that we plan to further leverage by continuing to launch new managed Wi-Fi
services offerings while expanding our portfolio of Wi-Fi offerings.
• Drive Revenue Growth and Profitability: We intend to drive revenue growth and profitability in our
MNS business by: (i) focusing on new customer acquisition and upsell opportunities with existing
7

8/18/2019 iPass 2012 Annual Report
http://slidepdf.com/reader/full/ipass-2012-annual-report 14/80
customers of our managed Wi-Fi service offerings; (ii) investing in new lead generation programs and
targeted marketing activities to drive Wi-Fi adoption; and (iii) launching a new MNS brand to embrace
the evolution in our Wi-Fi service offerings.
Geographic Revenue
Mobility service revenue and MNS revenue are derived from the following geographical locations:
For the Year Ended December 31,
2012 2011 2010
United StatesMobility Service Revenues . . . . . . . . . . . . . . . . . . . . . . . . 31% 37% 44%
Managed Network Service Revenues . . . . . . . . . . . . . . . . 26% 21% 18%
InternationalMobility Service Revenues . . . . . . . . . . . . . . . . . . . . . . . . 43% 42% 38%
Geographic revenues are determined by the location of the customer’s headquarters. No single customer
accounted for 10% or more of our revenues.
For further financial information on the Mobility Services and MNS segments, as well as long-lived assetsand geographic information, refer to the information contained in Note 15, “Segment and Geographic
Information,” in the Notes to the Consolidated Financial Statements included in Item 15. For risks attendant to
foreign operations, see the risk entitled “Because a meaningful portion of our business is international, we
encounter additional risks, which may impact our revenues and profitability” in “Item 1A. Risk Factors” of this
Form 10-K.
Seasonality
We generally experience seasonality in our business due to decreased business travel during the summer,
particularly in Europe, and during the year-end holiday season which results in lower usage of our network
services. Seasonal trends may cause fluctuations in our business results.
Network Service Providers
We have contractual relationships with approximately 300 telecommunications carriers, internet service
providers and other network service providers that enable us to offer our network services around the world. We
pay network service providers for access to their network on a usage, session or subscription basis. Most of these
contracts have a one or two-year term, after which either party can terminate the contract with notice. The
contracts we have entered into with providers are non-exclusive and may contain minimum commitments for the
purchase of network access.
Sales and Marketing
Our sales organizations are structured into regional account teams, which include sales management, sales
engineers and customer success teams. In our Mobility Services business, we sell our services directly throughour global sales force and indirectly through our reseller and carrier partners. In our MNS business, we sell
services directly through our sales force in the United States. We maintain sales offices or personnel in a number
of cities in the United States as well as in the United Kingdom, India, Australia, Japan, Germany, France,
Singapore, and The Netherlands. As of December 31, 2012, our sales organization comprised 55 individuals:
26 in North America, 24 in Europe, Middle East and Africa (“EMEA”) and 5 in Asia Pacific.
Our reseller partners, OEM carriers and carrier partners typically sign a one to two-year agreement with us
through which we appoint them as a non-exclusive reseller of our services. Their reseller responsibilities vary
8

8/18/2019 iPass 2012 Annual Report
http://slidepdf.com/reader/full/ipass-2012-annual-report 15/80
and may include actively marketing and selling our services, deploying and supporting customer accounts, and
implementing and managing billing for their customers. Our current sales structure allows us to offer our services
without incurring the full cost of customer acquisition (sales and marketing) or customer post-sales support. Our
reseller partners, OEM carriers and carrier partners typically sell complementary hardware, software, and
services, and bundle our services with their core offerings. They may also have a base of existing customers to
whom they can efficiently sell our portfolio of services. In many cases our salespeople do support our reseller
partners, OEM carriers and carrier partners with closing new business, and our post-sales team may work withthem to ensure successful implementation of our services. However, the enterprise or consumer remains the
customer of our reseller partners, OEM carriers or carrier partners and has no direct financial relationship
with us.
We focus our marketing efforts on establishing a strong corporate reputation in the market, creating
awareness and preference for our services and their benefits, educating potential customers, generating new sales
opportunities, generating end-user awareness and demand within existing customer accounts and enabling our
sales force and channel partners to effectively sell and provide our service offerings. We conduct a variety of
marketing programs that may include advertising, promotions, public relations, analyst relations, telemarketing,
direct marketing, web and e-mail marketing, collateral and sales tools creation, seminars, events and trade shows,
training, co-operative channel marketing, internet marketing and promotions.
Competition
Our approach to addressing the mobility challenges and needs of the enterprise is to provide an integrated
platform and suite of value-added services that offer connectivity, reporting and analytics, policy management,
and network services. While there are numerous point solution providers that offer varying individual or in some
cases combinations of the various mobility services similar to the services we offer, we are not aware of any
competitor that provides Wi-Fi global roaming, OM platform or range of services in an integrated offering as we
do. Further, we believe that the self-service nature of our platform that allows an enterprise to configure and
manage their own custom mobility service is an important and differentiating factor for us.
The mobility market is very fragmented with a variety of competitors, including facilities-based carriers,
cloud-based platform operators and mobility management solution providers. We compete based on a number of
factors including geographic network coverage, pricing, multiple network technology support, network
reliability, quality of service, platform functionality and features, ease of implementation, ease of use and ease of
management. We believe we have the largest commercial Wi-Fi network in the world; however, since we don’t
own the network, our competitors that own their own Wi-Fi networks can offer lower Wi-Fi pricing than we do.
As we continue to expand our mobility offerings beyond network services to include an integrated platform
of mobility services delivered through our cloud-based platform, we may also encounter additional competitors
in the marketplace, including mobility management solution providers which offer mobile device management,
mobile security, and telecommunication expense management software and services, among other mobility
offerings.
With respect to network connectivity and mobility services, we compete with the national
telecommunications carriers that provide a suite of services to enterprise customers. In this area, our Wi-Fi
offerings also compete directly with 3G and 4G related network connectivity options. To a lesser extent wecompete with cloud-based platform operators who may also provide managed services such as VPNs and
firewalls, and additional telecommunications services such as local exchange and long distance services,
voicemail and DSL services. We do have channel partners that offer these types of services in conjunction with
our service, but we do not offer these additional services directly.
With respect to our Managed Network Services, we compete with a variety of providers, including large
connectivity providers that own their own networks and have a broad range of network solutions and smaller
regional providers.
9

8/18/2019 iPass 2012 Annual Report
http://slidepdf.com/reader/full/ipass-2012-annual-report 16/80
Research and Development
We are committed to continuing to enhance our underlying technology and continuing to innovate and
incorporate new technologies and features into our services and network architecture. Our research and
development efforts are focused on improving and enhancing our platform and service offerings as well as
developing new services, especially for smartphones and tablets. As of December 31, 2012, our research and
development organization consisted of 135 employees, approximately 56 in North America, 75 in Asia Pacific,
and 4 in EMEA. Our research and development expenses were $13.7 million, $14.4 million and $13.8 million in2012, 2011 and 2010, respectively.
Intellectual Property
We believe our technology and platform contains valuable intellectual property and we rely on a
combination of trademark, copyright, trade secret laws, patents and disclosure restrictions to protect these
intellectual property rights. We license third-party technologies that are incorporated into our services. We also
enter into confidentiality and proprietary rights agreements with our employees, consultants and other third
parties and control access to software, documentation and other proprietary information. We have a patent
portfolio, solely related to our Mobility Services business consisting of twenty-three U.S. patents, two Australian
patents, one Israeli patent and three European patents (in United Kingdom, Germany and France). Our patents
expire between 2016 and 2025. In 2012 we were granted one new U.S. patent. We currently have ten U.S. patentapplications pending, and sixteen international patent applications pending (in the same subject areas as the U.S.
patent applications). iPass and the iPass logo are registered trademarks. We have also applied for or registered
company trademarks in the U.S. and numerous other countries.
Employees
As of December 31, 2012, we had 358 employees of which 211 were located in North America, 108 in
Asia Pacific, and 39 in EMEA.
Available Information
We use our website, www.ipass.com, as a routine channel for distribution of important information,
including news releases, annual reports on Form 10-K, quarterly reports on Form 10-Q, current reports on
Form 8-K, and amendments to those reports filed or furnished pursuant to Section 13(a) or 15(d) of the Securities
and Exchange Act, as amended, as soon as reasonably practicable after they are electronically filed with, or
furnished to the U.S. Securities and Exchange Commission (“SEC”). All of these postings and filings are
available on our website free of charge. The content on any website referred to in this Form 10-K is not
incorporated by reference into this Form 10-K.
10
8/18/2019 iPass 2012 Annual Report
http://slidepdf.com/reader/full/ipass-2012-annual-report 17/80
Item 1A. Risk Factors
Our business is subject to a number of risks, many of which are described below. If any of the events
described in these risks factors actually occur, our business, financial condition or results of operations could be
materially and adversely affected, which would likely have a corresponding impact on the value of our common
stock. Further, the risk factors described below could cause actual results to differ materially from the results
contemplated by the forward-looking statements contained in this report. These risk factors should be reviewed
carefully.
If our Open Mobile Platform does not achieve market acceptance or customer adoption and deployment of our
Open Mobile Platform is slow, especially on smartphone and tablet devices, our ability to grow our Mobility
Services business could be harmed.
The future success of our business will depend in large part on our current and prospective customers’
acceptance of our Open Mobile Platform and enterprise mobility services, as well as the timeliness of our
customers’ adoption and deployment of our Open Mobile Platform. Key risks associated with our Open Mobile
Platform and services are as follows:
Customer adoption and deployment of our Open Mobile Platform, especially on smartphone and tablet
devices, may be slow. We believe that the growth of our business is dependent on the timely adoption anddeployment of the Open Mobile Platform by our customers. In particular, smartphone and tablet devices are
becoming more relied upon by our customers for their mobile computing needs and may cause our users to stop
using laptops while traveling, or to use them less often. We believe it is critical for our business that our services
for smartphone and tablet devices achieve market acceptance and that our customers rapidly adopt and deploy
our services on smartphone and tablet devices. A material delay in the adoption and deployment of the Open
Mobile Platform by our customers, on smartphone and tablet devices in particular, will adversely impact our
ability to grow revenues and achieve profitability.
Customer deployment of our Open Mobile Platform may not result in increased use of our services. We
believe it is important to the future success of our business that users of our Mobility Services increase their
usage of our platform and network services. We believe that the deployment by our customers of our Open
Mobile Platform, especially on smartphone and tablet devices, will lead to increased usage of our platform
services and correspondingly, our network services, which will lead to an increase in our revenue. However, even
if a significant portion of our customers deploy our Open Mobile Platform, there is no guarantee that our
customers will use our services more frequently.
Our Open Mobile Platform may not have all functionality desired by our customers. There is risk that we
may not release versions of the Open Mobile Platform in a timely manner that contain features that our customers
desire and we will need to provide our customers with stable, easy to use, feature-rich and valuable enterprise
mobility services related to security, policy control, user activation, authentication and reporting. Further, the
Open Mobile Platform may contain technological limitations, bugs or errors that would cause our customers to
not adopt or delay the adoption of the Open Mobile Platform. If some or all of these risks associated with our
Open Mobile Platform were to occur, market acceptance of the platform may not occur and our business could be
harmed.
Customers must be willing to continue to pay for our platform for us to generate meaningful revenues and
growth. We believe that it is important that the value proposition of our Open Mobile Platform is accepted by our
customers such that they are willing to pay for their users to use our mobility services. If our customers are
willing to adopt our Open Mobile Platform but are not willing to pay for the platform, our ability to grow
revenues and achieve profitability could be adversely impacted.
11
8/18/2019 iPass 2012 Annual Report
http://slidepdf.com/reader/full/ipass-2012-annual-report 18/80
If our OMX service offerings do not achieve market acceptance our ability to grow our business could be
harmed.
Our OMX service offerings were introduced in 2011 and incorporate our Open Mobile Platform, global
authentication fabric, and global Wi-Fi network to provide mobile network operators, telecommunication carriers
and service provider partners around the world with the infrastructure to offer their customers new mobility
services. We have entered into contracts with a number of customers for our OMX services; however, we havenot yet received any meaningful revenue from these customers. We have and plan to continue to devote
significant resources building our OMX service line of business. If OMX service offerings do not achieve market
acceptance and generate meaningful revenue our financial condition may be harmed.
If Global 3G/4G data roaming rates decline precipitously, our ability to grow our business could be harmed.
For our network services to be attractive to our customers, the cost of 3G/4G roaming must be meaningfully
greater than the cost of our Wi-Fi network services. Currently, in certain geographies such as Asia, 3G/4G
roaming prices are not significantly higher than our rates for Wi-Fi access. In Europe, legislation has been
enacted mandating the reduction of wholesale 3G/4G roaming prices. If 3G/4G roaming prices do not remain
meaningfully higher than our Wi-Fi network prices then our ability to sell our Mobility Services could be
impacted and our business harmed.
Our decision to “End-of-Life” our legacy iPC platform product has and will continue to impact our total
revenues.
As of July 1, 2012 our iPC or legacy platform reached end-of-life. While the iPC platform will continue to
function for existing customers, we will only provide basic support and only for customers that pay extended
support fees. While we believe that the end-of-life of iPC will encourage our customers to migrate to our Open
Mobile platform, iPC customers may decide to instead terminate their service with us. If the number of iPC
customers who decide to terminate their service with us is greater than expected, our results of operations could
be negatively impacted.
If key global Wi-Fi venues offer “no charge” Internet access, our network revenues could be negatively
affected.
We derive a significant portion of our network revenue from providing Wi-Fi access in certain key venues
(e.g., hotels, airports and cafes). In general, these venues charge their customers for Wi-Fi access. If these venues
begin offering Wi-Fi access at no charge, the amount we can charge our customers for Wi-Fi access at these
venues will likely decrease or we may not charge our customers for Wi-Fi access at these venues. For example,
Starbucks and certain airports in the United States have ceased charging their customers for Wi-Fi access and we
have experienced reduced revenues as a result. If this trend continues at other key Wi-Fi venues, our network
revenues and overall profitability may be negatively impacted.
If we do not accurately predict network usage for our Flat Rate price plans, our costs could increase without a
corresponding increase in network revenue.
A significant number of our customers have purchased our Flat Rate network price plans, and we are
signing new customers to this plan. In this plan, our customers pay a flat rate price to access our network
services. However, in the majority of situations we continue to pay our providers based on actual network usage.
The rate we charge in our Flat Rate price plans is based on statistical predictions of usage across a pool of
users within a customer. If actual usage is higher than expected our ability to achieve profitability could be
negatively impacted.
12
8/18/2019 iPass 2012 Annual Report
http://slidepdf.com/reader/full/ipass-2012-annual-report 19/80
If demand for mobility services does not grow or grows in ways that do not require use of our services, we may
experience a decline in revenues and profitability.
The growth of our business is dependent, in part, upon the increased use of mobility services and our ability
to capture a higher proportion of this market. If the demand for mobility services does not continue to grow, or
grows in ways that do not require use of our services, then we may not be able to grow our business, or achieve
or maintain profitability. Increased usage of our Mobility Services depends on numerous factors, including:
• Willingness of enterprises to make additional information technology expenditures;
• Availability of security services necessary to ensure data privacy over a variety of networks;
• Quality, cost and functionality of our services and competing services;
• Increased adoption of wireless broadband access methods and our ability to support these new
methods;
• Proliferation of smartphones, tablets and mobile handheld devices and related applications, and our
ability to provide valuable services and support for those devices;
• Our ability to partner with mobile network operators and service providers that are willing to stimulate
consumer awareness and adoption of our Mobility Services; and
• Our ability to timely implement technology changes to our services to meet evolving industry standardsfor mobile devices, Wi-Fi network access and customer business requirements.
If we are unable to meet the challenges posed by Wi-Fi access, our ability to profitably grow our business may
be impaired.
A substantial portion of the growth of our business has depended, and will continue to depend, in part upon
our ability to expand our global Wi-Fi network. Such an expansion may not result in additional revenues to us.
Key challenges in expanding our Wi-Fi network include:
The Wi-Fi access market continues to develop at a rapid pace. We derive a significant portion of our revenues
from wireless broadband “hotspots,” such as certain airports, hotels and convention centers. The Wi-Fi access
market, continues to develop rapidly, in particular: the market for enterprise connectivity services through Wi-Fi is
characterized by evolving industry standards and specifications and there is currently no uniform standard for Wi-Fiaccess. Furthermore, although the use of wireless frequencies generally does not require a license in the United
States and abroad, if Wi-Fi frequencies become subject to licensing requirements, or are otherwise restricted, this
would substantially impair the growth of Wi-Fi access. Some large telecommunications providers and other
stakeholders that pay large sums of money to license other portions of the wireless spectrum may seek to have the
Wi-Fi spectrum become subject to licensing restrictions. If the Wi-Fi access market develops in ways that limit
access growth, our ability to generate substantial revenues from Wi-Fi access could be harmed.
The Wi-Fi service provider market is highly fragmented. There are currently many Wi-Fi service providers
that provide coverage in only one or a small number of hotspots. We have entered into contractual relationships
with numerous Wi-Fi service providers. These contracts generally have an initial term of two years or less. We
must continue to develop relationships with many providers on terms commercially acceptable to us in order to
provide adequate coverage for our customers’ mobile workers and to expand our Wi-Fi coverage. We may alsobe required to develop additional technologies in order to integrate new wireless broadband services into our
service offering. If we are unable to develop these relationships or technologies, our ability to grow our business
could be impaired.
Consolidation of large Wi-Fi service providers may impair our ability to expand network service coverage,
negotiate favorable network access terms, and deliver consistent service in our network. The telecommunications
industry is rapidly evolving and highly competitive. These factors may cause large Wi-Fi network service
providers to consolidate, which would reduce the number of network service providers from which we are able to
13
8/18/2019 iPass 2012 Annual Report
http://slidepdf.com/reader/full/ipass-2012-annual-report 20/80
obtain network access in key locations. If significant consolidation occurs, we will have a smaller number of
network service providers to acquire Wi-Fi network access from and we may not be able to provide additional or
sufficient redundant access points in some geographic areas, which could diminish our ability to provide broad,
reliable, redundant coverage. Further, our ability to negotiate favorable access rates from Wi-Fi network service
providers could be impaired, which could increase our network access expenses and harm our operating results.
Wi-Fi service provider actions may restrict our ability to sell our services. Some Wi-Fi network providersrestrict our ability to sell access to their networks to our resellers whom they consider competitive with them.
This can reduce our revenue by limiting the footprint our partners can make available to their customers.
Significant dependency on key network providers could negatively affect our revenues.
There are certain venues (hotels, airports, cafes, etc.) globally where we depend on key providers for
network access in those venues. In addition, in certain geographies we depend on a small number of providers for
a large portion of network access. If such a provider were to go out of business, terminate their agreement with
us, encounter technical difficulty such that network access was not available to our customers for an extended
period of time, it could have a negative impact on our revenues and profitability if we cannot find an alternative
provider to enable network access in those venues or geographies.
We face competition in the market for mobility services, which could make it difficult for us to succeed.
While we do not believe there are service providers in the mobility services market that offer a platform or
range of services in an integrated offering as we do, we compete with a variety of service providers, including
facilities-based carriers, cloud-based platform operators and mobility management solution providers. Some of
these providers have substantially greater resources, larger customer bases, longer operating histories and/or
greater name recognition than we have. In addition, we face the following challenges:
Many of our competitors can compete on price. Because many of our facilities-based competitors own and
operate physical networks they may be able to provide additional hotspot access at little incremental cost to them.
As a result, they may offer network access services at a lower cost, and may be willing to discount or subsidize
network access services to capture other sources of revenue. In contrast, we have traditionally purchased network access from facilities-based network service providers to enable our network access service and in these cases,
may not be able to compete aggressively on price. In addition, new cloud-based platform operators may enter the
mobility services market and compete on price. In either case, we may lose business or be forced to lower our
prices to compete, which could reduce our revenues.
Many of our competitors offer additional services that we do not, which enables them to bundle these
services and compete favorably against us. Some of our competitors provide services that we do not, such as
3G/4G data roaming, local exchange and long distance services, voicemail and digital subscriber line, or DSL,
services. Potential customers that desire these services on a bundled basis may choose to subscribe to network
access from a competitor that provides these additional services.
Our potential customers may have unrelated business relationships with our competitors and consider those
relationships when deciding between our services and those of our competitors. Many of our competitors are
large facilities-based carriers that purchase substantial amounts of services or provide other services or goods
unrelated to network access services. As a result, if a potential customer is also a supplier to one of our large
competitors, or purchases unrelated services or goods from our competitor, the potential customer may be
motivated to purchase its network access services from our competitor in order to maintain or enhance its
business relationship with that competitor. In addition, our current or potential carrier customers may already
have or may consider buying services from mobility management solution providers which may impact our
ability to sell our services to those customers as well as drive market prices down for the services that we offer.
14
8/18/2019 iPass 2012 Annual Report
http://slidepdf.com/reader/full/ipass-2012-annual-report 21/80
Users may take advantage of free Wi-Fi networks for Internet and corporate access. Telecommunications
providers may offer free Wi-Fi as part of a home broadband or other service contract, which may force down the
prices which the market will bear for our services and could reduce our revenues.
We face strong competition in the market for managed network services, which could make it difficult for us
to grow.
In the market for managed network services, we compete with a variety of large connectivity service providers,
many of whom own their own networks. We see the competition from these larger service providers, which own
their own networks, in two primary ways: first in that they can provide a broader range of network options, for
example, MPLS (Multiprotocol Label Switching), Frame Relay, Wire line and Wireless Voice, and, second, they
can integrate their separate products providing cross-product subsidization. There are also small regional players
with a similar model to ours who compete with us. If we are not able to offer competitively priced offerings that are
profitable for us, we may have difficulty growing our Managed Network Services business.
If our carrier and channel partners do not successfully market our Mobility Services to their customers, then
our ability to grow our revenues could be impaired.
We sell our services directly through our sales force and indirectly through our channel partners, which include
telecommunication carriers, systems integrators and value-added resellers. A large percentage of our sales outsidethe United States are made through our carrier and channel partners. Our business depends on the efforts and the
success of these carrier and channel partners in marketing our services to their customers. Our own ability to
promote our services directly to our carrier and channel partners’ customers is often limited. Many of our carrier
and channel partners may offer services to their customers that may be similar to, or competitive with, our services.
Therefore, these channel partners may not actively promote our services. If our channel partners fail to market our
services effectively, our ability to grow our revenue could be reduced and our business may be impaired.
Our network revenue and overall profitability may be adversely impacted by material reductions in existing
customer and partner minimum commitments.
Our customers and partners that are billed on a usage basis have traditionally entered into contractual
provisions that require them to pay the greater of the fees generated from the use of our services or a minimumcommitted amount over a pre-determined time period. Minimum commitments are negotiated by customers to
improve their usage unit pricing, effectively guaranteeing a certain volume to achieve a reduced unit price.
Recent global economic conditions in certain cases caused our customers and partners to generate fees from the
use of our services that are significantly less than their minimum committed amounts. Consequently this shortfall
has caused some partners and customers upon renewal of their contracts with us, to renew with a lower minimum
commitment and in some cases with no minimum commitment. Additionally, in some cases partners and
customers are requesting a re-evaluation of their minimum commitments on a prospective basis during the term
of their existing contract; to maintain these commercial relationships, we have addressed these requests on a
contract by contract basis. The reduction or elimination of minimum commitments means that a larger percentage
of future revenue will be based on the actual usage of our services and may result in a decrease in our revenues
and our ability to achieve profitability could be negatively impacted.
We recently implemented a new enterprise resource planning (ERP) solution. Risks generally associated with
the implementation of an ERP system may adversely affect operations and/or the effectiveness of internal
controls over financial reporting.
During the first quarter of 2013, we went live with a new ERP system to enhance our operating efficiencies,
provide timelier operating and financial information, and scale our infrastructure efficiently in support of our
business model. Deployment of ERP systems and related software carry potential risks such as cost overruns,
project delays and business interruptions. If we experience a material business interruption as a result of our ERP
15
8/18/2019 iPass 2012 Annual Report
http://slidepdf.com/reader/full/ipass-2012-annual-report 22/80
deployment, it could have a material adverse effect on our business. Additionally, if the ERP system does not
operate as intended, it could adversely affect our financial reporting systems, our ability to produce financial
reports, or the effectiveness of internal controls over financial reporting.
Our software is complex and may contain errors that could damage our reputation and decrease usage of our
services.
Our software may contain errors that interrupt network access or have other unintended consequences. If network access is disrupted due to a software error, or if any other unintended negative results occur, such as the
loss of billing information, a security breach, unauthorized access to our cloud-based platform or the introduction
of a virus by our software onto our customers’ computers or networks, our reputation could be harmed and our
business may suffer. Our contracts generally limit our exposure to incidental and consequential damages and to
the extent possible; we further limit our exposure by entering into insurance policies that are designed to protect
our customers and us from these and other types of losses. If these contract provisions are not enforced or
enforceable, or if liabilities arise that are not effectively limited or insured, our operating results and financial
condition could be harmed.
Because a meaningful portion of our business is international, we encounter additional risks, which may
impact our revenues and profitability.
We generate a substantial portion of our revenues from international customers. Revenues from customers
domiciled outside of the United States were approximately 43% of our revenues in 2012, of which approximately
32% and 10% were generated in the EMEA and Asia Pacific regions, respectively. The functional currency of
our foreign subsidiaries is the U.S. Dollar and we currently bill nearly all of our services in U.S. Dollars.
However, we pay certain expenses in local currencies. During the years ended December 31, 2012, 2011 and
2010, we have not entered into any hedging contracts to manage foreign currency exposure. Our international
operations subject our business to specific risks that could negatively impact our business, including:
• Generally longer payment cycles for foreign customers;
• The impact of changes in foreign currency exchange rates on both the attractiveness of our USD-based
pricing and our operating results, particularly upon the re-measurement of assets, liabilities, revenues
and expenses and the transactional settlement of outstanding local currency liabilities;
• High taxes in some foreign jurisdictions;
• Difficulty in complying with Internet and data privacy related regulations in foreign jurisdictions;
• Difficulty enforcing intellectual property rights and weaker laws protecting these rights; and
• Ability to efficiently deploy capital and generate returns in foreign jurisdictions.
We may be exposed to credit risk, collection risk and payment delinquencies on our accounts receivable.
A substantial majority of our outstanding accounts receivables are not secured. Our standard terms and
conditions permit payment within a specified number of days following the receipt of our services. While we
have procedures to monitor and limit exposure to credit risk on our receivables, there can be no assurance such
procedures will effectively limit our collection risk and avoid losses. In addition, under poor global economic
conditions, certain of our customers have faced and may face liquidity concerns and have delayed and may delayor may be unable to satisfy their payment obligations, which may have a material adverse effect on our financial
condition and operating results.
Our sales cycles are lengthy and could require us to incur substantial costs that may not result in related
revenues.
Our business is characterized by a lengthy sales cycle. Once a contract with a customer is signed there is
typically an extended period before the customer or customer’s end-users actually begin to use our services,
16

8/18/2019 iPass 2012 Annual Report
http://slidepdf.com/reader/full/ipass-2012-annual-report 23/80
which is when we begin to realize network revenues. As a result, we may invest a significant amount of time and
effort in attempting to secure a customer which may not result in any revenues in the near term. Even if we enter
into a contract, we may have incurred substantial sales-related expenses well before we recognize any related
revenues. If the expenses associated with sales efforts increase and, we are not successful in our sales efforts, or
we are unable to generate associated offsetting revenues in a timely manner, our operating results could be
harmed.
Cyber security risks and privacy concerns related to Internet-based services could reduce demand for our
services.
The secure transmission of confidential information and mission critical data when using Internet-based
services is extremely important to our customers. A key component of our ability to attract and retain customers
is the security measures that we have engineered into our network for the authentication of the end-user’s
credentials. These measures are designed to protect against unauthorized access to our customers’ networks.
Because techniques used to obtain unauthorized access or to sabotage networks change frequently and generally
are not recognized until launched against a target, we may be unable to anticipate these techniques or to
implement adequate preventative measures against unauthorized access or sabotage. If an actual or perceived
breach of network security occurs, that is attributable to our services, the market perception of the effectiveness
of our cyber security measures could be harmed resulting in a negative impact to our business.
As part of providing our services, we collect certain information about the users of our service. As such we
must comply with evolving laws and regulations regarding the protection and disclosure of such user
information. While we have taken steps to comply with applicable privacy laws and regulations and to protect
user information, any well-publicized compromises of our users’ data may reduce demand for our services and
harm our business.
We rely significantly on information technology to accurately bill our customers and any failure, inadequacy
or interruption of that technology could negatively impact our ability to report on our financial performance
on a timely basis.
A key component of our ability to attract and retain customers is the timely and accurate furnishing of
monthly detail billing records of activity on our network, rated for the agreements in place with both our
customers and our suppliers. Our ability to meet these billing requirements, as well as to effectively manage andmaintain our books and records and internal reporting requirements, depends significantly on our internal
information technology. In January 2013, we migrated to a new enterprise resource planning system to enable us
to more efficiently scale these accounting, billing, and reporting requirements. The inability of this new system to
operate effectively or to integrate with other systems, or a breach in security of this or related systems could
cause delays in billing and reduced efficiency of our operations, or negatively impact our system of internal
controls over financial reporting, any of which could require significant capital investments to remediate.
If licenses to third party technologies do not continue to be available to us at a reasonable cost, or at all, our
business and operations may be adversely affected.
We license technologies from several software providers that are incorporated into our services. We
anticipate that we will continue to license technology from third parties in the future. Licenses to third party
technologies may not continue to be available to us at a reasonable cost, or at all. The loss of the right to usethese technologies or other technologies that we license could have an adverse effect on our services and increase
our costs or cause interruptions, degradations or delays in our services until substitute technologies, if available,
are developed or identified, licensed and successfully integrated into our services.
Litigation arising out of intellectual property infringement could be expensive and disrupt our business.
We cannot be certain that our services do not, or will not, infringe upon patents, trademarks, copyrights or
other intellectual property rights held by third parties, or that other parties will not assert infringement claims
17
8/18/2019 iPass 2012 Annual Report
http://slidepdf.com/reader/full/ipass-2012-annual-report 24/80
against us. Any claim of infringement of proprietary rights of others, even if ultimately decided in our favor,
could result in substantial costs and diversion of our resources. Successful claims against us may result in an
injunction or substantial monetary liability, which in either case could significantly impact our results of
operations or materially disrupt the conduct of our business. If we are enjoined from using a technology, we will
need to obtain a license to use the technology, but licenses to third-party technology may not be available to us at
a reasonable cost, or at all.
In order to compete, we must attract and retain key employees, and our failure to do so could harm our results
of operations.
In order to compete, we must attract and retain executives, sales representatives, engineers and other key
employees. Hiring and retaining qualified executives, sales representatives and engineers are critical to our
business, and competition for experienced employees in our industry can be intense. If we experience significant
turnover of our executives, sales representatives, engineers and other key employees it will be difficult to achieve
our business objectives and could adversely impact our results of operations.
Item 1B. Unresolved Staff Comments
None
Item 2. Properties
We lease approximately 48,000 square feet of space for our headquarters in Redwood Shores, California
under a lease that expires in 2015. We also lease sales and support offices in other parts of the Unites States and
abroad in EMEA and Asia Pacific. We believe that our principal facility in Redwood Shores, and sales and
support offices in other parts of the Unites States and abroad are adequate for our business needs, and we expect
that additional facilities will be available in other jurisdictions to the extent we need to add new offices.
Item 3. Legal Proceedings
Not applicable.
Item 4. Mine Safety Disclosures
Not applicable.
18
8/18/2019 iPass 2012 Annual Report
http://slidepdf.com/reader/full/ipass-2012-annual-report 25/80
PART II
Item 5. Market For Registrant’s Common Equity, Related Stockholder Matters and Issuer Purchases of
Equity Securities
Price Range of Common Stock
Our common stock is traded on the NASDAQ Global Select Market under the symbol “IPAS”. Thefollowing table sets forth the intra-day high and low sale price of our common stock, in each quarterly period
presented within the two most recent years, as reported on the NASDAQ Global Select Market:
Price rangeHigh Low
Year ended December 31, 2012:First Quarter . . . . . . . . . . . . . . . . . . . . . . . . . . . . . . . . . . . . . . . . . $2.80 $1.33
Second Quarter . . . . . . . . . . . . . . . . . . . . . . . . . . . . . . . . . . . . . . . 2.70 2.07
Third Quarter . . . . . . . . . . . . . . . . . . . . . . . . . . . . . . . . . . . . . . . . . 2.39 1.71
Fourth Quarter . . . . . . . . . . . . . . . . . . . . . . . . . . . . . . . . . . . . . . . . 2.21 1.65
Year ended December 31, 2011:First Quarter . . . . . . . . . . . . . . . . . . . . . . . . . . . . . . . . . . . . . . . . . $1.71 $1.25
Second Quarter . . . . . . . . . . . . . . . . . . . . . . . . . . . . . . . . . . . . . . . 1.65 1.19
Third Quarter . . . . . . . . . . . . . . . . . . . . . . . . . . . . . . . . . . . . . . . . . 1.98 1.12
Fourth Quarter . . . . . . . . . . . . . . . . . . . . . . . . . . . . . . . . . . . . . . . . 1.53 1.11
We had 61,821,210 shares of our common stock outstanding as of February 28, 2013, held by 110 holders of
record, although there are a significantly larger number of beneficial owners of our common stock.
Dividends
In December 2010 we paid a cash dividend of $0.07 per share, for a total of $4.0 million, to holders of our
common stock. We did not pay any other cash dividends on our common stock in 2012, 2011, or 2010. We
currently do not expect to pay cash dividends, although the declaration of any future cash dividend is at the
discretion of the Board of Directors and will depend on the financial condition, results of operations, capital
requirements, business conditions and other factors, as well as a determination that cash dividends are in the best
interest of our stockholders.
Unregistered Sales of Equity Securities and Use of Proceeds
The following table sets forth repurchases made in the fourth quarter of the current fiscal year 2012:
Date
TotalNumber of
SharesPurchased
AveragePrice Paid
Per Share(3)
TotalNumber of Shares (or
units)Purchased as
Part of Publicly
AnnouncedPlans or
Programs
MaximumNumber (orapproximatedollar value)of Shares (orunits) ThatMay Yet BePurchasedUnder the
Plans orPrograms
October 9, 2012(1) . . . . . . . . . . . . . . . . . . . . . 15,036 $1.94 — —
December 10, 2012(2) . . . . . . . . . . . . . . . . . . . 33,000 $1.77 — —
(1) Represents the common stock withheld for the purpose of satisfying tax withholding obligations with respect to the vesting of restricted
stock awards by certain officers of the company.
19
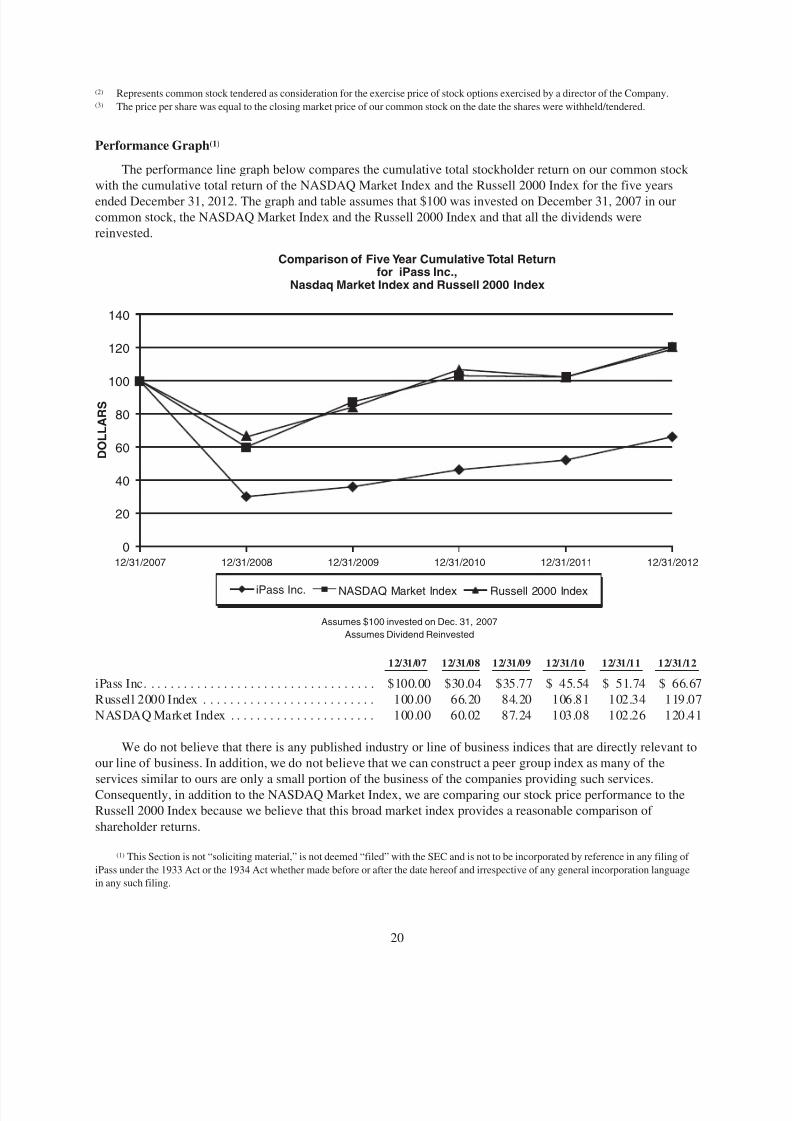
8/18/2019 iPass 2012 Annual Report
http://slidepdf.com/reader/full/ipass-2012-annual-report 26/80
(2) Represents common stock tendered as consideration for the exercise price of stock options exercised by a director of the Company.(3) The price per share was equal to the closing market price of our common stock on the date the shares were withheld/tendered.
Performance Graph(1)
The performance line graph below compares the cumulative total stockholder return on our common stock
with the cumulative total return of the NASDAQ Market Index and the Russell 2000 Index for the five years
ended December 31, 2012. The graph and table assumes that $100 was invested on December 31, 2007 in ourcommon stock, the NASDAQ Market Index and the Russell 2000 Index and that all the dividends were
reinvested.
12/31/2007 12/31/2008 12/31/2009 12/31/2010 12/31/201212/31/2011
0
20
40
60
80
100
140
120
iPass Inc. NASDAQ Market Index Russell 2000 Index
Comparison of Five Year Cumulative Total Returnfor iPass Inc.,
Nasdaq Market Index and Russell 2000 Index
D O L L A R S
Assumes $100 invested on Dec. 31, 2007
Assumes Dividend Reinvested
12/31/07 12/31/08 12/31/09 12/31/10 12/31/11 12/31/12
iPass Inc. . . . . . . . . . . . . . . . . . . . . . . . . . . . . . . . . . . $100.00 $30.04 $35.77 $ 45.54 $ 51.74 $ 66.67
Russell 2000 Index . . . . . . . . . . . . . . . . . . . . . . . . . . 100.00 66.20 84.20 106.81 102.34 119.07
NASDAQ Market Index . . . . . . . . . . . . . . . . . . . . . . 100.00 60.02 87.24 103.08 102.26 120.41
We do not believe that there is any published industry or line of business indices that are directly relevant to
our line of business. In addition, we do not believe that we can construct a peer group index as many of the
services similar to ours are only a small portion of the business of the companies providing such services.Consequently, in addition to the NASDAQ Market Index, we are comparing our stock price performance to the
Russell 2000 Index because we believe that this broad market index provides a reasonable comparison of
shareholder returns.
(1) This Section is not “soliciting material,” is not deemed “filed” with the SEC and is not to be incorporated by reference in any filing of
iPass under the 1933 Act or the 1934 Act whether made before or after the date hereof and irrespective of any general incorporation language
in any such filing.
20
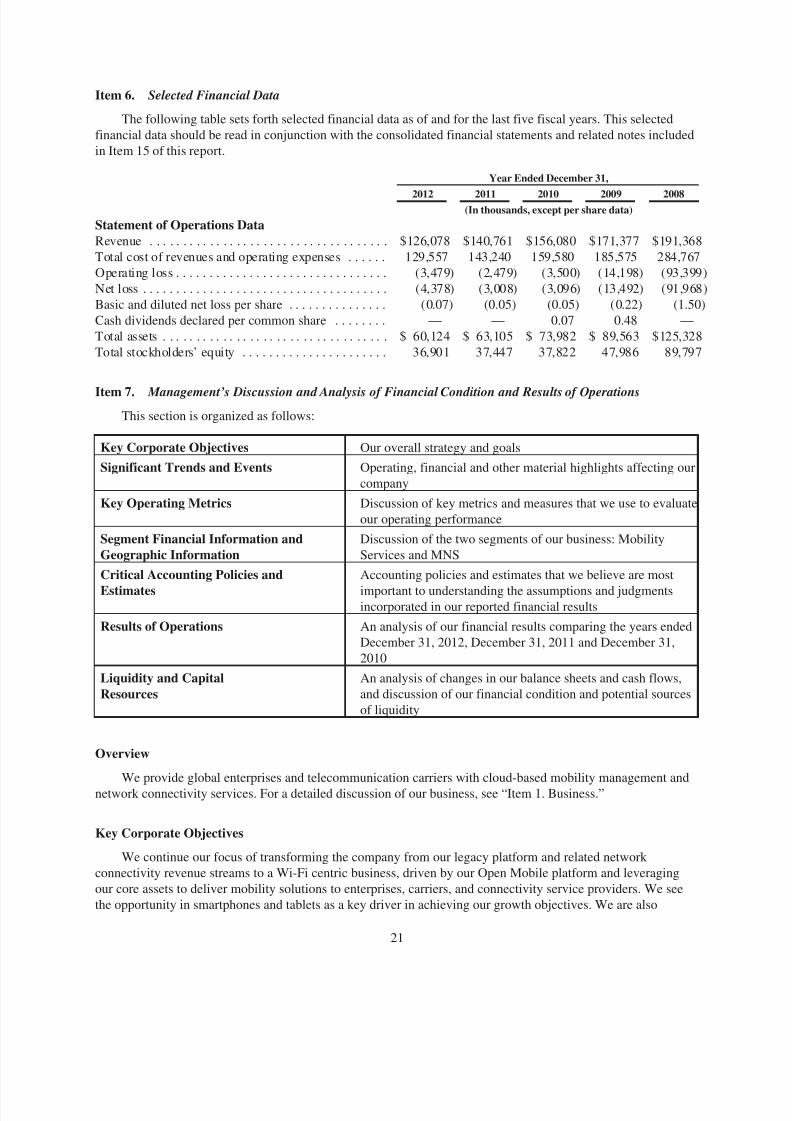
8/18/2019 iPass 2012 Annual Report
http://slidepdf.com/reader/full/ipass-2012-annual-report 27/80
Item 6. Selected Financial Data
The following table sets forth selected financial data as of and for the last five fiscal years. This selected
financial data should be read in conjunction with the consolidated financial statements and related notes included
in Item 15 of this report.
Year Ended December 31,
2012 2011 2010 2009 2008(In thousands, except per share data)
Statement of Operations DataRevenue . . . . . . . . . . . . . . . . . . . . . . . . . . . . . . . . . . . . $126,078 $140,761 $156,080 $171,377 $191,368
Total cost of revenues and operating expenses . . . . . . 129,557 143,240 159,580 185,575 284,767
Operating loss . . . . . . . . . . . . . . . . . . . . . . . . . . . . . . . . (3,479) (2,479) (3,500) (14,198) (93,399)
Net loss . . . . . . . . . . . . . . . . . . . . . . . . . . . . . . . . . . . . . (4,378) (3,008) (3,096) (13,492) (91,968)
Basic and diluted net loss per share . . . . . . . . . . . . . . . (0.07) (0.05) (0.05) (0.22) (1.50)
Cash dividends declared per common share . . . . . . . . — — 0.07 0.48 —
Total assets . . . . . . . . . . . . . . . . . . . . . . . . . . . . . . . . . . $ 60,124 $ 63,105 $ 73,982 $ 89,563 $125,328
Total stockholders’ equity . . . . . . . . . . . . . . . . . . . . . . 36,901 37,447 37,822 47,986 89,797
Item 7. Management’s Discussion and Analysis of Financial Condition and Results of Operations
This section is organized as follows:
Key Corporate Objectives Our overall strategy and goals
Significant Trends and Events Operating, financial and other material highlights affecting our
company
Key Operating Metrics Discussion of key metrics and measures that we use to evaluate
our operating performance
Segment Financial Information andGeographic Information
Discussion of the two segments of our business: Mobility
Services and MNS
Critical Accounting Policies and
Estimates
Accounting policies and estimates that we believe are most
important to understanding the assumptions and judgmentsincorporated in our reported financial results
Results of Operations An analysis of our financial results comparing the years ended
December 31, 2012, December 31, 2011 and December 31,
2010
Liquidity and Capital
Resources
An analysis of changes in our balance sheets and cash flows,
and discussion of our financial condition and potential sources
of liquidity
Overview
We provide global enterprises and telecommunication carriers with cloud-based mobility management and
network connectivity services. For a detailed discussion of our business, see “Item 1. Business.”
Key Corporate Objectives
We continue our focus of transforming the company from our legacy platform and related network
connectivity revenue streams to a Wi-Fi centric business, driven by our Open Mobile platform and leveraging
our core assets to deliver mobility solutions to enterprises, carriers, and connectivity service providers. We see
the opportunity in smartphones and tablets as a key driver in achieving our growth objectives. We are also
21
8/18/2019 iPass 2012 Annual Report
http://slidepdf.com/reader/full/ipass-2012-annual-report 28/80
focused on continuing to grow our MNS business through both customer additions and new upsell opportunities,
especially in the managed Wi-Fi area. Our plan is to continue to expand the strategic value of our business by
leveraging our mobility assets across both our businesses to address both large and compelling market
opportunities and to execute on key growth initiatives in our businesses. For a detailed discussion regarding our
key corporate objectives, see section entitled “Our Strategy” under “Item 1. Business.”
Significant Trends and Events
The following describes significant trends and events that impacted our financial condition, results of
operations, and/or the direction of our business in 2012:
Continued Focus on our Open Mobile Enterprise Business
We have continued to show solid progress against two key metrics for our OME business: (i) the number of
active Open Mobile Platform users; and (ii) the number of Open Mobile Wi-Fi Network users. During 2012, we
steadily increased our percentage of Open Mobile Platform users as a percentage of total platform users from 9%
for the fourth quarter of 2011 to 55% for the fourth quarter of 2012. In addition, we grew our percentage of Open
Mobile Wi-Fi Network users as a percentage of total Wi-Fi network users from 6% for the fourth quarter of 2011
to 43% for the fourth quarter of 2012. Our Open Mobile growth has been driven by a combination of legacy
platform customer migrations, migrated customer user and usage ramps, and new customer acquisition. Wecontinue to release updates to our Open Mobile platform, creating enhanced user experiences on a variety of
operating systems. We expect to grow Wi-Fi revenues in the future based on our ability to grow Open Mobile
platform and Wi-Fi network users, primarily through the continued focus on the deployment of our Open Mobile
platform on smartphone and tablet devices. See “Key Operating Metrics” below for a full discussion of our user
metrics.
Ramping Partner Interest in our Open Mobile Exchange Business
We are continuing to develop our OMX business, adding functionality and building-out the network of key
partners including mobile operators, telecommunication service providers, and mobile virtual network operators.
During 2012, we signed several strategic telecommunication carrier partners across Middle East, North America,
South East Asia and Southern Asia. We have signed 23 partners to date, more than doubling our partnerrelationships in 2012. We believe this early traction positions us to capitalize on the growing carrier and end user
consumer demand for Wi-Fi roaming and exchange services. We recognized approximately $0.8 million in OMX
revenues in 2012.
Continued Decline in our Legacy Revenues
We define our legacy revenue to include Dial-up and 3G network, our iPC platform, and related platform
services, as well as iPC driven network usage, including iPC user driven Wi-Fi, and minimum commit shortfall.
With our announcement to fully end-of-life the iPC platform effective July 1, 2012, we experienced anticipated
revenue declines in our network, platform, and other legacy revenue streams. Legacy network revenues declined
$32.6 million or 38% in 2012, as customers migrated to the Open Mobile platform and as our Dial-up and 3G
connectivity solutions continued to be phased out. Legacy platform revenues declined $3.6 million or 27% in2012 as customers migrated to the Open Mobile platform or terminated their contracts with us. We expect to exit
2013 with our legacy revenue streams representing a smaller percentage of our total company revenue when
compared to fiscal 2012.
Key Operating Metrics
Described below are key metrics that we use to evaluate our operating performance and our success in
transforming our business and driving future growth.
22
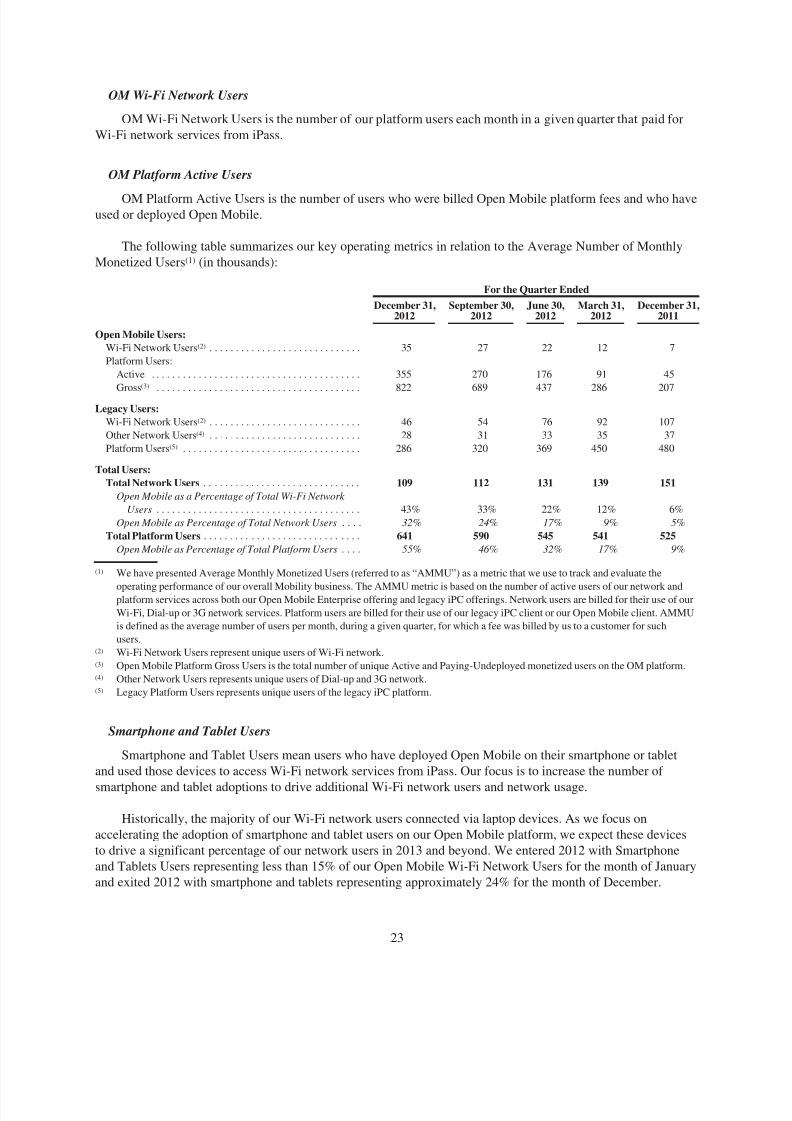
8/18/2019 iPass 2012 Annual Report
http://slidepdf.com/reader/full/ipass-2012-annual-report 29/80
OM Wi-Fi Network Users
OM Wi-Fi Network Users is the number of our platform users each month in a given quarter that paid for
Wi-Fi network services from iPass.
OM Platform Active Users
OM Platform Active Users is the number of users who were billed Open Mobile platform fees and who haveused or deployed Open Mobile.
The following table summarizes our key operating metrics in relation to the Average Number of Monthly
Monetized Users(1) (in thousands):
For the Quarter Ended
December 31,2012
September 30,2012
June 30,2012
March 31,2012
December 31,2011
Open Mobile Users:
Wi-Fi Network Users(2) . . . . . . . . . . . . . . . . . . . . . . . . . . . . . 35 27 22 12 7
Platform Users:
Active . . . . . . . . . . . . . . . . . . . . . . . . . . . . . . . . . . . . . . . . 355 270 176 91 45
Gross(3)
. . . . . . . . . . . . . . . . . . . . . . . . . . . . . . . . . . . . . . . 822 689 437 286 207Legacy Users:
Wi-Fi Network Users(2) . . . . . . . . . . . . . . . . . . . . . . . . . . . . . 46 54 76 92 107
Other Network Users(4) . . . . . . . . . . . . . . . . . . . . . . . . . . . . . 28 31 33 35 37
Platform Users(5) . . . . . . . . . . . . . . . . . . . . . . . . . . . . . . . . . . 286 320 369 450 480
Total Users:
Total Network Users . . . . . . . . . . . . . . . . . . . . . . . . . . . . . . 109 112 131 139 151
Open Mobile as a Percentage of Total Wi-Fi Network
Users . . . . . . . . . . . . . . . . . . . . . . . . . . . . . . . . . . . . . . . 43% 33% 22% 12% 6%
Open Mobile as Percentage of Total Network Users . . . . 32% 24% 17% 9% 5%
Total Platform Users . . . . . . . . . . . . . . . . . . . . . . . . . . . . . . 641 590 545 541 525
Open Mobile as Percentage of Total Platform Users . . . . 55% 46% 32% 17% 9%
(1) We have presented Average Monthly Monetized Users (referred to as “AMMU”) as a metric that we use to track and evaluate the
operating performance of our overall Mobility business. The AMMU metric is based on the number of active users of our network andplatform services across both our Open Mobile Enterprise offering and legacy iPC offerings. Network users are billed for their use of our
Wi-Fi, Dial-up or 3G network services. Platform users are billed for their use of our legacy iPC client or our Open Mobile client. AMMU
is defined as the average number of users per month, during a given quarter, for which a fee was billed by us to a customer for such
users.(2) Wi-Fi Network Users represent unique users of Wi-Fi network.(3) Open Mobile Platform Gross Users is the total number of unique Active and Paying-Undeployed monetized users on the OM platform.(4) Other Network Users represents unique users of Dial-up and 3G network.(5) Legacy Platform Users represents unique users of the legacy iPC platform.
Smartphone and Tablet Users
Smartphone and Tablet Users mean users who have deployed Open Mobile on their smartphone or tablet
and used those devices to access Wi-Fi network services from iPass. Our focus is to increase the number of
smartphone and tablet adoptions to drive additional Wi-Fi network users and network usage.
Historically, the majority of our Wi-Fi network users connected via laptop devices. As we focus on
accelerating the adoption of smartphone and tablet users on our Open Mobile platform, we expect these devices
to drive a significant percentage of our network users in 2013 and beyond. We entered 2012 with Smartphone
and Tablets Users representing less than 15% of our Open Mobile Wi-Fi Network Users for the month of January
and exited 2012 with smartphone and tablets representing approximately 24% for the month of December.
23

8/18/2019 iPass 2012 Annual Report
http://slidepdf.com/reader/full/ipass-2012-annual-report 30/80
Adjusted Earnings Before Interest, Taxes, Depreciation and Amortization (“Adjusted EBITDA”)
Adjusted EBITDA is used by our management as a measure of operating efficiency, financial performance
and as a benchmark against our peers and competitors. In addition, in 2012 we also used this metric to determine
a portion of our incentive compensation payouts. Management also believes that Adjusted EBITDA is useful to
investors because it is frequently used by securities analysts, investors and other interested parties to understand
our performance excluding the impact of items which may obscure trends in our core operating performance.
Furthermore, the use of Adjusted EBITDA facilitates comparisons with other companies in our industry whichmay use similar financial measures to supplement their GAAP results. We adjust for these excluded items
because we believe that, in general, these items possess one or more of the following characteristics: their
magnitude and timing is largely outside of our control; they are unrelated to the ongoing operation of the
business in the ordinary course; they are unusual or infrequent and we do not expect them to occur in the
ordinary course of business; or they are non-operational, or non-cash expenses involving stock option grants.
Adjusted EBITDA is not a measure determined in accordance with accounting principles generally accepted in
the United States or GAAP and should not be considered a substitute for operating income, operating
performance, net income or any other measure determined in accordance with GAAP. Adjusted EBITDA should
not be considered in isolation or as a substitute for measures of performance prepared in accordance with GAAP.
We defined Adjusted EBITDA as net loss adjusted for interest income, income taxes, depreciation and
amortization, stock-based compensation, restructuring charges, certain state sales and federal tax charges, andone-time non-recurring discrete items.
The following table reconciles Adjusted EBITDA to GAAP net loss (in thousands):
Year Ended December 31,
2012 2011 2010
Adjusted EBITDA income (loss) . . . . . . . . . . . . . . . . . . . . $ 960 $ (196) $ 811Interest income . . . . . . . . . . . . . . . . . . . . . . . . . . . . . . . . . . . 19 112 83
Income tax (expense) benefit . . . . . . . . . . . . . . . . . . . . . . . . (642) (290) 192
Depreciation of property and equipment . . . . . . . . . . . . . . . (2,110) (2,259) (3,326)
Amortization of intangible assets . . . . . . . . . . . . . . . . . . . . . (169) (239) (428)
Stock-based compensation . . . . . . . . . . . . . . . . . . . . . . . . . . (2,418) (1,725) (1,699)
Restructuring (charges) benefit . . . . . . . . . . . . . . . . . . . . . . (26) 151 (887)
Certain state sales and federal tax items and other discrete
items . . . . . . . . . . . . . . . . . . . . . . . . . . . . . . . . . . . . . . . . . 8 1,438 2,158
Net loss . . . . . . . . . . . . . . . . . . . . . . . . . . . . . . . . . . . . . . . . . $(4,378) $(3,008) $(3,096)
Adjusted EBITDA income for the year ended December 31, 2012 improved by approximately $1.2 million
compared to adjusted EBITDA loss in 2011. The improvement in Adjusted EBITDA was primarily derived from
ongoing cost management efforts. Operating expenses, after adjusting for the above excluded items, were
favorable $3.7 million, offset by lower gross profit (calculated as revenues less network access costs) of
$2.5 million on declining year over year revenues. Significant drivers of the decline in operating expenses not
listed in the above exclusions included lower subsidized 3G data card costs of $1.0 million and lower headcount
related expenses of $0.7 million.
Adjusted EBITDA loss for the year ended December 31, 2011 was unfavorable $1.0 million compared to
adjusted EBITDA income in 2010. The decrease in Adjusted EBITDA was primarily due to lower gross profit of
$8.6 million, and an unfavorable impact from foreign exchange rates of $0.6 million. These unfavorable
decreases were partially offset by lower operating expenses of approximately $8.2 million as a result of our
ongoing cost management efforts that included headcount reductions.
24
8/18/2019 iPass 2012 Annual Report
http://slidepdf.com/reader/full/ipass-2012-annual-report 31/80
Segment Financial Information and Geographic Information
We operate our business and report under two segments: Mobility Services and MNS. We allocate resources
and assess the performance of each operating segment using information about its revenue and operating loss.
The Mobility Services segment reflects our two primary areas of mobility services, (i) enterprise mobility
services that consist of Open Mobile Enterprise services, our legacy enterprise mobility services and other
ancillary services including professional consulting and other value-add services, and (ii) our Open MobileExchange services that were launched in 2011. Open Mobile Enterprise services have evolved from our
Enterprise Mobility Services offerings as we focus on our Open Mobile business and migrate away from our
legacy iPC services. Prior to 2011, our Mobility Services segment was referred to as Enterprise Mobility
Services.
Our business is dependent on the success of our Mobility Services and MNS segments. For a more complete
discussion of business risks that these segments face, both combined and individually, see the discussion that
appears in Part I, “Item 1A. Risk Factors,” of this Form 10-K.
For further financial information on the Mobility Services and MNS segments, as well as long-lived assets
and geographic information, refer to the information contained in Note 15, “Segment and Geographical
Information,” in the Notes to the Consolidated Financial Statements included in Item 15. For risks attendant toforeign operations, see the risk entitled “Because a meaningful portion of our business is international, we
encounter additional risks, which may impact our revenues and profitability” in “Item 1A. Risk Factors” of this
Form 10-K.
Critical Accounting Policies and Estimates
Our discussion and analysis of our financial condition and results of operations is based upon our
consolidated financial statements which have been prepared in accordance with accounting principles generally
accepted in the United States. The preparation of these consolidated financial statements requires us to make
estimates and judgments that affect the reported amounts of assets, liabilities, revenues and expenses, and related
disclosure of contingent assets and liabilities. We base our estimates and judgments on our historical experience,
knowledge of current conditions and our belief of what could occur in the future considering available
information, including assumptions that are believed to be reasonable under the circumstances. By their nature,these estimates and judgments are subject to an inherent degree of uncertainty and actual results could differ
materially from the amounts reported based on these policies. On an ongoing basis, we evaluate our estimates,
including those related to revenue recognition. We believe our most significant estimates, judgments and
assumptions used in the preparation of our consolidated financial statements are used in the following critical
accounting policies.
Revenue Recognition
Our revenue recognition policy requires us to make certain estimates and judgments, for example, in the
recognition of monthly minimum commitment (“MMC”) revenue and upfront fees for MNS contracts.
For customers that have agreed to a MMC fee in connection with network usage, such customer’s monthly
invoice reflects the greater of the customer’s actual usage during the month or the customer’s contractually
committed monthly minimum for that month. If the MMC exceeds actual usage (“Shortfall”), we determine
whether the Shortfall is fixed or determinable in accordance with the revenue recognition criteria. If we conclude
that the Shortfall is fixed or determinable, based upon customer specific collection history, and all other revenue
recognition criteria have been met, we recognize as revenue the amount of the Shortfall which is invoiced. If the
customer is in a Shortfall situation and it is determined that the Shortfall is not fixed or determinable, we
recognize revenue only when the Shortfall is collected. MNS contracts are monthly flat fee contracts combined
with certain other upfront fees such as, one-time non-recurring fees, which include equipment fees, installation,
25
8/18/2019 iPass 2012 Annual Report
http://slidepdf.com/reader/full/ipass-2012-annual-report 32/80
management set up, and shipping fees. The monthly flat usage fee is recognized on a monthly basis, while other
fees are recognized ratably over the estimated life of the end point. An end point represents a separate physical
location, such as a branch office, retail office or virtual office. End point lives are estimated based on historical
average end point life by product group. We periodically perform an analysis of estimated lives of the end points
and revise the remaining term over which revenue will be recognized, if needed. As of December 31, 2012, the
expected period of performance for end points approximates a 4-year period for our Branch/Retail product group,
and 18 months for our Home Office product group.
Results of Operations
Sources of Revenues
From a broad perspective, we report and analyze revenue under two primary offerings reflecting our
operating segments: Mobility Services and MNS. Within Mobility Services, we differentiate and analyze our
Open Mobile and legacy generated revenues separately.
Open Mobile generated revenues include:
• Network—Wi-Fi and minimum customer commitments based on the number of network users sourced
from the Open Mobile platform.
• Platform—Fees based on the number of Active Open Mobile monetized platform users and fees for
fully dedicated Open Mobile carrier arrangements.
• Other Fees and Revenue—Fees specific to providing additional value add services to Open Mobile
customers.
• OMX—Revenues generated from our OMX customers.
Legacy generated revenues include:
• Network—Wi-Fi and minimum customer commitments based on the number of network users sourced
from the legacy iPC platform. In addition, network revenues derived from our 3G and Dial-up products
are categorized as legacy network revenues.
• Platform—Fees based on the number of legacy iPC monetized platform users and fees related to legacy
add-on platform products and related services.
• Other Fees and Revenue—Fees specific to providing additional value add service to legacy iPC
customers.
26
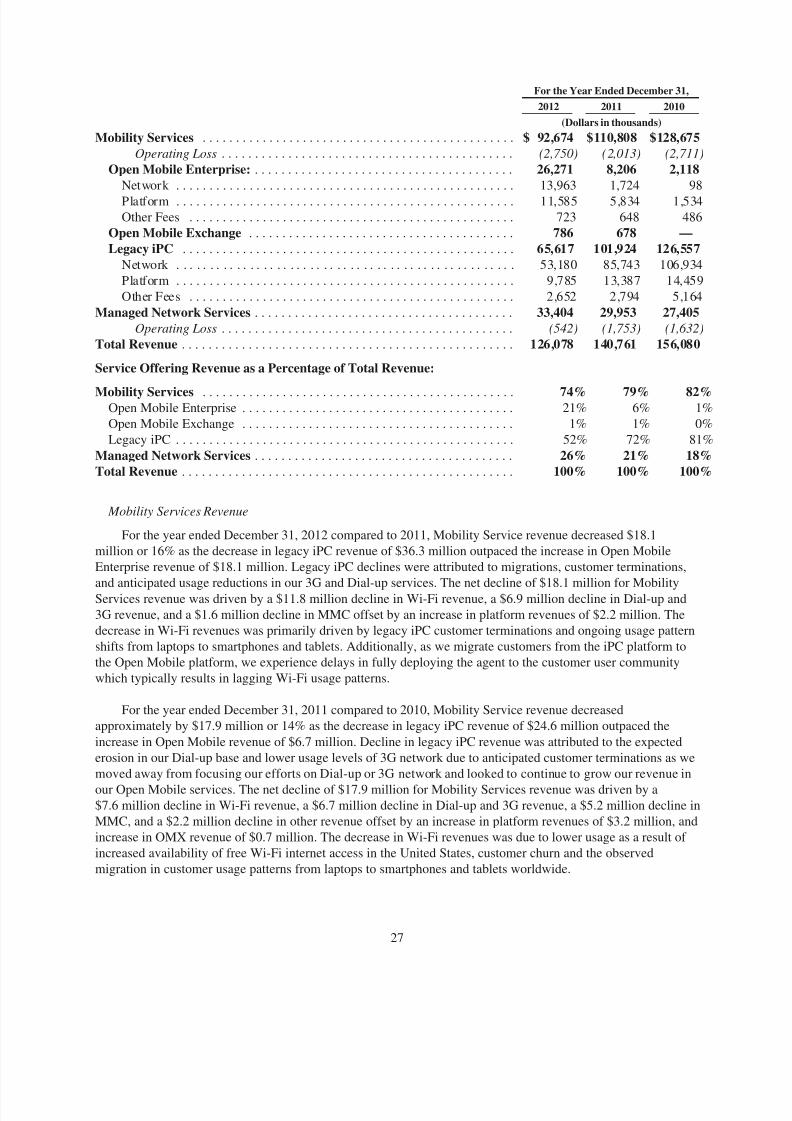
8/18/2019 iPass 2012 Annual Report
http://slidepdf.com/reader/full/ipass-2012-annual-report 33/80
For the Year Ended December 31,
2012 2011 2010
(Dollars in thousands)
Mobility Services . . . . . . . . . . . . . . . . . . . . . . . . . . . . . . . . . . . . . . . . . . . . . . . $ 92,674 $110,808 $128,675Operating Loss . . . . . . . . . . . . . . . . . . . . . . . . . . . . . . . . . . . . . . . . . . . . (2,750) (2,013) (2,711)
Open Mobile Enterprise: . . . . . . . . . . . . . . . . . . . . . . . . . . . . . . . . . . . . . . . 26,271 8,206 2,118Network . . . . . . . . . . . . . . . . . . . . . . . . . . . . . . . . . . . . . . . . . . . . . . . . . . . 13,963 1,724 98
Platform . . . . . . . . . . . . . . . . . . . . . . . . . . . . . . . . . . . . . . . . . . . . . . . . . . . 11,585 5,834 1,534Other Fees . . . . . . . . . . . . . . . . . . . . . . . . . . . . . . . . . . . . . . . . . . . . . . . . . 723 648 486
Open Mobile Exchange . . . . . . . . . . . . . . . . . . . . . . . . . . . . . . . . . . . . . . . . 786 678 —Legacy iPC . . . . . . . . . . . . . . . . . . . . . . . . . . . . . . . . . . . . . . . . . . . . . . . . . . 65,617 101,924 126,557
Network . . . . . . . . . . . . . . . . . . . . . . . . . . . . . . . . . . . . . . . . . . . . . . . . . . . 53,180 85,743 106,934
Platform . . . . . . . . . . . . . . . . . . . . . . . . . . . . . . . . . . . . . . . . . . . . . . . . . . . 9,785 13,387 14,459
Other Fees . . . . . . . . . . . . . . . . . . . . . . . . . . . . . . . . . . . . . . . . . . . . . . . . . 2,652 2,794 5,164
Managed Network Services . . . . . . . . . . . . . . . . . . . . . . . . . . . . . . . . . . . . . . . 33,404 29,953 27,405Operating Loss . . . . . . . . . . . . . . . . . . . . . . . . . . . . . . . . . . . . . . . . . . . . (542) (1,753) (1,632)
Total Revenue . . . . . . . . . . . . . . . . . . . . . . . . . . . . . . . . . . . . . . . . . . . . . . . . . . 126,078 140,761 156,080
Service Offering Revenue as a Percentage of Total Revenue:
Mobility Services . . . . . . . . . . . . . . . . . . . . . . . . . . . . . . . . . . . . . . . . . . . . . . . 74% 79% 82%Open Mobile Enterprise . . . . . . . . . . . . . . . . . . . . . . . . . . . . . . . . . . . . . . . . . 21% 6% 1%
Open Mobile Exchange . . . . . . . . . . . . . . . . . . . . . . . . . . . . . . . . . . . . . . . . . 1% 1% 0%
Legacy iPC . . . . . . . . . . . . . . . . . . . . . . . . . . . . . . . . . . . . . . . . . . . . . . . . . . . 52% 72% 81%
Managed Network Services . . . . . . . . . . . . . . . . . . . . . . . . . . . . . . . . . . . . . . . 26% 21% 18%Total Revenue . . . . . . . . . . . . . . . . . . . . . . . . . . . . . . . . . . . . . . . . . . . . . . . . . . 100% 100% 100%
Mobility Services Revenue
For the year ended December 31, 2012 compared to 2011, Mobility Service revenue decreased $18.1
million or 16% as the decrease in legacy iPC revenue of $36.3 million outpaced the increase in Open Mobile
Enterprise revenue of $18.1 million. Legacy iPC declines were attributed to migrations, customer terminations,
and anticipated usage reductions in our 3G and Dial-up services. The net decline of $18.1 million for MobilityServices revenue was driven by a $11.8 million decline in Wi-Fi revenue, a $6.9 million decline in Dial-up and
3G revenue, and a $1.6 million decline in MMC offset by an increase in platform revenues of $2.2 million. The
decrease in Wi-Fi revenues was primarily driven by legacy iPC customer terminations and ongoing usage pattern
shifts from laptops to smartphones and tablets. Additionally, as we migrate customers from the iPC platform to
the Open Mobile platform, we experience delays in fully deploying the agent to the customer user community
which typically results in lagging Wi-Fi usage patterns.
For the year ended December 31, 2011 compared to 2010, Mobility Service revenue decreased
approximately by $17.9 million or 14% as the decrease in legacy iPC revenue of $24.6 million outpaced the
increase in Open Mobile revenue of $6.7 million. Decline in legacy iPC revenue was attributed to the expected
erosion in our Dial-up base and lower usage levels of 3G network due to anticipated customer terminations as we
moved away from focusing our efforts on Dial-up or 3G network and looked to continue to grow our revenue in
our Open Mobile services. The net decline of $17.9 million for Mobility Services revenue was driven by a$7.6 million decline in Wi-Fi revenue, a $6.7 million decline in Dial-up and 3G revenue, a $5.2 million decline in
MMC, and a $2.2 million decline in other revenue offset by an increase in platform revenues of $3.2 million, and
increase in OMX revenue of $0.7 million. The decrease in Wi-Fi revenues was due to lower usage as a result of
increased availability of free Wi-Fi internet access in the United States, customer churn and the observed
migration in customer usage patterns from laptops to smartphones and tablets worldwide.
27
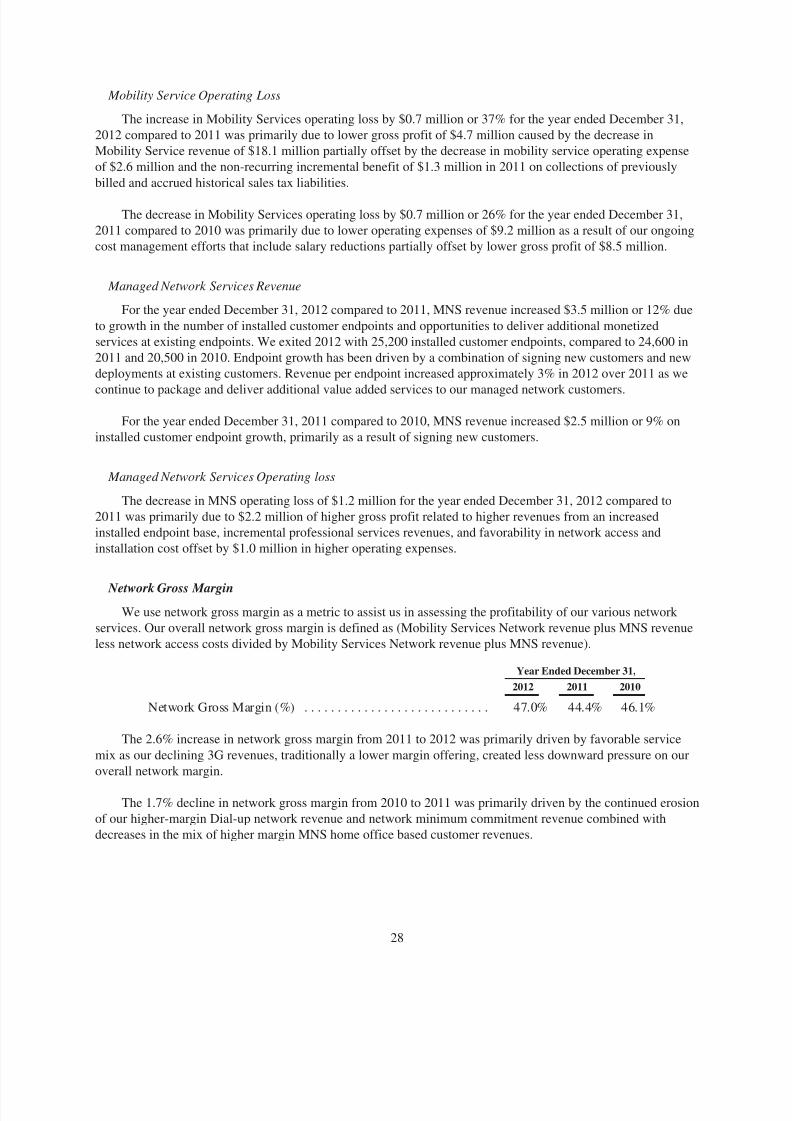
8/18/2019 iPass 2012 Annual Report
http://slidepdf.com/reader/full/ipass-2012-annual-report 34/80
Mobility Service Operating Loss
The increase in Mobility Services operating loss by $0.7 million or 37% for the year ended December 31,
2012 compared to 2011 was primarily due to lower gross profit of $4.7 million caused by the decrease in
Mobility Service revenue of $18.1 million partially offset by the decrease in mobility service operating expense
of $2.6 million and the non-recurring incremental benefit of $1.3 million in 2011 on collections of previously
billed and accrued historical sales tax liabilities.
The decrease in Mobility Services operating loss by $0.7 million or 26% for the year ended December 31,
2011 compared to 2010 was primarily due to lower operating expenses of $9.2 million as a result of our ongoing
cost management efforts that include salary reductions partially offset by lower gross profit of $8.5 million.
Managed Network Services Revenue
For the year ended December 31, 2012 compared to 2011, MNS revenue increased $3.5 million or 12% due
to growth in the number of installed customer endpoints and opportunities to deliver additional monetized
services at existing endpoints. We exited 2012 with 25,200 installed customer endpoints, compared to 24,600 in
2011 and 20,500 in 2010. Endpoint growth has been driven by a combination of signing new customers and new
deployments at existing customers. Revenue per endpoint increased approximately 3% in 2012 over 2011 as we
continue to package and deliver additional value added services to our managed network customers.
For the year ended December 31, 2011 compared to 2010, MNS revenue increased $2.5 million or 9% on
installed customer endpoint growth, primarily as a result of signing new customers.
Managed Network Services Operating loss
The decrease in MNS operating loss of $1.2 million for the year ended December 31, 2012 compared to
2011 was primarily due to $2.2 million of higher gross profit related to higher revenues from an increased
installed endpoint base, incremental professional services revenues, and favorability in network access and
installation cost offset by $1.0 million in higher operating expenses.
Network Gross Margin
We use network gross margin as a metric to assist us in assessing the profitability of our various network
services. Our overall network gross margin is defined as (Mobility Services Network revenue plus MNS revenue
less network access costs divided by Mobility Services Network revenue plus MNS revenue).
Year Ended December 31,
2012 2011 2010
Network Gross Margin (%) . . . . . . . . . . . . . . . . . . . . . . . . . . . . 47.0% 44.4% 46.1%
The 2.6% increase in network gross margin from 2011 to 2012 was primarily driven by favorable service
mix as our declining 3G revenues, traditionally a lower margin offering, created less downward pressure on our
overall network margin.
The 1.7% decline in network gross margin from 2010 to 2011 was primarily driven by the continued erosion
of our higher-margin Dial-up network revenue and network minimum commitment revenue combined with
decreases in the mix of higher margin MNS home office based customer revenues.
28

8/18/2019 iPass 2012 Annual Report
http://slidepdf.com/reader/full/ipass-2012-annual-report 35/80
Geographic Revenues
For the Year Ended December 31,
2012 2011 2010
United States . . . . . . . . . . . . . . . . . . . . . . . . . . . . . . . . . . . . . . . . . . . . . . . . . . . . . . 57% 58% 62%
Europe, Middle East and Africa (EMEA) . . . . . . . . . . . . . . . . . . . . . . . . . . . . . . . . 32% 32% 30%
Asia Pacific . . . . . . . . . . . . . . . . . . . . . . . . . . . . . . . . . . . . . . . . . . . . . . . . . . . . . . . 10% 9% 7%
Rest of the world . . . . . . . . . . . . . . . . . . . . . . . . . . . . . . . . . . . . . . . . . . . . . . . . . . . 1% 1% 1%
No individual country, except for the United States, accounted for 10% or more of total revenues for the
years ended December 31, 2012, 2011, and 2010. Revenues in the United Kingdom accounted for 9% of total
revenues in 2012, 2011 and 2010. To date, all of our revenues have been denominated in U.S. Dollars. In the
future some portion of our revenues may be denominated in foreign currencies. No individual customer
accounted for 10% or more of total revenues for the years ended December 31, 2012, 2011, and 2010.
Q1 2013 Outlook
For the first quarter of 2013 ending March 31, 2013 iPass anticipates total revenue to be in the range of
$28 million to $32 million, and Adjusted EBITDA loss to be in the range of $2.0 million to $0.5 million. The
following table reconciles projected adjusted EBITDA loss to projected net loss:(In millions)
Adjusted EBITDA Loss . . . . . . . . . . . . . . . . . . . . . . . . . . . . . . . . . . . $(2.0) $(0.5)
(a) Income tax expense . . . . . . . . . . . . . . . . . . . . . . . . . . . . . . . . . . (0.1)
(b) Depreciation of property and equipment . . . . . . . . . . . . . . . . . (0.6)
(c) Stock-based compensation . . . . . . . . . . . . . . . . . . . . . . . . . . . . (0.8)
(d) Restructuring charges . . . . . . . . . . . . . . . . . . . . . . . . . . . . . . . . (0.7)
GAAP Net Loss . . . . . . . . . . . . . . . . . . . . . . . . . . . . . . . . . . . . . . . . . $(4.2) $(2.7)
The projected Adjusted EBITDA loss does not include the projected impact of any foreign exchange gains
or losses or restructuring charges.
Operating Expenses
Network Access Costs
Network access costs (“NAC”) consist of charges for network access which we pay to our network service
providers.
Year Ended December 31,
2012 2011 2010
(In thousands, except percentages)
Network access costs . . . . . . . . . . . . . . . . . . . . . . . . . . . $53,640 $65,766 $72,497
As a percentage of revenue . . . . . . . . . . . . . . . . . . . . . . 42.5% 46.7% 46.4%
The decrease in NAC of approximately $12.1 million or 18% for 2012 compared to 2011 was primarily dueto a combination of lower Wi-Fi, 3G and Dial-up network usage that decreased Mobility Services NAC by
approximately $13.4 million, partially offset by an increase in MNS NAC of approximately $1.3 million. The
increase in MNS NAC was mainly due to the increase in usage driven by the increase in number of endpoints.
The decrease in NAC of approximately $6.7 million or 9% for 2011 compared to 2010 was primarily due to
a combination of lower Wi-Fi, 3G and Dial-up network usage that decreased Mobility Services NAC by
approximately $9.3 million, partially offset by an increase in MNS NAC of approximately $2.6 million due to the
increase in number of endpoints.
29
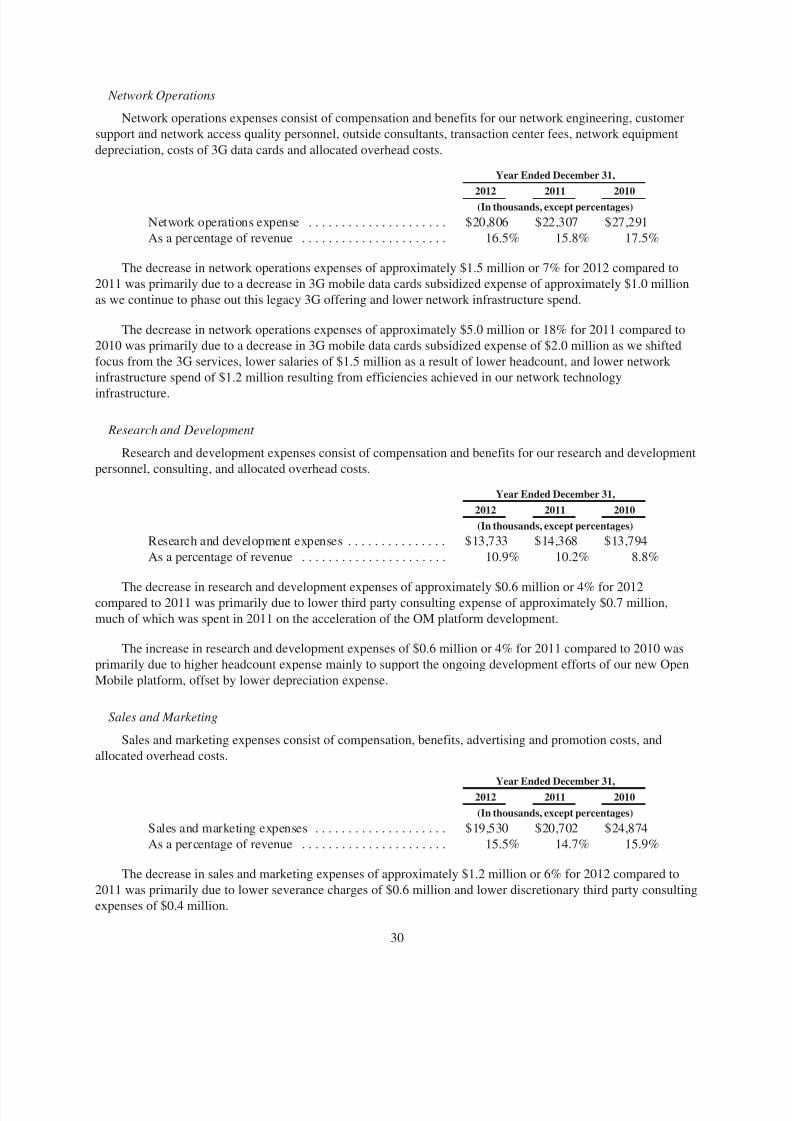
8/18/2019 iPass 2012 Annual Report
http://slidepdf.com/reader/full/ipass-2012-annual-report 36/80
Network Operations
Network operations expenses consist of compensation and benefits for our network engineering, customer
support and network access quality personnel, outside consultants, transaction center fees, network equipment
depreciation, costs of 3G data cards and allocated overhead costs.
Year Ended December 31,
2012 2011 2010(In thousands, except percentages)
Network operations expense . . . . . . . . . . . . . . . . . . . . . $20,806 $22,307 $27,291
As a percentage of revenue . . . . . . . . . . . . . . . . . . . . . . 16.5% 15.8% 17.5%
The decrease in network operations expenses of approximately $1.5 million or 7% for 2012 compared to
2011 was primarily due to a decrease in 3G mobile data cards subsidized expense of approximately $1.0 million
as we continue to phase out this legacy 3G offering and lower network infrastructure spend.
The decrease in network operations expenses of approximately $5.0 million or 18% for 2011 compared to
2010 was primarily due to a decrease in 3G mobile data cards subsidized expense of $2.0 million as we shifted
focus from the 3G services, lower salaries of $1.5 million as a result of lower headcount, and lower network
infrastructure spend of $1.2 million resulting from efficiencies achieved in our network technology
infrastructure.
Research and Development
Research and development expenses consist of compensation and benefits for our research and development
personnel, consulting, and allocated overhead costs.
Year Ended December 31,
2012 2011 2010
(In thousands, except percentages)
Research and development expenses . . . . . . . . . . . . . . . $13,733 $14,368 $13,794
As a percentage of revenue . . . . . . . . . . . . . . . . . . . . . . 10.9% 10.2% 8.8%
The decrease in research and development expenses of approximately $0.6 million or 4% for 2012compared to 2011 was primarily due to lower third party consulting expense of approximately $0.7 million,
much of which was spent in 2011 on the acceleration of the OM platform development.
The increase in research and development expenses of $0.6 million or 4% for 2011 compared to 2010 was
primarily due to higher headcount expense mainly to support the ongoing development efforts of our new Open
Mobile platform, offset by lower depreciation expense.
Sales and Marketing
Sales and marketing expenses consist of compensation, benefits, advertising and promotion costs, and
allocated overhead costs.
Year Ended December 31,2012 2011 2010
(In thousands, except percentages)
Sales and marketing expenses . . . . . . . . . . . . . . . . . . . . $19,530 $20,702 $24,874
As a percentage of revenue . . . . . . . . . . . . . . . . . . . . . . 15.5% 14.7% 15.9%
The decrease in sales and marketing expenses of approximately $1.2 million or 6% for 2012 compared to
2011 was primarily due to lower severance charges of $0.6 million and lower discretionary third party consulting
expenses of $0.4 million.
30
8/18/2019 iPass 2012 Annual Report
http://slidepdf.com/reader/full/ipass-2012-annual-report 37/80
8/18/2019 iPass 2012 Annual Report
http://slidepdf.com/reader/full/ipass-2012-annual-report 38/80
denominated assets and liabilities during each of those years. Foreign exchange gains in 2010 were primarily due
to strengthening of the U.S. Dollar against the Euro at the time we settled certain non-U.S. Dollar denominated
network access costs which outweighed the unfavorable re-measurement of foreign currency denominated assets
and liabilities.
Provision For (Benefit From) Income Taxes
The effective tax rate was a tax expense of 17% for 2012 and a tax expense of 11% for 2011. The 2012
increase of effective tax rate was due to an increase in foreign tax expense.
The effective tax rate in 2011 was a tax expense of 11% compared to the tax benefit of 6% in 2010. Our
U.S. federal statutory income tax rate was adjusted by the foreign tax rate benefit which decreased from 20% in
2010 to 1% in 2011.
Liquidity and Capital Resources
December 31,2012
December 31,2011
Increase/ (Decrease)
(dollars in thousands)
Cash and cash equivalents . . . . . . . . . . . . . . . . . . . $26,822 $25,439 $1,383As a percentage of total assets . . . . . . . . . . . . . . . . 44.6% 40.3%
Operating Activities. Net cash provided by operating activities in 2012 was $3.5 million, compared to net
cash used in operating activities of $5.5 million in 2011. Adjusting our net loss for non-cash items, resulted in
$0.4 million and $1.0 million of cash provided in 2012 and 2011 respectively. Working capital fluctuations such
as the timing of cash receipts and payments, provided $3.1 million in 2012 and used $6.5 million in 2011. The
outflows related to working capital in 2011 were predominantly related to the settlement and payment of sales
tax back bill issues with various states.
Investing Activities . Net cash used in investing activities in 2012 was approximately $3.5 million, compared
to net cash used by investing of $0.7 million in 2011. Net cash used in investing activities in 2012 was the result
of $4.5 million used for capital expenditures mainly driven by the acquisition of our new ERP system offset by a$1.0 million reduction in restricted cash pledged for letters of credit with a supplier. In 2011, $1.8 million used
for capital expenditure was partially offset by $1.1 million reduction in restricted cash pledged for letters of
credit with a supplier.
Financing Activities. Net cash provided by financing activities in 2012 was $1.4 million, compared to net
cash provided by financing activities of $0.9 million in 2011. Net cash provided by financing activities in 2012
was primarily due to $1.6 million of proceeds from the issuance of common stock upon exercise of stock options,
partially offset by $0.2 million in common stock repurchases to satisfy tax obligation of certain officers of the
Company. Approximately $0.9 million was received in 2011 from the issuance of common stock upon exercise
of stock options.
Sources of Cash and Future Cash Requirements
We have historically relied on existing cash and cash equivalents and cash flow from operations for our
liquidity needs. We use a professional investment management firm to manage a large portion of our cash which
is invested primarily in money market accounts with a remaining maturity of three months or less at the time of
purchase. We believe that based on our current business plan and revenue prospects and our anticipated cash
flows from operations, our existing cash balances will be sufficient to meet our working capital and operating
resource expenditure requirements for at least the next twelve months.
32
8/18/2019 iPass 2012 Annual Report
http://slidepdf.com/reader/full/ipass-2012-annual-report 39/80
The amount of cash and cash equivalents held by our foreign subsidiaries as of December 31, 2012 and
2011 was $1.4 million and $1.3 million, respectively. We currently do not intend to distribute any of our
cumulative earnings by our foreign subsidiaries to the parent company in the U.S.
Primary Uses of Cash
Our principal use of cash in 2012 was for the purchase of a new ERP system, network access costs, payrollrelated expenses and general operating expenses including marketing, travel, office rent, settlement of certain
sales tax obligations, settlement of restructuring obligations and other capital expenditures. In 2013, we expect to
use cash to fund ongoing operating activities and capital investments. We announced a restructuring event in
February 2013 (see “Note 16. Subsequent Event”) and expect to use approximately $0.7 million of cash in 2013
to complete this event.
Off-Balance Sheet Arrangements
As part of our ongoing business, we do not participate in transactions that generate material relationships
with unconsolidated entities or financial partnerships, such as entities often referred to as structured finance or
special purpose entities, which would have been established for the purpose of facilitating off-balance sheet
arrangements or for other contractually narrow or limited purposes. We did not have any off-balance sheetarrangements at December 31, 2012 and December 31, 2011 as defined in Item 303(a)(4)(ii) of SEC
Regulation S-K.
Contractual Obligations
TotalLess Than
1 Year 1-3 Years 3-5 Years
(In thousands)
Operating Lease Obligations . . . . . . . . . . . . . . . . . . . . . . . . . . . . . . . . . $ 8,268 $3,156 $4,360 $752
Network Service Commitments(1) . . . . . . . . . . . . . . . . . . . . . . . . . . . . . 3,209 2,694 515 —
Total Contractual Obligations . . . . . . . . . . . . . . . . . . . . . . . . . . . . . . . . $11,477 $5,850 $4,875 $752
(1) In the normal course of our business, we have signed contracts with certain network service providers under which we have minimum
purchase commitments. These commitments expire on various dates through April 2015.
In addition to the contractual obligations disclosed above, we have unrecognized tax benefits including
estimated gross interest and penalties of $5.8 million and $5.1 million as of December 31, 2012 and 2011,
respectively. At December 31, 2012, we did not have any material commitments for capital expenditures.
In the ordinary course of business, we may provide indemnifications of varying scope and terms to
customers, business partners, and other parties with respect to certain matters, including, but not limited to, losses
arising out of our breach of such agreements, services to be provided by us, or from intellectual property
infringement claims made by third-parties. In addition, we have entered into indemnification agreements with our
directors and certain of our officers and employees that will require us, among other things, to indemnify them
against certain liabilities that may arise by reason of their status or service as directors, officers or employees.
We maintain director and officer insurance, which may cover certain liabilities arising from our obligation to
indemnify our directors and certain of our officers and employees, in certain circumstances. iPass’ product
agreements typically include a limited indemnification provision for claims from third parties relating to breach
of agreements, and iPass’ intellectual property. Certain indemnification agreements may not be subject to
maximum loss clauses. If the potential loss from any indemnification claim is considered probable and the
amount or the range of the loss can be estimated, we accrue a liability for the estimated loss. To date, claims
under such indemnification provisions have not been significant.
33
8/18/2019 iPass 2012 Annual Report
http://slidepdf.com/reader/full/ipass-2012-annual-report 40/80
Item 7A. Quantitative and Qualitative Disclosures About Market Risk
Exchange Rate Risk
We are exposed to foreign currency exchange rate risk inherent in conducting business globally in numerous
currencies, of which the most significant to our operations for the year ended December 31, 2012 were the Euro,
the British pound, and the Indian Rupee. We are primarily exposed to foreign currency fluctuations related to
network access costs denominated in currencies other than the U.S. Dollar. As such, we benefit from a strongerU.S. Dollar and may be adversely affected by a weaker U.S. Dollar relative to the foreign currency. Currently,
we do not enter into currency forward exchange or option contracts to hedge foreign currency exposures. The
impact of foreign currency fluctuations is also discussed in “Foreign exchange gains (losses)” under Item 7,
“Management’s Discussion and Analysis of Financial Condition and Results of Operations.”
Interest Rate Risk
As of December 31, 2012, we had cash and cash equivalents of $26.8 million, restricted cash of $1.0 million
and no short-term investments. As of December 31, 2011, we had cash and cash equivalents of $25.4 million,
restricted cash of $1.9 million and no short-term investments. Our cash balances are held primarily in bank
deposits and money market accounts with a remaining maturity of three months or less at the time of purchase.
As a result, we do not believe we are exposed to material interest rate risk.
Item 8. Financial Statements and Supplementary Data
Financial Statements
Our financial statements required by this item are set forth in Item 15 of this report and incorporated by
reference here. See Item 15(a)(1) for a listing of financial statements provided in the section titled “Financial
Statements.”
Supplementary Data
The following tables present our operating results for each of the eight quarters during 2012 and 2011. This
data has been derived from unaudited condensed consolidated financial statements that, in the opinion of ourcompany’s management, include all adjustments, consisting only of normal recurring adjustments, necessary for
a fair presentation of such information when read in conjunction with our annual audited consolidated financial
statements and notes thereto appearing elsewhere in this report. These operating results are not necessarily
indicative of results for any future period (in thousands, except per share amounts):
Quarter Ended
March 31 June 30 September 30 December 31
Year Ended December 31, 2012Revenues . . . . . . . . . . . . . . . . . . . . . . . . . . . . . . . $33,294 $32,244 $30,818 $29,722
Operating loss . . . . . . . . . . . . . . . . . . . . . . . . . . . (1,112) (840) (434) (1,093)
Net loss . . . . . . . . . . . . . . . . . . . . . . . . . . . . . . . . (1,275) (881) (771) (1,451)
Basic and diluted net loss per share . . . . . . . . . . $ (0.02) $ (0.01) $ (0.01) $ (0.03)Quarter Ended
March 31 June 30 September 30 December 31
Year Ended December 31, 2011Revenues . . . . . . . . . . . . . . . . . . . . . . . . . . . . . . . $36,404 $35,511 $34,411 $34,435
Operating income (loss) . . . . . . . . . . . . . . . . . . . (989) (939) (873) 322
Net income (loss) . . . . . . . . . . . . . . . . . . . . . . . . (1,477) (1,058) (803) 330
Basic and diluted net income (loss) per share . . $ (0.03) $ (0.02) $ (0.01) $ 0.01
34

8/18/2019 iPass 2012 Annual Report
http://slidepdf.com/reader/full/ipass-2012-annual-report 41/80
Item 9. Changes in and Disagreements with Accountants on Accounting and Financial Disclosure
None.
Item 9A. Controls and Procedures
Disclosure Controls and Procedures
As of the end of the period covered by this report, management of the company conducted an evaluation,under the supervision and with the participation of our Chief Executive Officer and Principal Accounting Officer
who is performing the functions of our Principal Financial Officer at the time of the filing of this Form 10-K (our
“Principal Financial Officer”), of the effectiveness of the design and operation of our disclosure controls and
procedures, as such term is defined in Securities Exchange Act Rules 13a-15(e) and 15d-15(e) of the Securities
Exchange Act of 1934 (the Exchange Act), as of the end of the period covered by this report. Our disclosure
controls and procedures are designed to provide reasonable assurance of achieving their objectives. Based upon
that evaluation, our Chief Executive Officer and Principal Financial Officer concluded that our disclosure
controls and procedures are effective at the reasonable assurance level, as of the end of the period covered by this
report, to ensure that information required to be disclosed was recorded, processed, summarized and reported
within the time periods specified in the SEC’s rules and forms, and to provide reasonable assurance that
information required to be disclosed by us in such reports is accumulated and communicated to the company’s
management, including its Chief Executive Officer and Principal Financial Officer, as appropriate to allow
timely decisions regarding required disclosure.
Management’s Report on Internal Control Over Financial Reporting
Our management is responsible for establishing and maintaining adequate internal control over financial
reporting, as such terms is defined in Rule 13a-15(f) under the Exchange Act. Under the supervision and with the
participation of our Chief Executive Officer and Principal Financial Officer, management of the company
conducted an evaluation of the effectiveness of our internal control over financial reporting based upon the
framework in “Internal Control—Integrated Framework” issued by the Committee of Sponsoring Organizations
of the Treadway Commission (“COSO”) in Internal Control-Integrated Framework . Based on that evaluation,
our management concluded that, as of December 31, 2012, our internal control over financial reporting was
effective based on these criteria. KPMG LLP, an independent registered public accounting firm, has audited the
consolidated financial statements included in this Form 10-K and, as part of the audit, has issued a report,
included herein on the effectiveness of iPass’ internal control over financial reporting as of December 31, 2012.
Changes in Internal Control Over Financial Reporting
During the quarter ended December 31, 2012 there have been no changes in our internal controls over
financial reporting that materially affected, or are reasonably likely to materially affect, our internal controls over
financial reporting.
Inherent Limitations of Disclosure Controls and Procedures and Internal Control over FinancialReporting
Our management, including our Chief Executive Officer and Principal Financial Officer, does not expect
that our disclosure controls and procedures or our internal controls will prevent all errors and all fraud. A control
system, no matter how well designed and operated, can provide only reasonable, not absolute, assurance that theobjectives of the control system are met. Further, the design of a control system must reflect the fact that there
are resource constraints, and the benefits of controls must be considered relative to their costs. Because of the
inherent limitations in all control systems, no evaluation of controls can provide absolute assurance that all
control issues and instances of fraud, if any, within iPass have been detected.
Item 9B. Other Information
Not applicable.
35

8/18/2019 iPass 2012 Annual Report
http://slidepdf.com/reader/full/ipass-2012-annual-report 42/80
PART III
Item 10. Directors, Executive Officers and Corporate Governance
Information relating to our executive officers and directors will be presented under the captions “Executive
Officers” and “Proposal 1—Election of Directors” in our definitive proxy statement in connection with our 2013
Annual Meeting of stockholders to be filed with the Securities and Exchange Commission not later than April 30,
2013 (the “Proxy Statement”). That information is incorporated here by reference.
Information concerning compliance with Section 16(a) of the Securities Exchange Act of 1934 will be
presented under the caption “Section 16(a) Beneficial Ownership Reporting Compliance” in the Proxy Statement.
That information is incorporated into this report by reference.
Information concerning our Code of Ethics will be presented under the caption “Code of Conduct and
Ethics” in “Proposal—1 Election of Directors” in the Proxy Statement. That information is incorporated here by
reference.
Information concerning procedures for recommending nominees for director will be presented under the
caption “Corporate Governance and Nominating Committee” in “Proposal 1—Election of Directors” in the Proxy
Statement. That information is incorporated here by reference.
Information relating to our audit committee and the audit committee financial experts will be presented under
the captions “Information Regarding the Board of Directors and its Committees” and “Audit Committee” in the
“Proposal—1 Election of Directors” in the Proxy Statement. That information is incorporated here by reference.
Item 11. Executive Compensation
Information relating to director and executive compensation and other matters required by this Item 11 will
be presented under the caption “Executive Compensation and Related Information,” “Compensation Committee
Interlocks and Insider Participation” and “Compensation Committee Report” in the Proxy Statement. That
information is incorporated here by reference.
Item 12. Security Ownership of Certain Beneficial Owners and Management and Related Stockholder
Matters
Information relating to the security ownership of our common stock by our management and other
beneficial owners will be presented under the caption “Security Ownership of Certain Beneficial Owners and
Management” in the Proxy Statement. That information is incorporated here by reference.
Information relating to securities authorized for issuance under equity compensation plans will be presented
under the caption “Securities Authorized for Issuance Under Equity Compensation Plans” in the Proxy
Statement. That information is incorporated here by reference.
Item 13. Certain Relationships and Related Transactions, and Director Independence
Information relating to certain relationships of our directors and executive officers and related transactions
and the independence of our directors will be presented under the captions “Independence of the Board of Directors” in the “Proposal—1 Election of Directors” and “Certain Relationships and Related Transactions” in
the Proxy Statement. That information is incorporated here by reference.
Item 14. Principal Accounting Fees and Services
The information required by this item will be included under the caption “Principal Accountant Fees and
Services” in the “Proposal—2 Ratification of Independent Auditors” in the Proxy Statement. That information is
incorporated here by reference.
36
8/18/2019 iPass 2012 Annual Report
http://slidepdf.com/reader/full/ipass-2012-annual-report 43/80
PART IV
Item 15. Exhibits and Financial Statement Schedules
(a) The following financial statements are filed as part of this report:
1. Financial StatementsPage
Report of Independent Registered Public Accounting Firm . . . . . . . . . . . . . . . . . . . . . . . . . . . . . . . . . . . . . . 38
Consolidated Financial Statements:
Balance Sheets as of December 31, 2012 and 2011 . . . . . . . . . . . . . . . . . . . . . . . . . . . . . . . . . . . . . . . . . 40
Statements of Operations and Comprehensive Loss for the years ended December 31, 2012, 2011,
and 2010 . . . . . . . . . . . . . . . . . . . . . . . . . . . . . . . . . . . . . . . . . . . . . . . . . . . . . . . . . . . . . . . . . . . . . . . . 41
Statements of Stockholders’ Equity for the years ended December 31, 2012, 2011, and 2010 . . . . . . . . 42
Statements of Cash Flows for the years ended December 31, 2012, 2011, and 2010 . . . . . . . . . . . . . . . 43
Notes to Consolidated Financial Statements . . . . . . . . . . . . . . . . . . . . . . . . . . . . . . . . . . . . . . . . . . . . . . 44
2. Financial Statement SchedulesSchedule II—Valuation and Qualifying Accounts Receivable . . . . . . . . . . . . . . . . . . . . . . . . . . . . . . . . . . 66
All other schedules are omitted because they are not required or the required information is shown in the
financial statements or notes thereto.
3. Exhibits
See the Exhibit Index which follows the signature page of this Annual Report on Form 10-K, which is
incorporated here by reference.
37
8/18/2019 iPass 2012 Annual Report
http://slidepdf.com/reader/full/ipass-2012-annual-report 44/80
Report of Independent Registered Public Accounting Firm
The Board of Directors and Stockholders
iPass Inc.:
We have audited the accompanying consolidated balance sheets of iPass Inc. and subsidiaries (the
Company) as of December 31, 2012 and 2011, and the related consolidated statements of operations andcomprehensive loss, stockholders’ equity, and cash flows for each of the years in the three-year period ended
December 31, 2012. In connection with our audits of the consolidated financial statements, we also have audited
the accompanying financial statement schedule. We have also audited the Company’s internal control over
financial reporting as of December 31, 2012, based on criteria established in Internal Control—Integrated
Framework issued by the Committee of Sponsoring Organizations of the Treadway Commission (COSO). The
Company’s management is responsible for these consolidated financial statements and financial statement
schedule, for maintaining effective internal control over financial reporting, and for its assessment of the
effectiveness of internal control over financial reporting, included in the accompanying Management’s Report on
Internal Control over Financial Reporting appearing under Item 9A. Our responsibility is to express an opinion
on these consolidated financial statements and financial statement schedule and an opinion on the Company’s
internal control over financial reporting based on our audits.
We conducted our audits in accordance with the standards of the Public Company Accounting OversightBoard (United States). Those standards require that we plan and perform the audits to obtain reasonable
assurance about whether the financial statements are free of material misstatement and whether effective internal
control over financial reporting was maintained in all material respects. Our audits of the consolidated financial
statements included examining, on a test basis, evidence supporting the amounts and disclosures in the financial
statements, assessing the accounting principles used and significant estimates made by management, and
evaluating the overall financial statement presentation. Our audit of internal control over financial reporting
included obtaining an understanding of internal control over financial reporting, assessing the risk that a material
weakness exists, and testing and evaluating the design and operating effectiveness of internal control based on
the assessed risk. Our audits also included performing such other procedures as we considered necessary in the
circumstances. We believe that our audits provide a reasonable basis for our opinions.
A company’s internal control over financial reporting is a process designed to provide reasonable assuranceregarding the reliability of financial reporting and the preparation of financial statements for external purposes in
accordance with generally accepted accounting principles. A company’s internal control over financial reporting
includes those policies and procedures that (1) pertain to the maintenance of records that, in reasonable detail,
accurately and fairly reflect the transactions and dispositions of the assets of the company; (2) provide reasonable
assurance that transactions are recorded as necessary to permit preparation of financial statements in accordance
with generally accepted accounting principles, and that receipts and expenditures of the company are being made
only in accordance with authorizations of management and directors of the company; and (3) provide reasonable
assurance regarding prevention or timely detection of unauthorized acquisition, use, or disposition of the
company’s assets that could have a material effect on the financial statements.
Because of its inherent limitations, internal control over financial reporting may not prevent or detect
misstatements. Also, projections of any evaluation of effectiveness to future periods are subject to the risk thatcontrols may become inadequate because of changes in conditions, or that the degree of compliance with the
policies or procedures may deteriorate.
In our opinion, the consolidated financial statements referred to above present fairly, in all material respects,
the financial position of iPass Inc. and subsidiaries as of December 31, 2012 and 2011, and the results of their
operations and their cash flows for each of the years in the three-year period ended December 31, 2012, in
conformity with U.S. generally accepted accounting principles. Also in our opinion, the related financial
statement schedule, when considered in relation to the basic consolidated financial statements taken as a whole,
38

8/18/2019 iPass 2012 Annual Report
http://slidepdf.com/reader/full/ipass-2012-annual-report 45/80
presents fairly, in all material respects, the information set forth therein. Also in our opinion, the Company
maintained, in all material respects, effective internal control over financial reporting as of December 31, 2012,
based on criteria established in COSO.
/s/ KPMG LLP
Santa Clara, CaliforniaMarch 15, 2013
39
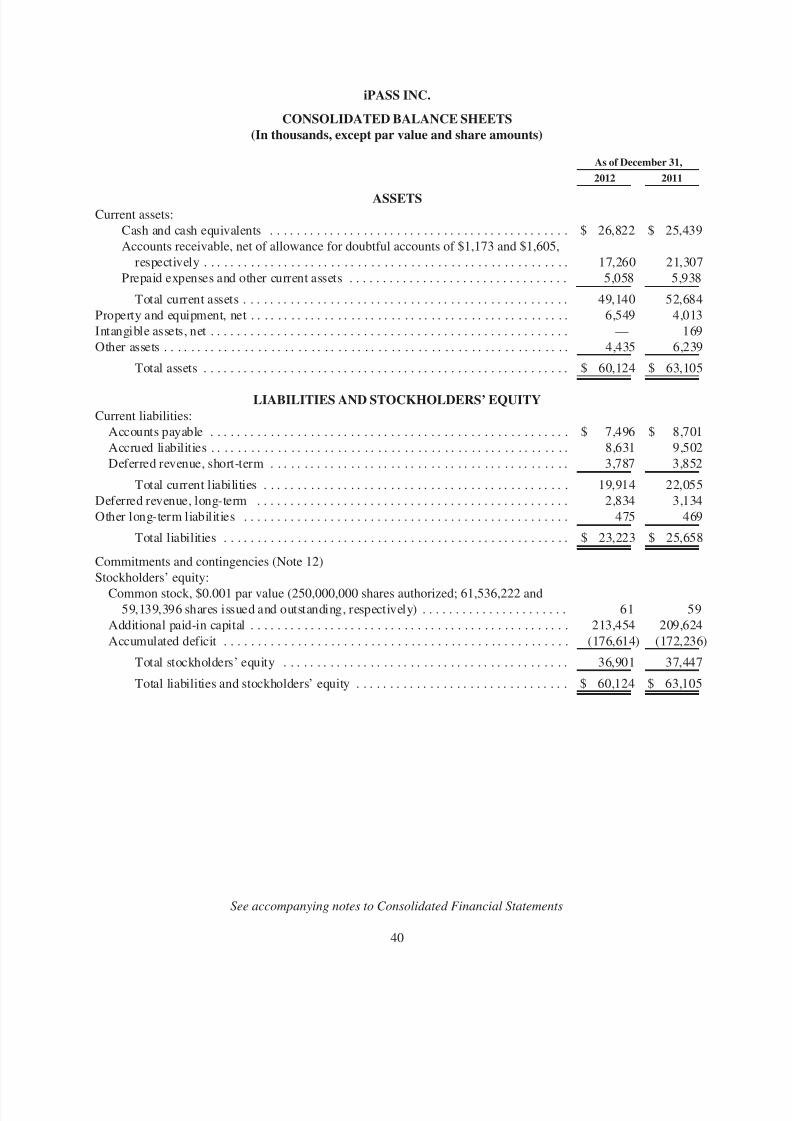
8/18/2019 iPass 2012 Annual Report
http://slidepdf.com/reader/full/ipass-2012-annual-report 46/80
iPASS INC.
CONSOLIDATED BALANCE SHEETS(In thousands, except par value and share amounts)
As of December 31,
2012 2011
ASSETSCurrent assets:
Cash and cash equivalents . . . . . . . . . . . . . . . . . . . . . . . . . . . . . . . . . . . . . . . . . . . . . $ 26,822 $ 25,439
Accounts receivable, net of allowance for doubtful accounts of $1,173 and $1,605,
respectively . . . . . . . . . . . . . . . . . . . . . . . . . . . . . . . . . . . . . . . . . . . . . . . . . . . . . . . 17,260 21,307
Prepaid expenses and other current assets . . . . . . . . . . . . . . . . . . . . . . . . . . . . . . . . . 5,058 5,938
Total current assets . . . . . . . . . . . . . . . . . . . . . . . . . . . . . . . . . . . . . . . . . . . . . . . . . 49,140 52,684
Property and equipment, net . . . . . . . . . . . . . . . . . . . . . . . . . . . . . . . . . . . . . . . . . . . . . . . . 6,549 4,013
Intangible assets, net . . . . . . . . . . . . . . . . . . . . . . . . . . . . . . . . . . . . . . . . . . . . . . . . . . . . . . — 169
Other assets . . . . . . . . . . . . . . . . . . . . . . . . . . . . . . . . . . . . . . . . . . . . . . . . . . . . . . . . . . . . . 4,435 6,239
Total assets . . . . . . . . . . . . . . . . . . . . . . . . . . . . . . . . . . . . . . . . . . . . . . . . . . . . . . . $ 60,124 $ 63,105
LIABILITIES AND STOCKHOLDERS’ EQUITYCurrent liabilities:
Accounts payable . . . . . . . . . . . . . . . . . . . . . . . . . . . . . . . . . . . . . . . . . . . . . . . . . . . . . . $ 7,496 $ 8,701
Accrued liabilities . . . . . . . . . . . . . . . . . . . . . . . . . . . . . . . . . . . . . . . . . . . . . . . . . . . . . . 8,631 9,502
Deferred revenue, short-term . . . . . . . . . . . . . . . . . . . . . . . . . . . . . . . . . . . . . . . . . . . . . 3,787 3,852
Total current liabilities . . . . . . . . . . . . . . . . . . . . . . . . . . . . . . . . . . . . . . . . . . . . . . 19,914 22,055
Deferred revenue, long-term . . . . . . . . . . . . . . . . . . . . . . . . . . . . . . . . . . . . . . . . . . . . . . . 2,834 3,134
Other long-term liabilities . . . . . . . . . . . . . . . . . . . . . . . . . . . . . . . . . . . . . . . . . . . . . . . . . 475 469
Total liabilities . . . . . . . . . . . . . . . . . . . . . . . . . . . . . . . . . . . . . . . . . . . . . . . . . . . . $ 23,223 $ 25,658
Commitments and contingencies (Note 12)
Stockholders’ equity:
Common stock, $0.001 par value (250,000,000 shares authorized; 61,536,222 and59,139,396 shares issued and outstanding, respectively) . . . . . . . . . . . . . . . . . . . . . . 61 59
Additional paid-in capital . . . . . . . . . . . . . . . . . . . . . . . . . . . . . . . . . . . . . . . . . . . . . . . . 213,454 209,624
Accumulated deficit . . . . . . . . . . . . . . . . . . . . . . . . . . . . . . . . . . . . . . . . . . . . . . . . . . . . (176,614) (172,236)
Total stockholders’ equity . . . . . . . . . . . . . . . . . . . . . . . . . . . . . . . . . . . . . . . . . . . 36,901 37,447
Total liabilities and stockholders’ equity . . . . . . . . . . . . . . . . . . . . . . . . . . . . . . . . $ 60,124 $ 63,105
See accompanying notes to Consolidated Financial Statements
40
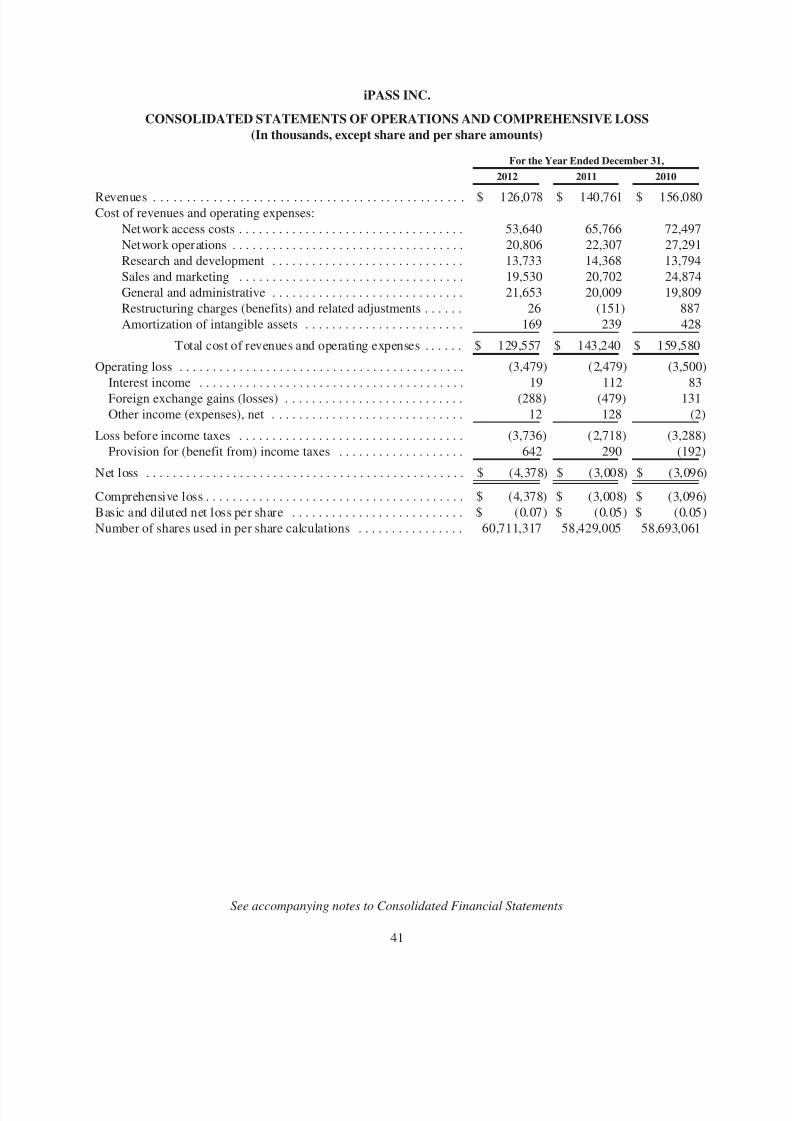
8/18/2019 iPass 2012 Annual Report
http://slidepdf.com/reader/full/ipass-2012-annual-report 47/80
iPASS INC.
CONSOLIDATED STATEMENTS OF OPERATIONS AND COMPREHENSIVE LOSS(In thousands, except share and per share amounts)
For the Year Ended December 31,
2012 2011 2010
Revenues . . . . . . . . . . . . . . . . . . . . . . . . . . . . . . . . . . . . . . . . . . . . . . . $ 126,078 $ 140,761 $ 156,080Cost of revenues and operating expenses:
Network access costs . . . . . . . . . . . . . . . . . . . . . . . . . . . . . . . . . . 53,640 65,766 72,497
Network operations . . . . . . . . . . . . . . . . . . . . . . . . . . . . . . . . . . . 20,806 22,307 27,291
Research and development . . . . . . . . . . . . . . . . . . . . . . . . . . . . . 13,733 14,368 13,794
Sales and marketing . . . . . . . . . . . . . . . . . . . . . . . . . . . . . . . . . . 19,530 20,702 24,874
General and administrative . . . . . . . . . . . . . . . . . . . . . . . . . . . . . 21,653 20,009 19,809
Restructuring charges (benefits) and related adjustments . . . . . . 26 (151) 887
Amortization of intangible assets . . . . . . . . . . . . . . . . . . . . . . . . 169 239 428
Total cost of revenues and operating expenses . . . . . . $ 129,557 $ 143,240 $ 159,580
Operating loss . . . . . . . . . . . . . . . . . . . . . . . . . . . . . . . . . . . . . . . . . . . (3,479) (2,479) (3,500)
Interest income . . . . . . . . . . . . . . . . . . . . . . . . . . . . . . . . . . . . . . . . 19 112 83
Foreign exchange gains (losses) . . . . . . . . . . . . . . . . . . . . . . . . . . . (288) (479) 131
Other income (expenses), net . . . . . . . . . . . . . . . . . . . . . . . . . . . . . 12 128 (2)
Loss before income taxes . . . . . . . . . . . . . . . . . . . . . . . . . . . . . . . . . . (3,736) (2,718) (3,288)
Provision for (benefit from) income taxes . . . . . . . . . . . . . . . . . . . 642 290 (192)
Net loss . . . . . . . . . . . . . . . . . . . . . . . . . . . . . . . . . . . . . . . . . . . . . . . . $ (4,378) $ (3,008) $ (3,096)
Comprehensive loss . . . . . . . . . . . . . . . . . . . . . . . . . . . . . . . . . . . . . . . $ (4,378) $ (3,008) $ (3,096)
Basic and diluted net loss per share . . . . . . . . . . . . . . . . . . . . . . . . . . $ (0.07) $ (0.05) $ (0.05)
Number of shares used in per share calculations . . . . . . . . . . . . . . . . 60,711,317 58,429,005 58,693,061
See accompanying notes to Consolidated Financial Statements
41

8/18/2019 iPass 2012 Annual Report
http://slidepdf.com/reader/full/ipass-2012-annual-report 48/80
iPASS INC.
CONSOLIDATED STATEMENTS OF STOCKHOLDERS’ EQUITY(In thousands)
Common Stock Additional
Paid-InCapital
AccumulatedComprehensiveIncome (Loss)
AccumulatedDeficit
TotalStockholders’
EquityShares Amount
Balances, December 31, 2009 . . . . . . 61,538 $ 62 $214,056 $— $(166,132) $47,986
Exercise of stock options—common
stock issued . . . . . . . . . . . . . . . . . . 289 — 211 — — 211
Restricted stock granted . . . . . . . . . . . 153 — — — — —
Restricted stock cancelled . . . . . . . . . (49) — — — — —
Employee stock purchase plan—
common stock issued . . . . . . . . . . . 183 — 194 — — 194
Repurchased and retired common
stock . . . . . . . . . . . . . . . . . . . . . . . . (4,248) (4) (5,121) — — (5,125)
Stock-based compensation . . . . . . . . . — — 1,699 — — 1,699
Cash dividend declared—Return of
capital . . . . . . . . . . . . . . . . . . . . . . . — — (4,047) — — (4,047)
Net loss . . . . . . . . . . . . . . . . . . . . . . . . — — — — (3,096) (3,096)
Balances, December 31, 2010 . . . . . . 57,866 $ 58 $206,992 — $(169,228) $37,822
Exercise of stock options—common
stock issued . . . . . . . . . . . . . . . . . . 695 1 725 — — 726
Restricted stock granted . . . . . . . . . . . 350 — — — — —
Restricted stock cancelled . . . . . . . . . (76) — — — — —
Restricted stock units released . . . . . . 106 — — — — —
Employee stock purchase plan—
common stock issued . . . . . . . . . . . 198 — 182 — — 182
Stock-based compensation . . . . . . . . . — — 1,725 — — 1,725
Net loss . . . . . . . . . . . . . . . . . . . . . . . . — — — — (3,008) (3,008)
Balances, December 31, 2011 . . . . . . 59,139 $ 59 $209,624 — $(172,236) $37,447
Exercise of stock options—common
stock issued . . . . . . . . . . . . . . . . . . 1,248 2 1,367 — — 1,369
Restricted stock granted . . . . . . . . . . . 1,048 — — — — —
Employee stock purchase plan—
common stock issued . . . . . . . . . . . 186 — 203 — — 203
Repurchased common stock . . . . . . . . (85) — (158) — — (158)
Stock-based compensation . . . . . . . . . — — 2,418 — — 2,418
Net loss . . . . . . . . . . . . . . . . . . . . . . . . — — — — (4,378) (4,378)
Balances, December 31, 2012 . . . . . . 61,536 $ 61 $213,454 — $(176,614) $36,901
See accompanying notes to Consolidated Financial Statements
42
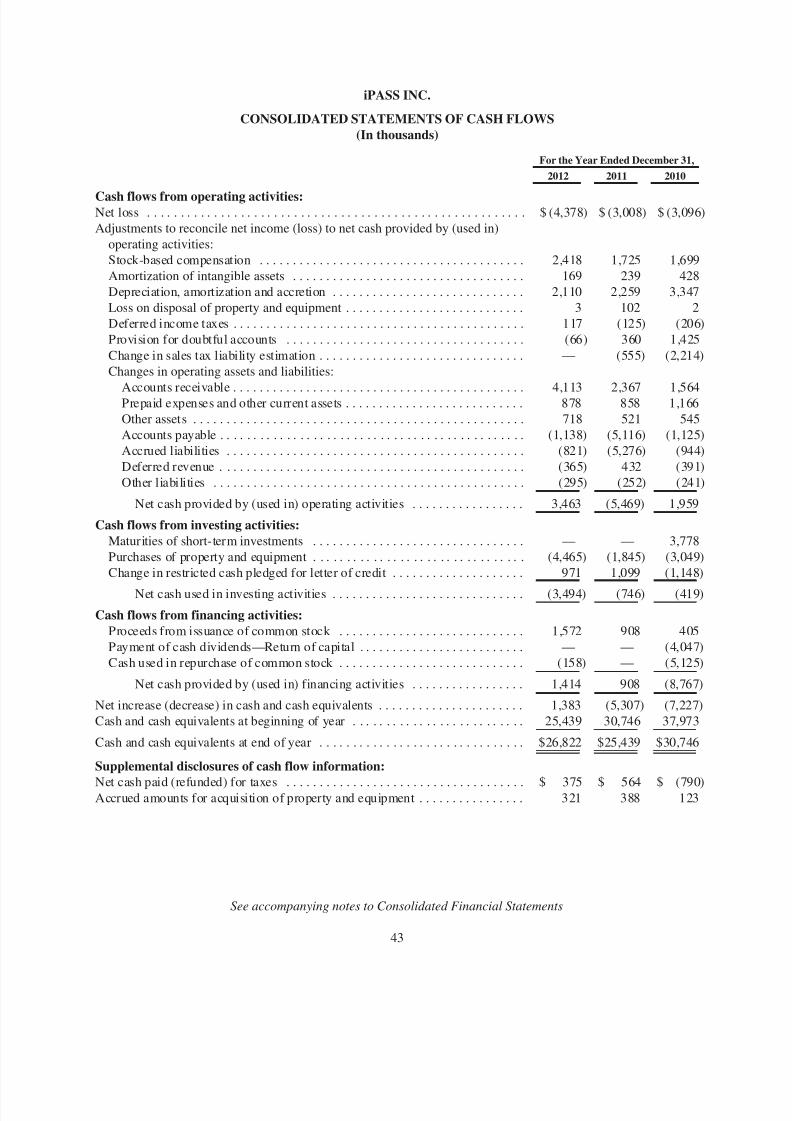
8/18/2019 iPass 2012 Annual Report
http://slidepdf.com/reader/full/ipass-2012-annual-report 49/80
iPASS INC.
CONSOLIDATED STATEMENTS OF CASH FLOWS(In thousands)
For the Year Ended December 31,
2012 2011 2010
Cash flows from operating activities:Net loss . . . . . . . . . . . . . . . . . . . . . . . . . . . . . . . . . . . . . . . . . . . . . . . . . . . . . . . . . $ (4,378) $ (3,008) $ (3,096)
Adjustments to reconcile net income (loss) to net cash provided by (used in)
operating activities:
Stock-based compensation . . . . . . . . . . . . . . . . . . . . . . . . . . . . . . . . . . . . . . . . 2,418 1,725 1,699
Amortization of intangible assets . . . . . . . . . . . . . . . . . . . . . . . . . . . . . . . . . . . 169 239 428
Depreciation, amortization and accretion . . . . . . . . . . . . . . . . . . . . . . . . . . . . . 2,110 2,259 3,347
Loss on disposal of property and equipment . . . . . . . . . . . . . . . . . . . . . . . . . . . 3 102 2
Deferred income taxes . . . . . . . . . . . . . . . . . . . . . . . . . . . . . . . . . . . . . . . . . . . . 117 (125) (206)
Provision for doubtful accounts . . . . . . . . . . . . . . . . . . . . . . . . . . . . . . . . . . . . (66) 360 1,425
Change in sales tax liability estimation . . . . . . . . . . . . . . . . . . . . . . . . . . . . . . . — (555) (2,214)
Changes in operating assets and liabilities:
Accounts receivable . . . . . . . . . . . . . . . . . . . . . . . . . . . . . . . . . . . . . . . . . . . . 4,113 2,367 1,564Prepaid expenses and other current assets . . . . . . . . . . . . . . . . . . . . . . . . . . . 878 858 1,166
Other assets . . . . . . . . . . . . . . . . . . . . . . . . . . . . . . . . . . . . . . . . . . . . . . . . . . 718 521 545
Accounts payable . . . . . . . . . . . . . . . . . . . . . . . . . . . . . . . . . . . . . . . . . . . . . . (1,138) (5,116) (1,125)
Accrued liabilities . . . . . . . . . . . . . . . . . . . . . . . . . . . . . . . . . . . . . . . . . . . . . (821) (5,276) (944)
Deferred revenue . . . . . . . . . . . . . . . . . . . . . . . . . . . . . . . . . . . . . . . . . . . . . . (365) 432 (391)
Other liabilities . . . . . . . . . . . . . . . . . . . . . . . . . . . . . . . . . . . . . . . . . . . . . . . (295) (252) (241)
Net cash provided by (used in) operating activities . . . . . . . . . . . . . . . . . 3,463 (5,469) 1,959
Cash flows from investing activities:Maturities of short-term investments . . . . . . . . . . . . . . . . . . . . . . . . . . . . . . . . — — 3,778
Purchases of property and equipment . . . . . . . . . . . . . . . . . . . . . . . . . . . . . . . . (4,465) (1,845) (3,049)
Change in restricted cash pledged for letter of credit . . . . . . . . . . . . . . . . . . . . 971 1,099 (1,148)
Net cash used in investing activities . . . . . . . . . . . . . . . . . . . . . . . . . . . . . (3,494) (746) (419)
Cash flows from financing activities:Proceeds from issuance of common stock . . . . . . . . . . . . . . . . . . . . . . . . . . . . 1,572 908 405
Payment of cash dividends—Return of capital . . . . . . . . . . . . . . . . . . . . . . . . . — — (4,047)
Cash used in repurchase of common stock . . . . . . . . . . . . . . . . . . . . . . . . . . . . (158) — (5,125)
Net cash provided by (used in) financing activities . . . . . . . . . . . . . . . . . 1,414 908 (8,767)
Net increase (decrease) in cash and cash equivalents . . . . . . . . . . . . . . . . . . . . . . 1,383 (5,307) (7,227)
Cash and cash equivalents at beginning of year . . . . . . . . . . . . . . . . . . . . . . . . . . 25,439 30,746 37,973
Cash and cash equivalents at end of year . . . . . . . . . . . . . . . . . . . . . . . . . . . . . . . $26,822 $25,439 $30,746
Supplemental disclosures of cash flow information:
Net cash paid (refunded) for taxes . . . . . . . . . . . . . . . . . . . . . . . . . . . . . . . . . . . . $ 375 $ 564 $ (790)Accrued amounts for acquisition of property and equipment . . . . . . . . . . . . . . . . 321 388 123
See accompanying notes to Consolidated Financial Statements
43
8/18/2019 iPass 2012 Annual Report
http://slidepdf.com/reader/full/ipass-2012-annual-report 50/80
iPASS INC.
NOTES TO CONSOLIDATED FINANCIAL STATEMENTS
Note 1. Basis of Presentation
The Company’s consolidated financial statements have been prepared in accordance with accounting
principles generally accepted in the United States of America (“GAAP”). The consolidated financial statements
include the accounts of iPass Inc. (the “Company”) and its wholly-owned subsidiaries. All intercompanytransactions and accounts have been eliminated.
Note 2. Significant Accounting Policies
Use of Estimates
The preparation of the consolidated financial statements and related disclosures in conformity with GAAP
and pursuant to the rules and regulations of the U.S. Securities and Exchange Commission (“SEC”) requires
management to make estimates and judgments that affect the amounts reported in the Consolidated Financial
Statements and accompanying notes. Estimates are used for, but not limited to the valuation of accounts
receivables, other long-lived assets, stock-based compensation, legal contingencies, network access costs, income
taxes, and sales tax liabilities. These estimates and assumptions are based on management’s best estimates and
judgment. Actual results could differ from the estimates made by management with respect to these and otheritems.
Foreign Currency Accounting
The U.S. Dollar is the functional currency for the Company and all of its subsidiaries; therefore, the
Company does not have a translation adjustment recorded through accumulated other comprehensive income
(loss). While the Company’s revenue contracts are denominated in United States (“U.S.”) dollars, the Company
has foreign operations that incur expenses in various foreign currencies. Monetary assets and liabilities are
remeasured using the current exchange rate at the balance sheet date. Non-monetary assets and liabilities and
capital accounts are remeasured using historical exchange rates. Foreign currency expenses are remeasured using
the average exchange rates in effect during the year. Foreign currency exchange gains and losses are presented
separately in the Consolidated Statements of Operations.
Cash Equivalents
The Company considers all highly-liquid investments with a remaining maturity of three months or less at
the time of purchase to be cash equivalents. Cash equivalents consist primarily of investments in institutional
money market funds.
Restricted Cash
The Company’s restricted cash consists of cash deposited with a national financial institution in connection
with irrevocable letters of credit issued to a network service provider. The total amount of restricted cash was
$1.0 million and $1.9 million at December 31, 2012 and 2011, respectively, and is included in other assets on the
Consolidated Balance Sheets at December 31, 2012 and 2011.
Concentrations of Risk
Financial instruments that potentially subject the Company to significant concentrations of credit risk
consist principally of cash, cash equivalents and accounts receivable. Substantially all of the Company’s cash and
cash equivalents are held by two financial institutions. The Company is exposed to risk in the event of default by
these financial institutions or the issuers of these securities to the extent the balances are in excess of amounts
that are insured by the FDIC.
44
8/18/2019 iPass 2012 Annual Report
http://slidepdf.com/reader/full/ipass-2012-annual-report 51/80
iPASS INC.
NOTES TO CONSOLIDATED FINANCIAL STATEMENTS—(Continued)
The Company’s receivables are derived from revenue earned from customers located primarily in the United
States and Europe. The Company provides credit to its customers in the normal course of business and requires
no collateral to secure accounts receivable. The Company maintains an allowance for potentially uncollectible
accounts receivable based on its assessment of the collectability of accounts receivable. The allowance fordoubtful accounts is based on customer-specific identification, which encompasses various factors, including; the
Company’s review of credit profiles of its customers, age of the accounts receivable balances, contractual terms
and conditions, current economic conditions that may affect a customer’s ability to pay and historical payment
experience. As of December 31, 2012, accounts receivables from European customers represented 45% of total
accounts receivable of which 33% were aged within the Company’s standard credit term of 30 days and 86%
were aged less than 90 days.
As of December 31, 2012 and 2011, no individual customer represented 10% or more of accounts
receivable. For the years ended December 31, 2012, 2011, and 2010, no individual customer represented more
than 10% of total revenues.
For the year ended December 31, 2012, 2011 and 2010, one supplier accounted for 12%, 17% and 16%,respectively, of total network access costs. No other individual supplier represented more than 10% of total
network access costs in 2012, 2011 and 2010.
Property and Equipment, Net
Property and equipment, net are stated at cost, less accumulated depreciation or amortization. Depreciation
of property and equipment and amortization of leasehold improvements are computed using the straight-line
method over the estimated useful lives of the respective assets as follows:
• Equipment: 3 years
• Furniture and fixtures: 5 years
• Computer software: 3 to 5 years
• Leasehold improvements: the shorter of the useful life of the leasehold improvements or the term of the
underlying lease
• Construction in progress: various depending on the underlying asset being developed
Upon retirement or sale, the cost of assets disposed of and the related accumulated depreciation are removed
from the accounts and any resulting gain or loss is credited or charged to the statement of operations.
Expenditures for maintenance and repairs are charged to expense as incurred.
Construction in progress is related to the construction or development of property and equipment that has
not yet been placed in service. Depreciation for equipment and computer software begins once it is placed in
service and depreciation for leasehold improvements commences once they are ready for intended use.
Income Taxes
Income taxes are accounted for under the asset and liability method. Deferred tax assets and liabilities are
recognized for the expected future tax consequences attributable to differences between the financial statement
carrying amounts of existing assets and liabilities and their respective tax bases, along with net operating loss and
tax credit carry forwards. Deferred tax assets and liabilities are measured using enacted tax rates expected to
45

8/18/2019 iPass 2012 Annual Report
http://slidepdf.com/reader/full/ipass-2012-annual-report 52/80
8/18/2019 iPass 2012 Annual Report
http://slidepdf.com/reader/full/ipass-2012-annual-report 53/80
iPASS INC.
NOTES TO CONSOLIDATED FINANCIAL STATEMENTS—(Continued)
projected employee stock option exercise behaviors, risk-free interest rates and expected dividends. The expected
stock price volatility is based on historical volatility and the expected term is based on the historical average
expected term. Because stock-based compensation expense is based on awards ultimately expected to vest, it has
been reduced for forfeitures. The expected forfeiture rate is based upon the historical experience of employeeturnover and certain other factors. To the extent the actual forfeiture rate is different from the expected rate,
stock-based compensation expense is adjusted accordingly.
Revenue Recognition
Revenue is recognized when all four revenue recognition criteria have been met; persuasive evidence of an
arrangement exists, service has been provided to the customer, the fee is fixed or determinable, and collection is
reasonably assured. When the above criteria are not met, revenue is deferred and recognized upon cash
collection, upon acceptance of a completion certificate from the customer or when the product is shipped,
depending on the type of fee or service arrangement.
Network Fees
The Company recognizes network fees during the period the services are rendered to the end-users based on
usage or a flat fee. The Company has two types of flat fee arrangements for its network services. The first is a
recurring flat fee that is billed at the same dollar amount each month. The second is a recurring fee calculated
based on a flat fee per user per month, of which the dollar amount billed would differ month-to-month depending
on the number of users using the Company’s services during a given month. The Company frequently requires
customers to commit to minimum network fees associated with monthly, quarterly or annual minimum network
usage or over the term of the arrangement. For customers that have agreed to a Minimum Monthly Commitment
(MMC), the customer’s monthly invoice reflects the greater of the customer’s actual usage for the month or the
MMC for that month. If the MMC exceeds actual usage (a “Shortfall”), the Company determines whether the
Shortfall is fixed or determinable. If the Company concludes that the Shortfall is fixed or determinable, based
upon customer specific billing history, and other revenue recognition criteria have been met, the Companyrecognizes as revenue the amount of Shortfall which is invoiced. If the Company concludes that the Shortfall is
not fixed or determinable, the Company recognizes revenue when the Shortfall amount is collected.
Platform Services and Other Fees
Platform services are any services that allow a user to connect to a network using the iPass platform. Fees
for this service are typically based upon a monthly rate, and revenue is recognized during the month the services
are provided. Revenue related to iPassConnect (“iPC”) fees, including extended support fees as the iPC product
reached end-of-life in 2012, and Open Mobile Platform fees are typically based upon a monthly rate (per user
rate or a flat fee) and are recognized during the month the services are provided. Start-up support service fees
representing charges to new customers, customization services and standard training may be billed up-front in
advance and recognized as revenue over the term of the contract.
Managed Network Services (“MNS”) Contract Fees
MNS contracts are monthly flat fee contracts combined with certain other upfront fees such as one-time
non-recurring fees, which include equipment fees, installation, management set up, and shipping fees. As a
result, the Company recognizes its MNS revenue arrangements monthly over the estimated life of the endpoint.
An endpoint represents a separate physical location, such as a branch office, a retail office or a virtual office.
Endpoint lives are estimated based on the historical average endpoint life by product group. The Company
47
8/18/2019 iPass 2012 Annual Report
http://slidepdf.com/reader/full/ipass-2012-annual-report 54/80
iPASS INC.
NOTES TO CONSOLIDATED FINANCIAL STATEMENTS—(Continued)
periodically performs an analysis of estimated lives of the endpoints and revises the remaining term over which
revenue will be recognized, if needed. As of December 31, 2012, the expected period of performance for
endpoints approximates a 4-year period for the Company’s Branch/Retail product group, and 18 months for the
Company’s Home Office product group.
Deferred Revenue
The Company defers revenue for services that are billed in advance or prepaid as required per customer
agreements. Revenue is recognized as the services are being performed, or ratably over the contract term,
depending on the nature of the service, such as maintenance, and certain professional services. Amounts expected
to be recognized as revenue within one year are classified as short-term.
Deferred Installation Costs
Installation costs are incurred on the Company’s MNS contracts and are deferred and amortized over the
estimated lives of the end points.
Network Access Costs
Network access costs represent the amounts paid to network access providers for the usage of their
networks. The Company has minimum purchase commitments with some network service providers for access
that it expects to utilize during the term of the contracts. Costs of minimum purchase contracts are recognized as
network access costs at the greater of the minimum commitment or actual usage.
Advertising Expenses
Advertising costs are expensed as incurred. Advertising expenses for the years ended December 31, 2012,
2011, and 2010 were $0.1 million each year.
Software Development Costs
The Company follows the guidance set forth in FASB Accounting Standards Codification (“ASC”) 985-20,
Costs of Software to be Sold, Leased or Otherwise Marketed . Under this guidance, capitalization of software
development costs begins upon the establishment of a product’s technological feasibility, which is generally the
completion of a working model of the product and amortization begins when a product is available for general
release to customers. The period between the achievement of technological feasibility and the general release of
products has typically been of short duration and costs incurred during this period have not been material.
Accordingly, the Company has not capitalized any software development costs for software sold, or otherwise
marketed. Software development costs incurred prior to the establishment of technological feasibility are
included in research and development and are expensed as incurred.
In addition, the Company follows the guidance set forth in ASC 350-40, Internal Use Software,
(“ASC 350-40”), in accounting for the development of its application service and other internal use applications.
ASC 350-40 requires companies to capitalize qualifying computer software costs, which are incurred during the
application development stage. Costs related to preliminary project activities and post-implementation activities
are expensed as incurred. The Company capitalized $2.6 million and $0.7 million in 2012 and 2011, respectively
for a purchase of a new ERP system as a construction in progress. These capitalized costs have not been
amortized as of December 31, 2012 since the ERP system was not ready for the Company’s intended use.
48
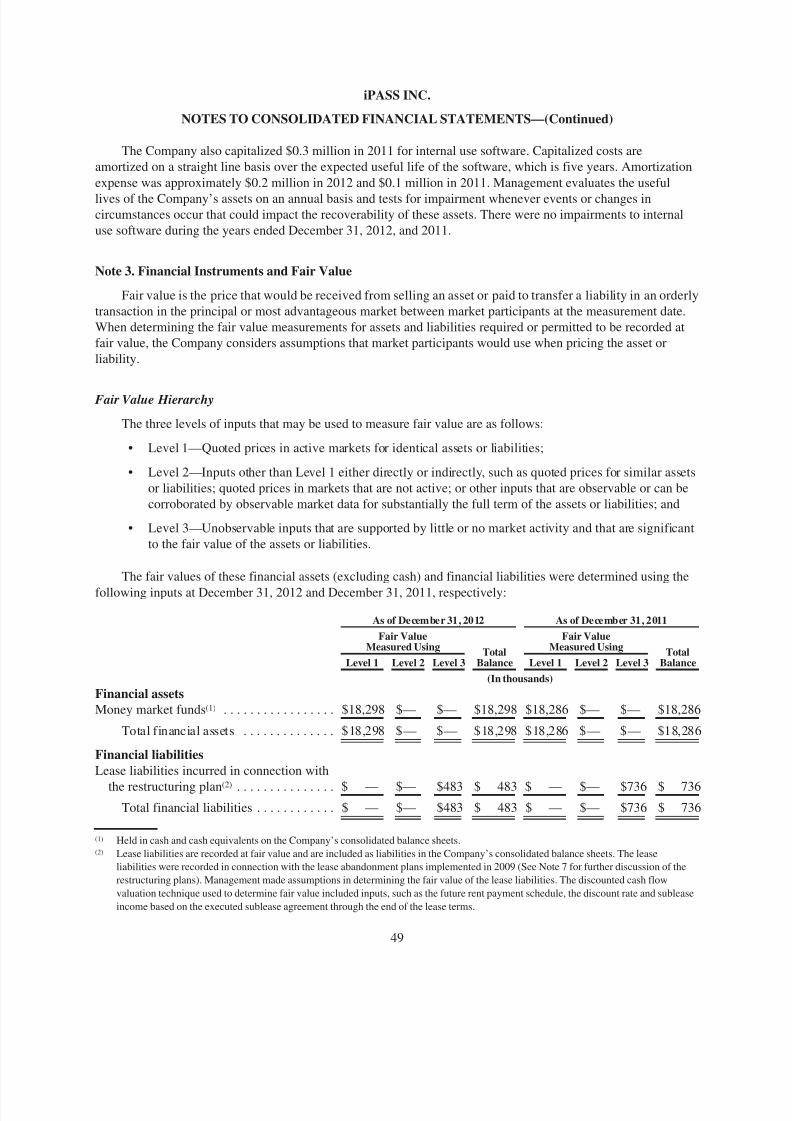
8/18/2019 iPass 2012 Annual Report
http://slidepdf.com/reader/full/ipass-2012-annual-report 55/80
iPASS INC.
NOTES TO CONSOLIDATED FINANCIAL STATEMENTS—(Continued)
The Company also capitalized $0.3 million in 2011 for internal use software. Capitalized costs are
amortized on a straight line basis over the expected useful life of the software, which is five years. Amortization
expense was approximately $0.2 million in 2012 and $0.1 million in 2011. Management evaluates the useful
lives of the Company’s assets on an annual basis and tests for impairment whenever events or changes incircumstances occur that could impact the recoverability of these assets. There were no impairments to internal
use software during the years ended December 31, 2012, and 2011.
Note 3. Financial Instruments and Fair Value
Fair value is the price that would be received from selling an asset or paid to transfer a liability in an orderly
transaction in the principal or most advantageous market between market participants at the measurement date.
When determining the fair value measurements for assets and liabilities required or permitted to be recorded at
fair value, the Company considers assumptions that market participants would use when pricing the asset or
liability.
Fair Value Hierarchy
The three levels of inputs that may be used to measure fair value are as follows:
• Level 1—Quoted prices in active markets for identical assets or liabilities;
• Level 2—Inputs other than Level 1 either directly or indirectly, such as quoted prices for similar assets
or liabilities; quoted prices in markets that are not active; or other inputs that are observable or can be
corroborated by observable market data for substantially the full term of the assets or liabilities; and
• Level 3—Unobservable inputs that are supported by little or no market activity and that are significant
to the fair value of the assets or liabilities.
The fair values of these financial assets (excluding cash) and financial liabilities were determined using the
following inputs at December 31, 2012 and December 31, 2011, respectively:
As of December 31, 2012 As of December 31, 2011
Fair ValueMeasured Using
TotalBalance
Fair ValueMeasured Using
TotalBalanceLevel 1 Level 2 Level 3 Level 1 Level 2 Level 3
(In thousands)
Financial assetsMoney market funds(1) . . . . . . . . . . . . . . . . . $18,298 $— $— $18,298 $18,286 $— $— $18,286
Total financial assets . . . . . . . . . . . . . . $18,298 $— $— $18,298 $18,286 $— $— $18,286
Financial liabilitiesLease liabilities incurred in connection with
the restructuring plan(2) . . . . . . . . . . . . . . . $ — $— $483 $ 483 $ — $— $736 $ 736
Total financial liabilities . . . . . . . . . . . . $ — $— $483 $ 483 $ — $— $736 $ 736
(1) Held in cash and cash equivalents on the Company’s consolidated balance sheets.(2) Lease liabilities are recorded at fair value and are included as liabilities in the Company’s consolidated balance sheets. The lease
liabilities were recorded in connection with the lease abandonment plans implemented in 2009 (See Note 7 for further discussion of the
restructuring plans). Management made assumptions in determining the fair value of the lease liabilities. The discounted cash flow
valuation technique used to determine fair value included inputs, such as the future rent payment schedule, the discount rate and sublease
income based on the executed sublease agreement through the end of the lease terms.
49
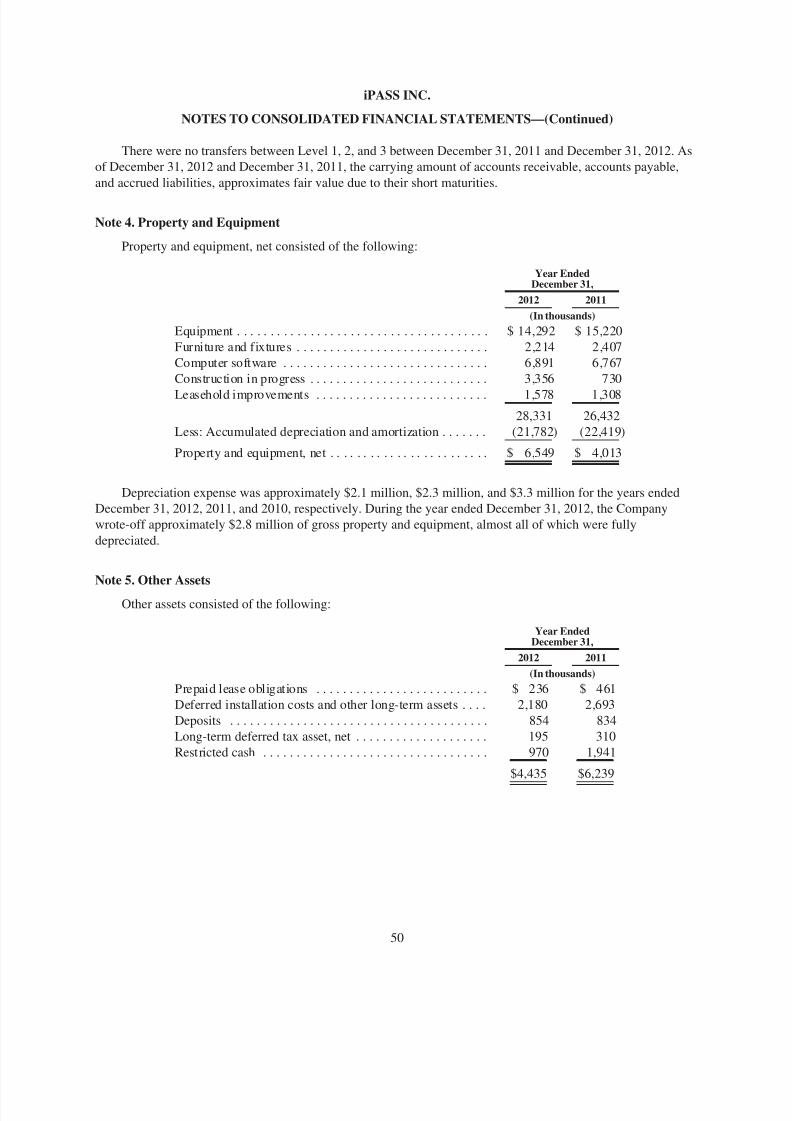
8/18/2019 iPass 2012 Annual Report
http://slidepdf.com/reader/full/ipass-2012-annual-report 56/80
iPASS INC.
NOTES TO CONSOLIDATED FINANCIAL STATEMENTS—(Continued)
There were no transfers between Level 1, 2, and 3 between December 31, 2011 and December 31, 2012. As
of December 31, 2012 and December 31, 2011, the carrying amount of accounts receivable, accounts payable,
and accrued liabilities, approximates fair value due to their short maturities.
Note 4. Property and Equipment
Property and equipment, net consisted of the following:
Year EndedDecember 31,
2012 2011
(In thousands)
Equipment . . . . . . . . . . . . . . . . . . . . . . . . . . . . . . . . . . . . . . $ 14,292 $ 15,220
Furniture and fixtures . . . . . . . . . . . . . . . . . . . . . . . . . . . . . 2,214 2,407
Computer software . . . . . . . . . . . . . . . . . . . . . . . . . . . . . . . 6,891 6,767
Construction in progress . . . . . . . . . . . . . . . . . . . . . . . . . . . 3,356 730
Leasehold improvements . . . . . . . . . . . . . . . . . . . . . . . . . . 1,578 1,308
28,331 26,432
Less: Accumulated depreciation and amortization . . . . . . . (21,782) (22,419)
Property and equipment, net . . . . . . . . . . . . . . . . . . . . . . . . $ 6,549 $ 4,013
Depreciation expense was approximately $2.1 million, $2.3 million, and $3.3 million for the years ended
December 31, 2012, 2011, and 2010, respectively. During the year ended December 31, 2012, the Company
wrote-off approximately $2.8 million of gross property and equipment, almost all of which were fully
depreciated.
Note 5. Other Assets
Other assets consisted of the following:
Year EndedDecember 31,
2012 2011
(In thousands)
Prepaid lease obligations . . . . . . . . . . . . . . . . . . . . . . . . . . $ 236 $ 461
Deferred installation costs and other long-term assets . . . . 2,180 2,693
Deposits . . . . . . . . . . . . . . . . . . . . . . . . . . . . . . . . . . . . . . . 854 834
Long-term deferred tax asset, net . . . . . . . . . . . . . . . . . . . . 195 310
Restricted cash . . . . . . . . . . . . . . . . . . . . . . . . . . . . . . . . . . 970 1,941
$4,435 $6,239
50

8/18/2019 iPass 2012 Annual Report
http://slidepdf.com/reader/full/ipass-2012-annual-report 57/80
iPASS INC.
NOTES TO CONSOLIDATED FINANCIAL STATEMENTS—(Continued)
Note 6. Accrued Liabilities
Accrued liabilities consisted of the following:
Year EndedDecember 31,
2012 2011
(In thousands)
Sales tax liabilities . . . . . . . . . . . . . . . . . . . . . . . . . . . . . . . . . . . $1,080 $1,858
Accrued restructuring liabilities—current(1) . . . . . . . . . . . . . . . 203 267
Accrued network access costs . . . . . . . . . . . . . . . . . . . . . . . . . . 1,995 2,418
Accrued bonus, commissions and other employee benefits . . . 2,550 2,829
Amounts due to customers . . . . . . . . . . . . . . . . . . . . . . . . . . . . 1,061 570
Other accrued liabilities . . . . . . . . . . . . . . . . . . . . . . . . . . . . . . 1,742 1,560
$8,631 $9,502
(1) See Note 7. Accrued Restructuring
Note 7. Accrued Restructuring
During the year ended December 31, 2009, the Company announced restructuring plans to reduce its
operating costs and focus its resources on key strategic priorities, which resulted in a workforce reduction of 146
positions across all functional areas and abandonment of certain facilities and termination of a contract
obligation. All workforce and contract obligation terminations were completed in 2010. The lease on the
abandonment of facilities will continue until 2015.
The following is a roll forward of restructuring liability for the years ended December 31, 2012, 2011 and
2010:
TotalRestructuring
Costs
(In thousands)
Balance as of December 31, 2009 . . . . . . . . . . . . . . . . . . . . . . . . . . . $ 4,323
Restructuring charges and related adjustments . . . . . . . . . . . . . . . . . 887
Payments . . . . . . . . . . . . . . . . . . . . . . . . . . . . . . . . . . . . . . . . . . . . . . (3,569)
Balance as of December 31, 2010 . . . . . . . . . . . . . . . . . . . . . . . . . . . $ 1,641
Restructuring benefits and related adjustments . . . . . . . . . . . . . . . . . (151)
Payments . . . . . . . . . . . . . . . . . . . . . . . . . . . . . . . . . . . . . . . . . . . . . . (754)
Balance as of December 31, 2011 . . . . . . . . . . . . . . . . . . . . . . . . . . . $ 736
Restructuring charges and related adjustments . . . . . . . . . . . . . . . . . 26
Payments . . . . . . . . . . . . . . . . . . . . . . . . . . . . . . . . . . . . . . . . . . . . . . (279)Balance as of December 31, 2012 . . . . . . . . . . . . . . . . . . . . . . . . . . . $ 483
As of December 31, 2012 and 2011, the Company classified approximately $0.2 million and $0.3 million,
respectively, of the restructuring liability in accrued liabilities and the remaining restructuring liability of
approximately $0.3 million and $0.4 million, respectively, in long-term liabilities based on the Company’s
expectation that the remaining lease payments for the abandoned facilities will be paid over the remaining term
of the related leases (net of expected sublease income).
51
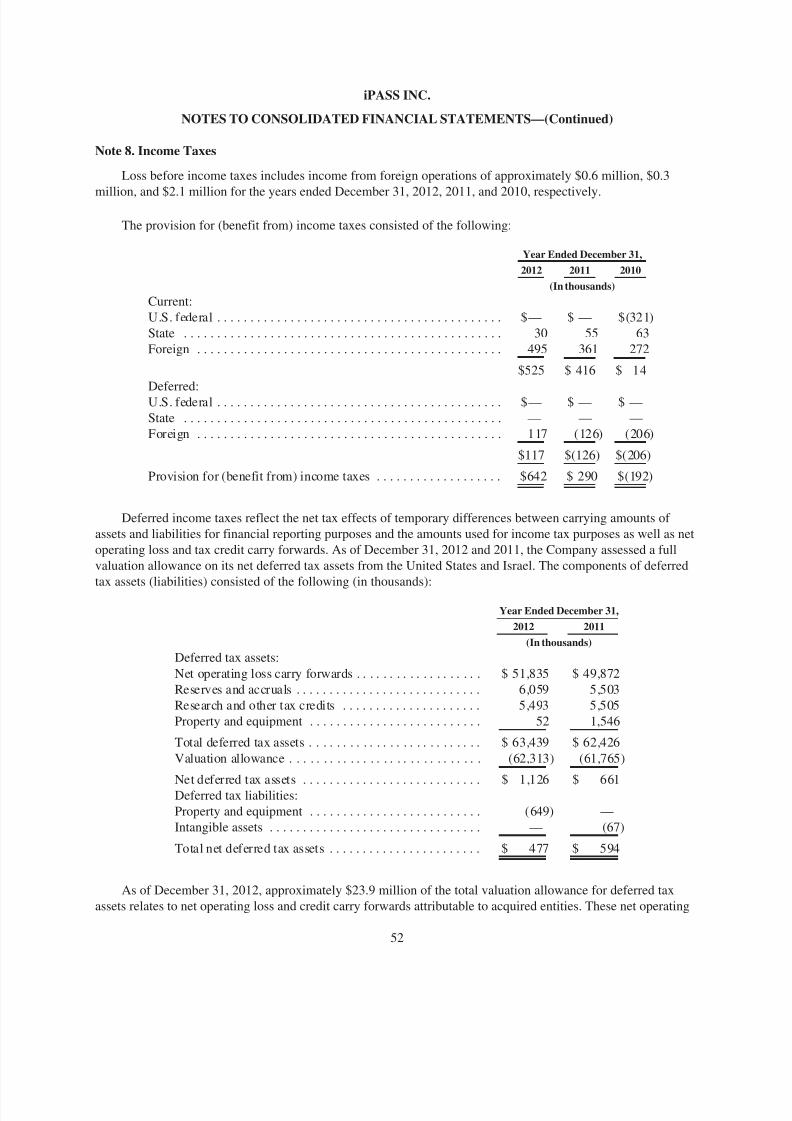
8/18/2019 iPass 2012 Annual Report
http://slidepdf.com/reader/full/ipass-2012-annual-report 58/80
iPASS INC.
NOTES TO CONSOLIDATED FINANCIAL STATEMENTS—(Continued)
Note 8. Income Taxes
Loss before income taxes includes income from foreign operations of approximately $0.6 million, $0.3
million, and $2.1 million for the years ended December 31, 2012, 2011, and 2010, respectively.
The provision for (benefit from) income taxes consisted of the following:
Year Ended December 31,
2012 2011 2010
(In thousands)
Current:
U.S. federal . . . . . . . . . . . . . . . . . . . . . . . . . . . . . . . . . . . . . . . . . . . $— $ — $(321)
State . . . . . . . . . . . . . . . . . . . . . . . . . . . . . . . . . . . . . . . . . . . . . . . . 30 55 63
Foreign . . . . . . . . . . . . . . . . . . . . . . . . . . . . . . . . . . . . . . . . . . . . . . 495 361 272
$525 $ 416 $ 14
Deferred:U.S. federal . . . . . . . . . . . . . . . . . . . . . . . . . . . . . . . . . . . . . . . . . . . $— $ — $ —
State . . . . . . . . . . . . . . . . . . . . . . . . . . . . . . . . . . . . . . . . . . . . . . . . — — —
Foreign . . . . . . . . . . . . . . . . . . . . . . . . . . . . . . . . . . . . . . . . . . . . . . 117 (126) (206)
$117 $(126) $(206)
Provision for (benefit from) income taxes . . . . . . . . . . . . . . . . . . . $642 $ 290 $(192)
Deferred income taxes reflect the net tax effects of temporary differences between carrying amounts of
assets and liabilities for financial reporting purposes and the amounts used for income tax purposes as well as net
operating loss and tax credit carry forwards. As of December 31, 2012 and 2011, the Company assessed a full
valuation allowance on its net deferred tax assets from the United States and Israel. The components of deferred
tax assets (liabilities) consisted of the following (in thousands):
Year Ended December 31,
2012 2011
(In thousands)
Deferred tax assets:
Net operating loss carry forwards . . . . . . . . . . . . . . . . . . . $ 51,835 $ 49,872
Reserves and accruals . . . . . . . . . . . . . . . . . . . . . . . . . . . . 6,059 5,503
Research and other tax credits . . . . . . . . . . . . . . . . . . . . . 5,493 5,505
Property and equipment . . . . . . . . . . . . . . . . . . . . . . . . . . 52 1,546
Total deferred tax assets . . . . . . . . . . . . . . . . . . . . . . . . . . $ 63,439 $ 62,426
Valuation allowance . . . . . . . . . . . . . . . . . . . . . . . . . . . . . (62,313) (61,765)
Net deferred tax assets . . . . . . . . . . . . . . . . . . . . . . . . . . . $ 1,126 $ 661Deferred tax liabilities:
Property and equipment . . . . . . . . . . . . . . . . . . . . . . . . . . (649) —
Intangible assets . . . . . . . . . . . . . . . . . . . . . . . . . . . . . . . . — (67)
Total net deferred tax assets . . . . . . . . . . . . . . . . . . . . . . . $ 477 $ 594
As of December 31, 2012, approximately $23.9 million of the total valuation allowance for deferred tax
assets relates to net operating loss and credit carry forwards attributable to acquired entities. These net operating
52
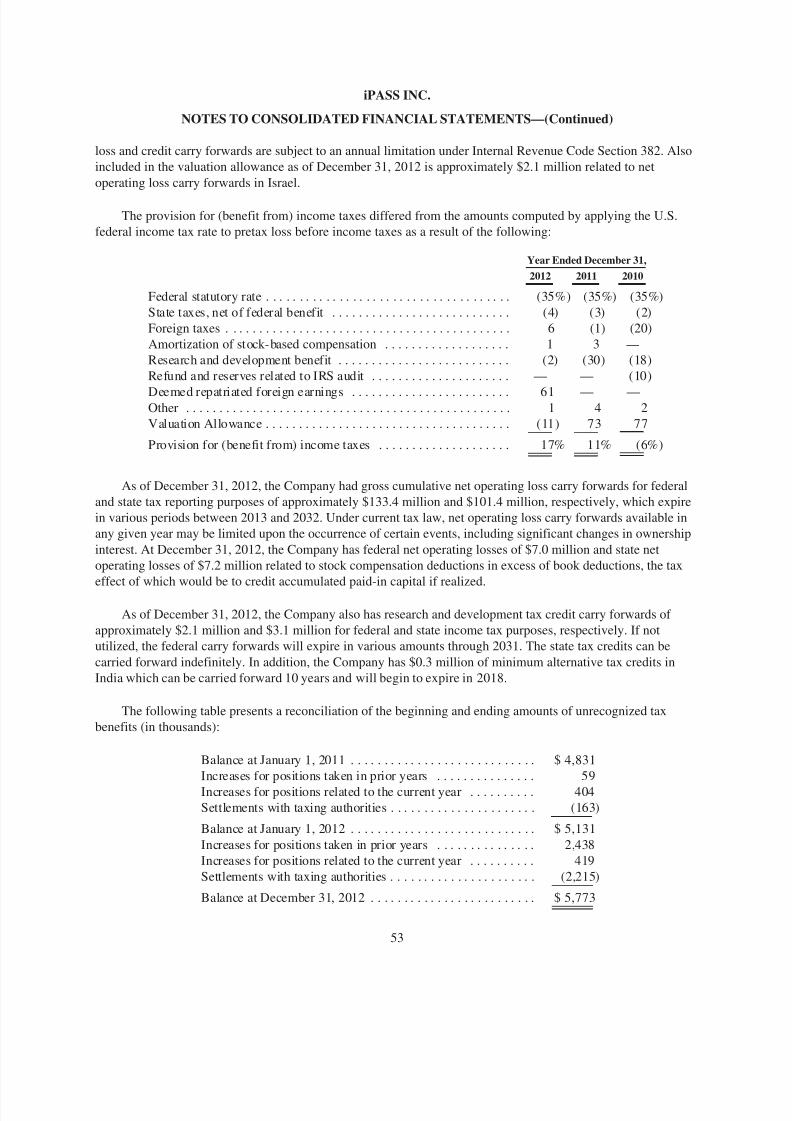
8/18/2019 iPass 2012 Annual Report
http://slidepdf.com/reader/full/ipass-2012-annual-report 59/80
iPASS INC.
NOTES TO CONSOLIDATED FINANCIAL STATEMENTS—(Continued)
loss and credit carry forwards are subject to an annual limitation under Internal Revenue Code Section 382. Also
included in the valuation allowance as of December 31, 2012 is approximately $2.1 million related to net
operating loss carry forwards in Israel.
The provision for (benefit from) income taxes differed from the amounts computed by applying the U.S.
federal income tax rate to pretax loss before income taxes as a result of the following:
Year Ended December 31,
2012 2011 2010
Federal statutory rate . . . . . . . . . . . . . . . . . . . . . . . . . . . . . . . . . . . . . (35%) (35%) (35%)
State taxes, net of federal benefit . . . . . . . . . . . . . . . . . . . . . . . . . . . (4) (3) (2)
Foreign taxes . . . . . . . . . . . . . . . . . . . . . . . . . . . . . . . . . . . . . . . . . . . 6 (1) (20)
Amortization of stock-based compensation . . . . . . . . . . . . . . . . . . . 1 3 —
Research and development benefit . . . . . . . . . . . . . . . . . . . . . . . . . . (2) (30) (18)
Refund and reserves related to IRS audit . . . . . . . . . . . . . . . . . . . . . — — (10)
Deemed repatriated foreign earnings . . . . . . . . . . . . . . . . . . . . . . . . 61 — —Other . . . . . . . . . . . . . . . . . . . . . . . . . . . . . . . . . . . . . . . . . . . . . . . . . 1 4 2
Valuation Allowance . . . . . . . . . . . . . . . . . . . . . . . . . . . . . . . . . . . . . (11) 73 77
Provision for (benefit from) income taxes . . . . . . . . . . . . . . . . . . . . 17% 11% (6%)
As of December 31, 2012, the Company had gross cumulative net operating loss carry forwards for federal
and state tax reporting purposes of approximately $133.4 million and $101.4 million, respectively, which expire
in various periods between 2013 and 2032. Under current tax law, net operating loss carry forwards available in
any given year may be limited upon the occurrence of certain events, including significant changes in ownership
interest. At December 31, 2012, the Company has federal net operating losses of $7.0 million and state net
operating losses of $7.2 million related to stock compensation deductions in excess of book deductions, the tax
effect of which would be to credit accumulated paid-in capital if realized.
As of December 31, 2012, the Company also has research and development tax credit carry forwards of
approximately $2.1 million and $3.1 million for federal and state income tax purposes, respectively. If not
utilized, the federal carry forwards will expire in various amounts through 2031. The state tax credits can be
carried forward indefinitely. In addition, the Company has $0.3 million of minimum alternative tax credits in
India which can be carried forward 10 years and will begin to expire in 2018.
The following table presents a reconciliation of the beginning and ending amounts of unrecognized tax
benefits (in thousands):
Balance at January 1, 2011 . . . . . . . . . . . . . . . . . . . . . . . . . . . . $ 4,831
Increases for positions taken in prior years . . . . . . . . . . . . . . . 59
Increases for positions related to the current year . . . . . . . . . . 404
Settlements with taxing authorities . . . . . . . . . . . . . . . . . . . . . . (163)
Balance at January 1, 2012 . . . . . . . . . . . . . . . . . . . . . . . . . . . . $ 5,131
Increases for positions taken in prior years . . . . . . . . . . . . . . . 2,438
Increases for positions related to the current year . . . . . . . . . . 419
Settlements with taxing authorities . . . . . . . . . . . . . . . . . . . . . . (2,215)
Balance at December 31, 2012 . . . . . . . . . . . . . . . . . . . . . . . . . $ 5,773
53

8/18/2019 iPass 2012 Annual Report
http://slidepdf.com/reader/full/ipass-2012-annual-report 60/80
iPASS INC.
NOTES TO CONSOLIDATED FINANCIAL STATEMENTS—(Continued)
The increase for tax positions taken in the prior years during fiscal 2012 primarily relates to certain state
research and development tax credits currently under review by tax authorities. Settlements with tax authorities
during fiscal 2012 resulted from taxes being assessed for deemed repatriated foreign earnings on intercompany
balances due to foreign subsidiaries.
If any of these tax benefits that are unrecognized should become recognizable at a future time a balance of
$0.7 million would be released into income.
It is reasonably possible that the total amount of unrecognized tax benefits will change in 2013. Decreases in
the unrecognized tax benefits will result from the lapsing of statutes of limitations and the possible completion of
tax audits in various jurisdictions. Increases will primarily result from tax positions expected to be taken on tax
returns for 2013.
In accordance with its accounting policy, the Company recognizes interest and penalties related to income
tax matters in the provision for income taxes; which were not considered material during 2012, 2011, and 2010.
Given the uncertainty as to settlement terms, the timing of payments and the impact of such settlements on
other uncertain tax positions, the range of estimated potential changes in underlying uncertain tax positions is
between a decrease of $0.8 million and an increase of $0.3 million.
The Company’s major taxing jurisdictions are U.S. Federal, California, the U.K. and India. In the normal
course of the Company’s business, the Company is subject to income tax audits in various jurisdictions. Years
2006 to 2012 remain open to examination by certain of these major taxing jurisdictions.
The Company currently has income tax audits in progress in India and has accrued approximately
$0.6 million in connection with these audits.
Note 9. Stockholders’ Equity
Equity Incentive Plans
The Company has two stock plans that permit it to grant stock options, restricted stock awards and restricted
stock units to employees (“Employee Plan”) and to directors (“Director Plan”). Stock options granted to
employees generally vest 25% on the first anniversary of the grant date with the remainder vesting ratably over
the following 36 months; stock options generally expire 10 years after the date of grant. Restricted stock awards
give the recipient the right to receive shares upon the lapse of the instruments’ time and/or performance based
restrictions. The restricted stock awards with time-based restrictions are considered outstanding at the time of
grant, as the holders are entitled to dividends and voting rights. Employees may surrender a portion of their
award shares to satisfy minimum statutory tax withholding obligations with respect to the vesting of restricted
stock awards. The restricted stock units are not considered outstanding until released and restricted stock awards
with performance-based restrictions are not considered outstanding until the performance criteria have been metand therefore are not entitled to dividends or voting rights at the time of grant. The performance-based restricted
stock awards vest upon the achievement of pre-defined performance goals, including targeted earnings before
interest, taxes and amortization (“EBITA”) and targeted number of active Open Mobile monetized users. As of
December 31, 2012, the Company has a total of 753,925 outstanding shares of performance-based restricted
stock awards related to targeted EBITA, none of which had vested as the performance goals had not been met.
During 2011, the Company had granted a total of 280,000 shares of performance-based restricted stock awards
related to targeted number of active Open Mobile monetized users which carry a service-condition to vest four
years from the grant
54
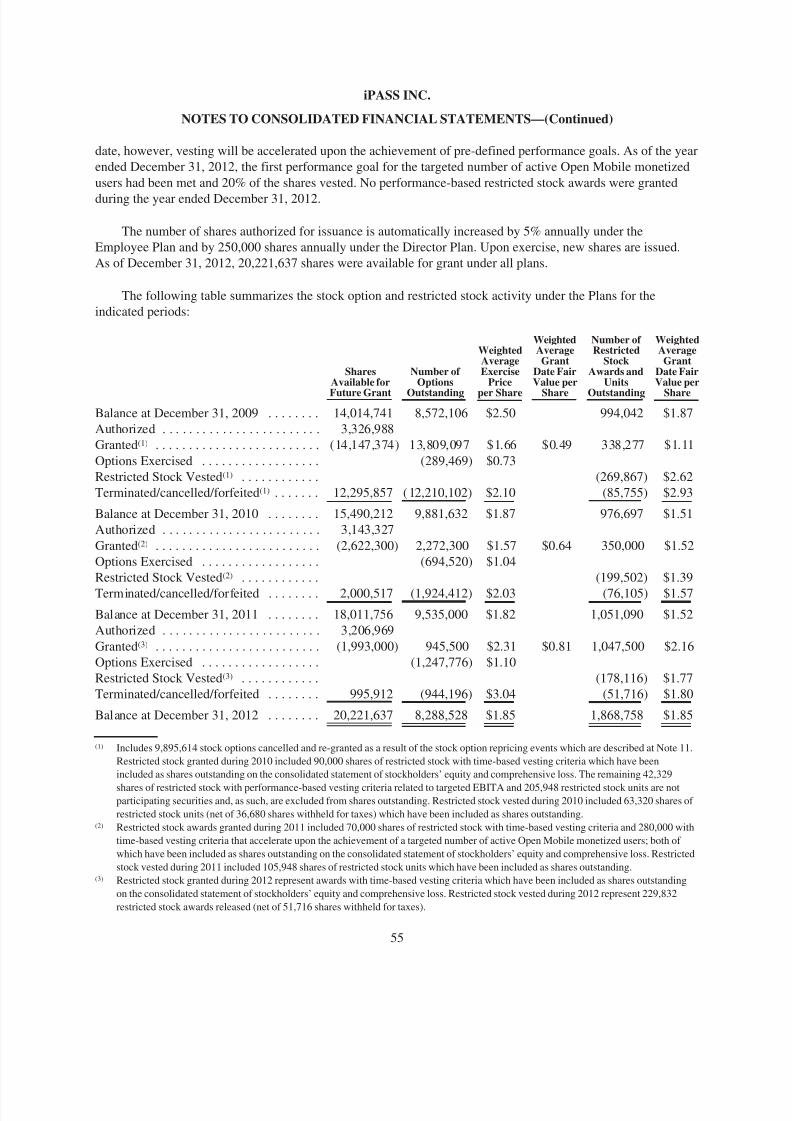
8/18/2019 iPass 2012 Annual Report
http://slidepdf.com/reader/full/ipass-2012-annual-report 61/80
iPASS INC.
NOTES TO CONSOLIDATED FINANCIAL STATEMENTS—(Continued)
date, however, vesting will be accelerated upon the achievement of pre-defined performance goals. As of the year
ended December 31, 2012, the first performance goal for the targeted number of active Open Mobile monetized
users had been met and 20% of the shares vested. No performance-based restricted stock awards were granted
during the year ended December 31, 2012.
The number of shares authorized for issuance is automatically increased by 5% annually under the
Employee Plan and by 250,000 shares annually under the Director Plan. Upon exercise, new shares are issued.
As of December 31, 2012, 20,221,637 shares were available for grant under all plans.
The following table summarizes the stock option and restricted stock activity under the Plans for the
indicated periods:
SharesAvailable for
Future Grant
Number of Options
Outstanding
WeightedAverageExercise
Price
per Share
WeightedAverage
GrantDate FairValue per
Share
Number of Restricted
StockAwards and
Units
Outstanding
WeightedAverage
GrantDate FairValue per
Share
Balance at December 31, 2009 . . . . . . . . 14,014,741 8,572,106 $2.50 994,042 $1.87
Authorized . . . . . . . . . . . . . . . . . . . . . . . . 3,326,988
Granted(1) . . . . . . . . . . . . . . . . . . . . . . . . . (14,147,374) 13,809,097 $1.66 $0.49 338,277 $1.11
Options Exercised . . . . . . . . . . . . . . . . . . (289,469) $0.73
Restricted Stock Vested(1) . . . . . . . . . . . . (269,867) $2.62
Terminated/cancelled/forfeited(1) . . . . . . . 12,295,857 ( 12,210,102) $2.10 (85,755) $2.93
Balance at December 31, 2010 . . . . . . . . 15,490,212 9,881,632 $1.87 976,697 $1.51
Authorized . . . . . . . . . . . . . . . . . . . . . . . . 3,143,327
Granted(2) . . . . . . . . . . . . . . . . . . . . . . . . . (2,622,300) 2,272,300 $1.57 $0.64 350,000 $1.52
Options Exercised . . . . . . . . . . . . . . . . . . (694,520) $1.04
Restricted Stock Vested(2) . . . . . . . . . . . . (199,502) $1.39
Terminated/cancelled/forfeited . . . . . . . . 2,000,517 (1,924,412) $2.03 (76,105) $1.57
Balance at December 31, 2011 . . . . . . . . 18,011,756 9,535,000 $1.82 1,051,090 $1.52
Authorized . . . . . . . . . . . . . . . . . . . . . . . . 3,206,969
Granted(3) . . . . . . . . . . . . . . . . . . . . . . . . . (1,993,000) 945,500 $2.31 $0.81 1,047,500 $2.16
Options Exercised . . . . . . . . . . . . . . . . . . (1,247,776) $1.10
Restricted Stock Vested(3) . . . . . . . . . . . . (178,116) $1.77
Terminated/cancelled/forfeited . . . . . . . . 995,912 (944,196) $3.04 (51,716) $1.80
Balance at December 31, 2012 . . . . . . . . 20,221,637 8,288,528 $1.85 1,868,758 $1.85
(1) Includes 9,895,614 stock options cancelled and re-granted as a result of the stock option repricing events which are described at Note 11.
Restricted stock granted during 2010 included 90,000 shares of restricted stock with time-based vesting criteria which have been
included as shares outstanding on the consolidated statement of stockholders’ equity and comprehensive loss. The remaining 42,329
shares of restricted stock with performance-based vesting criteria related to targeted EBITA and 205,948 restricted stock units are notparticipating securities and, as such, are excluded from shares outstanding. Restricted stock vested during 2010 included 63,320 shares of
restricted stock units (net of 36,680 shares withheld for taxes) which have been included as shares outstanding.(2) Restricted stock awards granted during 2011 included 70,000 shares of restricted stock with time-based vesting criteria and 280,000 with
time-based vesting criteria that accelerate upon the achievement of a targeted number of active Open Mobile monetized users; both of
which have been included as shares outstanding on the consolidated statement of stockholders’ equity and comprehensive loss. Restricted
stock vested during 2011 included 105,948 shares of restricted stock units which have been included as shares outstanding.(3) Restricted stock granted during 2012 represent awards with time-based vesting criteria which have been included as shares outstanding
on the consolidated statement of stockholders’ equity and comprehensive loss. Restricted stock vested during 2012 represent 229,832
restricted stock awards released (net of 51,716 shares withheld for taxes).
55
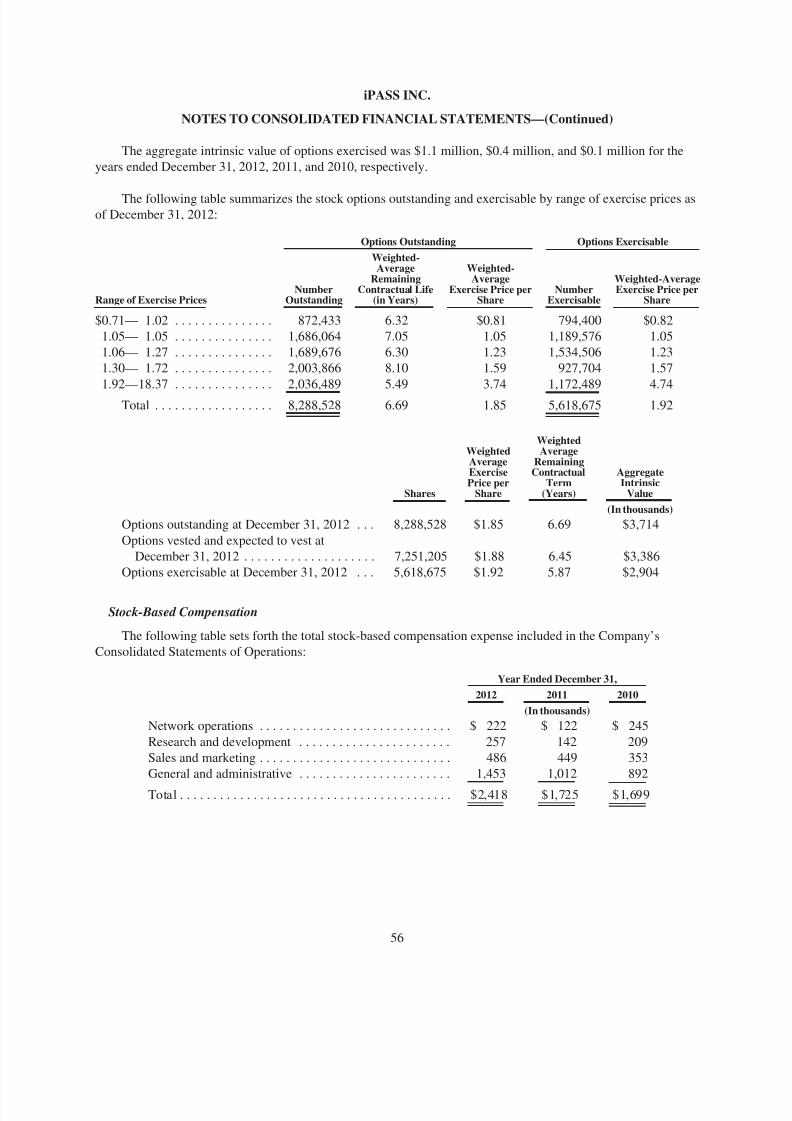
8/18/2019 iPass 2012 Annual Report
http://slidepdf.com/reader/full/ipass-2012-annual-report 62/80
iPASS INC.
NOTES TO CONSOLIDATED FINANCIAL STATEMENTS—(Continued)
The aggregate intrinsic value of options exercised was $1.1 million, $0.4 million, and $0.1 million for the
years ended December 31, 2012, 2011, and 2010, respectively.
The following table summarizes the stock options outstanding and exercisable by range of exercise prices asof December 31, 2012:
Options Outstanding Options Exercisable
Range of Exercise PricesNumber
Outstanding
Weighted-Average
RemainingContractual Life
(in Years)
Weighted-Average
Exercise Price perShare
NumberExercisable
Weighted-AverageExercise Price per
Share
$0.71— 1.02 . . . . . . . . . . . . . . . 872,433 6.32 $0.81 794,400 $0.82
1.05— 1.05 . . . . . . . . . . . . . . . 1,686,064 7.05 1.05 1,189,576 1.05
1.06— 1.27 . . . . . . . . . . . . . . . 1,689,676 6.30 1.23 1,534,506 1.23
1.30— 1.72 . . . . . . . . . . . . . . . 2,003,866 8.10 1.59 927,704 1.57
1.92—18.37 . . . . . . . . . . . . . . . 2,036,489 5.49 3.74 1,172,489 4.74
Total . . . . . . . . . . . . . . . . . . 8,288,528 6.69 1.85 5,618,675 1.92
Shares
WeightedAverageExercisePrice per
Share
WeightedAverage
RemainingContractual
Term(Years)
AggregateIntrinsic
Value
(In thousands)
Options outstanding at December 31, 2012 . . . 8,288,528 $1.85 6.69 $3,714
Options vested and expected to vest at
December 31, 2012 . . . . . . . . . . . . . . . . . . . . 7,251,205 $1.88 6.45 $3,386
Options exercisable at December 31, 2012 . . . 5,618,675 $1.92 5.87 $2,904
Stock-Based Compensation
The following table sets forth the total stock-based compensation expense included in the Company’s
Consolidated Statements of Operations:
Year Ended December 31,
2012 2011 2010
(In thousands)
Network operations . . . . . . . . . . . . . . . . . . . . . . . . . . . . . $ 222 $ 122 $ 245
Research and development . . . . . . . . . . . . . . . . . . . . . . . 257 142 209
Sales and marketing . . . . . . . . . . . . . . . . . . . . . . . . . . . . . 486 449 353
General and administrative . . . . . . . . . . . . . . . . . . . . . . . 1,453 1,012 892
Total . . . . . . . . . . . . . . . . . . . . . . . . . . . . . . . . . . . . . . . . . $2,418 $1,725 $1,699
56

8/18/2019 iPass 2012 Annual Report
http://slidepdf.com/reader/full/ipass-2012-annual-report 63/80
iPASS INC.
NOTES TO CONSOLIDATED FINANCIAL STATEMENTS—(Continued)
The following table sets forth the total stock-based compensation expense by award-type:
Year Ended December 31,
2012 2011 2010(In thousands)
Stock options . . . . . . . . . . . . . . . . . . . . . . . . . . . . . . . . . . . . . . $1,145 $1,299 $1,360
Restricted stock . . . . . . . . . . . . . . . . . . . . . . . . . . . . . . . . . . . . 1,173 392 302
Employee stock purchase plan . . . . . . . . . . . . . . . . . . . . . . . . . 100 34 37
Total . . . . . . . . . . . . . . . . . . . . . . . . . . . . . . . . . . . . . . . . . . . . . $2,418 $1,725 $1,699
As of December 31, 2012, there was $1.3 million of total unrecognized stock-based compensation expense
related to stock options, net of expected forfeitures that will be recognized over the weighted average period of
2.0 years. As of December 31, 2012, there was $1.2 million of total unrecognized compensation cost related to
the unvested restricted stock awards granted, which is expected to be recognized over the remaining weighted
average vesting period of 1.3 years.
Valuation Assumptions
The weighted average estimated fair value of stock options granted during the years ended December 31,
2012, 2011, and 2010 were calculated under the Black-Scholes option-pricing model, using the following
weighted-average assumptions (excluding repriced stock options, which are described at Note 11):
Year Ended December 31,
2012 2011 2010
Risk-free rate . . . . . . . . . . . . . . . . . . . . . . . . . . . . . . . . . 0.35% 0.98% 1.86%
Expected dividend yield . . . . . . . . . . . . . . . . . . . . . . . . . 0% 0% 0%
Expected volatility . . . . . . . . . . . . . . . . . . . . . . . . . . . . . 52% 57% 54%
Expected term . . . . . . . . . . . . . . . . . . . . . . . . . . . . . . . . 3.1 years 3.4 years 4.0 years
Expected volatility is based on the historical volatility of the Company’s common stock. The expected term
of stock options granted is based on the historical average expected term. The risk-free rate for periods within the
expected term of the stock option is based on the U.S. Treasury yield curve in effect at the time of grant.
The total grant date fair value of the restricted awards granted during the years ended December 31, 2012,
2011, and 2010 was approximately $2.3 million, $0.5 million, and $0.4 million, respectively, which will be
recognized over the requisite service periods.
Employee Stock Purchase Plan
Under the Company’s Employee Stock Purchase Plan (“ESPP”), the Company can grant stock purchaserights to all eligible employees during a one-year offering period with purchase dates at the end of each six-
month purchase period (each April and October). The number of shares reserved under the ESPP increases
annually by 1% of the total number of shares outstanding at the end of the prior year. As of December 31, 2012,
the Company reserved 6.3 million shares of common stock for issuance under the ESPP plan and approximately
3.7 million shares remain available for future issuance. The ESPP plan permits employees to purchase common
stock through payroll deductions of up to 15% on an employee’s compensation, including commissions,
overtime, bonuses and other incentive compensation. The purchase price per share is equal to the lower of 85%
of the fair market value per share at the beginning of the offering period, or 85% of the fair market value per
57

8/18/2019 iPass 2012 Annual Report
http://slidepdf.com/reader/full/ipass-2012-annual-report 64/80
iPASS INC.
NOTES TO CONSOLIDATED FINANCIAL STATEMENTS—(Continued)
share on the semi-annual purchase date. No participant may purchase more than 2,500 shares per offering or
$25,000 worth of common stock in any one calendar year. During the years ended December 31, 2012, 2011 and
2010, 186,275, 198,490, and 183,062 shares were purchased at average per share prices of $1.09, $0.92 and
$1.06, respectively.
Compensation cost related to the Company’s employee stock purchase plan is calculated using the fair value
of the employees’ purchase rights granted. The estimated fair value of employee purchase rights granted during
the years ended December 31, 2012, 2011, and 2010 was calculated using the Black-Scholes option-pricing
model with the following weighted-average assumptions:
Year Ended December 31,
2012 2011 2010
Risk-free rate . . . . . . . . . . . . . . . . . . . . . . . . . 0.09% 0.18% 0.16%
Expected dividend yield . . . . . . . . . . . . . . . . 0% 0% 0%
Expected volatility . . . . . . . . . . . . . . . . . . . . 55% 47% 57%
Expected term . . . . . . . . . . . . . . . . . . . . . . . . 0.5 to 1 year 0.5 to 1 year 0.5 to 1 year
Note 10. Return of Capital and Repricing of Stock Options
In 2010, the Company returned approximately $4.0 million or $0.07 per share to stockholders in the form of
an extraordinary cash dividend, which was paid on December 17, 2010 to stockholders of record as of
November 18, 2010. In accordance with an amendment approved by the Company’s stockholders on August 18,
2009, the Company’s Board of Directors subsequently adjusted the exercise price of 9,895,614 outstanding stock
options from an original weighted average exercise price of $2.02 to $1.91. The incremental fair value of the
adjusted options was determined using the Black-Scholes option-pricing model using the following assumptions:
Expected term of 3.81 years; Expected volatility of 54.1%; Risk free interest rate of 1.27%; and Expected
Dividend Yield of 0%. Also in accordance with this plan, the Board of Directors granted 59,033 additional stock
options and 48,277 additional performance stock awards. The performance stock awards had a fair market valueon the date of grant of $1.15 per share (collectively the “December 2010 Repricing”).
The adjustment of existing options and issuance of new stock options and performance stock awards was
intended to address the diminution in value to the option from the extraordinary cash dividend and to attempt to
preserve the option’s intrinsic value (amount of value the option holder would receive upon immediate exercise
and sale of the underlying stock) that existed prior to the extraordinary cash dividend. This completed the
Company’s commitment to return $40.0 million of capital to stockholders in the form of dividends and stock
repurchases. For further details on stock repurchases, see Note 11.
During the year ended December 31, 2012 and 2011, the Company did not pay any cash dividends on its
common stock or reprice its stock options.
Note 11. Stock Repurchase Activities
On November 3, 2009, the Company’s Board of Directors approved a $10.0 million stock repurchase
program (the “2009 Repurchase Program”) that expired on March 31, 2011. Under this program the Company
was authorized to repurchase up to $10.0 million of outstanding common stock from time to time on the open
market or through negotiated transactions. Through December 31, 2010, the Company had repurchased a total of
5.0 million shares of common stock at an average price of $1.17 per share for a total cash outlay of
approximately $5.8 million, excluding broker fees of approximately $0.1 million.
58
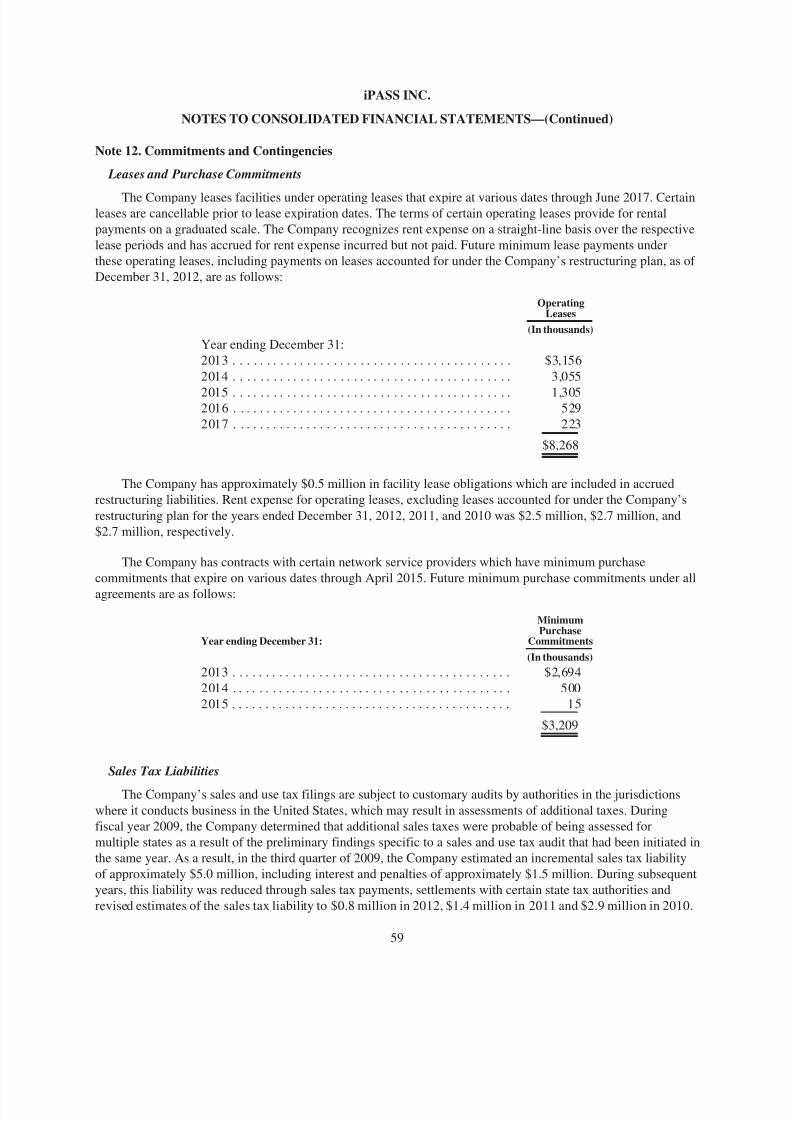
8/18/2019 iPass 2012 Annual Report
http://slidepdf.com/reader/full/ipass-2012-annual-report 65/80
iPASS INC.
NOTES TO CONSOLIDATED FINANCIAL STATEMENTS—(Continued)
Note 12. Commitments and Contingencies
Leases and Purchase Commitments
The Company leases facilities under operating leases that expire at various dates through June 2017. Certainleases are cancellable prior to lease expiration dates. The terms of certain operating leases provide for rental
payments on a graduated scale. The Company recognizes rent expense on a straight-line basis over the respective
lease periods and has accrued for rent expense incurred but not paid. Future minimum lease payments under
these operating leases, including payments on leases accounted for under the Company’s restructuring plan, as of
December 31, 2012, are as follows:
OperatingLeases
(In thousands)
Year ending December 31:
2013 . . . . . . . . . . . . . . . . . . . . . . . . . . . . . . . . . . . . . . . . . . $3,156
2014 . . . . . . . . . . . . . . . . . . . . . . . . . . . . . . . . . . . . . . . . . . 3,055
2015 . . . . . . . . . . . . . . . . . . . . . . . . . . . . . . . . . . . . . . . . . . 1,3052016 . . . . . . . . . . . . . . . . . . . . . . . . . . . . . . . . . . . . . . . . . . 529
2017 . . . . . . . . . . . . . . . . . . . . . . . . . . . . . . . . . . . . . . . . . . 223
$8,268
The Company has approximately $0.5 million in facility lease obligations which are included in accrued
restructuring liabilities. Rent expense for operating leases, excluding leases accounted for under the Company’s
restructuring plan for the years ended December 31, 2012, 2011, and 2010 was $2.5 million, $2.7 million, and
$2.7 million, respectively.
The Company has contracts with certain network service providers which have minimum purchase
commitments that expire on various dates through April 2015. Future minimum purchase commitments under all
agreements are as follows:
Year ending December 31:
MinimumPurchase
Commitments
(In thousands)
2013 . . . . . . . . . . . . . . . . . . . . . . . . . . . . . . . . . . . . . . . . . . $2,694
2014 . . . . . . . . . . . . . . . . . . . . . . . . . . . . . . . . . . . . . . . . . . 500
2015 . . . . . . . . . . . . . . . . . . . . . . . . . . . . . . . . . . . . . . . . . . 15
$3,209
Sales Tax Liabilities
The Company’s sales and use tax filings are subject to customary audits by authorities in the jurisdictions
where it conducts business in the United States, which may result in assessments of additional taxes. During
fiscal year 2009, the Company determined that additional sales taxes were probable of being assessed for
multiple states as a result of the preliminary findings specific to a sales and use tax audit that had been initiated in
the same year. As a result, in the third quarter of 2009, the Company estimated an incremental sales tax liability
of approximately $5.0 million, including interest and penalties of approximately $1.5 million. During subsequent
years, this liability was reduced through sales tax payments, settlements with certain state tax authorities and
revised estimates of the sales tax liability to $0.8 million in 2012, $1.4 million in 2011 and $2.9 million in 2010.
59
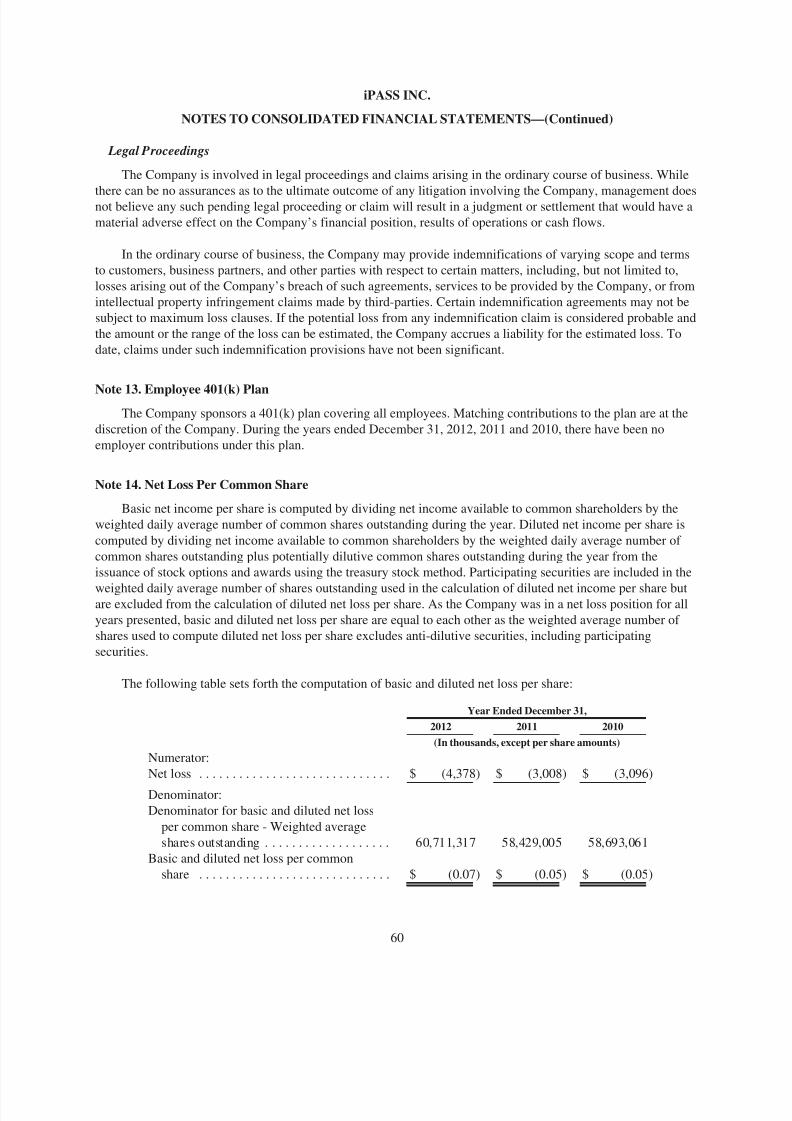
8/18/2019 iPass 2012 Annual Report
http://slidepdf.com/reader/full/ipass-2012-annual-report 66/80
iPASS INC.
NOTES TO CONSOLIDATED FINANCIAL STATEMENTS—(Continued)
Legal Proceedings
The Company is involved in legal proceedings and claims arising in the ordinary course of business. While
there can be no assurances as to the ultimate outcome of any litigation involving the Company, management doesnot believe any such pending legal proceeding or claim will result in a judgment or settlement that would have a
material adverse effect on the Company’s financial position, results of operations or cash flows.
In the ordinary course of business, the Company may provide indemnifications of varying scope and terms
to customers, business partners, and other parties with respect to certain matters, including, but not limited to,
losses arising out of the Company’s breach of such agreements, services to be provided by the Company, or from
intellectual property infringement claims made by third-parties. Certain indemnification agreements may not be
subject to maximum loss clauses. If the potential loss from any indemnification claim is considered probable and
the amount or the range of the loss can be estimated, the Company accrues a liability for the estimated loss. To
date, claims under such indemnification provisions have not been significant.
Note 13. Employee 401(k) PlanThe Company sponsors a 401(k) plan covering all employees. Matching contributions to the plan are at the
discretion of the Company. During the years ended December 31, 2012, 2011 and 2010, there have been no
employer contributions under this plan.
Note 14. Net Loss Per Common Share
Basic net income per share is computed by dividing net income available to common shareholders by the
weighted daily average number of common shares outstanding during the year. Diluted net income per share is
computed by dividing net income available to common shareholders by the weighted daily average number of
common shares outstanding plus potentially dilutive common shares outstanding during the year from the
issuance of stock options and awards using the treasury stock method. Participating securities are included in the
weighted daily average number of shares outstanding used in the calculation of diluted net income per share butare excluded from the calculation of diluted net loss per share. As the Company was in a net loss position for all
years presented, basic and diluted net loss per share are equal to each other as the weighted average number of
shares used to compute diluted net loss per share excludes anti-dilutive securities, including participating
securities.
The following table sets forth the computation of basic and diluted net loss per share:
Year Ended December 31,
2012 2011 2010
(In thousands, except per share amounts)
Numerator:
Net loss . . . . . . . . . . . . . . . . . . . . . . . . . . . . . $ (4,378) $ (3,008) $ (3,096)
Denominator:
Denominator for basic and diluted net loss
per common share - Weighted average
shares outstanding . . . . . . . . . . . . . . . . . . . 60,711,317 58,429,005 58,693,061
Basic and diluted net loss per common
share . . . . . . . . . . . . . . . . . . . . . . . . . . . . . $ (0.07) $ (0.05) $ (0.05)
60
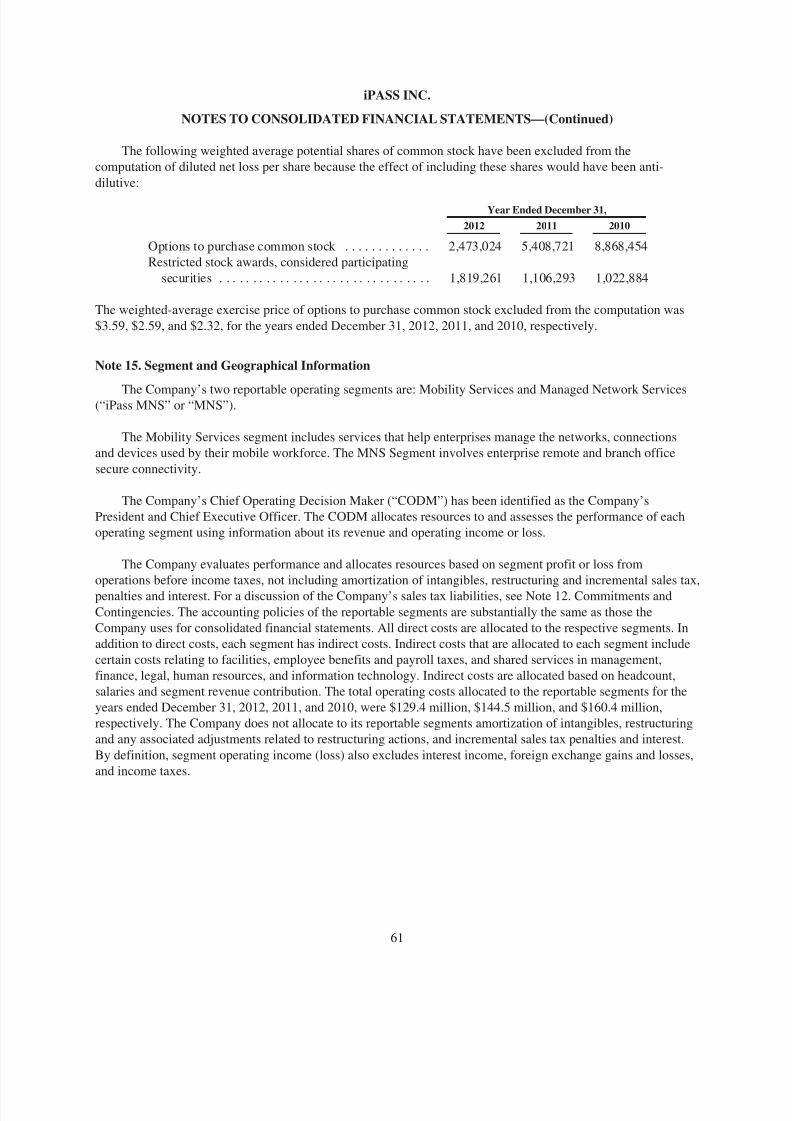
8/18/2019 iPass 2012 Annual Report
http://slidepdf.com/reader/full/ipass-2012-annual-report 67/80
iPASS INC.
NOTES TO CONSOLIDATED FINANCIAL STATEMENTS—(Continued)
The following weighted average potential shares of common stock have been excluded from the
computation of diluted net loss per share because the effect of including these shares would have been anti-
dilutive:
Year Ended December 31,
2012 2011 2010
Options to purchase common stock . . . . . . . . . . . . . 2,473,024 5,408,721 8,868,454
Restricted stock awards, considered participating
securities . . . . . . . . . . . . . . . . . . . . . . . . . . . . . . . . 1,819,261 1,106,293 1,022,884
The weighted-average exercise price of options to purchase common stock excluded from the computation was
$3.59, $2.59, and $2.32, for the years ended December 31, 2012, 2011, and 2010, respectively.
Note 15. Segment and Geographical Information
The Company’s two reportable operating segments are: Mobility Services and Managed Network Services(“iPass MNS” or “MNS”).
The Mobility Services segment includes services that help enterprises manage the networks, connections
and devices used by their mobile workforce. The MNS Segment involves enterprise remote and branch office
secure connectivity.
The Company’s Chief Operating Decision Maker (“CODM”) has been identified as the Company’s
President and Chief Executive Officer. The CODM allocates resources to and assesses the performance of each
operating segment using information about its revenue and operating income or loss.
The Company evaluates performance and allocates resources based on segment profit or loss from
operations before income taxes, not including amortization of intangibles, restructuring and incremental sales tax,
penalties and interest. For a discussion of the Company’s sales tax liabilities, see Note 12. Commitments and
Contingencies. The accounting policies of the reportable segments are substantially the same as those the
Company uses for consolidated financial statements. All direct costs are allocated to the respective segments. In
addition to direct costs, each segment has indirect costs. Indirect costs that are allocated to each segment include
certain costs relating to facilities, employee benefits and payroll taxes, and shared services in management,
finance, legal, human resources, and information technology. Indirect costs are allocated based on headcount,
salaries and segment revenue contribution. The total operating costs allocated to the reportable segments for the
years ended December 31, 2012, 2011, and 2010, were $129.4 million, $144.5 million, and $160.4 million,
respectively. The Company does not allocate to its reportable segments amortization of intangibles, restructuring
and any associated adjustments related to restructuring actions, and incremental sales tax penalties and interest.
By definition, segment operating income (loss) also excludes interest income, foreign exchange gains and losses,
and income taxes.
61
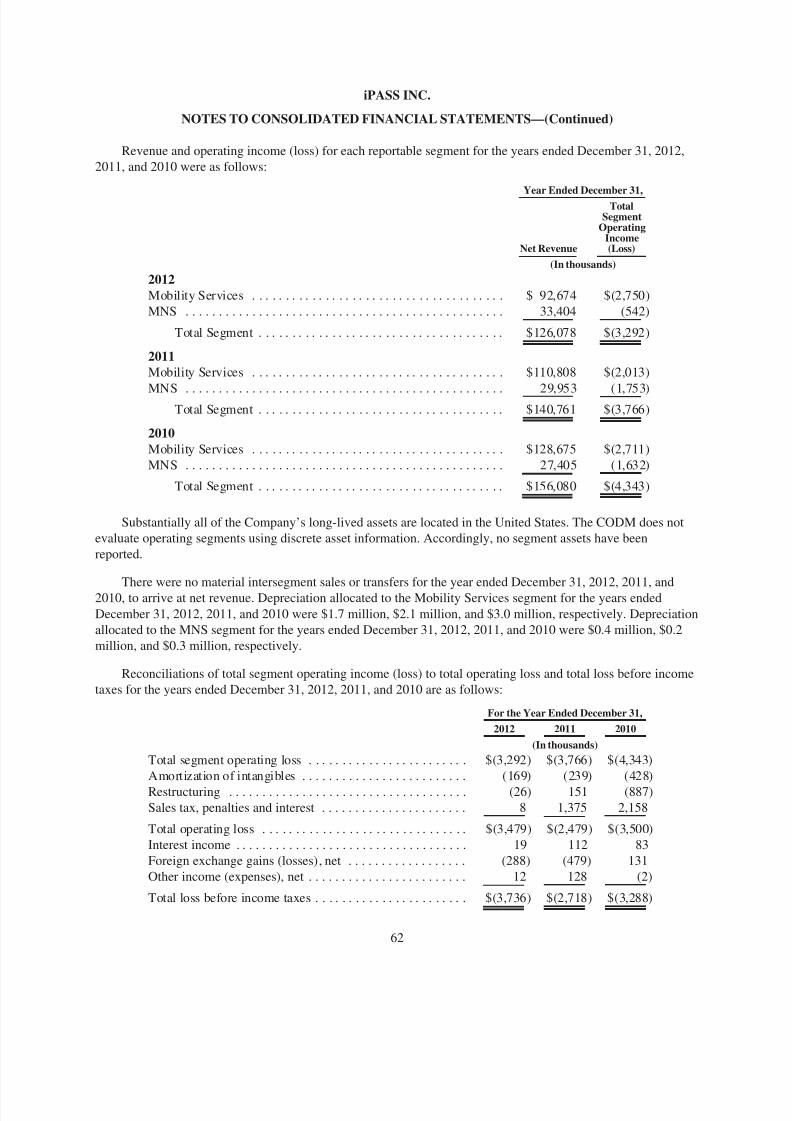
8/18/2019 iPass 2012 Annual Report
http://slidepdf.com/reader/full/ipass-2012-annual-report 68/80
iPASS INC.
NOTES TO CONSOLIDATED FINANCIAL STATEMENTS—(Continued)
Revenue and operating income (loss) for each reportable segment for the years ended December 31, 2012,
2011, and 2010 were as follows:
Year Ended December 31,
Net Revenue
TotalSegment
OperatingIncome(Loss)
(In thousands)
2012Mobility Services . . . . . . . . . . . . . . . . . . . . . . . . . . . . . . . . . . . . . . $ 92,674 $(2,750)
MNS . . . . . . . . . . . . . . . . . . . . . . . . . . . . . . . . . . . . . . . . . . . . . . . . 33,404 (542)
Total Segment . . . . . . . . . . . . . . . . . . . . . . . . . . . . . . . . . . . . . $126,078 $(3,292)
2011Mobility Services . . . . . . . . . . . . . . . . . . . . . . . . . . . . . . . . . . . . . . $110,808 $(2,013)
MNS . . . . . . . . . . . . . . . . . . . . . . . . . . . . . . . . . . . . . . . . . . . . . . . . 29,953 (1,753)Total Segment . . . . . . . . . . . . . . . . . . . . . . . . . . . . . . . . . . . . . $140,761 $(3,766)
2010Mobility Services . . . . . . . . . . . . . . . . . . . . . . . . . . . . . . . . . . . . . . $128,675 $(2,711)
MNS . . . . . . . . . . . . . . . . . . . . . . . . . . . . . . . . . . . . . . . . . . . . . . . . 27,405 (1,632)
Total Segment . . . . . . . . . . . . . . . . . . . . . . . . . . . . . . . . . . . . . $156,080 $(4,343)
Substantially all of the Company’s long-lived assets are located in the United States. The CODM does not
evaluate operating segments using discrete asset information. Accordingly, no segment assets have been
reported.
There were no material intersegment sales or transfers for the year ended December 31, 2012, 2011, and
2010, to arrive at net revenue. Depreciation allocated to the Mobility Services segment for the years ended
December 31, 2012, 2011, and 2010 were $1.7 million, $2.1 million, and $3.0 million, respectively. Depreciation
allocated to the MNS segment for the years ended December 31, 2012, 2011, and 2010 were $0.4 million, $0.2
million, and $0.3 million, respectively.
Reconciliations of total segment operating income (loss) to total operating loss and total loss before income
taxes for the years ended December 31, 2012, 2011, and 2010 are as follows:
For the Year Ended December 31,
2012 2011 2010
(In thousands)
Total segment operating loss . . . . . . . . . . . . . . . . . . . . . . . . $(3,292) $(3,766) $(4,343)
Amortization of intangibles . . . . . . . . . . . . . . . . . . . . . . . . . (169) (239) (428)
Restructuring . . . . . . . . . . . . . . . . . . . . . . . . . . . . . . . . . . . . (26) 151 (887)
Sales tax, penalties and interest . . . . . . . . . . . . . . . . . . . . . . 8 1,375 2,158
Total operating loss . . . . . . . . . . . . . . . . . . . . . . . . . . . . . . . $(3,479) $(2,479) $(3,500)
Interest income . . . . . . . . . . . . . . . . . . . . . . . . . . . . . . . . . . . 19 112 83
Foreign exchange gains (losses), net . . . . . . . . . . . . . . . . . . (288) (479) 131
Other income (expenses), net . . . . . . . . . . . . . . . . . . . . . . . . 12 128 (2)
Total loss before income taxes . . . . . . . . . . . . . . . . . . . . . . . $(3,736) $(2,718) $(3,288)
62
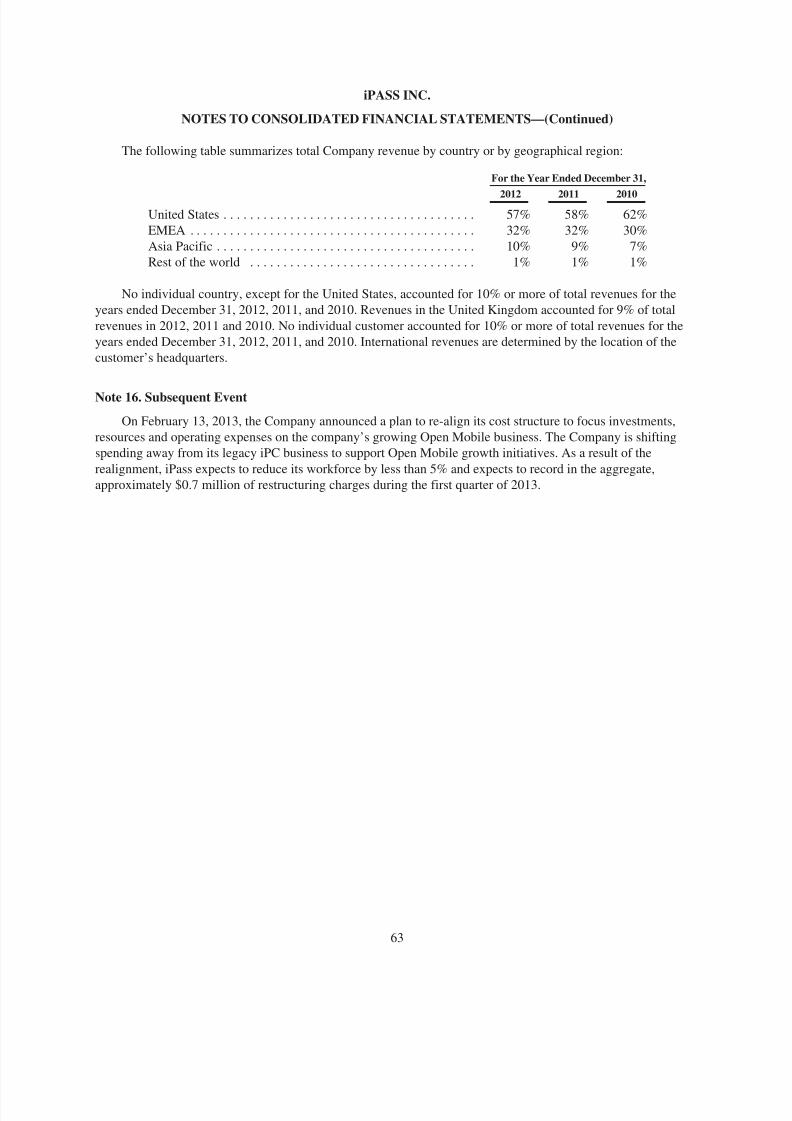
8/18/2019 iPass 2012 Annual Report
http://slidepdf.com/reader/full/ipass-2012-annual-report 69/80
iPASS INC.
NOTES TO CONSOLIDATED FINANCIAL STATEMENTS—(Continued)
The following table summarizes total Company revenue by country or by geographical region:
For the Year Ended December 31,
2012 2011 2010
United States . . . . . . . . . . . . . . . . . . . . . . . . . . . . . . . . . . . . . . 57% 58% 62%
EMEA . . . . . . . . . . . . . . . . . . . . . . . . . . . . . . . . . . . . . . . . . . . 32% 32% 30%
Asia Pacific . . . . . . . . . . . . . . . . . . . . . . . . . . . . . . . . . . . . . . . 10% 9% 7%
Rest of the world . . . . . . . . . . . . . . . . . . . . . . . . . . . . . . . . . . 1% 1% 1%
No individual country, except for the United States, accounted for 10% or more of total revenues for the
years ended December 31, 2012, 2011, and 2010. Revenues in the United Kingdom accounted for 9% of total
revenues in 2012, 2011 and 2010. No individual customer accounted for 10% or more of total revenues for the
years ended December 31, 2012, 2011, and 2010. International revenues are determined by the location of the
customer’s headquarters.
Note 16. Subsequent Event
On February 13, 2013, the Company announced a plan to re-align its cost structure to focus investments,
resources and operating expenses on the company’s growing Open Mobile business. The Company is shifting
spending away from its legacy iPC business to support Open Mobile growth initiatives. As a result of the
realignment, iPass expects to reduce its workforce by less than 5% and expects to record in the aggregate,
approximately $0.7 million of restructuring charges during the first quarter of 2013.
63

8/18/2019 iPass 2012 Annual Report
http://slidepdf.com/reader/full/ipass-2012-annual-report 70/80
SIGNATURES
Pursuant to the requirements of Section 13 or 15(d) the Securities Exchange Act of 1934, the registrant has
duly caused this report to be signed on its behalf by the undersigned, thereunto duly authorized.
iPass Inc.
By: / S / EVAN L. KAPLAN By: / S / DARIN R. VICKERY
Evan L. Kaplan, President and Chief Executive Officer
(Principal Executive Officer)
Darin R. Vickery, Vice President and
Corporate Controller
(Principal Financial Officer)
Date: March 15, 2013
64

8/18/2019 iPass 2012 Annual Report
http://slidepdf.com/reader/full/ipass-2012-annual-report 71/80
POWER OF ATTORNEY
KNOW ALL PERSONS BY THESE PRESENT, that each person whose signature appears below
constitutes and appoints Evan L. Kaplan and Darin R. Vickery, and each or any one of them, his true and lawful
attorney-in-fact and agent, with full power of substitution and resubstitution, for him and in his name, place and
stead, in any and all capacities, to sign any and all amendments to this Report, and to file the same, with all
exhibits thereto, and other documents in connection therewith, with the Securities and Exchange Commission,granting unto said attorneys-in-fact and agents, and each of them, full power and authority to do and perform
each and every act and thing requisite and necessary to be done in connection therewith, as fully to all intents and
purposes as he might or could do in person, hereby ratifying and confirming all that said attorneys-in-fact and
agents, or any of them, or their or his substitutes or substitute, may lawfully do or cause to be done by virtue
hereof.
Pursuant to the requirements of the Securities Exchange Act of 1934, this Report has been signed below by
the following persons on behalf of the registrant and in the capacities and on the dates indicated.
Signature Title Date
/S/ EVAN L. KAPLAN
Evan L. Kaplan
President, Chief Executive Officer
and Director (PrincipalExecutive Officer)
March 15, 2013
/S/ DARIN R. VICKERY
Darin R. Vickery
Vice President and Corporate
Controller (Principal Financial
Officer)
March 15, 2013
/S/ JOHN D. BELETIC
John D. Beletic
Chairman and Director March 15, 2013
/S/ PETER C. CLAPMAN
Peter C. Clapman
Director March 15, 2013
/S/ GARY A. GRIFFITHS
Gary A. Griffiths
Director March 15, 2013
/S/ ROBERT J. MAJTELES
Robert J. Majteles
Director March 15, 2013
/S/ KENNETH H. TRAUB
Kenneth H. Traub
Director March 15, 2013
/S/ SAMUEL L. SCHWERIN
Samuel L. Schwerin
Director March 15, 2013
65

8/18/2019 iPass 2012 Annual Report
http://slidepdf.com/reader/full/ipass-2012-annual-report 72/80
SCHEDULE II—VALUATION AND QUALIFYING ACCOUNTS RECEIVABLE
Classification
Balance atBeginning
of Year
AdditionsCharged
to(recovered
from)Costsand
Expenses Deductions
Balance atEnd of
Year(In thousands)
Allowance for doubtful accounts:
Year ended December 31
2012 . . . . . . . . . . . . . . . . . . . . . . . . . . . . . . . . $1,605 $ (66) $366 $1,173
2011 . . . . . . . . . . . . . . . . . . . . . . . . . . . . . . . . 1,757 $ 360 $512 $1,605
2010 . . . . . . . . . . . . . . . . . . . . . . . . . . . . . . . . 1,140 1,425 808 1,757
66

8/18/2019 iPass 2012 Annual Report
http://slidepdf.com/reader/full/ipass-2012-annual-report 73/80
INDEX TO EXHIBITS
ExhibitNumber Description of Document
3.1 Amended and Restated Certificate of Incorporation.(16)
3.2 Certificate of Amendment to Amended and Restated Certificate of Incorporation.(7)
3.3 Certificate of Change to Amended and Restated Certificate of Incorporation.(14)
3.4 Amended and Restated By-Laws.(2)
4.1 Reference is made to Exhibits 3.1, 3.2, 3.3 and 3.4.
4.2 Specimen stock certificate.(1)
10.1* iPass Inc. 2003 Equity Incentive Plan.(10)
10.2* Form of Stock Option Grant Notice under the 2003 Equity Incentive Plan.(3)
10.3* Form of Restricted Stock Grant Notice and Agreement for Vice Presidents and above, under the
Company’s 2003 Equity Incentive Plan.(6)
10.4* Form of Restricted Stock Grant Notice and Agreement for below Vice Presidents, under theCompany’s 2003 Equity Incentive Plan.(6)
10.5* Form of Performance Shares Grant Notice and Agreement, under the Company’s 2003 Equity
Incentive Plan.(6)
10.6* iPass Inc. 2003 Non-Employee Directors Plan.(10)
10.7* Forms of Restricted Stock Award Grant Notice and Restricted Stock Award Agreement under the
2003 Non-Employee Directors Plan.(4)
10.8* Forms of Stock Option Grant Notice and Stock Option Agreement under the 2003 Non-Employee
Directors Plan.(4)
10.9* iPass Inc. 2003 Employee Stock Purchase Plan and form of related agreements, as amended.(1)
10.10* Outside Director Compensation Arrangement.(5)
10.11* iPass Inc. Amended and Restated Executive Corporate Transaction and Severance Benefit Plan, as
amended.(15)
10.12* iPass Inc. Key Employee Corporate Transaction and Severance Benefit Plan.(11)
10.13* iPass Inc. Severance Benefit Plan.(11)
10.14* Employment Agreement, dated November 1, 2008, between Registrant and Evan L. Kaplan.(11)
10.15* Amendment to the Employment Agreement, dated May 28, 2009, between Registrant and Evan
L. Kaplan(13)
10.16* Amendment to the Employment Agreement, dated February 15, 2012, between Registrant and Evan
L. Kaplan.(9)
10.17* Offer Letter with William Garvey dated May 5, 2009.(7)
10.18* Offer Letter with Steven Gatoff dated May 20, 2009.(7)
10.19* Offer Letter with Christophe Culine dated June 14, 2011.(8)
10.20* Transition Agreement with Steven Gatoff dated December 10, 2012.
10.21* Form of Indemnity Agreement.(1)
67
8/18/2019 iPass 2012 Annual Report
http://slidepdf.com/reader/full/ipass-2012-annual-report 74/80
ExhibitNumber Description of Document
10.22 Lease Agreement, dated October 26, 1999, between iPass Inc. and Westport Joint Venture (as
amended).(1)
10.23 OEM Service Provider License Agreement, dated February 29, 2000, between RSA Security, Inc.
and iPass Inc., and amendments thereto.(3)
10.24 Support Agreement, dated February 29, 2000, between RSA Security, Inc. and iPass Inc.(3)
10.25* 2012 Annual Executive Management Bonus Plan.(12)
21.1 Subsidiaries of the Registrant.
23.1 Consent of Independent Registered Public Accounting Firm.
24.1 Power of Attorney (reference is made to the signature page of this Form 10-K).
31.1 Certification of the Chief Executive Officer pursuant to Section 302 of the Sarbanes-Oxley Act of
2002.
31.2 Certification of the Principal Financial Officer pursuant to Section 302 of the Sarbanes-Oxley Actof 2002.
32.1 Certification of the Chief Executive Officer pursuant to 18 U.S.C Section 1350, as adopted
pursuant to Section 906 of the Sarbanes-Oxley Act of 2002.
32.2 Certification of the Principal Financial Officer pursuant to 18 U.S.C Section 1350, as adopted
pursuant to Section 906 of the Sarbanes-Oxley Act of 2002.
101.INS** XBRL Instance Document
101.SCH** XBRL Taxonomy Extension Schema Document
101.CAL** XBRL Taxonomy Extension Calculation Linkbase Document
101.DEF** XBRL Taxonomy Extension Definition Linkbase Document
101.LAB** XBRL Taxonomy Extension Labels Linkbase Document
101.PRE** XBRL Taxonomy Extension Presentation Linkbase Document
* Indicates management contract or compensatory plan.
** XBRL (Extensible Business Reporting Language) information is furnished and not filed herewith, is not a
part of a registration statement of Prospectus for purposes of sections 11 or 12 of the Securities Act of
1933, and is deemed not filed for purposes of section 18 of the Securities Exchange Act of 1934.
(1) Previously filed as the like-described exhibit to our Registration Statement Form S-1, as amended (SEC
File No. 333-102715), filed on January 24, 2003, and incorporated by reference herein.
(2) Previously filed as the like-described exhibit to our Form 8-K (SEC File No. 000-50327), filed on
August 29, 2010, and incorporated by reference herein.
(3) Previously filed as the like-described exhibit to our Form 10-K (SEC File No. 000-50327), filed on
March 16, 2006, and incorporated by reference herein.
(4) Previously filed as the like-described exhibit to our Form 10-K (SEC File No. 000-50327), filed on
March 29, 2007, and incorporated by reference herein.
(5) Previously disclosed under the caption “Compensation of Directors” in our Definitive Proxy Statement on
Schedule 14A (SEC File No. 000-50327), filed on April 24, 2012, and incorporated by reference herein.
(6) Previously filed as the like-described exhibit to our Form 10-Q (SEC File No. 000-50327), filed on
May 10, 2007, and incorporated by reference herein.
68

8/18/2019 iPass 2012 Annual Report
http://slidepdf.com/reader/full/ipass-2012-annual-report 75/80
(7) Previously filed as the like-described exhibit to our Form 10-Q (SEC File No. 000-50327), filed on
August 7, 2009, and incorporated by reference herein.
(8) Previously filed as the like-described exhibit to our Form 10-Q (SEC File No. 000-50327), filed on
August 8, 2011, and incorporated by reference herein.
(9) Filed as Exhibit 10.16 to our Form 10-K, filed March 7, 2012 (SEC File No. 000-50327), and incorporated
herein by reference.
(10) Previously filed as an appendix to our Proxy Statement (SEC File No. 000-50327), filed on July 14, 2009,and incorporated by reference herein.
(11) Previously filed as the like-described exhibit to our Form 10-K (SEC File No. 000-50327), filed on
March 16, 2009, and incorporated by reference herein.
(12) Previously described in our Form 8-K (SEC File No. 000-50327), filed on February 28, 2012, which
description is incorporated by reference herein.
(13) Previously described in our Form 8-K (SEC File No. 000-50327), filed on June 1, 2009, which description
is incorporated by reference herein.
(14) Previously filed as the like-described exhibit to our Form 8-K (SEC File No. 000-50327), filed on
February 3, 2010, and incorporated by reference herein.
(15) Previously filed as the like-described exhibit to our Form 8-K (SEC File No. 000-50327), filed on July 6,
2011, and incorporated by reference herein.
(16) Previously filed as the like-described exhibit to our Form 10-Q (Commission No. 000-50327), filed on
November 13, 2003, and incorporated by reference herein.
69

8/18/2019 iPass 2012 Annual Report
http://slidepdf.com/reader/full/ipass-2012-annual-report 76/80
[THIS PAGE INTENTIONALLY LEFT BLANK]

8/18/2019 iPass 2012 Annual Report
http://slidepdf.com/reader/full/ipass-2012-annual-report 77/80
[THIS PAGE INTENTIONALLY LEFT BLANK]

8/18/2019 iPass 2012 Annual Report
http://slidepdf.com/reader/full/ipass-2012-annual-report 78/80
[THIS PAGE INTENTIONALLY LEFT BLANK]

8/18/2019 iPass 2012 Annual Report
http://slidepdf.com/reader/full/ipass-2012-annual-report 79/80
EXECUTIVE TEAM
Evan L. Kaplan
President and
Chief Executive Officer
Christophe Culine
Senior Vice President &
General Manager,
Enterprise Business
Steve A. Livingston
Senior Vice President,
Carrier Development
William P. Garvey
Vice President,
General Counsel and
Corporate Secretary
Barbara M. Nelson
Senior Vice President &
Chief Technology Officer
Marcio Avillez
Vice President,
Network Services
Information as of April 2013
BOARD OF DIRECTORS
John D. Beletic—Chairman
President and CEO of
Xiotech Inc; Venture Partner,
Oak Investment Partners
Peter C. Clapman
Retired; Former Senior
vice president and chief
counsel, TIAA-CREF
Gary A. Griffiths
Chief Executive
Officer, Trapit, Inc.
Evan L. Kaplan
President and Chief
Executive Officer
Robert J. Majteles
Managing Partner,
Treehouse Capital LLC
Samuel L. Schwerin
Managing Partner,
Millennium Technology
Value Partners
Kenneth H. Traub
President and Chief
Executive Officer,
Ethos Management
CORPORATE INFORMATION
Transfer Agent
Computershare
250 Royal Street
Canton, MA 02021
Securities Counsel
Cooley LLP
3175 Hanover Street
Palo Alto, CA 94304
Independent RegisteredPublic Accounting Firm
KPMG LLP
3975 Freedom Circle Dr, #100
Santa Clara CA 95054
Stock Listing
iPass’ common stock is tradedon the NASDAQ Global Select
market under the symbol IPAS.
SEC Form 10-K andRequest for Information
A copy of iPass’ annual report
filed with the Securities and
Exchange Commission on Form
10-K is available without charge
upon request.
Investor Relations
iPass Inc.
3800 Bridge ParkwayRedwood Shores, CA 94065
+1 650-232-4110
iPASS INC. 2012 ANNUAL R

8/18/2019 iPass 2012 Annual Report
http://slidepdf.com/reader/full/ipass-2012-annual-report 80/80
Corporate Headquarters
iPass Inc.
3800 Bridge Parkway
Redwood Shores, CA 94065
+1 650-232-4100
www.ipass.com