Embed Size (px)
Citation preview
1
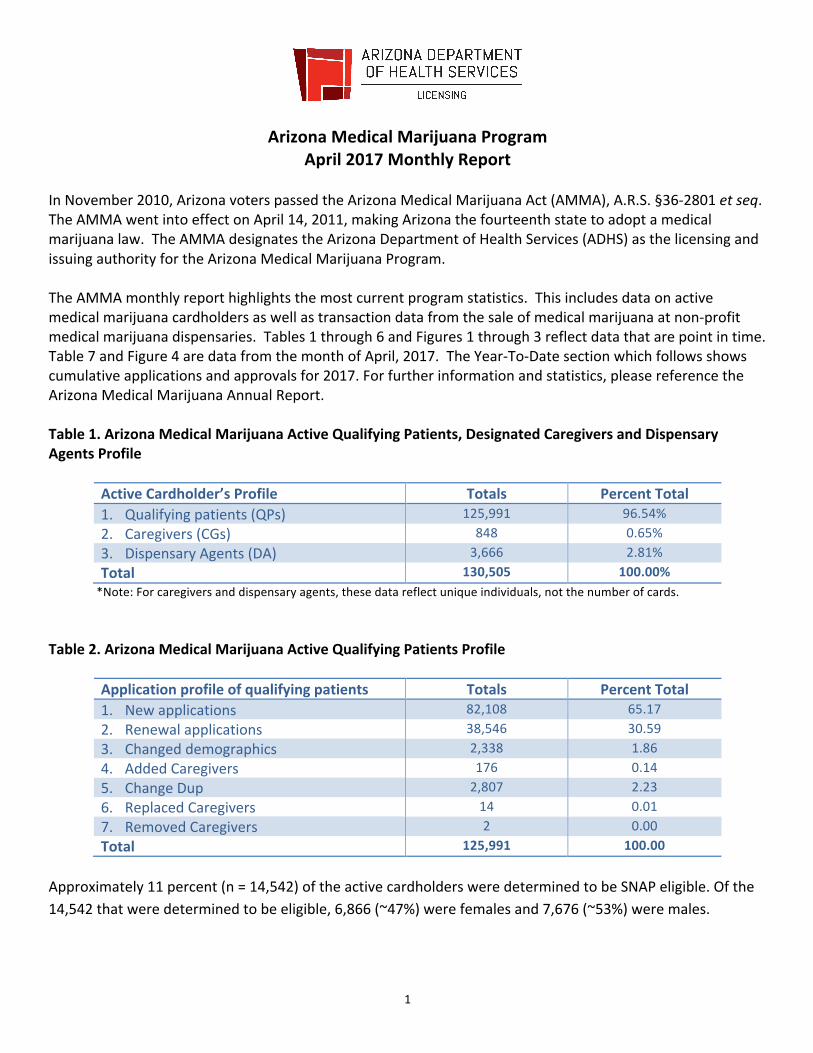
Arizona Medical Marijuana Program April 2017 Monthly Report
In November 2010, Arizona voters passed the Arizona Medical Marijuana Act (AMMA), A.R.S. §36-‐2801 et seq. The AMMA went into effect on April 14, 2011, making Arizona the fourteenth state to adopt a medical marijuana law. The AMMA designates the Arizona Department of Health Services (ADHS) as the licensing and issuing authority for the Arizona Medical Marijuana Program. The AMMA monthly report highlights the most current program statistics. This includes data on active medical marijuana cardholders as well as transaction data from the sale of medical marijuana at non-‐profit medical marijuana dispensaries. Tables 1 through 6 and Figures 1 through 3 reflect data that are point in time. Table 7 and Figure 4 are data from the month of April, 2017. The Year-‐To-‐Date section which follows shows cumulative applications and approvals for 2017. For further information and statistics, please reference the Arizona Medical Marijuana Annual Report. Table 1. Arizona Medical Marijuana Active Qualifying Patients, Designated Caregivers and Dispensary Agents Profile
Active Cardholder’s Profile Totals Percent Total 1. Qualifying patients (QPs) 125,991 96.54% 2. Caregivers (CGs) 848 0.65% 3. Dispensary Agents (DA) 3,666 2.81% Total 130,505 100.00% *Note: For caregivers and dispensary agents, these data reflect unique individuals, not the number of cards.
Table 2. Arizona Medical Marijuana Active Qualifying Patients Profile
Application profile of qualifying patients Totals Percent Total 1. New applications 82,108 65.17 2. Renewal applications 38,546 30.59 3. Changed demographics 2,338 1.86 4. Added Caregivers 176 0.14 5. Change Dup 2,807 2.23 6. Replaced Caregivers 14 0.01 7. Removed Caregivers 2 0.00 Total 125,991 100.00
Approximately 11 percent (n = 14,542) of the active cardholders were determined to be SNAP eligible. Of the 14,542 that were determined to be eligible, 6,866 (~47%) were females and 7,676 (~53%) were males.
2
Table 3. Arizona Medical Marijuana Active Qualifying Patients Characteristics
Characteristics of Active Cardholders who are Qualified Patients
Totals (N =125,991) Percent Total
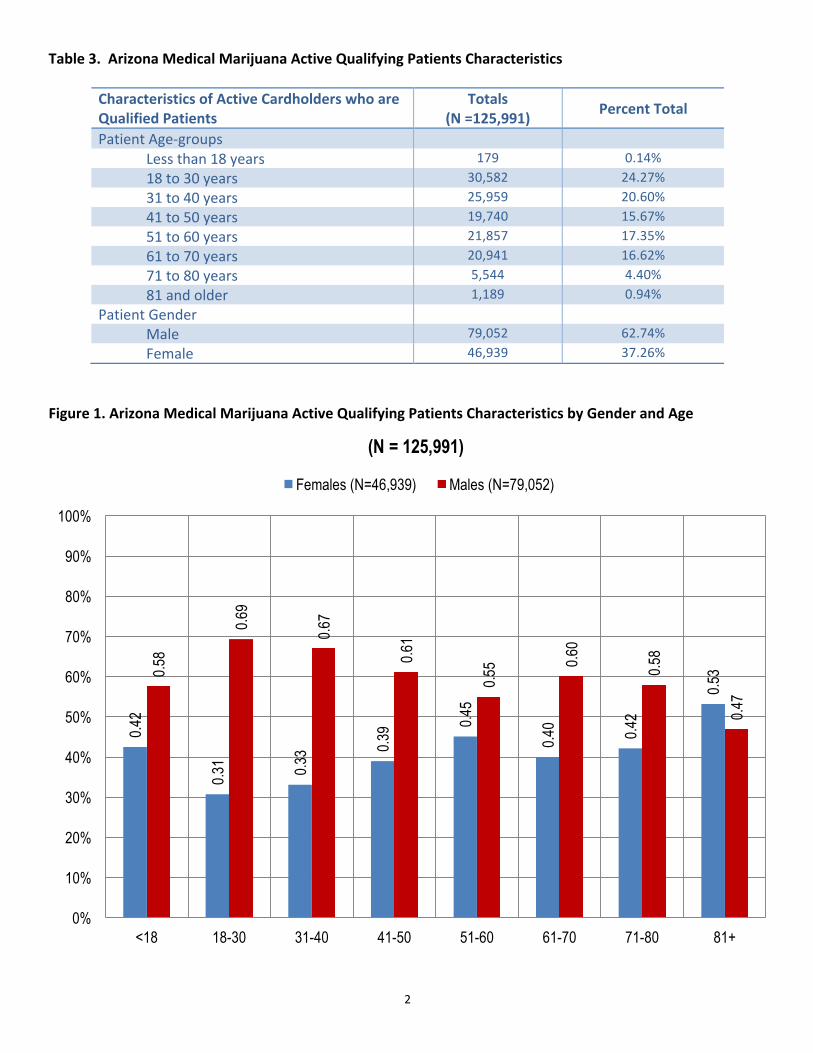
Patient Age-‐groups Less than 18 years 179 0.14% 18 to 30 years 30,582 24.27% 31 to 40 years 25,959 20.60% 41 to 50 years 19,740 15.67% 51 to 60 years 21,857 17.35% 61 to 70 years 20,941 16.62% 71 to 80 years 5,544 4.40% 81 and older 1,189 0.94%
Patient Gender Male 79,052 62.74% Female 46,939 37.26%
Figure 1. Arizona Medical Marijuana Active Qualifying Patients Characteristics by Gender and Age
0.42
0.31 0.3
3 0.39 0.4
5
0.40 0.4
2
0.530.5
8
0.69
0.67
0.61
0.55 0.6
0
0.58
0.47
0%
10%
20%
30%
40%
50%
60%
70%
80%
90%
100%
<18 18-30 31-40 41-50 51-60 61-70 71-80 81+
(N = 125,991)
Females (N=46,939) Males (N=79,052)
3
Table 4. Arizona Medical Marijuana Active Qualifying Patients Medical Condition Profile
Patient medical condition profile of Active Cardholders¶ Totals Percent Total Alzheimer’s 75 0.06% Cachexia 114 0.09% Cancer 3,433 2.72% Chronic Pain 104,025 82.57% Crohn's Disease 502 0.40% Glaucoma 897 0.71% Hepatitis C 895 0.71% HIV/AIDS 552 0.44% Muscle Spasms 911 0.72% Nausea 706 0.56% Post-‐Traumatic Stress Disorder (PTSD) 1,720 1.37% Sclerosis 28 0.02% Seizures 1,018 0.81% Two Or More Conditions 11,115 8.82% TOTAL 125,991 100.00%
¶Unique debilitating conditions
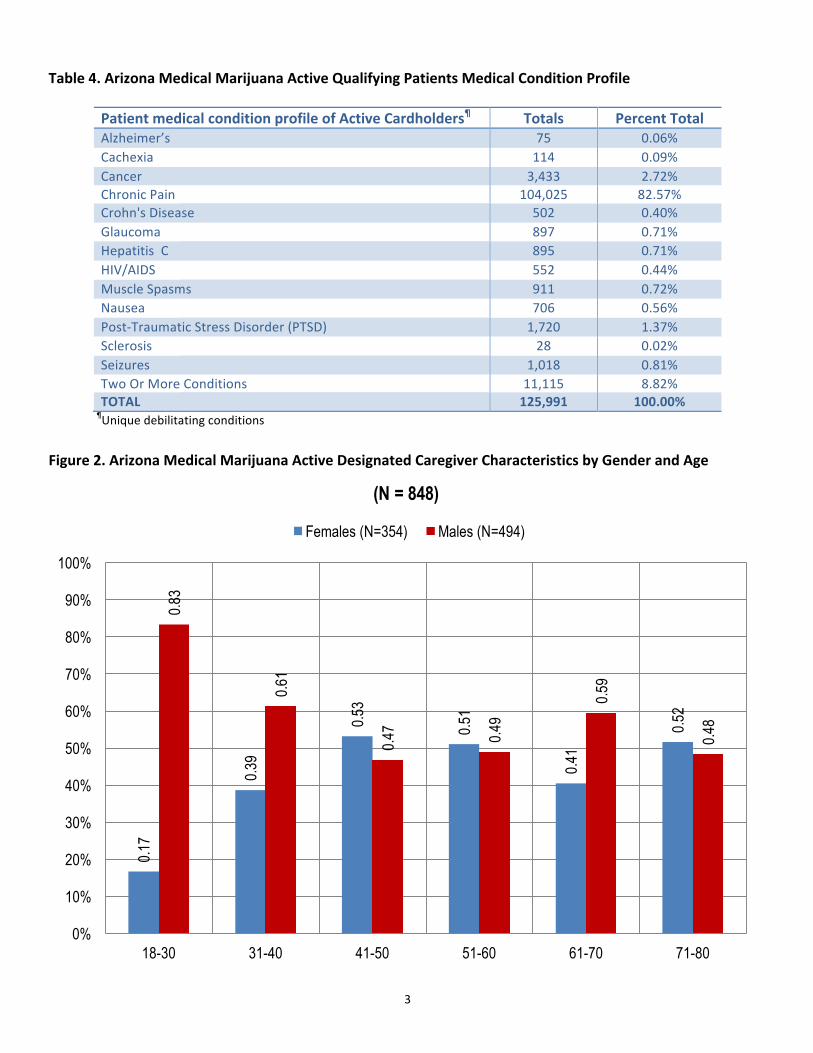
Figure 2. Arizona Medical Marijuana Active Designated Caregiver Characteristics by Gender and Age
0.17
0.39
0.53
0.51
0.41
0.52
0.83
0.61
0.47 0.4
9
0.59
0.48
0%
10%
20%
30%
40%
50%
60%
70%
80%
90%
100%
18-30 31-40 41-50 51-60 61-70 71-80
(N = 848)
Females (N=354) Males (N=494)
4
Table 5. Arizona Medical Marijuana Active Qualifying Patients and Designated Caregivers Authorized for Cultivation
Active cardholders cultivation status Totals Percent Total Qualifying patients (n =125,991) 1,519 1.21% Caregivers (n =848) 380 44.81%
Table 6. Frequency of Qualifying Patients, Caregivers, and Dispensary Agents by County of Residence
County Qualifying Patients Caregivers Dispensary
Agents* Apache County 750 Count under 20 Count under 20 Cochise County 1,840 Count under 20 82 Coconino County 2,886 37 114 Gila County 1,248 Count under 20 33 Graham County 483 Count under 20 Count under 20 Greenlee County 134 Count under 20 Count under 20 La Paz County 328 Count under 20 27 Maricopa County 79,138 519 2,232 Mohave County 4,713 Count under 20 127 Navajo County 1,680 Count under 20 127 Pima County 17,296 106 388 Pinal County 6,891 45 135 Santa Cruz County 383 Count under 20 50 Yavapai County 6,768 56 296 Yuma County 1,453 Count under 20 Count under 20 TOTAL 125,991 848 3,666 *33 Dispensary Agents are located outside of Arizona.
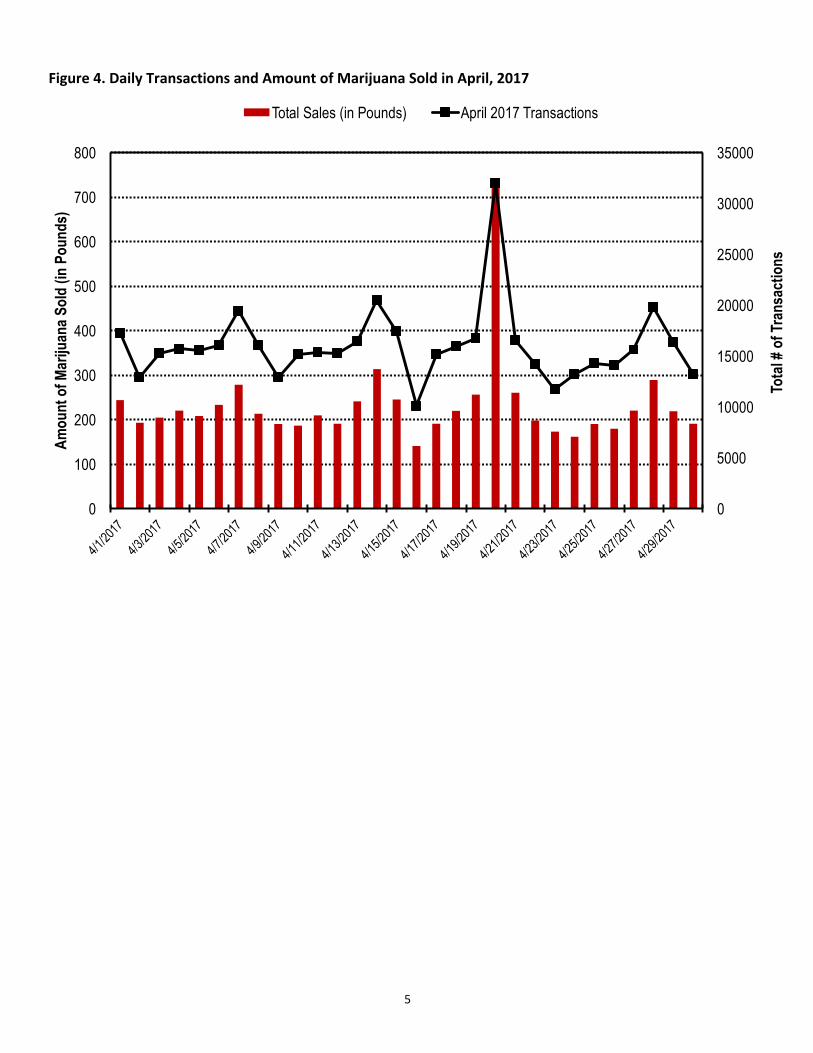
Table 7. Type and Amount of Transactions at Medical Marijuana Dispensaries in April, 2017
Type of Transaction† Ounces (oz.) Pounds Marijuana 103,433.23 6,464.58 Marijuana Edible 4,893.28 305.83 Marijuana Other 3,344.08 209.00 Total Marijuana Sold 111,670.59 6,979.41
†Amounts have been rounded and may not added to exact totals
5
Figure 4. Daily Transactions and Amount of Marijuana Sold in April, 2017
0
5000
10000
15000
20000
25000
30000
35000
0
100
200
300
400
500
600
700
800
Tota
l # o
f Tra
nsac
tions
Amou
nt o
f Mar
ijuan
a Sol
d (in
Pou
nds)
Total Sales (in Pounds) April 2017 Transactions
6
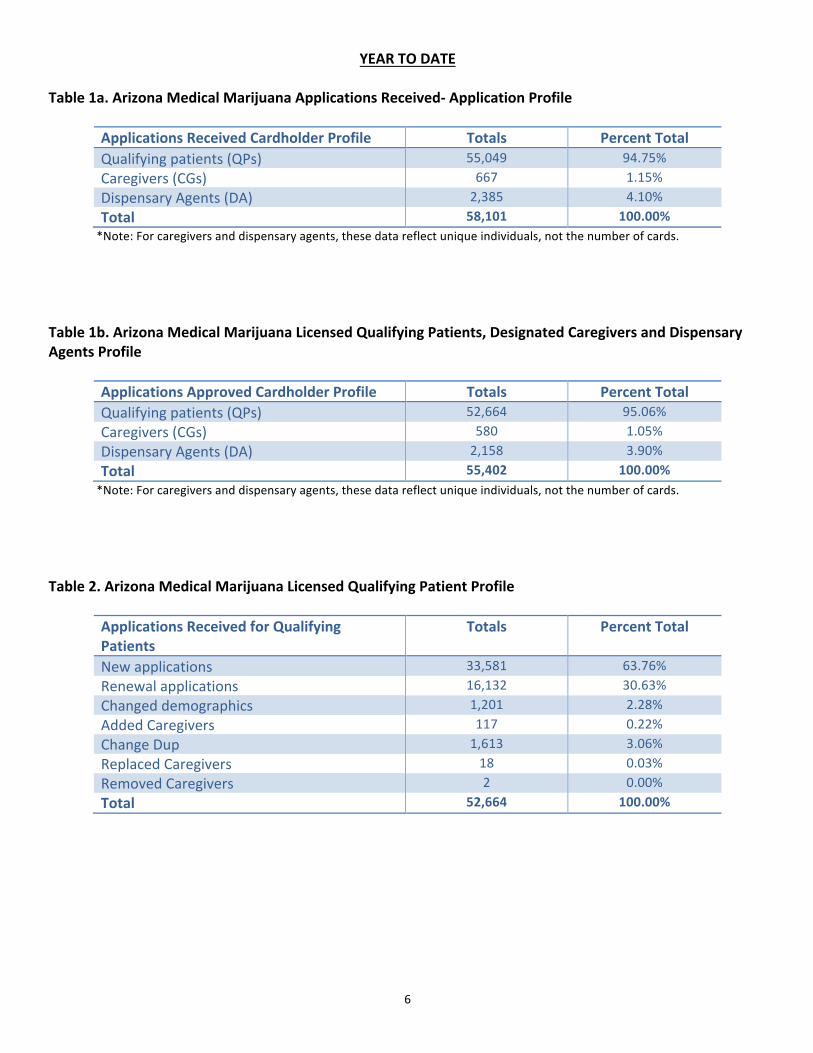
YEAR TO DATE
Table 1a. Arizona Medical Marijuana Applications Received-‐ Application Profile
Applications Received Cardholder Profile Totals Percent Total Qualifying patients (QPs) 55,049 94.75% Caregivers (CGs) 667 1.15% Dispensary Agents (DA) 2,385 4.10% Total 58,101 100.00% *Note: For caregivers and dispensary agents, these data reflect unique individuals, not the number of cards.
Table 1b. Arizona Medical Marijuana Licensed Qualifying Patients, Designated Caregivers and Dispensary Agents Profile
Applications Approved Cardholder Profile Totals Percent Total Qualifying patients (QPs) 52,664 95.06% Caregivers (CGs) 580 1.05% Dispensary Agents (DA) 2,158 3.90% Total 55,402 100.00% *Note: For caregivers and dispensary agents, these data reflect unique individuals, not the number of cards.
Table 2. Arizona Medical Marijuana Licensed Qualifying Patient Profile
Applications Received for Qualifying Patients
Totals Percent Total
New applications 33,581 63.76% Renewal applications 16,132 30.63% Changed demographics 1,201 2.28% Added Caregivers 117 0.22% Change Dup 1,613 3.06% Replaced Caregivers 18 0.03% Removed Caregivers 2 0.00% Total 52,664 100.00%
7
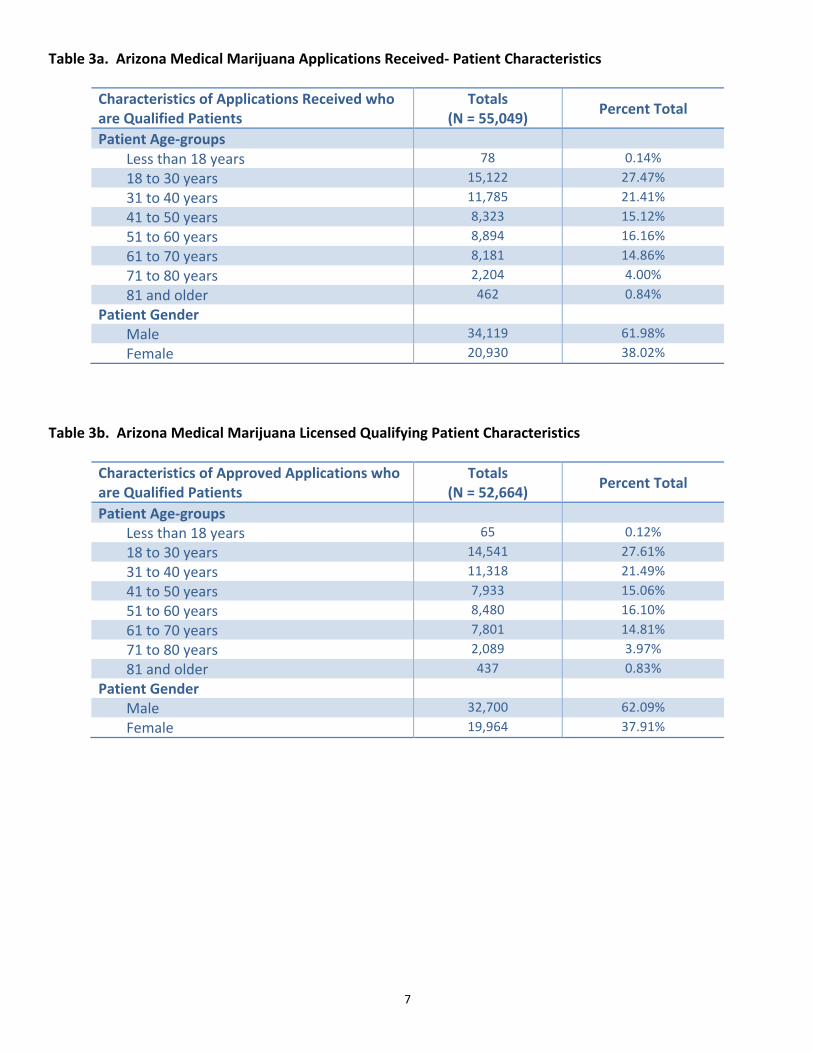
Table 3a. Arizona Medical Marijuana Applications Received-‐ Patient Characteristics
Characteristics of Applications Received who are Qualified Patients
Totals (N = 55,049) Percent Total
Patient Age-‐groups Less than 18 years 78 0.14% 18 to 30 years 15,122 27.47% 31 to 40 years 11,785 21.41% 41 to 50 years 8,323 15.12% 51 to 60 years 8,894 16.16% 61 to 70 years 8,181 14.86% 71 to 80 years 2,204 4.00% 81 and older 462 0.84%
Patient Gender Male 34,119 61.98% Female 20,930 38.02%
Table 3b. Arizona Medical Marijuana Licensed Qualifying Patient Characteristics
Characteristics of Approved Applications who are Qualified Patients
Totals (N = 52,664) Percent Total
Patient Age-‐groups Less than 18 years 65 0.12% 18 to 30 years 14,541 27.61% 31 to 40 years 11,318 21.49% 41 to 50 years 7,933 15.06% 51 to 60 years 8,480 16.10% 61 to 70 years 7,801 14.81% 71 to 80 years 2,089 3.97% 81 and older 437 0.83%
Patient Gender Male 32,700 62.09% Female 19,964 37.91%
8
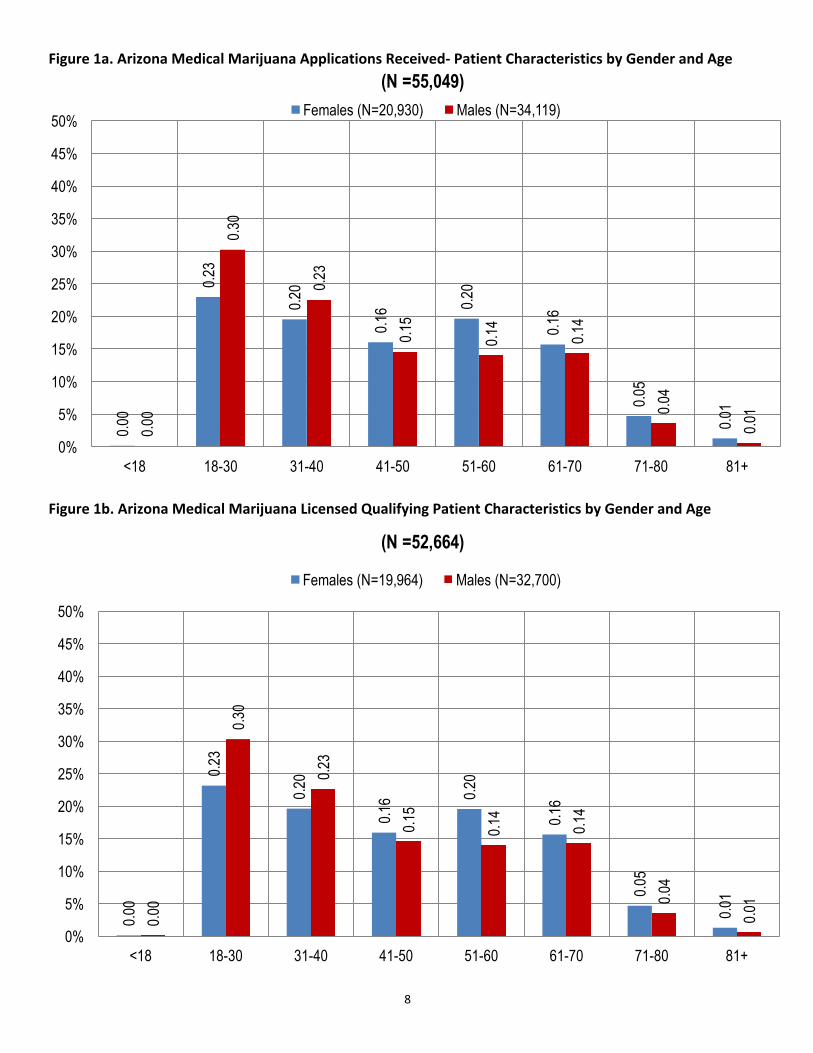
Figure 1a. Arizona Medical Marijuana Applications Received-‐ Patient Characteristics by Gender and Age
Figure 1b. Arizona Medical Marijuana Licensed Qualifying Patient Characteristics by Gender and Age
0.00
0.23
0.20
0.16 0.2
0
0.16
0.05
0.01
0.00
0.30
0.23
0.15
0.14
0.14
0.04
0.01
0%
5%
10%
15%
20%
25%
30%
35%
40%
45%
50%
<18 18-30 31-40 41-50 51-60 61-70 71-80 81+
(N =55,049)Females (N=20,930) Males (N=34,119)
0.00
0.23
0.20
0.16 0.2
0
0.16
0.05
0.01
0.00
0.30
0.23
0.15
0.14
0.14
0.04
0.01
0%
5%
10%
15%
20%
25%
30%
35%
40%
45%
50%
<18 18-30 31-40 41-50 51-60 61-70 71-80 81+
(N =52,664)
Females (N=19,964) Males (N=32,700)
9
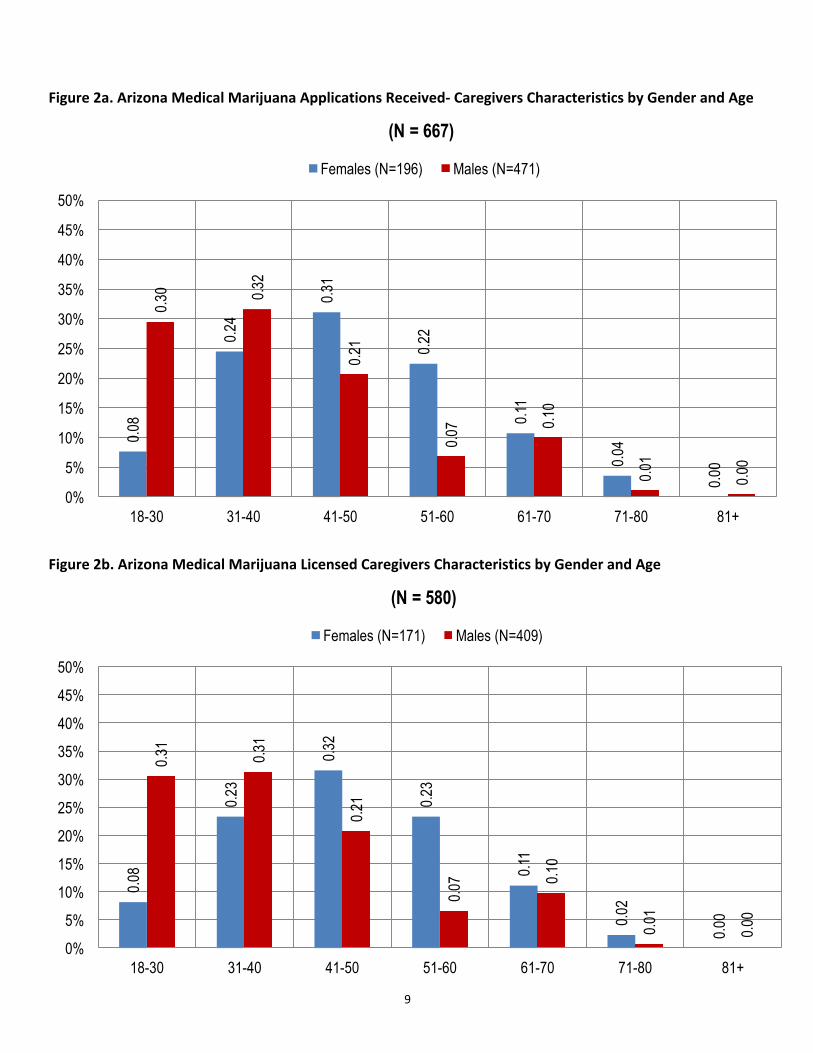
Figure 2a. Arizona Medical Marijuana Applications Received-‐ Caregivers Characteristics by Gender and Age
Figure 2b. Arizona Medical Marijuana Licensed Caregivers Characteristics by Gender and Age
0.08
0.24
0.31
0.22
0.11
0.04
0.00
0.30 0.3
2
0.21
0.07 0.1
0
0.01
0.00
0%
5%
10%
15%
20%
25%
30%
35%
40%
45%
50%
18-30 31-40 41-50 51-60 61-70 71-80 81+
(N = 667)
Females (N=196) Males (N=471)
0.08
0.23
0.32
0.23
0.11
0.02
0.00
0.31
0.31
0.21
0.07 0.1
0
0.01
0.00
0%
5%
10%
15%
20%
25%
30%
35%
40%
45%
50%
18-30 31-40 41-50 51-60 61-70 71-80 81+
(N = 580)
Females (N=171) Males (N=409)
10
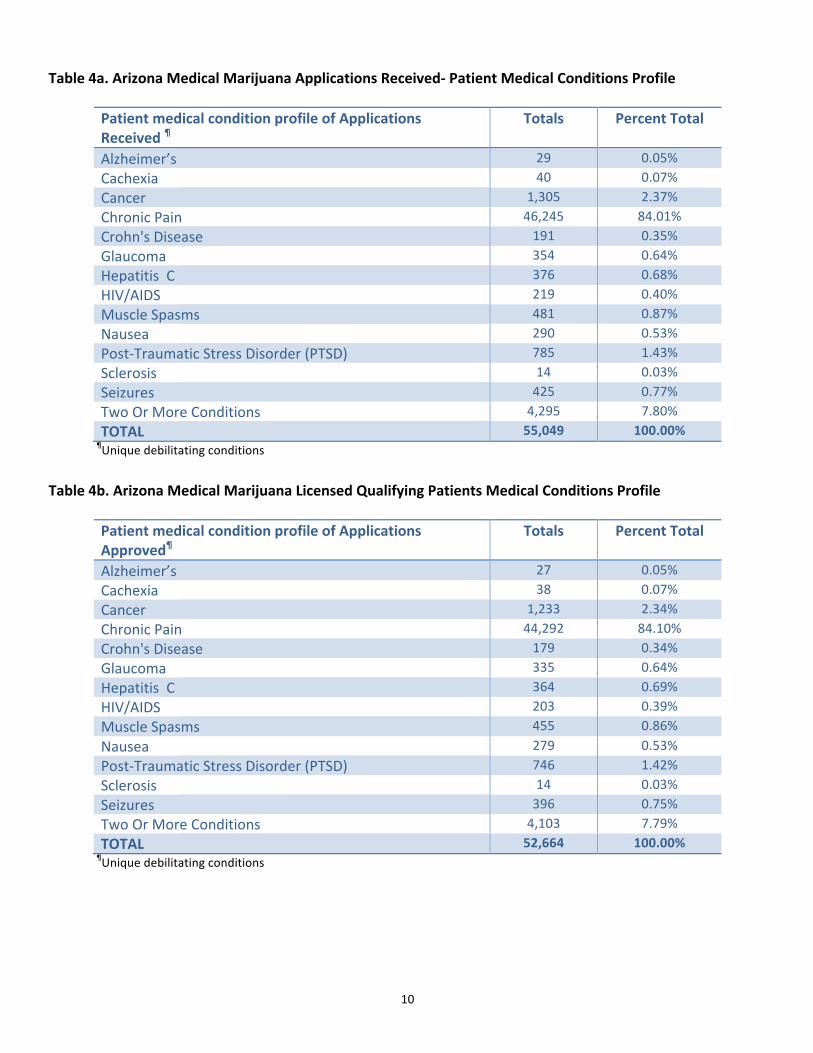
Table 4a. Arizona Medical Marijuana Applications Received-‐ Patient Medical Conditions Profile
Patient medical condition profile of Applications Received ¶
Totals Percent Total
Alzheimer’s 29 0.05% Cachexia 40 0.07% Cancer 1,305 2.37% Chronic Pain 46,245 84.01% Crohn's Disease 191 0.35% Glaucoma 354 0.64% Hepatitis C 376 0.68% HIV/AIDS 219 0.40% Muscle Spasms 481 0.87% Nausea 290 0.53% Post-‐Traumatic Stress Disorder (PTSD) 785 1.43% Sclerosis 14 0.03% Seizures 425 0.77% Two Or More Conditions 4,295 7.80% TOTAL 55,049 100.00%
¶Unique debilitating conditions
Table 4b. Arizona Medical Marijuana Licensed Qualifying Patients Medical Conditions Profile
Patient medical condition profile of Applications Approved¶
Totals Percent Total
Alzheimer’s 27 0.05% Cachexia 38 0.07% Cancer 1,233 2.34% Chronic Pain 44,292 84.10% Crohn's Disease 179 0.34% Glaucoma 335 0.64% Hepatitis C 364 0.69% HIV/AIDS 203 0.39% Muscle Spasms 455 0.86% Nausea 279 0.53% Post-‐Traumatic Stress Disorder (PTSD) 746 1.42% Sclerosis 14 0.03% Seizures 396 0.75% Two Or More Conditions 4,103 7.79% TOTAL 52,664 100.00%
¶Unique debilitating conditions
11
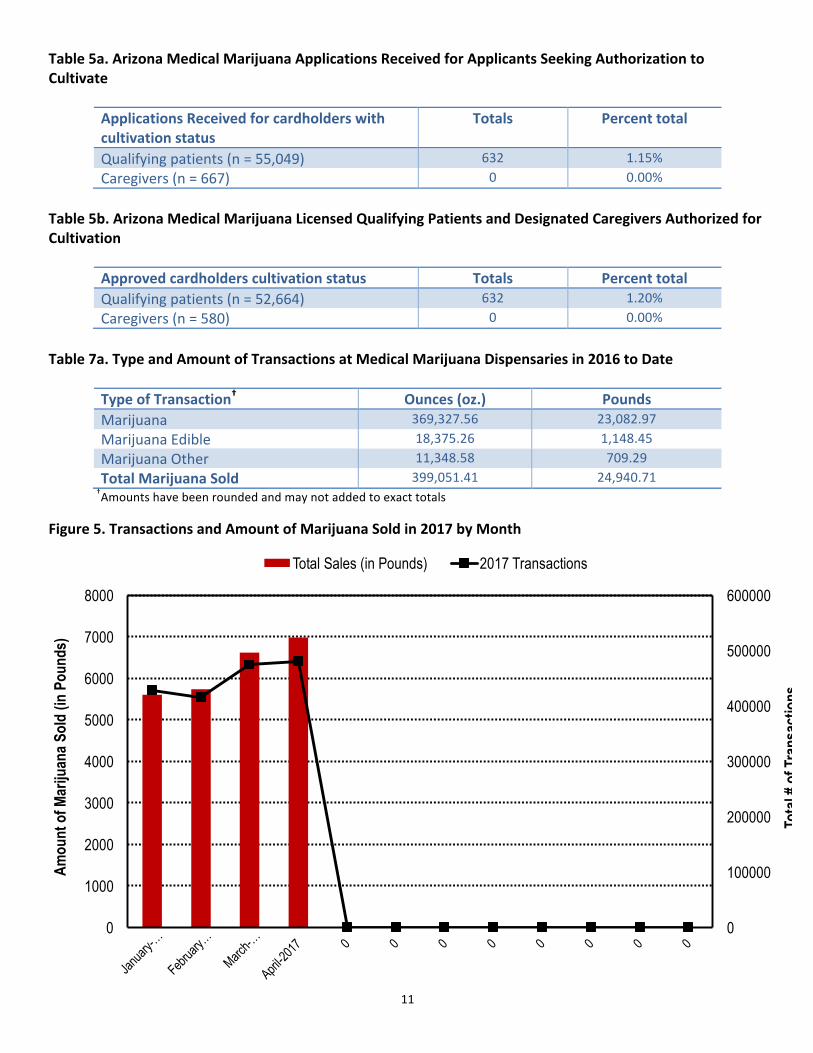
Table 5a. Arizona Medical Marijuana Applications Received for Applicants Seeking Authorization to Cultivate
Applications Received for cardholders with cultivation status
Totals Percent total
Qualifying patients (n = 55,049) 632 1.15% Caregivers (n = 667) 0 0.00%
Table 5b. Arizona Medical Marijuana Licensed Qualifying Patients and Designated Caregivers Authorized for Cultivation
Approved cardholders cultivation status Totals Percent total Qualifying patients (n = 52,664) 632 1.20% Caregivers (n = 580) 0 0.00%
Table 7a. Type and Amount of Transactions at Medical Marijuana Dispensaries in 2016 to Date
Type of Transaction† Ounces (oz.) Pounds Marijuana 369,327.56 23,082.97 Marijuana Edible 18,375.26 1,148.45 Marijuana Other 11,348.58 709.29 Total Marijuana Sold 399,051.41 24,940.71
†Amounts have been rounded and may not added to exact totals
Figure 5. Transactions and Amount of Marijuana Sold in 2017 by Month
0
100000
200000
300000
400000
500000
600000
0
1000
2000
3000
4000
5000
6000
7000
8000
Tota
l # o
f Tra
nsac
tions
Amou
nt o
f Mar
ijuan
a Sol
d (in
Pou
nds)
Total Sales (in Pounds) 2017 Transactions