Embed Size (px)
Citation preview

Mixture Modeling
Chongming YangResearch Support Center
FHSS College

Mixture of Distributions

Mixture of Distributions

Classification Techniques
• Latent Class Analysis (categorical indicators)• Latent Profile Analysis (continuous Indicators)• Finite Mixture Modeling (multivariate normal
variables)• …

Integrate Classification Models into Other Models
• Mixture Factor Analysis• Mixture Regressions• Mixture Structural Equation Modeling• Growth Mixture Modeling• Multilevel Mixture Modeling
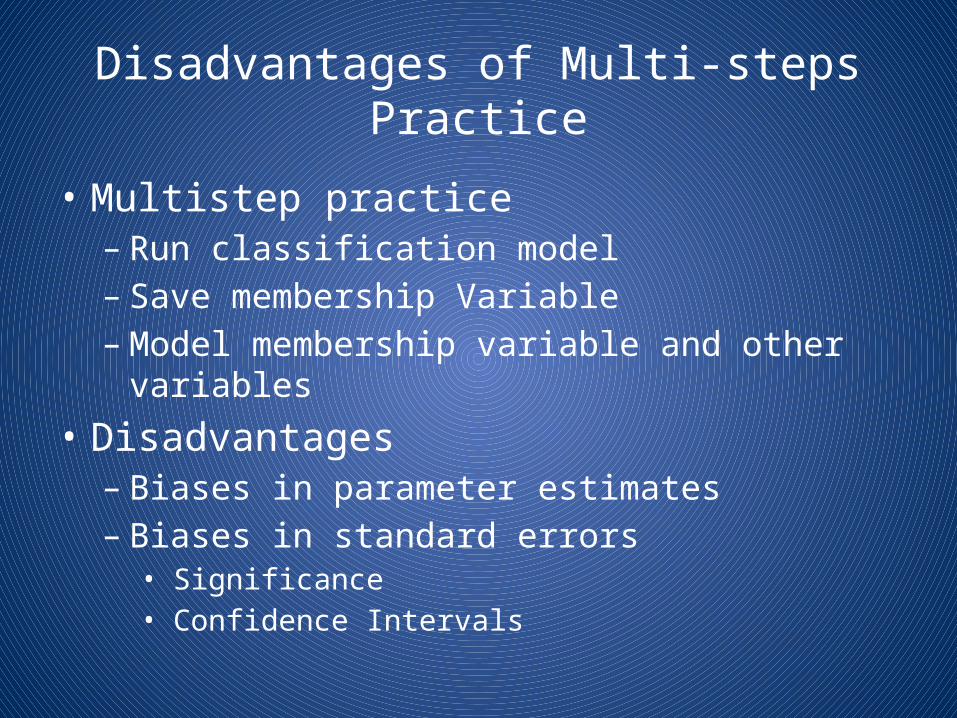
Disadvantages of Multi-steps Practice
• Multistep practice– Run classification model – Save membership Variable– Model membership variable and other variables
• Disadvantages– Biases in parameter estimates– Biases in standard errors • Significance• Confidence Intervals

Latent Class Analysis (LCA)
• Setting– Latent trait assumed to be categorical– Trait measured with multiple categorical indicators– Example: drug addiction, Schizophrenia
• Aim– Identify heterogeneous classes/groups – Estimate class probabilities– Identify good indicators of classes– Relate covariates to Classes

Graphic LCA Model
• Categorical Indicators u: u1, u2,u3, …ur
• Categorical Latent Variable C: C =1, 2, …, or K

Probabilistic Model
• Assumption: Conditional independence of u so that interdependence is explained by C like factor analysis model
• An item probability
• Joint Probability of all indicators
𝑃 (𝑢 𝑗=1)=∑𝑘=1
𝐾
¿¿
1 2 3
1 21
( , , ... )
( ) ( | ) ( | )... ( | )
r
k
rk
P u u u u
P c k P u c k P u c k P u c k

LCA Parameters
• Number of Classes -1• Item Probabilities -1
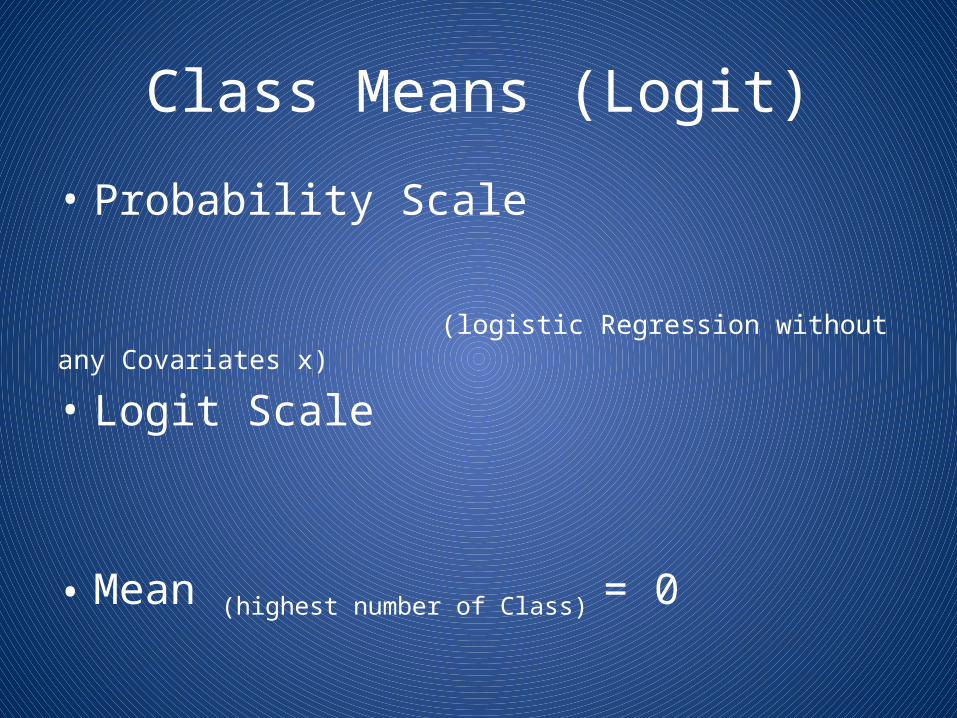
Class Means (Logit)
• Probability Scale
(logistic Regression without any Covariates x)
• Logit Scale
• Mean (highest number of Class) = 0

Latent Class Analysis with Covariates
• Covariates are related to Class Probability with multinomial logistic regression
1
( 1| )ck ck
cj cj
x
ik i Kx
J
eP c x
e

Posterior Probability(membership/classification of cases)
1 21 2
1 2
( ) ( | ) ( | )... ( | )( | , ,... )
( , ,... )r
rr
P c k P u c k P u c k P u c kP c k u u u
P u u u
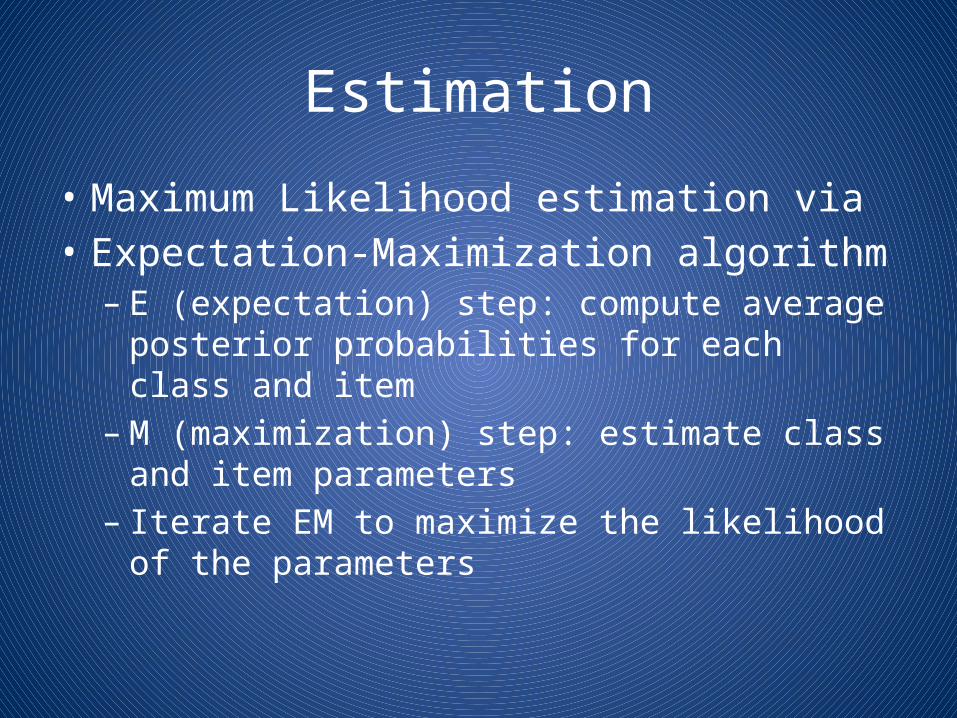
Estimation
• Maximum Likelihood estimation via • Expectation-Maximization algorithm– E (expectation) step: compute average posterior
probabilities for each class and item– M (maximization) step: estimate class and item
parameters– Iterate EM to maximize the likelihood of the
parameters

Test against Data
• O = observed number of response patterns• E = model estimated number of response
patterns• Pearson
• Chi-square based on likelihood ratio
22 ( )o e
e
2 2 log( / )LR o o e

Determine Number of Classes
• Substantive theory (parsimonious, interpretable)• Predictive validity• Auxiliary variables / covariates• Statistical information and tests– Bayesian Information Criterion (BIC)– Entropy– Testing K against K-1 Classes
• Vuong-Lo-Mendell-Rubin likelihood-ratio test• Bootstrapped likelihood ratio test

Bayesian Information Criterion (BIC)
2 ( ) ( ) ln( )BIC log L h N L = likelihoodh = number of parametersN = sample sizeChoose model with smallest BICBIC Difference > 4 appreciable

Quality of Classification
• Entropy
– = average of highest class probability of
individuals– A value of close to 1 indicates good classification– No clear cutting point for acceptance or rejection
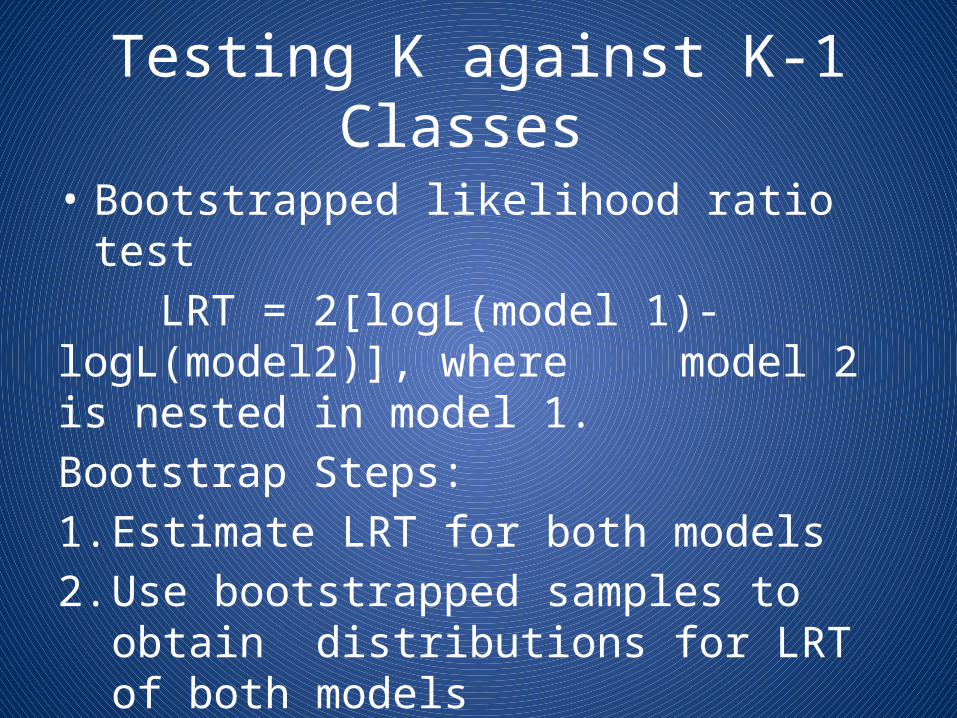
Testing K against K-1 Classes
• Bootstrapped likelihood ratio test LRT = 2[logL(model 1)- logL(model2)], where
model 2 is nested in model 1.Bootstrap Steps:1. Estimate LRT for both models2. Use bootstrapped samples to obtain
distributions for LRT of both models3. Compare LRT and get p values

Testing K against K-1 Classes
• Vuong-Lo-Mendell-Rubin likelihood-ratio test

Determine Quality of Indicators
• Good indicators– Item response probability is close to 0 or 1 in each
class• Bad indicators– Item response probability is high in more than one
classes, like cross-loading in factor analysis– Item response probability is low in all classes like
low-loading in factor analysis

LCA Examples
• LCA• LCA with covariates• Class predicts a categorical outcome

Save Membership Variable
Variable: idvar = id;
Output:Savedata: File = cmmber.txt; Save = cprob;

Latent Profile Analysis
• Covariance of continuous variables are dependent on class K and fixed at zero
• Variances of continuous variables are constrained to be equal across classes and minimized
• Mean differences are maximized across classes

Finite Mixture Modeling(multivariate normal variables)
• Finite = finite number of subgroups/classes• Variables are normally distributed in each class• Means differ across classes • Variances are the same across • Covariances can differ without restrictions or
equal with restrictions across classes• Latent profile can be special case with
covariances fixed at zero.

Mixture Factor Analysis
• Allow one to examine measurement properties of items in heterogeneous subgroups / classes
• Measurement invariance is not required assuming heterogeneity
• Factor structure can change• See Mplus outputs

Factor Mixture Analysis
• Parental Control
• Parental AcceptanceFeel people in your family understand you
Feel you want to leave home
Feel you and your family have fun together
Feel that your family pay attention to you
Feel your parents care about you
Feel close to your mother
Feel close to your father
Parents let you make your own decisions about the time you must be home on weekend nights
Parents let you make your own decisions about the people you hang around with
Parents let you make your own decisions about what you wear
Parents let you make your own decisions about which television programs you watch
Parents let you make your own decisions about which television programs you watch
Parents let you make your own decisions about what time you go to bed on week nights
Parents let you make your own decisions about what you eat

Two dimensions of Parenting

Mixture SEM
• See mixture growth modeling

Mixture Modeling with Known Classes
• Identify hidden classes within known groups• Under nonrandomized experiments – Impose equality constraints on covariates to
identify similar classes from known groups – Compare classes that differ in covariates