Embed Size (px)
Citation preview
Latent Growth Modeling
Chongming YangResearch Support Center
FHSS College

Objectives
• Understand the basics of LGM• Learn about some applications• Obtain some hands-on experience
Limitations of Traditional Repeated ANOVA / MANOVA / GLM
• Concern group-mean changes over time • Variances of changes not explicit parameters• List-wise deletion of cases with missing values• Can’t incorporate time-variant covariate
Recent Approaches Individual changes
• Multilevel/Mixed /HL modeling• Generalized Estimating Equations (GEE)• Structural equation modeling (latent growth
(curve) modeling)
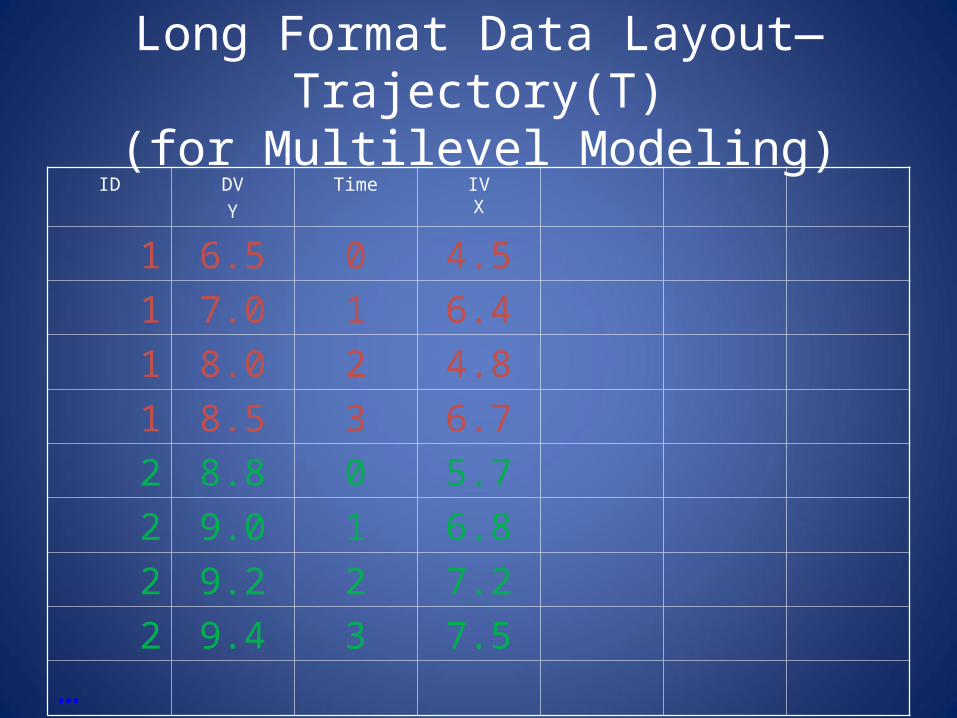
Long Format Data Layout—Trajectory(T)(for Multilevel Modeling)
ID DV
Y
Time IVX
1 6.5 0 4.5
1 7.0 1 6.4
1 8.0 2 4.8
1 8.5 3 6.7
2 8.8 0 5.7
2 9.0 1 6.8
2 9.2 2 7.2
2 9.4 3 7.5
…
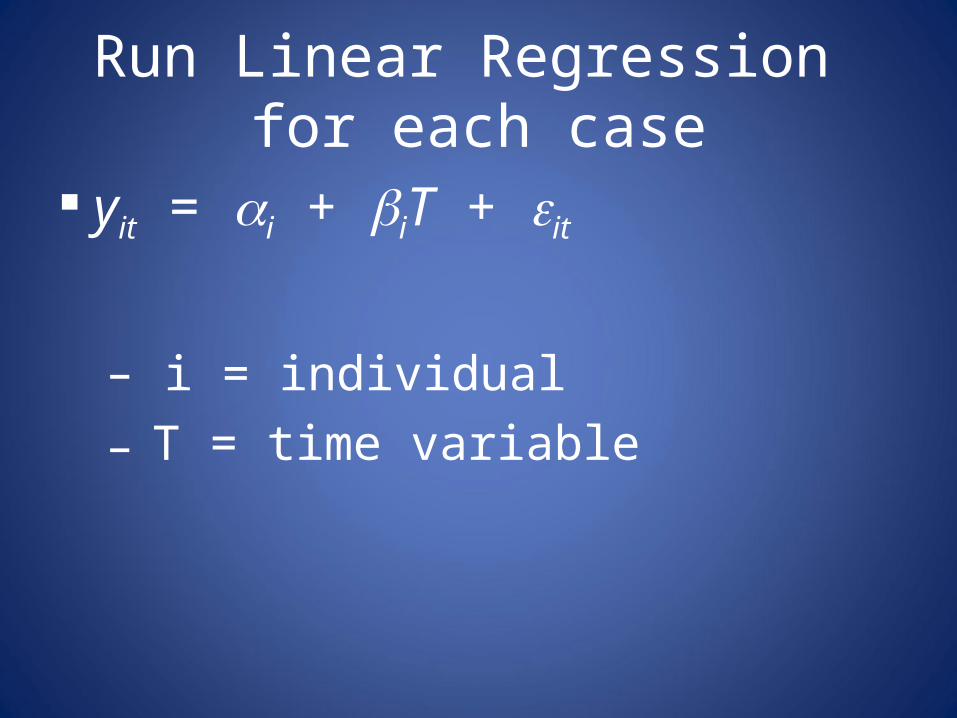
Run Linear Regression for each case
yit = i + iT + it
– i = individual– T = time variable
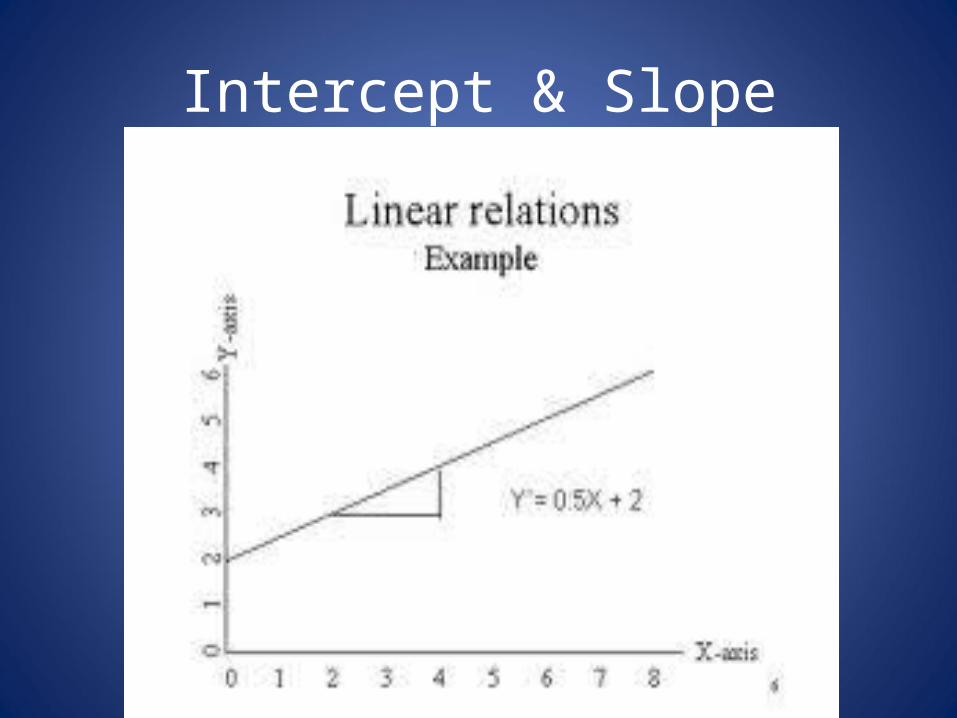
Intercept & Slope
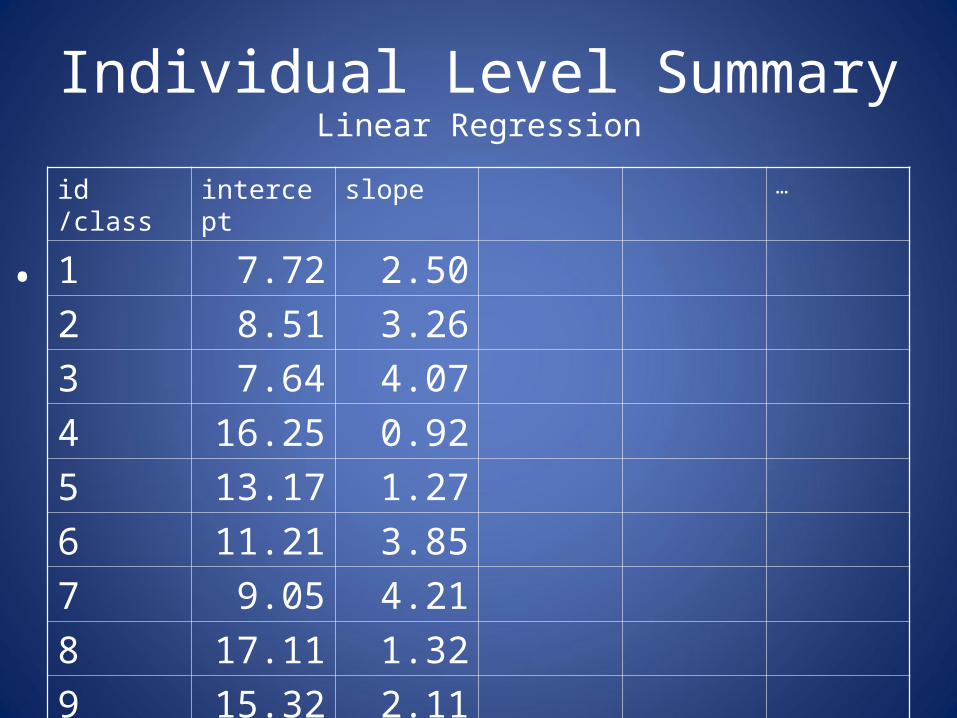
Individual Level SummaryLinear Regression
id /class intercept slope …
1 7.72 2.50
2 8.51 3.26
3 7.64 4.07
4 16.25 0.92
5 13.17 1.27
6 11.21 3.85
7 9.05 4.21
8 17.11 1.32
9 15.32 2.11
•
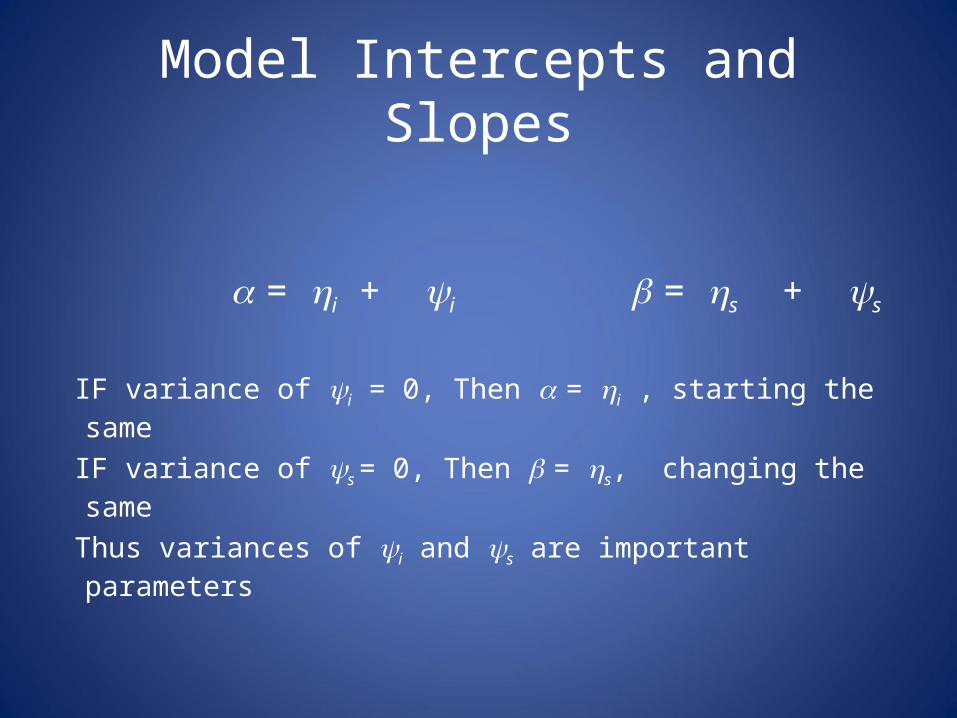
Model Intercepts and Slopes
= i + i = s + s
IF variance of i = 0, Then = i , starting the same
IF variance of s = 0, Then = s, changing the same
Thus variances of i and s are important parameters
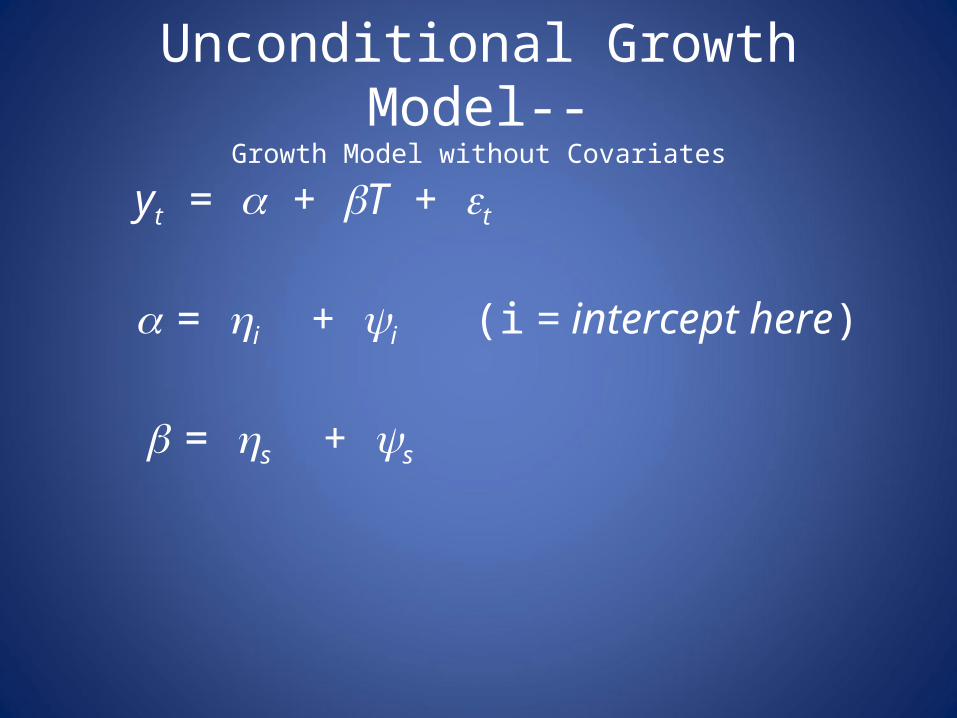
Unconditional Growth Model--Growth Model without Covariates
yt = + T + t
= i + i (i = intercept here) = s + s
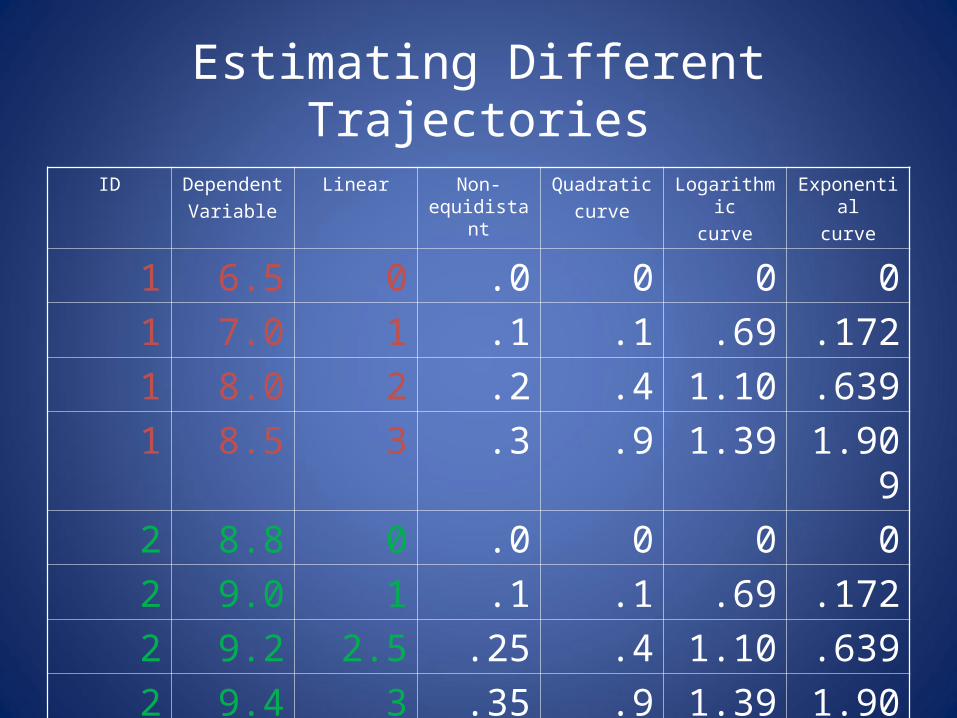
Estimating Different Trajectories
ID Dependent
Variable
Linear Non-equidistant
Quadratic
curve
Logarithmic
curve
Exponential
curve
1 6.5 0 .0 0 0 0
1 7.0 1 .1 .1 .69 .172
1 8.0 2 .2 .4 1.10 .639
1 8.5 3 .3 .9 1.39 1.909
2 8.8 0 .0 0 0 0
2 9.0 1 .1 .1 .69 .172
2 9.2 2.5 .25 .4 1.10 .639
2 9.4 3 .35 .9 1.39 1.909
…
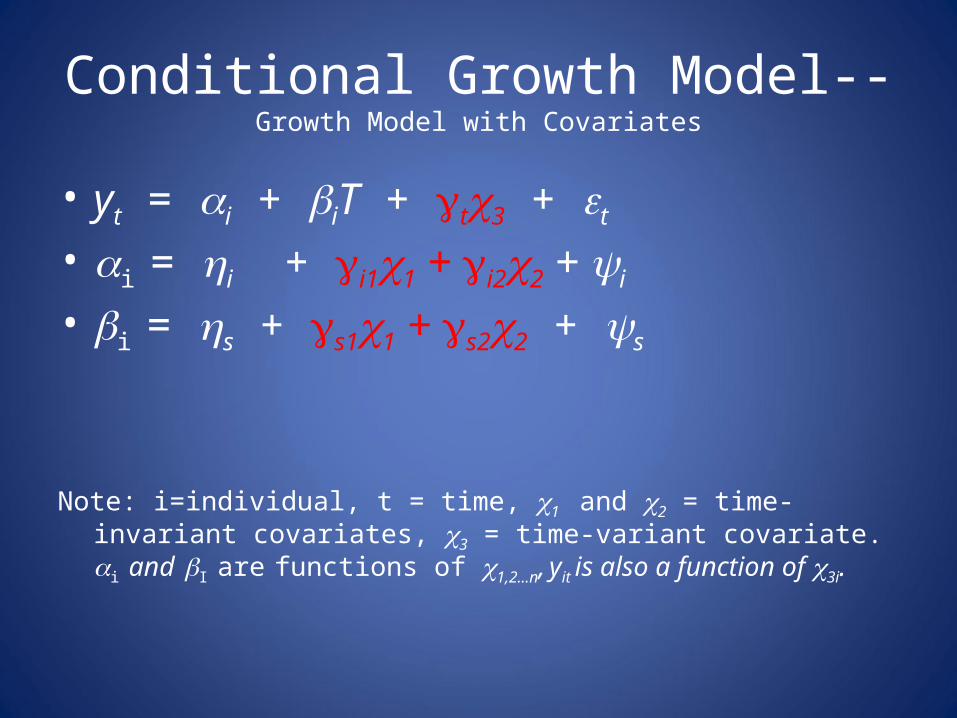
Conditional Growth Model--Growth Model with Covariates
• yt = i + iT + t3 + t
• i = i + i11 + i22 + i
• i = s + s11 + s22 + s
Note: i=individual, t = time, 1 and 2 = time-invariant covariates, 3 = time-variant covariate. i and I are functions of 1,2…n, yit is also a function of 3i.
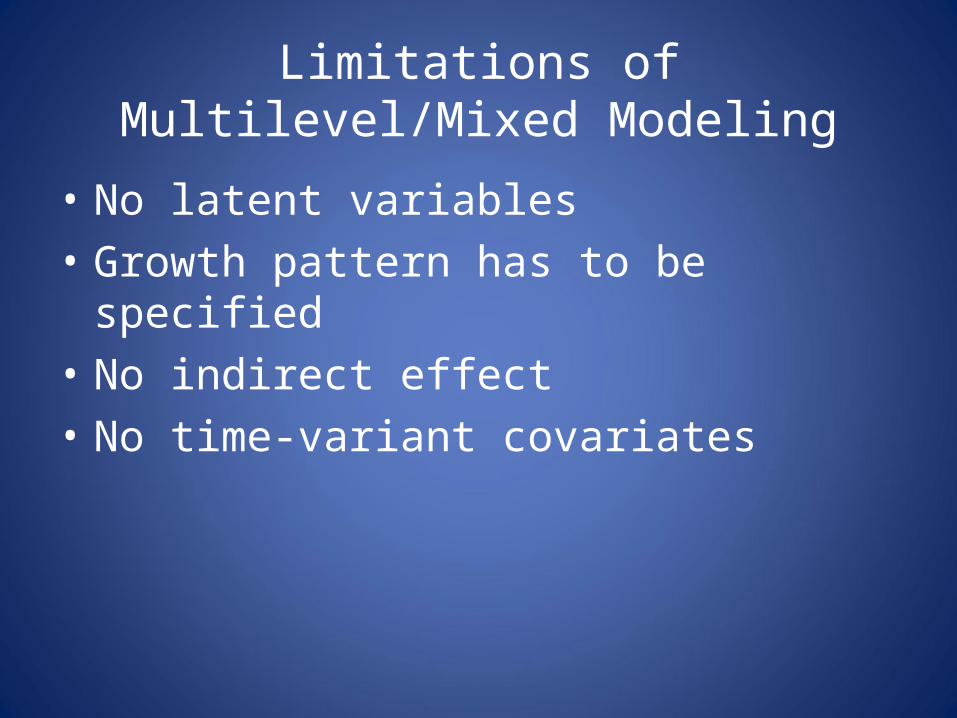
Limitations of Multilevel/Mixed Modeling
• No latent variables• Growth pattern has to be specified• No indirect effect• No time-variant covariates
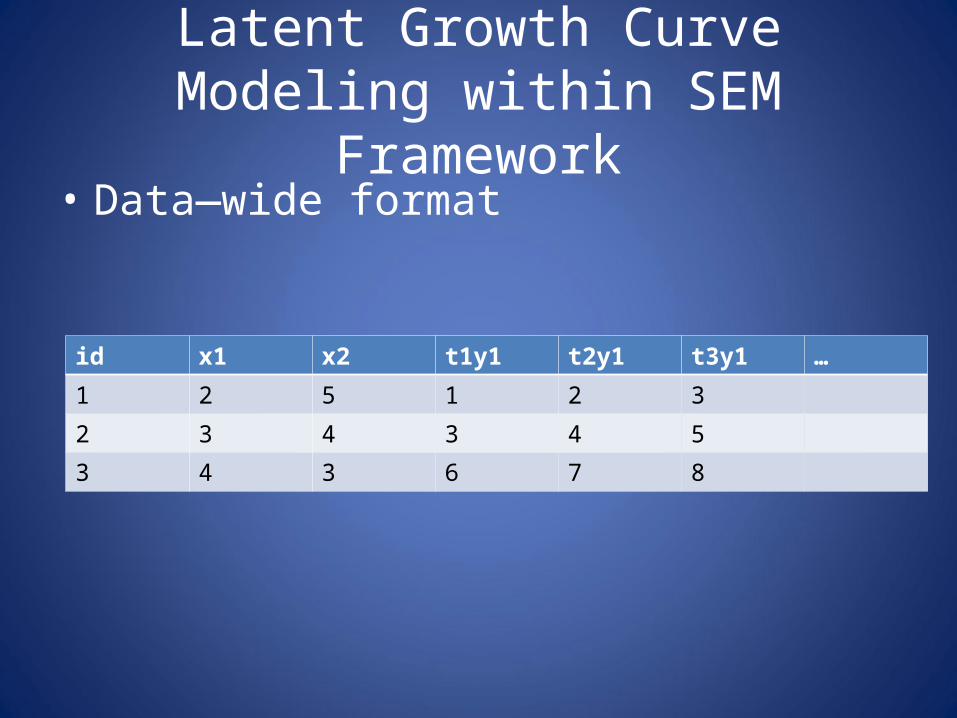
Latent Growth Curve Modeling within SEM Framework
• Data—wide format
id x1 x2 t1y1 t2y1 t3y1 …
1 2 5 1 2 3
2 3 4 3 4 5
3 4 3 6 7 8
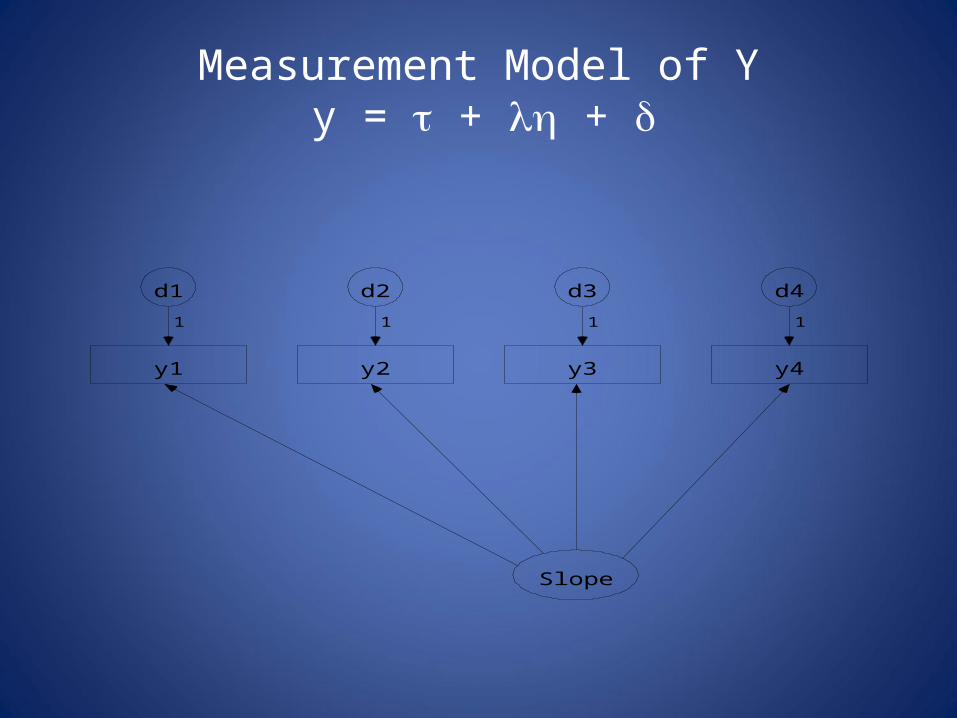
Measurement Model of Y y = + +
Slope
y1
d1
1
y2
d2
1
y3
d3
1
y4
d4
1
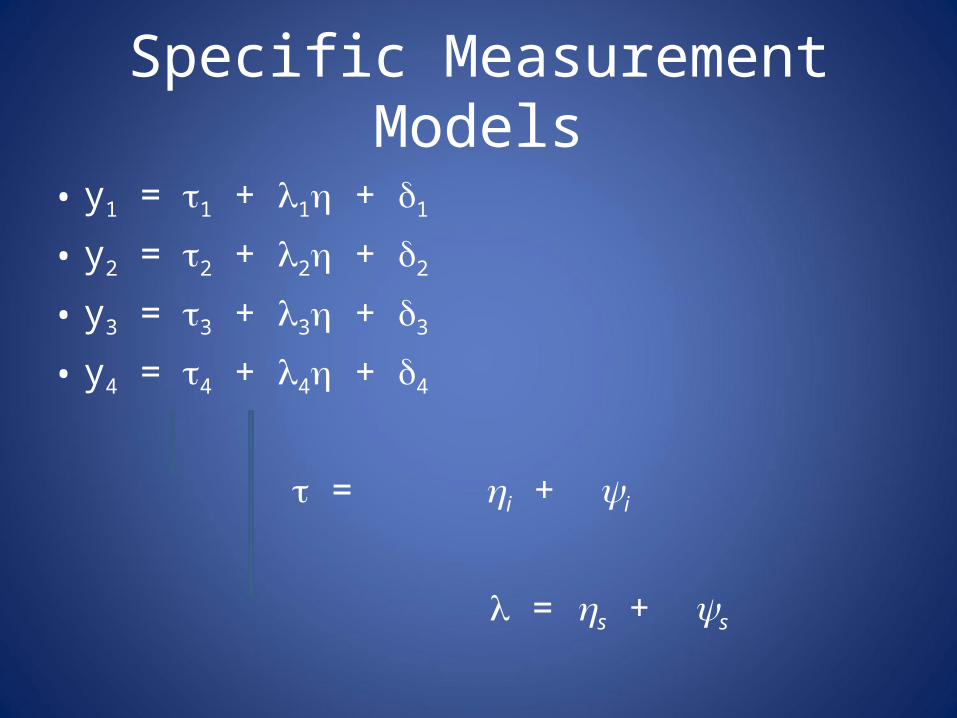
Specific Measurement Models
• y1 = 1 + 1 + 1
• y2 = 2 + 2 + 2
• y3 = 3 + 3 + 3
• y4 = 4 + 4 + 4
= i + i
= s + s
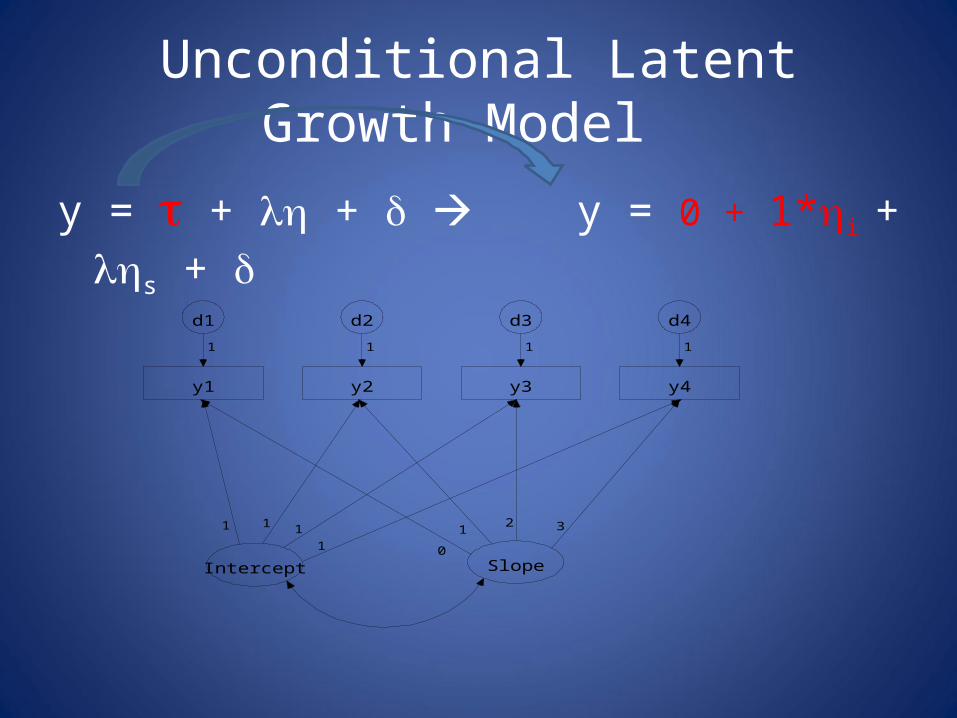
Unconditional Latent Growth Model
y = + + y = 0 + 1*i + s +
Slope
y1
d1
1
y2
d2
1
y3
d3
1
y4
d4
1
Intercept
1 3
0
211 1
1
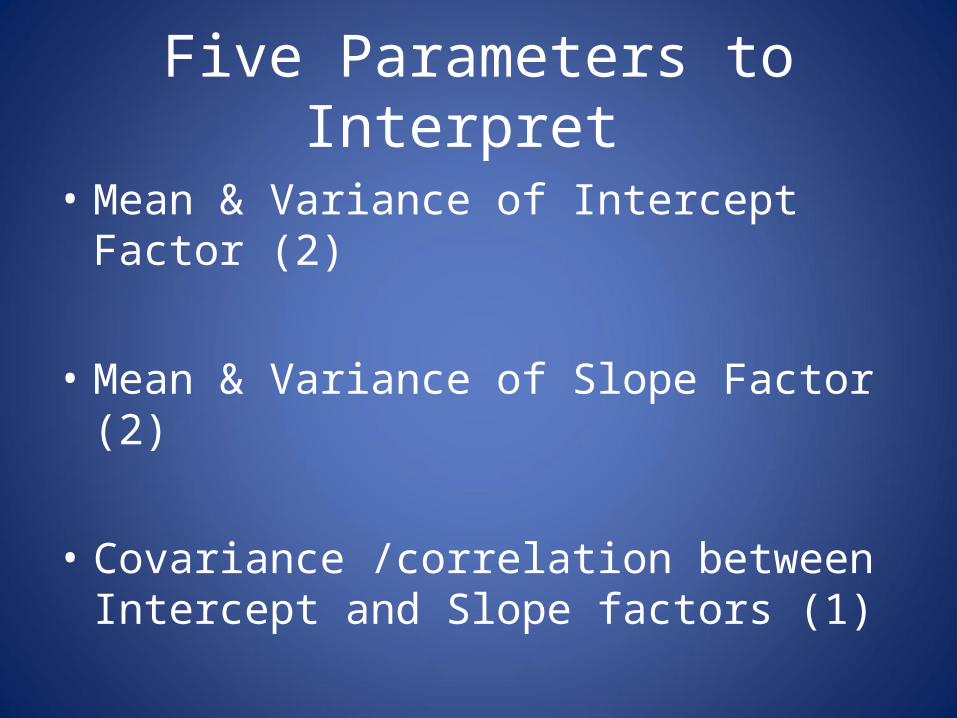
Five Parameters to Interpret
• Mean & Variance of Intercept Factor (2)
• Mean & Variance of Slope Factor (2)
• Covariance /correlation between Intercept and Slope factors (1)
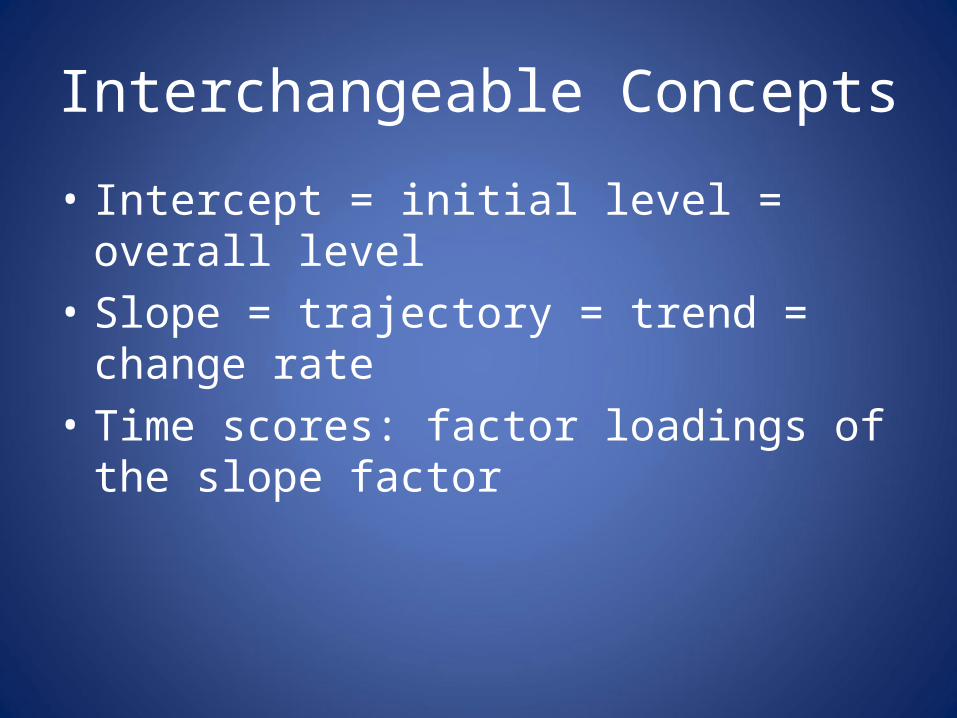
Interchangeable Concepts
• Intercept = initial level = overall level• Slope = trajectory = trend = change rate• Time scores: factor loadings of the slope
factor
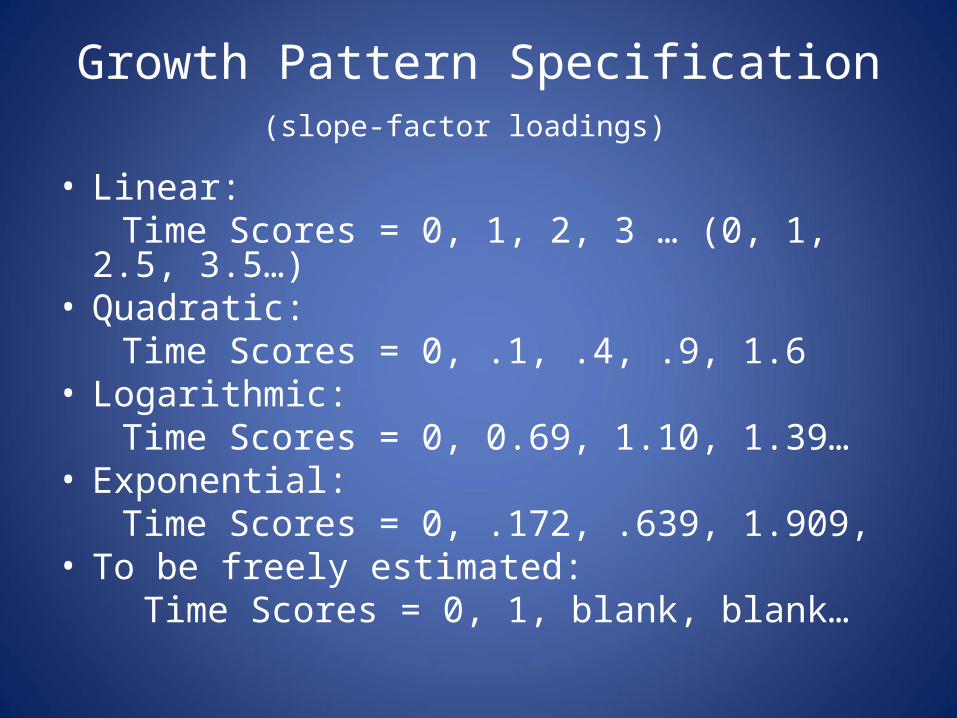
Growth Pattern Specification(slope-factor loadings)
• Linear: Time Scores = 0, 1, 2, 3 … (0, 1, 2.5, 3.5…)• Quadratic: Time Scores = 0, .1, .4, .9, 1.6• Logarithmic: Time Scores = 0, 0.69, 1.10, 1.39…• Exponential: Time Scores = 0, .172, .639, 1.909, • To be freely estimated: Time Scores = 0, 1, blank, blank…
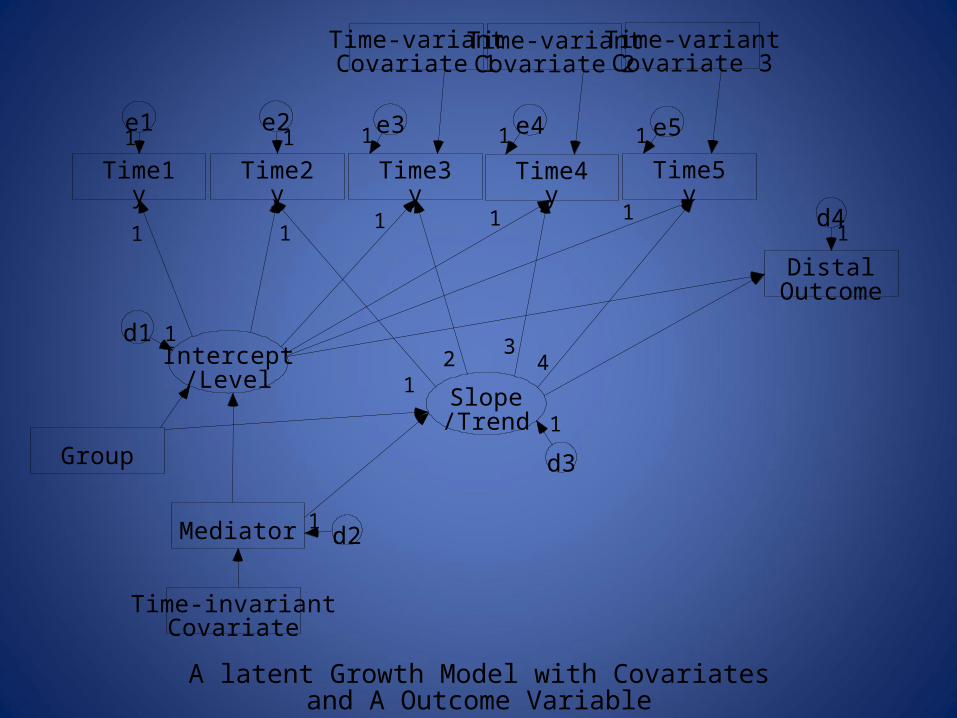
Intercept/Level
Time2y
e21
Time3y
e3
Time4y
e4
Time1y
e1
1
1
Slope/Trend
1
Time5y
e5
Time-variantCovariate 1
Time-variantCovariate 2
Time-variantCovariate 3
Mediator
Time-invariantCovariate
DistalOutcome
Group
d41
d3
1
d1 1
d21
1 1 1
A latent Growth Model with Covariatesand A Outcome Variable
11
2
1
1
34
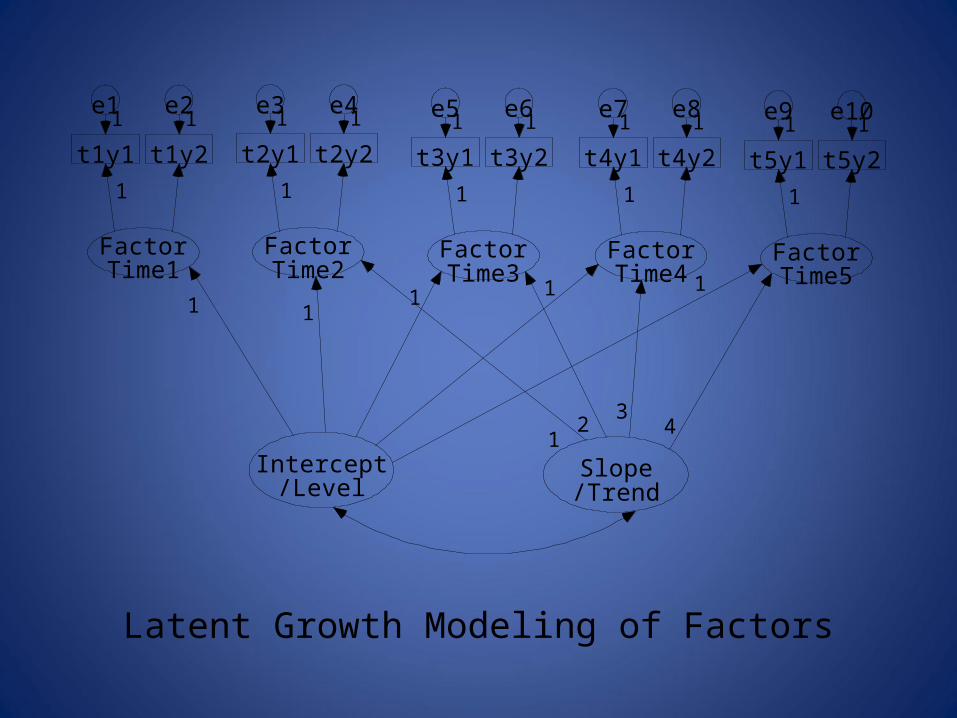
Intercept/Level
FactorTime2
FactorTime3
FactorTime4
Latent Growth Modeling of Factors
FactorTime1
1 1 1
Slope/Trend
3
1
21
FactorTime51
4
t1y1
e1
1
1
t1y2
e21
t2y1
e3
1
1
t2y2
e41
t3y1
e5
1
1
t3y2
e61
t4y1
e7
1
1
t4y2
e81
t5y1
e9
1
1
t5y2
e101
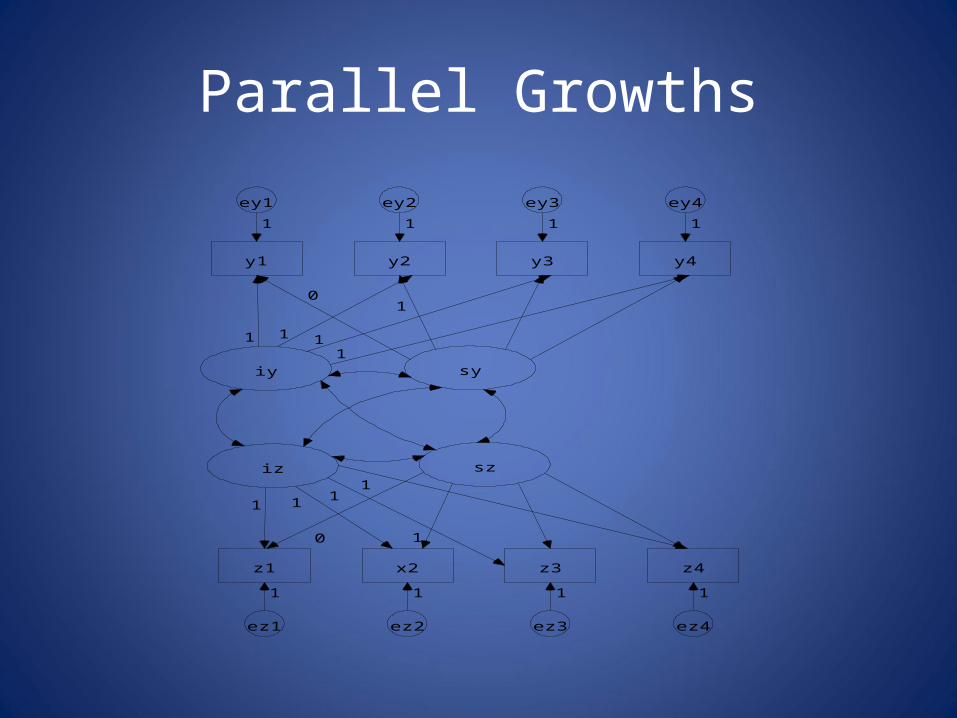
Parallel Growths
sy
y1
ey1
0
1
y2
ey2
1
1
y3
ey3
1
y4
ey4
1
iy
sz
z4
ez4
z3
ez3
x2
ez2
z1
ez1
11
1
11
iz
1
0
1
1 1 1
1 11
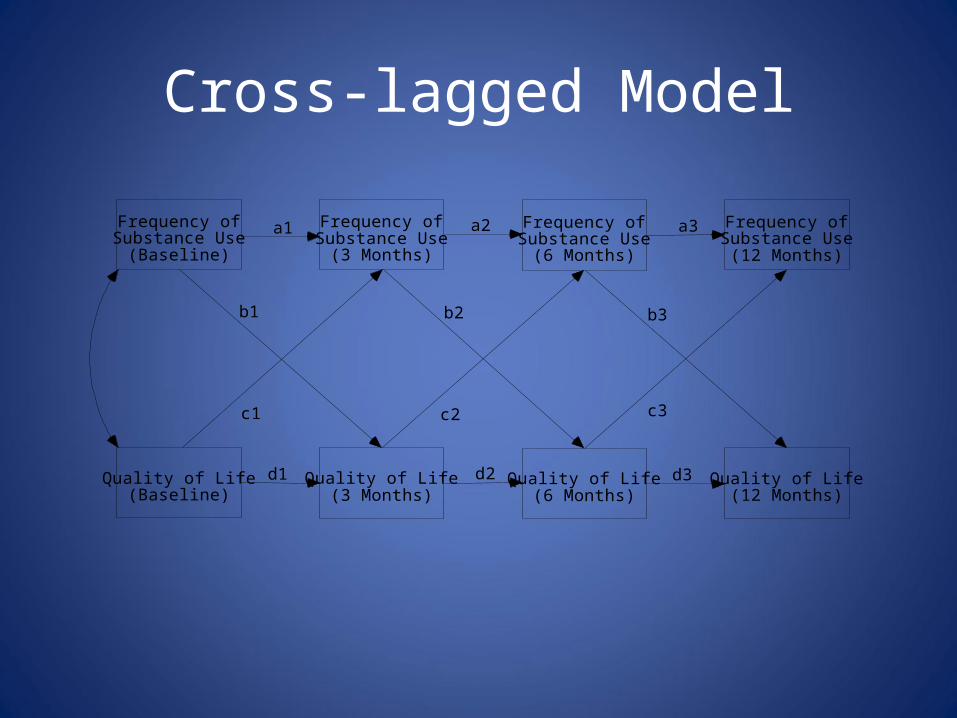
Cross-lagged Model
Frequency ofSubstance Use
(Baseline)
Frequency ofSubstance Use
(3 Months)
Frequency ofSubstance Use
(6 Months)
Frequency ofSubstance Use
(12 Months)
Quality of Life(Baseline)
Quality of Life(3 Months)
Quality of Life(6 Months)
Quality of Life(12 Months)
d1 d2 d3
a2
c3
b1 b2
c1 c2
b3
a3a1
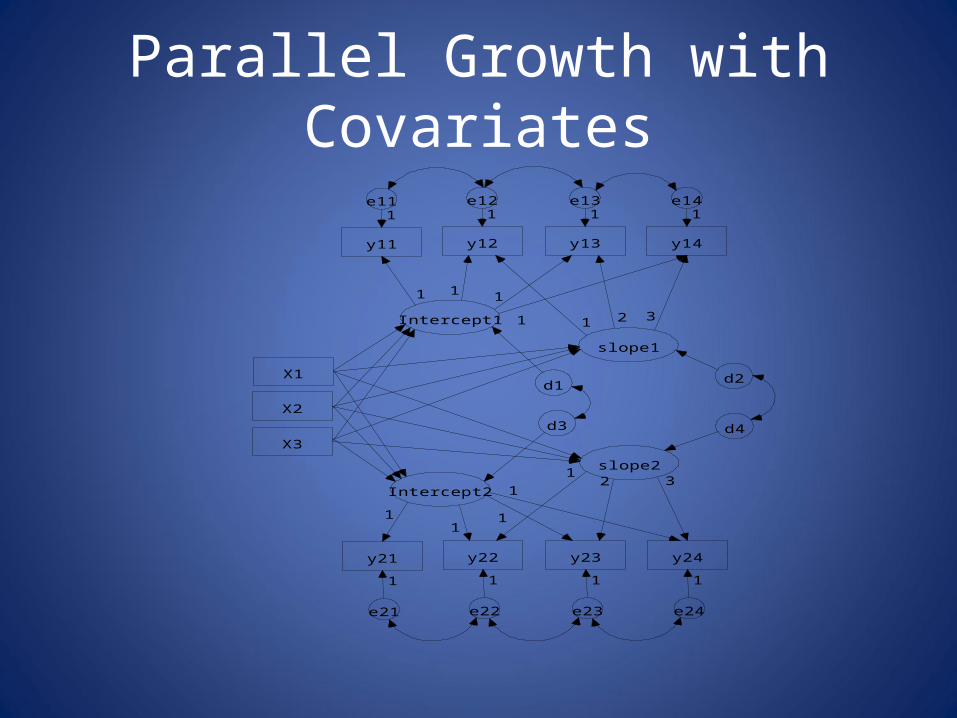
Parallel Growth with Covariates
y11 y12 y13 y14
Intercept1
slope1
1 1 1
1 2 3
e111
e121
e131
e141
1
y21 y22 y23 y24
Intercept2
slope2
e21 e22 e23 e24
11
12 3
1 1 1 1
X1
X2
X3
1
1
d1d2
d4d3
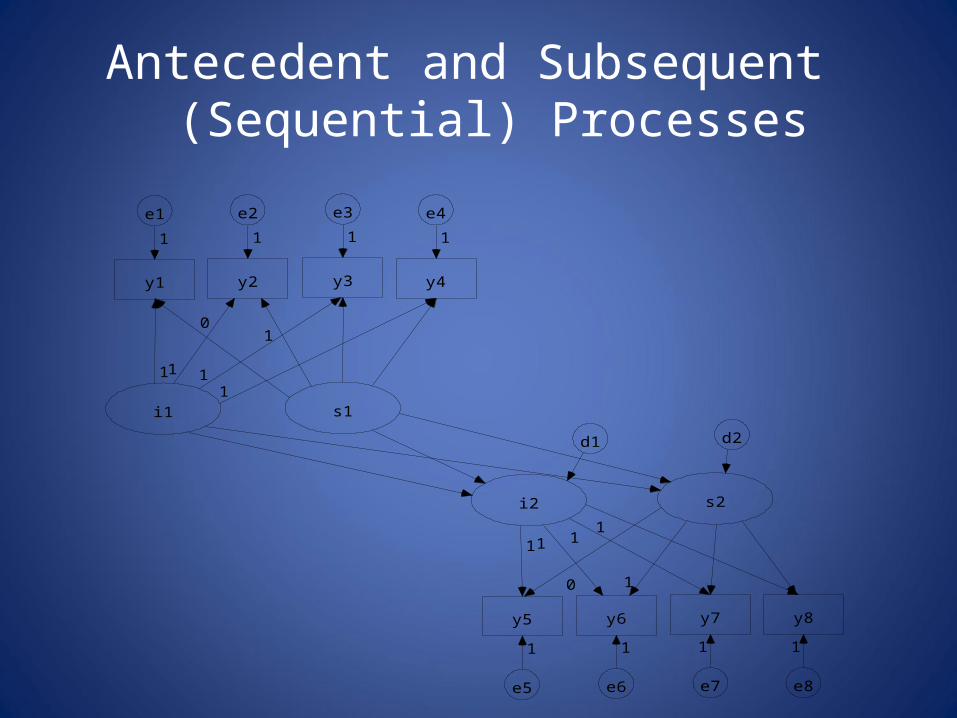
Antecedent and Subsequent (Sequential) Processes
s1
y1
e1
0
1
y2
e2
1
y3
e3
1
y4
e4
1
i1
s2
y8
e8
y7
e7
y6
e6
y5
e5
11
1
11
i2
0
1
1
d1 d2
11
1
11 1
1
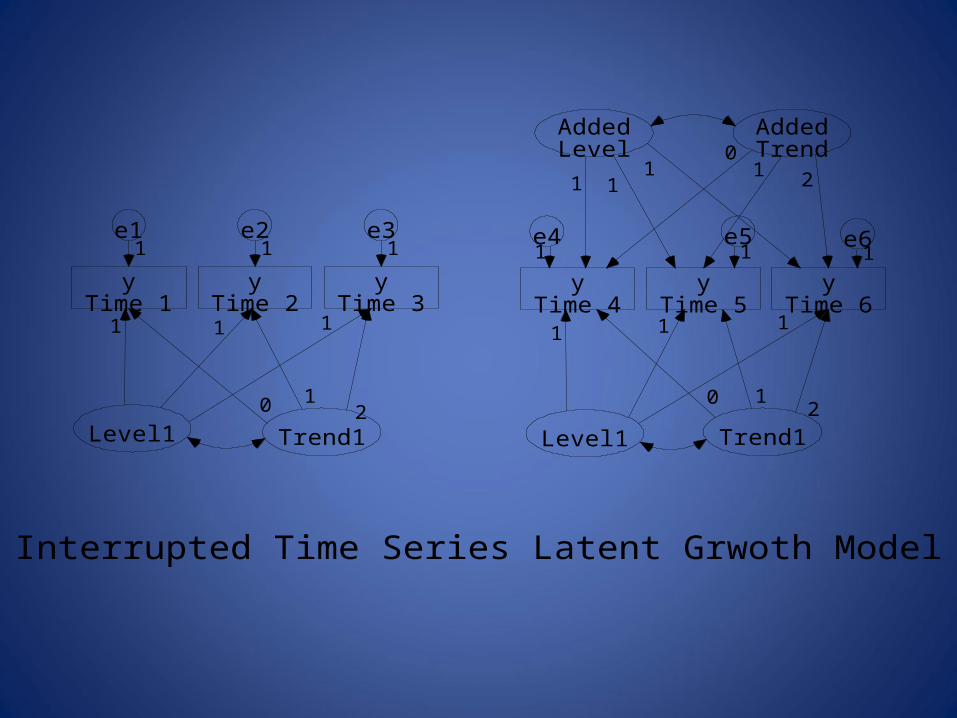
yTime 1
yTime 2
yTime 3
yTime 4
yTime 5
yTime 6
Level1 Trend1 Level1 Trend1
AddedLevel
AddedTrend
20
1
e11
e21
e31
e4 e5 e6
1
2
1
0
1
11 1
Interrupted Time Series Latent Grwoth Model
1 1
1 1
1
1
01 21
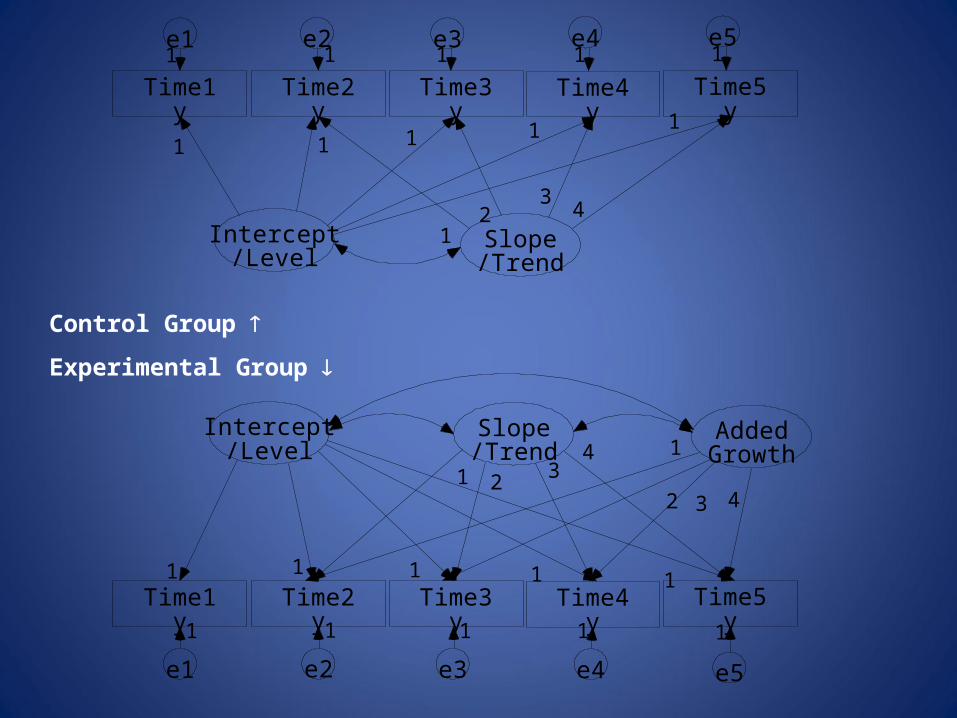
Control Group
Experimental Group
Intercept/Level
Time2y
e21
Time3y
e3
Time4y
e4
Time1y
e1
1
1
Slope/Trend
Time5y
e5
34
Intercept/Level
Time2y
e2
Time3y
e3
Time4y
e4
Time1y
e1
Slope/Trend
Time5y
e5
1
1
1 1 1
34
111
1
1
2
1 1
2
11
1
AddedGrowth1
2 3 4
1 1 1
1
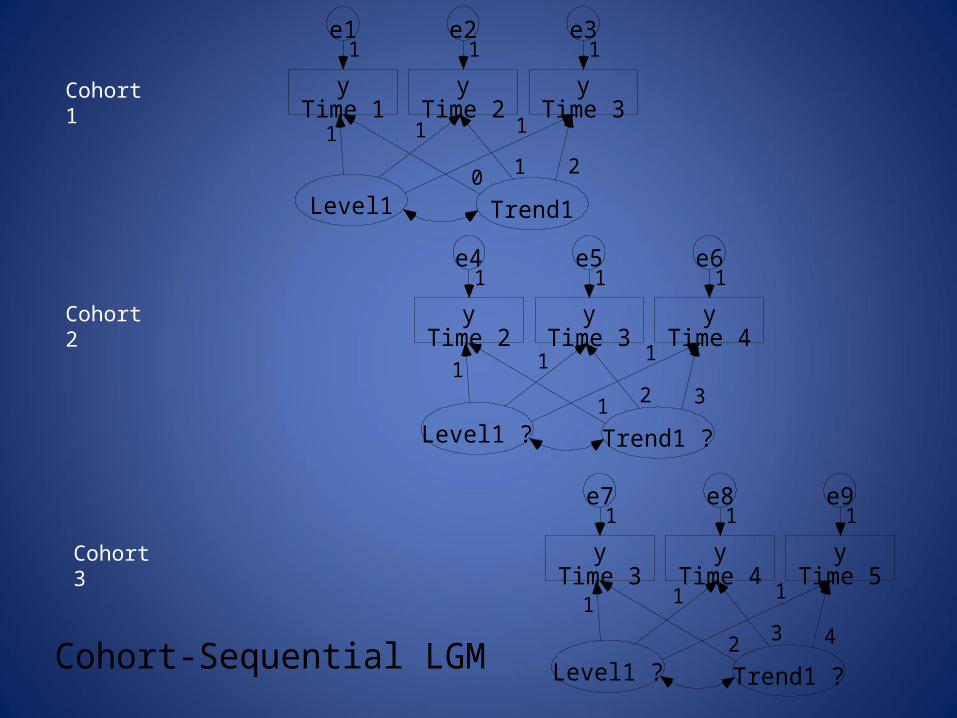
Cohort 1
Cohort 2
Cohort 3
yTime 1
yTime 2
yTime 3
Level1 Trend1
20
1
e11
e21
e31
1
1
1
yTime 2
yTime 3
yTime 4
Level1 ? Trend1 ?
e4 e5 e6
31
1
1 1 1
12
1
yTime 3
yTime 4
yTime 5
Level1 ? Trend1 ?
e7 e8 e9
42
1
1 1 1
13
1
Cohort-Sequential LGM
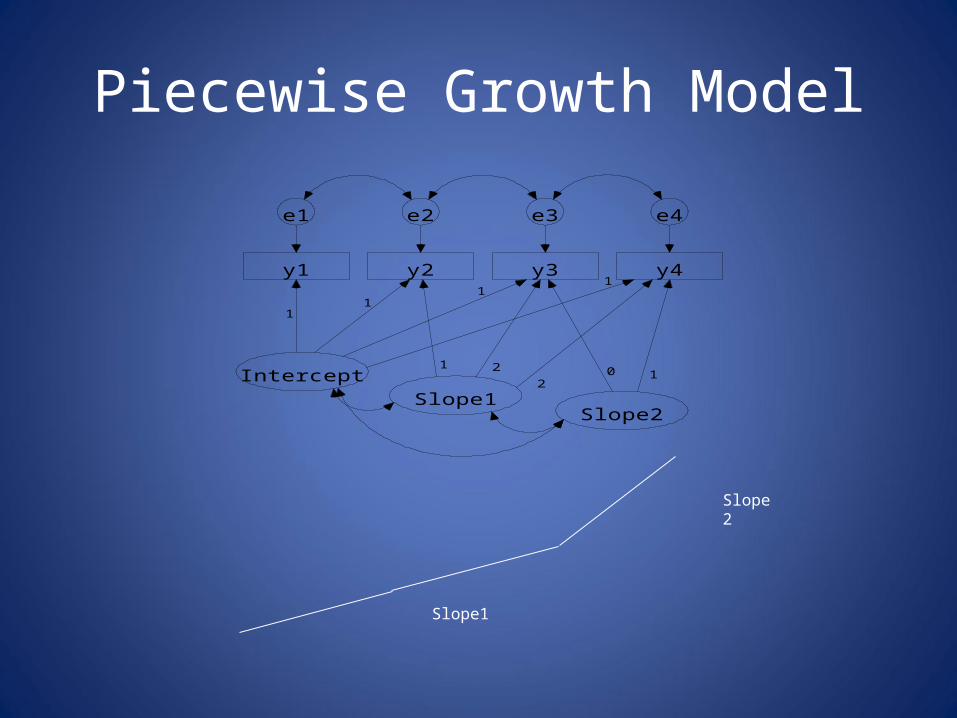
Piecewise Growth Model
Intercept
y1
e1
y2
e2
y3
e3
y4
e4
Slope1Slope2
1
1
20 1
2
11
1
Slope1
Slope2
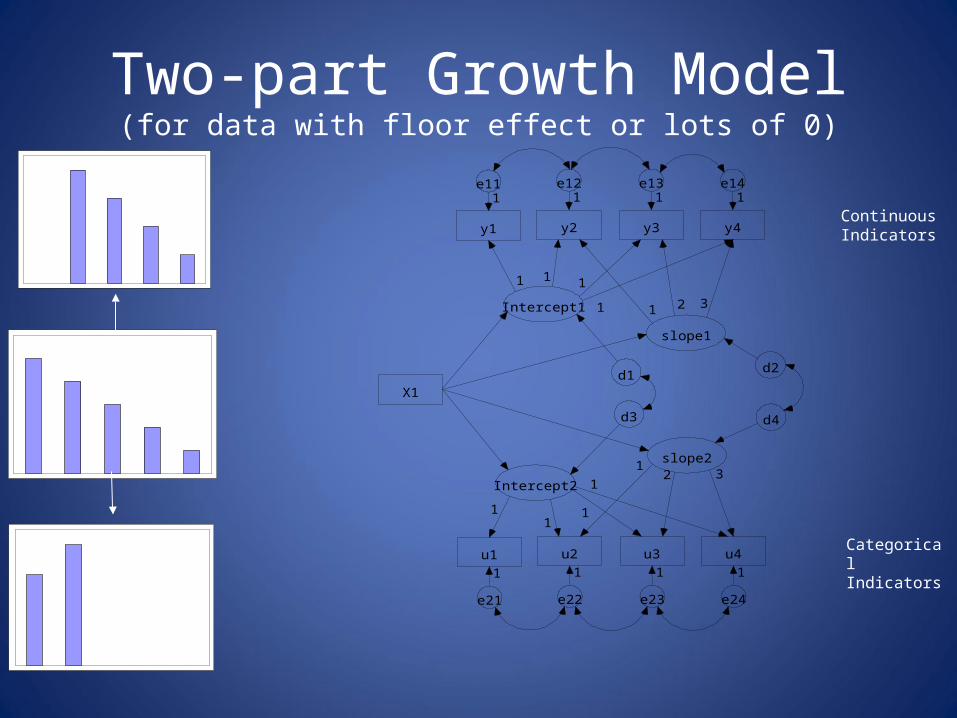
Two-part Growth Model(for data with floor effect or lots of 0)
Dummy- Coding 0-1
y1 y2 y3 y4
Intercept1
slope1
1 1 1
1 2 3
e111
e121
e131
e141
1
u1 u2 u3 u4
Intercept2
slope2
e21 e22 e23 e24
11
12 3
1 1 1 1
X1
1
1
d1d2
d4d3
Original Rating 0-4
Continuous Indicators
Categorical Indicators
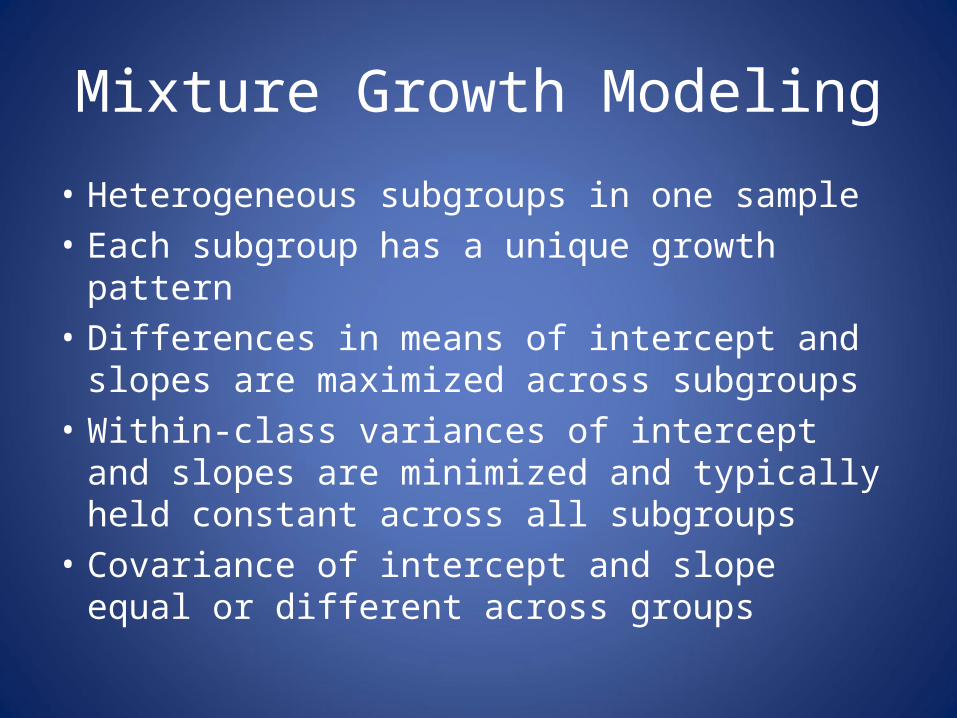
Mixture Growth Modeling
• Heterogeneous subgroups in one sample• Each subgroup has a unique growth pattern• Differences in means of intercept and slopes are
maximized across subgroups• Within-class variances of intercept and slopes
are minimized and typically held constant across all subgroups
• Covariance of intercept and slope equal or different across groups
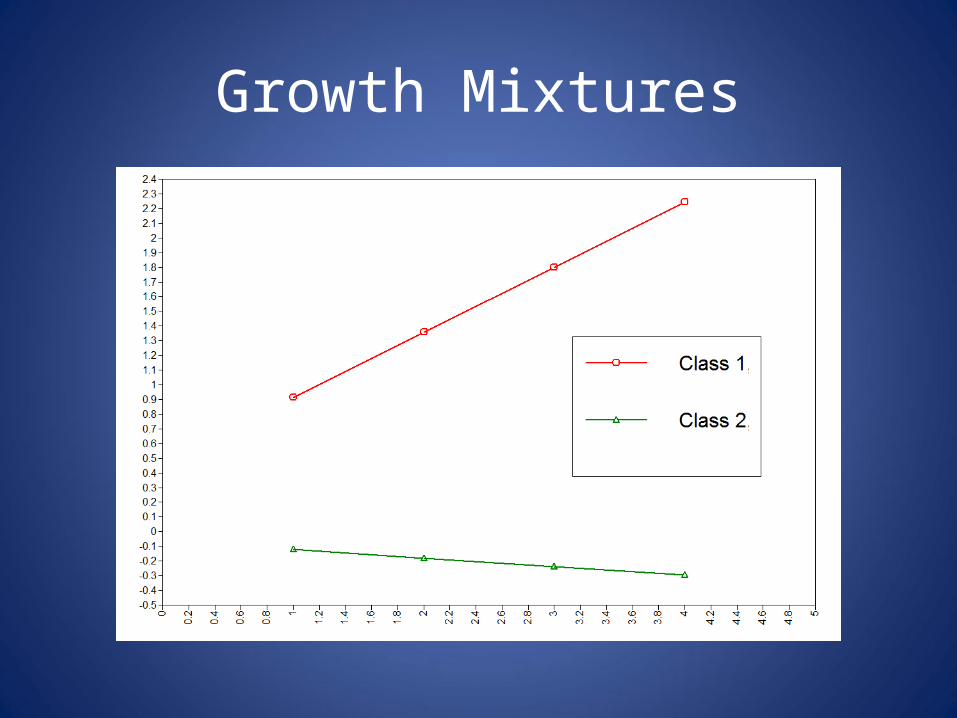
Growth Mixtures
T-scores approach
• Use a variable that is different from the one that indicates measurement time to examine individual changes
• Example– Sample varies in age– Measurement was collected over time – Research question: How measurement changes
with age?

Advantage of SEM Approach
• Flexible curve shape via estimation• Multiple processes• Indirect effects • Time-variant and invariant covariates• Model indirect effects• Model growth of latent constructs • Multiple group analysis and test of parameter
equivalence• Identify heterogeneous subgroups with unique
trajectories
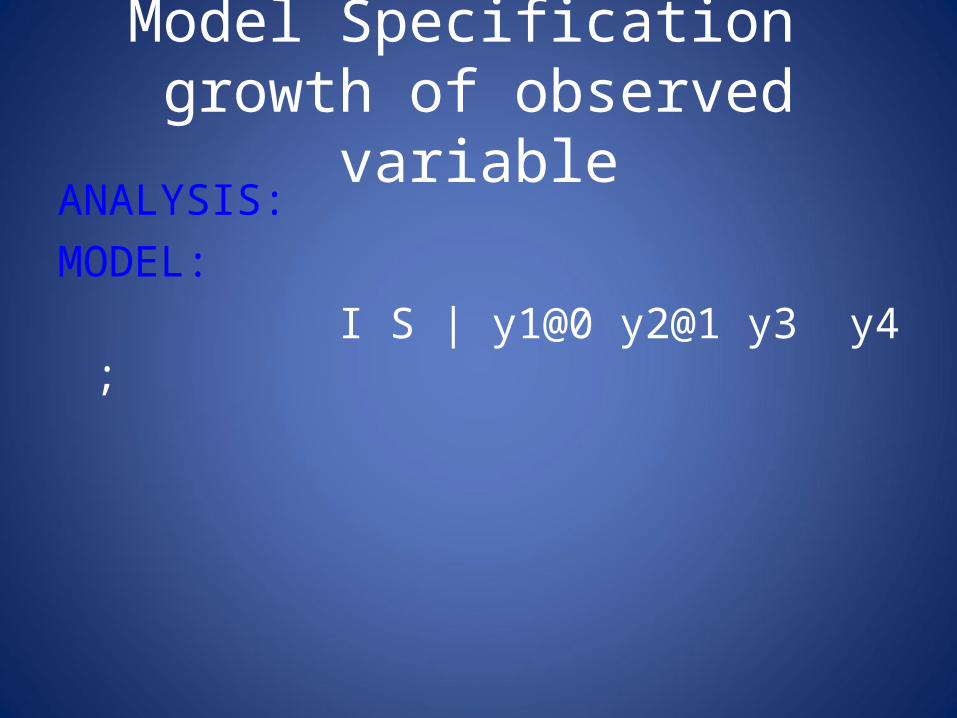
Model Specification growth of observed variable
ANALYSIS: MODEL: I S | y1@0 y2@1 y3 y4 ;
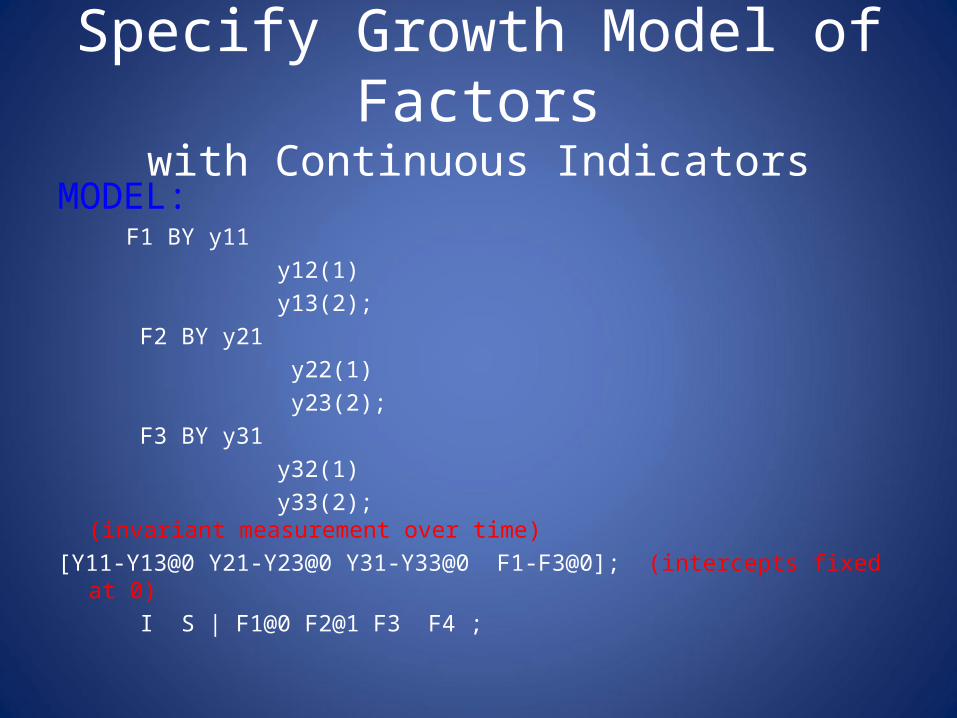
Specify Growth Model of Factorswith Continuous Indicators
MODEL: F1 BY y11 y12(1) y13(2); F2 BY y21 y22(1) y23(2); F3 BY y31 y32(1) y33(2); (invariant measurement over time)[Y11-Y13@0 Y21-Y23@0 Y31-Y33@0 F1-F3@0]; (intercepts fixed at 0) I S | F1@0 F2@1 F3 F4 ;
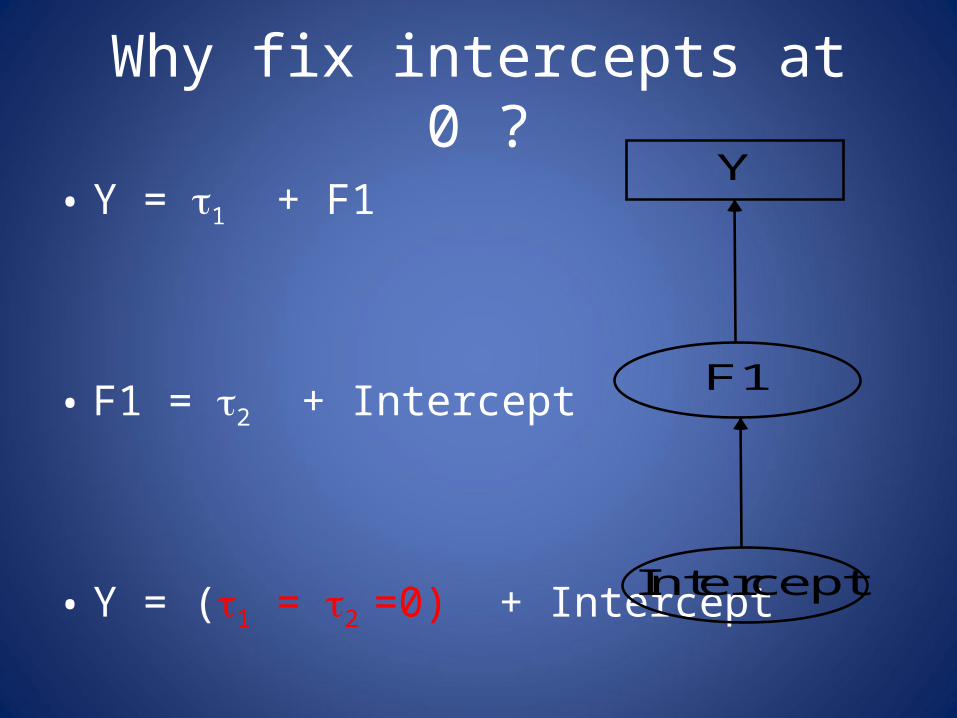
Why fix intercepts at 0 ?
• Y = 1 + F1
• F1 = 2 + Intercept
• Y = (1 = 2 =0) + Intercept
Y
F1
Intercept
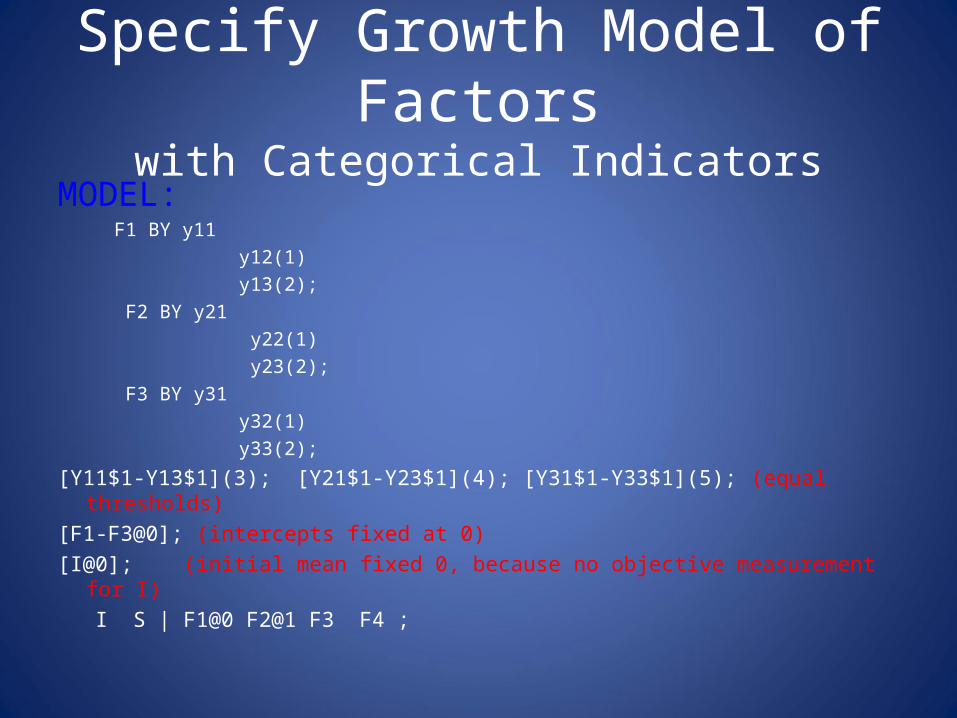
Specify Growth Model of Factorswith Categorical Indicators
MODEL: F1 BY y11 y12(1) y13(2); F2 BY y21 y22(1) y23(2); F3 BY y31 y32(1) y33(2);
[Y11$1-Y13$1](3); [Y21$1-Y23$1](4); [Y31$1-Y33$1](5); (equal thresholds)[F1-F3@0]; (intercepts fixed at 0) [I@0]; (initial mean fixed 0, because no objective measurement for I) I S | F1@0 F2@1 F3 F4 ;
Practical Tip
• Specify a growth trajectory pattern to ensure the model runs
• Examine sample and model estimated trajectories to determine the best pattern
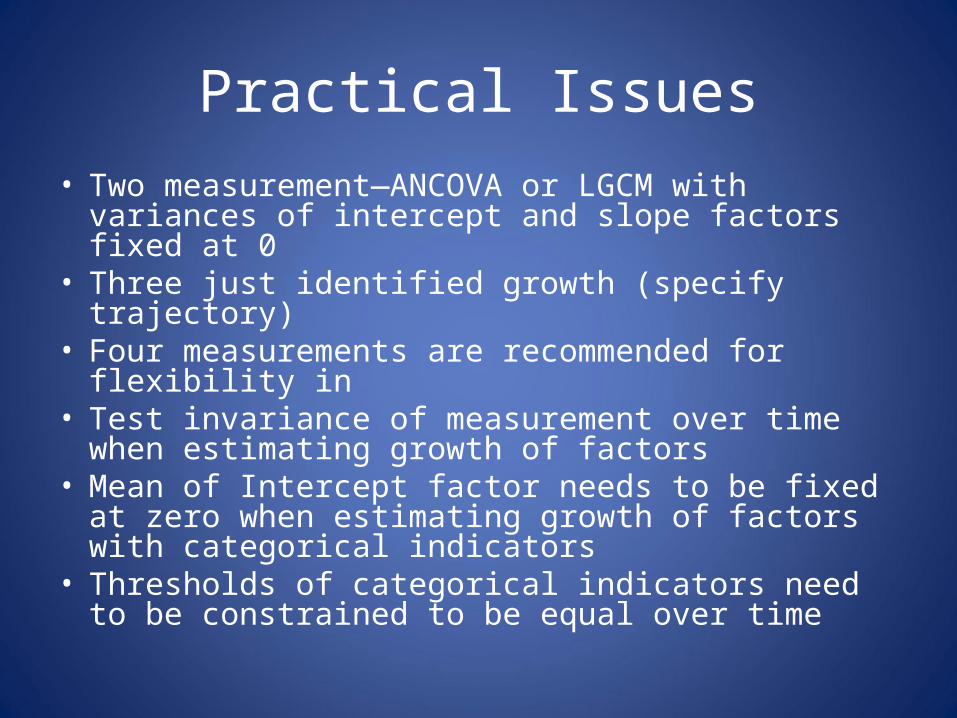
Practical Issues• Two measurement—ANCOVA or LGCM with variances
of intercept and slope factors fixed at 0• Three just identified growth (specify trajectory)• Four measurements are recommended for flexibility in • Test invariance of measurement over time when
estimating growth of factors• Mean of Intercept factor needs to be fixed at zero
when estimating growth of factors with categorical indicators
• Thresholds of categorical indicators need to be constrained to be equal over time
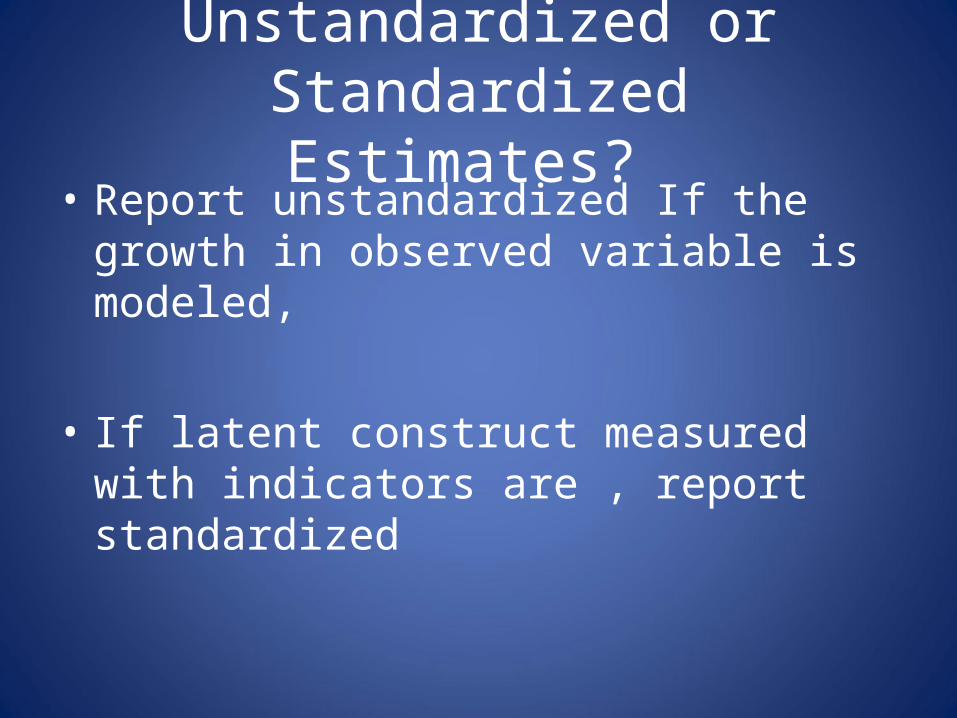
Unstandardized or StandardizedEstimates?
• Report unstandardized If the growth in observed variable is modeled,
• If latent construct measured with indicators are , report standardized

Resources• Bollen K. A., & Curren, P. J. (2006). Latent curve models: A structural
equation perspective. John Wiley & Sons: Hoboken, New Jersey• Duncan, T. E., Duncan, S. C., Strycker, L. A., Li, F., & Alpert A. (1999). An
introduction to latent variable growth curve modeling: Concepts, issues, and applications. Lawrence Erlbaum Associates, Publishers: Mahwah, New Jersey
• www.statmodel.com Search under paper and discussion for papers and answers to problems
Practice
1. Estimate an unconditional growth model 2. Compare various trajectories, linear, curve,
or unknown to determine which growth model fit the data best
3. Incorporate covariates4. Use sex or race as grouping variable and test
if the two groups have similar slopes.5. Explore mixture growth modeling