Embed Size (px)
Citation preview

355
Mitosis in the Mouse:A Study of Living and Fixed Cells in Tissue Cultures ,
BY
HONOR B. FELL
(FoulerUm Research Fellow, Royal Society}
A N D
A. F. HUGHES(Sir Halley Stewart Fellow)
{From the Strangeuiays Research Laboratory, Cambridge)
With eight Plates
INTRODUCTION
BY means of phase contrast cine-photomicrography applied to tissuecultures it has become possible to study the division of living vertebrate
cells in much greater detail than hitherto. Observations have already beenmade by these methods on mitosis in chick cells (Hughes and Swann, 1948;Hughes and Fell, 1949) and in amphibian tissue (Hughes and Preston, 1949).The present authors have extended these investigations to mammalian cells,using cultures of new-born mouse tissues, mainly of the spleen and kidney.In this material prophase can be identified in the living cultures at a very earlystage and mitosis followed to its completion. Mouse cultures are characterizedby a wide variation in cell size; investigations showed that the larger cells arepolyploid. The first part of this paper describes the course of normal mitosisand is based on the study of both living and fixed preparations; the secondpart records the evidence for the polyploid nature of the large nuclei.
Normal mitotic cell division in tissue cultures has been investigated byseveral authors. One of the earliest accounts is that of Strangeways (1924)who made warm-stage observations on mitosis in chick fibroblasts. Theearlier work on mitosis in tissue culture has been fully reviewed by Levi(1934). Some more recent studies by W. H. Lewis (1940) are discussed inthe text.
The literature on the chromosome cytology of the mouse has been cited byGriineberg (1943); the most recent publication on this subject is that ofMatthey (1936). In Mus musculus the diploid number of chromosomes is 40and the attachment to the spindle (centromere) is subterminal.
In their research H. B. F. was responsible for the tissue culture and thepreparation and study of the fixed material. The photography was by A. F. H.and the analysis of the film records was the joint work of both authors.[Quarterly Journal Microscopical Science, Vol. 90, part 4, December, 1949.]
356 Fell and Hughes—Mitosis in the Mouse
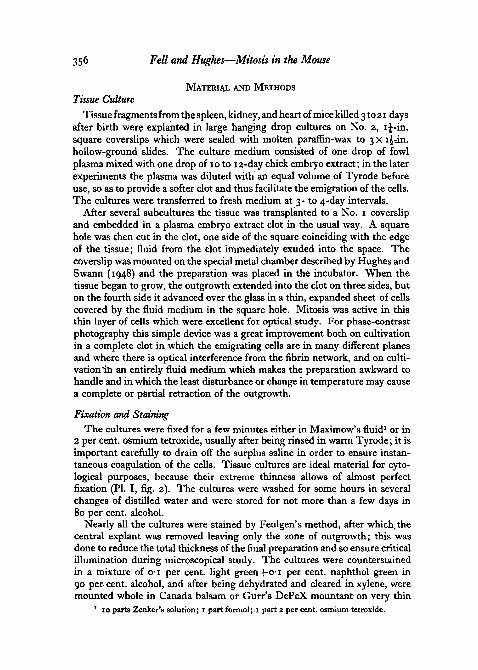
MATERIAL AND METHODS
Tissue Culture
Tissue fragments from the spleen, kidney, and heart of mice killed 3 to 21 daysafter birth were explanted in large hanging drop cultures on No. 2, ij-in.square coverslips which were sealed with molten paraffin-wax to 3 x i\-j.n.hollow-ground slides. The culture medium consisted of one drop of fowlplasma mixed with one drop of 10 to 12-day chick embryo extract; in the laterexperiments the plasma was diluted with an equal volume of Tyrode beforeuse, so as to provide a softer clot and thus facilitate the emigration of the cells.The cultures were transferred to fresh medium at 3- to 4-day intervals.
After several subcultures the tissue was transplanted to a No. 1 coverslipand embedded in a plasma embryo extract clot in the usual way. A squarehole was then cut in the clot, one side of the square coinciding with the edgeof the tissue; fluid from the clot immediately exuded into the space. Thecoverslip was mounted on the special metal chamber described by Hughes andSwann (1948) and the preparation was placed in the incubator. When thetissue began to grow, the outgrowth extended into the clot on three sides, buton the fourth side it advanced over the glass in a thin, expanded sheet of cellscovered by the fluid medium in the square hole. Mitosis was active in thisthin layer of cells which were excellent for optical study. For phase-contrastphotography this simple device was a great improvement both on cultivationin a complete clot in which the emigrating cells are in many different planesand where there is optical interference from the fibrin network, and on culti-vation'ill an entirely fluid medium which makes the preparation awkward tohandle and in which the least disturbance or change in temperature may causea complete or partial retraction of the outgrowth.
Fixation and StainingThe cultures were fixed for a few minutes either in Maximow's fluid1 or in
2 per cent, osmium tetroxide, usually after being rinsed in warm Tyrode; it isimportant carefully to drain off the surplus saline in order to ensure instan-taneous coagulation of the cells. Tissue cultures are ideal material for cyto-logical purposes, because their extreme thinness allows of almost perfectfixation (PI. I, fig. 2). The cultures were washed for some hours in severalchanges of distilled water and were stored for not more than a few days in80 per cent, alcohol.
Nearly all the cultures were stained by Feulgen's method, after which, thecentral explant was removed leaving only the zone of outgrowth; this wasdone to reduce the total thickness of the final preparation and so ensure criticalillumination during microscopical study. The cultures were counterstainedin a mixture of o-i per cent, light green+o-i per cent, naphthol green in90 per cent, alcohol, and after being dehydrated and cleared in xylene, weremounted whole in Canada balsam or Gurr's DePeX mountant on very thin
1 10 parts Zenker's solution; i part formol; i part z per cent, osmium tetroxide.

Fell and Hughes—Mitosis in the Mouse 357
slides. A few preparations were made in which the cultures were hydrolysedas for Feulgen's method and then stained in well-ripened Ehrlich's haema-toxylin (Hughes and Fell, 1949).
PhotographyThe photographic records of the cultures were made at two magnifications.
Fields of up to 100 cells were photographed at a total magnification of X 50.These low-power pictures were taken on 3 5-mm. film with apparatus designedand used by the late Dr. R. G. Canti and loaned by the British Empire CancerCampaign. The Canti machine is now installed at the Strangeways Labora-tory and has been modified for phase-contrast photography. The recordswere made on Kodak 'Microfile' film with a Xio phase-contrast objective;the source of light was a ribbon filament lamp, with a green filter. The intervalbetween exposures was either 1 or z\ minutes; photography was continuedfor 2 days.
Single cells were photographed at high magnification on 16-mm. film bya .technique which has already been described in detail (Hughes, 1949).Usually a cell in early prophase was chosen and was followed through mitosisfor 1-4 hours. The interval between photographs varied from 1 to 6 seconds.
All the objectives and condensers used were manufactured by Messrs.Cooke, Troughton & Simms, Ltd.
Analysis of Film RecordsThe analysis of the film records is one of the most important and difficult
parts of the cinematographic technique. Usually projection at 16 frames persecond is too rapid for the detailed study of particular features in cellularprocesses. On the other hand, the observation of individual frames one ata time is inadequate, as projection in motion is necessary to appreciate theinterrelation of adjacent structures.
Recently a 'Craig' Projecto-Editor, generously presented to the Laboratoryby the Rockefeller Foundation, has proved of the utmost value in film analysis.With this instrument motion projection at any speed in either direction can becombined with the viewing of single frames. In our opinion this is a necessarypiece of apparatus to obtain the best results from film records.
Comparison of the Living with the Fixed NucleusIn some cultures the same cell was photographed in three different ways:
(1) by phase contrast in life, (2) by phase contrast after fixation in 2 per cent,osmium tetroxide, and (3) by ordinary illumination after being stained byeither Feulgen's method or Ehrlich's haematoxylin. The procedure wasrepeated with cells at different stages of mitosis. Two sets of such photo-graphs are shown in PI. I.
Fixation with osmium produces an almost negligible amount of distortionof the nucleus as is shown by the photographs of an interphase nucleus onPL I, fig. 2. The chfomocentres and chromonemata (see p. 359 below) are in
358 Fell and Hughes—Mitosis in the Mouse
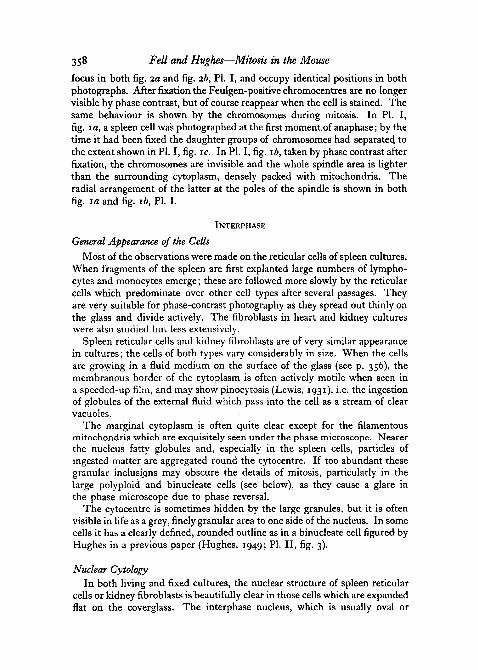
focus in both fig. za and fig. 2b, PI. I, and occupy identical positions in bothphotographs. After fixation the Feulgen-positive chromocentres are no longervisible by phase contrast, but of course reappear when the cell is stained. Thesame behaviour is shown by the chromosomes during mitosis. In PI. I,fig. 1 a, a spleen cell was photographed at the first moment of anaphase; by thetime it had been fixed the daughter groups of chromosomes had separated tothe extent shown in PI. I, fig. ic. In PI. I, fig. ib, taken by phase contrast afterfixation, the chromosomes are invisible and the whole spindle area is lighterthan the surrounding cytoplasm, densely packed with mitochondria. Theradial arrangement of the latter at the poles of the spindle is shown in bothfig. 1a and fig. 16, PI. I.
INTERPHASE
General Appearance of the Cells
Most of the observations were made on the reticular cells of spleen cultures.When fragments of the spleen are first explanted large numbers of lympho-cytes and monocytes emerge; these are followed more slowly by the reticularcells which predominate over other cell types after several passages. Theyare very suitable for phase-contrast photography as they spread out thinly onthe glass and divide actively. The fibroblasts in heart and kidney cultureswere also studied but less extensively.
Spleen reticular cells and kidney fibroblasts are of very similar appearancein cultures; the cells of both types vary considerably in size. When the cellsare growing in a fluid medium on the surface of the glass (see p. 356), themembranous border of the cytoplasm is often actively motile when seen ina speeded-up film, and may show pinocytosis (Lewis, 1931), i.e. the ingestionof globules of the external fluid which pass into the cell as a stream of clearvacuoles.
The marginal cytoplasm is often quite clear except for the filamentousmitochondria which are exquisitely seen under the phase microscope. Nearerthe nucleus fatty globules and, especially in the spleen cells, particles ofingested matter are aggregated round the cytocentre. If too abundant thesegranular inclusions may obscure the details of mitosis, particularly in thelarge polyploid and binucleate cells (see below), as they cause a glare inthe phase microscope due to phase reversal.
The cytocentre is sometimes hidden by the large granules, but it is oftenvisible in life as a grey, finely granular area to one side of the nucleus. In somecells it has a clearly defined, rounded outline as in a binucleate cell figured byHughes in a previous paper (Hughes, 1949; PI. II, fig. 3).
Nuclear CytologyIn both living and fixed cultures, the nuclear structure of spleen reticular
cells or kidney fibroblasts is beautifully clear in those cells which are expandedflat on the coverglass. The interphase nucleus, which is usually oval or

0173 /
Fell and Hughes—Mitosis in the Mouse 359
rounded, contains from 3 to 7 nucleoli varying greatly in size and shape. Inlife the nucleoli appear dark grey by phase contrast and do not change theirform and relative positions; sometimesthey contain vacuoles similar to thosedescribed by Lewis (1943). 2[ (A)
Feulgen-positive heterochromatic 4 (j\granules, the chromocentres, which 106 ^look almost black in the living cell, arestuck to the nucleoli and to the innersurface of the nuclear membrane; asimilar appearance has been describedby Ludford, Smiles, and Welch (1948)in mouse tumour cells. These chromo-centres range in number from about ^10 to 72; when only a few are presentthey are much larger than when thereare many, which suggests that thelarge bodies are formed by the fusionof several small heterochromatic gran-ules. In Table I are listed the numberof chromocentres in 21 interphase nu-clei. Five nuclei (marked) were muchbigger than the rest; one of them hadonly 25 chromocentres which, however,were very large, but the remaining 4contained many (36-72). In Feulgenpreparations of well-fixed cells theground substance of the nucleus, whichstains pale pink, seems almost homo-geneous at first sight. Close inspectionwith a high-power apochromat, how-
394
0n
212 ,
n 0398 r\
ever, shows it to consist of a mass offaintly granular filaments, the chromo-nemata, which are particularly clearin cultures fixed with 2 per'cent,osmium tetroxide (PI. II, fig. 4). Thechromonemata are attached to thechromocentres and are always moredistinct near the point of attachmentthan elsewhere; parts of the chromonemata are visible in life in a large, well-flattened cell (cf. Ludford et al, 1948), especially near the union of the threadswith the chromocentres. There appears to be considerable variation in thevisibility of chromocentres and chromonemata in interphase nuclei. Whensearching in living cultures for cells in early prophase we have often foundnuclei containing obvious filaments and granules and have followed them for
46TEXT-FIG, I . Diagram of cell lineages from
a spleen culture, photographed at low power.Each A represents a mitosis, and the verticallines intermitotic periods. For each parentnucleus in early prophase the outline is given,together with the nuclear area in square mi-crons, (a) Lineage of a cell with a medium-sized nucleus. (6) Lineage of a binucleate cell,the descendants of which had large nuclei.
360 Fell and Hughes—Mitosis in the Mouse
as long as 1 hour, during which time they remained unchanged. Such nucleimay possibly be approaching mitosis.
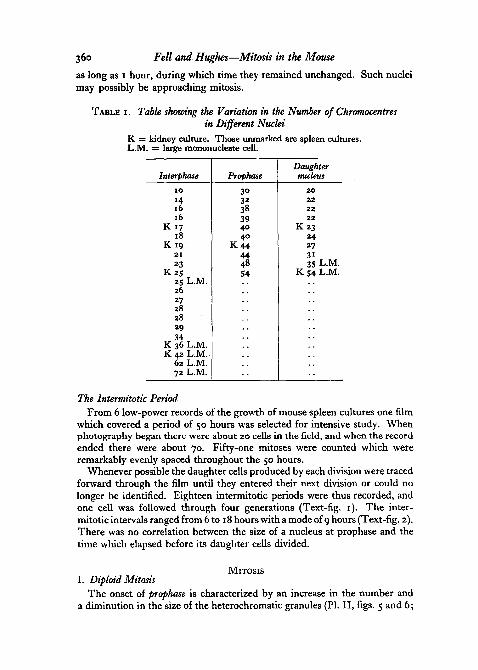
TABLE I . Table showing the Variation in the Number of Chromocentresin Different Nuclei
K = kidney culture. Those unmarked are spleen cultures.L.M. = large mononucleate cell.
Interphase
1 0
Hl 616
K 1 718
K 192 1
23Kzs
25 L.M.2627282829
K 36 L.M.K 42 L.M.
62 L.M.72 L.M.
Prophase
303238394040
K 4 4444854
Daughternucleus
2 02 22 22 2
K 2 324273135 L.M.
K 54 L.M.
The Intermitotic PeriodFrom 6 low-power records of the growth of mouse spleen cultures one film
which covered a period of 50 hours was selected for intensive study. Whenphotography began there were about 20 cells in the field, and when the recordended there were about 70. Fifty-one mitoses were counted which wereremarkably evenly spaced throughout the 50 hours.
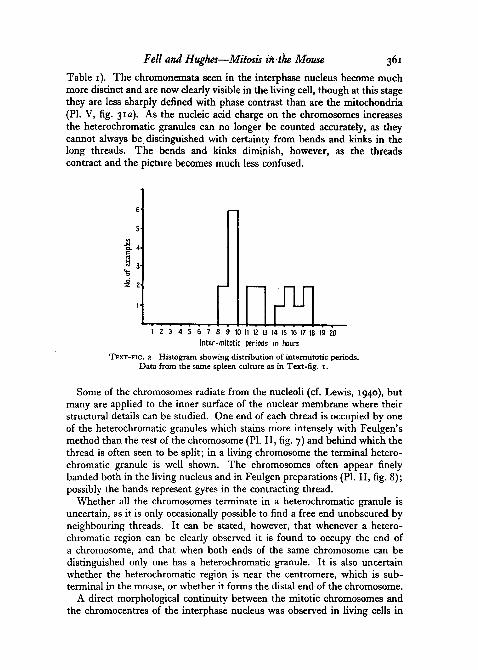
Whenever possible the daughter cells produced by each division were tracedforward through the film until they entered their next division or could nolonger be identified. Eighteen intermitotic periods were thus recorded, andone cell was followed through four generations (Text-fig. 1). The inter-mitotic intervals ranged from 6 to 18 hours with a mode of 9 hours (Text-fig. 2).There was no correlation between the size of a nucleus at prophase and thetime which elapsed before its daughter cells divided.
MITOSISI. Diploid Mitosis
The onset of prophase is characterized by an increase in the number anda diminution in the size of the heterochromatic granules (PI. II, figs. 5 and 6;
Fell and Hughes—Mitosis iii the Mouse 361
Table 1). The chromonemata seen in the interphase nucleus become muchmore distinct and are now clearly visible in the living cell, though at this stagethey are less sharply denned with phase contrast than are the mitochondria(PI. V, fig. 31a). As the nucleic acid charge on the chromosomes increasesthe heterochromatic granules can no longer be counted accurately, as theycannot always be distinguished with certainty from bends and kinks in thelong threads. The bends and kinks diminish, however, as the threadscontract and the picture becomes much less confused.
f1 2 3 4 5 6 7 8 9 10 11 12 13 14 15 16 17 18 19 20
Inter-mitotic periods in hours
TEXT-FIG. 2. Histogram showing distribution of interrrutotic periods.Data from the same spleen culture as in Text-fig. I.
Some of the chromosomes radiate from the nucleoli (cf. Lewis, 1940), butmany are applied to the inner surface of the nuclear membrane where theirstructural details can be studied. One end of each thread is occupied by oneof the heterochromatic granules which stains more intensely with Feulgen'smethod than the rest of the chromosome (PI. II, fig. 7) and behind which thethread is often seen to be split; in a living chromosome the terminal hetero-chromatic granule is well shown. The chromosomes often appear finelybanded both in the living nucleus and in Feulgen preparations (PI. II, fig. 8);possibly the bands represent gyres in the contracting thread.
Whether all the chromosomes terminate in a heterochromatic granule isuncertain, as it is only occasionally possible to find a free end unobscured byneighbouring threads. It can be stated, however, that whenever a hetero-chromatic region can be clearly observed it is found to occupy the end ofa chromosome, and that when both ends of the same chromosome can bedistinguished only one has a heterochromatic granule. It is also uncertainwhether the heterochromatic region is near the centromere, which is sub-terminal in the mouse, or whether it forms the distal end of the chromosome.
A direct morphological continuity between the mitotic chromosomes andthe chromocentres of the interphase nucleus was observed in living cells in
362 Fell and Hughes—Mitosis in the Mouse
tissue culture by W. H. Lewis (1940). This author, however, does not dis-tinguish between the Feulgen-positive chromocentres and the Feulgen-negative nucleoli and applies the latter term to all intranuclear granules. Itseems clear, however, that the 'small nucleoli' of Lewis which were seen to bein structural continuity with certain chromosomes correspond to the chromo-centres in our material, and that the chromosomes which seemed to developfrom the large nucleoli in his cells were, in fact, associated with the chromo-centres sticking to the surface of the nucleoli.
Our films show that in early prophase the nucleus often revolves. Therotation usually occurs in greatly expanded cells and seems to be associatedwith the spindle, since the asters often appear shortly after it has taken place.It is possible that the nucleus is rotated by the spindle material forcing its waybetween the nuclear and cell membranes, which in very flattened cells areseparated by a mere film of cytoplasm. As the chromosomes acquire theirnucleic acid charge the heterochromatic region ceases to be distinguishable,and the longitudinal split dividing each chromosome into two chromatids isnow obvious in stained cultures (PI. II, fig. 8). In the living cell the split inthe chromosomes is usually first seen nearer metaphase (PI. V, fig. 31c).
In favourable cells the formation of the asters can be followed in somedetail (PI. V, fig. 31*); the process is particularly well seen in polyploid cells(PI. VI, fig. 32c). They first appear at the poles of the early prophase nucleusas rounded areas of dark granular cytoplasm similar to that of the cytocentreof interphase. In these areas the mitochondria and other cell inclusions soonacquire a radial orientation. The spindle is formed from the asters and some-times each half of the developing spindle produces a deep indentation of thenuclear membrane (PI. VI, fig. 32c). A few seconds later the nuclear mem-brane suddenly collapses and disappears, the nucleoli finally vanish and thecell enters metaphase (PI. V, fig. 3ic;Pl. II,figs, ioand n ) . At the time whenthe nuclear membrane vanishes the whole cell contracts. The extendedprocesses are withdrawn, and the surface area is reduced. In the living cellthe spindle is seen as a clear area surrounded by dark, rather granular cyto-plasm (PL V, fig. 3 id). The chromatids of each pair are now clearly separatedexcept at the centromere (PI. II, fig. 10), and for several minutes they move atrandom up and down the spindle (cf. Lewis, 1939; Hughes and Swann, 1948).In mouse cells the radial stage, characteristic of early metaphase in chickfibroblast cultures (Hughes and Fell, 1949), is only occasionally seen (PI. II,fig. 9). In the chick cells the spindle probably forms at right angles to theplane of the cover-slip and then rotates through 900 until it is parallel with thecover-slip, whereas in the mouse cells the spindle usually develops in the planeof the cover-glass from the beginning and there is no subsequent rotation.When a radial arrangement of the chromosomes is seen in exceptionalmouse cells the asters are not visible, being above and below the metaphaseplate.
The chromosomes soon become orientated near the equator, and after aninterval of 6 to 20 minutes anaphase begins (PI. V, fig. 31/; PI. II, fig. 12): the

Fell and Hughes—Mitosis in the Mouse 363
chromatids separate and pass to opposite poles of the spindle (PI. V, fig. 31^, h).A few minutes later the cytoplasm begins to constrict at the equator (PI. V,fig. 31A, i) and the cell enters telophase. Both anaphase and telophase areaccompanied by the usual cytoplasmic 'bubbling'.
Close attention was paid to the process of nuclear reconstruction as it is shownin Feulgen preparations, in the films, and by direct observation of the livingcells. The development of a living daughter nucleus from telophase until theend of the first few hours of interphase is illustrated in PI. VII, fig. 34; thearea of this nucleus (see p. 367) is plotted against time in Text-fig. 3.
As soon as the daughter chromosomes reach the poles they shorten andbecome closely packed together (PI. V, fig. 31A, and PI. ft, fig. 13). Suddenlythis chromosomal mass begins to swell; at the same time it unravels into a webof fine threads radiating in all directions from the oblong areas of refractile,chromatinic material which represent the original chromosome bodies(PI. VII, fig. 34c) and which in fixed preparations are still strongly Feulgen-positive (PI. II, figs. 14, 15).
In the film records it is sometimes possible to follow for a short time thetransformation of one or two individual daughter chromosomes in the com-pact group. The chromosome becomes very short and plump, then vacuolesappear in its substance and it rapidly dilates (cf. Lewis, 1940); at the sametime a delicate lattice-work of threads, closely associated with that of neigh-bouring chromosomes, is drawn out of the shrinking chromatinic material.At the interface between the chromosome and the cytoplasm, a sector of thenuclear membrane develops.
In Feulgen preparations the vacuoles which form in the interior of thechromosomes make them appear double (PI. II, fig. 15), but we are doubtfulwhether this apparent doubleness does, in fact, represent a split in preparationfor the next mitosis. The problem is being investigated further.
At first the young nucleus is a narrow body with an irregular outline, butas it continues to swell it assumes a smooth, oval contour (PI. VII, fig. 34c).The chromatinic areas become less refractile in the living cell and in fixedpreparations are seen to have lost much of their Feulgen positive charge,except in the terminal heterochromatic segment (PI. IV, fig. 25). They arerapidly replaced, however, by a more diffuse system of irregular lumps andstrands which occupy the greater part of the nucleus and which are muchmore clearly seen in the living nucleus (PI. VII, fig. 34c,/) by phase contrastthan in Feulgen preparations. The subsequent history of this system showsthat it represents the nucleolar material.
When the film records are traced backwards, the nucleolar material seemsto form at the sites of the original chromosomes, but the close study of anunusually favourable record indicated that the chromatic material disappearsbefore the nucleolar substance becomes visible. The surface of the developingnucleoli is studded with dark heterochromatic granules from each of whichfine filaments emerge, so that the nucleolar components are knit together byan intricate mesh of threads (PI. VII, fig. 34^, g). Other heterochromatic
364 Fell and Hughes—Mitosis in the Mouse
granules adhere to the nuclear membrane. It is noteworthy that throughoutthe nucleus most of the threads appear taut, as if under tension. The hetero-chromatic granules are intensely Feulgen-positive in fixed preparations;although most of the chromosomes have now shed nearly all their nucleic acidcharge, a few of those, attached to the nucleoli lost it much more slowly thanthe others.
The larger nucleolar masses form where the greatest number of chromo-somes are aggregated. As time goes on, the nucleoli become even morerefractile and less diffuse (PI. VII, fig. 34^, h).
Although the nucleus continues to swell, during the later stages of recon-struction there is little, if any, increase in size of the nucleoli, which thereforeoccupy a diminishing proportion of the nuclear volume. As a result, there isan extensive rearrangement of the nuclear contents (PI. VII, fig. 34J-&) whichis interesting to watch in the film records. Sometimes two nucleolar masseswhich were originally close together move apart and the chromosome threadsconnecting them are then drawn out to several times their previous length;elsewhere the nucleolar substance may retract from the margin of the nucleus,leaving behind a chromocentre stuck to the nuclear membrane. Meanwhile thenucleoli change their appearance; as they become more refractile, the diffuse,straggling nucleolar system of the young daughter nucleus becomes transformedinto the compact, rather rounded masses characteristic of interphase (PI. VII,fig. 34&). At the same time the chromosome threads become less conspicuousand the chromocentres to which they are attached more distinct both in lifeand in Feulgen preparations (PI. IV, fig. 27). Finally the nucleus ceases toenlarge and the mature interphase condition has been reached (Text-fig. 3).
We tentatively suggest the following interpretation of some of the appear-ances seen in nuclear reconstruction. In early telophase the compactlyarranged chromosomes swell, presumably by imbibition of water, and are thusbrought into even more intimate contact than before. The nuclear membraneforms at the interface between the chromosomes and the cytoplasm; thenucleus then rapidly dilates and the chromosomes are forced apart by theexpansion. At the same time the chromosomes begin to lose their nucleicacid charge and their structure becomes looser, as indicated by the smallvacuoles which appear within them (cf. Wilson, 1925, pp. 134-8). Thechromosomes seem to adhere to each other, to the nuclear membrane, and tothe developing nucleoli, so.that when they are thrust apart by the dilation ofthe nucleus, it is possible that their complex adhesions may cause loops of theirchromonemata to be dragged out in all directions by the intranuclear tensionsand thus form the delicate web of threads so beautifully seen in the living aswell as in the fixed cell (PI. IV, fig. 25; PI. VII, fig. 34^); as mentioned above,the general straightness of the threads suggests that they are being held tautby mechanical forces. It must be emphasized that this explanation of thearrangement of the fine filaments is mere hypothesis as the fibres are too nearthe limits of resolution for their detailed structural relations to be determinedby ordinary microscopical observation.

Fell and Hughes—Mitosis in the Mouse 365
i t . Heteroploid MitosisThe spleen reticular cells and kidney fibroblasts in the zone of outgrowth
may be classified in three groups:
1. Mononucleate cells of medium size which are probably diploid andwhich form the greater part of the cell population (PI. II, figs. 3 and 4).
450"
400'
350
300
250
§•200
150
MOO
3Hours
T E X T - F I G . 3. Nuclear area of a cell du r ing mitosis, (a) that of the paren t cell in p rophase ,(6) that of one daughte r cell in telophase and early interphase (this daugh te r cell is shown inPI. VII).
2. Large mononucleate cells, which appear to have more than the normalnumber of chromosomes, i.e. to be heteroploid (PI. I l l , figs. 16, 18,and 19).
3. Binucleate cells with either medium or large nuclei (PI. I l l , fig. 17).
The observations we are about to describe suggest that these groups arenot distinct cell types but are produced by variations in the mitotic process.
1. The formation of a binucleate cell. Of 51 mitoses Tecorded in a spleenculture photographed at low magnification for 50 hours, one produced abinucleate cell (PI. IV, fig. 30, compare PI. IV, figs. 24 and 29). Division wasapparently normal, but cytoplasmic cleavage was not completed and thedaughter cells reunited (cf. Strangeways, 1924; Fell and Andrews, 1927).

366 Fell and Hughes—Mitosis in the Mouse
If the incidence of mitosis without effective cleavage is of the order of1 in 50, as this record would suggest, the rate of formation would not accountfor all the binucleate cells seen in the outgrowth during a single 3- to 4-daypassage. It is probable that many binucleate cells survived from previouspassages and some may have emigrated from the explant.
In normal mitosis the daughter cells often remain connected by the inter-zonal strand for some time (PI. V, fig. 317) and while such continuity persists,reunion is always possible. Binucleate cells can be artificially produced byexposing a dividing cell to strong illumination which often suppresses cleavagecompletely.
2. Mitosis in binucleate cells. Six records of binucleate cells in prophasehave been obtained, in all of which one spindle was formed and both sets ofchromosomes joined a single metaphase plate (PI. VIII, figs. 36 and 37). Oneof the cells was fixed at this stage. In two records anaphase was followed bycleavage and two abnormally large mononucleate daughter cells resulted(PI. VIII, fig. 36); one of the films was made under low magnification and thedaughter cells were followed through two subsequent generations of mono-nucleate cells (see p. 360 and Text-fig. 1).
In three of the records, mitosis did not end in cleavage and a binucleate cellwas again formed. The chromosomes were very distinct in one of these cellswhich contained few cytoplasmic granules (PI. VIII, fig. 37). They becamearranged on a metaphase plate where they remained for 35 minutes; animperfect anaphase ensued in which the chromatids moved an abnormallyshort distance apart and in which one half of the spindle seemed to be defec-tive, since both groups shifted in the same direction across the field. Duringthe next half-hour daughter nuclei were reconstructed from the tetraploidgroups of chromosomes. In this way a cell with two diploid nuclei was con-verted into one with two tetraploid nuclei.
In a fixed preparation a cell was encountered containing two separatespindles each with a metaphase plate, but unfortunately we have no cinerecords of mitosis of this type. There may be other unrecorded variants ofmitosis in binucleate cells.
We have no evidence of the fusion of nuclei in binucleate cells duringinterphase. Very large nuclei containing many nucleoli have occasionallybeen seen in which the nuclear membrane showed an equatorial infoldingwhich might have represented a stage in the fusion of two nuclei; althoughone such nucleus was watched for several hours it gave no indication thatfusion was in progress.
3. Mitosis in large mononucleate cells. Several records were made of-thedivision of large mononucleate cells similar to those which may result fromthe fusion of a binucleate element. The appearance of the nuclei at prophasesuggests that they contain more than the diploid number of chromosomes(PI. VI, fig. 32a and b).
In living cells, several details at this stage were more clearly seen in hetero-ploid than in diploid elements. Thanks to the larger size of the former, it was
Fell and Hughes—Mitosis in the Mouse 367
easily possible to focus separately on the interior of the nucleus and at the levelof the nuclear membrane (PI. VI, figs. 336 and c). The position of chromone-mata and chromocentres on1 the inner surface of the nuclear membrane wasthus quite clear. The asters appeared either in polar indentations of thenuclear membrane as described above (PI. VI, fig. 32c), or asymmetrically toone side of the nucleus (PI. VIII, fig. 35c).
Between prophase and metaphase the movements of the chromosomes inrelation to the asters and spindle were clearly seen in these large nuclei(PI. VI, fig. 32 c-f). Before the nuclear membrane had vanished the chromo-somes crowded towards the two poles, giving a spurious effect of anaphase(PI. VIII, fig. 356; PI. I l l , fig. 21). When the membrane had gone and thespindle had formed, the numerous and rather widely scattered chromosomesmoved towards the spindle (PI. VI, figs. 32^:-^). These facts suggest that thechromosomes are drawn in some way towards the asters and spindle. Thespindle was of normal size, and during metaphase seemed over-crowded withchromosomes. Anaphase, telophase, and cleavage proceeded normally insuch cells, and two large daughter cells were produced in the example shownin PI. VIII, fig. 35.
Attempts were made to count the chromosomes in fixed and stained pre-parations of these large cells. Tissue cultures are very unfavourable forchromosome counts, however, because as already stated the metaphase plateusually lies at right angles to the plane of the coverslip. All our counts werealmost certainly too low, but they showed that many more than the diploidnumber of chromosomes were present.
4. Observations on nuclear size. The results described above implied thatin cells of the same histological type, the size of the nucleus, at the same pointin the mitotic cycle, is related to the number of its chromosomes (comparePI. II, fig. 10, and PI. IV, fig. 22; also in PI. IV, fig. 25 with fig. 26, and fig. 27with fig. 28).
The areas of a number of living nuclei in early prophase, including some ofthe largest, were measured in the following way. From each of twenty-tworecords of mitotic cells made at high magnification, a frame in prophase wasselected before the nuclear membrane had begun to contract. This wasprojected at a total magnification of X 2,000, and the area bounded by thenuclear membrane was measured with a planimeter. The nuclear volumecould not be estimated as it is impracticable to measure the depth of so thina structure as the nucleus of a flattened tissue culture cell. It is reasonable toassume, however, that a relationship exists between the volume and the areaof the projected nuclear image, which for convenience is termed 'the nucleararea'. The measurements were restricted to well-flattened spleen reticularcells.
The results are listed in Table 2. It will be seen that the nuclear areasrange from 198 to 625 sq. /u. The difference in volume between the large andmedium-sized nuclei is greater than the projected areas suggest, since thelarge prophase nuclei are thicker than the smaller ones, as shown by the fact

368 Fell and Hughes—Mitosis in the Mouse
that in the former it is possible to focus separately on the nuclear membraneand internally at the level of the nucleoli.
TABLE 2. Data from 19 Records of Mitosis in Cells of Mouse Spleen
The area of the nucleus in prophase at the beginning of the record and the durationof each phase of division is given.
MV. 2i Bs S my -a, S <3.S
Time of phases in minutes
O $
IPIType of cell
3456789
10
19821522924925527027229631s333
1325 94-0
1285 9
30019-0198zi-418-8
5-8415-85-85-5
io-oi3-36-64-4
i5'3n-61982O-On-61807-4.5-7
I2-O94
5°4'4393"544486-65'350
5 4
3-84'iS-65-54148
— i2-44087
9397
138244
9720-4
> 1
15620326-3
Medium mono-nucleate
14IS16
42045146s465575625
528
2I-O
8037-8
4465
i i - i824-3
186155i4'o
39>i4-8
4957776-4
546-56-87"3
40-01304-2
11-2
Large mono-nucleate
33O(both)
384(both)
443(both)
io-6
2O'O
30
1 7 5 61
1030
9-2 24-2Binucleatewith cleavage
No cleavage
6 0 3 9 0
The following observations show that a difference in nuclear size betweentwo cells of the same culture may persist in their descendants through severalgenerations. As already stated, one of the low-power cine records was analysedexhaustively and a few cell families were traced through several mitoses. Thenuclear areas at prophase were measured throughout two of these lineages;the parent of one family was a medium-sized mononucleate reticular cell, andthat of the other a binucleate cell of the same type, to which reference hasalready been made (p. 366), and in which the two interphase nuclei fused inlate prophase.
Selected frames of the film were projected at a total magnification of X 600,and the outlines of the nuclei were traced on squared paper. The data thus
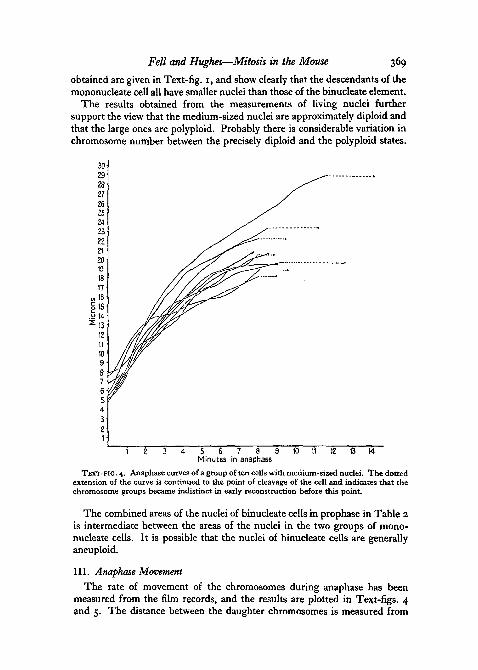
Fell and Hughes—Mitosis in the Mouse 369
obtained are given in Text-fig. 1, and show clearly that the descendants of themononucleate cell all have smaller nuclei than those of the binucleate element.
The results obtained from the measurements of living nuclei furthersupport the view that the medium-sized nuclei are approximately diploid andthat the large ones are polyploid. Probably there is considerable variation inchromosome number between the precisely diploid and the polyploid states.
30
29
28
27
26
25
24
23
22
21
20
19
18
17
«16
§15.0 14S 1 3
1211109876S432
5 6 7 8 9Minutes in anaphase
10 11 12 13 M
TEXT-FIG. 4. Anaphase curves of a group of ten cells with medium-sized nuclei. The dottedextension of the curve is continued to the point of cleavage of the cell and indicates that thechromosome groups became indistinct in early reconstruction before this point.
The combined areas of the nuclei of binucleate cells in prophase in Table 2is intermediate between the areas of the nuclei in the two groups of mono-nucleate cells. It is possible that the nuclei of binucleate cells are generallyaneuploid.
III. Anaphase Movement
The rate of movement of the chromosomes during anaphase has beenmeasured from the film records, and the results are plotted in Text-figs. 4and 5. The distance between the daughter chromosomes is measured from
37° Pell and Hughes—Mitosis in the Mouse
the axial centromeres, i.e. from the surfaces of the chromosome groups whichface the spindle poles. The duration of the cytoplasmic cleavage is indicatedin Text-figs. 4 and 5; after this point nuclear reconstruction had begun,so that the distance measured no longer represents that between the cen-tromeres.
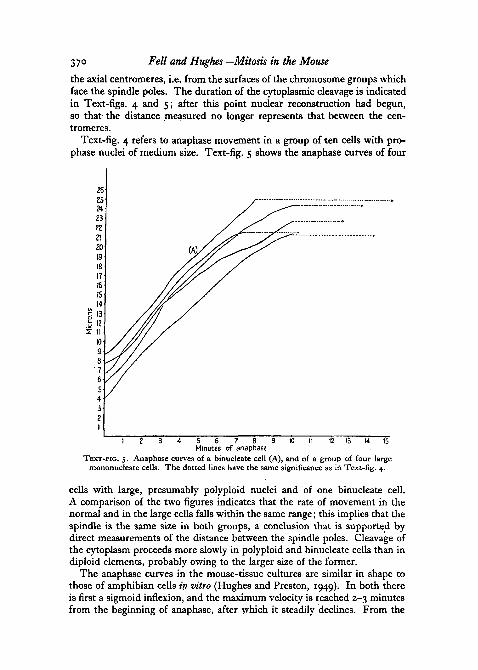
Text-fig. 4 refers to anaphase movement in a group of ten cells with pro-phase nuclei of medium size. Text-fig. 5 shows the anaphase curves of four
10 12 13 151 2 3 4 5 6 7 8 9Minutes of anaphase
TEXT-FIG. 5. Anaphase curves of a binucleate cell (A), and of a group of four largemononucleate cells. The dotted lines have the same significance as iri Text-fig. 4.
cells with large, presumably polyploid nuclei and of one binucleate cell.A comparison of the two figures indicates that the rate of movement in thenormal and in the large cells falls within the same range; this implies that thespindle is the same size in both groups, a conclusion that is supported bydirect measurements of the distance between the spindle poles. Cleavage ofthe cytoplasm proceeds more slowly in polyploid and binucleate cells than indiploid elements, probably owing to the larger size of the former.
The anaphase curves in the mouse-tissue cultures are similar in shape tothose of amphibian cells in vitro (Hughes and Preston, 1949). In both thereis first a sigmoid inflexion, and the maximum velocity is reached 2-3 minutesfrom the beginning of anaphase, after which it steadily declines. From the
Fell and Hughes—Mitosis in the Mouse 371
curves of diploid anaphase (Text-fig. 4), an average curve was calculatedgiving a maximum chromosome velocity of i-8/x per minute; in Rana andXenopus the maximum velocity is about 2-0/Lt per minute. The final distancebetween the daughter chromosome groups is similar in Mus, Rana, and Xeno-pus. The period from the beginning of anaphase to the end of cleavage inMus is intermediate between that in Rana and Xenopus.
In the chick (Hughes and Swann, 1948) the initial sigmoid inflexion is verysmall and the daughter chromosomes attain their maximum velocity of 4/i perminute almost as soon as their movement can be accurately measured. Twopossible reasons may be suggested for these differences between anaphasemovement in the chick and in other vertebrates. The tearing apart of thelong chromosome arms is amphibian and mouse mitosis may exert a drag onthe centromeres at early anaphase and thus retard their motion; alternativelythe spindle may be a better orientated structure in chick cells than in thoseof other animals. It is unlikely that the maximum rate of anaphase movementis governed by the size of the chromosomes, because in Amphibia, chromo-somes of widely different lengths move together with their centromeresranged on a regular arc.
IV. Duration of Mitotic PhasesThe duration of each phase of division was calculated from the cine records
and compared with measurements made from direct observation of the livingcells during photography. The results are expressed in Table 2.
In Table 2 the mitotic process is subdivided into six stages which, however,cannot be denned with equal precision. As the cell was already in prophasewhen photography began, the record of this phase of division is incomplete andthe longest period recorded is therefore the nearest approach to the true value.By the disappearance of the nucleoli is meant that stage in prophase when thechromosomes attached to the nucleoli become more conspicuous than thenucleolar material itself; these chromosomes remain associated for someminutes longer, however, and it is probable that the nucleoli do not finallydisappear until the chromosomes become free. The beginning of anaphasecan be determined to within one or two frames of the film. The end ofcleavage is usually sharply marked at the time when equatorial constrictionceases, although an isthmus of variable size may connect the daughter cells forsome time. The most difficult point to define is that when the nucleoli andchromocentres first become discrete structures; as described above, thenucleolar material is first distinguishable early in telophase before thechromosomes have completely shed their nucleic acid charge.
In Table 2 the total time occupied by division minus the duration ofprophase which has to be estimated (see above) is recorded for nineteen cellswhich are arranged in three groups according to the type of mitosis which theyundergo (see p. 365). In group I, the smaller mononucleate cells, mitosisproceeds faster than in the other groups. There is a larger scatter in theduration of each period in the large mononucleate cells of group II than in the

372 Fell and Hughes—Mitosis in the Mouse
smaller cells. The cycle of chromosome changes is slowest in the non-dividingbinucleate cells of group III.
DISCUSSION
Different methods of observation have led to divergent views on thestructure of the nucleus during interphase. The doctrine of chromosomecontinuity between successive divisions, although never doubted, was notsecurely based on direct observation. Although the earlier cytologists describedthe structure of the interphase nucleus as they saw it in fixed and stainedpreparations, in terms of chromosome continuity, their views on nuclear struc -ture were not accepted by students of the living cell. Thus Lewis and Lewis(1924) state that in the nuclei of living cells in tissue culture 'no linin networkor chromatin granules are to be seen. These are fixation, coagulation, orprecipitation products and do not represent living structures.'
This opinion, which was shared by most of those who worked with livingtissue cultures, was based on the fact that when living cells in cultures areexamined by ordinary direct illumination or by the dark-field method, onlythe nucleoli are visible and the ground substance appears optically homo-geneous. Moreover, M. H. Lewis showed that living cells could be gelated bytreatment with dilute acid which produced first a granulation and then acoarse reticulum in the nucleoplasm; under appropriate conditions thisgelation could be reversed, when the granules and reticulum disappeared.These interesting experiments naturally led to the conclusion that similarappearances in fixed preparations were artifacts and should be disregarded.
Use of the phase-contrast method suggests that the structures describedby earlier cytologists in fixed cells were only partly artificial. The statementthat the ground substance of the living nucleus is optically homogeneous is dueto the limitations of the microscopical methods previously available. It is wellknown that unstained structures are visible under the microscope by virtue ofdifferences in refractive index between them and their surroundings. Boththe ordinary bright-field and the dark-field microscopes are insensitive tosmall gradations of refraction. The dark-field microscope brilliantly revealssharp discontinuities of structure of which the nuclear membrane is anexample; as a result the nuclear membrane scatters the converging rays of thedark-field condenser so much that the fine detail in the nucleus does notdeflect enough light to be recognized.
These optical limitations of the bright and dark fields are largely overcomeby using the phase microscope. As described above, in the living interphasenucleus studied by this means, three types of structure are visible: (1) thenucleoli, (2) small dark granules, some adherent to the nucleoli and others tothe inner surface of the nuclear membrane, and (3) fine threads attached tothe small granules; the threads, which are the least conspicuous objects in theliving nucleus, are seen bestin a young cell which has recently divided. Whenthe same nucleus which has been observed and photographed in life is fixedwith osmium tetroxide and stained by Feulgen's method, very little distortion

Fell and Hughes—Mitosis in the Mouse 373
is produced; the small dark granules in the living nucleus are found to cor-respond with the Feulgen-positive chromocentres, and the delicate threadsemerging from them are seen to form part of an intricate mass of chromone-mata which in the Feulgen-stained nucleus are seen completely to fill the spacebetween the nucleoli and the nuclear membrane.
In the well-fixed cells composing the thin zone of outgrowth, the filamentousstructure in the nuclear ground substance is only revealed by careful scrutinyunder the most critical optical conditions. On the other hand, many of theinterphase nuclei left sticking to the glass after removal of the explant are lessperfectly fixed, owing to the slower penetration of the reagent in this part ofthe culture, and these often show a fine network resembling the linin reticulumdescribed by earlier workers. In our view, this appearance is caused by thedefective fixation of the chromonemata which have become irregularly clottedtogether instead of being evenly distributed in the nucleus in the normal way.Thus the linin network of the earlier observers may be regarded as a realcytological entity artificially distorted by fixation. Bensley (1933) showed thatnuclei fixed by the freeze- drying technique were similar in appearance to thosetreated with chemical fixatives, and concluded that the structures seen instained preparations of the nuclei were not mere fixative artifacts.
The structure and cytochemistry of the resting nucleus has recently beeninvestigated by Serra (1947) who concluded that 'mitotic chromosomesusually arise from resting nuclei of the thread type, that is from nuclei inwhich threads which take up chromatin dyes and give strong Feulgen andarginine reactions are conspicuous'.
The state of the chromosomes in the interphase nucleus has recently beeninvestigated by Ris and Mirsky (1949) who, like the earlier workers on tissuecultures, state that 'In the living interphase nucleus no chromosomal structuresare visible' (p. 500). As described above, in the living interphase nuclei ofmouse cells grown in vitro, phase contrast (not used by Ris and Mirsky)reveals fine threads which we regard as chromonemata; the threads areTnostdistinct in young daughter nuclei (PI. VII, fig. 34^ and k). In the maturenucleus they are usually best seen near their union with the chromocentres;precisely the same type of structure is visible in the nuclei after fixation withosmium or Maximow's fluid (PI. II, figs. 3 and 4); sometimes the samechromonema can be identified in a nucleus before and after fixation. In thefixed nucleus, however, the complete system of chromonemata is distin-guishable. The threads are faintly Feulgen-positive, and a small amount ofdesoxyribonucleic acid may have been deposited on them during fixation, asdescribed by Ris and Mirsky for fixatives other than osmium. As recordedabove, in the mouse cells during telophase each chromosome rapidly swellsand thus enters the 'extended state' of Ris and Mirsky, but in our material thechromonemata became clearly visible during the swelling process (see p. 363).
In certain plants the number of Feulgen-positive granules or chromocentresin the nucleus is approximately the same as that of the chromosomes(Wilson, 1925). Overton (1909) named them 'prochromosomes' and suggested
374 F£U and Hughes—Mitosis in the Mouse
that they were aggregates of residual chromatin around which the chromo-somes were formed early in prophase. Heitz (1928) showed that the pro-chromosomes were segments of the mitotic chromosomes, which retained thefull charge of nucleic acid in interphase. These segments were called 'hetero-chromatic'; Recent literature on the nature and function of 'heterochromatin'has been reviewed by Schultz (1947). The chromocentres of human tumourcells have been studied by Roller (1947) and those of mouse carcinomata byBiesele (19446).
A striking feature of the chromocentres is their apparent adhesiveness;they are always attached to the surface of either the nucleoli or the nuclearmembrane. This characteristic, which has also been noted by Vanderlyn(1946), is very conspicuous in the living mouse nuclei viewed with the phasemicroscope. There is almost no depth of focus with the phase microscope, sothat it is possible to focus separately on a number of planes even in so thina structure as the nucleus of a tissue-culture cell. On the surface of thenuclear membrane the mitochondria are seen, and a very slight movement ofthe fine adjustment reveals the chromonemata and chromocentres adherentto the inner surface of the membrane. In a large polyploid nucleus in earlyprophase, the focus can then be shifted to the level of the nucleoli, to whichother chromocentres are attached (PL VI, fig. 336 and c). This distributionof the chromocentres is less obvious in fixed and stained preparations, asfixation and dehydration shrink the nucleus in a direction vertical to the cover-slip. The nucleolar chromocentres remain stuck to the dwindling nucleoli late inprophase. The chromonemata become well charged with desoxyribonucleicacid before the nucleoli disappear, so that towards the end of prophase chromo-somes radiate from the nucleoli in the manner described by Lewis (1940).
If the heterochromatic segment of the chromosomes is adjacent to thecentromere, the attachment of the chromocentres to the nuclear membraneor nucleolus might be regarded as equivalent to the attachment of the chromo-somes to the spindle. Unfortunately, however, we have been unable to findconclusive evidence as to which end of the chromosome is occupied by theheterochromatic segment.
As described above, the so-called euchromatic region of the chromosome,which is adjacent to the heterochromatic segment, is reduced in interphase tothe residual chromonema by the loss of most of the nucleic acid charge. It isusually believed that this process is accompanied by an uncoiling of thechromonema: 'the change from metaphase to resting nucleus consistsspatially in an uncoiling and repacking of the chromosome thread' (Darlington,1937, p. 34). Conversely, in prophase the chromonema is thought to becomecoiled as it acquires its charge of nucleic acid. In our material the chromo-somes are too small for any coiling or uncoiling to be clearly distinguishable,but, as already stated, the mouse chromosomes in prophase often have a finelybanded appearance which may represent the gyres of a fine coil.
A relationship between nuclear size and chromosome content was firstnoted by Boveri (1905) in haploid, diploid, and tetraploid sea-urchin embryos.

Fell and Hughes—Mitosis in the Mouse 375
His observations were confirmed by Balzer (1910) and Herbst (1912), andsimilar conclusions were reached by Artom (1928) who studied diploid andtetraploid races of Artemia salina. In Amphibia, heteroploidy has beeninvestigated in great detail and the literature has recently been reviewed byFankhauser (1945)- Heteroploid division has also been described in normal
500
Heilberg "07
Jacoby '25
Voss '28
= . Miiller '37
450
400
350
300
I 250
H
o
o 200
150
100
503 ' 4 " 5 6 7 8 9 10 11 IZ 13 14 15
Diameter of nuclei in micronsTEXT-FIG. 6. Histograms of the nuclear diameter of cells of the mouse liver,
extracted from the data given by the authors indicated.
mammalian cells. It has been seen in human spermatogonia and spermato-cytes (Painter, 1923), in the rat liver (Biesele, 1944a) and in the embryonictissue of the mouse (Howard, personal communication).
The interphase nucleus of normal mammalian cells vary considerably insize and several authors, notably Jacoby (1925,1935), have attempted to showthat in distribution curves of nuclear sizes, there are modes which corre-spond to simple multiples of nuclear volume (ibid.). Nuclear size hasbeen studied in the liver of the mouse by Heiberg (1907), Jacoby (1925), Voss(1928), and Miiller (1937). The distribution curves of nuclear diametersderived from the data given by these authors are plotted in Text-fig. 6; it is

376 Fell and Hughes—Mitosis in the Mouse
hardly possible to identify the modes of these curves with degrees of hetero-ploidy. In the rat liver also, nuclear sizes have been investigated by Jacoby(1935) and by Beams and King (1942), but the curves obtained in these twostudies also fail to agree.
Biesele (1944a) made chromosome counts in rat liver and found a slightpreponderance of diploid over tetraploid nuclei in both the normal andregenerating tissue; the proportion of octoploid nuclei was much smaller.He also observed irregularities in chromosome number which were not exactmultiples of the haploid number and which are termed aneuploid. If aneu-ploid cells are fairly numerous, their presence must contribute to the difficultyof interpreting data on nuclear size. Our own observations suggest thataneuploid nuclei are fairly common in mouse tissue cultures.
Distribution curves of nuclear size can only indicate that a cell populationis not uniform and more direct evidence is needed before heterogeneity involume can be attributed to polyploidy. Such evidence was obtained byBeams and King (1942) in the regenerating liver of the rat. These authorsconcluded that tetraploid nuclei were formed by the mitosis of binucleatecells. Their description of this process, based on the study of stained prepara-tions, is exactly confirmed by our own observations on living mouse cellsin vitro. They also describe the formation of a cell with two tetraploid nucleifrom one with two diploid nuclei, by mitosis without cleavage; this, too, wehave observed in life (see p. 366). Formerly, nuclei of double size in the liverwere thought to arise by an amitotic process (Jacoby, 1925, 1935; Miiller,1937), a view which was discarded by Beams and King; we ourselves havenever seen amitotic division in vertebrate tissue cultures.
Our own observations on the formation of polyploid cells in tissue cultureswere made before we had read the paper by Beams and King. That similarresults should have been obtained in vivo shows that the variation in themitotic process whereby polyploid cells are produced is not an abnormalitypeculiar to tissue cultures. It would be interesting to know whether the originof polyploid from binucleate cells is a general phenomenon in mammaliantissues. Wherever binucleate and large mononucleate cells occur together,it may well be suspected that the latter originate from the former.
In the Insecta polyploidy is achieved by a quite different process, viz.'endomitosis'. Thus, in the nurse cells of the ovary of Drosophila, the chromo-somes split and double within the nuclear membrane during prophase(Painter and Reindorp, 1939). Biesele (1944^) suggested that in the nucleiof tumour cells chromosomes may double their size by an endomitoticprocess.
We are indebted to the Royal Society for a grant to cover the cost ofadditional plates, and to the Medical Research Council and the British EmpireCancer Campaign by whom the expenses of the research were defrayed. Wealso wish to thank our assistant, Mr. L. J. King, for his help with the tissuecultures.

Quart. Journ. Micr. Sci., Third Series, Vol. go
H. B. FELL AND A. F. HUGHES—P'

Quart. Journ. Micr. Set., Third Series, Vol. go
15 15H. B. FELL AND A. F. HUGHES—PLATE II
Quart. Journ. Micr. Set., Third Series, Vol. go
15*5
H. B. FELL AND A. F. HUGHES—PLATE III
Quart. Journ. Micr. Sci., Third Series, Vol. go
29H. B. FELL AND A. F. HUGHES—PLATE IV
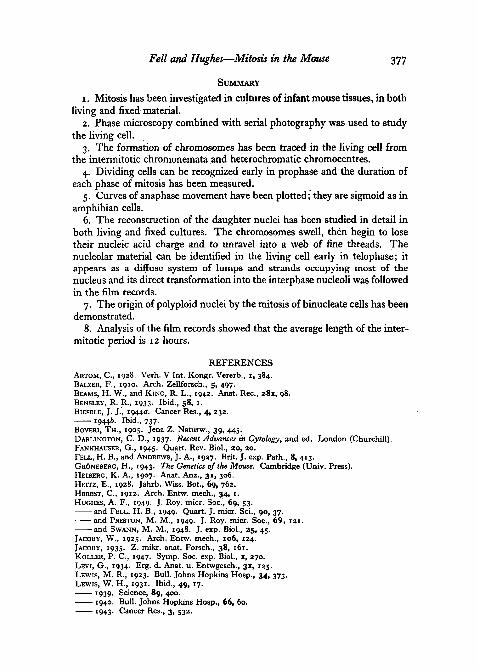
Fell and Hughes—Mitosis in the Mouse 377
SUMMARY
1. Mitosis has been investigated in cultures of infant mouse tissues, in bothliving and fixed material.
2. Phase microscopy combined with serial photography was used to studythe living cell.
3. The formation of chromosomes has been traced in the living cell fromthe intermitotic chromonemata and heterochromatic chromocentres.
4. Dividing cells can be recognized early in prophase and the duration ofeach phase of mitosis has been measured.
5. Curves of anaphase movement have been plotted; they are sigmoid as inamphibian cells.
6. The reconstruction of the daughter nuclei has been studied in detail inboth living and fixed cultures. The chromosomes swell, then begin to losetheir nucleic acid charge and to unravel into a web of fine threads. Thenucleolar material can be identified in the living cell early in telophase; itappears as a diffuse system of lumps and strands occupying most of thenucleus and its direct transformation into the interphase nucleoli was followedin the film records.
7. The origin of polyploid nuclei by the mitosis of binucleate cells has beendemonstrated.
8. Analysis of the film records showed that the average length of the inter-mitotic period is 12 hours.
REFERENCESARTOM, C, 1928. Verh. V Int. Kongr. Vererb., i, 384.BALZER, F., 1910. Arch. Zellforsch., 5, 497.BEAMS, H. W., and KING, R. L., 1942. Anat. Rec, 281, 98.BENSLEY, R. R., 1933. Ibid., 58, 1.BIESELE, J. J., 1944a. Cancer Res., 4, 232.
19446. Ibid., 737.BOVERI, TH., 1905. Jena Z. Naturw., 39, 445.DARLINGTON, C. D., 1937. Recent Advances in Cytology, 2nd ed. London (Churchill).FANKHAUSER, G., 1945. Quart. Rev. Biol., 20, 20.FELL, H. B., and ANDREWS, J. A., 1927. Brit. J. exp. Path., 8, 413.GRUNEBERG, H., 1943. The Genetics of the Mouse. Cambridge (Univ. Press).HEIBERG, K. A., 1907. Anat. Anz., 31, 306.HEITZ, E., 1928. Jahrb. Wiss. Bot., 69, 762.HERBST, C., 1912. Arch. Entw. mech., 34, 1.HUGHES, A. F., 1949. J. Roy. micr. Soc, 69, 53.
and FELL, H. B.( 1949. Quart. J. micr. Sci., 90, 37.and PRESTON, M. M., 1949. J. Roy. micr. Soc, 69, 121.and SWANN, M. M., 1948. J. exp. Biol., 25, 45.
JACOBY, W., 1925. Arch. Entw. mech., 106, 124.JACOBY, 1935. Z. mikr. anat. Forsch., 38, 161.ROLLER, P. C., 1947. Symp. Soc. exp. Biol., 1, 270.LEVI, G., 1934. Erg. d. Anat. u. Entwgesch., 31, 125.LEWIS, M. R., 1923. Bull. Johns Hopkins Hosp., 34, 373.LEWIS, W. H.( 1931. Ibid., 49, 17.
1939. Science, 89, 400.1940. Bull. Johns Hopkins Hosp., 66, 60.1943. Cancer Res., 3, 532.
378 Fell and Hughes—Mitosis in the Mouse
LEWIS, W. H., and LEWIS, M. R., 1924. In E. V. Cowdry's General Cytology, p. 410.Chicago (Univ. Press).
LUDFORD, R. J., SMILES, J., and WELCH, F. V., 1948. J. Roy. micr. Soc, 68, 1.MATTHEY, R., 1936. Arch. Biol. Paris, 47, 319.MttLLEH, H. G., 1937. Z. mikr. anat. Forsch., 41, 249.OVERTON, J. B., 1909. Ann. Bot., 23, 19.PAINTER, T. S., 1923. J. exp. Zool., 37, 291.PAINTER, T. S., and REINDORP, E. C., 1939. Chromosoma, 1, 276.Ris, H., and MIRSKY, A. E., 1949. J. gen. Physiol., 32, 489.SERRA, J. A., 1947. Cold Spring Harbor Symp., 12, 192.SCHULTZ, J., 1947. Ibid., 12, 179.
STRANGEWAYS, T. S. P., 1924. Proc. Roy. Soc. B, Lond., 96, 291.VANDERLYN, L., 1946. Science, 104, 514.Voss, H., 1928. Z. Zellforsch., 7, 187.WILSON, E. B., 1925. The Cell in Development and Heredity, 3rd ed. New York (Macmillan).WILSON, J. W., and LEDUC, E. H., 1947. Amer. J. Anat., 82, 353.
DESCRIPTION OF PLATESPLATE I
All x 2,800Fig. 1. Cell in early anaphase (spleen culture).(a) By phase contrast, living: note the pattern of mitochondria around spindle.(6) By phase contrast, fixed in OsO4; the chromosomes are invisible, but the outline of the
spindle is seen.(c) Stained with the Feulgen reagent.Fig. 2. Cell in interphase (spleen culture),(a) By phase contrast, living: within the nucleus the small dark granules are chromocentres
and the larger bodies are nucleoli.(6) By phase contrast, fixed. The chromocentres are almost invisible,(c) Stained with the Feulgen reagent. Note the very close correspondence of the chromo-
centres and nucleoli in (a) and (c).
PLATE II
Nuclei in interphase, and in normal diploid mitosis, X 2,800; all except Fig. 3 are Feulgenpreparations.
Fig. 3. Intermitotic nucleus (spleen culture). Note the chromonemata in the ground sub-stance. Haematoxylin.
Fig. 4. Intermitotic nucleus (kidney culture), showing nucleoli, chromocentres, andchromonemata.
Fig. 5. Early prophase (spleen culture). The chromonemata are more distinct and thechromocentres smaller and more numerous than at interphase.
Fig. 6. Slightly later prophase (kidney culture). Nucleoli are still present.Fig. 7. Later prophase (kidney culture). The nucleoli have disappeared. Note the terminal
heterochromatic granules (h) on the chromosomes.Fig. 8. End stage of prophase in spleen cell, just before collapse of nuclear membrane.
The chromosomes are now obviously double.Fig. 9. 'Prometaphase' in kidney cell. The nuclear membrane has gone and the chromo-
somes have contracted. The chromosomes lie in a plane parallel to the coverslip which is'rarein mouse-tissue cultures.
Fig. 10. Metaphase in spleen cell. The chromosomes are not yet equatorially arranged.Fig. 11. Full metaphase in spleen cell.Fig. 12. Early anaphase in spleen cell.Fig. 13. Telophase in spleen cell. The chromosomes form a tight mass.Fig. 14. Daughter nucleus in.reconstruction (heart culture).Fig. 15. Daughter nucleus in slightly later reconstruction (spleen culture). Some of the
chromosomes appear double.
Fell and Hughes—Mitosis in the Mouse 379
PLATE III
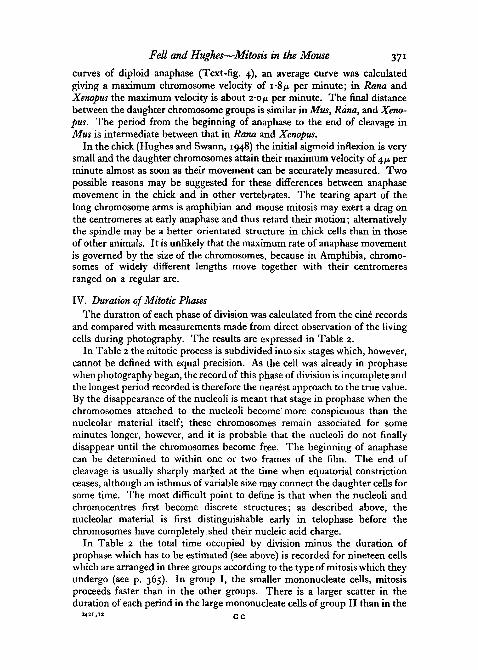
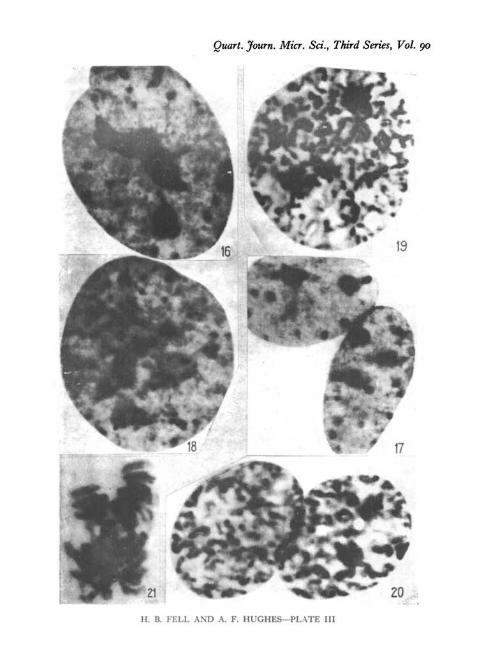
Tetraploid and binucleate cells in interphase and mitosis. X 2,800. All Feulgen preparations,except Fig. 21.
Fig. 16. Tetraploid nucleus in interphase (spleen culture).Fig. 17. Binucleate cell in interphase (kidney culture).Fig. 18. Tetraploid cell in very early prophase (kidney culture).Fig. 19. Tetraploid cell in prophase (kidney culture). The nucleoli have nearly dis-
appeared.Fig. 20. Binucleate cell in late prophase (spleen culture).Fig. 21. Tetraploid cell at the end of prophase (spleen culture). Haematoxylin. The
nuclear membrane has disappeared, and the chromosomes are crowding round the twoopposite poles of the spindle (compare PL VIII, fig. 376).
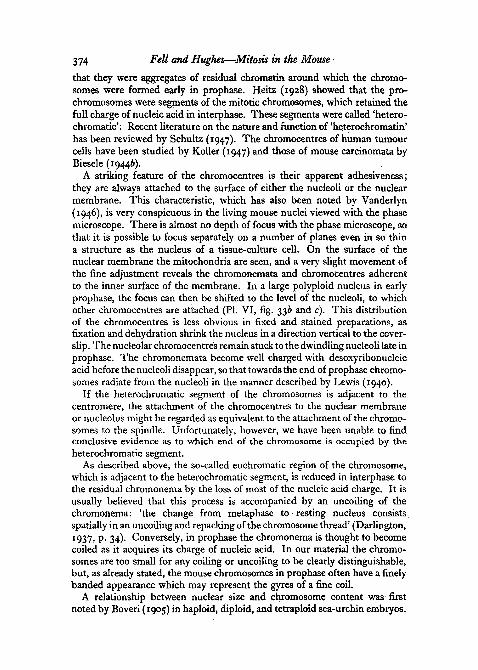
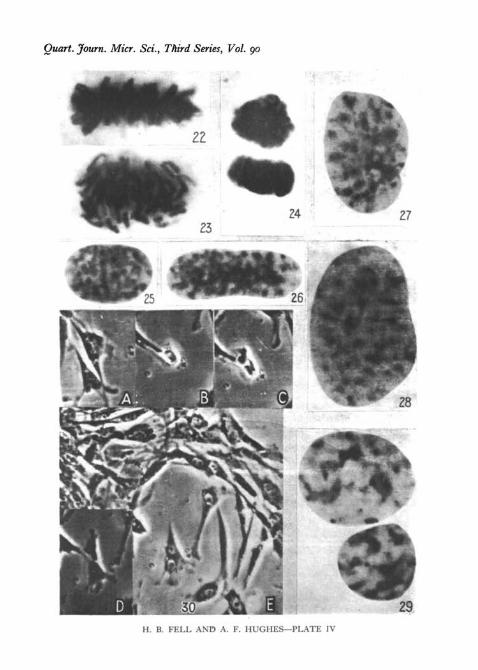
PLATE IV
All Feulgen preparations, X 2,800, except Fig. 30.
Fig. 22. Tetraploid metaphase (spleen culture). Compare with PI. II, fig. 11.Fig. 23. Early anaphase of a tetraploid cell (kidney culture). Compare with PI. II, fig. 12.Fig. 24. Telophase (spleen culture). The daughter nuclei remain within one cell.Fig. 25. Reconstruction of a normal diploid daughter nucleus (spleen culture) at a later
stage than in PI. II, fig. 15. Note the fine transverse filaments connecting the chromosomes.Fig.-26. Reconstruction of a tetraploid daughter cell at the same stage as in Fig. 25 (kidney
culture).Fig. 27. Late stage in the reconstruction of a diploid nucleus (kidney culture). The nucleoli
and chromocentres are now distinct.Fig. 28. Late reconstruction stage of a tetraploid nucleus (kidney culture). Compare with
Fig. 27.Fig. 29. Late reconstruction stage in a binucleate cell (spleen culture).Fig. 30. Stages in the formation of a binucleate cell in a spleen culture, photographed by
phase contrast at low power; all enlarged to X 220.(a) The upper cell is approaching the end of interphase.(6) 2$ hours later. Cell in anaphase.(c) 12 min. later than (6). Cleavage apparently complete.(<f) 28 min. later than (c). Daughter cells flattening, but still connected by a strand.(e) 15 min. later than (d). They reunite to form one binucleate cell.
PLATE V
Fig. 31. Mitosis in a diploid cell (spleen culture). Phase contrast enlargements, all x 1,500,from frames of 16 mm. film. Duration of complete record: 74 min.
(a) Prophase. Nucleoli still present but chromosomes developing.(6) 3-7 min. later than (a). The nuclear membrane is shrinking, and is indented by the
spindle asters above and below.{c) 6-3 min. later than (6). Early metaphase. The spindle is outlined by mitochondrial
material.id) 9-7 min. later than (c).(e) 3-4 min. later than (d). The split in the metaphase chromosomes is clearly visible.( /) 0 9 min. later than (e). The beginning of anaphase.(g) 3-i min. later than (/) . Mid-anaphase. The interzonal region of the spindle is being
constricted as is shown by the inward movement of mitochondria.(h) 4'5 min. later than (g). Orientated mitochondria are seen in the interzonal region.
The groups of daughter chromosomes are closely packed.(»') 2-5 min. later than (/1). Cleavage nearly complete and the groups of daughter chromo-
somes are swelling.(j) 9-8 min. later than (i). The daughter cells are connected by an interzonal strand (j).
In the lower daughter the nuclear membrane is visible. The nucleoli are now distinct.(k) 13-0 min. later than (;'). The young interphase nucleus is increasing in size, and the
nucleoli 1-ave more contrast.(/) i6-,' min. later than (£). Further development of the interphase nucleus.

380 Fell and Hughes—Mitosis in the Mouse
PLATE VI
Fig. 32. Prophase and metaphase of a polyploid cell (spleen culture). Phase-contrast •enlargements, all X 1,500, from frames of 16-mm. film. Duration of record: 25-4 min.-
(a) Prophase. Nucleoli are still present. Compare nuclear size with that in PI. V, fig. 31a.(b) 5-6 min. later than (a). Nucleoli are disappearing.(c) s'9 min. later than (6). The asters have deeply indented the nuclear membrane.(d) 1-9 min. later than (c). The nuclear membrane has disappeared; the spindle has been
formed and chromosomes are migrating towards it.(e) 8 min. later than (d). Many of the chromosomes are not yet on the equator of the
spindle.(/) 4 min. later than (e). The chromosomes are nearer the metaphase arrangement.Fig. 33. Prophase of a polyploid cell (spleen culture). Phase-contrast enlargements, all
X 1,500, from frames of 16-mm. film record. Duration of record: 23 min.(a) A polyploid prophase. The plane of focus is within the nucleus, at the level of the
nucleoli.(b) 14 min. later than (a). Note the change in shape and arrangement of the nucleoli.(e) Immediately after (b). The focus has been changed to the level of the nuclear membrane,
on the inside surface of which are many chromosome threads.(d) 8-8 min. later than (c). The development of the chromosomes is further advanced.
PLATE VII
Fig. 34. Anaphase, telophase, and reconstruction of one daughter nucleus of a polyploidcell in a spleen culture. Phase-contrast enlargements, X 2,530, from frames of 16-mm. film.Duration of complete record: about 5 hours. For description see p. 363. n = nucleolus.ch = chromonema.
(a) 4 min. after the beginning of anaphase. (g) 19 min. later than (/)(6) 2'3 min. later than (a). (h) 60 min. ,, ,, (g).(c) 11-i min. „ ,, (b). («') 15 min. „ „ (ft).(d) 6-1 min. ,, „ (c). (j) 22 min. „ ,, (i).(e) 45 min. „ „ (d). (k) 24 min. „ „ 0')-(/) 7 min. „ „ (e).
PLATE VIIIF'8- 35- Polyploid nucleus in prophase, to show movement of chromosomes (spleen
culture). Phase-contrast enlargements, X 1,500, from frames of 16-mm. film. Duration ofrecord: 17 min.
(a) Late prophase, with nucleoli gone.(b) 2 min. later than (a). Nuclear membrane contracting.(c) 15 min. later than (6). Most chromosomes have crowded round the two asters, which
lie to the left of the nuclear area. A group of chromosomes at the top remain separate,and are not brought on to the metaphase plate until 25 min. later.
Fig. 36. Mitosis of a binucleate cell (spleen culture). Phase-contrast enlargements, X 1,500,from frames of 16-mm. film. Duration of record: 129 min.
(a) Late prophase; nucleoli and nuclear membrane still present.{b) 9 min. later than (a). Nuclear membranes have gone, and the two diploid sets of
chromosomes come together.(c) 40 min. later than (6). Anaphase.(d) and (e) 80 min. later than (c). The polyploid nucleus of each daughter cell.Fig. 37. Mitosis of a binucleate cell, without cleavage (spleen culture). Phase-contrast
enlargements, x 1,500, from frames of 16-mm. film. Duration of record: 253 min.(a) Prophase. Nucleoli and nuclear membranes still present.(b) 3 min. later than (a). The nuclear membranes have gone and the diploid chromosome
sets have come together.(c) 125 min. later than (6). Tetraploid daughter nuclei now nearly as big as the parent
diploid nuclei and still in the same cell.(d) 125 min. later than (c). Rearrangement of the nucleoli in each nucleus.