Embed Size (px)
Citation preview
Mitigating fringing in discrete frequencyinfrared imaging using time-delayed integrationSHIHAO RAN, SEBASTIAN BERISHA, RUPALI MANKAR, WEI-CHUANSHIH, AND DAVID MAYERICH*
Department of Electrical and Computer Engineering, University of Houston, 4726 Calhoun Rd., Houston,TX 77204, USA*[email protected]
Abstract: Infrared (IR) spectroscopicmicroscopes provide the potential for label-free quantitativemolecular imaging of biological samples, which can be used to aid in histology, forensics, andpharmaceutical analysis. Most IR imaging systems use broadband illumination combined with aspectrometer to separate the signal into spectral components. This technique is currently too slowfor many biomedical applications such as clinical diagnosis, primarily due to the availability ofbright mid-infrared sources and sensitive MCT detectors. There has been a recent push to increasethroughput using coherent light sources, such as synchrotron radiation and quantum cascadelasers. While these sources provide a significant increase in intensity, the coherence introducesfringing artifacts in the final image. We demonstrate that applying time-delayed integration inone dimension can dramatically reduce fringing artifacts with minimal alterations to the standardinfrared imaging pipeline. The proposed technique also offers the potential for less expensivefocal plane array detectors, since linear arrays can be more readily incorporated into the proposedframework.© 2018 Optical Society of America under the terms of the OSA Open Access Publishing Agreement
OCIS codes: (180.0180) Microscopy; (300.0300) Spectroscopy; (140.5965) Semiconductor lasers, quantum cascade.
References and links1. H. A. Alturkistani, F. M. Tashkandi, and Z. M. Mohammedsaleh, “Histological stains: A literature review and case
study,” Global J Health Sci. 8, 72 (2016).2. J. D. Pallua, S. Unterberger, N. Pemberger, C. Woess, C. Ensinger, B. Zelger, C. Lass-Flörl, and M. Lackner,
“Retrospective case study on the suitability of mid-infrared microscopic imaging for the diagnosis of mucormycosisin human tissue sections,” Anal. Methods 9, 4135–4142 (2017).
3. S. K. Paidi, A. Rizwan, C. Zheng, M. Cheng, K. Glunde, and I. Barman, “Label-free raman spectroscopy detectsstromal adaptations in premetastatic lungs primed by breast cancer,” Cancer Res. 77, 247–256 (2017).
4. M. J. Baker, J. Trevisan, P. Bassan, R. Bhargava, H. J. Butler, K. M. Dorling, P. R. Fielden, S. W. Fogarty, N. J.Fullwood, K. A. Heys, C. Hughes, P. Lasch, P. L. Martin-Hirsch, B. Obinaju, G. D. Sockalingum, J. SulÃľ-Suso, R. J.Strong, M. J. Walsh, B. R. Wood, P. Gardner, and F. L. Martin, “Using Fourier transform IR spectroscopy to analyzebiological materials,” Nat. Protoc. 9, 1771–1791 (2014).
5. G. Bellisola and C. Sorio, “Infrared spectroscopy and microscopy in cancer research and diagnosis,” AmericanJournal of Cancer Research 2, 1–21 (2011).
6. M. J. Walsh, R. K. Reddy, and R. Bhargava, “Label-Free Biomedical Imaging With Mid-IR Spectroscopy,” IEEE J.Sel. Top. Quantum Electron. 18, 1502–1513 (2012).
7. P. Lasch, W. Haensch, D. Naumann, and M. Diem, “Imaging of colorectal adenocarcinoma using FT-IR microspec-troscopy and cluster analysis,” Biochim. Biophys. Acta, Mol. Basis Dis. 1688, 176–186 (2004).
8. T. Zhou, T. Dong, Y. Su, and Y. He, “A CMOS Readout With High-Precision and Low-Temperature-CoefficientBackground Current Skimming for Infrared Focal Plane Array,” IEEE Trans. Circuits Syst. Video Technol. 25,1447–1455 (2015).
9. E. N. Lewis, P. J. Treado, R. C. Reeder, G. M. Story, A. E. Dowrey, C. Marcott, and I. W. Levin, “Fourier TransformSpectroscopic Imaging Using an Infrared Focal-Plane Array Detector,” Anal. Chem. 67, 3377–3381 (1995).
10. I. W. Levin and R. Bhargava, “Fourier transform infrared vibrational spectroscopic imaging: integrating microscopyand molecular recognition,” Annu. Rev. Phys. Chem. 56, 429–474 (2005).
11. C. J. Hirschmugl and K. M. Gough, “Fourier Transform Infrared Spectrochemical Imaging: Review of Design andApplications with a Focal Plane Array and Multiple Beam Synchrotron Radiation Source,” Appl. Spectrosc. 66,475–491 (2012).
Vol. 9, No. 2 | 1 Feb 2018 | BIOMEDICAL OPTICS EXPRESS 832
#308889 Journal © 2018
https://doi.org/10.1364/BOE.9.000832 Received 12 Oct 2017; revised 9 Jan 2018; accepted 10 Jan 2018; published 26 Jan 2018
12. M. J. Nasse, M. J. Walsh, E. C. Mattson, R. Reininger, A. Kajdacsy-Balla, V. Macias, R. Bhargava, and C. J.Hirschmugl, “High-resolution Fourier-transform infrared chemical imaging with multiple synchrotron beams,” Nat.Methods 8, 413–416 (2011).
13. M. C. Martin, C. Dabat-Blondeau, M. Unger, J. Sedlmair, D. Y. Parkinson, H. A. Bechtel, B. Illman, J. M. Castro,M. Keiluweit, D. Buschke, B. Ogle, M. Nasse, C. Hirschmugl, “3D spectral imaging with synchrotron fouriertransform infrared spectro-microtomography,” Nat. Methods 10, 861–864 (2013).
14. A. K. Kodali, M. Schulmerich, J. Ip, G. Yen, B. T. Cunningham, and R. Bhargava, “Narrowband midinfraredreflectance filters using guided mode resonance,” Anal. Chem. 82, 5697–5706 (2010).
15. J.-N. Liu, M. V. Schulmerich, R. Bhargava, and B. T. Cunningham, “Optimally designed narrowband guided-moderesonance reflectance filters for mid-infrared spectroscopy,” Opt. Express 19, 24182–24197 (2011).
16. M. R. Kole, R. K. Reddy, M. V. Schulmerich, M. K. Gelber, and R. Bhargava, “Discrete frequency infraredmicrospectroscopy and imaging with a tunable quantum cascade laser,” Anal. Chem. 84, 10366–10372 (2012).
17. G. Wysocki, R. F. Curl, F. K. Tittel, R. Maulini, J. M. Bulliard, and J. Faist, “Widely tunable mode-hop free externalcavity quantum cascade laser for high resolution spectroscopic applications,” Appl. Phys. B 81, 769–777 (2005).
18. M. J. Weida, P. R. Buerki, M. Pushkarsky, and T. Day, “QCL-assisted infrared chemical imaging,” in “ProceedingsSPIE, Micro- and Nanotechnology Sensors, Systems, and Applications III,” , vol. 8031 (2011), vol. 8031, pp. 803127.
19. J. Faist, F. Capasso, D. L. Sivco, C. Sirtori, A. L. Hutchinson, and A. Y. Cho, “Quantum cascade laser,” Science(New York, N.Y.) 264, 553–556 (1994).
20. F. Capasso, “High-performance midinfrared quantum cascade lasers,” Opt. Eng. 49, 111102 (2010).21. M. C. Phillips and N. Ho, “Infrared hyperspectral imaging using a broadly tunable external cavity quantum cascade
laser and microbolometer focal plane array,” Opt. Express 16, 1836 (2008).22. B. Bird and J. Rowlette, “High definition infrared chemical imaging of colorectal tissue using a spero qcl microscope,”
Analyst 142, 1381–1386 (2017).23. P. Bassan, M. J. Weida, J. Rowlette, and P. Gardner, “Large scale infrared imaging of tissue micro arrays (tmas) using
a tunable quantum cascade laser (qcl) based microscope,” Analyst 139, 3856–3859 (2014).24. K. Yeh, S. Kenkel, J.-N. Liu, and R. Bhargava, “Fast Infrared Chemical Imaging with a Quantum Cascade Laser,”
Anal. Chem. 87, 485–493 (2015).25. H. Sreedhar, V. K. Varma, F. V. Gambacorta, G. Guzman, and M. J. Walsh, “Infrared spectroscopic imaging detects
chemical modifications in liver fibrosis due to diabetes and disease,” Biomed. Opt. Express 7, 2419–2424 (2016).26. I. Patel, V. P. Rajamanickam, A. Bertoncini, F. Pagliari, L. Tirinato, S. P. Laptenok, and C. Liberale, “Quantum
cascade laser infrared spectroscopy of single cancer cells,” in “Optical Trapping Applications,” (Optical Society ofAmerica, 2017), JTu4A.21.
27. M. J. Pilling, A. Henderson, B. Bird, M. D. Brown, N. W. Clarke, and P. Gardner, “High-throughput quantum cascadelaser (qcl) spectral histopathology: a practical approach towards clinical translation,” Faraday Discuss. 187, 135–154(2016).
28. M. R. Kole, R. K. Reddy, M. V. Schulmerich, M. K. Gelber, and R. Bhargava, “Discrete Frequency InfraredMicrospectroscopy and Imaging with a Tunable Quantum Cascade Laser,” Anal. Chem. 84, 10366–10372 (2012).
29. K. Yeh and R. Bhargava, “Discrete frequency infrared imaging using quantum cascade lasers for biological tissueanalysis,” in “SPIE BiOS,” (International Society for Optics and Photonics, Bellingham, WA, 970406, 2016).
30. H. C. Hulst and H. C. van de Hulst, Light scattering by small particles (Courier Corporation, 1957).31. S. Berisha, T. van Dijk, R. Bhargava, P. S. Carney, and D. Mayerich, “BIM-Sim: Interactive Simulation of Broadband
Imaging Using Mie Theory,” Front. Phys. 5 (2017).32. R. Mankar, V. Verma, M. Walsh, C. Bueso-Ramos, and D. Mayerich, “Imaging and Feature Selection Using GA-FDA
Algorithm for the Classification of Mid-Infrared Biomedical Images,” Microsc. Microanal. 22, 1008–1009 (2016).
1. Introduction
Mid-infrared (IR) spectroscopy is a non-destructive method for obtaining quantitative molecularinformation from a sample. When incorporated into imaging systems, such as microscopes, IRspectroscopy is a powerful tool for exploring the spatial distribution of molecular constituents inheterogeneous samples. There has been growing interest in integrating high-quality molecular andstructural spectroscopic measurements into areas of clinical and biomedical research. For example,standard histology relies on chemical staining to differentiate tissues [1], which is non-quantitativeand destroys the sample. Emerging vibrational imaging methods using mid-infrared [2] andRaman spectroscopy [3] have established label-free techniques to extract biomedical informationfrom micrometer-thick samples. No prior knowledge of the sample composition is needed, sincemany molecular functional groups have resonant frequencies in the IR fingerprint region [4].Based on this technique, many newly developed IR imaging applications are being explored forbiomedical analysis and clinical diagnosis [5–7].
Vol. 9, No. 2 | 1 Feb 2018 | BIOMEDICAL OPTICS EXPRESS 833
One of the most widely used IR imaging systems is Fourier Transform Infrared (FTIR)spectroscopy, which uses a broadband globar thermal source. Spatial information is acquired byscanning the sample with a single-point detector coupled to an aperture that limits signal to asingle spatial location. An alternative approach uses focal plane array (FPA) detectors, whichcan provide outstanding performance with > 90% quantum efficiency, low readout noise, andlow dark current [8]. Coupled with interferometry and liquid nitrogen-cooled mercury cadmiumtelluride (MCT) FPA detectors [9], FTIR instruments are capable of broadband spectral dataacquisition [10] and are widely commercially available. MCT detectors are still relatively lowresolution (≈ 128×128 pixels) compared to visible-range counterparts, which limits applicabilityin fields like clinical histology, where throughput is critical.
Several newly developed technologies have focused on increasing throughput, most notably byreplacing incoherent thermal sources with coherent beams, such as synchrontron radiation [11],which provides higher flux for improved SNR. By taking advantage of coherent sources andFPA detectors, recent research has focused on higher throughput and spatial resolution [12] andopened the door to three-dimensional imaging [13]. Increased throughput can also be achievedby limiting the number of spectral measurements acquired. This can be accomplished in FTIR byreducing the scanning range of the interferogram, which is proportional to the spectral resolution.This approach provides very limited specificity, since the user has no control over the vibrationalstates that are probed.More recent approaches, collectively known as discrete-frequency infrared (DFIR), provide
more control over the acquired wavelengths. Multiple methods have been proposed for DFIR,including the use of narrowband filters [14, 15] and quantum cascade lasers (QCLs) [16].Currently, QCL-based imaging systems are more common since they provide more excitationenergy within an extremely narrow band. QCLs can be constructed for tunability through thefingerprint region [17], have a very narrow (< 1cm−1) line width, and are operable at roomtemperature [18–20] using uncooled bolometer FPAs [21]. This allows precise probing of specificvibrational modes using bench-top systems. Imaging systems incorporating these techniquesare commercially available [22] (Spero, Daylight Solutions), and have been used in tissuestudies [23–25] and cell biology [26], with a general movement towards clinical applications [27].
50
250
150
200
100
50µm0.00
1.00
0.50
0.75
0.25
50µm
(a) (b)
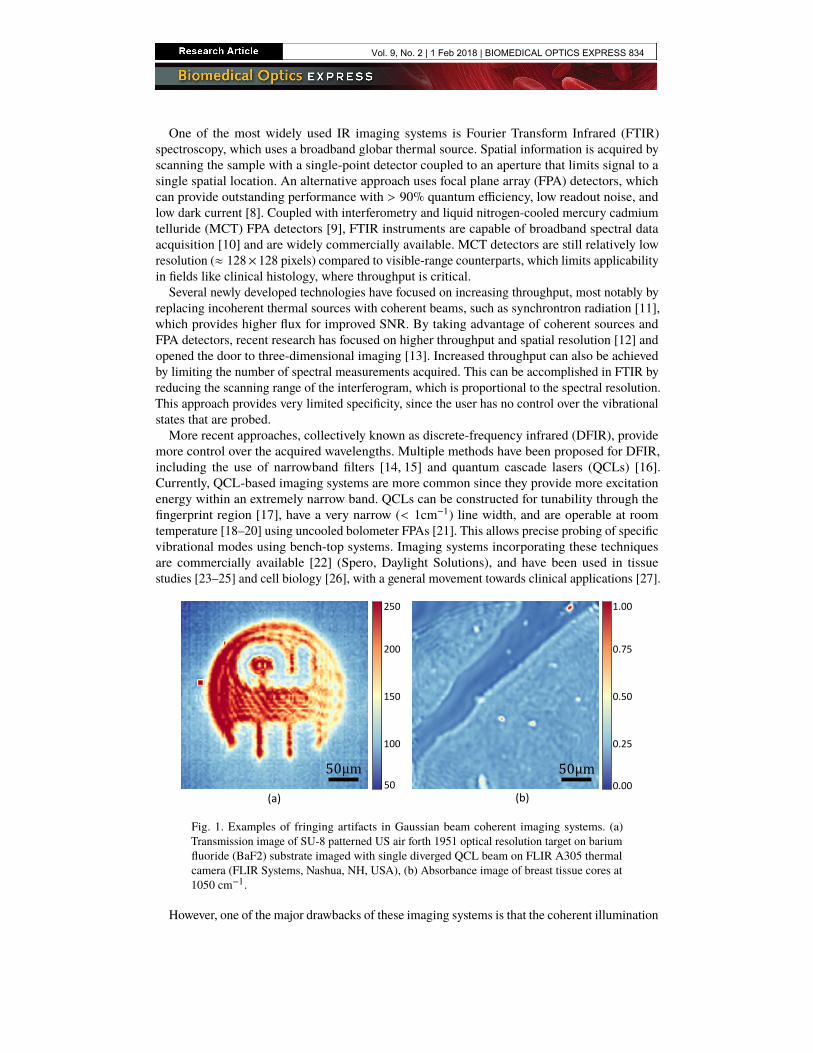
Fig. 1. Examples of fringing artifacts in Gaussian beam coherent imaging systems. (a)Transmission image of SU-8 patterned US air forth 1951 optical resolution target on bariumfluoride (BaF2) substrate imaged with single diverged QCL beam on FLIR A305 thermalcamera (FLIR Systems, Nashua, NH, USA), (b) Absorbance image of breast tissue cores at1050 cm−1.
However, one of the major drawbacks of these imaging systems is that the coherent illumination
Vol. 9, No. 2 | 1 Feb 2018 | BIOMEDICAL OPTICS EXPRESS 834
generates fringing patterns in the detector image (Fig. 1). These patterns are difficult to removeusing image processing methods, since the pattern structure is dependent on wavelength andfiltering spatial frequencies can distort the actual spatial content of the image. Consequently,these artifacts also cause meaningful changes in the chemical measurement that is intrinsicallytied to the sample structure and substrate. Recent research has focused on mitigating coherenceeffects using beam diffusion or apertures combined with point detection [28]. An alternativeapproach relies on obtaining point measurements in reflection to rasterize the final image [29].Confocal apertures can then be inserted to reject the scattered light that produces the fringingpattern. This approach effectively eliminates coherence effects by simulating an extended source,however throughput is limited by the scanning speed of the sample stage.
In this paper, we propose a hybrid approach that allows developers to maintain the throughputallowed with FPA detectors while significantly mitigating coherence artifacts in the final image.This is accomplished by using time-delayed integration (TDI) to simulate an extended source inone dimension. This allows us to fully utilize an FPA detectors, where one dimension providesspatial resolution and the second provides integration that reduces both noise and coherencefringing.
2. Materials and methods
2.1. Simulation
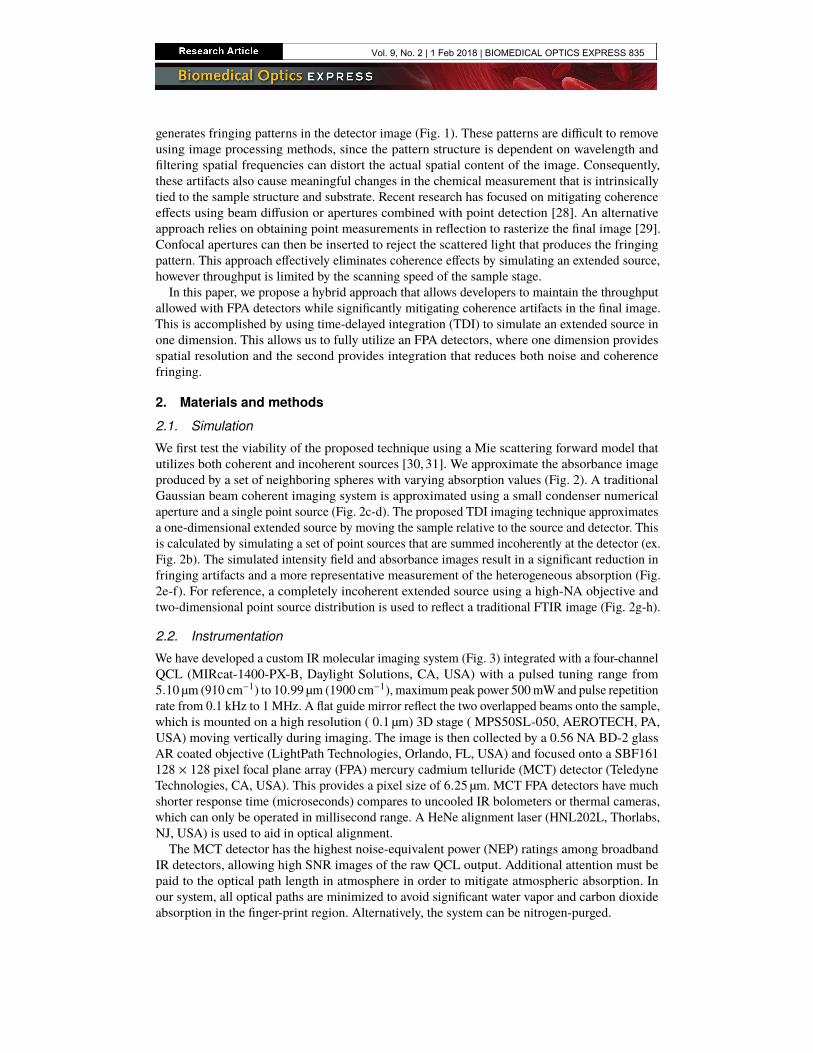
We first test the viability of the proposed technique using a Mie scattering forward model thatutilizes both coherent and incoherent sources [30,31]. We approximate the absorbance imageproduced by a set of neighboring spheres with varying absorption values (Fig. 2). A traditionalGaussian beam coherent imaging system is approximated using a small condenser numericalaperture and a single point source (Fig. 2c-d). The proposed TDI imaging technique approximatesa one-dimensional extended source by moving the sample relative to the source and detector. Thisis calculated by simulating a set of point sources that are summed incoherently at the detector (ex.Fig. 2b). The simulated intensity field and absorbance images result in a significant reduction infringing artifacts and a more representative measurement of the heterogeneous absorption (Fig.2e-f). For reference, a completely incoherent extended source using a high-NA objective andtwo-dimensional point source distribution is used to reflect a traditional FTIR image (Fig. 2g-h).
2.2. Instrumentation
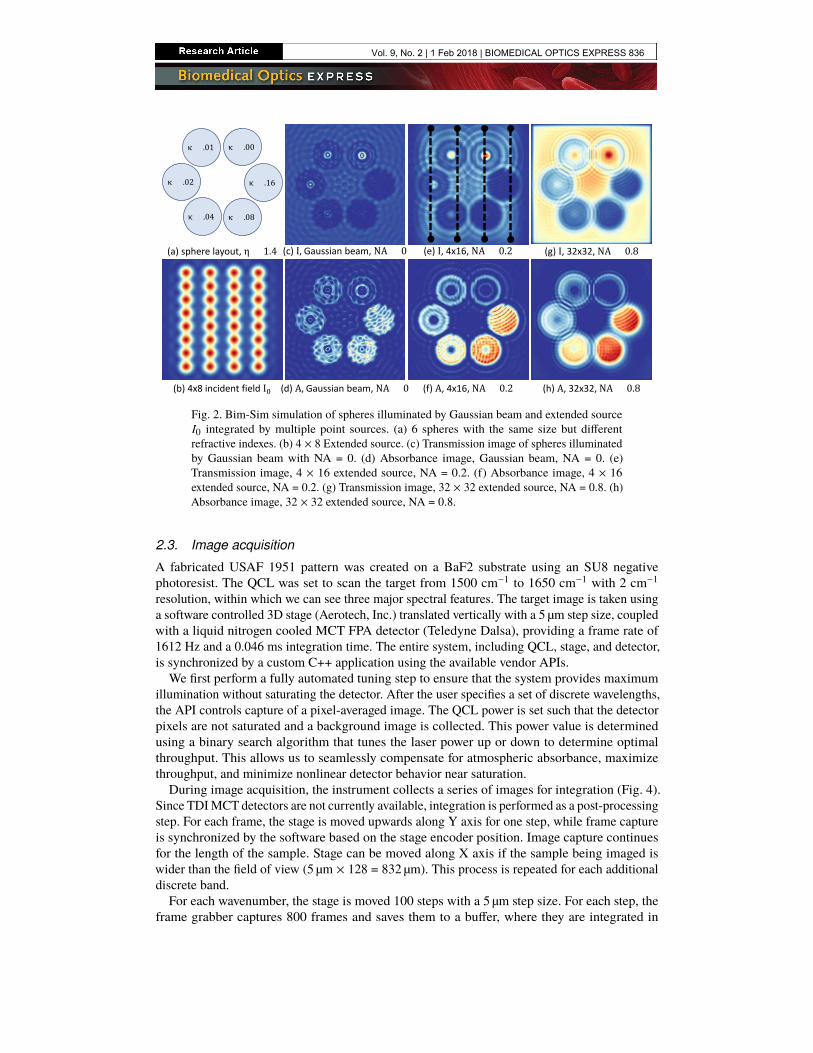
We have developed a custom IR molecular imaging system (Fig. 3) integrated with a four-channelQCL (MIRcat-1400-PX-B, Daylight Solutions, CA, USA) with a pulsed tuning range from5.10 µm (910 cm−1) to 10.99 µm (1900 cm−1), maximum peak power 500mWand pulse repetitionrate from 0.1 kHz to 1 MHz. A flat guide mirror reflect the two overlapped beams onto the sample,which is mounted on a high resolution ( 0.1 µm) 3D stage ( MPS50SL-050, AEROTECH, PA,USA) moving vertically during imaging. The image is then collected by a 0.56 NA BD-2 glassAR coated objective (LightPath Technologies, Orlando, FL, USA) and focused onto a SBF161128 × 128 pixel focal plane array (FPA) mercury cadmium telluride (MCT) detector (TeledyneTechnologies, CA, USA). This provides a pixel size of 6.25 µm. MCT FPA detectors have muchshorter response time (microseconds) compares to uncooled IR bolometers or thermal cameras,which can only be operated in millisecond range. A HeNe alignment laser (HNL202L, Thorlabs,NJ, USA) is used to aid in optical alignment.The MCT detector has the highest noise-equivalent power (NEP) ratings among broadband
IR detectors, allowing high SNR images of the raw QCL output. Additional attention must bepaid to the optical path length in atmosphere in order to mitigate atmospheric absorption. Inour system, all optical paths are minimized to avoid significant water vapor and carbon dioxideabsorption in the finger-print region. Alternatively, the system can be nitrogen-purged.
Vol. 9, No. 2 | 1 Feb 2018 | BIOMEDICAL OPTICS EXPRESS 835
κ = .08
κ = .16
κ = .04
κ = .02
κ = .01 κ = .00
(a) sphere layout, η = 1.4 (c) I, Gaussian beam, NA = 0 (e) I, 4x16, NA = 0.2 (g) I, 32x32, NA = 0.8
(b) 4x8 incident field I0 (d) A, Gaussian beam, NA = 0 (f) A, 4x16, NA = 0.2 (h) A, 32x32, NA = 0.8
Fig. 2. Bim-Sim simulation of spheres illuminated by Gaussian beam and extended sourceI0 integrated by multiple point sources. (a) 6 spheres with the same size but differentrefractive indexes. (b) 4 × 8 Extended source. (c) Transmission image of spheres illuminatedby Gaussian beam with NA = 0. (d) Absorbance image, Gaussian beam, NA = 0. (e)Transmission image, 4 × 16 extended source, NA = 0.2. (f) Absorbance image, 4 × 16extended source, NA = 0.2. (g) Transmission image, 32 × 32 extended source, NA = 0.8. (h)Absorbance image, 32 × 32 extended source, NA = 0.8.
2.3. Image acquisition
A fabricated USAF 1951 pattern was created on a BaF2 substrate using an SU8 negativephotoresist. The QCL was set to scan the target from 1500 cm−1 to 1650 cm−1 with 2 cm−1
resolution, within which we can see three major spectral features. The target image is taken usinga software controlled 3D stage (Aerotech, Inc.) translated vertically with a 5 µm step size, coupledwith a liquid nitrogen cooled MCT FPA detector (Teledyne Dalsa), providing a frame rate of1612 Hz and a 0.046 ms integration time. The entire system, including QCL, stage, and detector,is synchronized by a custom C++ application using the available vendor APIs.We first perform a fully automated tuning step to ensure that the system provides maximum
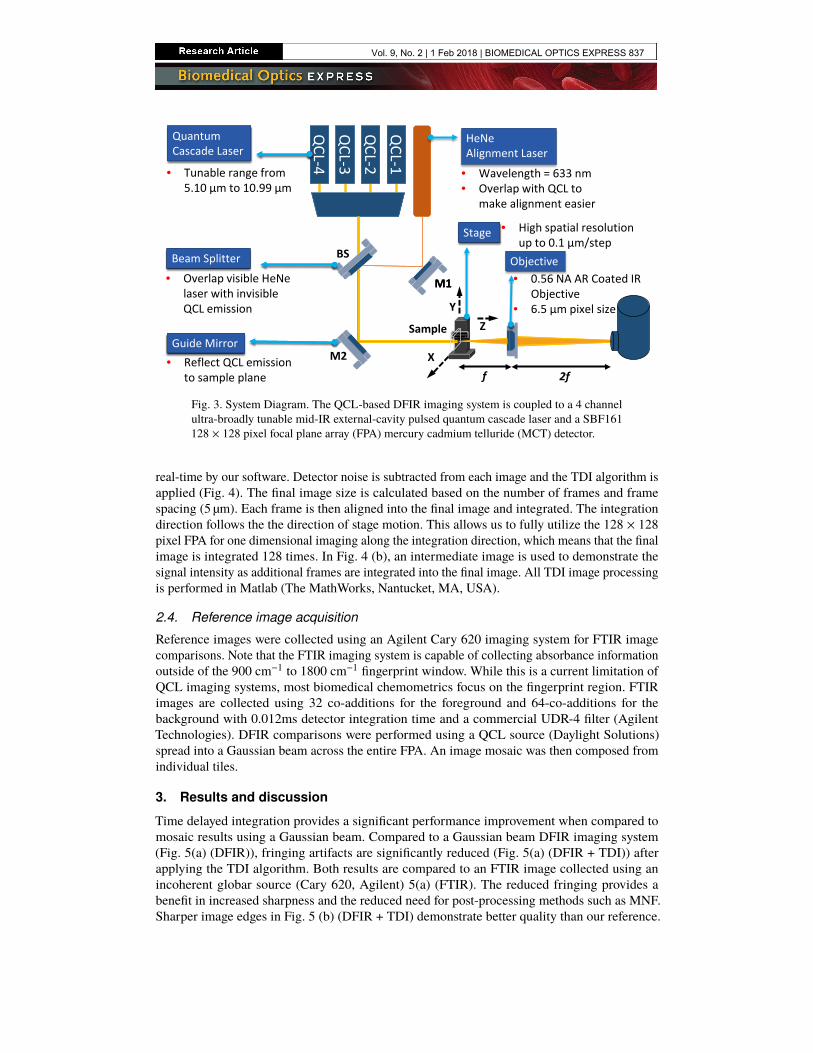
illumination without saturating the detector. After the user specifies a set of discrete wavelengths,the API controls capture of a pixel-averaged image. The QCL power is set such that the detectorpixels are not saturated and a background image is collected. This power value is determinedusing a binary search algorithm that tunes the laser power up or down to determine optimalthroughput. This allows us to seamlessly compensate for atmospheric absorbance, maximizethroughput, and minimize nonlinear detector behavior near saturation.During image acquisition, the instrument collects a series of images for integration (Fig. 4).
Since TDIMCT detectors are not currently available, integration is performed as a post-processingstep. For each frame, the stage is moved upwards along Y axis for one step, while frame captureis synchronized by the software based on the stage encoder position. Image capture continuesfor the length of the sample. Stage can be moved along X axis if the sample being imaged iswider than the field of view (5 µm × 128 = 832 µm). This process is repeated for each additionaldiscrete band.For each wavenumber, the stage is moved 100 steps with a 5 µm step size. For each step, the
frame grabber captures 800 frames and saves them to a buffer, where they are integrated in
Vol. 9, No. 2 | 1 Feb 2018 | BIOMEDICAL OPTICS EXPRESS 836
QCL-1
QCL-2
QCL-3
QCL-4
BS
M1
M2
Quantum Cascade Laser
Beam Splitter
Guide Mirror
• Tunable range from 5.10 µm to 10.99 µm
• Overlap visible HeNelaser with invisible QCL emission
• Reflect QCL emission to sample plane
HeNeAlignment Laser
• Wavelength = 633 nm• Overlap with QCL to
make alignment easier
Objective• 0.56 NA AR Coated IR
Objective• 6.5 µm pixel size
Stage • High spatial resolution up to 0.1 µm/step
QCL-1
QCL-2
QCL-3
QCL-4
BS
M1
M2
Sample
Quantum Cascade Laser
Beam Splitter
Guide Mirror
Stage
YZ
Xf 2f
Fig. 3. System Diagram. The QCL-based DFIR imaging system is coupled to a 4 channelultra-broadly tunable mid-IR external-cavity pulsed quantum cascade laser and a SBF161128 × 128 pixel focal plane array (FPA) mercury cadmium telluride (MCT) detector.
real-time by our software. Detector noise is subtracted from each image and the TDI algorithm isapplied (Fig. 4). The final image size is calculated based on the number of frames and framespacing (5 µm). Each frame is then aligned into the final image and integrated. The integrationdirection follows the the direction of stage motion. This allows us to fully utilize the 128 × 128pixel FPA for one dimensional imaging along the integration direction, which means that the finalimage is integrated 128 times. In Fig. 4 (b), an intermediate image is used to demonstrate thesignal intensity as additional frames are integrated into the final image. All TDI image processingis performed in Matlab (The MathWorks, Nantucket, MA, USA).
2.4. Reference image acquisition
Reference images were collected using an Agilent Cary 620 imaging system for FTIR imagecomparisons. Note that the FTIR imaging system is capable of collecting absorbance informationoutside of the 900 cm−1 to 1800 cm−1 fingerprint window. While this is a current limitation ofQCL imaging systems, most biomedical chemometrics focus on the fingerprint region. FTIRimages are collected using 32 co-additions for the foreground and 64-co-additions for thebackground with 0.012ms detector integration time and a commercial UDR-4 filter (AgilentTechnologies). DFIR comparisons were performed using a QCL source (Daylight Solutions)spread into a Gaussian beam across the entire FPA. An image mosaic was then composed fromindividual tiles.
3. Results and discussion
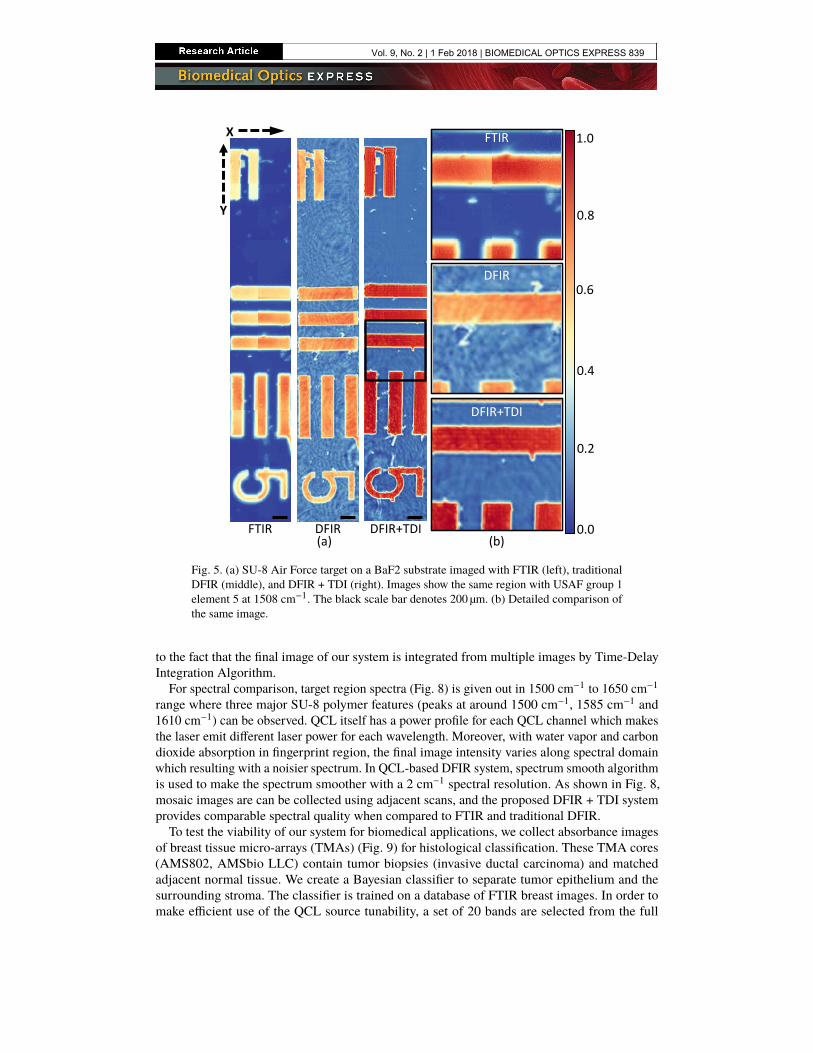
Time delayed integration provides a significant performance improvement when compared tomosaic results using a Gaussian beam. Compared to a Gaussian beam DFIR imaging system(Fig. 5(a) (DFIR)), fringing artifacts are significantly reduced (Fig. 5(a) (DFIR + TDI)) afterapplying the TDI algorithm. Both results are compared to an FTIR image collected using anincoherent globar source (Cary 620, Agilent) 5(a) (FTIR). The reduced fringing provides abenefit in increased sharpness and the reduced need for post-processing methods such as MNF.Sharper image edges in Fig. 5 (b) (DFIR + TDI) demonstrate better quality than our reference.
Vol. 9, No. 2 | 1 Feb 2018 | BIOMEDICAL OPTICS EXPRESS 837
(a)0.0
1.0
0.5
200µm
(b)
Load TDI Frames
Calculate Output Size
For Each TDI Frame
Calculate Position
Integrate
Output Image
TDI inprogress
TDI
⋮
�
x
∆y𝐩𝐩
y0
x
t0t1t2t3
tN
(c)
YX
Fig. 4. (a) Flow chart of TDI (time delay integration) algorithm. (b) Intermediate image fromTDI post process. The top and bottom part of the image demonstrates the SNR differencebetween images before TDI and after fully applied TDI (center part of the image). (c)Individual images at different position and time point (left) and corresponding integratedimage (right).
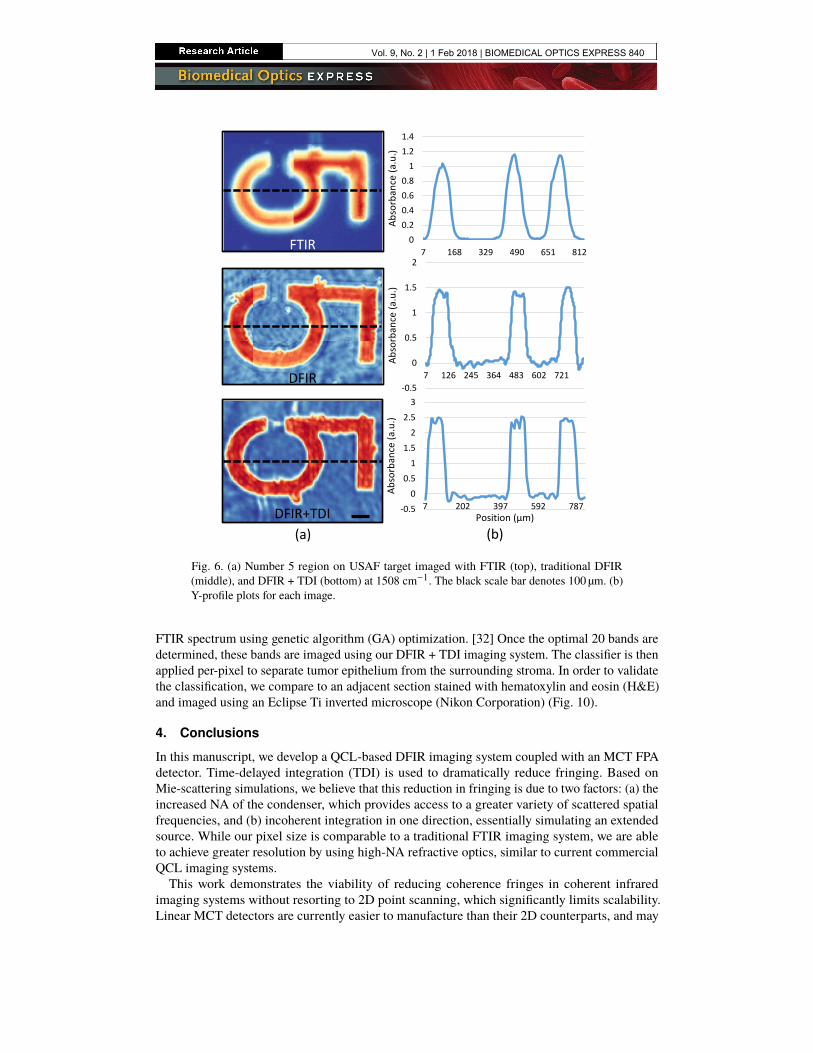
While the pixel sizes between all three images are comparable, sharper edges in the DFIR andDFIR + TDI imaging systems are likely due to higher-NA refractive optics.Quantified sharpnessfor each image is given out in Fig. 6. Number 5 region on the target is cropped out for detailedcomparison. Y-profile (red dash line) is plotted in Fig. 6 (b) with Y axis stands for absorbanceand X axis stands for pixel position.The main bottleneck to this approach is the need to implement TDI integration as a post-
processing step. However, several linear arrays are used as detectors in custom and commercialsystems and are far less expensive than their 2D counterparts. This research opens the door to theuse of linear arrays that can provide a compromise between the throughput benefit of FPAs withthe incoherent imaging of point confocal [28] or FTIR imaging systems.In order to optimize this trade-off between imaging time and signal-to-noise ratio, a SNR
analysis was done for the most efficient number of frames that should be averaged. From 10 framesto 800 frames, an 8 fold SNR increase is achieved, with results converging after 800 frames.Aside from imaging frame rate, our QCL-based DFIR system is operated at an integration time4X longer than that of the FTIR system (which utilizes the same detector) at 0.01 µs integrationtime. Unlike the globar source, QCL has a maximal pulse rate of 1 MHz and maximal 5% dutycycle. A trade-off between laser power and integration time for each image must be taken intoconsideration in order to avoid saturation while achieving higher SNR, that is to say, laser powerhas to be lowered for longer integration time. Finally, a 0.046 µs integration time is chosen toensure that there is no background saturation.
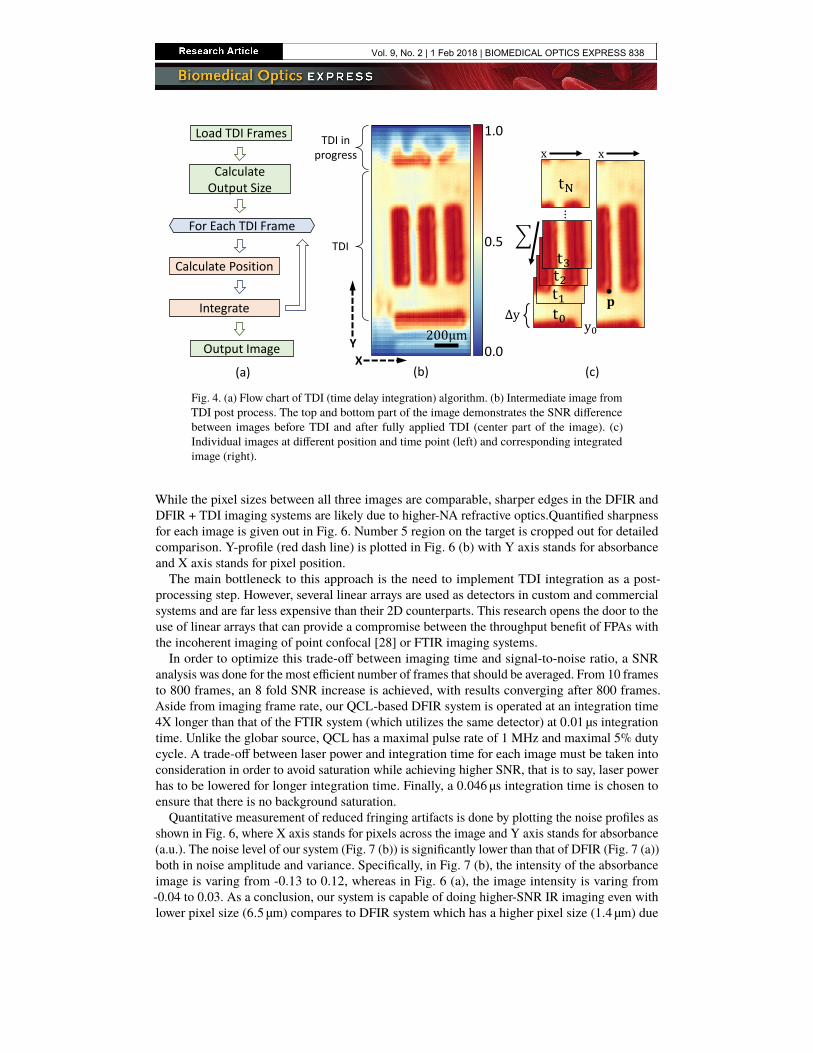
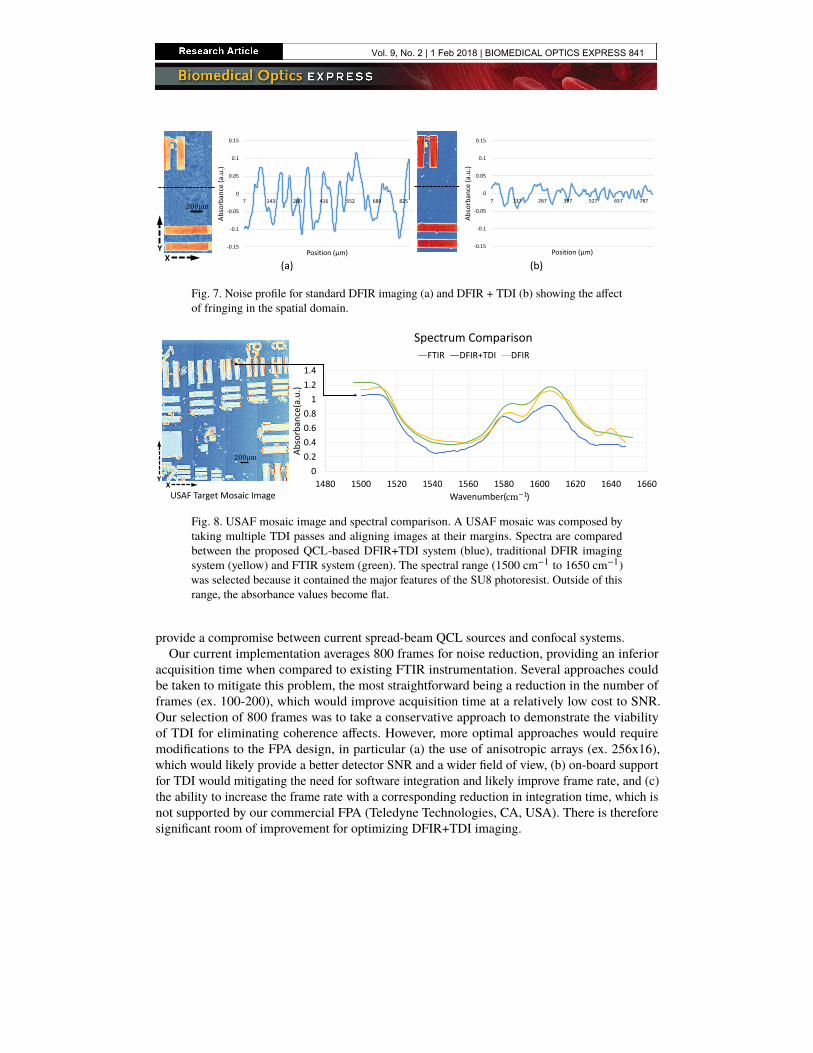
Quantitative measurement of reduced fringing artifacts is done by plotting the noise profiles asshown in Fig. 6, where X axis stands for pixels across the image and Y axis stands for absorbance(a.u.). The noise level of our system (Fig. 7 (b)) is significantly lower than that of DFIR (Fig. 7 (a))both in noise amplitude and variance. Specifically, in Fig. 7 (b), the intensity of the absorbanceimage is varing from -0.13 to 0.12, whereas in Fig. 6 (a), the image intensity is varing from-0.04 to 0.03. As a conclusion, our system is capable of doing higher-SNR IR imaging even withlower pixel size (6.5 µm) compares to DFIR system which has a higher pixel size (1.4 µm) due
Vol. 9, No. 2 | 1 Feb 2018 | BIOMEDICAL OPTICS EXPRESS 838
0.0
0.2
0.4
1.0
0.8
0.6
FTIR
DFIR
FTIR DFIR DFIR+TDI(a) (b)
DFIR+TDI
Y
X
Fig. 5. (a) SU-8 Air Force target on a BaF2 substrate imaged with FTIR (left), traditionalDFIR (middle), and DFIR + TDI (right). Images show the same region with USAF group 1element 5 at 1508 cm−1. The black scale bar denotes 200 µm. (b) Detailed comparison ofthe same image.
to the fact that the final image of our system is integrated from multiple images by Time-DelayIntegration Algorithm.
For spectral comparison, target region spectra (Fig. 8) is given out in 1500 cm−1 to 1650 cm−1
range where three major SU-8 polymer features (peaks at around 1500 cm−1, 1585 cm−1 and1610 cm−1) can be observed. QCL itself has a power profile for each QCL channel which makesthe laser emit different laser power for each wavelength. Moreover, with water vapor and carbondioxide absorption in fingerprint region, the final image intensity varies along spectral domainwhich resulting with a noisier spectrum. In QCL-based DFIR system, spectrum smooth algorithmis used to make the spectrum smoother with a 2 cm−1 spectral resolution. As shown in Fig. 8,mosaic images are can be collected using adjacent scans, and the proposed DFIR + TDI systemprovides comparable spectral quality when compared to FTIR and traditional DFIR.To test the viability of our system for biomedical applications, we collect absorbance images
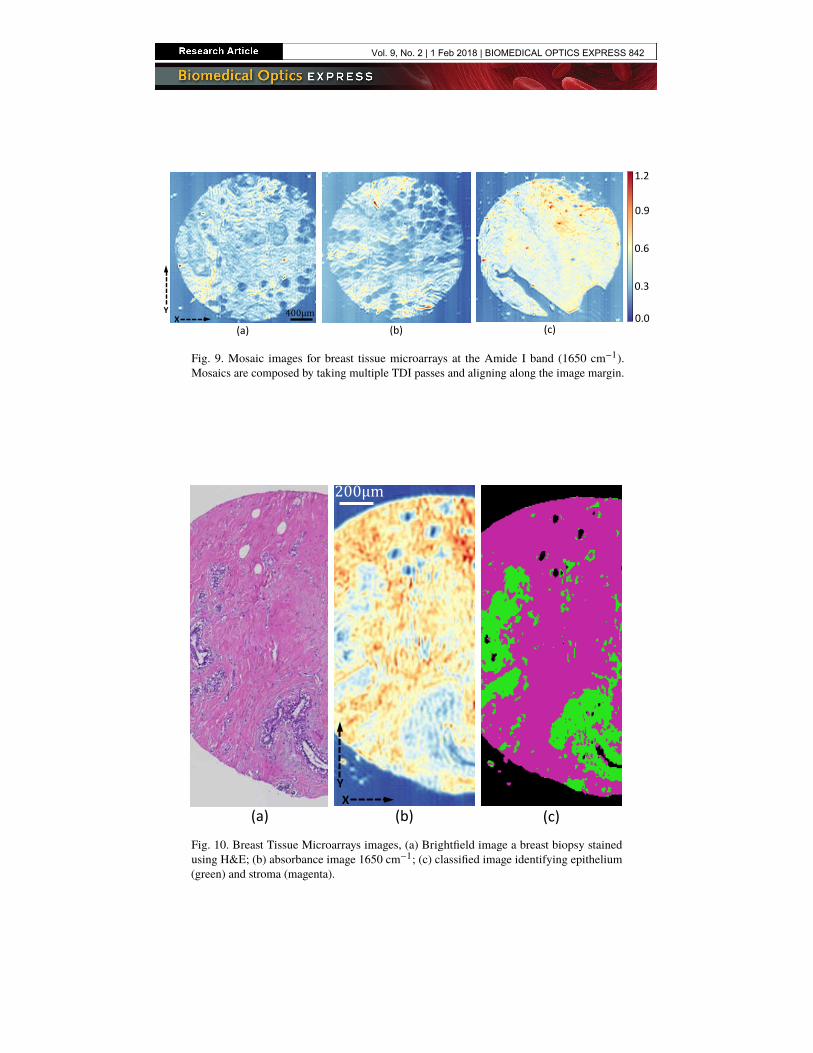
of breast tissue micro-arrays (TMAs) (Fig. 9) for histological classification. These TMA cores(AMS802, AMSbio LLC) contain tumor biopsies (invasive ductal carcinoma) and matchedadjacent normal tissue. We create a Bayesian classifier to separate tumor epithelium and thesurrounding stroma. The classifier is trained on a database of FTIR breast images. In order tomake efficient use of the QCL source tunability, a set of 20 bands are selected from the full
Vol. 9, No. 2 | 1 Feb 2018 | BIOMEDICAL OPTICS EXPRESS 839
FTIR
DFIR
(a) (b)DFIR+TDI
00.20.40.60.8
11.21.4
7 168 329 490 651 812
Abso
rban
ce (a
.u.)
-0.5
0
0.5
1
1.5
2
7 126 245 364 483 602 721
Abso
rban
ce (a
.u.)
-0.5
0
0.5
1
1.5
2
2.5
3
7 202 397 592 787
Abso
rban
ce (a
.u.)
Position (µm)
Fig. 6. (a) Number 5 region on USAF target imaged with FTIR (top), traditional DFIR(middle), and DFIR + TDI (bottom) at 1508 cm−1. The black scale bar denotes 100 µm. (b)Y-profile plots for each image.
FTIR spectrum using genetic algorithm (GA) optimization. [32] Once the optimal 20 bands aredetermined, these bands are imaged using our DFIR + TDI imaging system. The classifier is thenapplied per-pixel to separate tumor epithelium from the surrounding stroma. In order to validatethe classification, we compare to an adjacent section stained with hematoxylin and eosin (H&E)and imaged using an Eclipse Ti inverted microscope (Nikon Corporation) (Fig. 10).
4. Conclusions
In this manuscript, we develop a QCL-based DFIR imaging system coupled with an MCT FPAdetector. Time-delayed integration (TDI) is used to dramatically reduce fringing. Based onMie-scattering simulations, we believe that this reduction in fringing is due to two factors: (a) theincreased NA of the condenser, which provides access to a greater variety of scattered spatialfrequencies, and (b) incoherent integration in one direction, essentially simulating an extendedsource. While our pixel size is comparable to a traditional FTIR imaging system, we are ableto achieve greater resolution by using high-NA refractive optics, similar to current commercialQCL imaging systems.This work demonstrates the viability of reducing coherence fringes in coherent infrared
imaging systems without resorting to 2D point scanning, which significantly limits scalability.Linear MCT detectors are currently easier to manufacture than their 2D counterparts, and may
Vol. 9, No. 2 | 1 Feb 2018 | BIOMEDICAL OPTICS EXPRESS 840
(a) (b)
200µm 100𝜇𝜇𝜇𝜇
YX
-0.15
-0.1
-0.05
0
0.05
0.1
0.15
7 143 280 416 552 689 825
Abso
rban
ce (a
.u.)
Position (µm)-0.15
-0.1
-0.05
0
0.05
0.1
0.15
7 137 267 397 527 657 787
Abso
rban
ce (a
.u.)
Position (µm)
Fig. 7. Noise profile for standard DFIR imaging (a) and DFIR + TDI (b) showing the affectof fringing in the spatial domain.
00.20.40.60.8
11.21.4
1480 1500 1520 1540 1560 1580 1600 1620 1640 1660
Abso
rban
ce(a
.u.)
Wavenumber( )
Spectrum ComparisonFTIR DFIR+TDI DFIR
cm−1
200µm
USAF Target Mosaic Image
YX
Fig. 8. USAF mosaic image and spectral comparison. A USAF mosaic was composed bytaking multiple TDI passes and aligning images at their margins. Spectra are comparedbetween the proposed QCL-based DFIR+TDI system (blue), traditional DFIR imagingsystem (yellow) and FTIR system (green). The spectral range (1500 cm−1 to 1650 cm−1)was selected because it contained the major features of the SU8 photoresist. Outside of thisrange, the absorbance values become flat.
provide a compromise between current spread-beam QCL sources and confocal systems.Our current implementation averages 800 frames for noise reduction, providing an inferior
acquisition time when compared to existing FTIR instrumentation. Several approaches couldbe taken to mitigate this problem, the most straightforward being a reduction in the number offrames (ex. 100-200), which would improve acquisition time at a relatively low cost to SNR.Our selection of 800 frames was to take a conservative approach to demonstrate the viabilityof TDI for eliminating coherence affects. However, more optimal approaches would requiremodifications to the FPA design, in particular (a) the use of anisotropic arrays (ex. 256x16),which would likely provide a better detector SNR and a wider field of view, (b) on-board supportfor TDI would mitigating the need for software integration and likely improve frame rate, and (c)the ability to increase the frame rate with a corresponding reduction in integration time, which isnot supported by our commercial FPA (Teledyne Technologies, CA, USA). There is thereforesignificant room of improvement for optimizing DFIR+TDI imaging.
Vol. 9, No. 2 | 1 Feb 2018 | BIOMEDICAL OPTICS EXPRESS 841
0.0
1.2
0.6
0.9
0.3
(c)(b)(a)400µmY
X
Fig. 9. Mosaic images for breast tissue microarrays at the Amide I band (1650 cm−1).Mosaics are composed by taking multiple TDI passes and aligning along the image margin.
(a) (b)
200µm
(c)
YX
Fig. 10. Breast Tissue Microarrays images, (a) Brightfield image a breast biopsy stainedusing H&E; (b) absorbance image 1650 cm−1; (c) classified image identifying epithelium(green) and stroma (magenta).
Vol. 9, No. 2 | 1 Feb 2018 | BIOMEDICAL OPTICS EXPRESS 842

Funding
Cancer Prevention and Research Institute of Texas (CPRIT) #RR140013, the National Institutes ofHealth (NIH) / National Library of Medicine (NLM) #4 R00 LM011390-02, Agilent TechnologiesUniversity Relations Grant #3938 and National Science Foundation (NSF) grant #NSF-1151154.
Disclosures
The authors declare that there are no conflicts of interest related to this article.
Vol. 9, No. 2 | 1 Feb 2018 | BIOMEDICAL OPTICS EXPRESS 843