Embed Size (px)
Citation preview

miR-21 in the Extracellular Vesicles (EVs)of Cerebrospinal Fluid (CSF): A Platform
for Glioblastoma Biomarker DevelopmentThe Harvard community has made this
article openly available. Please share howthis access benefits you. Your story matters
Citation Akers, J. C., V. Ramakrishnan, R. Kim, J. Skog, I. Nakano, S.Pingle, J. Kalinina, et al. 2013. “miR-21 in the ExtracellularVesicles (EVs) of Cerebrospinal Fluid (CSF): A Platform forGlioblastoma Biomarker Development.” PLoS ONE 8 (10): e78115.doi:10.1371/journal.pone.0078115. http://dx.doi.org/10.1371/journal.pone.0078115.
Published Version doi:10.1371/journal.pone.0078115
Citable link http://nrs.harvard.edu/urn-3:HUL.InstRepos:11879153
Terms of Use This article was downloaded from Harvard University’s DASHrepository, and is made available under the terms and conditionsapplicable to Other Posted Material, as set forth at http://nrs.harvard.edu/urn-3:HUL.InstRepos:dash.current.terms-of-use#LAA

miR-21 in the Extracellular Vesicles (EVs) ofCerebrospinal Fluid (CSF): A Platform for GlioblastomaBiomarker DevelopmentJohnny C. Akers1☯, Valya Ramakrishnan1☯, Ryan Kim1, Johan Skog2, Ichiro Nakano3, Sandeep Pingle4,Juliya Kalinina6, Wei Hua7, Santosh Kesari4, Ying Mao7, Xandra O. Breakefield5, Fred H. Hochberg5, ErwinG. Van Meir6, Bob S. Carter1¶, Clark C. Chen1*
1 Center for Theoretical and Applied Neuro-Oncology, University of California, San Diego, California, United States of America, 2 Exosome Diagnostics, NewYork, New York, United States of America, 3 Dardinger Laboratory for Neurosciences, Department of Neurosurgery, Ohio State University,Columbus, Ohio,United States of America, 4 Department of Neurosciences, University of California, San Diego, California, United States of America, 5 Neurology Service,Massachusetts General Hospital, and Program in Neuroscience, Harvard Medical School, Boston, Massachusetts, United States of America, 6 Department ofNeurosurgery and Hematology & Medical Oncology, School of Medicine and Winship Cancer Institute, Emory University, Atlanta, Georgia, United States ofAmerica, 7 Department of Neurosurgery, Huashan Hospital, Fudan University, Shanghai, China
Abstract
Glioblastoma cells secrete extra-cellular vesicles (EVs) containing microRNAs (miRNAs). Analysis of these EVmiRNAs in the bio-fluids of afflicted patients represents a potential platform for biomarker development. However, theanalytic algorithm for quantitative assessment of EV miRNA remains under-developed. Here, we demonstrate thatthe reference transcripts commonly used for quantitative PCR (including GAPDH, 18S rRNA, and hsa-miR-103) wereunreliable for assessing EV miRNA. In this context, we quantitated EV miRNA in absolute terms and normalized thisvalue to the input EV number. Using this method, we examined the abundance of miR-21, a highly over-expressedmiRNA in glioblastomas, in EVs. In a panel of glioblastoma cell lines, the cellular levels of miR-21 correlated with EVmiR-21 levels (p<0.05), suggesting that glioblastoma cells actively secrete EVs containing miR-21. Consistent withthis hypothesis, the CSF EV miR-21 levels of glioblastoma patients (n=13) were, on average, ten-fold higher thanlevels in EVs isolated from the CSF of non-oncologic patients (n=13, p<0.001). Notably, none of the glioblastomaCSF harbored EV miR-21 level below 0.25 copies per EV in this cohort. Using this cut-off value, we were able toprospectively distinguish CSF derived from glioblastoma and non-oncologic patients in an independent cohort oftwenty-nine patients (Sensitivity=87%; Specificity=93%; AUC=0.91, p<0.01). Our results suggest that CSF EVmiRNA analysis of miR-21 may serve as a platform for glioblastoma biomarker development.
Citation: Akers JC, Ramakrishnan V, Kim R, Skog J, Nakano I, et al. (2013) miR-21 in the Extracellular Vesicles (EVs) of Cerebrospinal Fluid (CSF): APlatform for Glioblastoma Biomarker Development. PLoS ONE 8(10): e78115. doi:10.1371/journal.pone.0078115
Editor: Mike Chen, City of Hope, United States of America
Received May 8, 2013; Accepted September 9, 2013; Published October 21, 2013
Copyright: © 2013 Akers et al. This is an open-access article distributed under the terms of the Creative Commons Attribution License, which permitsunrestricted use, distribution, and reproduction in any medium, provided the original author and source are credited.
Funding: CCC is supported by the Doris Duke Charitable Foundation http://www.ddcf.org/, Sontag Foundation http://www.sontagfoundation.com/display.aspx?page=home, Burroughs Wellcome Fund http://www.bwfund.org/, Forbeck Foundation http://wgfrf.org/, and Kimmel Foundation http://www.kimmelfoundation.org/. The funders had no role in study design, data collection and analysis, decision to publish, or preparation of the manuscript.
Competing interests: We would like to declare that one of the co-author, Johan Skog, is an employee at Exosome Diagnostics. No other authors haveany competing interests. This does not alter our adherence to all the PLOS ONE policies on sharing data and materials.
* E-mail: [email protected]
☯ These authors contributed equally to this work.
Introduction
Glioblastoma is the most common form of primary braincancer and remains one of the deadliest of human cancers [1].Timely diagnosis and sensitive therapeutic monitoring remainmajor challenges in the treatment of this disease. Clinically,response evaluations are largely based on clinical examinationand Magnetic Resonance Imaging (MRI) [2]. However, bothclinical examination and MRI are insensitive measures of
disease status. For instance, the lowest resolution for reliabledetection by MRI is on the order of millimeters [3]. Consideringthe size of a tumor cell, this limitation in resolution translatesinto a delay of at least ten cell divisions before therapeuticresistance can be detected [4]. While repeated post-treatmentbiopsies constitute a monitoring option, this practice isassociated with significant morbidity [5,6]. In this context, lessinvasive platforms for therapeutic monitoring are needed.
PLOS ONE | www.plosone.org 1 October 2013 | Volume 8 | Issue 10 | e78115

Recent studies suggest that glioblastoma cells secreteextracellular vesicles (EVs) containing genetic materials thatmirror the intracellular tumor milieu, including tumor specificmutations and patterns of RNA expression [7–11]. These EVsare released into the local environment and transgressanatomic compartments into cerebrospinal fluid (CSF) and thesystemic blood circulation [7,8,12,13]. Analyses of these EVsoffer a potential platform for monitoring tumor presence,phenotypic/genotypic features, and pathophysiology[7,9,14,15]. The EVs shelter the tumor-specific genetic materialfrom the extracellular environment that is replete with RNAses[16,17] and preserve the integrity of these materials.Importantly, the genetic materials within EVs appear highlyenriched for RNAs in the size range of microRNAs (miRNAs)[9].
Since non-neoplastic cells secrete EVs [18–20] and they out-number neoplastic cells by several orders of magnitude in apatient [21], tumor-specific EVs remain a rarity in clinicalsamples [22]. As such, sensitive methods of amplification, suchas quantitative polymerase chain reactions (qPCR), arerequired for detection and quantitation of RNA in EVs [7,8,23].In the frequently used relative CT method of qPCR [24], thecellular abundance of a “query” transcript is assessed bydetermining the number of cycles of PCR required to reach athreshold quantity [25]. To correct for the quality and quantity ofthe input material, this cycle number is then normalized to thePCR cycles required for a reference transcript to reach thesame threshold [26]. This method assumes abundance andnear-homogeneity of the reference transcript level per cell[27,28].
Here we report that the commonly used reference transcriptsfor quantitation of cellular RNA, including GAPDH, 18S rRNA,and hsa-miR-103, are present in extremely low and highlyvaried levels within EVs (on the order of 1 copy per 103 to 104
EVs). Moreover, their relative abundance in EVs bears nocorrelation to the total EV number or RNA yield. In this context,we characterized the abundance of EV miRNAs in absoluteterms and normalized this value to the input EV particlenumbers. Using this method, we studied the level of hsa-miR-21, a miRNA that is highly over-expressed in glioblastomacells [29]. Our results indicate that miR-21 levels weresignificantly elevated in EVs isolated from the CSF ofglioblastoma patients relative to those derived from non-oncologic patients.
Materials and Methods
Clinical specimen collectionAll research performed were approved by IRB boards at
University of California, San Diego Human ResearchProtections Program and were in accordance with theprinciples expressed at the declaration at Helsinki. Each patientwas consented by a dedicated clinical research specialist priorto collection. Written consent was obtained for each patient.The consent process was approved by the ethics committee,and all records were documented in our electronic recordsystem. The written consent from patients was also scannedinto our electronic filing system. The serum and CSF
specimens for the initial, exploratory studies were collected atthe University of California San Diego Medical Center underIRB 120345X. The sera collection and an initial training CSFcollection were performed by CCC and BSC at the time ofsurgical procedure. The CSF was collected by ventricular/lumbar drain placement or cisternal aspiration at the time ofcraniotomy. Blood was collected using an 18 Gauge-needlevenipuncture into clot-activating blood collection tubes with gelseparator (BD vacutainer catalog #366450). Attention was paidto minimize mechanical tube agitation. The samples wereprocessed by spinning at 1,500 x g within 30 minutes ofcollection and the snap frozen [30]. The clinical diagnosis of thenon-oncologic patients who contributed blood samples were:severe head trauma (n=2), subarachnoid hemorrhage (n=2),and normal pressure hydrocephalus (n=1). The clinicaldiagnosis of the non-oncologic patients who contributed CSFsamples were: trauma (n=2), subarachnoid hemorrhage (n=8),normal pressure hydrocephalus (n=2), arteriovenousmalformation (n=2). All diagnoses of glioblastoma werehistologically confirmed. CSF specimens were snap frozen in-80 upon receipt and analyzed without further centrifugation.The CSF specimens for the validation study were generouslyprovided by Dr. Santosh Kesari (University of California, SanDiego; IRB 110551X) and Dr. Erwin Van Meri (EmoryUniversity, IRB 642-2005). 1-5 mL of CSF was collected fromeach patient through lumbar or ventricular puncture.
EV free media preparationEV-depleted medium was prepared by ultracentrifugation of
DMEM supplemented with 20% FBS at 120,000 x g for 18hours at 4°C. The medium was then diluted to a finalconcentration of 10% FBS and used to culture cell lines asdescribed.
Cell lines and cell cultureEleven human glioblastoma cell lines (A1207, A172, LN18,
LN340, LN464, T98G, U118, U373, U87MG, LN229, andLN235) [31] and 3 non-glioblastoma cell lines (A549, U20S,and 293T) [32–34] were cultured in DMEM supplemented with10% FBS. At 60-70% confluency, the standard culture mediumwas replaced with EV depleted medium. The cells werecultured for an additional 72 hours before EV collection fromthe cell-free supernatants. 9 neurosphere lines (1123, 326, 83,30, AC17, AC20, 84, BT70, and CMK3) were cultured inDMEM F12 supplemented with growth factors as describedpreviously [35–37]. Cell free supernatant was collected threedays after culturing for EV isolation.
Extracellular vesicle (EV) IsolationThe effect of freeze-thaw cycle on the stability of vesicular
content has not been well studied. In order to avoiddegradation of vesicles, all samples were processed promptlyupon thawing of serum and CSF samples. The EV fraction wasisolated by differential centrifugation [38]. Briefly, conditionedmedia or diluted bio-fluids were first centrifuged at 2,000 x g for20 minutes to remove cellular debris. The supernatant wascollected and further centrifuged at 10,000 x g for 30 minutes.The resultant supernatant was then transferred to
miR-21 in the Extracellular Vesicles of CSF
PLOS ONE | www.plosone.org 2 October 2013 | Volume 8 | Issue 10 | e78115

ultracentrifuge tubes for ultracentrifugation at 120,000 x g for 2hours. The supernatant was discarded and the EV pellets werere-suspended in 150μL of PBS for storage at -80°C prior toRNA isolation. All centrifugation steps were performed at 4°C.This protocol was designed to enrich for EVs in the 50-250 nmsize range (Figure 5).
EV Quantification and AssessmentThe number of vesicles recovered was determined by
Nanoparticle Tracking Analysis (NTA) on a NanosightLM-10HS in accordance to the manufacturer’s instructions(Nanosight, Wiltshire, UK). Resuspended vesicles were diluted1:40 to 1:200 with PBS before analysis. The purity of the EVisolated were assessed using electron microscopy aspreviously described [38] (Figure 1).
Quantitative Reverse Transcriptase-Polymerase ChainReaction (qRT-PCR)
RNA from the EV fraction was extracted using themirRCURY RNA Isolation Kit (Exiqon, Vedbaek, Denmark) permanufacturer’s protocol. RNA concentration and quality weredetermined using the NanoDrop ND-1000 Spectrophotometer(Thermo Scientific, Waltham, MA). For profiling GAPDH, 18SrRNA, miR-21, and miR-103 expression, cDNA wassynthesized with the miRCURY LNATM Universal RT microRNAPCR system (Exiqon). The resultant cDNA were diluted 20x forqRT-PCR. (See Table 1 for primer information).
Determination of copy numberTo determine the absolute copy numbers of GAPDH and
18S RNA in the cellular cytoplasm and in the EVs, a standardcurve for each gene was generated using serial dilutions ofknown quantity of U87MG genomic DNA. The copy number ofGAPDH and 18S RNA within the U87 genome was previouslydetermined by integrated sequencing efforts and comparativegenomic hybridization [39]. To determine copy number ofmiRNA (miR-103, miR-21), standard curves were generated byserial dilution of known quantities of miRNA mimic (Qiagen,Germantown, MD), followed by cDNA synthesis using themiRCURY LNATM Universal RT microRNA PCR system underconditions that allow one round of cDNA synthesis [40]. ThecDNAs were then used for the generation of standard curve.
Statistical AnalysisAll statistical analyses were performed using the GraphPad
Prism Software version 5 (GraphPad, La Jolla, CA). Correlationbetween GAPDH, 18S RNA, and miR-103 transcript level, EVRNA yield, and EV numbers were determined using Pearson’sCorrelation [41]. Difference in hsa-miR-21 level betweenglioblastoma and non-oncologic clinical samples wasdetermined using the student’s t-test (2 tailed) [42]. Sensitivity,specificity, positive predictive value (PPV), and negativepredictive value (NPV), Receiver Operating Characteristic(ROC) curve and Area Under the Curve (AUC) weredetermined as previously described [43].
Results
GAPDH, 18S rRNA, and hsa-miR-103 levels inglioblastoma cell line derived EVs
Housekeeping genes, such as GAPDH, 18S rRNA, andmiR-103, are expressed at high levels across cell types andexhibit little cell-to-cell variability relative to most query genes.As such, they are considered well-validated reference genes inthe expression profiling of cellular contents [27,28,44]. Theabsolute copy number of these transcripts in EVs, however,remains poorly characterized. Since the mechanisms by whichgenetic materials are transported from the cell into the EVsremain largely unknown [45], it is conceivable that EV transcriptlevels differ from their cellular expression levels. Despite thisknowledge gap, GADPH mRNA, 18s rRNA, and miR-103transcripts are frequently used as reference genes forquantitative analysis of EV-derived genetic materials [46–48]via the relative CT qPCR method [49–53].
We first determined the relative abundance of GAPDHmRNA, 18S rRNA, and hsa-miR-103 in EVs derived from 6glioblastoma and 2 non-glioblastoma adherent cell lines. Allthree transcripts were abundant in the cellular cytoplasm, withcopy numbers that ranged from 300 to 1,000 copies per cell forGAPDH, 100,000 to 1,000,000 copies for 18S rRNA, and 8,000to 80,000 copies for hsa-miR-103 (Table 1). These copynumbers are comparable to those previously published[54–57].
We next analyzed the level of reference transcripts in EVssecreted by these adherent cell lines. EVs were isolated byultracentrifugation and their numbers were determined byNanoparticle Tracking Analysis [58–61]. While all threetranscripts were detectable, their abundance in the EVs wereapproximately 105 -1010 fold lower than the levels detected inthe cellular cytoplasm. At most, an average of one copy ofGAPDH transcript was detected in 1,000 EVs; an average ofone 18S rRNA transcript was found in 40 EVs; an average ofone copy of miR-103 transcript was present in 750 EVs (Table1).
To determine whether reference housekeeping genes wouldserve as surrogate markers for the total RNA yield or the totalnumber of EVs, we analyzed the levels of GAPDH mRNA, 18SrRNA, and hsa-miR-103 in EVs isolated from 11 glioblastomaand 3 non-glioblastoma adherent cell lines (cultured underserum conditions). We observed that the level of the potentialreference transcripts varied by at least an order of magnitude inEVs isolated from different lines. The expression of the 18SrRNA and hsa-miR-103 demonstrated low correlation with EVRNA yield (Figure 1A) or EV number (Figure 1B). While EVGADPH transcript level demonstrated correlation with EV RNAyield and number, these correlations were not as robust asthose seen between cellular GAPDH transcript level and cellnumber (Figure 1C) or the RNA yield from cell extracts (Figure1D).
As cell lines cultured under neurosphere and serum-freeconditions may better recapitulate certain aspects ofglioblastoma biology [62,63], we quantitated the three potentialreference transcripts in the EVs isolated from nine glioblastomaneurosphere lines [35–37]. While GAPDH mRNA, 18S rRNA,
miR-21 in the Extracellular Vesicles of CSF
PLOS ONE | www.plosone.org 3 October 2013 | Volume 8 | Issue 10 | e78115
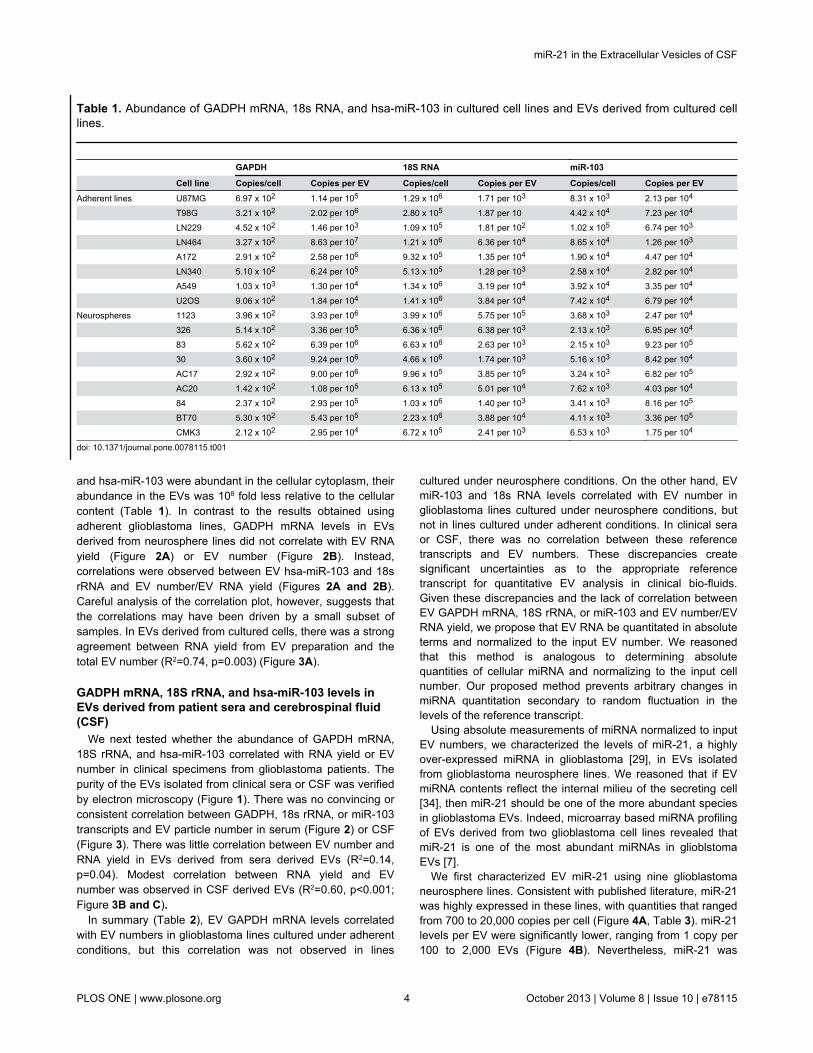
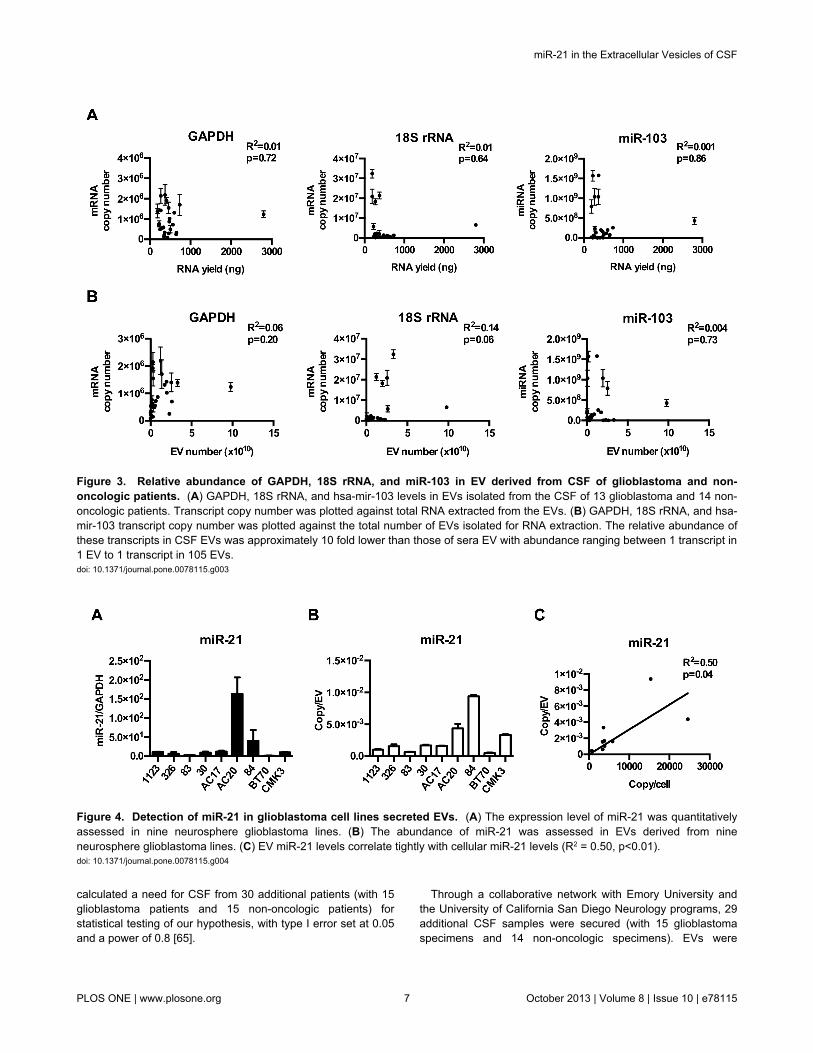
and hsa-miR-103 were abundant in the cellular cytoplasm, theirabundance in the EVs was 108 fold less relative to the cellularcontent (Table 1). In contrast to the results obtained usingadherent glioblastoma lines, GADPH mRNA levels in EVsderived from neurosphere lines did not correlate with EV RNAyield (Figure 2A) or EV number (Figure 2B). Instead,correlations were observed between EV hsa-miR-103 and 18srRNA and EV number/EV RNA yield (Figures 2A and 2B).Careful analysis of the correlation plot, however, suggests thatthe correlations may have been driven by a small subset ofsamples. In EVs derived from cultured cells, there was a strongagreement between RNA yield from EV preparation and thetotal EV number (R2=0.74, p=0.003) (Figure 3A).
GADPH mRNA, 18S rRNA, and hsa-miR-103 levels inEVs derived from patient sera and cerebrospinal fluid(CSF)
We next tested whether the abundance of GAPDH mRNA,18S rRNA, and hsa-miR-103 correlated with RNA yield or EVnumber in clinical specimens from glioblastoma patients. Thepurity of the EVs isolated from clinical sera or CSF was verifiedby electron microscopy (Figure 1). There was no convincing orconsistent correlation between GADPH, 18s rRNA, or miR-103transcripts and EV particle number in serum (Figure 2) or CSF(Figure 3). There was little correlation between EV number andRNA yield in EVs derived from sera derived EVs (R2=0.14,p=0.04). Modest correlation between RNA yield and EVnumber was observed in CSF derived EVs (R2=0.60, p<0.001;Figure 3B and C).
In summary (Table 2), EV GAPDH mRNA levels correlatedwith EV numbers in glioblastoma lines cultured under adherentconditions, but this correlation was not observed in lines
cultured under neurosphere conditions. On the other hand, EVmiR-103 and 18s RNA levels correlated with EV number inglioblastoma lines cultured under neurosphere conditions, butnot in lines cultured under adherent conditions. In clinical seraor CSF, there was no correlation between these referencetranscripts and EV numbers. These discrepancies createsignificant uncertainties as to the appropriate referencetranscript for quantitative EV analysis in clinical bio-fluids.Given these discrepancies and the lack of correlation betweenEV GAPDH mRNA, 18S rRNA, or miR-103 and EV number/EVRNA yield, we propose that EV RNA be quantitated in absoluteterms and normalized to the input EV number. We reasonedthat this method is analogous to determining absolutequantities of cellular miRNA and normalizing to the input cellnumber. Our proposed method prevents arbitrary changes inmiRNA quantitation secondary to random fluctuation in thelevels of the reference transcript.
Using absolute measurements of miRNA normalized to inputEV numbers, we characterized the levels of miR-21, a highlyover-expressed miRNA in glioblastoma [29], in EVs isolatedfrom glioblastoma neurosphere lines. We reasoned that if EVmiRNA contents reflect the internal milieu of the secreting cell[34], then miR-21 should be one of the more abundant speciesin glioblastoma EVs. Indeed, microarray based miRNA profilingof EVs derived from two glioblastoma cell lines revealed thatmiR-21 is one of the most abundant miRNAs in glioblstomaEVs [7].
We first characterized EV miR-21 using nine glioblastomaneurosphere lines. Consistent with published literature, miR-21was highly expressed in these lines, with quantities that rangedfrom 700 to 20,000 copies per cell (Figure 4A, Table 3). miR-21levels per EV were significantly lower, ranging from 1 copy per100 to 2,000 EVs (Figure 4B). Nevertheless, miR-21 was
Table 1. Abundance of GADPH mRNA, 18s RNA, and hsa-miR-103 in cultured cell lines and EVs derived from cultured celllines.
GAPDH 18S RNA miR-103
Cell line Copies/cell Copies per EV Copies/cell Copies per EV Copies/cell Copies per EVAdherent lines U87MG 6.97 x 10² 1.14 per 105 1.29 x 10⁶ 1.71 per 103 8.31 x 10³ 2.13 per 104
T98G 3.21 x 10² 2.02 per 106 2.80 x 10⁵ 1.87 per 10 4.42 x 10⁴ 7.23 per 104
LN229 4.52 x 10² 1.46 per 103 1.09 x 10⁵ 1.81 per 102 1.02 x 10⁵ 6.74 per 103
LN464 3.27 x 10² 8.63 per 107 1.21 x 10⁶ 6.36 per 104 8.65 x 10⁴ 1.26 per 103
A172 2.91 x 10² 2.58 per 106 9.32 x 10⁵ 1.35 per 104 1.90 x 10⁴ 4.47 per 104
LN340 5.10 x 10² 6.24 per 105 5.13 x 10⁵ 1.28 per 103 2.58 x 10⁴ 2.82 per 104
A549 1.03 x 10³ 1.30 per 104 1.34 x 10⁶ 3.19 per 104 3.92 x 10⁴ 3.35 per 104
U2OS 9.06 x 10² 1.84 per 104 1.41 x 10⁶ 3.84 per 104 7.42 x 10⁴ 6.79 per 104
Neurospheres 1123 3.96 x 10² 3.93 per 106 3.99 x 10⁶ 5.75 per 105 3.68 x 10³ 2.47 per 104
326 5.14 x 10² 3.36 per 105 6.36 x 10⁶ 6.38 per 103 2.13 x 10³ 6.95 per 104
83 5.62 x 10² 6.39 per 106 6.63 x 10⁶ 2.63 per 103 2.15 x 10³ 9.23 per 105
30 3.60 x 10² 9.24 per 106 4.66 x 10⁶ 1.74 per 103 5.16 x 10³ 8.42 per 104
AC17 2.92 x 10² 9.00 per 106 9.96 x 10⁵ 3.85 per 105 3.24 x 10³ 6.82 per 105
AC20 1.42 x 10² 1.08 per 105 6.13 x 10⁵ 5.01 per 104 7.62 x 10³ 4.03 per 104
84 2.37 x 10² 2.93 per 105 1.03 x 10⁶ 1.40 per 103 3.41 x 10³ 8.16 per 105
BT70 5.30 x 10² 5.43 per 105 2.23 x 10⁶ 3.88 per 104 4.11 x 10³ 3.36 per 105
CMK3 2.12 x 10² 2.95 per 104 6.72 x 10⁵ 2.41 per 103 6.53 x 10³ 1.75 per 104
doi: 10.1371/journal.pone.0078115.t001
miR-21 in the Extracellular Vesicles of CSF
PLOS ONE | www.plosone.org 4 October 2013 | Volume 8 | Issue 10 | e78115

consistently detectable in EVs isolated from all nine lines.Moreover, the EV miR-21 level correlated with the cellularmiR-21 level (R2=0.50; p<0.05), suggesting that EV miRNAanalysis may afford a window into the physiology of thesecreting cell (Figure 4C).
We also examined the effect of the culturing condition on theabundance of miR-21 in EVs. To this end, the CMK-3neurosphere cell line was adapted to growth as adherentculture in the presence of fetal bovine serum. Thisexperimental manipulation led to a nine-fold increase in thecellular level of miR-21. However, the abundance of miR-21 in
secreted EVs was decreased by approximately ten fold (Figure6). In a reciprocal experiment, adherent U87MG cells werecultured under neurosphere conditions. This adaptation led todecreased abundance of miR-21 in both cellular and EVcontents. These results suggest that glioblastoma growth underneurosphere conditions is associated with decreased cellularlevels of miR-21. While culturing conditions also significantlyimpact EV miR-21 level, these effects are less predictable.
Figure 1. Relative abundance of GAPDH, 18S rRNA, and miR-103 in glioblastoma cell line derived EVs. (A) GAPDH, 18SrRNA, and hsa-mir-103 levels in EVs isolated from 11 glioblastoma and 3 non-glioblastoma adherent cell lines, cultured underserum conditions. Transcript copy number was plotted against total RNA yield extracted from the EVs. (B) GAPDH, 18S rRNA, andhsa-mir-103 transcript copy number was plotted against the total number of EVs isolated for RNA extraction. (C) Cellular GAPDHtranscript number tightly correlated with the number of cells collected for RNA extraction and (D) the amount of RNA recovered.doi: 10.1371/journal.pone.0078115.g001
miR-21 in the Extracellular Vesicles of CSF
PLOS ONE | www.plosone.org 5 October 2013 | Volume 8 | Issue 10 | e78115

miR-21 levels in EVs isolated from glioblastoma andnon-oncologic patients
Since miR-21 is present in glioblastoma secreted EVs, ifthese EVs eventually reach bio-fluids such as blood or CSF,then the elevated levels of EV miR-21 in these bio-fluids mayserve to indicate the presence of tumor. This hypothesis pre-supposes that EVs secreted from normal cells harborsignificantly lowered levels of miR-21 relative to those ofglioblastoma EVs. As a first step toward testing this hypothesis,we determined whether miR-21 levels in clinical bio-fluids (seraand CSF) derived from glioblastoma patients differed fromthose of non-oncologic patients.
Since EVs bearing tumor specific RNAs have been detectedin blood [7], we tested whether miR-21 levels differed in EVsderived from the sera of 24 glioblastoma patients differed fromthose of 5 non-oncologic patients (2 trauma, 2 subarachnoidhemorrhage, 1 normal pressure hydrocephalus). On average,1.96x109 to 1.19x10¹¹ EVs were isolated from 2-5cc of sera.The level of EV miR-21 ranged from 0.21 to 10.35 copies/EV inthe glioblastoma patients and 0.21 to 14.30 copies/EV in thenon-oncologic patients. No statistically significant differencewas detected between these two groups (Figure 5A).
We hypothesized that the secretion of EV miR-21 byhematopoietic cells [64] might obscure glioblastoma EV miR-21in sera. Thus, we analyzed miR-21 levels in EVs from CSF of
glioblastoma (n=13) and non-oncologic patients (n=14). CSFEV miR-21 ranged from 0.14 to 1.04 copies/EV in glioblastomapatients and 5.26x10⁻⁴ to 1.48x10⁻¹ copies/EV in non-oncologicpatients. The difference between these two groups wasstatistically significant at p<0.001 (Figure 5B), suggesting thatCSF EV may be a platform for therapeutic monitoring of tumorpresence. We also noted that the bulk of miR-21 is locatedwithin EVs rather than freely floating in CSF, <10% of total CSFmiR-21 (Figure 5C) was detected in the EV depleted CSFfraction in samples collected from five independentglioblastoma patients. In our analysis, we noted that all of theCSFs derived from non-oncologic patients harbored EV miR-21level of < 0.25 copy/EV. Of note, the number of EVs as well asthe size distribution of EVs isolated from the bio-fluids ofglioblastoma patients did not significantly differ from thoseisolated from non-oncologic patients (Figures 4 and 5).
CSF EV miR-21 analysis in an independent cohortWe next wished determined whether such a threshold can be
utilized to discriminate CSF derived from glioblastoma patientsfrom those of non-oncologic patients in an independent cohort.In our initial cohort, the sensitivity, specificity, positivepredictive value (PPV), and negative predictive value (NPV)associated with EV miR-21 level of <0.25 copy/EV were 85%,100%, 100%, and 93%, respectively (Figure 6A). We
Figure 2. Relative abundance of GAPDH, 18S rRNA, and miR-103 in neurosphere glioblastoma line derived EVs. (A)GAPDH, 18S rRNA, and hsa-mir-103 levels in EVs isolated from 9 glioblastoma neurophere lines, cultured under serum-freeconditions. Transcript copy number was plotted against total RNA extracted from the EVs. (B) GAPDH, 18S rRNA, and hsa-mir-103transcript copy number was plotted against the total number of EVs isolated for RNA extraction.doi: 10.1371/journal.pone.0078115.g002
miR-21 in the Extracellular Vesicles of CSF
PLOS ONE | www.plosone.org 6 October 2013 | Volume 8 | Issue 10 | e78115
calculated a need for CSF from 30 additional patients (with 15glioblastoma patients and 15 non-oncologic patients) forstatistical testing of our hypothesis, with type I error set at 0.05and a power of 0.8 [65].
Through a collaborative network with Emory University andthe University of California San Diego Neurology programs, 29additional CSF samples were secured (with 15 glioblastomaspecimens and 14 non-oncologic specimens). EVs were
Figure 3. Relative abundance of GAPDH, 18S rRNA, and miR-103 in EV derived from CSF of glioblastoma and non-oncologic patients. (A) GAPDH, 18S rRNA, and hsa-mir-103 levels in EVs isolated from the CSF of 13 glioblastoma and 14 non-oncologic patients. Transcript copy number was plotted against total RNA extracted from the EVs. (B) GAPDH, 18S rRNA, and hsa-mir-103 transcript copy number was plotted against the total number of EVs isolated for RNA extraction. The relative abundance ofthese transcripts in CSF EVs was approximately 10 fold lower than those of sera EV with abundance ranging between 1 transcript in1 EV to 1 transcript in 105 EVs.doi: 10.1371/journal.pone.0078115.g003
Figure 4. Detection of miR-21 in glioblastoma cell lines secreted EVs. (A) The expression level of miR-21 was quantitativelyassessed in nine neurosphere glioblastoma lines. (B) The abundance of miR-21 was assessed in EVs derived from nineneurosphere glioblastoma lines. (C) EV miR-21 levels correlate tightly with cellular miR-21 levels (R2 = 0.50, p<0.01).doi: 10.1371/journal.pone.0078115.g004
miR-21 in the Extracellular Vesicles of CSF
PLOS ONE | www.plosone.org 7 October 2013 | Volume 8 | Issue 10 | e78115

isolated from these specimens, and miR-21 levels weredetermined. In this second and independent cohort, setting EVmiR-21 level of <0.25 copy/EV as the discriminating thresholdfor glioblastoma versus non-oncologic patients yieldedsensitivity, specificity, PPV, and NPV of 87%, 93%, 87%, and86%, respectively (Figure 6B). Receiver OperatingCharacteristics (ROC) curves for CSF EV miR-21 as abiomarker of glioblastoma tumor presence show an AUC of 0.9and p<0.01 (Figure 6C). In aggregate, these results supportCSF EV miR-21 as a feasible biomarker for the presence ofglioblastoma.
In aggregate, these results suggest that CSF EV miR-21constitutes a biomarker for the presence of glioblastoma cells.A corollary of this prediction is that surgical excision ofglioblastoma should be associated with a decrease in CSF EVmiR-21 level. We tested this prediction in a patient whounderwent CSF sampling at the time of glioblastoma surgeryand then at three months after a gross-total resection.Consistent with our hypothesis, the relative abundance ofmiR-21 in CSF EV was decreased by approximately 50-foldafter surgical resection (Figure 6D).
Table 2. Overview of robustness of reference transcripts inEVs derived from cell lines and bio-fluids.
Correlation with RNA yield Correlation with EV number
Sample type GAPDH 18S rRNA miR-103 GAPDH 18S rRNA miR-103Adherent lines + - - - - -Neurosphere lines - + + - + +
Serum NT NT NT - - -Cerebrospinal Fluid - - - - - -No correlation+. Significant correlation (R2>0.5 and p<0.05)NT: Not testedmiR-21 levels in EVs derived from glioblastoma cell linesdoi: 10.1371/journal.pone.0078115.t002
Table 3. Abundance of miR-21 in cultured neurospherelines and neurosphere derived EVs.
miR-21
Cell line Copies/cell Copies per vesicle1123 3.87 x 10³ 1.05 per 103
326 3.36 x 10³ 1.57 per 103
83 3.40 x 10³ 6.28 per 104
30 3.83 x 10³ 1.68 per 103
AC17 5.86 x 10³ 1.60 per 103
AC20 2.46 x 10⁴ 4.37 per 103
84 1.54 x 10⁴ 9.38 per 103
BT70 7.14 x 10² 4.80 per 104
CMK3 3.60 x 10³ 3.34 per 103
doi: 10.1371/journal.pone.0078115.t003
Discussion
Analysis of genetic material within glioblastoma secretedwithin EVs in bio-fluids represents a unique opportunity fordiagnosis and therapeutic monitoring. EVs isolated from bio-fluids can encompass exosomes, microvesicles, retrovirus-likeparticles (RLPs) and apoptotic bodies [66,67]. While themechanisms of their biogenesis may differ, genetic materialsfrom their originating cells have been detected in all types ofvesicles. Enrichment of miRNA in EV content [9] renders EVs aparticularly attractive platform.
The quantitative assessment of EV miRNAs requiresthoughtful considerations. Our study reveals that commonlyused reference transcripts (GADPH mRNA, 18S rRNA, andhsa-miR-103) were present at extremely low and variablelevels in EVs. Moreover, there were no consistent correlationsbetween the level of these transcripts and EV RNA yield or EVparticle numbers (Figure 3 and Figure 2). When comparing theEV particle numbers and the total amount of RNA extracted,we noted a strong correlation in systems such where there isonly one source of EV secreting cell (e.g. neurosphere culture;Figure 3A). Under these conditions, RNA yield serves as aneffective normalization method in place of EV number (Figure7A and 7B). However, in more complex samples such aspatient CSF, where EVs are likely secreted by multiple cells oforigin, the correlation between EV number and total RNA yieldare significantly lowered (Figure 3C). Because of theseobservations, we recommend quantifying EV miRNA inabsolute terms and normalizing to total EV number.
Using this method, we showed that EV miR-21 levels can beused to differentiate CSF isolated from glioblastoma patientsand CSF from non-oncologic patients. Importantly, our resultwas validated using multiple independent CSF collections. It isimportant to note that CSF is not routinely collected during thecourse of treatment for glioblastoma patients in the U.S. Thus,while the total number of CSF samples analyzed here isrelatively small, with a total of 28 glioblastoma CSF and 28non-oncologic CSF samples analyzed, our study represents anexhaustive analysis of CSF specimens collected by fourindependent investigators over a multi-year period. The resultspresented here provide a sound basis for a prospective, multi-center study to validate CSF EV miR-21 as a biomarker forassessing the presence of glioblastoma.
Recent studies suggest that circulating miRNA can exist intwo compartments: 1) outside of EV where they complex withArgonaut2, the catalytic component of the RNA-inducedsilencing complex (RISC) or high density lipoproteins; and 2)within EVs [68,69]. We add the finding that the majority of CSFmiR-21 is of EV origin. Additionally, the available data suggeststhat genetic material within EVs are quite stable in the CSF[70]. Thus, isolating CSF EV may enhance the sensitivity ofCSF miRNA based biomarker assays.
miR-21 was previously reported as a CSF biomarker forglioblastoma burden in a prior study [70], While our overallconclusion is generally consistent with this previous study, it isworthwhile noting the differences between the two. First,Teplyuk et. al. [70] measured the level of miR-21 in total CSFand not CSF EVs. Second, in the previous study, quantitative
miR-21 in the Extracellular Vesicles of CSF
PLOS ONE | www.plosone.org 8 October 2013 | Volume 8 | Issue 10 | e78115

assessment of miRNA in the CSF was performed using therelative CT methods using miR-24 and miR-125 as referencetranscripts. We tested whether miR-24 and miR-125 are
adequate reference transcripts for quantitative EV miRNAanalysis. While we observed modest to strong correlationsbetween miR-24/miR-125 expression and EV RNA yield and/or
Figure 5. Discrimination of glioblastoma disease status by CSF EV miR-21 analysis. (A) Comparable levels of miR-21 levelin sera EVs derived from 24 glioblastoma patients and 5 non-oncologic patients. (B) Elevated level of miR-21 in CSF EV derivedfrom 13 glioblastoma patients relative to 14 non-oncologic patients. (C) miR-21 is detected in CSF EV but not in EV depleted CSF insamples isolated from five independent glioblastoma patients. Patient 1, 2, 3, 4, and 5 correspond to T2, T7, T10, T12, and T13respectively from the UCSD glioblastoma cohort.doi: 10.1371/journal.pone.0078115.g005
miR-21 in the Extracellular Vesicles of CSF
PLOS ONE | www.plosone.org 9 October 2013 | Volume 8 | Issue 10 | e78115

total EV number in cells cultured under neurosphere conditions(Figure 8A), such correlations were not found in clinical CSFspecimens (Figure 8B). Using criteria established in our study,these results would suggest that miR-24 and miR-25 are notadequate reference transcripts for the quantitative miRNAanalysis of CSF EVs. Consistent with this proposition, Teplyuket. al. reported that miR-24 and miR-25 were present inrelatively low levels and varied between clinical specimens[70].
miR-21 expression is not unique to glioblastoma, it has beendetected in endothelial cells [71], normal breast tissue [72],cervical tissue [73], and hematopoietic cells [74]. While theexpression level of miR-21 in glioblastoma cells are generallyone to two orders of magnitude higher than those found innormal tissue [34], it is certainly conceivable that the normalcellular secretion of EV miR-21 may mask the presence of asmall number of glioblastoma EVs containing miR-21. WhenEVs isolated from sera were examined, this appeared to havebeen the case, as no significant differences in EV miR-21levels in could be detected between patients with and withoutglioblastoma (Figure 5A). However, Wang et. al. previouslyreported that plasma levels of miR-21 were significantly altered
in glioblastoma patients compared to normal controls [75]. Inthe context of our study, it is possible that EV independentmiR-21 significantly differed between glioblastoma and non-oncology patients. It is also worthwhile noting the technicaldifference in the method of miRNA quantitation between ourstudy and this previous study [75]. In the previous study, Wanget al. [75] quantitated miR-21 using the relative CT method, withmurine miR-29 as spike-in control. In contrast, our studyquantitated miR-21 in absolute terms and normalized to thenumber of EVs. Both methods harbor inherent advantages anddisadvantages [76]. The optimal method of miRNA quantitationin bio-fluids remains an unresolved issue and may be bio-fluiddependent.
In contrast to our sera derived results, miR-21 levels in theCSF of non-oncologic patients were extremely low bycomparison. The amount of miR-21per EV derived from theCSF of glioblastoma patients was, on average, ten-fold higherthan those derived from non-oncologic patients (Figure 5B).These results suggest that the normal tissues in contact withCSF secrete less miR-21/EV as compared to brain tissueharboring glioblastoma cells.
Figure 6. Elevated levels of CSF EV miR-21 are detected in glioblastoma patients. (A) Sensitivity, specificity, positivepredictive, and negative predictive values associated with EV miR-21 level of <0.25 copy/EV as a discriminating threshold forglioblastoma disease status in the initial exploratory study. (B) Sensitivity, specificity, positive predictive, and negative predictivevalues associated with EV miR-21 level of <0.25 copy/EV as a discriminating threshold for glioblastoma disease status in avalidation study. (C) Receiver Operating Characteristic Curve for EV miR-21 level of <0.25 copy/EV as a discriminating threshold forglioblastoma disease status. (D) Level of miR-21 in CSF EV from a glioblastoma patient at time of surgery and three months after agross-total resection. The relative abundance of miR-21 in CSF EV was decreased by approximately 50-fold after surgical resection.doi: 10.1371/journal.pone.0078115.g006
miR-21 in the Extracellular Vesicles of CSF
PLOS ONE | www.plosone.org 10 October 2013 | Volume 8 | Issue 10 | e78115

Our studies raised several important questions. AlthoughEVs in CSF appear to be enriched for miR-21, we have littledata on the sub-speciation of these EVs in terms of size, zetapotential, shape, or type [67]. Equally uncertain is the origin ofCSF EV miR-21, which may be from glioblastoma orassociated endothelial, ependymal or inflammatory cells[77,78]. To the extent that we consistently observed thesecretion of miR-21 containing EVs from all glioblastoma cellsexamined, we propose that these vesicles contribute to thepresence of hsa-miR-21 in the CSF. However, this remains apoint of uncertainty. Finally, with the emergence of the conceptof glioblastoma subtypes [79], whether subtyping can beachieved through CSF EV miRNA analysis remains animportant question,
In sum, our study delineates miR-21 levels in absolute termsas number of copies per EV and provides data suggesting theutility of CSF EV miRNA analysis as a biomarker forglioblastoma patients. It is likely that other glioblastoma EVmiRNAs [80] may be similarly exploited as diagnosticbiomarkers.
Supporting Information
Figure S1. Electron micrograph of EVs isolated from CSF.EVs were isolated from CSF by differential centrifugation andanalyzed by transmission electron microscopy. Scale barrepresents 200nm in (A) and 100nm in (B). EVs in the sizerange of 50-250nm were observed.(EPS)
Figure S2. Relative abundance of GAPDH, 18S RNA, andmiR-103 in EV derived from sera of glioblastoma and non-oncologic patients. GAPDH, 18S rRNA, and hsa-mir-103transcript copy number was plotted against the total number ofEVs isolated for RNA extraction. The relative abundance ofthese transcripts in EV ranged between 1 transcript in 7 EVs to1 transcript in 106 EVs.(EPS)
Figure S3. Correlation between EV number and RNA yield.For each sample, the RNA yield from EV preparations for (A)neurosphere cell lines, (B) Serum samples, and (C) CSFsamples were plotted on the X-axis; the input EV number forthese two datasets were plotted on the Y axis. There wasexcellent correlation between the RNA yield and the EVpreparation in neurosphere lines, the correlation was poor inserum samples.(EPS)
Figure S4. Abundance of EVs per cc of biofluids. (A)Abundance of EVs per cc of serum in glioblastoma and non-oncogenic patients. There was no significant differencebetween tumor and control samples. (B) Abundance of EVs percc of CSF in glioblastoma and non-oncogenic patients. Nosignificant differences were observed.
(EPS)
Figure S5. Average size profile of EVs isolated frombiofluids. (A) Average size distribution of EVs isolated fromserum of glioblastoma and non-oncogenic patients. There wasno significant difference between tumor and control samples.(B) Average size distribution of EVs isolated from the CSF ofglioblastoma and non-oncogenic patients. No significant sizedifferences were observed.(EPS)
Figure S6. Effects of culturing condition on miR-21expression in cells and EVs. Glioblastoma cell lines U87MGand CMK3 were grown under adherent or neurospherecondition and the miR-21 level in cells or EVs were quantitated.(EPS)
Figure S7. Normalization of EV miR-21 by RNA yield. (A)The expression level of miR-21 was quantitatively assessed innine neurosphere glioblastoma lines using total RNA yield asnormalization parameter. (B) Comparison of normalizationmethod revealed good correlation between normalizing by EVparticle number or total RNA yield in cell culure. (C) Levels ofmiR-21 in EVs isolated from glioblastoma and non-oncologicpatients normalized by RNA yield. (D) Correlation betweennormalization by EV number or total RNA yield in CSF.(EPS)
Figure S8. Relative abundance of miR-24 and miR-125 inEVs derived from neurosphere glioblastoma cell lines andCSF of glioblastoma and non-oncologic patients. has-miR-24 and has-miR-125 levels in EV isolated from from (A) 9glioblastoma neurophere lines, cultured under serum-freeconditions or (B) from CSF of 13 glioblastoma and 14 non-oncologic patients were plotted against total RNA extractedfrom the EVs or against the total number of EVs isolated forRNA extraction.(EPS)
Table S1. List of primers used.(DOCX)
Acknowledgements
We would like to thank Jie Li, Ying Shen, David Gonda, DiahnnFutalan, Tyler Steed and Zack Taich for critical reading of themanuscript and helpful advice.
Author Contributions
Conceived and designed the experiments: JCA VR CCC.Performed the experiments: JCA VR. Analyzed the data: SKSP JK EVM IN RK FH BSC XOB JS. Contributed reagents/materials/analysis tools: SK SP JK EVM IN RK FH BSC XOBJS WH YM. Wrote the manuscript: JCA VR CCC.
miR-21 in the Extracellular Vesicles of CSF
PLOS ONE | www.plosone.org 11 October 2013 | Volume 8 | Issue 10 | e78115

References
1. Van Meir EG, Hadjipanayis CG, Norden AD, Shu HK, Wen PY et al.(2012) Exciting new advances in neuro-oncology: the avenue to a curefor malignant glioma. CA Cancer J Clin 60: 166-193. PubMed:20445000.
2. Grossman SA, Batara JF (2004) Current management of glioblastomamultiforme. Semin Oncol 31: 635-644. doi:10.1053/j.seminoncol.2004.07.005. PubMed: 15497116.
3. Sorensen AG, Batchelor TT, Wen PY, Zhang WT, Jain RK (2008)Response criteria for glioma. Nat Clin Pract Oncol 5: 634-644. doi:10.1038/ncponc1204. PubMed: 18711427.
4. Teodori L, Albertini MC, Uguccioni F, Falcieri E, Rocchi MB et al.(2006) Static magnetic fields affect cell size, shape, orientation, andmembrane surface of human glioblastoma cells, as demonstrated byelectron, optic, and atomic force microscopy. Cytometry A 69: 75-85.PubMed: 16419064.
5. Air EL, Leach JL, Warnick RE, McPherson CM (2009) Comparing therisks of frameless stereotactic biopsy in eloquent and noneloquentregions of the brain: a retrospective review of 284 cases. J Neurosurg111: 820-824. doi:10.3171/2009.3.JNS081695. PubMed: 19408980.
6. Chen CC, Hsu PW, Erich Wu TW, Lee ST, Chang CN et al. (2009)Stereotactic brain biopsy: Single center retrospective analysis ofcomplications. Clin Neurol Neurosurg 111: 835-839. doi:10.1016/j.clineuro.2009.08.013. PubMed: 19765887.
7. Skog J, Würdinger T, van Rijn S, Meijer DH, Gainche L et al. (2008)Glioblastoma microvesicles transport RNA and proteins that promotetumour growth and provide diagnostic biomarkers. Nat Cell Biol 10:1470-1476. doi:10.1038/ncb1800. PubMed: 19011622.
8. Balaj L, Lessard R, Dai L, Cho YJ, Pomeroy SL et al. (2011) Tumourmicrovesicles contain retrotransposon elements and amplifiedoncogene sequences. Nat Commun 2: 180. doi:10.1038/ncomms1180.PubMed: 21285958.
9. Noerholm M, Balaj L, Limperg T, Salehi A, Zhu LD et al. (2012) RNAexpression patterns in serum microvesicles from patients withglioblastoma multiforme and controls. BMC Cancer 12: 22. doi:10.1186/1471-2407-12-22. PubMed: 22251860.
10. Hong BS, Cho JH, Kim H, Choi EJ, Rho S et al. (2009) Colorectalcancer cell-derived microvesicles are enriched in cell cycle-relatedmRNAs that promote proliferation of endothelial cells. BMC Genomics10: 556. doi:10.1186/1471-2164-10-556. PubMed: 19930720.
11. Rabinowits G, Gerçel-Taylor C, Day JM, Taylor DD, Kloecker GH(2009) Exosomal microRNA: a diagnostic marker for lung cancer. ClinLung Cancer 10: 42-46. doi:10.3816/CLC.2009.n.006. PubMed:19289371.
12. Camussi G, Deregibus MC, Bruno S, Grange C, Fonsato V et al. (2011)Exosome/microvesicle-mediated epigenetic reprogramming of cells.Am J Cancer Res 1: 98-110. PubMed: 21969178.
13. Street JM, Barran PE, Mackay CL, Weidt S, Balmforth C et al. (2012)Identification and proteomic profiling of exosomes in humancerebrospinal fluid. J Transl Med 10: 5. doi:10.1186/1479-5876-10-S3-O5. PubMed: 22221959.
14. Shao H, Chung J, Balaj L, Charest A, Bigner DD et al. (2012) Proteintyping of circulating microvesicles allows real-time monitoring ofglioblastoma therapy. Nat Med 18: 1835-1840. doi:10.1038/nm.2994.PubMed: 23142818.
15. Taylor DD, Gercel-Taylor C (2008) MicroRNA signatures of tumor-derived exosomes as diagnostic biomarkers of ovarian cancer. GynecolOncol 110: 13-21. doi:10.1016/j.ygyno.2008.04.033. PubMed:18589210.
16. Thery C (2011) Exosomes: secreted vesicles and intercellularcommunications. F1000. Biol Reprod 3: 15.
17. Li L, Zhu D, Huang L, Zhang J, Bian Z et al. (2012) Argonaute 2complexes selectively protect the circulating microRNAs in cell-secreted microvesicles. PLOS ONE 7: e46957. doi:10.1371/journal.pone.0046957. PubMed: 23077538.
18. Raposo G, Nijman HW, Stoorvogel W, Liejendekker R, Harding CV etal. (1996) B lymphocytes secrete antigen-presenting vesicles. J ExpMed 183: 1161-1172. doi:10.1084/jem.183.3.1161. PubMed: 8642258.
19. Blanchard N, Lankar D, Faure F, Regnault A, Dumont C et al. (2002)TCR activation of human T cells induces the production of exosomesbearing the TCR/CD3/zeta complex. J Immunol 168: 3235-3241.PubMed: 11907077.
20. Taylor DD, Akyol S, Gercel-Taylor C (2006) Pregnancy-AssociatedExosomes and Their Modulation of T Cell Signaling. J Immunol 176:1534-1542. PubMed: 16424182.
21. Alberts B, Johnson A, Lewis J (2002) Molecular Biology of the Cell.New York: Garland Sciences.
22. D'Souza-Schorey C, Clancy JW (2012) Tumor-derived microvesicles:shedding light on novel microenvironment modulators and prospectivecancer biomarkers. Genes Dev 26: 1287-1299. doi:10.1101/gad.192351.112. PubMed: 22713869.
23. Hunter MP, Ismail N, Zhang X, Aguda BD, Lee EJ et al. (2008)Detection of microRNA expression in human peripheral bloodmicrovesicles. PLOS ONE 3: e3694. doi:10.1371/journal.pone.0003694. PubMed: 19002258.
24. Livak KJ, Schmittgen TD (2001) Analysis of relative gene expressiondata using real-time quantitative PCR and the 2(-Delta Delta C(T))Method. Methods 25: 402-408. doi:10.1006/meth.2001.1262. PubMed:11846609.
25. VanGuilder HD, Vrana KE, Freeman WM (2008) Twenty-five years ofquantitative PCR for gene expression analysis. BioTechniques 44:619-626. PubMed: 18474036.
26. Bustin SA (2000) Absolute quantification of mRNA using real-timereverse transcription polymerase chain reaction assays. J MolEndocrinol 25: 169-193. doi:10.1677/jme.0.0250169. PubMed:11013345.
27. Suzuki T, Higgins PJ, Crawford DR (2000) Control selection for RNAquantitation. BioTechniques 29: 332-337. PubMed: 10948434.
28. Thellin O, Zorzi W, Lakaye B, De Borman B, Coumans B et al. (1999)Housekeeping genes as internal standards: use and limits. J Biotechnol75: 291-295. doi:10.1016/S0168-1656(99)00163-7. PubMed:10617337.
29. Chan JA, Krichevsky AM, Kosik KS (2005) MicroRNA-21 Is anAntiapoptotic Factor in Human Glioblastoma Cells. Cancer Res 65:6029-6033. doi:10.1158/0008-5472.CAN-05-0137. PubMed: 16024602.
30. Witwer KW, Buzás EI, Bemis LT, Lässer C, Lötvall J, et al. (In press)Standardisation of sample collection, isolation and analysis methods inextracellular vesicle research: A position paper arising from the 2012ISEV Workshop on RNA in extracellular vesicles. Journal ofExtracellular Vesicles.
31. Ishii N, Maier D, Merlo A, Tada M, Sawamura Y et al. (1999) Frequentco-alterations of TP53, p16/CDKN2A, p14ARF, PTEN tumorsuppressor genes in human glioma cell lines. Brain Pathol 9: 469-479.doi:10.1111/j.1750-3639.1999.tb00536.x. PubMed: 10416987.
32. Giard DJ, Aaronson SA, Todaro GJ, Arnstein P, Kersey JH et al. (1973)In vitro cultivation of human tumors: establishment of cell lines derivedfrom a series of solid tumors. J Natl Cancer Inst 51: 1417-1423.PubMed: 4357758.
33. Pontén J, Saksela E (1967) Two established in vitro cell lines fromhuman mesenchymal tumours. Int J Cancer 2: 434-447. doi:10.1002/ijc.2910020505. PubMed: 6081590.
34. DuBridge RB, Tang P, Hsia HC, Leong PM, Miller JH et al. (1987)Analysis of mutation in human cells by using an Epstein-Barr virusshuttle system. Mol Cell Biol 7: 379-387. PubMed: 3031469.
35. Joshi K, Banasavadi-Siddegowda Y, Mo X, Kim SH, Mao P et al.(2013) MELK-dependent FOXM1 Phosphorylation is Essential forProliferation of Glioma Stem Cells. Stem Cells, 31: 1051–63. PubMed:23404835.
36. Ng K, Nitta M, Hu L, Kesari S, Kung A et al. (2009) A small interferenceRNA screen revealed proteasome inhibition as strategy forglioblastoma therapy. Clin Neurosurg 56: 107-118. PubMed: 20214041.
37. Gu C, Banasavadi-Siddegowda YK, Joshi K, Nakamura Y, Kurt H et al.(2013) Tumor-specific Activation of the c-JUN/MELK PathwayRegulates Glioma Stem Cell Growth in a p53-dependent Manner. StemCells.
38. Théry C, Amigorena S, Raposo G, Clayton A (2006) Isolation andcharacterization of exosomes from cell culture supernatants andbiological fluids. Curr Protoc Cell Biol Chapter 3: Unit 3.22: Unit 3 22.PubMed: 18228490
39. Clark MJ, Homer N, O'Connor BD, Chen Z, Eskin A et al. (2010)U87MG Decoded: The Genomic Sequence of a CytogeneticallyAberrant Human Cancer Cell Line. PLOS Genet 6: e1000832. PubMed:20126413.
40. Trang P, Wiggins JF, Daige CL, Cho C, Omotola M et al. (2011)Systemic delivery of tumor suppressor microRNA mimics using aneutral lipid emulsion inhibits lung tumors in mice. Mol Ther 19:1116-1122. doi:10.1038/mt.2011.48. PubMed: 21427705.
41. Stigler S (1989) Francis Galton's Account of the Invention ofCorrelation. Stat Sci 4: 7.
42. STUDENT (1908) THE PROBABLE ERROR OF A MEAN. Biometrika6: 1-25. doi:10.2307/2331554.
43. Zweig MH, Campbell G (1993) Receiver-operating characteristic (ROC)plots: a fundamental evaluation tool in clinical medicine. Clin Chem 39:561-577. PubMed: 8472349.
miR-21 in the Extracellular Vesicles of CSF
PLOS ONE | www.plosone.org 12 October 2013 | Volume 8 | Issue 10 | e78115

44. Wotschofsky Z, Meyer H-A, Jung M, Fendler A, Wagner I et al. (2011)Reference genes for the relative quantification of microRNAs in renalcell carcinomas and their metastases. Anal Biochem 417: 233-241. doi:10.1016/j.ab.2011.06.009. PubMed: 21741950.
45. Gonda DD, Akers JC, Kim R, Kalkanis SN, Hochberg FH et al. (2013)Neuro-oncologic Applications of Exosomes, Microvesicles, and OtherNano-Sized Extracellular Particles. Neurosurgery 72: 501-510. doi:10.1227/NEU.0b013e3182846e63. PubMed: 23277376.
46. Huan J, Hornick NI, Shurtleff MJ, Skinner AM, Goloviznina NA et al.(2013) RNA Trafficking by Acute Myelogenous Leukemia Exosomes.Cancer Res 73: 918-929. doi:10.1158/0008-5472.CAN-12-2184.PubMed: 23149911.
47. Rana S, Malinowska K, Zöller M (2013) Exosomal Tumor MicroRNAModulates Premetastatic Organ Cells. Neoplasia 15: 281-295.PubMed: 23479506.
48. Xiao D, Ohlendorf J, Chen Y, Taylor DD, Rai SN et al. (2012)Identifying mRNA, MicroRNA and Protein Profiles of MelanomaExosomes. PLOS ONE 7: e46874. doi:10.1371/journal.pone.0046874.PubMed: 23056502.
49. de Biase D, Visani M, Morandi L, Marucci G, Taccioli C et al. (2012)miRNAs Expression Analysis in Paired Fresh/Frozen and DissectedFormalin Fixed and Paraffin Embedded Glioblastoma Using Real-TimePCR. PLOS ONE 7: e35596. doi:10.1371/journal.pone.0035596.PubMed: 22530056.
50. Bangert A, Cristofanon S, Eckhardt I, Abhari BA, Kolodziej S et al.(2012) Histone deacetylase inhibitors sensitize glioblastoma cells toTRAIL-induced apoptosis by c-myc-mediated downregulation of cFLIP.Oncogene 31: 4677-4688. doi:10.1038/onc.2011.614. PubMed:22266862.
51. Wang H, Shen W, Huang H, Hu L, Ramdas L et al. (2003) Insulin-likegrowth factor binding protein 2 enhances glioblastoma invasion byactivating invasion-enhancing genes. Cancer Res 63: 4315-4321.PubMed: 12907597.
52. Jarboe JS, Johnson KR, Choi Y, Lonser RR, Park JK (2007)Expression of interleukin-13 receptor alpha2 in glioblastomamultiforme: implications for targeted therapies. Cancer Res 67:7983-7986. doi:10.1158/0008-5472.CAN-07-1493. PubMed: 17804706.
53. Ehtesham M, Winston JA, Kabos P, Thompson RC (2006) CXCR4expression mediates glioma cell invasiveness. Oncogene 25:2801-2806. doi:10.1038/sj.onc.1209302. PubMed: 16407848.
54. Santangelo PJ, Alonas E, Jung J, Lifland AW, Zurla C (2012) Probesfor intracellular RNA imaging in live cells. Methods Enzymol 505:383-399. doi:10.1016/B978-0-12-388448-0.00028-0. PubMed:22289464.
55. Barber RD, Harmer DW, Coleman RA, Clark BJ (2005) GAPDH as ahousekeeping gene: analysis of GAPDH mRNA expression in a panelof 72 human tissues. Physiol Genomics 21: 389-395. doi:10.1152/physiolgenomics.00025.2005. PubMed: 15769908.
56. Wada Y, Li D, Merley A, Zukauskas A, Aird WC et al. (2011) A multi-gene transcriptional profiling approach to the discovery of cell signaturemarkers. Cytotechnology 63: 25-33. doi:10.1007/s10616-010-9315-8.PubMed: 20972619.
57. Visani M, de Biase D, Marucci G, Taccioli C, Baruzzi A et al. (2013)Definition of miRNAs expression profile in glioblastoma samples: therelevance of non-neoplastic brain reference. PLOS ONE 8: e55314.doi:10.1371/journal.pone.0055314. PubMed: 23383149.
58. Filipe V, Hawe A, Jiskoot W (2010) Critical evaluation of NanoparticleTracking Analysis (NTA) by NanoSight for the measurement ofnanoparticles and protein aggregates. Pharm Res 27: 796-810. doi:10.1007/s11095-010-0073-2. PubMed: 20204471.
59. Wright M (2012) Nanoparticle tracking analysis for the multiparametercharacterization and counting of nanoparticle suspensions. MethodsMol Biol 906: 511-524. PubMed: 22791460.
60. Gercel-Taylor C, Atay S, Tullis RH, Kesimer M, Taylor DD (2012)Nanoparticle analysis of circulating cell-derived vesicles in ovariancancer patients. Anal Biochem 428: 44-53. doi:10.1016/j.ab.2012.06.004. PubMed: 22691960.
61. Vallhov H, Gutzeit C, Johansson SM, Nagy N, Paul M et al. (2011)Exosomes containing glycoprotein 350 released by EBV-transformed Bcells selectively target B cells through CD21 and block EBV infection invitro. J Immunol 186: 73-82. doi:10.4049/jimmunol.1001145. PubMed:21106852.
62. Galli R, Binda E, Orfanelli U, Cipelletti B, Gritti A et al. (2004) Isolationand characterization of tumorigenic, stem-like neural precursors from
human glioblastoma. Cancer Res 64: 7011-7021. doi:10.1158/0008-5472.CAN-04-1364. PubMed: 15466194.
63. Lee J, Kotliarova S, Kotliarov Y, Li A, Su Q et al. (2006) Tumor stemcells derived from glioblastomas cultured in bFGF and EGF moreclosely mirror the phenotype and genotype of primary tumors than doserum-cultured cell lines. Cancer Cell 9: 391-403. doi:10.1016/j.ccr.2006.03.030. PubMed: 16697959.
64. Caby MP, Lankar D, Vincendeau-Scherrer C, Raposo G, Bonnerot C(2005) Exosomal-like vesicles are present in human blood plasma. IntImmunol 17: 879-887. doi:10.1093/intimm/dxh267. PubMed: 15908444.
65. Chang A (2013) StatsToDo website. Available: www.statstodo.com.Accessed 2013 March 4.
66. Raposo Ga Stoorvogel W (2013) Extracellular vesicles: Exosomes,microvesicles, and friends. J Cell Biol 200: 373-383. doi:10.1083/jcb.201211138. PubMed: 23420871.
67. Akers JC, Gonda D, Kim R, Carter BS, Chen CC (2013) Biogenesis ofextracellular vesicles (EV): exosomes, microvesicles, retrovirus-likevesicles, and apoptotic bodies. J Neuro Oncol 113: 1-11. doi:10.1007/s11060-013-1084-8. PubMed: 23456661.
68. Arroyo JD, Chevillet JR, Kroh EM, Ruf IK, Pritchard CC et al. (2011)Argonaute2 complexes carry a population of circulating microRNAsindependent of vesicles in human plasma. Proc Natl Acad Sci U S A108: 5003-5008. doi:10.1073/pnas.1019055108. PubMed: 21383194.
69. Boon RA, Vickers KC (2013) Intercellular transport of microRNAs.Arterioscler Thromb Vasc Biol 33: 186-192. doi:10.1161/ATVBAHA.112.300139. PubMed: 23325475.
70. Teplyuk NM, Mollenhauer B, Gabriely G, Giese A, Kim E et al. (2012)MicroRNAs in cerebrospinal fluid identify glioblastoma and metastaticbrain cancers and reflect disease activity. Neuro-Oncology 14:689-700. doi:10.1093/neuonc/nos074. PubMed: 22492962.
71. Guduric-Fuchs J, O'Connor A, Cullen A, Harwood L, Medina RJ et al.(2012) Deep sequencing reveals predominant expression of miR-21amongst the small non-coding RNAs in retinal microvascularendothelial cells. J Cell Biochem 113: 2098-2111. doi:10.1002/jcb.24084. PubMed: 22298343.
72. Qi L, Bart J, Tan LP, Platteel I, Sluis Tv et al. (2009) Expression ofmiR-21 and its targets (PTEN, PDCD4, TM1) in flat epithelial atypia ofthe breast in relation to ductal carcinoma in situ and invasivecarcinoma. BMC Cancer 9: 163. doi:10.1186/1471-2407-9-163.PubMed: 19473551.
73. Deftereos G, Corrie SR, Feng Q, Morihara J, Stern J et al. (2011)Expression of Mir-21 and Mir-143 in Cervical Specimens Ranging fromHistologically Normal through to Invasive Cervical Cancer. PLOS ONE6: e28423. doi:10.1371/journal.pone.0028423. PubMed: 22194833.
74. Bhagat TD, Zhou L, Sokol L, Kessel R, Caceres G et al. (2013) miR-21mediates hematopoietic suppression in MDS by activating TGF-betasignaling. Blood 121: 2875-2881. doi:10.1182/blood-2011-12-397067.PubMed: 23390194.
75. Wang Q, Li P, Li A, Jiang W, Wang H et al. (2012) Plasma specificmiRNAs as predictive biomarkers for diagnosis and prognosis ofglioma. J Exp Clin Cancer Res 31: 97. doi:10.1186/1756-9966-31-97.PubMed: 23174013.
76. Huggett J, Dheda K, Bustin S, Zumla A (2005) Real-time RT-PCRnormalisation; strategies and considerations. Genes Immun 6: 279-284.doi:10.1038/sj.gene.6364190. PubMed: 15815687.
77. Tran Thang NN, Derouazi M, Philippin G, Arcidiaco S, Di Berardino-Besson W et al. (2010) Immune infiltration of spontaneous mouseastrocytomas is dominated by immunosuppressive cells from earlystages of tumor development. Cancer Res 70: 4829-4839. doi:10.1158/0008-5472.CAN-09-3074. PubMed: 20501837.
78. Ghosh A, Chaudhuri S (2010) Microglial action in glioma: a boon turnsbane. Immunol Lett 131: 3-9. doi:10.1016/j.imlet.2010.03.003. PubMed:20338195.
79. Verhaak RG, Hoadley KA, Purdom E, Wang V, Qi Y et al. (2010)Integrated genomic analysis identifies clinically relevant subtypes ofglioblastoma characterized by abnormalities in PDGFRA, IDH1, EGFR,and NF1. Cancer Cell 17: 98-110. doi:10.1016/j.ccr.2009.12.020.PubMed: 20129251.
80. Møller HG, Rasmussen AP, Andersen HH, Johnsen KB, Henriksen Met al. (2013) A systematic review of microRNA in glioblastomamultiforme: micro-modulators in the mesenchymal mode of migrationand invasion. Mol Neurobiol 47: 131-144. doi:10.1007/s12035-012-8349-7. PubMed: 23054677.
miR-21 in the Extracellular Vesicles of CSF
PLOS ONE | www.plosone.org 13 October 2013 | Volume 8 | Issue 10 | e78115