Embed Size (px)
Citation preview

MINING THE DIGITAL INFORMATION NETWORKS

This page intentionally left blank
M
Alexa
Mining
Proceedi
Bl
Bl
ander Techn
Amst
g the D
N
ngs of the
on Elec
Nik
lekinge Instit
P
lekinge Instit
Panayi
nological Edu
terdam • Ber
Digital
Network
17th Intern
ctronic Pub
Edited by
klas Lave
tute of Techn
Peter Lind
tute of Techn
and
ota Polyd
ucational Ins
rlin • Tokyo •
l Infor
ks
national Co
blishing
y
sson
nology, Swed
de
nology, Swed
doratou
stitute of The
• Washingto
rmation
onference
den
den
essaloniki, G
n, DC
n
Greece

© 2013 The authors and IOS Press.
All rights reserved. No part of this book may be reproduced, stored in a retrieval system,
or transmitted, in any form or by any means, without prior written permission from the publisher.
ISBN 978-1-61499-269-1 (print)
ISBN 978-1-61499-270-7 (online)
Library of Congress Control Number: 2013941588
Publisher
IOS Press BV
Nieuwe Hemweg 6B
1013 BG Amsterdam
Netherlands
fax: +31 20 687 0019
e-mail: [email protected]
Distributor in the USA and Canada
IOS Press, Inc.
4502 Rachael Manor Drive
Fairfax, VA 22032
USA
fax: +1 703 323 3668
e-mail: [email protected]
LEGAL NOTICE
The publisher is not responsible for the use which might be made of the following information.
PRINTED IN THE NETHERLANDS
Preface
The main theme of the 17th International Conference on Electronic Publishing
(ELPUB) concerns different ways to extract and process data from the vast wealth of
digital publishing and how to use and reuse this information in innovative social con-
texts in a sustainable way. We bring together researchers and practitioners to discuss
data mining, digital publishing and social networks along with their implications for
scholarly communication, information services, e-learning, e-businesses, the cultural
heritage sector, and other areas where electronic publishing is imperative.
ELPUB 2013 received 36 paper submissions. The peer review process resulted in
the acceptance of 16 papers. From the accepted papers, 8 were submitted as full papers
and 8 as extended abstracts. These papers were grouped into sessions based on the fol-
lowing topics: Data Mining and Intelligent Computing, Publishing and Access, and
Social Computing and Practices.
James MacGregor and Karen Meijer-Kline from the Public Knowledge Project
(Simon Fraser University Library, Canada) lead the pre-conference workshop on
June 12. The workshop is entitled “The Future of E-publishing: An Introduction to
Open Journal Systems & Open Monograph Press”.
The main program on June 13–14 features two keynotes. Stephan Shakespeare
(YouGov, UK) will deliver a keynote entitled “Getting value out of our digital trace: a
strategy for unleashing the economic and justice potential of data sharing”. Professor
Felix S. Wu (University of California at Davis, USA) will deliver a keynote entitled
“Social computing leveraging online social informatics”. ELPUB 2013 also features a
panel discussion entitled “Setting research data free – problems and solutions”. The
panel consists of the aforementioned keynote speakers as well as Professor David
Rosenthal (Stanford University, USA) and Hans Jörgen Marker (Swedish National
Data Service, Sweden).
We believe that the topics featured in the program of this year’s ELPUB confer-
ence are diverse and exciting. Firstly, we would like to thank members of the ELPUB
Executive Committee who, together with the Local Advisory Committee, provided
valuable advice and assistance during the entire process of the organization. Secondly,
we would like to thank our colleagues in the Program Committee who helped in assur-
ing the quality of the conference throughout the peer reviewing process. Lastly, we
acknowledge the Local Organization team for making sure that all efforts materialized
into a very interesting scientific event. Thank you all for helping us maintain the quali-
ty of ELPUB and deserve the trust of our authors and attendees.
We wish you all a good conference and we say farewell hoping to see you again in
Greece for the next installment of the conference in 2014!
Niklas Lavesson, Peter Linde, and Panayiota Polydoratou (editors)
Mining the Digital Information NetworksN. Lavesson et al. (Eds.)© 2013 The authors and IOS Press.This article is published online with Open Access by IOS Press and distributed under the termsof the Creative Commons Attribution Non-Commercial License.
v

This page intentionally left blank

Organizing Chairs
General Chair: Niklas Lavesson – Blekinge Institute of Technology (Sweden)
Programme Chair: Panayiota Polydoratou – Alexander Technological Educational
Institute of Thessaloniki (Greece)
Organizing Chair: Peter Linde – Blekinge Institute of Technology (Sweden)
Executive Committee
John Smith – University of Kent at Canterbury (UK)
Peter Linde – Blekinge Institute of Technology (Sweden)
Karel Jezek – University of West Bohemia in Pilsen (Czech Republic)
Ana Alice Baptista – University of Minho (Portugal)
Sely Costa – University of Brasília (Brazil)
Jan Engelen – Catholic University of Leuven (Belgium)
Mícheál Mac An Airchinnigh – Trinity College Dublin (Ireland)
Bob Martens – Vienna University of Technology (Austria)
Leslie Chan – University of Toronto (Canada)
Susanna Mornati – CILEA (Italy)
Turid Hedlund – Swedish School of Economics and BA, Helsinki (Finland)
Yasar Tonta – Hacettepe University (Turkey)
Alexander Technological Educational Institute of Thessaloniki (Greece)
Milena Dobreva, University of Malta
Local Organization Team
Maria Engberg – Blekinge Institute of Technology (Sweden)
Bo Helgeson – Blekinge Institute of Technology (Sweden)
Henric Johnson – Blekinge Institute of Technology (Sweden)
Michaela Linge – Blekinge Institute of Technology (Sweden)
Eva Norling – Blekinge Institute of Technology (Sweden)
Ewa Osękowska – Blekinge Institute of Technology (Sweden)
vii
Programme Committee
Alvim, Luísa – University of Évora (Portugal)
Ayris, Paul – University College of London (UK)
Baptista, Ana Alice – University of Minho (Portugal)
Björnshauge, Lars – SPARC Europe (Denmark)
Bolter, Jay David – Georgia Institute of Technology (USA)
Borges, Maria Manuel – University of Coimbra (Portugal)
Chan, Leslie – University of Toronto Scarborough (Canada)
Coleman, Ross – University of Sydney (Australia)
Delgado, Jaime – Universitat Politècnica de Catalunya (Spain)
Engberg, Maria – Blekinge Institute of Technology (Sweden)
Engelen, Jan – Katholieke Universiteit Leuven (Belgium)
Fitzpatrick, Kathleen – Modern Language Association (USA)
Gabriel, David – University of Porto (Portugal)
Garoufallou, Emmanouel – Technological Educational Institute of Thessaloniki
(Greece)
Gathegi, John – University of South Florida (USA)
Griffin Speer, Julie – Virginia Tech (USA)
Hagerlid, Jan – Consultant (Sweden)
Hedlund, Turid – Hanken School of Economics (Finland)
Jamali, Hamid – Kharazmi University (IRAN)
Jezek, Karel – University of West Bohemia in Pilsen (Czech Republic)
Johnson, Henric – Blekinge Institute of Technology (Sweden)
Johnson, Ian M. – The Robert Gordon University (Scotland)
Koprinska, Irena – University of Sydney (Australia)
Kurbanoglu, Serap – Hacettepe University (Turkey)
Lavesson, Niklas – Blekinge Institute of Technology (Sweden)
Linde, Peter – Blekinge Institute of Technology (Sweden)
Mac An Airchinnigh, Micheal – Trinity College Dublin (Ireland)
Martens, Bob – Vienna University of Technology (Austria)
Martzoukou, Konstantina – University of Malta (Malta)
Mele, Salvatore – CERN (Switzerland)
Moreira, Fernando – Portucalense University (Portugal)
Mornati, Susanna – CILEA (Italy)
Nisheva-Pavlova, Maria – Sofia University (Bulgaria)
Polydoratou, Panayiota – ATEI of Thessaloniki (Greece)
Pryor, Graham – Digital Curation Centre (UK)
Quaresma, Paulo – University of Évora (Portugal)
Rauber, Andreas – Vienna University of Technology (Austria)
Sachini, Evi – National Documentation Centre (Greece)
Savenije, Bas – Utrecht University Library (The Netherlands)
Schranz, Markus – Pressetext Austria (Austria)
Schimmer, Ralf – Max Planck Digital Library (Germany)
Serrano, Anabela – Politechnical Institute of Porto (Portugal)
Slavic, Aida – UDCC (UK)
van de Sompel, Herbert – Los Alamos National Laboratory (USA)
viii

Sousa Pinto, Joaquim – University of Aveiro (Portugal)
Strufe, Thorsten – TU Darmstadt (Germany)
Svensson, Aina – Uppsala University (Sweden)
Tenopir, Carol – University of Tennessee (USA)
de Waard, Anita – Elsevier Labs and Utrecht Institute of Linguistics (Netherlands)
Warner, Simeon – Cornell University (USA)
Virkus, Sirje – Tallinn University (Estonia)
Wu, Felix S. – University of California at Davis (USA)
ix

This page intentionally left blank
Contents
Preface v
Niklas Lavesson, Peter Linde and Panayiota Polydoratou
Organizing Chairs, Executive Committee, Local Organization Team,
Programme Committee vii
Full Research Articles
Data Mining and Intelligent Computing
The Shattered Document Approach to Adaptive Hypertext. Design and Evaluation 3
Mário Amado Alves
3D Gesture-Based Exploration and Search in Document Collections 13
Angélica de Antonio, Cristian Moral, Daniel Klepel and Martín J. Abente
Cover Sheets Considered Harmful 23
Emma L. Tonkin, Stephanie Taylor and Gregory J.L. Tourte
Publishing and Access
Me4DCAP V0.1: A Method for the Development of Dublin Core Application
Profiles 33
Mariana Curado Malta and Ana Alice Baptista
Social Computing and Practices
COMFy – A Conference Management Framework 45
Christian Caldera, René Berndt and Dieter W. Fellner
Full Professional Articles
Data Mining and Intelligent Computing
Deduplication of Metadata Harvested from Open Archives Initiative Repositories 57
Piotr Wendykier
Publishing and Access
Facilitating Access and Reuse of Research Materials: The Case of the European
Library 67
Nuno Freire
PlosOpenR Exploring FP7 Funded PLOS Publications 77
Najko Jahn, Martin Fenner and Jochen Schirrwagen
xi
Extended Abstracts
The extended abstracts are available in full text online from:
http://elpub.scix.net/cgi-bin/works/Home
Data Mining and Intelligent Computing
Making Sense of a Flat List of Terms into Linked Open Data SKOS Vocabularies 89
Helder Noel Firmino and Ana Alice Baptista
Publishing and Access
Does Openness and Open Access Policy Relate to the Success of Universities 90
Pekka Olsbo
Usage Data of an Open Access e-Journal in a Digital Repository 91
Teresa S. Welsh and Stacy Creel
Publisher Interest Towards a Role for Journals in Data-Sharing: The Findings
of the JoRD Project 92
Marianne Bamkin, Jane Smith, Paul Sturges, Azhar Hussein and
Bill Hubbard
Opening Up Digital Publications – Suggestions for Making Humanities Data
Available for Research 93
Henriette Roued-Cunliffe
Repositories Recreated – Working Towards Improved Interoperability and
Integration by a Co-Operative Approach in Sweden 94
Stefan Andersson and Aina Svensson
Towards an e-Publishing Library Service in Humanities and Social Sciences:
A Feasibility Study 95
Rosa Di Cesare, Silvia Giannini and Daniela Luzi
Social Computing and Practices
Making Social Interactions Accessible in Online Social Networks 97
Fredrik Erlandsson, Roosbeh Nia, Henric Johnson and Felix Wu
Subject Index 99
Author Index 101
xii

Full Research Articles

This page intentionally left blank
The Shattered Document Approach to
Adaptive Hypertext. Design and
Evaluation
Mario AMADO ALVES a,1
a LIAAD-INESC TEC. [email protected]
Abstract. We address the problem of improving, automatically, the usability of
a large online document. We propose an adaptive hypertext approach, based on
splitting the document into components smaller than the page or screen, called
noogramicles, and creating each page as a new assemblage of noogramicles each
time it is accessed. The adaptation comes from learning the navigation patterns
of the usors (authors and readers), and is manifested in the assemblage of pages.
We test this model across a number of configurations, including chance and non-
adaptive systems. We evaluate our model through simulation. We have designed
a simulator based on established findings about the behaviour of hypertext users.
We have realised a quantitative evaluation based on hypertext usability measures
adapted to the problem: session size, session cost.
Keywords. H.3.3 Information Search and Retrieval / Information filtering, Retrieval
models, Search process, H.5.1 Multimedia Information Systems / Evaluation/methodology,
H.5.4 Hypertext/Hypermedia / Theory, I.2.0 General / Cognitive simulation, I.2.6
Learning / Connectionism and neural nets, Algorithms, Design, Experimentation,
Theory, adaptive hypertext, spreading activation
1. Introduction
We study the large online document, and how its utilization might be improved by means
of adaptive hypertext features. Large means an extent such that the document cannot be
seen all at once. In other words: large = (much) larger than a screenful.
The overall process of hypertextualization and hypertext adaptation is depicted in
figure 1. The Document state represents a conventional document, or else a poorly struc-
tured para-document like a set of forum posts, a wiki, etc. The hypertextualization step
consists in casting this content into an Hypertextual form that can be adapted. The aim
of adaptation is to have this form evolve onto a Better hypertext, by learning from the
navigation patterns of the users (or some other adaptative input).
A classical example of adaptive hypertext at the service of improved utilization of a
large online document is the Knowledge Sea II system [1], applied to a manual of C, in
a programming language learning environment.
1This work is financed by the ERDF – European Regional Development Fund through the COMPETE
Programme (operational programme for competitiveness) and by National Funds through the FCT – Fundacao
para a Ciencia e a Tecnologia (Portuguese Foundation for Science and Technology) within project FCOMP -
01-0124-FEDER-022701.
Mining the Digital Information NetworksN. Lavesson et al. (Eds.)© 2013 The authors and IOS Press.This article is published online with Open Access by IOS Press and distributed under the termsof the Creative Commons Attribution Non-Commercial License.doi:10.3233/978-1-61499-270-7-3
3
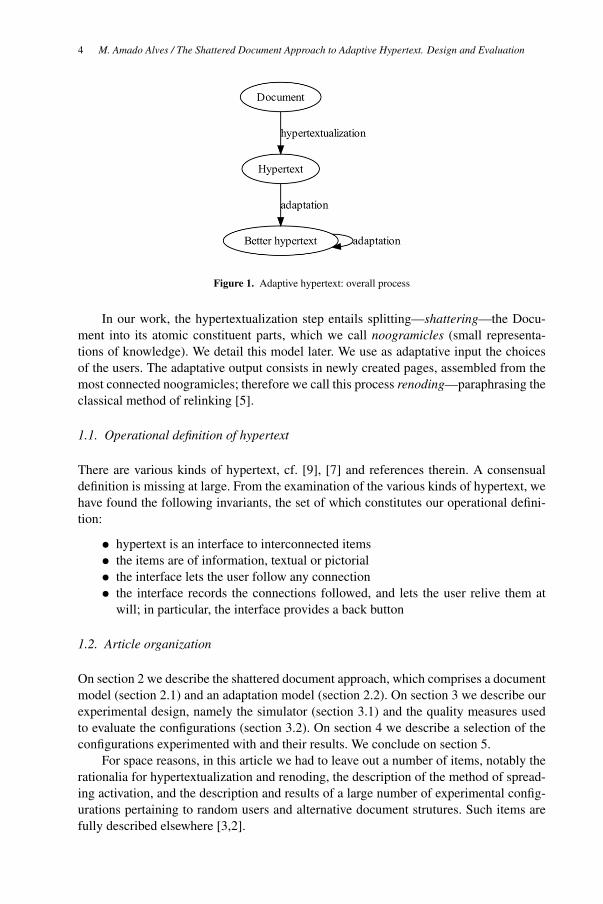
Figure 1. Adaptive hypertext: overall process
In our work, the hypertextualization step entails splitting—shattering—the Docu-
ment into its atomic constituent parts, which we call noogramicles (small representa-
tions of knowledge). We detail this model later. We use as adaptative input the choices
of the users. The adaptative output consists in newly created pages, assembled from the
most connected noogramicles; therefore we call this process renoding—paraphrasing the
classical method of relinking [5].
1.1. Operational definition of hypertext
There are various kinds of hypertext, cf. [9], [7] and references therein. A consensual
definition is missing at large. From the examination of the various kinds of hypertext, we
have found the following invariants, the set of which constitutes our operational defini-
tion:
• hypertext is an interface to interconnected items
• the items are of information, textual or pictorial
• the interface lets the user follow any connection
• the interface records the connections followed, and lets the user relive them at
will; in particular, the interface provides a back button
1.2. Article organization
On section 2 we describe the shattered document approach, which comprises a document
model (section 2.1) and an adaptation model (section 2.2). On section 3 we describe our
experimental design, namely the simulator (section 3.1) and the quality measures used
to evaluate the configurations (section 3.2). On section 4 we describe a selection of the
configurations experimented with and their results. We conclude on section 5.
For space reasons, in this article we had to leave out a number of items, notably the
rationalia for hypertextualization and renoding, the description of the method of spread-
ing activation, and the description and results of a large number of experimental config-
urations pertaining to random users and alternative document strutures. Such items are
fully described elsewhere [3,2].
M. Amado Alves / The Shattered Document Approach to Adaptive Hypertext. Design and Evaluation4
1.1.21. 1.1 1.1.1
Figure 2. Standard hypertextualization of the sequential structure.
C
N N
N
N
1. 1.1 1.1.1N NC
C
C C N
N
C
C
C
(simile)
C
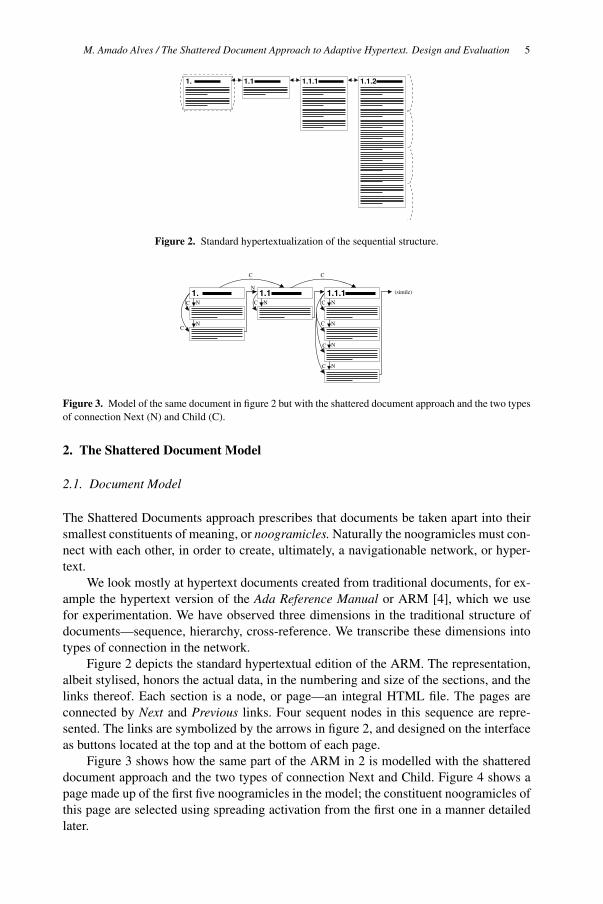
Figure 3. Model of the same document in figure 2 but with the shattered document approach and the two types
of connection Next (N) and Child (C).
2. The Shattered Document Model
2.1. Document Model
The Shattered Documents approach prescribes that documents be taken apart into their
smallest constituents of meaning, or noogramicles. Naturally the noogramicles must con-
nect with each other, in order to create, ultimately, a navigationable network, or hyper-
text.
We look mostly at hypertext documents created from traditional documents, for ex-
ample the hypertext version of the Ada Reference Manual or ARM [4], which we use
for experimentation. We have observed three dimensions in the traditional structure of
documents—sequence, hierarchy, cross-reference. We transcribe these dimensions into
types of connection in the network.
Figure 2 depicts the standard hypertextual edition of the ARM. The representation,
albeit stylised, honors the actual data, in the numbering and size of the sections, and the
links thereof. Each section is a node, or page—an integral HTML file. The pages are
connected by Next and Previous links. Four sequent nodes in this sequence are repre-
sented. The links are symbolized by the arrows in figure 2, and designed on the interface
as buttons located at the top and at the bottom of each page.
Figure 3 shows how the same part of the ARM in 2 is modelled with the shattered
document approach and the two types of connection Next and Child. Figure 4 shows a
page made up of the first five noogramicles in the model; the constituent noogramicles of
this page are selected using spreading activation from the first one in a manner detailed
later.
M. Amado Alves / The Shattered Document Approach to Adaptive Hypertext. Design and Evaluation 5
parag. of sec. 1.1, resp.)
1.11.1
1.
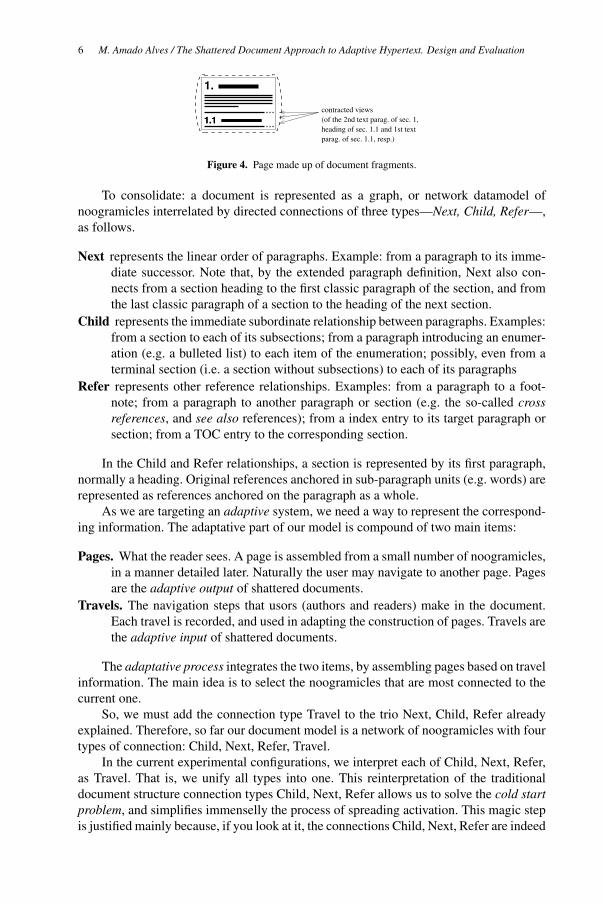
contracted views(of the 2nd text parag. of sec. 1,heading of sec. 1.1 and 1st text
Figure 4. Page made up of document fragments.
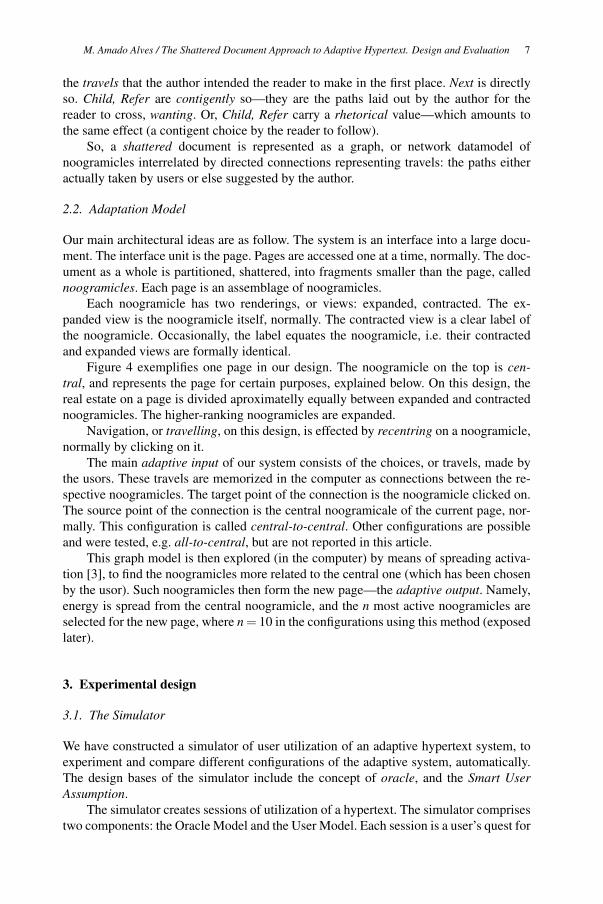
To consolidate: a document is represented as a graph, or network datamodel of
noogramicles interrelated by directed connections of three types—Next, Child, Refer—,
as follows.
Next represents the linear order of paragraphs. Example: from a paragraph to its imme-
diate successor. Note that, by the extended paragraph definition, Next also con-
nects from a section heading to the first classic paragraph of the section, and from
the last classic paragraph of a section to the heading of the next section.
Child represents the immediate subordinate relationship between paragraphs. Examples:
from a section to each of its subsections; from a paragraph introducing an enumer-
ation (e.g. a bulleted list) to each item of the enumeration; possibly, even from a
terminal section (i.e. a section without subsections) to each of its paragraphs
Refer represents other reference relationships. Examples: from a paragraph to a foot-
note; from a paragraph to another paragraph or section (e.g. the so-called crossreferences, and see also references); from a index entry to its target paragraph or
section; from a TOC entry to the corresponding section.
In the Child and Refer relationships, a section is represented by its first paragraph,
normally a heading. Original references anchored in sub-paragraph units (e.g. words) are
represented as references anchored on the paragraph as a whole.
As we are targeting an adaptive system, we need a way to represent the correspond-
ing information. The adaptative part of our model is compound of two main items:
Pages. What the reader sees. A page is assembled from a small number of noogramicles,
in a manner detailed later. Naturally the user may navigate to another page. Pages
are the adaptive output of shattered documents.
Travels. The navigation steps that usors (authors and readers) make in the document.
Each travel is recorded, and used in adapting the construction of pages. Travels are
the adaptive input of shattered documents.
The adaptative process integrates the two items, by assembling pages based on travel
information. The main idea is to select the noogramicles that are most connected to the
current one.
So, we must add the connection type Travel to the trio Next, Child, Refer already
explained. Therefore, so far our document model is a network of noogramicles with four
types of connection: Child, Next, Refer, Travel.
In the current experimental configurations, we interpret each of Child, Next, Refer,
as Travel. That is, we unify all types into one. This reinterpretation of the traditional
document structure connection types Child, Next, Refer allows us to solve the cold startproblem, and simplifies immenselly the process of spreading activation. This magic step
is justified mainly because, if you look at it, the connections Child, Next, Refer are indeed
M. Amado Alves / The Shattered Document Approach to Adaptive Hypertext. Design and Evaluation6
the travels that the author intended the reader to make in the first place. Next is directly
so. Child, Refer are contigently so—they are the paths laid out by the author for the
reader to cross, wanting. Or, Child, Refer carry a rhetorical value—which amounts to
the same effect (a contigent choice by the reader to follow).
So, a shattered document is represented as a graph, or network datamodel of
noogramicles interrelated by directed connections representing travels: the paths either
actually taken by users or else suggested by the author.
2.2. Adaptation Model
Our main architectural ideas are as follow. The system is an interface into a large docu-
ment. The interface unit is the page. Pages are accessed one at a time, normally. The doc-
ument as a whole is partitioned, shattered, into fragments smaller than the page, called
noogramicles. Each page is an assemblage of noogramicles.
Each noogramicle has two renderings, or views: expanded, contracted. The ex-
panded view is the noogramicle itself, normally. The contracted view is a clear label of
the noogramicle. Occasionally, the label equates the noogramicle, i.e. their contracted
and expanded views are formally identical.
Figure 4 exemplifies one page in our design. The noogramicle on the top is cen-tral, and represents the page for certain purposes, explained below. On this design, the
real estate on a page is divided aproximatelly equally between expanded and contracted
noogramicles. The higher-ranking noogramicles are expanded.
Navigation, or travelling, on this design, is effected by recentring on a noogramicle,
normally by clicking on it.
The main adaptive input of our system consists of the choices, or travels, made by
the usors. These travels are memorized in the computer as connections between the re-
spective noogramicles. The target point of the connection is the noogramicle clicked on.
The source point of the connection is the central noogramicale of the current page, nor-
mally. This configuration is called central-to-central. Other configurations are possible
and were tested, e.g. all-to-central, but are not reported in this article.
This graph model is then explored (in the computer) by means of spreading activa-
tion [3], to find the noogramicles more related to the central one (which has been chosen
by the usor). Such noogramicles then form the new page—the adaptive output. Namely,
energy is spread from the central noogramicle, and the n most active noogramicles are
selected for the new page, where n = 10 in the configurations using this method (exposed
later).
3. Experimental design
3.1. The Simulator
We have constructed a simulator of user utilization of an adaptive hypertext system, to
experiment and compare different configurations of the adaptive system, automatically.
The design bases of the simulator include the concept of oracle, and the Smart UserAssumption.
The simulator creates sessions of utilization of a hypertext. The simulator comprises
two components: the Oracle Model and the User Model. Each session is a user’s quest for
M. Amado Alves / The Shattered Document Approach to Adaptive Hypertext. Design and Evaluation 7
the noogramicle that will respond to their reference question, or information need. Such
noogramicle is called the oracle of the session. The simulator draws a random oracle for
each session. The random distribution of oracles is called the Oracle Model.The simulated user, or User Model consists in a function Choice which selects a page
item. It acts as the user clicking on a hyperlink to follow. The Smart User Assumptionasserts that a human user chooses the right link if the link label is clear about the distal
content. For the case when the oracle is only one click away, the label clearly identifies
the oracle, and therefore the user selects the item easily. When the oracle is further away
than one click, the intelligence or intuition of the user takes place to select the item most
likely to lead to the goal. The results in [5] and [10] are interpretable as support for this
assumption.
Given these premises, the Choice function can be designed as a choice of the page
item most likely to lead to the oracle. In our implementation this is done via spreading
activation from the atom, until a page item X is reached, such that X has not been seen
or visited before in the same session. The most active item represents the item most
connected to the oracle, globally.
The session ends upon reaching the oracle (successful session), or else a maximum
session size (number of pages) has been breached (unsuccessful session).
3.2. Quality measures
We introduce the hypertext usability or quality measure of session cost as a refinement
of the well established measure of session size = number of pages = number of clicks - 1.
Session cost is a combination of session size with a few extra factors of cognitive effortassociated with poorer or null navigational aids, longer pages (requiring scroll), and a
large quantity of links (requiring more examination). This is necessary because we want
to compare across different configurations, and, on the limit, a configuration of only one
large page containing the entire document has always the best possible session size of
1—thus unfairly winning the competition even before the start!
It sounds natural, practical, reasonable, to extend the unit of session size, the page,
to this new unit of session cost. Let us call it the session cost point, or just point. We for-
malize session cost as the sum of the cognitive effort terms involved. We have identified
the extra cognitive factors described below. For each factor, we introduce a formula for
its contribution to the cognitive cost. These factors affect the page. Naturally, the session
cost is the summation of the page costs.
We quantify cognitive effort in points directly related to the session size component.
We establish a basis: for a configuration of no scroll and a fixed, low page size (quantity
of page items, or links) of at most 10, we equate session cost with session size, and
therefore define a fixed page cost value of 1 point. From this basis we define page cost
for non-trivial pages as follows.
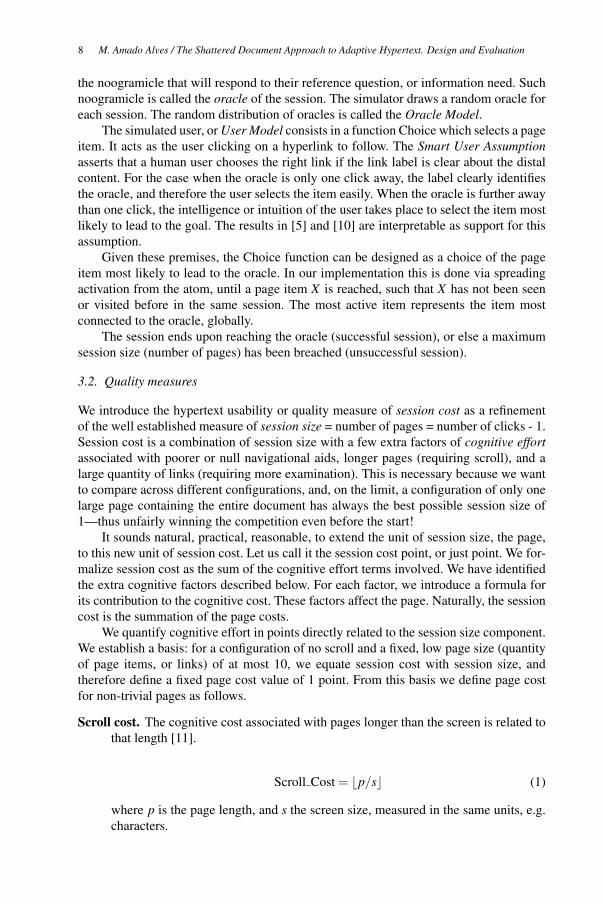
Scroll cost. The cognitive cost associated with pages longer than the screen is related to
that length [11].
Scroll Cost = �p/s� (1)
where p is the page length, and s the screen size, measured in the same units, e.g.
characters.
M. Amado Alves / The Shattered Document Approach to Adaptive Hypertext. Design and Evaluation8
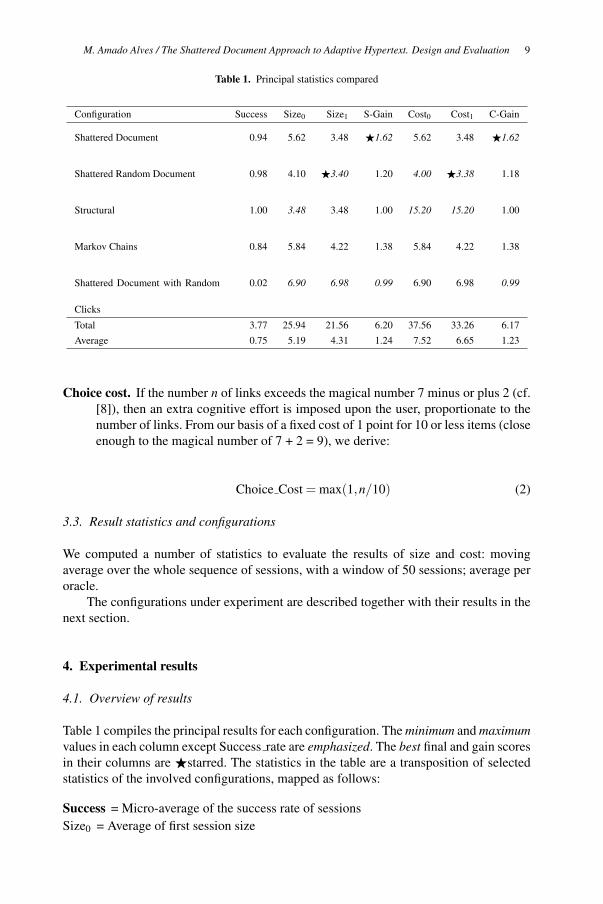
Table 1. Principal statistics compared
Choice cost. If the number n of links exceeds the magical number 7 minus or plus 2 (cf.
[8]), then an extra cognitive effort is imposed upon the user, proportionate to the
number of links. From our basis of a fixed cost of 1 point for 10 or less items (close
enough to the magical number of 7 + 2 = 9), we derive:
Choice Cost = max(1,n/10) (2)
3.3. Result statistics and configurations
We computed a number of statistics to evaluate the results of size and cost: moving
average over the whole sequence of sessions, with a window of 50 sessions; average per
oracle.
The configurations under experiment are described together with their results in the
next section.
4. Experimental results
4.1. Overview of results
Table 1 compiles the principal results for each configuration. The minimum and maximumvalues in each column except Success rate are emphasized. The best final and gain scores
in their columns are �starred. The statistics in the table are a transposition of selected
statistics of the involved configurations, mapped as follows:
Success = Micro-average of the success rate of sessions
Size0 = Average of first session size
Total 3.77 25.94 21.56 6.20 37.56 33.26 6.17
Average 0.75 5.19 4.31 1.24 7.52 6.65 1.23
Shattered Document 0.94 5.62 3.48 �1.62 5.62 3.48 �1.62
Shattered Random Document 0.98 4.10 �3.40 1.20 4.00 �3.38 1.18
Structural 1.00 3.48 3.48 1.00 15.20 15.20 1.00
Markov Chains 0.84 5.84 4.22 1.38 5.84 4.22 1.38
Shattered Document with Random
Clicks
0.02 6.90 6.98 0.99 6.90 6.98 0.99
Configuration Success Size0 Size1 S-Gain Cost0 Cost1 C-Gain
M. Amado Alves / The Shattered Document Approach to Adaptive Hypertext. Design and Evaluation 9
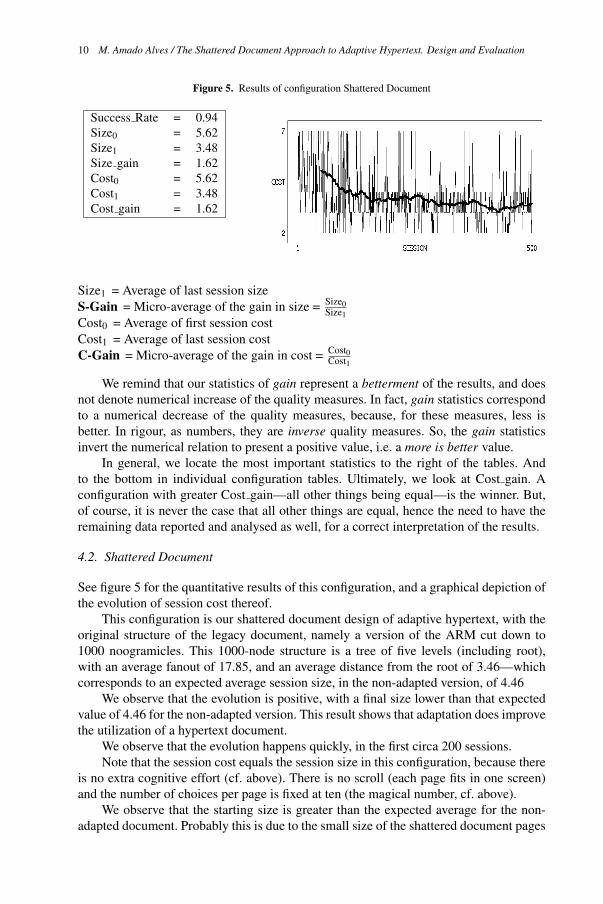
Figure 5. Results of configuration Shattered Document
Size1 = Average of last session size
S-Gain = Micro-average of the gain in size = Size0Size1
Cost0 = Average of first session cost
Cost1 = Average of last session cost
C-Gain = Micro-average of the gain in cost = Cost0Cost1
We remind that our statistics of gain represent a betterment of the results, and does
not denote numerical increase of the quality measures. In fact, gain statistics correspond
to a numerical decrease of the quality measures, because, for these measures, less is
better. In rigour, as numbers, they are inverse quality measures. So, the gain statistics
invert the numerical relation to present a positive value, i.e. a more is better value.
In general, we locate the most important statistics to the right of the tables. And
to the bottom in individual configuration tables. Ultimately, we look at Cost gain. A
configuration with greater Cost gain—all other things being equal—is the winner. But,
of course, it is never the case that all other things are equal, hence the need to have the
remaining data reported and analysed as well, for a correct interpretation of the results.
4.2. Shattered Document
See figure 5 for the quantitative results of this configuration, and a graphical depiction of
the evolution of session cost thereof.
This configuration is our shattered document design of adaptive hypertext, with the
original structure of the legacy document, namely a version of the ARM cut down to
1000 noogramicles. This 1000-node structure is a tree of five levels (including root),
with an average fanout of 17.85, and an average distance from the root of 3.46—which
corresponds to an expected average session size, in the non-adapted version, of 4.46
We observe that the evolution is positive, with a final size lower than that expected
value of 4.46 for the non-adapted version. This result shows that adaptation does improve
the utilization of a hypertext document.
We observe that the evolution happens quickly, in the first circa 200 sessions.
Note that the session cost equals the session size in this configuration, because there
is no extra cognitive effort (cf. above). There is no scroll (each page fits in one screen)
and the number of choices per page is fixed at ten (the magical number, cf. above).
We observe that the starting size is greater than the expected average for the non-
adapted document. Probably this is due to the small size of the shattered document pages
gain = 1.62Cost
Cost1 = 3.48
Cost0 = 5.62
gain = 1.62Size
Size1 = 3.48
Size0 = 5.62
Rate = 0.94Success
M. Amado Alves / The Shattered Document Approach to Adaptive Hypertext. Design and Evaluation10
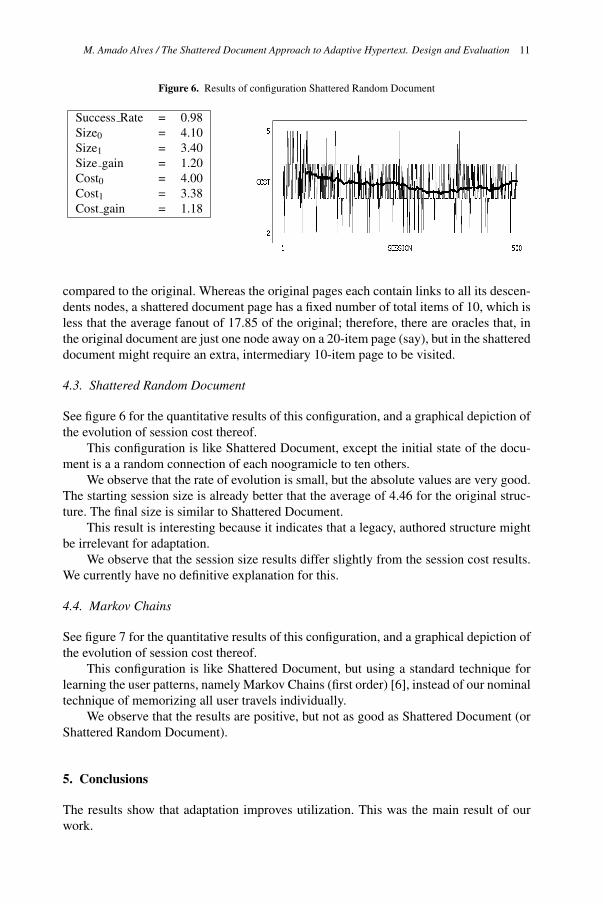
Figure 6. Results of configuration Shattered Random Document
compared to the original. Whereas the original pages each contain links to all its descen-
dents nodes, a shattered document page has a fixed number of total items of 10, which is
less that the average fanout of 17.85 of the original; therefore, there are oracles that, in
the original document are just one node away on a 20-item page (say), but in the shattered
document might require an extra, intermediary 10-item page to be visited.
4.3. Shattered Random Document
See figure 6 for the quantitative results of this configuration, and a graphical depiction of
the evolution of session cost thereof.
This configuration is like Shattered Document, except the initial state of the docu-
ment is a a random connection of each noogramicle to ten others.
We observe that the rate of evolution is small, but the absolute values are very good.
The starting session size is already better that the average of 4.46 for the original struc-
ture. The final size is similar to Shattered Document.
This result is interesting because it indicates that a legacy, authored structure might
be irrelevant for adaptation.
We observe that the session size results differ slightly from the session cost results.
We currently have no definitive explanation for this.
4.4. Markov Chains
See figure 7 for the quantitative results of this configuration, and a graphical depiction of
the evolution of session cost thereof.
This configuration is like Shattered Document, but using a standard technique for
learning the user patterns, namely Markov Chains (first order) [6], instead of our nominal
technique of memorizing all user travels individually.
We observe that the results are positive, but not as good as Shattered Document (or
Shattered Random Document).
5. Conclusions
The results show that adaptation improves utilization. This was the main result of our
work.
gain = 1.18Cost
Cost1 = 3.38
Cost0 = 4.00
gain = 1.20Size
Size1 = 3.40
Size0 = 4.10
Rate = 0.98Success
M. Amado Alves / The Shattered Document Approach to Adaptive Hypertext. Design and Evaluation 11
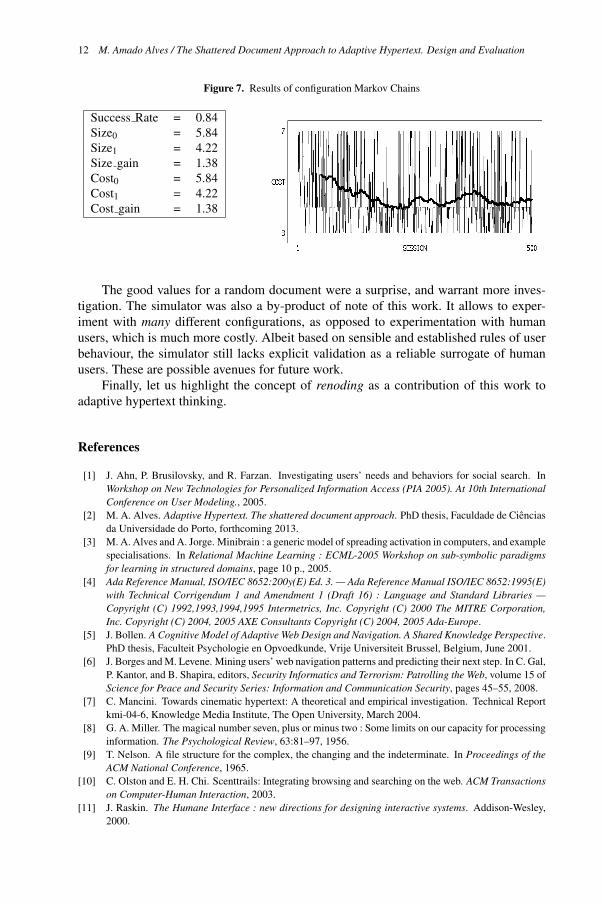
Figure 7. Results of configuration Markov Chains
The good values for a random document were a surprise, and warrant more inves-
tigation. The simulator was also a by-product of note of this work. It allows to exper-
iment with many different configurations, as opposed to experimentation with human
users, which is much more costly. Albeit based on sensible and established rules of user
behaviour, the simulator still lacks explicit validation as a reliable surrogate of human
users. These are possible avenues for future work.
Finally, let us highlight the concept of renoding as a contribution of this work to
adaptive hypertext thinking.
References
[1] J. Ahn, P. Brusilovsky, and R. Farzan. Investigating users’ needs and behaviors for social search. In
Workshop on New Technologies for Personalized Information Access (PIA 2005). At 10th InternationalConference on User Modeling., 2005.
[2] M. A. Alves. Adaptive Hypertext. The shattered document approach. PhD thesis, Faculdade de Ciencias
da Universidade do Porto, forthcoming 2013.
[3] M. A. Alves and A. Jorge. Minibrain : a generic model of spreading activation in computers, and example
specialisations. In Relational Machine Learning : ECML-2005 Workshop on sub-symbolic paradigmsfor learning in structured domains, page 10 p., 2005.
[4] Ada Reference Manual, ISO/IEC 8652:200y(E) Ed. 3. — Ada Reference Manual ISO/IEC 8652:1995(E)with Technical Corrigendum 1 and Amendment 1 (Draft 16) : Language and Standard Libraries —Copyright (C) 1992,1993,1994,1995 Intermetrics, Inc. Copyright (C) 2000 The MITRE Corporation,Inc. Copyright (C) 2004, 2005 AXE Consultants Copyright (C) 2004, 2005 Ada-Europe.
[5] J. Bollen. A Cognitive Model of Adaptive Web Design and Navigation. A Shared Knowledge Perspective.
PhD thesis, Faculteit Psychologie en Opvoedkunde, Vrije Universiteit Brussel, Belgium, June 2001.
[6] J. Borges and M. Levene. Mining users’ web navigation patterns and predicting their next step. In C. Gal,
P. Kantor, and B. Shapira, editors, Security Informatics and Terrorism: Patrolling the Web, volume 15 of
Science for Peace and Security Series: Information and Communication Security, pages 45–55, 2008.
[7] C. Mancini. Towards cinematic hypertext: A theoretical and empirical investigation. Technical Report
kmi-04-6, Knowledge Media Institute, The Open University, March 2004.
[8] G. A. Miller. The magical number seven, plus or minus two : Some limits on our capacity for processing
information. The Psychological Review, 63:81–97, 1956.
[9] T. Nelson. A file structure for the complex, the changing and the indeterminate. In Proceedings of theACM National Conference, 1965.
[10] C. Olston and E. H. Chi. Scenttrails: Integrating browsing and searching on the web. ACM Transactionson Computer-Human Interaction, 2003.
[11] J. Raskin. The Humane Interface : new directions for designing interactive systems. Addison-Wesley,
2000.
gain = 1.38Cost
Cost1 = 4.22
Cost0 = 5.84
gain = 1.38Size
Size1 = 4.22
Size0 = 5.84
Rate = 0.84Success
M. Amado Alves / The Shattered Document Approach to Adaptive Hypertext. Design and Evaluation12
3D gesture-based exploration and search
in document collections
Angelica de Antonio, Cristian Moral, Daniel Klepel, Martın J. Abente
Facultad de Informatica, Campus de Montegancedo, Univ. Politecnica de Madrid
{angelica, cmoral, dklepel}@fi.upm.es, [email protected]
Abstract. This paper describes an approach towards the interaction with 3D repre-
sentations of large document collections. The goal was to provide the user with a
highly dynamic environment in which even the very mapping strategy to position
documents in space can be adjusted by the user depending on the specific task at
hand, on his preferences, or on the context. A modification to the FDP algorithm
is proposed, as well as a new gesture-based interaction paradigm in which the user
can explore and search information in the collection just by simple hand move-
ments. An experimental user evaluation was carried on to investigate the impact of
the proposed approach on the precision of the mental model built by users through
exploration, on the effectiveness in information search tasks, and on the general
user satisfaction and perception of utility.
Keywords. 3D visualization and navigation, 3D interaction, Information Retrieval,
Force-Directed Placement, Clustering, k-means
Introduction
Exploration and search of information contained in large document collections is increas-
ingly a need, but many times also a problem. In fact, Internet offers such a huge quantity
of information that it is in practice impossible to explore it exhaustively so as to fill a
specific information need. In the last 30 years, many techniques have been proposed to
visualize document collections. Some of them were developed for 3D virtual environ-
ments, as the third dimension increases the information that can be shown to the user.
The application of one or another technique often depends on the type of documents to
be visualized. For structured documents, specific visualizations highlight the structure
and relations between data [1] [2], while for non-structured documents only the con-
tent can be analyzed in order to infer as much information as possible. In the last case,
visualization techniques are more general and sophisticated, and then more complex [3].
This paper focuses on 3D visualization of non-structured document collections. The
visual metaphor chosen, a sphere, is a simple and generic one in order to avoid overload-
ing the visualization. Then, a collection of documents is virtually represented as a cloud
of spheres. But visualization is definitely not enough to satisfy the user needs; interaction
with the 3D representation is the key aspect to facilitate the user tasks.
The remainder of this document is divided into 4 sections. In Section 1 we detail
the general process that must be followed to visualize a document collection in a 3D
virtual environment. Section 2 deals with the interaction techniques we have proposed to
Mining the Digital Information NetworksN. Lavesson et al. (Eds.)© 2013 The authors and IOS Press.This article is published online with Open Access by IOS Press and distributed under the termsof the Creative Commons Attribution Non-Commercial License.doi:10.3233/978-1-61499-270-7-13
13
allow the user exploring and extracting information from the 3D virtual environment. To
evaluate the benefits and drawbacks of our proposal, we carried out an experiment, whose
details and results are presented in Section 3. Finally, Section 4 reports the conclusions
we have extracted from our work and proposes future research.
1. 3D Visualization of document collections
Based on the model described in [4], the information visualization pipeline can be split
into four major stages. The first one consists in gathering, cleaning and preprocessing
the documents, aiming at extracting from data attributes of interest that contain rele-
vant information. Selecting these attributes requires a deep understanding of the task that
should be carried on with the data and the nature of the data itself. The second stage
consists in mapping visual characteristics to each of these attributes. The most common
visual characteristics are color, shape, spatial position and movement [5], and they must
be selected carefully in order to exploit the natural perception abilities of the users and
considering the nature of each attribute [6]. The third stage consists in the generation of
a visual representation of the scene making an efficient use of the screen space while
keeping the cognitive load as low as possible. The fourth step deals with the interaction
between the users and the virtual representation. Interaction is a fundamental issue re-
garding the design of any information visualization tool. Interaction mechanisms must
be designed in order to assist the user’s tasks, and they can act upon any of the previous
stages including: select and manipulate a dataset, navigate through the environment and
perform actions affecting the data or the system itself.
1.1. Document Preprocessing
In our system, preprocess aims at determining the similarity between pairwise docu-
ments. Many complementary treatments have been proposed to undertake this task: nor-
malization, stopwords lists, stemming [7], Part-Of-Speech Tagging [8], Named Entity
Recognition [9], and many others. Which of them to use depends on the efficiency and
precision required in the retrieval of information. In our case, we look for a dynamic and
interactive, and hence efficient, system, even at the expense of precision.
Our preprocessing phase consists of two main parts: the lexical analysis of each doc-
ument, and clustering the documents into semantic groups based on the distance mea-
sure between them. The first part allows us to translate documents into data structures
treatable by computers. The process starts with the tokenization of the documents, fol-
lowed by a normalization of the obtained tokens, for example by clearing accents, punc-
tuation, email addresses, URLs and numbers, among others. All filters are applied to in-
dividual tokens, as we use a bag-of-words model, where context and order are not taken
into account. Even if this causes the loss of some semantic information, the treatment is
much easier and faster. Once tokens are ”clean”, we proceed to delete the meaningless
ones (included in a stopword list), like articles, prepositions, determinants and so on. At
the end, the noise, and the initial vocabulary, are reduced, fastening and the process and
increasing its precision.
Before proceeding to the second step of preprocessing, we have to represent ev-
ery document, and its filtered tokens, in a computational way. We have decided to use
A. de Antonio et al. / 3D Gesture-Based Exploration and Search in Document Collections14
multidimensional vectors where every dimension, also called feature, corresponds to a
token, and its content is the frequency of the token in the document. This way of rep-
resenting documents is known as Vector Space Model [10], allows to easily figure out
the so-called cosine similarity between two documents by computing the inner product
of their normalized unit vector representations. This measure of similitude, calculated
for every pairwise documents, is statistical in nature as it only reflects the proportion of
tokens that both documents have in common, independently of their semantic meaning.
Therefore, it will not reflect faithfully if they share the same topic, but only the rate of
words they share. Even if this may seem a drawback, our objective is not to obtain very
precise similitude values, but to obtain good enough ones in the shortest possible time.
After this, the system assigns each document to a thematic group by means of a clus-
tering algorithm based on the similarity between documents. In this work the k-means
algorithm [11] is chosen , as it is probably the simplest clustering algorithm available
and it matches our needs: the number of clusters is dynamically definable by the user
and it is fast enough for small sized datasets, allowing the reconfiguration of the clus-
ters in realtime. On the contrary, k-means is not a deterministic algorithm because of the
random selection of the initial seeds, and then the algorithm doesn’t always converge to
the same clusters [12]. This is not acceptable for an interactive system as the user could
get confused. That’s why we have slightly modified the classical k-means algorithm, by
executing it n times, each of them with a different random combination of initial seeds,
and choosing the ones that, after executing k-means, minimize the sum of the distances
between any document and the centroid of the group to which it belongs.
Finally, in this step we also extract a representative keyword for each document,
by retrieving from every vector the feature with the highest value, which represents the
meaningful token most frequent in the document. Again, this process is not very precise,
but instead it is really simple and fast, which is our goal.
1.2. Assignment of Visual Characteristics
For this work, three attributes of interest were considered: the similarity between docu-
ments, the thematic category of each document and the keywords extracted. Taking into
account the considerations mentioned in [6], three different visual characteristics were
chosen in order to visually represent these attributes.
First, the collection is represented by a tridimensional cloud of spheres, each of them
representing a single document. Similarity between documents is visually represented
by the spatial distance between the spheres. So, the more the documents are themati-
cally similar, the closer are the spheres. The thematic category is represented by the hue
component of color, so that the same category documents have the same color. The hue
values of each document are updated every time the number of clusters changes. For the
visualization of the keywords, a single label is imposed on the sphere.
In order to obtain a spatial position for every document, the dimensions of the equiv-
alent vectors must be reduced to three, but trying to keep as many similarity information
between the documents as possible. In this work the Force-Directed Placement (FDP)
technique [13] was used; it simulates attraction and repulsion forces among the docu-
ments depending on their similarity measures. Although an FDP approach has big scal-
ability issues, it also has many desirable properties for our goals: good quality of the
resulting layout, iterative and realtime positioning process, and ability to be extended by
including other factors in the positioning process, as it will be explained in Section 2.2.
A. de Antonio et al. / 3D Gesture-Based Exploration and Search in Document Collections 15
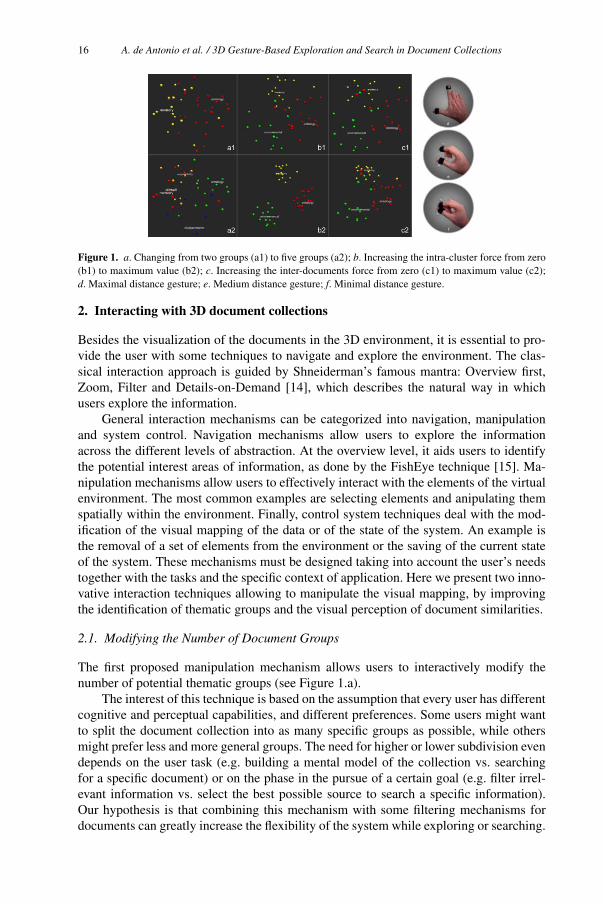
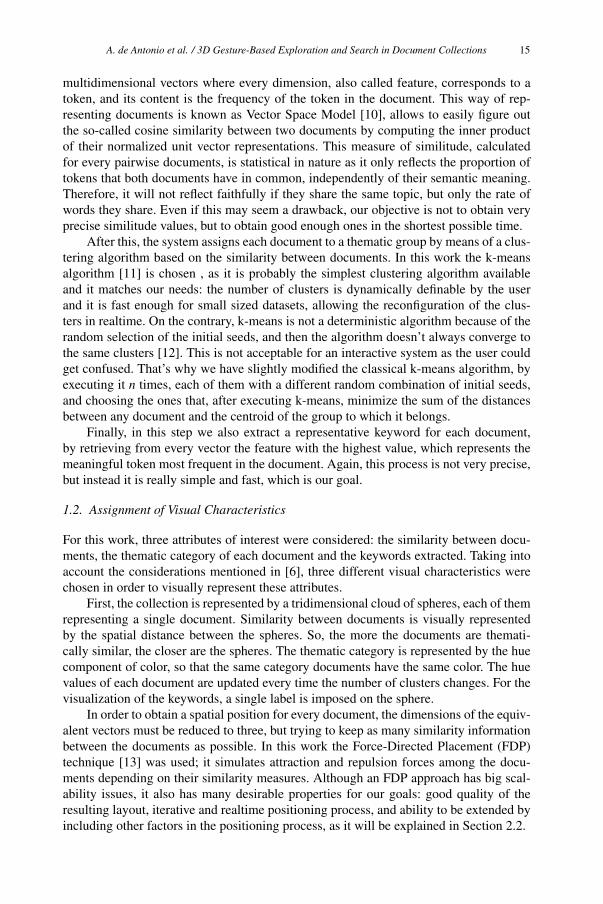
Figure 1. a. Changing from two groups (a1) to five groups (a2); b. Increasing the intra-cluster force from zero
(b1) to maximum value (b2); c. Increasing the inter-documents force from zero (c1) to maximum value (c2);
d. Maximal distance gesture; e. Medium distance gesture; f. Minimal distance gesture.
2. Interacting with 3D document collections
Besides the visualization of the documents in the 3D environment, it is essential to pro-
vide the user with some techniques to navigate and explore the environment. The clas-
sical interaction approach is guided by Shneiderman’s famous mantra: Overview first,
Zoom, Filter and Details-on-Demand [14], which describes the natural way in which
users explore the information.
General interaction mechanisms can be categorized into navigation, manipulation
and system control. Navigation mechanisms allow users to explore the information
across the different levels of abstraction. At the overview level, it aids users to identify
the potential interest areas of information, as done by the FishEye technique [15]. Ma-
nipulation mechanisms allow users to effectively interact with the elements of the virtual
environment. The most common examples are selecting elements and anipulating them
spatially within the environment. Finally, control system techniques deal with the mod-
ification of the visual mapping of the data or of the state of the system. An example is
the removal of a set of elements from the environment or the saving of the current state
of the system. These mechanisms must be designed taking into account the user’s needs
together with the tasks and the specific context of application. Here we present two inno-
vative interaction techniques allowing to manipulate the visual mapping, by improving
the identification of thematic groups and the visual perception of document similarities.
2.1. Modifying the Number of Document Groups
The first proposed manipulation mechanism allows users to interactively modify the
number of potential thematic groups (see Figure 1.a).
The interest of this technique is based on the assumption that every user has different
cognitive and perceptual capabilities, and different preferences. Some users might want
to split the document collection into as many specific groups as possible, while others
might prefer less and more general groups. The need for higher or lower subdivision even
depends on the user task (e.g. building a mental model of the collection vs. searching
for a specific document) or on the phase in the pursue of a certain goal (e.g. filter irrel-
evant information vs. select the best possible source to search a specific information).
Our hypothesis is that combining this mechanism with some filtering mechanisms for
documents can greatly increase the flexibility of the system while exploring or searching.
A. de Antonio et al. / 3D Gesture-Based Exploration and Search in Document Collections16
2.2. Adjustment of Attraction Forces
This mechanism allows users to modify the relative position of the documents. Although
the spatial positioning reflects by itself the similarity between documents, we think the
visual clarity of the representation can be improved. In this sense, we propose a modifi-
cation to the original FDP algorithm, called FDP with Force Control (FDPFC) algorithm,
where two new attraction forces, dynamically modifiable by the users, are added.
The first force modifier aims at enhancing the overview visualization. To achieve
this, it modifies the spatial position of spheres so documents that belong to the same
cluster get closer and are separated from the other clusters (see Figure 1.b). This mod-
ification results into a more compact and lean clusters visualization from the overview
perspective. Technically, this effect is generated by adding a specific multiplier to the
force that controls the attraction between any pairwise documents, and it is applied if and
only if both documents belong to the same cluster.
The second force modifier aims at enhancing the inter-document similarity percep-
tion, both in the overview and the detail levels. This is accomplished by modifying the
spatial position of the spheres so documents whose similarity is higher than a predifined
threshold are located closer in space, independently of the previous clustering (see Fig-
ure 1.c). Then, users can determine at a glance which documents are similar even if they
belong to different clusters. This effect is generated by adding another multiplier to the
attraction force between pairwise documents if and only if the distance between them is
lower than the mean distance between any other pairwise documents.
2.3. A Gesture-based Interaction Paradigm
As for our daily tasks we use our hands, we think that the manipulation of 3D environ-
ments is also more intuitive using them. Therefore, we propose a gestural interaction
paradigm where the index and the thumb, equipped with solitary markers, are optically
tracked to obtain their spatial position and the distance between them. Both the position
and the distance are used to infer which of the three recognizable gestures does the user:
maximal distance (thumb and index spread, see Figure 1.d), medium distance (relaxed
fingers, see Figure 1.e) and minimal distance (thumb and index pinched, see Figure 1.f).
To adapt distances to each user, an initial and directed training phase is carried out. Fin-
gers are virtually represented by two 3D fingerprints (see Figure 2.a), that are immedi-
ately identified by the user as representations of his fingers because of the realtime feed-
back received in terms of position, inclination and rotation while the real fingers move.
In order to test our approach, we have implemented a prototype system with three
types of interaction techniques: navigation, selection and control state of spheres. In the
first case, we offer three navigation mechanisms allowing the user to reach any point of
the environment and to visualize the collection with the desired detail: horizontal and
vertical translation of the environment; rotation of the environment with respect to a fixed
point; and zoom in and out within the environment. Associated to the zooming mech-
anisms, and to avoid cognitive overload in the visualization, keywords get visible only
when the distance between the spheres they are attached to and the position of the user’s
avatar (fingerprints) is under a defined threshold. The second group of techniques deals
with the selection of one or more documents, as our system is intended both for individ-
ual document search and global exploration of a collection of documents. The first one
A. de Antonio et al. / 3D Gesture-Based Exploration and Search in Document Collections 17
Figure 2. User interface: a. Virtual fingertips; b. Delete; c. Invert; d. Undo; e.Inspect; f. Document force
adjustment; g. Groups adjustment; h.Group force adjustment; i. Jump
permits selecting one of the documents, whereas the latter allows selecting all the docu-
ments that belong to the same cluster. For increased flexibility, the system allows mak-
ing incremental selections, that is adding new documents and/or groups to the current
selection. We also provide the possibility of deselecting a group that has been previously
selected. At last, the system offers eight different functionalities for manipulating the
collection, implemented as pop-up widgets (see Figure 2). To avoid undesired executions
of these functionalities during navigation, widgets have to remain activated by the user
for at least 2 seconds in order to become operational. Most of the widgets have a binary
behaviour and their associated functionality is executed just by activation. The first case
is jumping between groups in order to focus the visualization over the centroid of one
group. If more than one group has been created, every activation results in focusing on
a new group, which is a great help when navigating and exploring over groups and not
over individual documents. In addition, the system offers four control functionalities that
require a previous selection of a document or a group: consult the content of a document,
invert the selection, clear the selected documents or groups from the visualization or re-
cover the last documents or groups cleared. The last three functionalities require a nu-
merical value, so, besides activation, their widgets require the user to indicate a number,
that is also provided by finger movements. This is the case of the dynamic adjustment of
the number of groups for the clustering algorithm (see Section 2.1), and the adjustment
of both force modifiers added in the FDPFC approach (see Section 2.2).
3. Experimental Evaluation
3.1. Experiment Design
A user evaluation was designed in order to evaluate the impact of the modifications in-
troduced by the FDPFC and of the gestural interaction techniques proposed. An experi-
ment was conducted in which one independent variable, the type of 3D mapping method,
was manipulated with two possible levels: Force Directed Placement (FDP), and Force
Directed Placement with Force Control (FDPFC). A total of 36 subjects were selected
for the experiment and randomly assigned to one of the two experimental treatments.
All subjects were computer science students or professors, so they were assumed to be
A. de Antonio et al. / 3D Gesture-Based Exploration and Search in Document Collections18
able to understand the abstraction applied in the 3D representation of document collec-
tions, and to quickly learn and apply new interaction techniques. Ages of the participants
ranged from 21 to 40, with 25 males and 9 females. The measured dependent variables
were: Precision in the mental model resulting from exploration (M), Effectiveness in
search (E), and Satisfaction (S). The null hypotheses were: H01) The mean precision in
the mental model obtained from exploration is the same for FDP and FDPFC ; H02) The
mean effectiveness in search is the same for FDP and FDPFC; H03) The mean satisfac-
tion is the same for FDP and FDPFC. Statistical t-tests were applied to evaluate these
hypotheses.
Precision of the mental model was evaluated after an exploration task. The exper-
imental document collection was manually composed by intentionally selecting docu-
ments within a set of predefined topics. Precision of the mental model was measured by
presenting, after some minutes of free exploration, a brief thematic questionnaire with
nine questions in the form ”Were there any documents in the collection talking about
topic?” A 5 levels response scale was presented with the meaning -2:”definitely no”, -
1:”probably no”, 0:”I do not know”, 1:”probably yes”, and 2:”definitely yes”. The ref-
erence topics for the nine questions were Ontologies, Buildings, Bridges, Animals, Ped-
agogy, Software Agents, Memory, Art, and Civilizations. The hypothesis was that the
availability of force control mechanisms in FDPFC would allow the subjects to construct
a more precise model of the thematic structure of the collection, particularly by strength-
ening the intra-cluster attraction force.
Effectiveness in search was measured via a search task in which the participant was
asked to find within the collection a representative document talking about a particular
topic, as well as two additional documents that were the closest to it in their thematic
content. The best possible solution for the task was pre-calculated. Taking the inter-
document distance matrix, the effectiveness in search was computed as the distance be-
tween the solution document provided by the experimental subject and the optimal so-
lution. For the evaluation of the selected neighbors we decided to count the number of
best neighbors provided. The hypothesis was that the availability of force control mech-
anisms in FDPFC would allow the subjects to find a higher quality set of documents,
particularly by strengthening the inter-documents attraction force. We hypothesized that
the increase in quality would be more significant when considering the neighbors than
just by comparing the best representative.
Finally, Satisfaction was evaluated by a questionnaire at the end of the experience.
15 questions were common for both experimental groups, with 3 additional questions
for the FDPFC group evaluating the perceived usefulness of the force control capabili-
ties, and 2 additional questions for the FDP group trying to find out the usefulness they
anticipated for these features. The questions offered a 5 levels response scale with the
interpretation 0:”I strongly disagree”, 1:”I disagree”, 2:”Neutral”, 3:”I agree”, and 4:”I
strongly agree”. There were four open questions investigating previous user knowledge
of document collection exploration and search tools, and requesting a general evaluation
of positive and negative aspects.
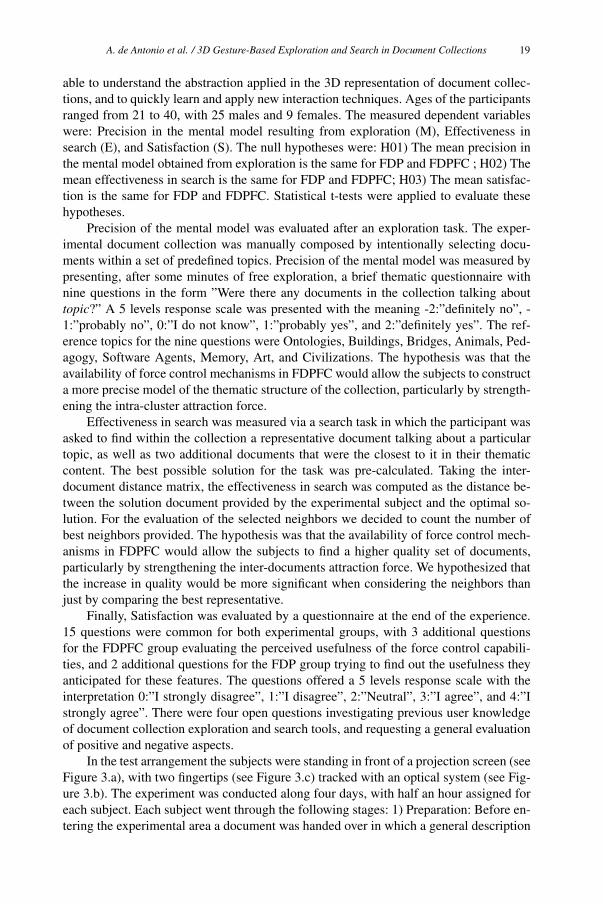
In the test arrangement the subjects were standing in front of a projection screen (see
Figure 3.a), with two fingertips (see Figure 3.c) tracked with an optical system (see Fig-
ure 3.b). The experiment was conducted along four days, with half an hour assigned for
each subject. Each subject went through the following stages: 1) Preparation: Before en-
tering the experimental area a document was handed over in which a general description
A. de Antonio et al. / 3D Gesture-Based Exploration and Search in Document Collections 19
Figure 3. VR installation: a. Stereoscopic screen; b. Optical trackers; c. Optical markers
of the experiment’s goal and procedure was presented; 2) Training: The participant was
led to the projection screen and ten minutes were allocated for the participant to famil-
iarize with the visualization display and interaction techniques by using a training col-
lection; 3) Exploration: The test collection was loaded and the participant was instructed
to freely explore it trying to get an idea of the documents’ topics during five minutes; 4)
Mental model evaluation: The participant was taken to a separate room and five minutes
were left for completing the thematic questionnaire; 5) Search: The participant was taken
again in front of the projection screen and the search task was completed in five minutes;
6) Questionnaire: Again at a separate room, the participant was requested to complete
the satisfaction questionnaire and was thanked by their collaboration. No time limit was
imposed at this stage.
3.2. Results and Discussion
When evaluating precision of the mental model, if a topic presented to the user is cer-
tainly included in the collection, the correct response is considered to be 2, while it should
be -2 if the topic is not in the collection. Any other response is considered incorrect. The
topics that were certainly in the collection (Ontologies, Bridges and Memory) were no-
ticed by the majority of the users (with more than 10 correct responses out of 18 partici-
pants in each topic and experimental group -FDP and FDPFC-, and a mean of 13 correct
responses in both cases). If we consider topics that were not included and were semanti-
cally quite far from other topics in the collection (Animals, Art and Civilizations), users
found it difficult to assert with certainty that the topic was absent (even if they tended to
believe the topic was not in the collection), so the percentage of correct responses is low,
but we can notice less uncertainty in the group of users who could control the attraction
forces (FDPFC), with higher success rates (mean of 4 versus 2,33 correct responses out
of 18 participants). In the case of topics that were not in the collection but were intention-
ally close to other topics in the collection (Buildings, Pedagogy and Software agents), the
success rate is the lowest, as expected, with a slightly highest success rate in the FDPFC
group (mean of 1 versus 0 correct responses). In both cases, the reduced amount of time
left for exploration (5 minutes) as well as the fact that users only had access to a keyword
and the abstract of the documents, can explain the uncertainty that prevented them from
asserting the absence of the topics. The test on the equality between the mean number of
A. de Antonio et al. / 3D Gesture-Based Exploration and Search in Document Collections20
correct responses in the FDP and FDPFC conditions did not allow us to reject the null
hypothesis (σ=0.32).
In the evaluation of search effectiveness, two tasks were demanded. The mean dis-
tance between the users’ selected document and the optimal one was similar in both
groups (0,29 for FDP vs 0,26 for FDPFC in the first task, and 0,09 for FDP vs 0,11
for FDPFC in the second one). No significant difference was found between FDP and
FDPFC, with both groups being able to find approximately half of the best neighbors.
Regarding user satisfaction, if we analyze the mean response value for each of the
Likert format questions, we can see that all means are higher than 2 (the neutral point
in the scale), showing a generally favorable opinion. For the overall questionnaire, the
mean response value for the FDP group is 3.12, while it is 3.29 for the FDPFC group,
slightly better but still the difference is not significant (σ=0.13). The most remarkably
positive opinions (above 3.5 points) were about the usefulness of keyword visualization,
the possibility to jump the viewpoint from one group to another, and the possibility to
select a group of documents and remove it. The most valued feature for both groups was
keyword labeling. In both experimental conditions, users believed they could make more
benefit from the system with more training and experience.
Regarding the features that were available for the FDPFC group but not for the FDP
group it is interesting to see that the particpants of the latter one did not value much
the possibility to include them, despite not having any experience with them (with mean
value of 2,31, close to 2-neutral), while the group that effectively had the opportunity to
enjoy the features certainly valued much more their usefulness (with a mean of 3,32).
4. Conclusions and Future work
We presented some contributions towards a more intuitive and effective interaction with
3D visualizations of unstructured document collections. A prototype system has been
developed fully automating the information visualization pipeline. A modification of the
classical FDP algorithm has been proposed (the FDPFC variant) to determine the spatial
position for each document’s spherical representation in the 3D space. This modification
allows the user to control the attraction forces to be applied among documents so that
group separation or inter-document similarity can be visually enhanced, as required for
the task at hand. A full set of interaction techniques have been implemented through a
new gesture-based interaction paradigm based on tracking the position of two hand fin-
gers (index and thumb) by using solitary markers. Navigation, selection and manipula-
tion of both individual documents and document clusters, as well as adjustment of the vi-
sualization settings (number of clusters and attraction forces), can be achieved just with
very basic hand movements and a set of reactive zones in space.
After experimentation FDPFC seemed to help decrease the uncertainty about the
thematic structure of the collection, although no conclusive evidence was found that
FDPFC allows the construction of a more precise mental model. Partly this could be
explained by the fact that the exploration task was the first experience of the users with
the system after a really very brief training period (just ten minutes), and the participants
may have felt overwhelmed by the new way to interact with the system, the number of
functionalities offered and the tasks required. In fact we observed very limited use of
the force control options during exploration. We believe that a longer training period in
A. de Antonio et al. / 3D Gesture-Based Exploration and Search in Document Collections 21
which users have the opportunity to really understand the effect and possibilities of each
interaction mechanism could result into more effective use of the force control features
and a more significant effect on the precision of the mental model.
Regarding the user satisfaction and subjective perception, keywords were the most
valued option. This is probably due to the fact that it was the most evident way to look
for the required documents in the search task. Some users applied an almost exhaustive
search strategy, inspecting every document’s keyword, or even explicitly consulting all
documents’ contents. This strategy could suffice in our limited-size experimental collec-
tion, but we believe that if faced with much more populated collections, users would start
to realize the usefulness and higher efficiency of alternative manipulation techniques.
In our future work we plan to experiment with bigger and more complex document
collections and with a longer and more explicit training period that really helps users to
become proficient in the use of the interaction techniques, to face users to situations in
which the application of the new interaction techniques really becomes a worthy alter-
native to more evident strategies, and to avoid results to be biased by the initial user’s
disorientation.
References
[1] Fairchild K, Poltrock S, Furnas G. SemNet: Three-dimensional graphic representations of large knowl-
edge bases. Cognitive Science and its Applications for Human-Computer Interaction. Lawrence Erl-
baum Associates; 1988.
[2] Robertson GG, Mackinlay JD, Card SK. Cone Trees: animated 3D visualizations of hierarchical in-
formation. In: Proc. SIGCHI conference on Human factors in computing systems: Reaching through
technology. CHI ’91. ACM; 1991. p. 189–194.
[3] Risch JS, Rex DB, Dowson ST, Walters TB, May RA, Moon BD. The STARLIGHT information vi-
sualization system. In: Proc. IEEE Conference on Information Visualisation. IV ’97. DC, USA: IEEE
Comp. Soc.; 1997. p. 42–49.
[4] Card SK, Mackinlay JD, Shneiderman B. Readings in information visualization: using vision to think.
San Francisco: Morgan Kaufmann Pub.; 1999.
[5] Mazza R. Introduction to information visualization. London: Springer-Verlag; 2009. Riccardo Mazza.
[6] Shirley P, Marschner S. Fundamentals of Computer Graphics. 3rd ed. MA, USA: A. K. Peters, Ltd.;
2009.
[7] Porter MF. An algorithm for suffix stripping. Program. 1980 Oct;3(14):130–137.
[8] Abney S. In: Young S, Bloothooft G, editors. Part-of-Speech Tagging and Partial Parsing. Kluwer; 1996.
p. 118–136.
[9] Nadeau D, Sekine S. A survey of named entity recognition and classification. Lingvisticae Investiga-
tiones. 2007 Jan;30(1):3–26.
[10] Salton G, Wong A, Yang CS. A vector space model for automatic indexing. Commun ACM. 1975
Nov;18(11):613–620.
[11] Macqueen JB. Some Methods for classification and analysis of multivariate observations. In: Proc. 5th
Berkeley Symposium on Math, Statistics, and Probability. vol. 1. UC Press; 1967. p. 281–297.
[12] Davidson IS. Speeding up k-means clustering by bootstrap averaging. Workshop on Clustering Large
Data Sets. 2003;.
[13] Fruchterman TMJ, Reingold EM. Graph drawing by force directed placement. Software: Practice and
experience. 1991;21(11):1129–1164.
[14] Shneiderman B. The eyes have it: A task by data type taxonomy for information visualizations. In: Proc.
IEEE Symp. on Visual Languages. IEEE; 1996. p. 336–343.
[15] Furnas GW. Generalized fisheye views. In: Proc. SIGCHI conference on Human factors in computing
systems. CHI ’86. New York, NY, USA: ACM; 1986. p. 16–23.
A. de Antonio et al. / 3D Gesture-Based Exploration and Search in Document Collections22
Cover sheets considered harmful
Emma L. TONKIN a, Stephanie TAYLOR a and Gregory J. L. TOURTE b
a UKOLN, The University of Bathb The University of Bristol
Abstract. The spread of the cover sheet is a divisive phenomenon. Their appear-
ance is geographically bound and their content situated in the local political and
financial context. In this article we discuss the arguments for and against the cov-
ersheet in its guise as a fixture on institutional repository preprints, exploring the
issue through statistical information gathered from survey material. We lay out the
reasoning behind the use of cover sheets in the United Kingdom and discuss their
prevalence and the underlying trends.
Keywords. institutional repositories, cover sheets, survey, copyright, text analysis
Introduction: What are cover sheets?
Cover sheets may appear an unlikely source of controversy. Simply put, they are addi-
tional pages added to a resource in a digital repository, almost always prepended to the
first page rather than appended as an appendix to the document. The use of cover sheets
is often associated with the rise of branding in institutional repositories—that is, they are
seen as the solution to the marketing challenge faced by institutional repositories seek-
ing to render the scope and usage patterns of their activities more visible in light of the
need to retain funding in a difficult research environment. Institutional repositories, how-
ever, face many other challenges, including a [perceived] need to retain a visible copy-
right statement on each file and to provide user-accessible metadata. In a world in which
the majority of resources are accessed directly through links to the resource, rather than
through the intermediary of the institutional repository, a cover sheet is the most visi-
ble and arguably the most accessible way for institutional repositories to provide useful
information to the reader.
Guidance for the institutional repository manager in the United Kingdom has gen-
erally been positive on the subject of cover sheets. For example, Brace [3] wrote that
the benefits of consistently constructed cover sheets applied either to a subset or a full
set of repository objects included the availability of detailed version information (as-
suming, implicitly, that the cover sheet information set included versioning data) and the
possibility of linking to other information such as copyright details. The only downside
identified in this instance was the time and resource requirement of the process of cover
sheet creation; the solution identified was the use of an automated system for cover sheet
creation.
Internationally, viewpoints on cover sheets vary widely. Large archives such as JS-
TOR provide work behind a cover sheet which provides a standardised view of various
information about the document, including citation information. Sites such as Arizona’s
Mining the Digital Information NetworksN. Lavesson et al. (Eds.)© 2013 The authors and IOS Press.This article is published online with Open Access by IOS Press and distributed under the termsof the Creative Commons Attribution Non-Commercial License.doi:10.3233/978-1-61499-270-7-23
23
DLIST do not embed a full-page cover sheet, although some citation or versioning infor-
mation may be provided within some documents. The QUT repository in Australia, by
comparison, routinely places a cover sheet at the beginning of PDF content. Establishing
the prevalence of this practice worldwide would be a major task if completed manually
and is perhaps best achieved through reliable, automated analysis.
It is perhaps worth identifying a few uses of cover sheets:
• Content submission cover sheets: for example, grant applications, thesis submis-
sions, even homework submitted by students may be prefaced with a cover sheet
identifying the submitter and some basic information about the document. These
are a form of process management aid, and inherit from the tradition of the print-
out cover sheet, which was widely used in many institutions to identify documents
when printed.
• Presentational cover sheets: some types of document, such as reports, may be
wrapped or prefaced with an appropriate cover sheet for the purposes of imposing
a standard presentation on institutional outputs.
• Cover sheets as an aid for the researcher: having identified and printed or copied
the document to the local machine, the researcher has lost potentially useful con-
textual information about the document. Placing that information within the body
of the document means that it is, in principle, retained.
• Cover sheets as a means of author identification: some academic authors feel
reassured that their intellectual property and identity as the author of a piece of
work is more securely asserted by the use of a cover sheet. In such cases, the cover
sheet can be perceived as providing the same author information as a traditional
journal article.
• Cover sheets for data papers [9]: A ‘data paper’ in this context is proposed to
be a type of paper that presents ‘a neutral, argumentfree platform from which to
draw scientific conclusions’. The purpose of a cover sheet in this context is the
provision of essential indexing information alongside ‘a package of narrative and
references that captures the entire data product’ (for example, links to the full
dataset).
• Cover sheets as a visual reference for copyright and permissions data.
• Cover sheets as a branding exercise.
Cover sheets and copyright
Copyright is a major guiding force behind the use of cover sheets. Matthies and Frisby
[10] describe the use of cover sheets as an integral part of the permissions process. A
poster presentation by St Andrews [2] regarding the provision of an electronic theses
service describes the use of cover sheets not only for branding of the full-text documents,
but also to provide relevant context (‘anchoring’ the full text) and to give reassurance
to postgraduates that their work is adequately protected against unauthorised reuse or
plagiarism. In other words, there is a perception that cover sheets are either required
or beneficial as a visible indicator that a copyright triage/assessment process has been
undergone and that any readers will be informed of the copyright status of the work.
In the UK, the SHERPA/RoMEO project [6] provides a series of conditions laid
down by publishers for self-archiving. In many of these cases conditions for author self-
archiving may include the use of a statement of some kind (i.e., published source must
E.L. Tonkin et al. / Cover Sheets Considered Harmful24
be acknowledged, a DOI must be provided, etc.). Publishers do not typically specify that
this information is to be provided in a cover sheet embedded into the document itself.
What’s wrong with cover sheets?
With the exception of cases in which specialised templates are used (such as certain for-
mal report delivery processes, in some cases thesis submissions, and so forth), the use of
cover sheets in institutional repositories is almost solely associated with files encoded in
fixed-layout formats, particularly PDF. This is probably due to the relative ease and reli-
ability by which these formats can be manipulated on the command line using tools such
as pdftk and pdftools. This manipulation is often visible, since cover sheets frequently
use a different paper format/layout to the item itself (e.g., letter format vs. A4). The for-
matting discontinuity is visible to the user and to the printer, and is wholly unjustifiable
since there is no reason why, in the cases of common paper formats, a corresponding
cover sheet format cannot be generated.
The Version Identification Framework [14] lists a number of pros and cons of cover
sheets from the perspective of an enthusiast. The pros listed included
Uniformity The object continues to be identified clearly, including its version status,
even if it is removed from the repository itself’,
Detail all of the types of essential versioning information [can] be used’
Linking to other repository information, such as policies, that might be related’
The downsides identified included the time and resource commitment required to
add cover sheets, which they propose should be offset with automated alternatives, per-
ception of interference (introduction of potentially unwelcome branding, relegation of
content to second page), problems with page numbering and, finally, preservation issues.
These issues are covered in the following statement: ‘Some may view the object as rep-
resentative of how the research process stands at the time of deposit, and that altering
it, even in such a ‘behind the scenes’ way, is a threat to the integrity of the work in an
archiving sense.’
The VIF proposed solution to this last issue is the use of the PREMIS data dictionary
[12] for preservation metadata to store information about any changes made. However,
the proposed solution requires the identification of what constitutes useful information
and what should be retained. For text mining purposes in particular, it is easy for minor
changes to significantly alter the usefulness of the file for a given approach.
Consider for example a scenario in which a researcher is attempting to make use of
PDFs retrieved from repositories in order to perform author name/identity disambigua-
tion upon a document set: that is, the researcher is seeking to make use of available con-
textual information in order to tell two people called ‘John Smith’ apart. Contextual in-
formation typically used for this purpose may include location of publication, classifi-
cation of the text, subject of the text, references contained within the document and so
forth. A researcher could equally choose to look at the structure of the document itself
and attempt to tell individuals apart by the platform that they use to generate their doc-
uments (OpenOffice versus Word; LATEX on a Mac; printer driver used to print to PDF,
Calligra and so forth). It is a simple feature set, easily accessible through manipulation
of the PDF format using tools such as pdfinfo or exiftool, but potentially an important
one—but this information is usually removed when a cover sheet is generated. As with
E.L. Tonkin et al. / Cover Sheets Considered Harmful 25
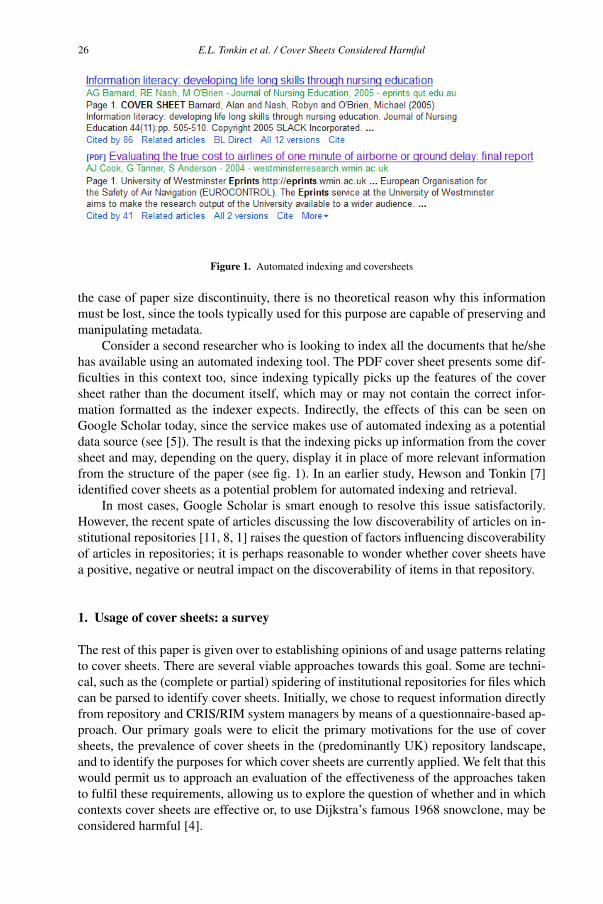
Figure 1. Automated indexing and coversheets
the case of paper size discontinuity, there is no theoretical reason why this information
must be lost, since the tools typically used for this purpose are capable of preserving and
manipulating metadata.
Consider a second researcher who is looking to index all the documents that he/she
has available using an automated indexing tool. The PDF cover sheet presents some dif-
ficulties in this context too, since indexing typically picks up the features of the cover
sheet rather than the document itself, which may or may not contain the correct infor-
mation formatted as the indexer expects. Indirectly, the effects of this can be seen on
Google Scholar today, since the service makes use of automated indexing as a potential
data source (see [5]). The result is that the indexing picks up information from the cover
sheet and may, depending on the query, display it in place of more relevant information
from the structure of the paper (see fig. 1). In an earlier study, Hewson and Tonkin [7]
identified cover sheets as a potential problem for automated indexing and retrieval.
In most cases, Google Scholar is smart enough to resolve this issue satisfactorily.
However, the recent spate of articles discussing the low discoverability of articles on in-
stitutional repositories [11, 8, 1] raises the question of factors influencing discoverability
of articles in repositories; it is perhaps reasonable to wonder whether cover sheets have
a positive, negative or neutral impact on the discoverability of items in that repository.
1. Usage of cover sheets: a survey
The rest of this paper is given over to establishing opinions of and usage patterns relating
to cover sheets. There are several viable approaches towards this goal. Some are techni-
cal, such as the (complete or partial) spidering of institutional repositories for files which
can be parsed to identify cover sheets. Initially, we chose to request information directly
from repository and CRIS/RIM system managers by means of a questionnaire-based ap-
proach. Our primary goals were to elicit the primary motivations for the use of cover
sheets, the prevalence of cover sheets in the (predominantly UK) repository landscape,
and to identify the purposes for which cover sheets are currently applied. We felt that this
would permit us to approach an evaluation of the effectiveness of the approaches taken
to fulfil these requirements, allowing us to explore the question of whether and in which
contexts cover sheets are effective or, to use Dijkstra’s famous 1968 snowclone, may be
considered harmful [4].
E.L. Tonkin et al. / Cover Sheets Considered Harmful26
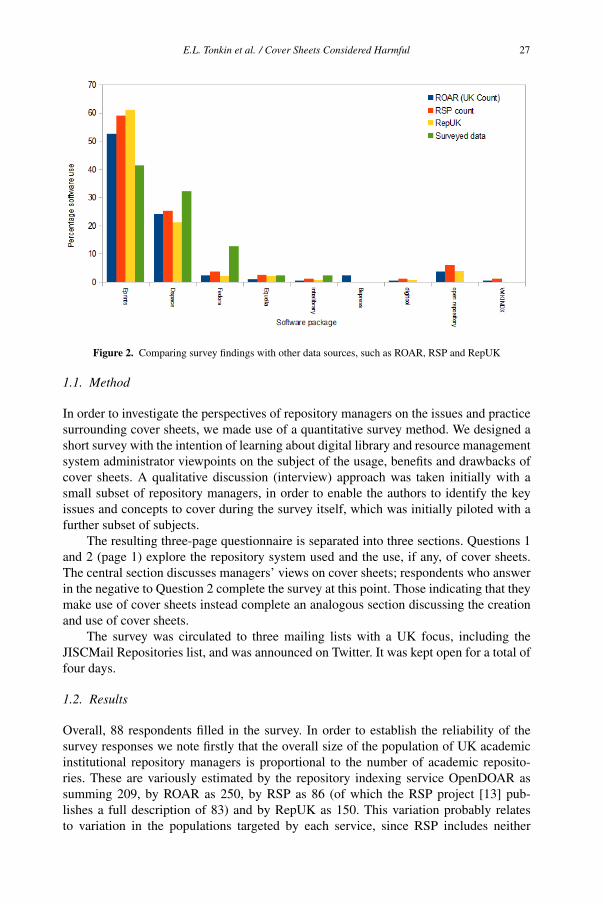
Figure 2. Comparing survey findings with other data sources, such as ROAR, RSP and RepUK
1.1. Method
In order to investigate the perspectives of repository managers on the issues and practice
surrounding cover sheets, we made use of a quantitative survey method. We designed a
short survey with the intention of learning about digital library and resource management
system administrator viewpoints on the subject of the usage, benefits and drawbacks of
cover sheets. A qualitative discussion (interview) approach was taken initially with a
small subset of repository managers, in order to enable the authors to identify the key
issues and concepts to cover during the survey itself, which was initially piloted with a
further subset of subjects.
The resulting three-page questionnaire is separated into three sections. Questions 1
and 2 (page 1) explore the repository system used and the use, if any, of cover sheets.
The central section discusses managers’ views on cover sheets; respondents who answer
in the negative to Question 2 complete the survey at this point. Those indicating that they
make use of cover sheets instead complete an analogous section discussing the creation
and use of cover sheets.
The survey was circulated to three mailing lists with a UK focus, including the
JISCMail Repositories list, and was announced on Twitter. It was kept open for a total of
four days.
1.2. Results
Overall, 88 respondents filled in the survey. In order to establish the reliability of the
survey responses we note firstly that the overall size of the population of UK academic
institutional repository managers is proportional to the number of academic reposito-
ries. These are variously estimated by the repository indexing service OpenDOAR as
summing 209, by ROAR as 250, by RSP as 86 (of which the RSP project [13] pub-
lishes a full description of 83) and by RepUK as 150. This variation probably relates
to variation in the populations targeted by each service, since RSP includes neither
E.L. Tonkin et al. / Cover Sheets Considered Harmful 27
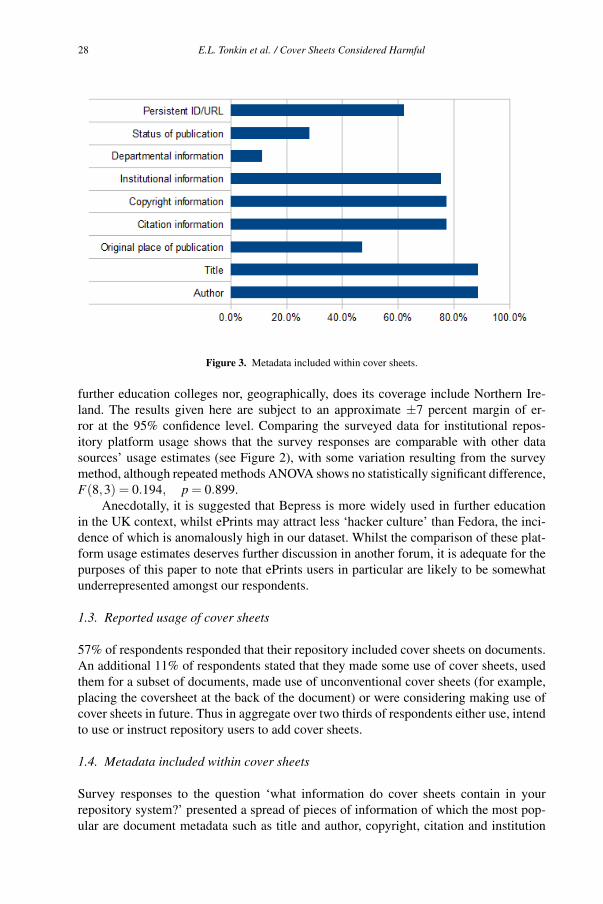
Figure 3. Metadata included within cover sheets.
further education colleges nor, geographically, does its coverage include Northern Ire-
land. The results given here are subject to an approximate ±7 percent margin of er-
ror at the 95% confidence level. Comparing the surveyed data for institutional repos-
itory platform usage shows that the survey responses are comparable with other data
sources’ usage estimates (see Figure 2), with some variation resulting from the survey
method, although repeated methods ANOVA shows no statistically significant difference,
F(8,3) = 0.194, p = 0.899.
Anecdotally, it is suggested that Bepress is more widely used in further education
in the UK context, whilst ePrints may attract less ‘hacker culture’ than Fedora, the inci-
dence of which is anomalously high in our dataset. Whilst the comparison of these plat-
form usage estimates deserves further discussion in another forum, it is adequate for the
purposes of this paper to note that ePrints users in particular are likely to be somewhat
underrepresented amongst our respondents.
1.3. Reported usage of cover sheets
57% of respondents responded that their repository included cover sheets on documents.
An additional 11% of respondents stated that they made some use of cover sheets, used
them for a subset of documents, made use of unconventional cover sheets (for example,
placing the coversheet at the back of the document) or were considering making use of
cover sheets in future. Thus in aggregate over two thirds of respondents either use, intend
to use or instruct repository users to add cover sheets.
1.4. Metadata included within cover sheets
Survey responses to the question ‘what information do cover sheets contain in your
repository system?’ presented a spread of pieces of information of which the most pop-
ular are document metadata such as title and author, copyright, citation and institution
E.L. Tonkin et al. / Cover Sheets Considered Harmful28
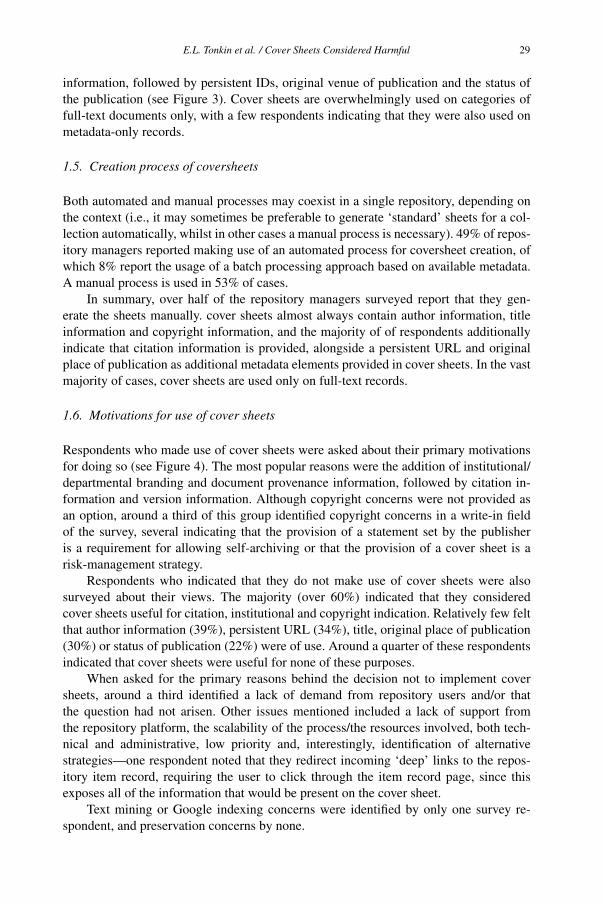
information, followed by persistent IDs, original venue of publication and the status of
the publication (see Figure 3). Cover sheets are overwhelmingly used on categories of
full-text documents only, with a few respondents indicating that they were also used on
metadata-only records.
1.5. Creation process of coversheets
Both automated and manual processes may coexist in a single repository, depending on
the context (i.e., it may sometimes be preferable to generate ‘standard’ sheets for a col-
lection automatically, whilst in other cases a manual process is necessary). 49% of repos-
itory managers reported making use of an automated process for coversheet creation, of
which 8% report the usage of a batch processing approach based on available metadata.
A manual process is used in 53% of cases.
In summary, over half of the repository managers surveyed report that they gen-
erate the sheets manually. cover sheets almost always contain author information, title
information and copyright information, and the majority of of respondents additionally
indicate that citation information is provided, alongside a persistent URL and original
place of publication as additional metadata elements provided in cover sheets. In the vast
majority of cases, cover sheets are used only on full-text records.
1.6. Motivations for use of cover sheets
Respondents who made use of cover sheets were asked about their primary motivations
for doing so (see Figure 4). The most popular reasons were the addition of institutional/
departmental branding and document provenance information, followed by citation in-
formation and version information. Although copyright concerns were not provided as
an option, around a third of this group identified copyright concerns in a write-in field
of the survey, several indicating that the provision of a statement set by the publisher
is a requirement for allowing self-archiving or that the provision of a cover sheet is a
risk-management strategy.
Respondents who indicated that they do not make use of cover sheets were also
surveyed about their views. The majority (over 60%) indicated that they considered
cover sheets useful for citation, institutional and copyright indication. Relatively few felt
that author information (39%), persistent URL (34%), title, original place of publication
(30%) or status of publication (22%) were of use. Around a quarter of these respondents
indicated that cover sheets were useful for none of these purposes.
When asked for the primary reasons behind the decision not to implement cover
sheets, around a third identified a lack of demand from repository users and/or that
the question had not arisen. Other issues mentioned included a lack of support from
the repository platform, the scalability of the process/the resources involved, both tech-
nical and administrative, low priority and, interestingly, identification of alternative
strategies—one respondent noted that they redirect incoming ‘deep’ links to the repos-
itory item record, requiring the user to click through the item record page, since this
exposes all of the information that would be present on the cover sheet.
Text mining or Google indexing concerns were identified by only one survey re-
spondent, and preservation concerns by none.
E.L. Tonkin et al. / Cover Sheets Considered Harmful 29
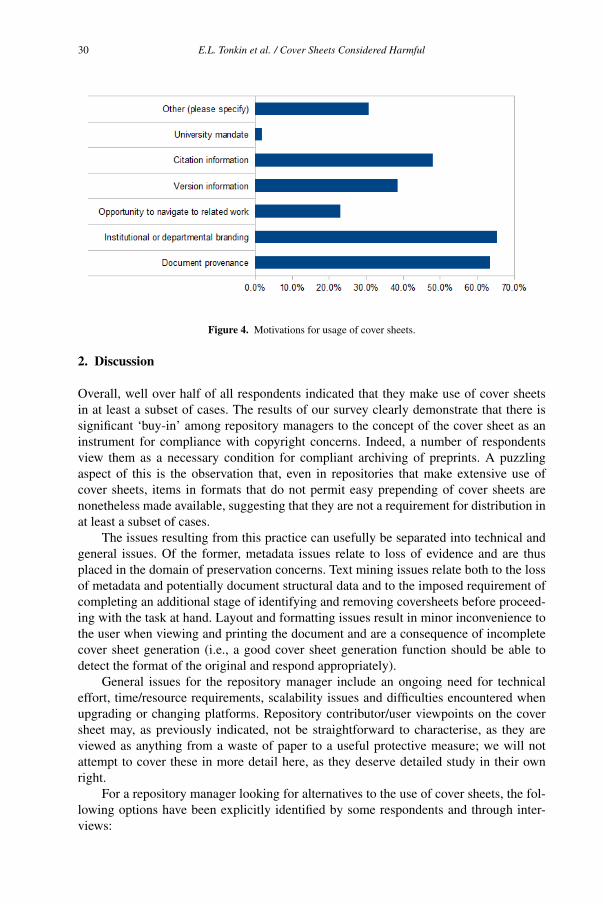
Figure 4. Motivations for usage of cover sheets.
2. Discussion
Overall, well over half of all respondents indicated that they make use of cover sheets
in at least a subset of cases. The results of our survey clearly demonstrate that there is
significant ‘buy-in’ among repository managers to the concept of the cover sheet as an
instrument for compliance with copyright concerns. Indeed, a number of respondents
view them as a necessary condition for compliant archiving of preprints. A puzzling
aspect of this is the observation that, even in repositories that make extensive use of
cover sheets, items in formats that do not permit easy prepending of cover sheets are
nonetheless made available, suggesting that they are not a requirement for distribution in
at least a subset of cases.
The issues resulting from this practice can usefully be separated into technical and
general issues. Of the former, metadata issues relate to loss of evidence and are thus
placed in the domain of preservation concerns. Text mining issues relate both to the loss
of metadata and potentially document structural data and to the imposed requirement of
completing an additional stage of identifying and removing coversheets before proceed-
ing with the task at hand. Layout and formatting issues result in minor inconvenience to
the user when viewing and printing the document and are a consequence of incomplete
cover sheet generation (i.e., a good cover sheet generation function should be able to
detect the format of the original and respond appropriately).
General issues for the repository manager include an ongoing need for technical
effort, time/resource requirements, scalability issues and difficulties encountered when
upgrading or changing platforms. Repository contributor/user viewpoints on the cover
sheet may, as previously indicated, not be straightforward to characterise, as they are
viewed as anything from a waste of paper to a useful protective measure; we will not
attempt to cover these in more detail here, as they deserve detailed study in their own
right.
For a repository manager looking for alternatives to the use of cover sheets, the fol-
lowing options have been explicitly identified by some respondents and through inter-
views:
E.L. Tonkin et al. / Cover Sheets Considered Harmful30
• placing relevant information on the repository item page, instead of altering the
item itself
• forcing the visitor to click-through the associated repository item page,
• embedding relevant data within the document metadata itself
• use of a smaller and less intrusive repository ‘stamp’ somewhere on the document,
enabling branding and provision of relevant information
• provision of unaltered versions of the documents contained within the repository
for access by means other than direct browsing over the Web, permitting those
with a use for unaltered versions of the documents to retrieve the originals.
Of these, the third and fourth are as achievable within PDF as the application of
cover sheets themselves (and are no more applicable to other file formats such as DOC
files). The second resolves part of the issue, ensuring that users view the copyright state-
ment/repository branding, but if that document is distributed elsewhere, it will not con-
tain relevant embedded data.
It is perhaps worth noting that whilst it is broadly understood by the majority of
survey respondents that cover sheets often indeed contain useful information, the use of
the cover sheet to protect a document’s copyright attribution is not supported by the tech-
nical application. Cover sheets may easily be removed in bulk or simply by using ‘print
to file’; on the technical level they provide significantly less of a challenge to remove
than a watermark or a stamp. A visible cover sheet provides only the reassurance that
the reader may be assumed to be aware of the information contained within it. That said,
the cover sheet seems to have become an agreed convention for fulfilling the compliance
requirements of all parties with an interest in rights management. As such, it can be said
to have become a ‘quick win’ way of dealing with these issues for busy IR managers.
Establishing and maintaining a good working relationship with authors and rights hold-
ers is an essential part of the job for IR managers, so any quick, easy and agreed way of
dealing with this potentially tricky area is welcomed into their busy work flow.
3. Conclusions
On the evidence presented here, the adoption of cover sheets is widespread in the UK,
although far from uniform. There is a strong argument for the use of some mechanism to
present relevant information, as publishers often request that this is done; however, it is
not clear that this information must be embedded within each digital object. If this proves
to be the case, it will raise questions about the provision of other types of document such
as data files in formats that do not support a cover sheet.
In conclusion, the authors recommend a number of possible steps for repository
managers. Consider alternative ways to brand your documents, such as using a water-
mark or a ‘stamp’ such as that used by ArXiv. Explore the possibility of holding metadata
currently contained in the cover sheet elsewhere in the document, such as in metadata
fields specific to that file format. Review the performance of your cover sheet genera-
tion process, if you use one, and discuss any technical issues identified such as loss of
metadata or formatting issues with the repository vendor or support community. Finally
ensure that the original versions of files are retained, as you may wish to change your
approach in future.
E.L. Tonkin et al. / Cover Sheets Considered Harmful 31
Future work in this area should include a broader survey of cover sheet use world-
wide, as well as focusing in some detail on the opinions of repository users and con-
tributors. However, the authors would like to emphasise once again that repository man-
agers don’t make the rules; the repository manager is tasked with identifying and apply-
ing an appropriate compromise between the concerns of the different stakeholder groups
involved, which is not a trivial undertaking.
References
[1] K. Arlitsch and P. S. O’Brien. Invisible institutional repositories: addressing the
low indexing ratios of IRs in Google. Library Hi Tech, 30(1):60–81, 2012.
[2] J. Aucock. Electronic theses at the university of st andrews: institutional infrastruc-
ture, policy and support to establish an electronic theses service. Technical report,
Univeristy of St Andrews, 2008.
[3] J. Brace. Versioning in Repositories: Implementing Best Practice. Ariadne, 56,
2008. ISSN 1361-3200. URL http://www.ariadne.ac.uk/issue56/brace.
[4] E. W. Dijkstra. Letters to the editor: go to statement considered harmful. Commun.ACM, 11(3):147–148, March 1968. ISSN 0001-0782. doi: 10.1145/362929.362947.
[5] Google. Indexing in Google Scholar, 2013. URL http://scholar.google.co.
uk/intl/en/scholar/inclusion.html#indexing.
[6] A. Hanlon and M. Ramirez. Asking for Permission: A Survey of Copyright
Workflows for Institutional Repositories. portal: Libraries and the Academy,
11(2):683–702, April 2011. URL http://muse.jhu.edu/journals/portal_
libraries_and_the_academy/v011/11.2.hanlon.html.
[7] A. Hewson and E. Tonkin. Supporting PDF accessibility evaluation: early results
from the FixRep project. In 2nd Qualitative and Quantitative Methods in LibrariesInternational Conference (QQML2010), 2010.
[8] P. Jacso. Metadata mega mess in Google Scholar. Online Information Review, 34
(1):175–191, 2010. ISSN 1468-4527. doi: 10.1108/14684521011024191.
[9] J. A. Kunze, P. Cruse, R. Hu, S. Abrams, K. Hastings, C. Mitchell, and L. R. Schiff.
Practices, Trends, and Recommendations in Technical Appendix Usage for Selected
Data-Intensive Disciplines. Technical report, University of California, 2011. URL
http://escholarship.org/uc/item/9jw4964t.
[10] B. Matthies and K. Frisby. Creating an Institutional Repository ”on the Cheap”. In
Ohio Valley Group of Technical Services Librarians 2009 Conference, May 2009.
[11] M. Norris, C. Oppenheim, and F. Rowland. Finding open access articles using
Google, Google Scholar, OAIster and OpenDOAR. Online Information Review, 32
(6):709–715, 2008. ISSN 1468-4527. doi: 10.1108/14684520810923881.
[12] PREMIS. PREMIS Data Dictionary for Preservation Metadata, 2011. URL http:
//www.loc.gov/standards/premis/.
[13] Repository Support Project (RSP). Cover sheets, 2011. URL http://www.rsp.
ac.uk/documents/briefing-papers/2011/coversheets_RSP_0811.pdf.
[14] VIF. Covert sheet, January 2008. URL http://www2.lse.ac.uk/library/
vif/framework/Object/cover.html.
E.L. Tonkin et al. / Cover Sheets Considered Harmful32
Me4DCAP V0.1: a Method for the
Development of Dublin Core Application
Profiles
Mariana CURADO MALTA a,1, Ana Alice BAPTISTA a
a University of Minho, Algoritmi Center, Portugal
Abstract. Recent studies show that there is no method to develop a Dublin Core
Application Profile (DCAP). A DCAP is a very important construct to implement
interoperability, therefore it is essential to have a method to be able to develop such
a construct, in order to give DCAP developers a common ground of work. This
paper presents the first version of a method to develop Dublin Core Application
Profiles (Me4DACP V0.1) that has been developed in a PhD project with a Design
Science Research (DSR) approach. Me4DCAP was built having as starting point
the Singapore Framework for DCAP and shows the way through the DCAP devel-
opment. It encompasses a group of pre-defined interconnected activities, explicitly
states when they should take place, what techniques could be used to execute them
and what artifacts should result from their execution.
Keywords. Semantic Web; Metadata; Dublin Core Application Profile; DCAP; de-
velopment of DCAP; Me4DCAP; Method; Design Science Research
1. Introduction
The Semantic Web, or Web of Data, has technologies that “enable people to create data
stores on the Web, build vocabularies, and write rules for handling data. Linked data are
empowered by technologies“[1] that started to emerge in 1999. The Semantic Web is
about common formats for integration and combination of data from different sources
[1]. Metadata, both in its use and in its definition and description, is present at various
levels. Metadata is data that describes resources with information [2] and that follows
well-defined rules of metadata schemes. A metadata scheme is a set of “metadata ele-
ments designed for a specific purpose, such as describing a particular type of information
resource“ [2, p. 4].
The Dublin Core Metadata Initiative2 (DCMI) created new instruments so that those
involved in the definition of metadata descriptions could speak a common language.
These new instruments appeared with the aim to adapt the metadata community to the
transformations the Semantic Web brought. The Dublin Core Abstract Model (DCAM)
[3] appears with this purpose: it is a model developed by DCMI, for DCMI syntax spec-
1Corresponding Author: Algoritmi Center, University of Minho, Campus Azurem, 4800-058 Guimaraes,
Portugal; E-mail: [email protected] http://dublincore.org/
Mining the Digital Information NetworksN. Lavesson et al. (Eds.)© 2013 The authors and IOS Press.This article is published online with Open Access by IOS Press and distributed under the termsof the Creative Commons Attribution Non-Commercial License.doi:10.3233/978-1-61499-270-7-33
33
ifications, that presents the components and constructs used in DCMI metadata. One of
these constructs is the Dublin Core Application Profile (DCAP), “a generic construct for
designing metadata records” [4]. The Singapore Framework for Dublin Core Application
Profiles” recommendation - c.f. [5] - defines the rules to build a DCAP.
A DCAP is a very important construct to implement interoperability, therefore it is
essential to have a method3 to be able to develop such a construct, in order to give DCAP
developers a common ground of work. For the time, being the only guidelines available
to develop a DCAP are stated in the Singapore Framework and the DCMI Guidelines
for DCAP - c.f. [5] and [4] - and they are too brief. In fact, recent studies show that
there is no formal method to develop a DCAP [7]. The absence of guidelines showing
life-cycle with standardised activities, as well as a set of well-defined design criteria,
with defined techniques, make a DCAP development rather a craft than an engineering
activity. Therefore, it is imperative to have a method for the development of DCAP.
The work detailed in this article is framed in a PhD project that has as goal to de-
velop such a method. In this article we present a condensed description of the first ver-
sion (V0.1) of the method for the development of DCAP (Me4DCAP). A report with
a detailed description of Me4DCAP is available at http://hdl.handle.net/1822/
23537. This research is still in progress. This article is organised in 4 sections. In Sec-
tion 2 we present the Design Science Research methodological approach. In Section 3
we present the first version of our results, i.e., Me4DCAP V0.1. Finally, conclusions and
future work are drawn in section 4.
2. Design Science Research methodological approach
Our work is based on a design science research (DSR) approach. Design Science aims
at the development of innovative artifacts that solve real-world problems [8], thus ”De-
sign Science is inherently a problem solving process“ [9, p. 82]. An artifact is something
that is artificial, constructed by humans [10], a project using a DSR methodology pro-
duces artifacts that can be either constructs, models, methods, or instantiations of one
of these 3 artifacts [11]. ”Artifacts must be improved upon existing solutions to a prob-
lem or perhaps provide a first solution to an important problem” [10, p.6]. Our research
project will develop a first solution to a problem: a method for the development of DCAP
(Me4DCAP) to provide the metadata community with a method that, to the best of our
knowledge, does not exist.
According to A. Hevner [11] DSR has 3 cycles: (i) the ”Relevance Cycle“ that works
in the ”Environment”; (ii) the ”Design Cycle“ that works in the core activities of building
the artifact, and; (iii) the ”Rigor Cycle“ that works in the ”Knowledge Base” of scientific
theories.
In the Relevance Cycle the “Environment“ supplies the research project with the
needed requisites and the application context, and ”defines acceptance criteria for the
ultimate evaluation for the research results“ [11, p. 89].
In the Design Cycle DSR ”calls for multiple iterations (...) before contributions are
output into the Relevance Cycle and the Rigor Cycle“ [11, p. 91]. These iterations are
3A method is a selection of techniques, the control of their usage and the integration of the obtained partial
results [6].
M. Curado Malta and A.A. Baptista / Me4DCAP V0.1: A Method for the Development of DCAPs34
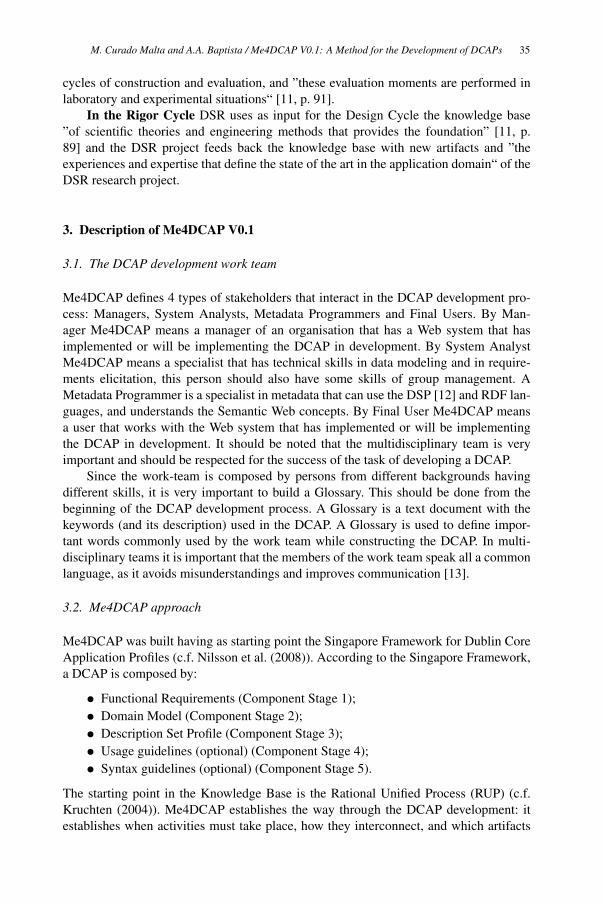
cycles of construction and evaluation, and ”these evaluation moments are performed in
laboratory and experimental situations“ [11, p. 91].
In the Rigor Cycle DSR uses as input for the Design Cycle the knowledge base
”of scientific theories and engineering methods that provides the foundation” [11, p.
89] and the DSR project feeds back the knowledge base with new artifacts and ”the
experiences and expertise that define the state of the art in the application domain“ of the
DSR research project.
3. Description of Me4DCAP V0.1
3.1. The DCAP development work team
Me4DCAP defines 4 types of stakeholders that interact in the DCAP development pro-
cess: Managers, System Analysts, Metadata Programmers and Final Users. By Man-
ager Me4DCAP means a manager of an organisation that has a Web system that has
implemented or will be implementing the DCAP in development. By System Analyst
Me4DCAP means a specialist that has technical skills in data modeling and in require-
ments elicitation, this person should also have some skills of group management. A
Metadata Programmer is a specialist in metadata that can use the DSP [12] and RDF lan-
guages, and understands the Semantic Web concepts. By Final User Me4DCAP means
a user that works with the Web system that has implemented or will be implementing
the DCAP in development. It should be noted that the multidisciplinary team is very
important and should be respected for the success of the task of developing a DCAP.
Since the work-team is composed by persons from different backgrounds having
different skills, it is very important to build a Glossary. This should be done from the
beginning of the DCAP development process. A Glossary is a text document with the
keywords (and its description) used in the DCAP. A Glossary is used to define impor-
tant words commonly used by the work team while constructing the DCAP. In multi-
disciplinary teams it is important that the members of the work team speak all a common
language, as it avoids misunderstandings and improves communication [13].
3.2. Me4DCAP approach
Me4DCAP was built having as starting point the Singapore Framework for Dublin Core
Application Profiles (c.f. Nilsson et al. (2008)). According to the Singapore Framework,
a DCAP is composed by:
• Functional Requirements (Component Stage 1);
• Domain Model (Component Stage 2);
• Description Set Profile (Component Stage 3);
• Usage guidelines (optional) (Component Stage 4);
• Syntax guidelines (optional) (Component Stage 5).
The starting point in the Knowledge Base is the Rational Unified Process (RUP) (c.f.
Kruchten (2004)). Me4DCAP establishes the way through the DCAP development: it
establishes when activities must take place, how they interconnect, and which artifacts
M. Curado Malta and A.A. Baptista / Me4DCAP V0.1: A Method for the Development of DCAPs 35
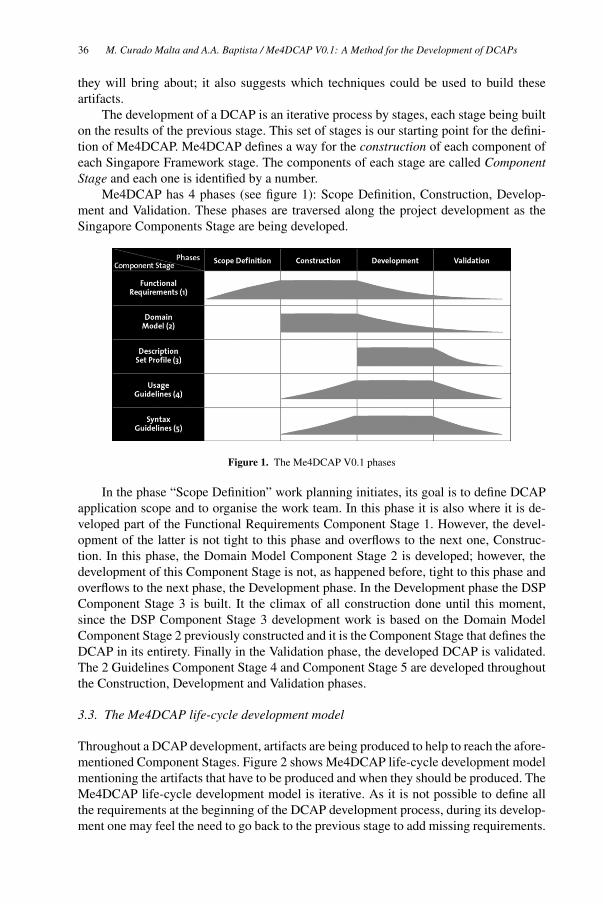
they will bring about; it also suggests which techniques could be used to build these
artifacts.
The development of a DCAP is an iterative process by stages, each stage being built
on the results of the previous stage. This set of stages is our starting point for the defini-
tion of Me4DCAP. Me4DCAP defines a way for the construction of each component of
each Singapore Framework stage. The components of each stage are called ComponentStage and each one is identified by a number.
Me4DCAP has 4 phases (see figure 1): Scope Definition, Construction, Develop-
ment and Validation. These phases are traversed along the project development as the
Singapore Components Stage are being developed.
Figure 1. The Me4DCAP V0.1 phases
In the phase “Scope Definition” work planning initiates, its goal is to define DCAP
application scope and to organise the work team. In this phase it is also where it is de-
veloped part of the Functional Requirements Component Stage 1. However, the devel-
opment of the latter is not tight to this phase and overflows to the next one, Construc-
tion. In this phase, the Domain Model Component Stage 2 is developed; however, the
development of this Component Stage is not, as happened before, tight to this phase and
overflows to the next phase, the Development phase. In the Development phase the DSP
Component Stage 3 is built. It the climax of all construction done until this moment,
since the DSP Component Stage 3 development work is based on the Domain Model
Component Stage 2 previously constructed and it is the Component Stage that defines the
DCAP in its entirety. Finally in the Validation phase, the developed DCAP is validated.
The 2 Guidelines Component Stage 4 and Component Stage 5 are developed throughout
the Construction, Development and Validation phases.
3.3. The Me4DCAP life-cycle development model
Throughout a DCAP development, artifacts are being produced to help to reach the afore-
mentioned Component Stages. Figure 2 shows Me4DCAP life-cycle development model
mentioning the artifacts that have to be produced and when they should be produced. The
Me4DCAP life-cycle development model is iterative. As it is not possible to define all
the requirements at the beginning of the DCAP development process, during its develop-
ment one may feel the need to go back to the previous stage to add missing requirements.
M. Curado Malta and A.A. Baptista / Me4DCAP V0.1: A Method for the Development of DCAPs36
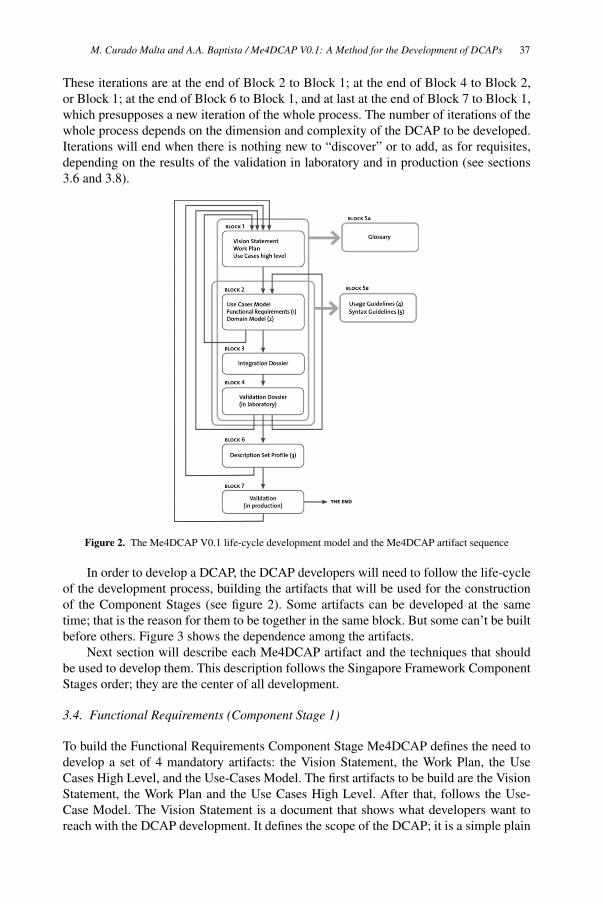
These iterations are at the end of Block 2 to Block 1; at the end of Block 4 to Block 2,
or Block 1; at the end of Block 6 to Block 1, and at last at the end of Block 7 to Block 1,
which presupposes a new iteration of the whole process. The number of iterations of the
whole process depends on the dimension and complexity of the DCAP to be developed.
Iterations will end when there is nothing new to “discover” or to add, as for requisites,
depending on the results of the validation in laboratory and in production (see sections
3.6 and 3.8).
Figure 2. The Me4DCAP V0.1 life-cycle development model and the Me4DCAP artifact sequence
In order to develop a DCAP, the DCAP developers will need to follow the life-cycle
of the development process, building the artifacts that will be used for the construction
of the Component Stages (see figure 2). Some artifacts can be developed at the same
time; that is the reason for them to be together in the same block. But some can’t be built
before others. Figure 3 shows the dependence among the artifacts.
Next section will describe each Me4DCAP artifact and the techniques that should
be used to develop them. This description follows the Singapore Framework Component
Stages order; they are the center of all development.
3.4. Functional Requirements (Component Stage 1)
To build the Functional Requirements Component Stage Me4DCAP defines the need to
develop a set of 4 mandatory artifacts: the Vision Statement, the Work Plan, the Use
Cases High Level, and the Use-Cases Model. The first artifacts to be build are the Vision
Statement, the Work Plan and the Use Cases High Level. After that, follows the Use-
Case Model. The Vision Statement is a document that shows what developers want to
reach with the DCAP development. It defines the scope of the DCAP; it is a simple plain
M. Curado Malta and A.A. Baptista / Me4DCAP V0.1: A Method for the Development of DCAPs 37
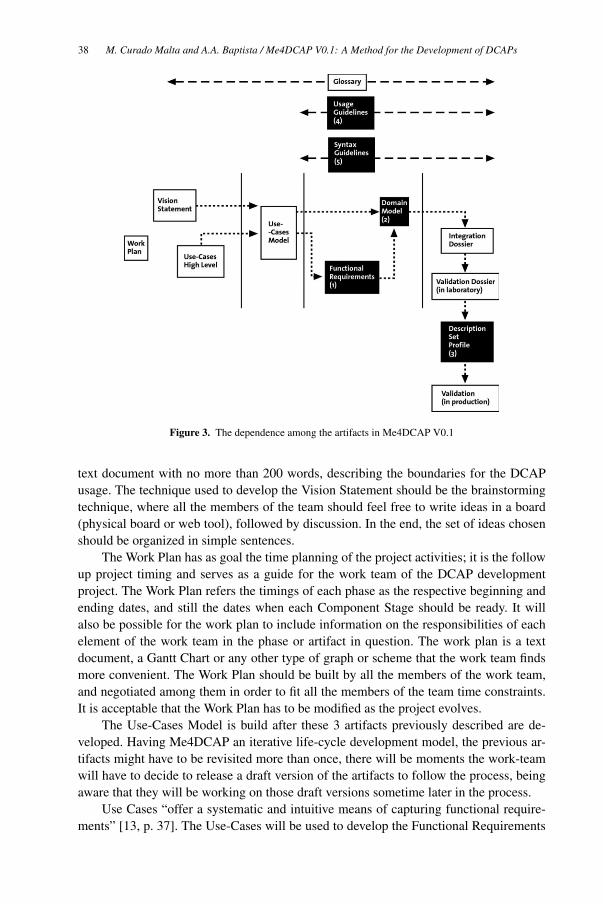
Figure 3. The dependence among the artifacts in Me4DCAP V0.1
text document with no more than 200 words, describing the boundaries for the DCAP
usage. The technique used to develop the Vision Statement should be the brainstorming
technique, where all the members of the team should feel free to write ideas in a board
(physical board or web tool), followed by discussion. In the end, the set of ideas chosen
should be organized in simple sentences.
The Work Plan has as goal the time planning of the project activities; it is the follow
up project timing and serves as a guide for the work team of the DCAP development
project. The Work Plan refers the timings of each phase as the respective beginning and
ending dates, and still the dates when each Component Stage should be ready. It will
also be possible for the work plan to include information on the responsibilities of each
element of the work team in the phase or artifact in question. The work plan is a text
document, a Gantt Chart or any other type of graph or scheme that the work team finds
more convenient. The Work Plan should be built by all the members of the work team,
and negotiated among them in order to fit all the members of the team time constraints.
It is acceptable that the Work Plan has to be modified as the project evolves.
The Use-Cases Model is build after these 3 artifacts previously described are de-
veloped. Having Me4DCAP an iterative life-cycle development model, the previous ar-
tifacts might have to be revisited more than once, there will be moments the work-team
will have to decide to release a draft version of the artifacts to follow the process, being
aware that they will be working on those draft versions sometime later in the process.
Use Cases “offer a systematic and intuitive means of capturing functional require-
ments” [13, p. 37]. The Use-Cases will be used to develop the Functional Requirements
M. Curado Malta and A.A. Baptista / Me4DCAP V0.1: A Method for the Development of DCAPs38
and to understand the objects (and attributes) of the system to be studied. The Use-Cases
Model is composed of:
• the UML Use-Case diagram with the actors that interact in the Use-Cases, de-
scribing the functionality of the system [14];
• the set of all detailed Use-Cases.
For information on how to built an UML Use-Case diagram see [15] or [13].
“Each use-case must include details about what has to be done to achieve its func-
tionality” [16, p.21] Every Use-Case should be then documented in detail. This docu-
mentation should set the sequence of actions - a specific sequence of events that happen
in the system - that a system performs to bring added value to a specific actor. An actor
is somebody or something (automata) outside the system that interacts with it [14]. An
Use-Case description is a flow of events description, and it should be developed using
the template proposed by [16]. Every manager member of the work-group will know
precisely which are the needs of the system in order to achieve certain objectives of
functionality; they should be the persons to identify what are the actions that will bring
value to the system. So, the Use-Case description should be developed by the jmanagers,
giving them the template of the flow-of-events defined by [16] and a definition of Use-
Case (defined in the Glossary). The set of Use-Case descriptions should be written on the
board (physical board or web tool), and the work-team as a whole should revise them,
with the System Analysts members of the work-team helping managers to clarify ideas.
After having the previously described 4 artifacts developed, the Functional Require-
ments can be built. This Singapore Component Stage 1 is mandatory. Functional require-
ments “guide the development of the application profile by providing goals and bound-
aries and are an essential component of a successful application profile development pro-
cess. This development is often a broad community task and may involve managers of
services, experts in the materials being used, application developers, and potential end-
users of the services” [4]. The Functional Requirements Component Stage 1 is a text doc-
ument, where general goals are mentioned as well as specific tasks [4]. To develop the
Functional Requirements the work-team should read, in group, the Use-Cases detailed
description to identify which are the functional requirements that the use-cases explicit.
Short sentences should be used, and should be written on the board (physical board or
on the working web tool). After that, the work-team should identify if there are no re-
peated ideas of functional requirements on the board. Certain ideas speak more to some
work-team members than to others so, each functional-requirement- idea should be dis-
tributed accordingly, in order to satisfy every member’s needs specific requirements. Ev-
ery member of the work-group should write some sentences describing more deeply the
requirement-case that is responsible for. In the end of the process, all the requirements-
cases should be put together on the board (physical board or web tool), and the whole
group should discuss and review the final result.
3.5. Domain Model (Component Stage 2)
The Domain Model is the mandatory Singapore Component Stage 2. It “captures the
most important types of objects in the context of the system.” [13, p. 119]. According
to [4] “a domain model is a description of what things your metadata will describe,
and the relationships between those things. The domain model is the basic blueprint
M. Curado Malta and A.A. Baptista / Me4DCAP V0.1: A Method for the Development of DCAPs 39
for the construction of the application profile”. The domain model is build based on
the Functional Requirements Component Stage 1 and on the Use-Cases Model artifact
described in Section 3.4. The domain model development can also use the help of other
techniques depending on the DCAP development context. In situations where access to
documentation or the information systems databases is available, it is possible to resort
to the Document Analysis technique to define it as well.
Me4DCAP suggests that the Domain Model should be developed using an UML
class diagram with details suppressed. The diagram identifies the classes of objects and
the relationships among them but the classes’ methods and attributes are omitted since
the methods’ definition is not in the frame of a DCAP development, and the attributes will
be defined in the ORM Diagram data model (see next section). The Entity-Relationship
diagram [17] showing the entities and the relationships among them can be an alternative
to the UM class diagram technique (attributes should be omitted).
3.6. Description Set Profile (Component Stage 3)
To develop the mandatory Singapore Component Stage 3 Description Set Profile (DSP)
Me4DCAP defines the need to develop a set of 2 mandatory dossiers:
• The Integration Dossier;
• The Validation Dossier (in laboratory).
The Integration dossier comprises 3 artifacts: an Object Role Modeling (ORM/NIAM)
[18] diagram data model, a State Of The Art and a Document of Integration. All these
artifacts are mandatory.
The ORM diagram is a data model with:
• the classes of objects (defined in the Domain Model);
• the attributes of the classes of objects;
• the attributes’ constraints, such as their repeatability, domain and multi-language
option.
In this part of the DCAP development process, every class of object and attribute
should have been already described in plain text, in the Usage Guidelines Component
Stage 4 (see section 3.7 for details about this artifact). This work should be done by the
stakeholders.
After defining the ORM Diagram data model, Me4DCAP defines as next step the
application of a metadata scheme property to every attribute of the objects of the Domain
Model. The attributes are described, each and everyone, by the existing properties of the
metadata schemes of the metadata community. In case of not being able to describe some
of the attributes with the existing metadata schemes, those attributes should be described
with new properties; these new properties have to be created. According to Baker &
Coyle (2009) [4], this process is done in 2 steps:
• To perform a State of the art to existing metadata schemes - that are described in
RDF - to find out from the existing schemes which ones can describe the identified
attributes. This work should be done by the metadata programmers of the work-
team;
• To create new properties - in case there are no properties on the metadata schemes
of the state of the art to describe some of the identified attributes. This work
should be done by the metadata programmers of the work-team.
M. Curado Malta and A.A. Baptista / Me4DCAP V0.1: A Method for the Development of DCAPs40
The existing information on the State Of The Art and on the ORM Diagram will be
used to build a Document of Integration. This Document shows, in a matrix, per line,
every attribute and its constraints, described by the properties of the metadata schemes
and encoding schemes chosen. This work should be done by the metadata program-
mers of the work-team. An example based on the DCMI Guidelines (c.f. [4]) can be
downloaded from the repository of University of Minho accessible through the URL
http://hdl.handle.net/1822/. Me4DCAP defines as next step the execution of the
validation of the work done until the present moment of the development process. In
order to do that a validation in laboratory is executed; Me4DCAP calls it the “Validation
Dossier”. The Validation Dossier comprises 3 mandatory artifacts: a Validation Report,
a filled-in Matrix and a filled-in Questionnaire.
A laboratory validation should take place, so as to check:
1. its adequacy to what has been defined in the “Vision Statement” artifact: a meet-
ing of the work-team should take place to evaluate the answer to the defined vi-
sion (see Vision Statement in section 3.4). The work-team should make a report
(text document) with the conclusions of the meeting and recommendations.
2. DCAP adaptation to the resources that are going to be described by the DCAP:
the validation is done through the application of the DCAP to a resource sample.
This validation work is done in 2 stages:
(a) Application of the DCAP to a resource sample. The work-team should iden-
tify a set of resources that constitutes a trustworthy sample of the application
domain of the developing DCAP, and from there, final users, chosen by the
stakeholders members of the work-team, and the metadata programmers as
resource persons, should complete the validation matrix with data referring
to each resource. The matrix template should be simple to fill in, where each
element of the metadata is populated with the data that corresponds to the re-
source. This matrix should be accompanied by the 2 Guidelines Component
Stage 4 and Component Stage 5. An example of a validation matrix can be
downloaded from the repository of University of Minho accessible through
the URL http://hdl.handle.net/1822/. The example used is the same as in the
Document of integration (see previous point);
(b) Answer to a set of questions. The final users chosen to do the application of
the DCAP to a resource sample (see previous point) together with the meta-
data programmers of the work-team, should answer to a set of questions to
assess the difficulties of the validation process. The goal is to assess if there is
data for which the DCAP has no description, or if there are DCAP elements,
defined as compulsory, that could not be fulfilled with the information existing
in a given resource, or any other type of difficulty or ambiguity. The questions
to be asked to the DCAP validators could be like:
i. Could you describe all your data with the available elements? If not, please
refer the difficulties;
ii. Were there any DCAP metadata elements left that you could not fulfill?
Which? Did this happen for lack of data or because you did not know how
to do it?;
iii. Did you have any difficulty in particular to describe your data? Were there
any ambiguities?;
M. Curado Malta and A.A. Baptista / Me4DCAP V0.1: A Method for the Development of DCAPs 41
iv. Is there anything else you want to add?
According to the results of the questionnaire, the process iterates or follows
to the DSP development (see figure 2).
The Singapore Component Stage 4 DSP is mandatory. The task is to detail the metadata
developing their design in the DSP language defined by Nilsson (2008). Further infor-
mation, including implementation examples, can be found in Baker & Coyle (2009) [4].
This task should be performed by the metadata programmers of the work-team.
3.7. Guidelines (Component Stage 4 and Component Stage 5)
These guidelines are not mandatory in the Singapore Framework. Me4DCAP does not
make them mandatory but recommends that they are developed since it helps the final
users of the DCAP application to apply correctly the properties and constraints.
Me4DCAP defines that the developing of the Usage Guidelines starts at the same
time as the Domain Model. DCMI Guidelines [4] explain: “Description Set Profile de-
fines the “what” of the application profile; usage guidelines provide the “how” and
“why”. Usage guidelines offer instructions to those who will create the metadata records.
Ideally, they explain each property and anticipate the decisions that must be made in the
course of creating a metadata record” [4] . For detailed information see [4] and [5] .
The development of the Syntax Guidelines needs that the Integration Dossier is de-
veloped in a certain stage. This artifact describes “any application profile-specific syn-
taxes and/or syntax guidelines, if any” [4]. For detailed information see [4] and [5] .
The Usage Guidelines can be developed by both types of members of the work-team,
the stakeholders and the metadata programmers, since the description of the attributes
and classes of objects is information that will have to be filled in by the domain experts.
The Syntax Guidelines have to be developed by the metadata programmers since it is a
very technical document.
3.8. Finishing the DCAP development
A validation in production of the DCAP should be performed. This process of validation
can be done using a log registration technique or observing final-users working with
the system that has implemented the DCAP developed. The results of this validation in
production should be reported to the work-team in order to review and access the DCAP
definitions. If there is new information to introduce in the process, the whole DCAP
development process should start from Block 1 (see figure 2), and every artifact should
be checked against this new information.
4. Conclusions and future work
A Dublin Core Application Profile is a very important construct to implement interop-
erability in a community of practice. Previous studies [7] has shown that there is no
method to develop such a construct. The absence of guidelines showing life-cycle with
standardised activities, as well as a set of well-defined design criteria, with defined tech-
niques, make a DCAP development rather a craft than an engineering activity. Thus, this
M. Curado Malta and A.A. Baptista / Me4DCAP V0.1: A Method for the Development of DCAPs42
is a problem that the metadata community has faced; this community needs a common
ground of work concerning the development of DCAP.
This paper presents version 0.1 of a method for the development of DCAP
(Me4DCAP), based on PhD research in progress project that uses a Design Science
Research methodological approach. Me4DCAP establishes the way through the DCAP
development: it establishes when activities must take place, how they interconnect, and
which artifacts they will bring about; it also suggests which techniques could be used
to build these artifacts. Me4DCAP defines a way for the construction of each Singapore
Framework [5] component.
As future work we envision the validation process of Me4DCAP under the scope
of the DSR approach; this validation is a very important tool to access the adequacy of
Me4DCAP to the needs of the metadata community application domain. These validation
process will be done using the Focus Group approach and we expect to find projects in
developing DCAP using Me4DCAP V0.1 for feedback and fine-tuning A new version
of Me4DCAP (V0.2) will be developed, integrating the information reported from the
validation process.
Acknowledgements
This work is sponsored by FEDER funds through the Competitivity Factors Operational
Programme - COMPETE and by National funds through FCT - Foundation for Science
and Technology within the scope of the project: FCOMP-01-0124-FFEDER-022674.
We would also like to thank Ida Cruz for the drawings of this paper. Last but not the
least; we would like to thank Maria Emılia for the English review of the paper.
References
[1] W3C, “Semantic web.” http://www.w3.org/standards/semanticweb/, 2012. Accessed in 14 Jan
2012. Confirmed 9 Feb 2013.
[2] N. Press, “Understanding metadata,” NISO Press Booklets, vol. 1, 2004.
[3] A. Powell, M. Nilsson, A. Naeve, T. Baker, and P. Johnston, “Dcmi abstract model.” http://
dublincore.org/documents/2007/06/04/abstract-model/, 06 2007. Accessed in 26.06.2011.
[4] T. Baker and K. Coyle, “Guidelines for dublin core application profiles.”
http://dublincore.org/documents/profile-guidelines/, 05 2009. Accessed in 26 Jun 2011. Confirmed 1
Feb 2013.
[5] T. Baker, M. Nilsson, and P. Johnston, “The singapore framework for dublin core application pro-
files.” http://dublincore.org/documents/singapore-framework/, 01 2008. Accessed in 26
Jun 2011. Confirmed 9 Feb 2013.
[6] J. de Almeida and J. Pinto, A investigacao nas ciencias sociais. Presenca, 1995.
[7] M. Curado Malta and A. A. Baptista, “State of the art on methodologies for the development of a meta-
data application profile,” in Comunications in Computer and Information Sciences (P. K. J. M. Dodero,
M. Palomo-Duarte, ed.), vol. 343, p. 61–73, Springer-Verlag Berlin Heidelberg, 2012.
[8] H. A. Simon, The sciences of the artificial. MIT press, 1996.
[9] A. Hevner, S. March, J. Park, and S. Ram, “Design science in information systems research,” MISquarterly, vol. 28, no. 1, pp. 75–105, 2004.
[10] A. Hevner and S. Chatterjee, Design Research in Information Systems - Theory and Practice, vol. 22 of
Integrated Series in Information Systems. Springer, 2010.
[11] A. Hevner, “The three cycle view of design science research,” Scandinavian Journal of InformationSystems, vol. 19, no. 2, p. 87, 2007.
M. Curado Malta and A.A. Baptista / Me4DCAP V0.1: A Method for the Development of DCAPs 43

[12] M. Nilsson, “Description set profiles: A constraint language for dublin core application profiles.” http:
//dublincore.org/documents/2008/03/31/dc-dsp/, 2008. This is a DCMI Working Draft.
[13] I. Jacobson, G. Booch, and J. Rumbaugh, The Unified Software Development Process. Addison Wesley,
1999.
[14] P. Kruchten, The rational unified process: an introduction. Addison-Wesley Professional, 2004.
[15] M. Fowler, UML distilled. Addison-Wesley Professional, 2004.
[16] G. Schneider and J. Winters, Applying use cases: a practical guide. Addison-Wesley, 2001.
[17] P. Chen, “The entity-relationship model—toward a unified view of data,” ACM Transactions onDatabase Systems (TODS), vol. 1, no. 1, pp. 9–36, 1976.
[18] T. Halpin, “Business rules and object-role modeling,” Database Programming and Design, vol. 9,
pp. 66–72, 1996.
M. Curado Malta and A.A. Baptista / Me4DCAP V0.1: A Method for the Development of DCAPs44
COMFy - A Conference Management
Framework
Christian CALDERA a, Rene BERNDT b,1
and Dieter W. FELLNER a,c
a Institute of ComputerGraphics and KnowledgeVisualization (CGV), TU Graz, Austriab Fraunhofer Austria Research GmbH
c GRIS, TU Darmstadt & Fraunhofer IGD, Darmstadt, Germany
Abstract. Organizing the peer review process for a scientific conference can be a
cumbersome task. Electronic conference management systems support chairs and
reviewers in managing the huge amount of submissions. These system implement
the complete work-flow of a scientific conference. We present a new approach to
such systems. By providing an open API framework instead of a closed system it
enables external programs to harvest and to utilize open information sources avail-
able on the internet today.
Keywords. conference management system, linked open data, open Bibliographic
Data
Introduction
In scientific publishing today most conferences and journals use an electronic conference
managing system in order to organize their peer reviewing. Peer review is described as
a process of self-regulation by a profession or a process of evaluation involving quali-
fied individuals within the relevant field. Peer review methods are employed to maintain
standards, improve performance and provide credibility. In academia peer review is often
used to determine an academic paper’s suitability for publication[1].
A typical peer review process for a conference or a journal works as follows: Authors
submit their papers in a conference management system. After the submission deadline
the reviewers are assigned to these papers. After the reviewing deadline the review results
are communicated back to the authors. For all accepted papers the camera-ready version
needs to be submitted from the authors. The reviewers are selected from a pool of known
experts in the domain of the conference/journal. In case of a conference these experts are
usually listed as the international program committee (IPC). For this reviewing process
the two most applied types are single-blind and double-blind peer review. Single-blind
means that the authors dont know who is reviewing their paper. The reviewer on the other
hand knows the identity of the author. In the double-blind review process the reviewer
does not know the identity of the authors.
1Corresponding Author: Rene Berndt, Fraunhofer Austria Research GmbH, Inffeldgasse 16c, 8010 Graz,
Austria; E-mail: [email protected].
Mining the Digital Information NetworksN. Lavesson et al. (Eds.)© 2013 The authors and IOS Press.This article is published online with Open Access by IOS Press and distributed under the termsof the Creative Commons Attribution Non-Commercial License.doi:10.3233/978-1-61499-270-7-45
45
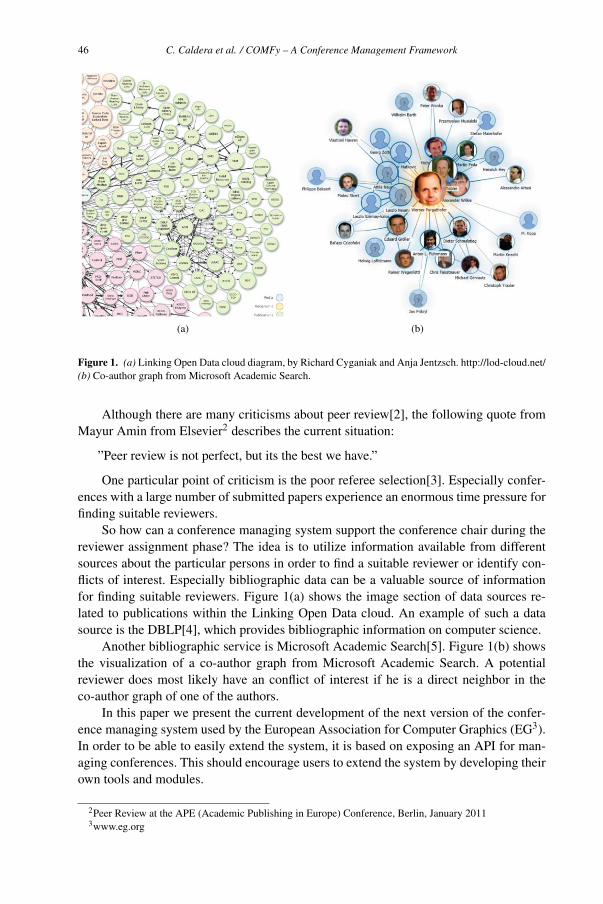
(a) (b)
Figure 1. (a) Linking Open Data cloud diagram, by Richard Cyganiak and Anja Jentzsch. http://lod-cloud.net/
(b) Co-author graph from Microsoft Academic Search.
Although there are many criticisms about peer review[2], the following quote from
Mayur Amin from Elsevier2 describes the current situation:
”Peer review is not perfect, but its the best we have.”
One particular point of criticism is the poor referee selection[3]. Especially confer-
ences with a large number of submitted papers experience an enormous time pressure for
finding suitable reviewers.
So how can a conference managing system support the conference chair during the
reviewer assignment phase? The idea is to utilize information available from different
sources about the particular persons in order to find a suitable reviewer or identify con-
flicts of interest. Especially bibliographic data can be a valuable source of information
for finding suitable reviewers. Figure 1(a) shows the image section of data sources re-
lated to publications within the Linking Open Data cloud. An example of such a data
source is the DBLP[4], which provides bibliographic information on computer science.
Another bibliographic service is Microsoft Academic Search[5]. Figure 1(b) shows
the visualization of a co-author graph from Microsoft Academic Search. A potential
reviewer does most likely have an conflict of interest if he is a direct neighbor in the
co-author graph of one of the authors.
In this paper we present the current development of the next version of the confer-
ence managing system used by the European Association for Computer Graphics (EG3).
In order to be able to easily extend the system, it is based on exposing an API for man-
aging conferences. This should encourage users to extend the system by developing their
own tools and modules.
2Peer Review at the APE (Academic Publishing in Europe) Conference, Berlin, January 20113www.eg.org
C. Caldera et al. / COMFy – A Conference Management Framework46
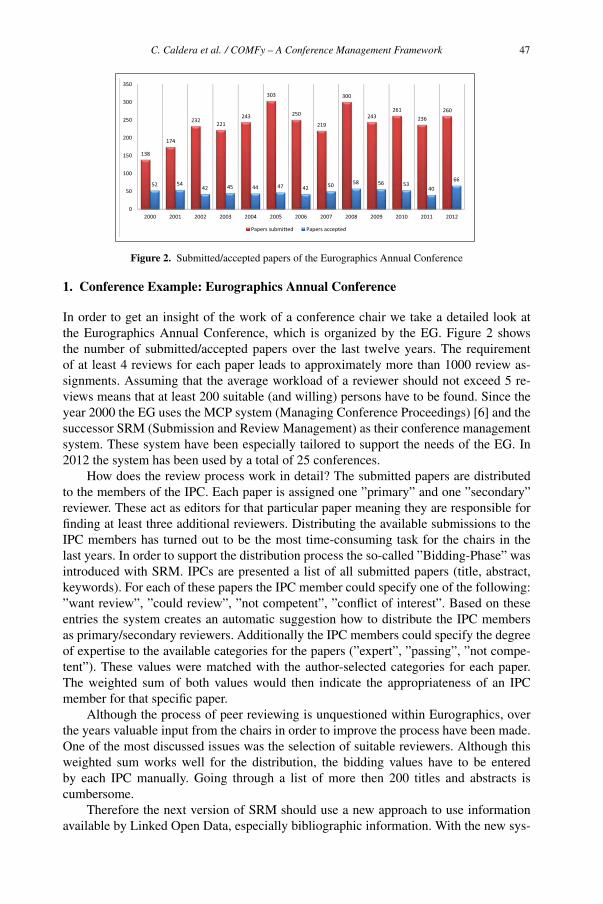
138
174
232221
243
303
250
219
300
243261
236260
52 5442 45 44 47 42 50 58 56 53
4066
0
50
100
150
200
250
300
350
2000 2001 2002 2003 2004 2005 2006 2007 2008 2009 2010 2011 2012
Papers�submitted Papers�accepted
Figure 2. Submitted/accepted papers of the Eurographics Annual Conference
1. Conference Example: Eurographics Annual Conference
In order to get an insight of the work of a conference chair we take a detailed look at
the Eurographics Annual Conference, which is organized by the EG. Figure 2 shows
the number of submitted/accepted papers over the last twelve years. The requirement
of at least 4 reviews for each paper leads to approximately more than 1000 review as-
signments. Assuming that the average workload of a reviewer should not exceed 5 re-
views means that at least 200 suitable (and willing) persons have to be found. Since the
year 2000 the EG uses the MCP system (Managing Conference Proceedings) [6] and the
successor SRM (Submission and Review Management) as their conference management
system. These system have been especially tailored to support the needs of the EG. In
2012 the system has been used by a total of 25 conferences.
How does the review process work in detail? The submitted papers are distributed
to the members of the IPC. Each paper is assigned one ”primary” and one ”secondary”
reviewer. These act as editors for that particular paper meaning they are responsible for
finding at least three additional reviewers. Distributing the available submissions to the
IPC members has turned out to be the most time-consuming task for the chairs in the
last years. In order to support the distribution process the so-called ”Bidding-Phase” was
introduced with SRM. IPCs are presented a list of all submitted papers (title, abstract,
keywords). For each of these papers the IPC member could specify one of the following:
”want review”, ”could review”, ”not competent”, ”conflict of interest”. Based on these
entries the system creates an automatic suggestion how to distribute the IPC members
as primary/secondary reviewers. Additionally the IPC members could specify the degree
of expertise to the available categories for the papers (”expert”, ”passing”, ”not compe-
tent”). These values were matched with the author-selected categories for each paper.
The weighted sum of both values would then indicate the appropriateness of an IPC
member for that specific paper.
Although the process of peer reviewing is unquestioned within Eurographics, over
the years valuable input from the chairs in order to improve the process have been made.
One of the most discussed issues was the selection of suitable reviewers. Although this
weighted sum works well for the distribution, the bidding values have to be entered
by each IPC manually. Going through a list of more then 200 titles and abstracts is
cumbersome.
Therefore the next version of SRM should use a new approach to use information
available by Linked Open Data, especially bibliographic information. With the new sys-
C. Caldera et al. / COMFy – A Conference Management Framework 47
tem it should be easy to interact with 3rd party applications or data sources. It should be
easy to harvest the data to create statistics and further usage of this data. Additionally
this solution should handle in a similar fashion like the current system.
2. Related Work
This section will give a small overview of some of other reviewed conference manage-
ment systems:
• Easy Chair is a free service for managing a conference. It provides the basic fea-
tures like uploading a submission and a reviewing system. Further it has multi-
ple conference models a chair can choose from to customize its conference. Be-
side the models it is not possible to further modify the conference[7]. The re-
view assignment process in Easychair works manual or automatic. When using
the automatic mode the Program Committee defines the conflicts of interests and
then they specifies which papers they are interested to review. After this is done
Easychair tries to create a good matching between the Committee and the papers.
[8]
• COMS Conference Management System has a one time set up fee for creating
a website to satisfy the needs of the chair. This website will be the frontend for
their conference management system. Once the homepage is created the chair
may define 9 different review fields. The review assignment works is again either
manual or automatic. The automatic mode takes the reviewers biddings like in
Easychair and creates a matching between the reviewer and the submission. [9]
• OpenConf is a php based conference management tool which has again the stan-
dard functionality for managing a conference. OpenConf provides the basic con-
ference management tools. They further offer additional modules to add func-
tionality to the program. One of these modules called the bidding module adds
the functionality for Program Committee members to define which papers they
want to review. After this bidding OpenConf provides some different algorithms
to create a matching between the reviewer and the papers. [10]
• Confious The Confious system has also the standard features for managing a con-
ference. Confious has like the other systems a automated and a manual reviewer
assignment system. But unlike the other systems Confious takes the paper topics
into consideration. Authors define which topics their paper is in and the Commit-
tee members set their experience in these topics. Then it tries to create a good
matching. Further Confious also tries to generate automated conflicts based on
the Email and the institute of the IPC and the author. [11]
• Conftool is a tool which provides many different languages to manage a con-
ference. Like Confious its automated review assignment takes the IPCs bidding
and the paper topics into consideration when creating a review assignment. It also
tries to create conflicts like Confious according to the Email, the organization and
the surname of the reviewer. [12]
One major challenge in the Eurographics conference is the assignment of reviewers.
There are currently two different approaches to accomplish this task. The automated
and the manual assignment. With the manual approach the chairs assign reviewers to
C. Caldera et al. / COMFy – A Conference Management Framework48
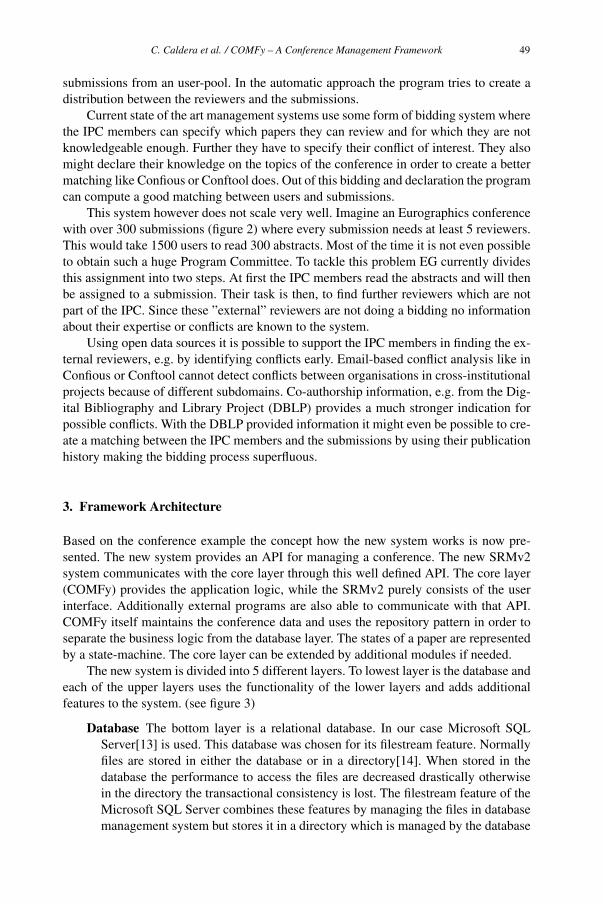
submissions from an user-pool. In the automatic approach the program tries to create a
distribution between the reviewers and the submissions.
Current state of the art management systems use some form of bidding system where
the IPC members can specify which papers they can review and for which they are not
knowledgeable enough. Further they have to specify their conflict of interest. They also
might declare their knowledge on the topics of the conference in order to create a better
matching like Confious or Conftool does. Out of this bidding and declaration the program
can compute a good matching between users and submissions.
This system however does not scale very well. Imagine an Eurographics conference
with over 300 submissions (figure 2) where every submission needs at least 5 reviewers.
This would take 1500 users to read 300 abstracts. Most of the time it is not even possible
to obtain such a huge Program Committee. To tackle this problem EG currently divides
this assignment into two steps. At first the IPC members read the abstracts and will then
be assigned to a submission. Their task is then, to find further reviewers which are not
part of the IPC. Since these ”external” reviewers are not doing a bidding no information
about their expertise or conflicts are known to the system.
Using open data sources it is possible to support the IPC members in finding the ex-
ternal reviewers, e.g. by identifying conflicts early. Email-based conflict analysis like in
Confious or Conftool cannot detect conflicts between organisations in cross-institutional
projects because of different subdomains. Co-authorship information, e.g. from the Dig-
ital Bibliography and Library Project (DBLP) provides a much stronger indication for
possible conflicts. With the DBLP provided information it might even be possible to cre-
ate a matching between the IPC members and the submissions by using their publication
history making the bidding process superfluous.
3. Framework Architecture
Based on the conference example the concept how the new system works is now pre-
sented. The new system provides an API for managing a conference. The new SRMv2
system communicates with the core layer through this well defined API. The core layer
(COMFy) provides the application logic, while the SRMv2 purely consists of the user
interface. Additionally external programs are also able to communicate with that API.
COMFy itself maintains the conference data and uses the repository pattern in order to
separate the business logic from the database layer. The states of a paper are represented
by a state-machine. The core layer can be extended by additional modules if needed.
The new system is divided into 5 different layers. To lowest layer is the database and
each of the upper layers uses the functionality of the lower layers and adds additional
features to the system. (see figure 3)
Database The bottom layer is a relational database. In our case Microsoft SQL
Server[13] is used. This database was chosen for its filestream feature. Normally
files are stored in either the database or in a directory[14]. When stored in the
database the performance to access the files are decreased drastically otherwise
in the directory the transactional consistency is lost. The filestream feature of the
Microsoft SQL Server combines these features by managing the files in database
management system but stores it in a directory which is managed by the database
C. Caldera et al. / COMFy – A Conference Management Framework 49
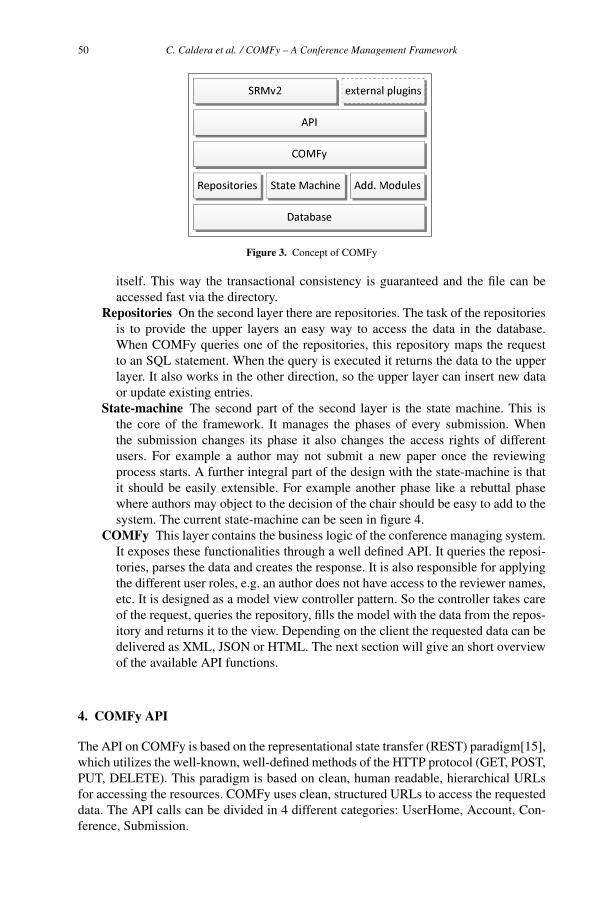
Figure 3. Concept of COMFy
itself. This way the transactional consistency is guaranteed and the file can be
accessed fast via the directory.
Repositories On the second layer there are repositories. The task of the repositories
is to provide the upper layers an easy way to access the data in the database.
When COMFy queries one of the repositories, this repository maps the request
to an SQL statement. When the query is executed it returns the data to the upper
layer. It also works in the other direction, so the upper layer can insert new data
or update existing entries.
State-machine The second part of the second layer is the state machine. This is
the core of the framework. It manages the phases of every submission. When
the submission changes its phase it also changes the access rights of different
users. For example a author may not submit a new paper once the reviewing
process starts. A further integral part of the design with the state-machine is that
it should be easily extensible. For example another phase like a rebuttal phase
where authors may object to the decision of the chair should be easy to add to the
system. The current state-machine can be seen in figure 4.
COMFy This layer contains the business logic of the conference managing system.
It exposes these functionalities through a well defined API. It queries the reposi-
tories, parses the data and creates the response. It is also responsible for applying
the different user roles, e.g. an author does not have access to the reviewer names,
etc. It is designed as a model view controller pattern. So the controller takes care
of the request, queries the repository, fills the model with the data from the repos-
itory and returns it to the view. Depending on the client the requested data can be
delivered as XML, JSON or HTML. The next section will give an short overview
of the available API functions.
4. COMFy API
The API on COMFy is based on the representational state transfer (REST) paradigm[15],
which utilizes the well-known, well-defined methods of the HTTP protocol (GET, POST,
PUT, DELETE). This paradigm is based on clean, human readable, hierarchical URLs
for accessing the resources. COMFy uses clean, structured URLs to access the requested
data. The API calls can be divided in 4 different categories: UserHome, Account, Con-
ference, Submission.
C. Caldera et al. / COMFy – A Conference Management Framework50
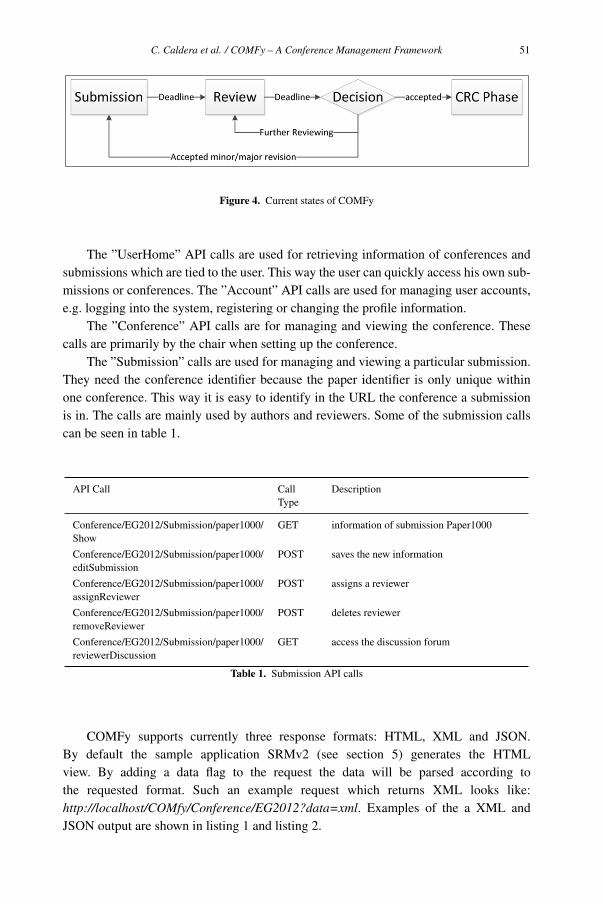
Figure 4. Current states of COMFy
The ”UserHome” API calls are used for retrieving information of conferences and
submissions which are tied to the user. This way the user can quickly access his own sub-
missions or conferences. The ”Account” API calls are used for managing user accounts,
e.g. logging into the system, registering or changing the profile information.
The ”Conference” API calls are for managing and viewing the conference. These
calls are primarily by the chair when setting up the conference.
The ”Submission” calls are used for managing and viewing a particular submission.
They need the conference identifier because the paper identifier is only unique within
one conference. This way it is easy to identify in the URL the conference a submission
is in. The calls are mainly used by authors and reviewers. Some of the submission calls
can be seen in table 1.
API Call Call
Type
Description
Conference/EG2012/Submission/paper1000/
Show
GET information of submission Paper1000
Conference/EG2012/Submission/paper1000/
editSubmission
POST saves the new information
Conference/EG2012/Submission/paper1000/
assignReviewer
POST assigns a reviewer
Conference/EG2012/Submission/paper1000/
removeReviewer
POST deletes reviewer
Conference/EG2012/Submission/paper1000/
reviewerDiscussion
GET access the discussion forum
Table 1. Submission API calls
COMFy supports currently three response formats: HTML, XML and JSON.
By default the sample application SRMv2 (see section 5) generates the HTML
view. By adding a data flag to the request the data will be parsed according to
the requested format. Such an example request which returns XML looks like:
http://localhost/COMfy/Conference/EG2012?data=xml. Examples of the a XML and
JSON output are shown in listing 1 and listing 2.
C. Caldera et al. / COMFy – A Conference Management Framework 51
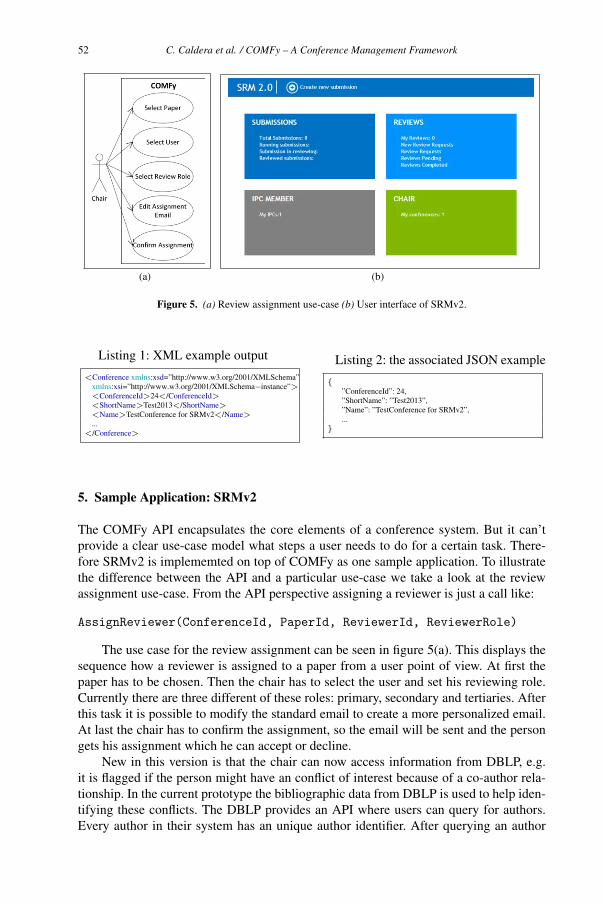
(a) (b)
Figure 5. (a) Review assignment use-case (b) User interface of SRMv2.
Listing 1: XML example output Listing 2: the associated JSON example
5. Sample Application: SRMv2
The COMFy API encapsulates the core elements of a conference system. But it can’t
provide a clear use-case model what steps a user needs to do for a certain task. There-
fore SRMv2 is implememted on top of COMFy as one sample application. To illustrate
the difference between the API and a particular use-case we take a look at the review
assignment use-case. From the API perspective assigning a reviewer is just a call like:
AssignReviewer(ConferenceId, PaperId, ReviewerId, ReviewerRole)
The use case for the review assignment can be seen in figure 5(a). This displays the
sequence how a reviewer is assigned to a paper from a user point of view. At first the
paper has to be chosen. Then the chair has to select the user and set his reviewing role.
Currently there are three different of these roles: primary, secondary and tertiaries. After
this task it is possible to modify the standard email to create a more personalized email.
At last the chair has to confirm the assignment, so the email will be sent and the person
gets his assignment which he can accept or decline.
New in this version is that the chair can now access information from DBLP, e.g.
it is flagged if the person might have an conflict of interest because of a co-author rela-
tionship. In the current prototype the bibliographic data from DBLP is used to help iden-
tifying these conflicts. The DBLP provides an API where users can query for authors.
Every author in their system has an unique author identifier. After querying an author
</Conference>...<Name>TestConference for SRMv2</Name><ShortName>Test2013</ShortName><ConferenceId>24</ConferenceId>xmlns:xsi=”http://www.w3.org/2001/XMLSchema−instance”>
<Conference xmlns:xsd=”http://www.w3.org/2001/XMLSchema”
}...”Name”: ”TestConference for SRMv2”,”ShortName”: ”Test2013”,”ConferenceId”: 24,
{
C. Caldera et al. / COMFy – A Conference Management Framework52
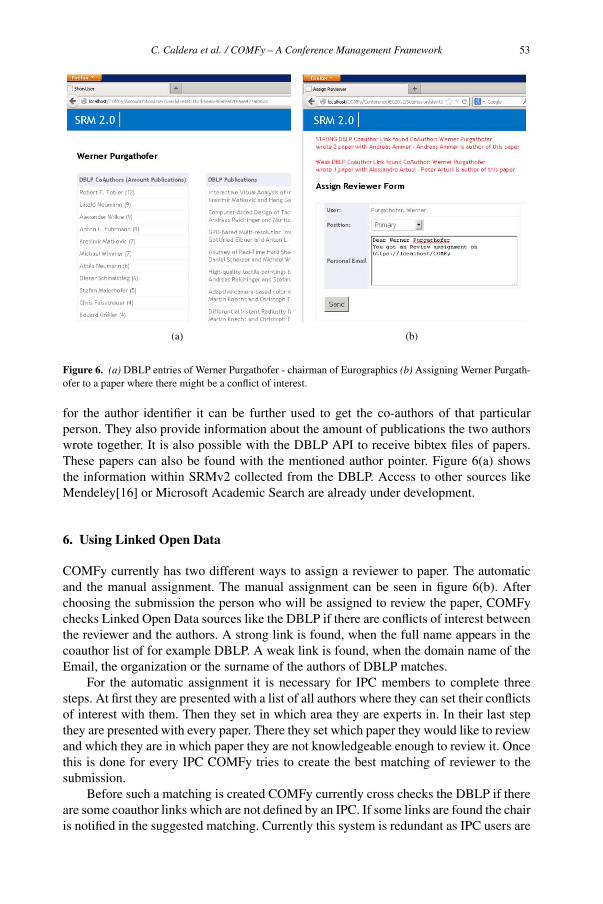
(a) (b)
Figure 6. (a) DBLP entries of Werner Purgathofer - chairman of Eurographics (b) Assigning Werner Purgath-
ofer to a paper where there might be a conflict of interest.
for the author identifier it can be further used to get the co-authors of that particular
person. They also provide information about the amount of publications the two authors
wrote together. It is also possible with the DBLP API to receive bibtex files of papers.
These papers can also be found with the mentioned author pointer. Figure 6(a) shows
the information within SRMv2 collected from the DBLP. Access to other sources like
Mendeley[16] or Microsoft Academic Search are already under development.
6. Using Linked Open Data
COMFy currently has two different ways to assign a reviewer to paper. The automatic
and the manual assignment. The manual assignment can be seen in figure 6(b). After
choosing the submission the person who will be assigned to review the paper, COMFy
checks Linked Open Data sources like the DBLP if there are conflicts of interest between
the reviewer and the authors. A strong link is found, when the full name appears in the
coauthor list of for example DBLP. A weak link is found, when the domain name of the
Email, the organization or the surname of the authors of DBLP matches.
For the automatic assignment it is necessary for IPC members to complete three
steps. At first they are presented with a list of all authors where they can set their conflicts
of interest with them. Then they set in which area they are experts in. In their last step
they are presented with every paper. There they set which paper they would like to review
and which they are in which paper they are not knowledgeable enough to review it. Once
this is done for every IPC COMFy tries to create the best matching of reviewer to the
submission.
Before such a matching is created COMFy currently cross checks the DBLP if there
are some coauthor links which are not defined by an IPC. If some links are found the chair
is notified in the suggested matching. Currently this system is redundant as IPC users are
C. Caldera et al. / COMFy – A Conference Management Framework 53
checking their conflicts by hand. In the future this automated assignment process will
be improved and the cross checks against the DBLP should replace the manual conflict
settings.
7. Conclusion and Future Work
In this paper we described the new approach for a conference management system. In-
stead of creating a closed system the new system will allow to utilize the information
of different data-sources. There is strict distinction between the core business logic of
conference and the user interface defining the various use-cases. Currently the SRMv2
prototype is tested by a small conference (see figure 5(b)).
Future work will concentrate on improving the support for a semi-automatic review
assignment process. For the current SRM system an experimental tool exists which cal-
culated a so-called affinity score for the IPC members. Instead of performing a time-
consuming bidding process, the IPC members upload up to 5 papers which are processed
using natural language processing. These affinity scores were matched with the scores
from the submitted papers in order to get an automatic distribution from IPC members to
the submitted papers. Instead of the IPCs uploading their papers, the tool should harvest
the papers itself from sources like the Eurographics or ACM digital library. By tweaking
and improving this module the mapping should be that sufficient that the additional bid-
ding and self entered level of expertise will be unnecessary. So the time the IPC mem-
bers currently have to invest by bidding on the papers and setting the experience will be
saved.
References
[1] Wikipedia. Peer review — Wikipedia, the free encyclopedia, 2013. [Online; accessed 09-January-2013].
[2] Richard Smith. Peer review: a flawed process at the heart of science and journals. JRSM, 99, 2006.
[3] David Shatz. Peer Review: A Critical Inquiry (Issues in Academic Ethics (Paper)). Rowman & Littlefield
Publishers, Inc., November 2004.
[4] Michael Ley. Dblp: some lessons learned. Proc. VLDB Endow., 2(2):1493–1500, August 2009.
[5] Microsoft Corporation. Microsoft academic search, December 2012.
[6] Marco Zens. Creation, Management and Publication of Digital Documents using Standard Componentson the Internet. PhD thesis, Technische Universitat Braunschweig, 2004.
[7] Andrei Voronkov. Easy chair conference system, December 2012.
[8] Naveen Garg, Telikepalli Kavitha, Amit Kumar, Kurt Mehlhorn, and Julian Mestre. Assigning papers to
referees. Algorithmica, 58(1):119–136, 2010.
[9] Marianne Mandl. Conference management system (coms), December 2012.
[10] Zakon Group. Openconf, December 2012.
[11] Manos Papagelis and Dimitris Plexousakis. Confious, December 2012.
[12] Harald Weinreich. conftool - conference management tool, March 2013.
[13] Grant Fritchey and Sajal Dam. SQL Server 2008 Query Performance Tuning Distilled. Apress, Berkely,
CA, USA, 1 edition, 2009.
[14] Russell Sears, Catharine van Ingen, and Jim Gray. To blob or not to blob: Large object storage in a
database or a filesystem? CoRR, abs/cs/0701168, 2007.
[15] Roy Thomas Fielding. Architectural styles and the design of network-based software architectures. PhD
thesis, University of California, Irvine, 2000. AAI9980887.
[16] Mendeley Ltd. Mendeley, January 2013.
C. Caldera et al. / COMFy – A Conference Management Framework54

Full Professional Articles

This page intentionally left blank
Deduplication of Metadata Harvested
from Open Archives Initiative
Repositories
Piotr WENDYKIER
Interdisciplinary Centre for Mathematical and Computational Modelling, University ofWarsaw, ul. Prosta 69, 00-838 Warsaw, Poland
Abstract, Open access (OA) is a way of providing unrestricted access via the Inter-
net to peer-reviewed journal articles as well as theses, monographs and book chap-
ters. Many open access repositories have been created in the last decade. There is
also a number of registry websites that index these repositories. This article ana-
lyzes the repositories indexed by the Open Archives Initiative (OAI) organization in
terms of record duplication. Based on the sample of 958 metadata files containing
records modified in 2012 we provide an estimate on the number of duplicates in the
entire collection of repositories indexed by OAI. In addition, this work describes
several open source tools that form a generic workflow suitable for deduplication
of bibliographic records.
Keywords. deduplication, record linkage, metadata, Dublin Core, open access,
OAI-PMH
1. Open Archives Initiative
The Budapest Open Access Initiative [1] defines open access documents as follows: "By
open access, we mean its immediate, free availability on the public internet, permitting
any users to read, download, copy, distribute, print, search or link to the full text of these
articles, crawl them for indexing, pass them as data to software or use them for any other
lawful purpose." The number of open access repositories has grown significantly in the
last decade. As a result, different organizations started creating registry websites that in-
dex these repositories. One of them is maintained by the Open Archives Initiative (OAI)
- an association that develops and promotes interoperability standards that aim to facil-
itate the efficient dissemination of content. The main goal of OAI is to enhance access
to all kinds of e-print archives independent of the type of content offered as well as the
economic mechanisms surrounding that content. Current OAI projects include the Open
Archives Initiative Protocol for Metadata Harvesting (OAI-PMH) and Open Archives
Initiative Object Reuse and Exchange (OAI-ORE). The latter one defines standards for
the description and exchange of aggregations of Web resources. These aggregations may
combine distributed resources with multiple media types including text, images, data,
and video. In this article we focus only on the bibliographic records that can be acquired
by using OAI-PMH protocol.
Mining the Digital Information NetworksN. Lavesson et al. (Eds.)© 2013 The authors and IOS Press.This article is published online with Open Access by IOS Press and distributed under the termsof the Creative Commons Attribution Non-Commercial License.doi:10.3233/978-1-61499-270-7-57
57
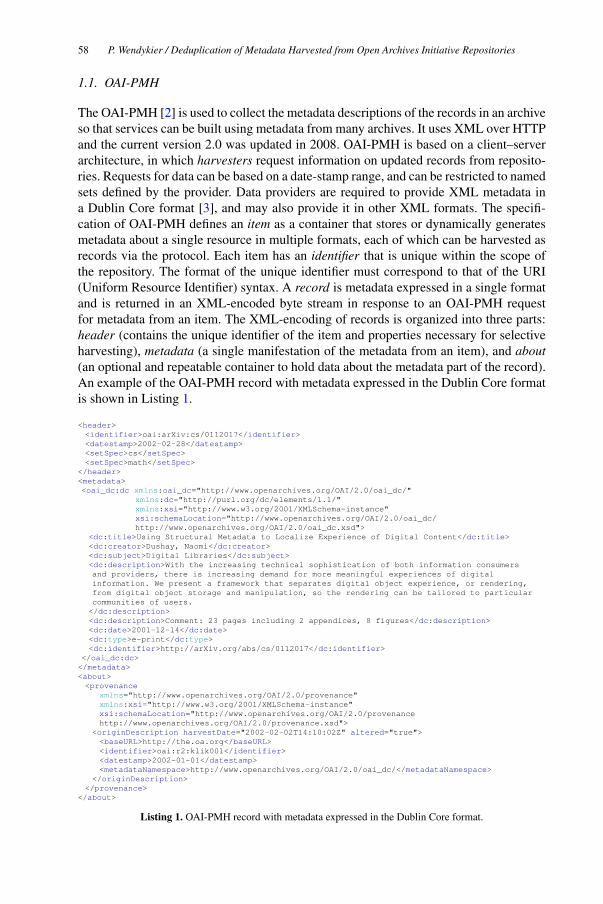
1.1. OAI-PMH
The OAI-PMH [2] is used to collect the metadata descriptions of the records in an archive
so that services can be built using metadata from many archives. It uses XML over HTTP
and the current version 2.0 was updated in 2008. OAI-PMH is based on a client–server
architecture, in which harvesters request information on updated records from reposito-
ries. Requests for data can be based on a date-stamp range, and can be restricted to named
sets defined by the provider. Data providers are required to provide XML metadata in
a Dublin Core format [3], and may also provide it in other XML formats. The specifi-
cation of OAI-PMH defines an item as a container that stores or dynamically generates
metadata about a single resource in multiple formats, each of which can be harvested as
records via the protocol. Each item has an identifier that is unique within the scope of
the repository. The format of the unique identifier must correspond to that of the URI
(Uniform Resource Identifier) syntax. A record is metadata expressed in a single format
and is returned in an XML-encoded byte stream in response to an OAI-PMH request
for metadata from an item. The XML-encoding of records is organized into three parts:
header (contains the unique identifier of the item and properties necessary for selective
harvesting), metadata (a single manifestation of the metadata from an item), and about(an optional and repeatable container to hold data about the metadata part of the record).
An example of the OAI-PMH record with metadata expressed in the Dublin Core format
is shown in Listing 1.
<header><identifier>oai:arXiv:cs/0112017</identifier><datestamp>2002-02-28</datestamp><setSpec>cs</setSpec><setSpec>math</setSpec>
</header><metadata><oai_dc:dc xmlns:oai_dc="http://www.openarchives.org/OAI/2.0/oai_dc/"
xmlns:dc="http://purl.org/dc/elements/1.1/"xmlns:xsi="http://www.w3.org/2001/XMLSchema-instance"xsi:schemaLocation="http://www.openarchives.org/OAI/2.0/oai_dc/http://www.openarchives.org/OAI/2.0/oai_dc.xsd">
<dc:title>Using Structural Metadata to Localize Experience of Digital Content</dc:title><dc:creator>Dushay, Naomi</dc:creator><dc:subject>Digital Libraries</dc:subject><dc:description>With the increasing technical sophistication of both information consumersand providers, there is increasing demand for more meaningful experiences of digitalinformation. We present a framework that separates digital object experience, or rendering,from digital object storage and manipulation, so the rendering can be tailored to particularcommunities of users.</dc:description><dc:description>Comment: 23 pages including 2 appendices, 8 figures</dc:description><dc:date>2001-12-14</dc:date><dc:type>e-print</dc:type><dc:identifier>http://arXiv.org/abs/cs/0112017</dc:identifier>
</oai_dc:dc></metadata><about><provenance
xmlns="http://www.openarchives.org/OAI/2.0/provenance"xmlns:xsi="http://www.w3.org/2001/XMLSchema-instance"xsi:schemaLocation="http://www.openarchives.org/OAI/2.0/provenancehttp://www.openarchives.org/OAI/2.0/provenance.xsd">
<originDescription harvestDate="2002-02-02T14:10:02Z" altered="true"><baseURL>http://the.oa.org</baseURL><identifier>oai:r2:klik001</identifier><datestamp>2002-01-01</datestamp><metadataNamespace>http://www.openarchives.org/OAI/2.0/oai_dc/</metadataNamespace>
</originDescription></provenance>
</about>
Listing 1. OAI-PMH record with metadata expressed in the Dublin Core format.
P. Wendykier / Deduplication of Metadata Harvested from Open Archives Initiative Repositories58
OAI-PMH supports the following six types of requests (aka. verbs) [2]:
• Identify - retrieves information about a repository such as repositoryName,
baseURL, protocolVersion, earliestDatestamp, deletedRecord, and granularity.
• ListMetadataFormats - retrieves the metadata formats available from a repository.
Possible formats include oai_dc, olac and perseus.
• ListSets - retrieves the set structure of a repository, which is useful for selective
harvesting.
• GetRecord - retrieves an individual metadata record from a repository. It is re-
quired to specify the identifier of the item from which the record is requested and
the format of the metadata that should be included in the record.
• ListRecords - is used to harvest records from a repository that match specified
criteria such as lower and upper bounds for the datestamp.
• ListIdentifiers - is an abbreviated form of ListRecords, retrieving only headers
rather than records.
Each type of request takes additional arguments. For ListRecords, the following argu-
ments are supported:
• from - an optional argument which specifies a lower bound for datestamp-based
selective harvesting.
• until - an optional argument which specifies a upper bound for datestamp-based
selective harvesting.
• set - an optional argument which specifies set criteria for selective harvesting.
• resumptionToken - an exclusive argument with a value that is the flow control
token returned by a previous ListRecords request that issued an incomplete list.
• metadataPrefix - a required argument (unless the exclusive argument resumption-
Token is used) that specifies the metadataPrefix of the format that should be in-
cluded in the metadata part of the returned records.
For example, the request in the form
http://arXiv.org/oai2?verb=GetRecord&identifier=oai:arXiv.org:cs/0112017&metadata
Prefix=oai_dc will return a record with identifier oai:arXiv.org:cs/0112017 in the Dublin
Core format (metadataPrefix=oai_dc).
1.2. Dublin Core
The Dublin Core metadata terms [3] are a set of vocabulary terms which can be used
to describe resources for the purposes of discovery. The terms can be used to describe
a full range of web resources: video, images, web pages etc. and physical resources
such as books and objects like artworks. The Simple Dublin Core Metadata Element
Set (DCMES) [4] consists of 15 metadata elements: title, creator, subject, description,
publisher, contributor, date, type, format, identifier, source, language, relation, coverage,
and rights. Each Dublin Core element is optional and may be repeated. The Dublin Core
Metadata Initiative (DCMI), a public, not-for-profit company, has established standard
ways to refine elements and encourage the use of encoding and vocabulary schemes.
There is no prescribed order in Dublin Core for presenting or using the elements. The
Dublin Core became ISO 15836 standard in 2006 and is a required metadata format in
OAI-PMH protocol. Listing 1 shows how the Dublin Core format is used in the OAI-
PMH record.
P. Wendykier / Deduplication of Metadata Harvested from Open Archives Initiative Repositories 59
1.3. Repositories
The OAI-PMH has become widely adopted by many digital libraries, institutional repos-
itories, and digital archives. There are several large registries of OAI-compliant reposi-
tories:
1. The Open Archives list of registered OAI repositories [5].
2. Openarchives.eu: the European Guide to OAI-PMH compliant repositories in the
world [6].
3. ScientificCommons.org: a worldwide service and registry [7].
This work present results only from the first registry. As of March 6, 2013, there are
1934 repositories registered in the Open Archives list including ArXiv, PubMed Central,
Nature Publishing Group Metadata Repository, NASA Technical Reports Server, and
CERN Document Server. Since Open Archives list stores only links to individual repos-
itories, it is not possible to query aggregated results from multiple collections. To enable
such functionality, one would have to build a digital library containing metadata from
all repositories. However, to ensure uniqueness of each record in the resulting library, a
deduplication operation needs to be performed. The rest of this paper describes the prob-
lem of deduplication in practice, where the database of over four million bibliographic
records is analyzed.
2. Record Linkage and Deduplication
Databases play very important role in today’s world. Many industries depend on the ac-
curacy of data stored in databases to carry out operations. Therefore, for any analysis
of database resources, the uniqueness of every record is very desirable. Unfortunately,
due to the lack of unique global identifier in each table, the process of linking of two or
more tables may introduce duplicates. This section, after formal definition of the prob-
lem, describes the main features of a particular software package for record linkage and
deduplication.
2.1. Definition
For a given sets A and B of records, a record linkage is a process of finding a partition
of A×B consisting of sets M (matched), U (unmatched), and P (possibly matched) that
satisfy M = {(a, b) | a = b} and U = {(a, b) | a�=b}. In a classical probabilistic approach
to record linkage defined by Fellegi [8], a vector of similarity scores (or agreement val-
ues) is first computed for each pair. Then, the pair is classified as either a match or non-
match (or possibly matched) based on an aggregate of the similarity scores. Classifica-
tion methods have been widely studied [9,10,11] and the current state-of-the-art algo-
rithms include rule-based methods that allow human experts to specify matching rules,
unsupervised learning methods such as Expectation-Maximization (EM) that learns the
weights or thresholds without relying on labeled data, and supervised learning methods
that use labeled data to train a model, such as a decision tree, a naïve Bayesian or the
Support Vector Machine (SVM). For computing similarities, various distance functions
are used and studied [9,12,13,14].
P. Wendykier / Deduplication of Metadata Harvested from Open Archives Initiative Repositories60
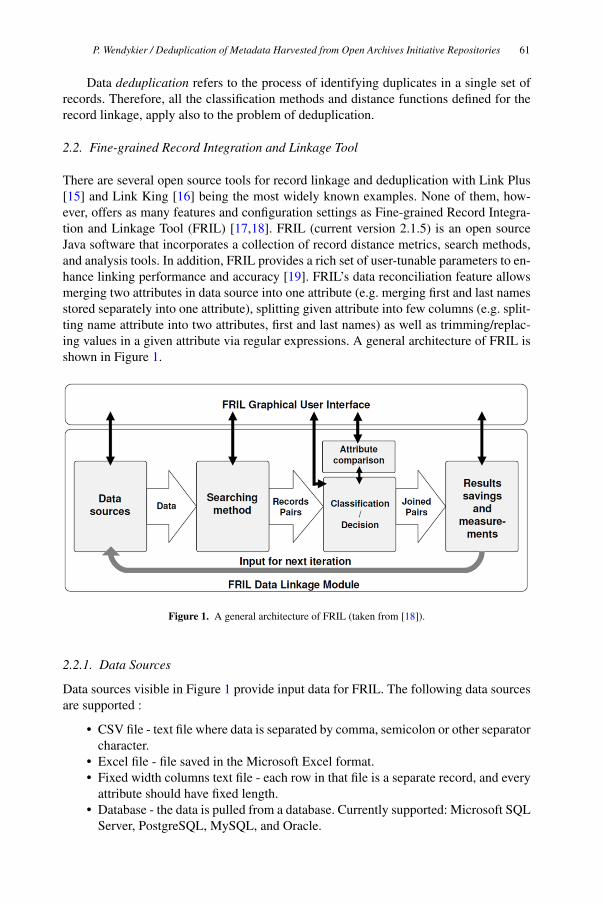
Data deduplication refers to the process of identifying duplicates in a single set of
records. Therefore, all the classification methods and distance functions defined for the
record linkage, apply also to the problem of deduplication.
2.2. Fine-grained Record Integration and Linkage Tool
There are several open source tools for record linkage and deduplication with Link Plus
[15] and Link King [16] being the most widely known examples. None of them, how-
ever, offers as many features and configuration settings as Fine-grained Record Integra-
tion and Linkage Tool (FRIL) [17,18]. FRIL (current version 2.1.5) is an open source
Java software that incorporates a collection of record distance metrics, search methods,
and analysis tools. In addition, FRIL provides a rich set of user-tunable parameters to en-
hance linking performance and accuracy [19]. FRIL’s data reconciliation feature allows
merging two attributes in data source into one attribute (e.g. merging first and last names
stored separately into one attribute), splitting given attribute into few columns (e.g. split-
ting name attribute into two attributes, first and last names) as well as trimming/replac-
ing values in a given attribute via regular expressions. A general architecture of FRIL is
shown in Figure 1.
Figure 1. A general architecture of FRIL (taken from [18]).
2.2.1. Data Sources
Data sources visible in Figure 1 provide input data for FRIL. The following data sources
are supported :
• CSV file - text file where data is separated by comma, semicolon or other separator
character.
• Excel file - file saved in the Microsoft Excel format.
• Fixed width columns text file - each row in that file is a separate record, and every
attribute should have fixed length.
• Database - the data is pulled from a database. Currently supported: Microsoft SQL
Server, PostgreSQL, MySQL, and Oracle.
P. Wendykier / Deduplication of Metadata Harvested from Open Archives Initiative Repositories 61
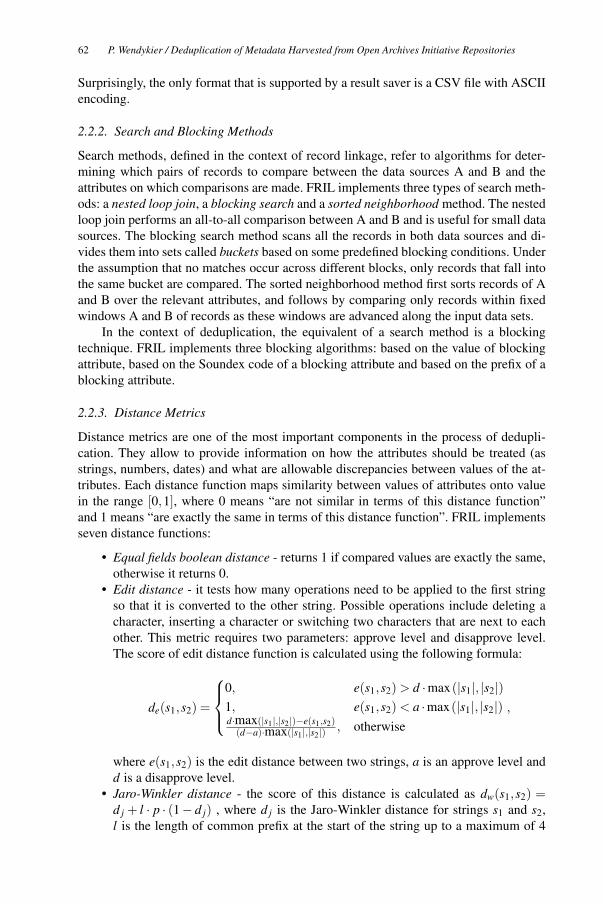
Surprisingly, the only format that is supported by a result saver is a CSV file with ASCII
encoding.
2.2.2. Search and Blocking Methods
Search methods, defined in the context of record linkage, refer to algorithms for deter-
mining which pairs of records to compare between the data sources A and B and the
attributes on which comparisons are made. FRIL implements three types of search meth-
ods: a nested loop join, a blocking search and a sorted neighborhood method. The nested
loop join performs an all-to-all comparison between A and B and is useful for small data
sources. The blocking search method scans all the records in both data sources and di-
vides them into sets called buckets based on some predefined blocking conditions. Under
the assumption that no matches occur across different blocks, only records that fall into
the same bucket are compared. The sorted neighborhood method first sorts records of A
and B over the relevant attributes, and follows by comparing only records within fixed
windows A and B of records as these windows are advanced along the input data sets.
In the context of deduplication, the equivalent of a search method is a blocking
technique. FRIL implements three blocking algorithms: based on the value of blocking
attribute, based on the Soundex code of a blocking attribute and based on the prefix of a
blocking attribute.
2.2.3. Distance Metrics
Distance metrics are one of the most important components in the process of dedupli-
cation. They allow to provide information on how the attributes should be treated (as
strings, numbers, dates) and what are allowable discrepancies between values of the at-
tributes. Each distance function maps similarity between values of attributes onto value
in the range [0,1], where 0 means “are not similar in terms of this distance function”
and 1 means “are exactly the same in terms of this distance function”. FRIL implements
seven distance functions:
• Equal fields boolean distance - returns 1 if compared values are exactly the same,
otherwise it returns 0.
• Edit distance - it tests how many operations need to be applied to the first string
so that it is converted to the other string. Possible operations include deleting a
character, inserting a character or switching two characters that are next to each
other. This metric requires two parameters: approve level and disapprove level.
The score of edit distance function is calculated using the following formula:
de(s1,s2) =
⎧⎪⎨⎪⎩
0, e(s1,s2)> d ·max(|s1|, |s2|)1, e(s1,s2)< a ·max(|s1|, |s2|)d·max(|s1|,|s2|)−e(s1,s2)(d−a)·max(|s1|,|s2|) , otherwise
,
where e(s1,s2) is the edit distance between two strings, a is an approve level and
d is a disapprove level.
• Jaro-Winkler distance - the score of this distance is calculated as dw(s1,s2) =d j + l · p · (1− d j) , where d j is the Jaro-Winkler distance for strings s1 and s2,
l is the length of common prefix at the start of the string up to a maximum of 4
P. Wendykier / Deduplication of Metadata Harvested from Open Archives Initiative Repositories62
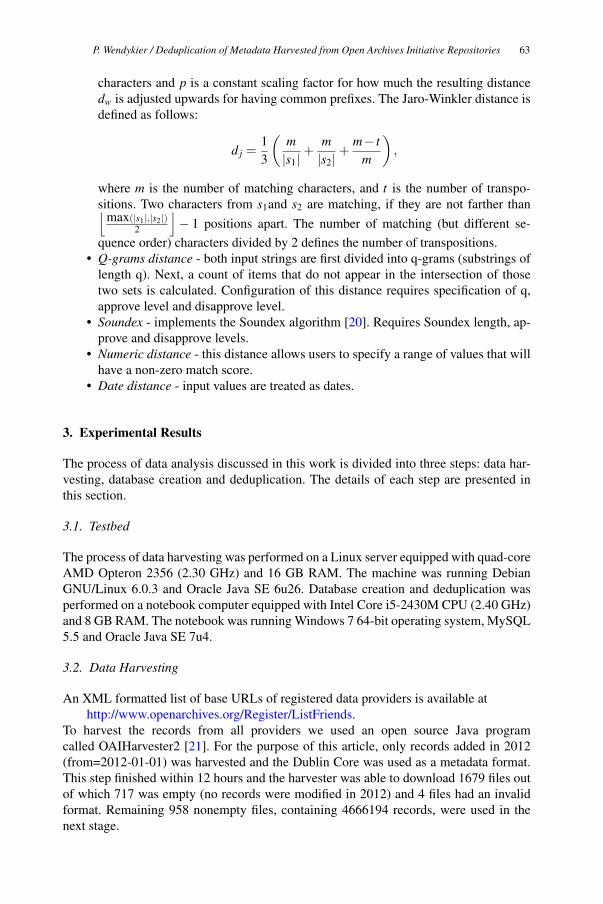
characters and p is a constant scaling factor for how much the resulting distance
dw is adjusted upwards for having common prefixes. The Jaro-Winkler distance is
defined as follows:
d j =1
3
(m|s1| +
m|s2| +
m− tm
),
where m is the number of matching characters, and t is the number of transpo-
sitions. Two characters from s1and s2 are matching, if they are not farther than⌊max(|s1|,|s2|)
2
⌋− 1 positions apart. The number of matching (but different se-
quence order) characters divided by 2 defines the number of transpositions.
• Q-grams distance - both input strings are first divided into q-grams (substrings of
length q). Next, a count of items that do not appear in the intersection of those
two sets is calculated. Configuration of this distance requires specification of q,
approve level and disapprove level.
• Soundex - implements the Soundex algorithm [20]. Requires Soundex length, ap-
prove and disapprove levels.
• Numeric distance - this distance allows users to specify a range of values that will
have a non-zero match score.
• Date distance - input values are treated as dates.
3. Experimental Results
The process of data analysis discussed in this work is divided into three steps: data har-
vesting, database creation and deduplication. The details of each step are presented in
this section.
3.1. Testbed
The process of data harvesting was performed on a Linux server equipped with quad-core
AMD Opteron 2356 (2.30 GHz) and 16 GB RAM. The machine was running Debian
GNU/Linux 6.0.3 and Oracle Java SE 6u26. Database creation and deduplication was
performed on a notebook computer equipped with Intel Core i5-2430M CPU (2.40 GHz)
and 8 GB RAM. The notebook was running Windows 7 64-bit operating system, MySQL
5.5 and Oracle Java SE 7u4.
3.2. Data Harvesting
An XML formatted list of base URLs of registered data providers is available at
http://www.openarchives.org/Register/ListFriends.
To harvest the records from all providers we used an open source Java program
called OAIHarvester2 [21]. For the purpose of this article, only records added in 2012
(from=2012-01-01) was harvested and the Dublin Core was used as a metadata format.
This step finished within 12 hours and the harvester was able to download 1679 files out
of which 717 was empty (no records were modified in 2012) and 4 files had an invalid
format. Remaining 958 nonempty files, containing 4666194 records, were used in the
next stage.
P. Wendykier / Deduplication of Metadata Harvested from Open Archives Initiative Repositories 63
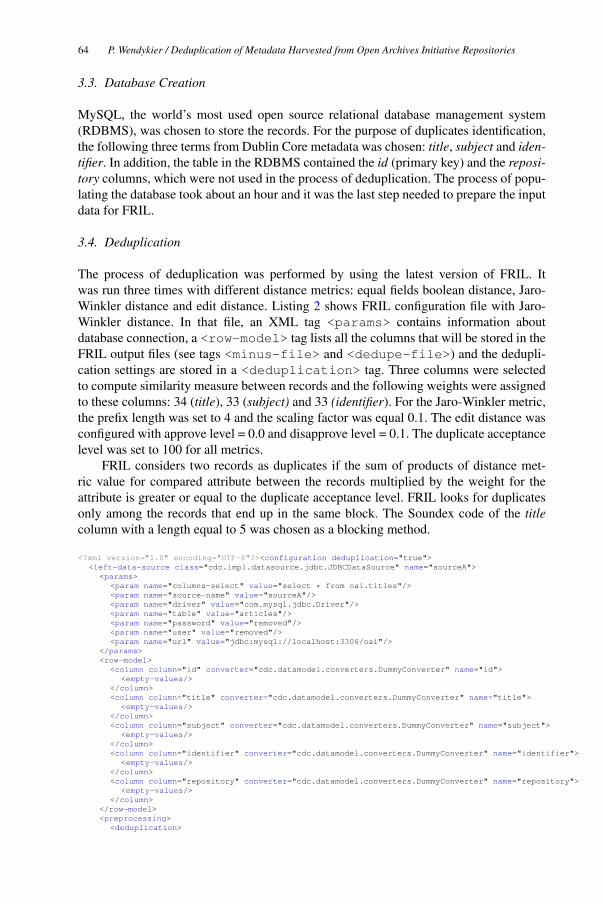
3.3. Database Creation
MySQL, the world’s most used open source relational database management system
(RDBMS), was chosen to store the records. For the purpose of duplicates identification,
the following three terms from Dublin Core metadata was chosen: title, subject and iden-tifier. In addition, the table in the RDBMS contained the id (primary key) and the reposi-tory columns, which were not used in the process of deduplication. The process of popu-
lating the database took about an hour and it was the last step needed to prepare the input
data for FRIL.
3.4. Deduplication
The process of deduplication was performed by using the latest version of FRIL. It
was run three times with different distance metrics: equal fields boolean distance, Jaro-
Winkler distance and edit distance. Listing 2 shows FRIL configuration file with Jaro-
Winkler distance. In that file, an XML tag <params> contains information about
database connection, a <row-model> tag lists all the columns that will be stored in the
FRIL output files (see tags <minus-file> and <dedupe-file>) and the dedupli-
cation settings are stored in a <deduplication> tag. Three columns were selected
to compute similarity measure between records and the following weights were assigned
to these columns: 34 (title), 33 (subject) and 33 (identifier). For the Jaro-Winkler metric,
the prefix length was set to 4 and the scaling factor was equal 0.1. The edit distance was
configured with approve level = 0.0 and disapprove level = 0.1. The duplicate acceptance
level was set to 100 for all metrics.
FRIL considers two records as duplicates if the sum of products of distance met-
ric value for compared attribute between the records multiplied by the weight for the
attribute is greater or equal to the duplicate acceptance level. FRIL looks for duplicates
only among the records that end up in the same block. The Soundex code of the titlecolumn with a length equal to 5 was chosen as a blocking method.
<?xml version="1.0" encoding="UTF-8"?><configuration deduplication="true"><left-data-source class="cdc.impl.datasource.jdbc.JDBCDataSource" name="sourceA">
<params><param name="columns-select" value="select * from oai.titles"/><param name="source-name" value="sourceA"/><param name="driver" value="com.mysql.jdbc.Driver"/><param name="table" value="articles"/><param name="password" value="removed"/><param name="user" value="removed"/><param name="url" value="jdbc:mysql://localhost:3306/oai"/>
</params><row-model>
<column column="id" converter="cdc.datamodel.converters.DummyConverter" name="id"><empty-values/>
</column><column column="title" converter="cdc.datamodel.converters.DummyConverter" name="title">
<empty-values/></column><column column="subject" converter="cdc.datamodel.converters.DummyConverter" name="subject">
<empty-values/></column><column column="identifier" converter="cdc.datamodel.converters.DummyConverter" name="identifier">
<empty-values/></column><column column="repository" converter="cdc.datamodel.converters.DummyConverter" name="repository">
<empty-values/></column>
</row-model><preprocessing>
<deduplication>
P. Wendykier / Deduplication of Metadata Harvested from Open Archives Initiative Repositories64
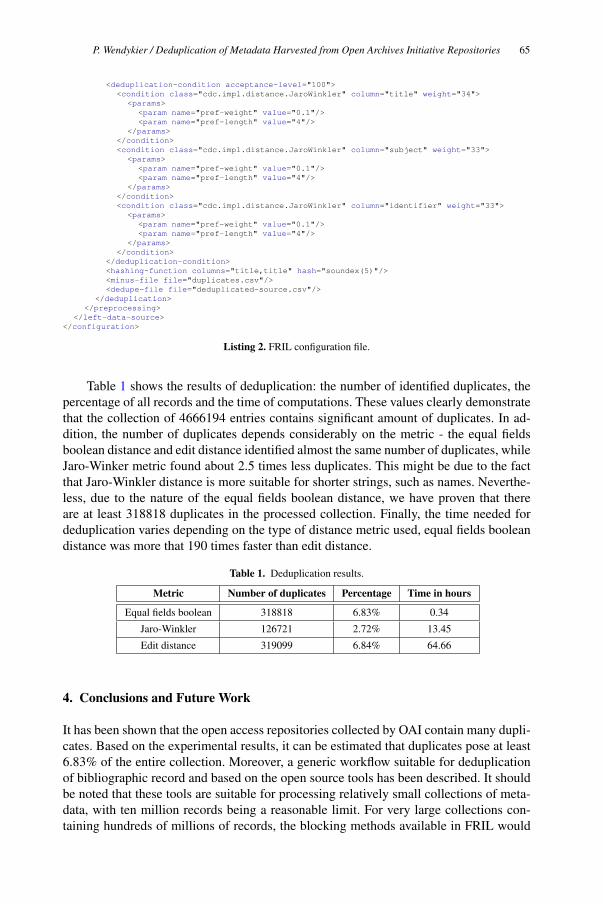
<deduplication-condition acceptance-level="100"><condition class="cdc.impl.distance.JaroWinkler" column="title" weight="34">
<params><param name="pref-weight" value="0.1"/><param name="pref-length" value="4"/>
</params></condition><condition class="cdc.impl.distance.JaroWinkler" column="subject" weight="33">
<params><param name="pref-weight" value="0.1"/><param name="pref-length" value="4"/>
</params></condition><condition class="cdc.impl.distance.JaroWinkler" column="identifier" weight="33">
<params><param name="pref-weight" value="0.1"/><param name="pref-length" value="4"/>
</params></condition>
</deduplication-condition><hashing-function columns="title,title" hash="soundex(5)"/><minus-file file="duplicates.csv"/><dedupe-file file="deduplicated-source.csv"/>
</deduplication></preprocessing>
</left-data-source></configuration>
Listing 2. FRIL configuration file.
Table 1 shows the results of deduplication: the number of identified duplicates, the
percentage of all records and the time of computations. These values clearly demonstrate
that the collection of 4666194 entries contains significant amount of duplicates. In ad-
dition, the number of duplicates depends considerably on the metric - the equal fields
boolean distance and edit distance identified almost the same number of duplicates, while
Jaro-Winker metric found about 2.5 times less duplicates. This might be due to the fact
that Jaro-Winkler distance is more suitable for shorter strings, such as names. Neverthe-
less, due to the nature of the equal fields boolean distance, we have proven that there
are at least 318818 duplicates in the processed collection. Finally, the time needed for
deduplication varies depending on the type of distance metric used, equal fields boolean
distance was more that 190 times faster than edit distance.
Table 1. Deduplication results.
Metric Number of duplicates Percentage Time in hours
Equal fields boolean 318818 6.83% 0.34
Jaro-Winkler 126721 2.72% 13.45
Edit distance 319099 6.84% 64.66
4. Conclusions and Future Work
It has been shown that the open access repositories collected by OAI contain many dupli-
cates. Based on the experimental results, it can be estimated that duplicates pose at least
6.83% of the entire collection. Moreover, a generic workflow suitable for deduplication
of bibliographic record and based on the open source tools has been described. It should
be noted that these tools are suitable for processing relatively small collections of meta-
data, with ten million records being a reasonable limit. For very large collections con-
taining hundreds of millions of records, the blocking methods available in FRIL would
P. Wendykier / Deduplication of Metadata Harvested from Open Archives Initiative Repositories 65
require a machine with a lot of RAM memory and the whole process would take a long
time to finish.
In the future work we plan to harvest and deduplicate all metadata records indexed be
OAI. Such task is a big data challenge and needs to be solved with a dedicated software
tools such as Apache Hadoop - an open source implementation of MapReduce paradigm.
References
[1] Budapest Open Access Initiative. Budapest Open Access Initiative Home Page. http://www.opensocietyfoundations.org/openaccess, March 2013.
[2] Michael Nelson Carl Lagoze, Herbert Van de Sompel and Simeon Warner. The Open Archives Initiative
Protocol for Metadata Harvesting. Technical report, Open Archives Initiative, 2008.
[3] A. Powell, M. Nilsson, A. Naeve, and P. Johnston. Dublin Core Metadata Initiative - Abstract Model.
http://dublincore.org/documents/abstract-model, 2005. White Paper.
[4] DCMI Usage Board. DCMI Metadata Terms. http://dublincore.org/documents/dcmi-terms/, March 2013.
[5] Open Archives Initiative. Registered Data Providers. http://www.openarchives.org/Register/BrowseSites, March 2013.
[6] Openarchives.eu. The European guide to OAI-PMH compliant digital repositories in the world. http://www.openarchives.eu/, March 2013.
[7] Scientific Commons. ScientificCommons.org A worldwide service and registry. http://en.scientificcommons.org/, March 2013.
[8] I. P. Fellegi and A. B. Sunter. A Theory for Record Linkage. Journal of the American StatisticalAssociation, 64:1183–1210, 1969.
[9] Ahmed Elmagarmid, Panagiotis Ipeirotis, and Vassilios Verykios. Duplicate Record Detection: A Sur-
vey. IEEE Transactions on Knowledge and Data Engineering, 19(1):1–16, January 2007.
[10] Alon Halevy, Anand Rajaraman, and Joann Ordille. Data integration: the teenage years. In VLDB’2006:Proceedings of the 32nd international conference on Very large data bases, pages 9–16. VLDB Endow-
ment, 2006.
[11] William E. Winkler. Overview of record linkage and current research directions. Technical report, U.S.
Census Bureau, February 2006.
[12] Gonzalo Navarro. A guided tour to approximate string matching. ACM Computing Surveys, 33(1):31–
88, March 2001.
[13] Edward H. Porter, William E. Winkler, Bureau Of The Census, and Bureau Of The Census. Approximate
String Comparison and its Effect on an Advanced Record Linkage System. In Advanced Record LinkageSystem. U.S. Bureau of the Census, Research Report, pages 190–199, 1997.
[14] W. Cohen, P. Ravikumar, and S. Fienberg. A comparison of string metrics for matching names and
records. In Proceedings of the IJCAI-2003 Workshop on Information Integration on the Web, pages
73–78, August 2003.
[15] CDC’s Division of Cancer Prevention and Control in support. Link Plus. http://www.cdc.gov/cancer/npcr/tools/registryplus/index.htm, March 2013.
[16] Camelot Consulting. The Link King. Record Linkage and Consolidation Software. http://www.the-link-king.com/index.html, March 2013.
[17] Pawel Jurczyk. Fine-grained Record Integration and Linkage Tool. http://fril.sourceforge.net/, March 2013.
[18] P. Jurczyk, J. J. Lu, L. Xiong, J. D. Cragan, and A. Correa. FRIL: A Tool for Comparative Record
Linkage. AMIA Symposium, pages 440–444, 2008.
[19] Pawel Jurczyk. Fine-grained Record Integration and Linkage Tool. Tutorial. V3.2. http://fril.sourceforge.net/FRIL-Tutorial-3.2.pdf, August 2009.
[20] J R Jacobs. Finding words that sound alike. The SOUNDEX algorithm. Byte 7, pages 473–474, 1982.
[21] OCLC. OAIHarvester2. http://www.oclc.org/research/activities/past/orprojects/harvester2/harvester2.htm, March 2013.
P. Wendykier / Deduplication of Metadata Harvested from Open Archives Initiative Repositories66
Facilitating Access and Reuse of Research Materials: the Case of The European
Library Nuno Freire1
The European Library
Abstract. The European Library provides access to research materials from the collections of Europe’s national and research libraries, representing members from 46 countries. This paper presents the current status, on-going work, and future plans of the resource dissemination services provided by The European Library, covering resources such as national bibliographies, digital collections, full text collections, its access portal and API, open linked data publication, and integration in digital humanities infrastructures. In the coming years, The European Library will work to provide the means and tools for digital humanities researchers to easily use research materials from libraries in their research activities.
Keywords. digital libraries, full text, digital humanities, portals, research infrastructures.
Introduction
The European Library provides access to research materials existing in the collections of Europe’s national and research libraries. The European Library’s partnership with libraries extends beyond the European Union, covering all the Council of Europe member states. It is a pan-European service in the widest sense.
The European Library centres its activities in the provision of services based on exploiting the centralization of pan-European bibliographic data and digital content. Its most visible service is its portal, which is designed with researchers as the target user. The portal provides value to the libraries by showcasing their collections of research materials to a wide audience, and drawing new customers to their repositories. The homepage of the portal is shown in Figure 1. The centralization of resources from European libraries also allows the provision of other services that promote the reuse of these digital resources in many contexts.
This paper starts with a presentation of The European Library, and follows with a description of the main digital resources that underlie its service. These include national bibliographies, bibliographic databases, digital objects and full text materials.
1 Corresponding Author: Senior researcher, The European Library, Europeana Foundation, Willem-
Alexanderhof 5, 2509 LK The Hague, Netherlands; Email: [email protected]
Mining the Digital Information NetworksN. Lavesson et al. (Eds.)© 2013 The authors and IOS Press.This article is published online with Open Access by IOS Press and distributed under the termsof the Creative Commons Attribution Non-Commercial License.doi:10.3233/978-1-61499-270-7-67
67
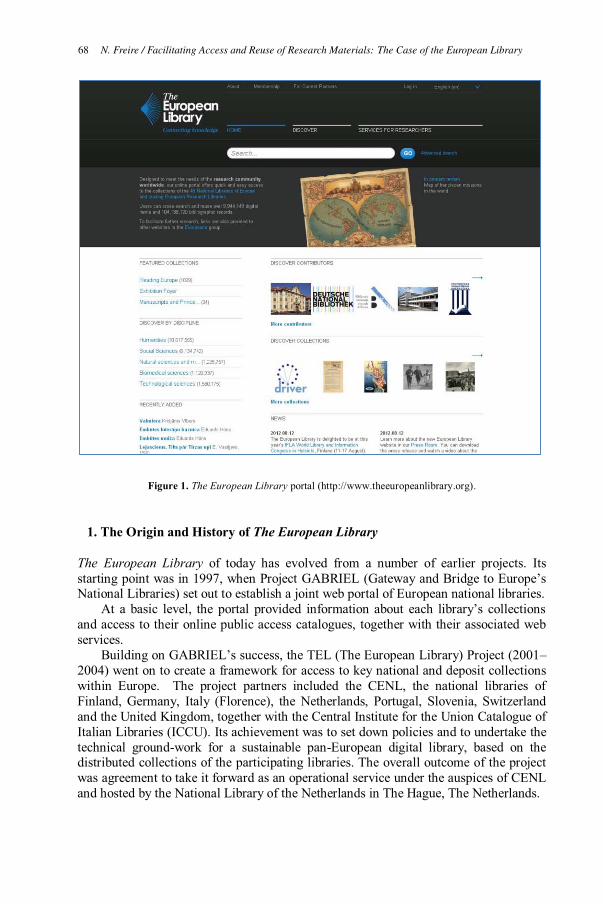
Figure 1. The European Library portal (http://www.theeuropeanlibrary.org).
1. The Origin and History of The European Library
The European Library of today has evolved from a number of earlier projects. Its starting point was in 1997, when Project GABRIEL (Gateway and Bridge to Europe’s National Libraries) set out to establish a joint web portal of European national libraries.
At a basic level, the portal provided information about each library’s collections and access to their online public access catalogues, together with their associated web services.
Building on GABRIEL’s success, the TEL (The European Library) Project (2001–2004) went on to create a framework for access to key national and deposit collections within Europe. The project partners included the CENL, the national libraries of Finland, Germany, Italy (Florence), the Netherlands, Portugal, Slovenia, Switzerland and the United Kingdom, together with the Central Institute for the Union Catalogue of Italian Libraries (ICCU). Its achievement was to set down policies and to undertake the technical ground-work for a sustainable pan-European digital library, based on the distributed collections of the participating libraries. The overall outcome of the project was agreement to take it forward as an operational service under the auspices of CENL and hosted by the National Library of the Netherlands in The Hague, The Netherlands.
N. Freire / Facilitating Access and Reuse of Research Materials: The Case of the European Library68
The European Library was launched as an operational service in March 2005. It aggregates the digital collections of Europe’s national and research libraries and brings together the catalogues of its partner libraries to create a union catalogue for Europe.
Between 2005 and 2007, the TEL-ME-MOR project helped to incorporate 10 more national libraries from new European Union member states as full partners of The European Library. By the beginning of 2008, a further nine national libraries had joined the service. The European Library was further enlarged by the EDLproject, during which national libraries continued to join The European Library. The project also focused on multilingualism, undertook the first steps towards a European Metadata Registry and created a roadmap for potential digitization efforts in the national libraries.
The European Library provided much of the organisational structure and expertise required to launch Europeana. When the European Parliament called for Europeana to be established, The European Library was asked to apply to run the project under the eContentplus programme. Work began on a prototype in 2007 and Europeana was launched in November 2008.
Europeana now operates independently but The European Library continues to work closely with Europeana. In project Europeana Libraries, which ran from 2010 until 2012, the library aggregation model for Europeana has been established, where The European Library had the mission to become the library-domain aggregator service for Europeana. This aggregation service provided by The European Library is available for libraries across Europe.
Currently, The European Library is led by three major library associations from Europe:
� The Conference of European National Librarians 2 (CENL) - The CENL foundation promotes the role of national libraries in Europe, in particular in respect of their responsibilities for maintaining the national cultural heritage and ensuring the accessibility of knowledge. Members of CENL are the national librarians of all Member States of the Council of Europe. The conference currently consists of 49 members from 46 European countries.
� Association of European Research Libraries3 (LIBER) – LIBER is the main network for research libraries in Europe, comprising more than 400 national, university and other libraries from more than 40 countries.
� Consortium of European Research Libraries4 (CERL) - CERL is a library consortium focused on the European printed heritage from the hand-press period (up to c. 1830). It aims to the sharing of resources and expertise between research libraries.
These three associations include in its members over 400 national and research libraries. For a library to be a member in The European Library, it is not required a membership in CENL, LIBER or CERL.
The European Library has launched a new web portal in 2012, aiming to open up new possibilities for academic research, and to build on The European Library’s already unique position of giving researchers free, online access to research materials from Europe’s national and research libraries.
2 http://web3.nlib.ee/cenl/ 3 http://www.libereurope.eu 4 http://www.cerl.org
N. Freire / Facilitating Access and Reuse of Research Materials: The Case of the European Library 69
2. Resources Aggregated by The European Library
This section outlines the main research resources available through The European Library. It also describes the unique characteristics of these resources, and summarises our recent and on-going activities.
2.1. Bibliographic Resources
The European Library holds several millions of bibliographic records from the national and leading research libraries of Europe. This bibliographic universe is organised into collections – groups of objects clustered around a topic or theme. The concept of collections is an extremely important one for The European Library because it represents a curatorial attempt at categorising content. Hundreds of collections are available and together they cover all the general areas of knowledge.
The National Bibliographies, one of the main bibliographic data sources in each country, are a key resource for The European Library users. Their purpose is to list every publication in a country, under the auspices of a national library or other government agency. Depending on the country, all publishers will need to send a copy of every published work to the national legal deposit, or in other countries, a national organisation will need to collect all publications. Given that the publisher domain is very heterogeneous and that thousands of publishers might exist in a country, national bibliographies are effectively the single point of reference with which to comprehensively identify all the publications in a country. In Europe, national bibliographies are typically created and maintained by national libraries. Whenever a book is published in a country, it is recorded in the corresponding national library catalogue from where the national bibliography is derived.
The European Library also offers access to collections of digital resources. These include a diverse wealth of content, such as e-theses, books, manuscripts and films, including many sizeable collections grouped around specific themes, topics or notable personalities. Examples of these are: digitised letters from prominent thinkers such as philosopher Immanuel Kant, pamphlets detailing the history of the Low Countries from 1490 to 1800, and images covering the papers, photographs and correspondence of prominent physicists such as Nobel prize winner Erwin Schrödinger. There are also digitised manuscripts created in European parts of the Ottoman Empire.
Currently, The European Library holds approximately 112 million bibliographic records in its centralized repository. This number is constantly increasing, as part of its data aggregation role in the Europeana context, and more national and research libraries’ catalogues are included in the centralized repository. By the end of 2013, the total bibliographic universe of The European Library is expected to be approximately 200 million records.
2.2. Textual Resources
The European Library hosts a growing centralized index of textual resources. It currently contains over 24 million pages of full-text content, originating from 14 national libraries.
These textual resources were created mostly from Optical Character Recognition performed during digitization projects at the national libraries. The quality of the text
N. Freire / Facilitating Access and Reuse of Research Materials: The Case of the European Library70
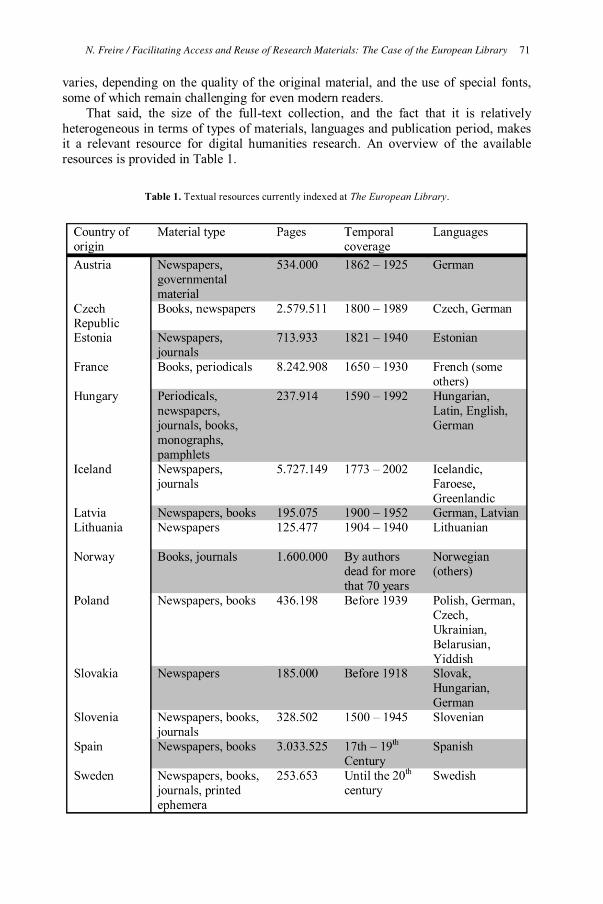
varies, depending on the quality of the original material, and the use of special fonts, some of which remain challenging for even modern readers.
That said, the size of the full-text collection, and the fact that it is relatively heterogeneous in terms of types of materials, languages and publication period, makes it a relevant resource for digital humanities research. An overview of the available resources is provided in Table 1.
Table 1. Textual resources currently indexed at The European Library.
N. Freire / Facilitating Access and Reuse of Research Materials: The Case of the European Library 71
5 http://www.europeana-newspapers.eu/ 6 http://www.d-nb.de/eng/wir/projekte/macs.htm
These textual resources will be expanded during 2013, thanks to the Europeana Newspapers project5. In this project, a group of 17 European institutions are working to provide more than 18 million newspaper pages for The European Library and Europeana. Each library participating in the project will distribute digitized newspapers and full-texts that are in the public domain and free of any legal restrictions.
3. Resource Dissemination Services
Although The European Library service was founded as a traditional library service, focused on making the library resources available through traditional online catalogue features, it is now aiming to facilitate the use of these resources in order to improve existing services, enable the development of new ones, or provide a good setting for research. This section presents the main services and activities undertaken by The European Library.
3.1. The European Library Portal
The European Library’s portal main focus is to provide access to the collections of the European national and research libraries. It provides a web interface for searching and browsing through libraries, collections, bibliographic records, digital objects and full text contents. A new version of the portal was launched in May 2012, which included a complete functional redesign, focused on a shift towards functionalities for digital humanities researchers.
While previous versions of the portal were based on the distributed search paradigm, this new version is based on the centralization of the digital resources, which enables much functionality that nowadays web users expect in resource discovery portals.
Data mining technologies are being applied for automatic linkage of bibliographic data across countries and libraries (some examples are shown in Figure 2). On-going work is focusing on the linkage of the main entities used to describe bibliographic resources: persons, organizations, locations, historical periods, and subjects, in order to enable better functionality in the portal. This on-going work, once completed, will allow the exploration of an author’s work across time and space. Users will be able to locate different editions of a work throughout Europe, browse all catalogues with a unified subject system, and browse across historical periods.
Access to the bibliographic resources under a unified subject system is also a core functionality of the portal. Subject information is frequently used in bibliographic data and very relevant for the portal functionality, given the multilingual nature of The European Library. However, unifying subject systems is great challenge because of the diversity of languages and knowledge organization systems in use across European libraries. Unified subject access is currently based in the results of the project Multilingual Access to Subjects6 (MACS). The MACS project has produced manual
N. Freire / Facilitating Access and Reuse of Research Materials: The Case of the European Library72
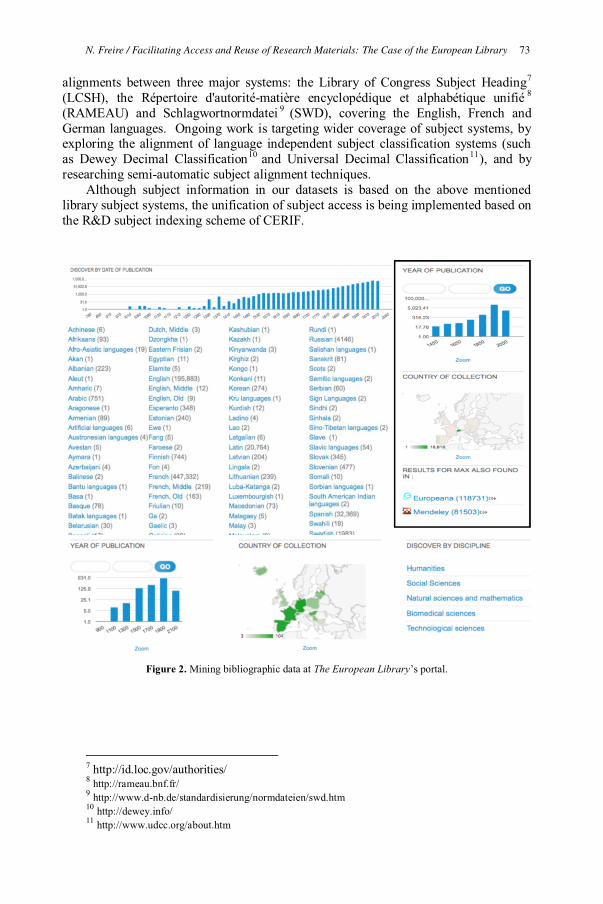
alignments between three major systems: the Library of Congress Subject Heading7 (LCSH), the Répertoire d'autorité-matière encyclopédique et alphabétique unifié 8 (RAMEAU) and Schlagwortnormdatei 9 (SWD), covering the English, French and German languages. Ongoing work is targeting wider coverage of subject systems, by exploring the alignment of language independent subject classification systems (such as Dewey Decimal Classification10 and Universal Decimal Classification11), and by researching semi-automatic subject alignment techniques.
Although subject information in our datasets is based on the above mentioned library subject systems, the unification of subject access is being implemented based on the R&D subject indexing scheme of CERIF.
Figure 2. Mining bibliographic data at The European Library’s portal.
7 http://id.loc.gov/authorities/ 8 http://rameau.bnf.fr/ 9 http://www.d-nb.de/standardisierung/normdateien/swd.htm 10 http://dewey.info/ 11 http://www.udcc.org/about.htm
N. Freire / Facilitating Access and Reuse of Research Materials: The Case of the European Library 73
3.2. The European Library API
The European Library OpenSearch12 API allows the development of applications by third parties, which allow the search and display of The European Library‘s collections, bibliographic data and previews. Along with standard keyword searching, the API also offers faceted searching. Currently, the OpenSearch API is available for non-commercial use to all members of The European Library.
We are also working towards making the resources hosted at The European Library available through third party applications in the research domain, such as Mendeley13 and the Summon discovery service14.
3.3. Aggregation for Europeana
Europeana15 provides access to digital content from libraries, museums, archives and audio-visual collections across Europe. Data about its digital contents follows the Europeana Data Model [1] (EDM) which is an open, cross-domain, semantic web-based framework for structuring the data about the digital content that Europeana ingests, manages, publishes for end-user access, and also publishes as open data. This data model allows Europeana to keep the richness of domain-level metadata and facilitates the participation of Europeana in the semantic web.
The European Library conducts activities within the library domain, involving EDM, in order to promote the representation of library specific information in EDM alongside authoritative and curated information from other domains. Of particular relevance is analysis of how bibliographic data (e.g. MARC21, UNIMARC, MODS, METS and Dublin Core-based application profiles) can be aligned to EDM, since in its role as aggregator for Europeana, The European Library supports all these bibliographic data formats for conversion and delivery to Europeana, according to EDM.
3.4. Intellectual Property Rights Infrastructures
The European Library’s bibliographic data is enabling an innovative approach towards intellectual property rights clearance processes for supporting mass digitization projects. In the ARROW rights infrastructure16 (Accessible Registries of Rights Information and Orphan Works), a framework is being established to assist in determining the rights status of works.
ARROW provides automated ways to clear the rights of the books to be digitised. This rights clearance process is time consuming, since a library has to go through the following steps for each book:
� To identify the underlying work incorporated in the book to be digitised; � To find out if the underlying work is in the public domain or in copyright,
and whether it is an orphan work or out-of-print;
12 http://www.opensearch.org/ 13 http://www.mendeley.com 14 http://www.proquest.com/ 15 http://www.europeana.eu 16 http://www.arrow-net.eu/
N. Freire / Facilitating Access and Reuse of Research Materials: The Case of the European Library74
� To clearly describe the use that is requested for the book, such as digitisation for preservation, electronic document delivery, etc.;
� To identify the rights holder(s) or their agent, such as a collecting society; � To seek the appropriate permission, if necessary.
The successful completion of this process depends on the availability of existing bibliographic and rights data, and national bibliographies are effectively the single point of reference with which to identify all the publications of an intellectual work. In this infrastructure, The European Library provides web services for the processing and use of national bibliographies during rights clearance processes. The service from The European Library is thereby a bibliographic record clustering service for national bibliographies. The service provides a set of related publications from the national bibliographies for a deeper analysis in a rights clearance process.
3.5. Linked Open Data
The European Library is currently working in its open linked data prototype. This prototype aims to make openly available the results of the data mining processing applied while aggregating library catalogues, digital libraries and open repositories. This process aims to establish links between entities defined in the Functional Requirements for Bibliographic Records [2] (FRBR) such as:
� Linking between the FRBR group 1 entities, particularly work and manifestation, across libraries.
� Linking between FRBR expressions within the same country (a result of the processing for the ARROW rights infrastructure)
� Linking of FRBR group 2 entities person and corporate body, between the aggregated bibliographic data and VIAF [3] (when they are not already linked at the source).
� Linking of the FRBR group 3 entity concept, across the aggregated bibliographic data sources, by exploiting the results of the MACS project.
� Linking of the FRBR group 3 entity place between the aggregated bibliographic data and Geonames [4] (a geographic ontology available as open data).
The European library’s open data prototype aims to make this data enrichment available in a way that complements the ongoing activities of libraries with open data.
3.6. Digital Humanities Research Infrastructures
In order to provide the means and tools for digital humanities researchers to exploit the research materials held by libraries, a new research infrastructure, Europeana Research, will be created by extending the currently existing portal of The European Library.
Early stages of the project will analyse how academic users locate data and how they perceive the value of the content within Europeana. This analysis will be the basis of the content strategy of the Europeana Research platform, and will also provide the understanding of scholarly workflows which will be supported by Europeana Research. This analysis will be carried out jointly with the DARIAH network of arts and humanities researchers, and with the Council of European Social Science Data Archives (CESSDA). Academics working in these domains will be the most fertile
N. Freire / Facilitating Access and Reuse of Research Materials: The Case of the European Library 75
exploiters of libraries research materials, and therefore they have key roles to play in shaping the future of Europeana Research.
This analysis will allow the identification of tools that allow researchers to manipulate and exploit research materials in innovative ways. The project will therefore develop a suite of tools that allows scholars to interact with the content that they require from Europeana Research. The areas to be approached are:
� Accessing and analysing big data - permitting scholars to download, manipulate and analyse large data sets.
� Annotation - allowing researchers to annotate documents and to share these annotations
� Transcription - allowing users to transcribe and interpret documents � Discovery and access - ensuring that services are tailored so that research
material is discoverable by the scholarly community, possibly with integration in other research infrastructures in the field of digital humanities.
The creation of statistical datasets, resulting from data analysis and mining conducted by The European Library, is also being considered. Although no concrete plans are ready at this time, we expect these kinds of data sets to emerge as a result of our involvement with the digital humanities research community.
4. Conclusion
This paper presented The European Library and the main digital resources that underlie its services. The European Library provides services that add value to resources made available by libraries, by exploring the possibilities given by centralization of data and resources.
The European Library is entering a new phase as national and research libraries are coming together in a partnership to bring libraries’ research collections to a worldwide audience. The European Library aims to support libraries to play a pivotal role in Europe’s research agenda, supporting the growth strategy of the European Commission, which highlights higher education as key to fostering innovation, employment and long-term economic prospects. These policy developments present exciting opportunities for national and research libraries to work with Europeana to develop a research platform to support innovation and growth.
References
[1] Europeana v1.0, The EDM Specifications V5.2.3. Online at http://pro.europeana.eu/web/guest/edm-documentation
[2] IFLA Study Group on the Functional Requirements for Bibliographic Records. Functional requirements for bibliographic records: final report. München: K.G. Saur. UBCIM publications; new series, vol. 19. (1998) ISBN 3-598-11382-X. <www.ifla.org/VII/s13/frbr/frbr.pdf>
[3] R. Bennett, C. Hengel-Dittrich, E. O'Neill, B.B. Tillett. VIAF (Virtual International Authority File): Linking Die Deutsche Bibliothek and Library of Congress Name Authority Files. World Library and Information Congress: 72nd IFLA General Conference and Council (2006)
[4] B. Vatant, M. Wick, Geonames Ontology (2006). Online at http://www.geonames.org/ontology/
N. Freire / Facilitating Access and Reuse of Research Materials: The Case of the European Library76
PlosOpenR
Exploring FP7 Funded PLOS Publications
Najko JAHN a,1, Martin FENNER b,c and Jochen SCHIRRWAGEN a
a Bielefeld University Library, Bielefeld University, Germanyb Hannover Medical School, Germany
c Technical Lead PLOS Article Level Metrics, Public Library of Science, USA
Abstract. This case study explores alternative science metrics on grant-supported
research publications. The study is based on plosOpenR, a software package for
the statistical computing environment R. plosOpenR facilitates access to the ap-
plication programming interfaces (API) provided by Open Access publisher Pub-
lic Library of Science (PLOS) and OpenAIRE – Open Access Infrastructure for
Research in Europe.
We report 1,166 PLOS articles that acknowledge grant support from 624 differ-
ent research projects funded by the European Union’s 7th Framework Programme
(FP7). plosOpenR allows the exploration of PLOS Article-Level Metrics (PLOS
ALM), including citations, usage and social media events as well as collaboration
patterns on these articles. Findings reveal the potential of reusing data, that are
made openly and automatically available by publishers, funders and the repository
community.
Keywords. Research evaluation, Article-Level Metrics, Statistical Computing, R,
PLOS, Open Access, OpenAIRE, 7th Framework Programme
1. Introduction and Motivation
With the growing number of openly available research services, new opportunities arise
for measuring performance and impact of research publications. The quantitative study
of scholarly communication no longer solely depends on traditional citation analysis, but
is complemented by usage and social media data. Publishers, funders and the repository
community are likewise seeking for ways to provide relevant data for the ongoing work
on alternative metrics.
Since its launch, the Open Access publisher Public Library of Science (PLOS)2 has
been a strong advocate of alternative ways to publish and measure research. On every
article, PLOS displays a suite of indicators including citations, information on usage and
social media activity.3 In November 2012, PLOS also started the Altmetrics collection
inviting research articles on alternative science metrics [1].
1 Corresponding Author: Bielefeld University Library, Bielefeld University, Universitaetsstrasse 25, 33602
Bielefeld, Germany; E-mail: [email protected] Public Library of Science (PLOS), http://www.plos.org/3 PLOS Article-Level-Metrics (ALM), http://article-level-metrics.plos.org/
Mining the Digital Information NetworksN. Lavesson et al. (Eds.)© 2013 The authors and IOS Press.This article is published online with Open Access by IOS Press and distributed under the termsof the Creative Commons Attribution Non-Commercial License.doi:10.3233/978-1-61499-270-7-77
77
It is promising to apply PLOS Article-Level Metrics (PLOS ALM) in broader con-
texts, as for instance on a particular funding programme. OpenAIRE – Open Access
Infrastructure for Research in Europe4 gives access to results funded by the European
Union’s 7th Framework Programme (FP7) in general and FP7 grants subject to the Open
Access pilot of the European Commission under the Special Clause 39 (SC39) in par-
ticular. OpenAIRE features a dedicated work package for exploiting usage metrics on
Open Access publications as a supplement to conventional citation analysis. To this end,
OpenAIRE has started to aggregate data from federated usage data providers.[2]
In this case study, we stress the potential of PLOS ALM information on exploring
FP7 grant-supported research publications. Moreover, our considerations reflect a grow-
ing community of scientists that collaborate on statistical tools to access and analyse re-
search output[3,4]. The case study, therefore, derives from a set of tools for the statistical
computing environment R[5] – plosOpenR.5
After introducing the APIs and existing software solutions used in the next section,
we demonstrate plosOpenR on the basis of 1,166 PLOS research articles acknowledging
624 FP7 funded projects. Finally, we discuss the potential benefits and limits from the
perspectives of research infrastructure and quantitative science studies.
The dataset of our case study is available at doi:10.5281/ZENODO.1239
2. Background and Data
PLOS offers two public available APIs that plosOpenR uses. The PLOS Search API6
gives developers access to the fulltext-corpus of all PLOS articles published. The search
fields correspond to article sections. For our study on information about FP7 funded
research published in PLOS, we mainly rely on the fields listed in Table 1.
Table 1. PLOS Search API fields
Field Description
id DOI (Digital Object Identifier)
financial disclosure Funding acknolwedgement (free text)
affiliate Affiliation of the authors (free text)
The PLOS ALM API is used to retrieve metrics on PLOS articles.7 PLOS releases
the underlying software under an Open Source licence.8 For our work, we analysed the
following PLOS ALM providers listed in Table 2.
OpenAIRE exposes FP7 funding information via its OAI-PMH interface9 which
reflects the OpenAIRE data model[6]. Detailed project information are listed in the
set project. Fields that we have used to identify and contextualize projects in corre-
4 OpenAIRE, http://www.openaire.eu/5 plosOpenR repository on GitHub, https://github.com/articlemetrics/plosOpenR6 PLOS Search Fields, http://api.plos.org/solr/search-fields/7 PLOS ALM FAQ, http://api.plos.org/alm/faq/8 ALM software repository: https://github.com/articlemetrics/alm/9 OpenAIRE BaseURL, http://api.openaire.research-infrastructures.eu:8280/is/mvc/openaireOAI/oai.do
N. Jahn et al. / PlosOpenR Exploring FP7 Funded PLOS Publications78
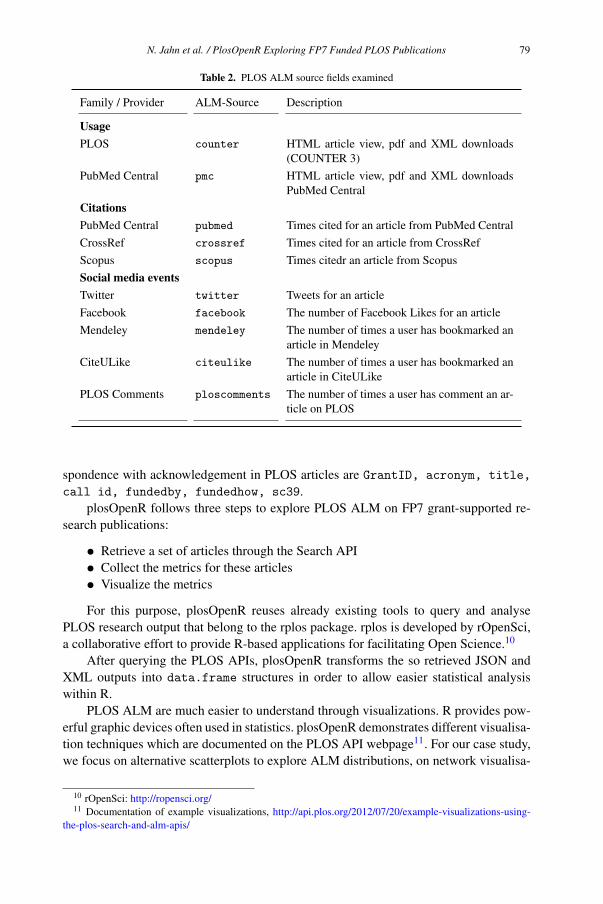
Table 2. PLOS ALM source fields examined
Family / Provider ALM-Source Description
UsagePLOS counter HTML article view, pdf and XML downloads
(COUNTER 3)
PubMed Central pmc HTML article view, pdf and XML downloads
PubMed Central
CitationsPubMed Central pubmed Times cited for an article from PubMed Central
CrossRef crossref Times cited for an article from CrossRef
Scopus scopus Times citedr an article from Scopus
Social media eventsTwitter twitter Tweets for an article
Facebook facebook The number of Facebook Likes for an article
Mendeley mendeley The number of times a user has bookmarked an
article in Mendeley
CiteULike citeulike The number of times a user has bookmarked an
article in CiteULike
PLOS Comments ploscomments The number of times a user has comment an ar-
ticle on PLOS
spondence with acknowledgement in PLOS articles are GrantID, acronym, title,
call id, fundedby, fundedhow, sc39.
plosOpenR follows three steps to explore PLOS ALM on FP7 grant-supported re-
search publications:
• Retrieve a set of articles through the Search API
• Collect the metrics for these articles
• Visualize the metrics
For this purpose, plosOpenR reuses already existing tools to query and analyse
PLOS research output that belong to the rplos package. rplos is developed by rOpenSci,
a collaborative effort to provide R-based applications for facilitating Open Science.10
After querying the PLOS APIs, plosOpenR transforms the so retrieved JSON and
XML outputs into data.frame structures in order to allow easier statistical analysis
within R.
PLOS ALM are much easier to understand through visualizations. R provides pow-
erful graphic devices often used in statistics. plosOpenR demonstrates different visualisa-
tion techniques which are documented on the PLOS API webpage11. For our case study,
we focus on alternative scatterplots to explore ALM distributions, on network visualisa-
10 rOpenSci: http://ropensci.org/11 Documentation of example visualizations, http://api.plos.org/2012/07/20/example-visualizations-using-
the-plos-search-and-alm-apis/
N. Jahn et al. / PlosOpenR Exploring FP7 Funded PLOS Publications 79
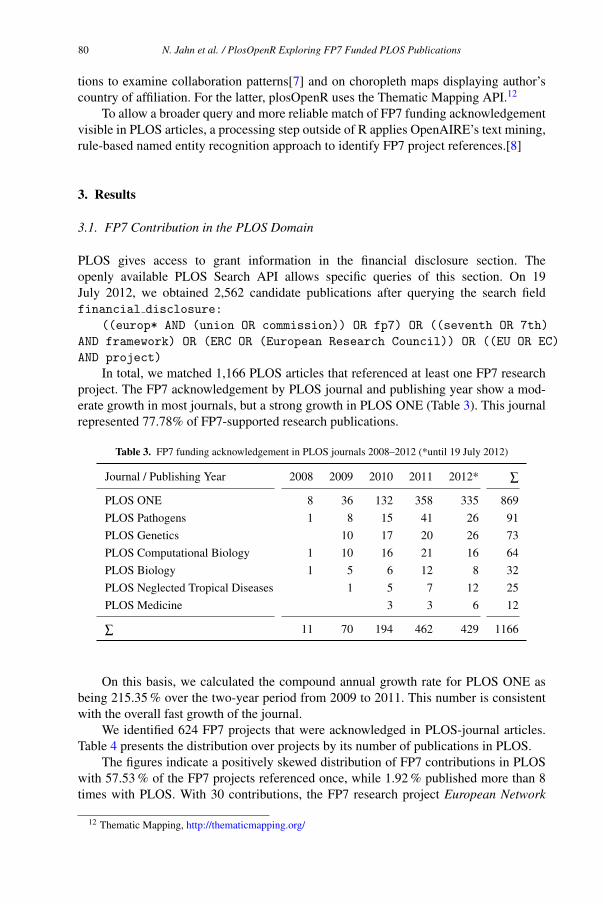
tions to examine collaboration patterns[7] and on choropleth maps displaying author’s
country of affiliation. For the latter, plosOpenR uses the Thematic Mapping API.12
To allow a broader query and more reliable match of FP7 funding acknowledgement
visible in PLOS articles, a processing step outside of R applies OpenAIRE’s text mining,
rule-based named entity recognition approach to identify FP7 project references.[8]
3. Results
3.1. FP7 Contribution in the PLOS Domain
PLOS gives access to grant information in the financial disclosure section. The
openly available PLOS Search API allows specific queries of this section. On 19
July 2012, we obtained 2,562 candidate publications after querying the search field
financial disclosure:
((europ* AND (union OR commission)) OR fp7) OR ((seventh OR 7th)
AND framework) OR (ERC OR (European Research Council)) OR ((EU OR EC)
AND project)
In total, we matched 1,166 PLOS articles that referenced at least one FP7 research
project. The FP7 acknowledgement by PLOS journal and publishing year show a mod-
erate growth in most journals, but a strong growth in PLOS ONE (Table 3). This journal
represented 77.78% of FP7-supported research publications.
Table 3. FP7 funding acknowledgement in PLOS journals 2008–2012 (*until 19 July 2012)
Journal / Publishing Year 2008 2009 2010 2011 2012* ∑
PLOS ONE 8 36 132 358 335 869
PLOS Pathogens 1 8 15 41 26 91
PLOS Genetics 10 17 20 26 73
PLOS Computational Biology 1 10 16 21 16 64
PLOS Biology 1 5 6 12 8 32
PLOS Neglected Tropical Diseases 1 5 7 12 25
PLOS Medicine 3 3 6 12
∑ 11 70 194 462 429 1166
On this basis, we calculated the compound annual growth rate for PLOS ONE as
being 215.35 % over the two-year period from 2009 to 2011. This number is consistent
with the overall fast growth of the journal.
We identified 624 FP7 projects that were acknowledged in PLOS-journal articles.
Table 4 presents the distribution over projects by its number of publications in PLOS.
The figures indicate a positively skewed distribution of FP7 contributions in PLOS
with 57.53 % of the FP7 projects referenced once, while 1.92 % published more than 8
times with PLOS. With 30 contributions, the FP7 research project European Network
12 Thematic Mapping, http://thematicmapping.org/
N. Jahn et al. / PlosOpenR Exploring FP7 Funded PLOS Publications80
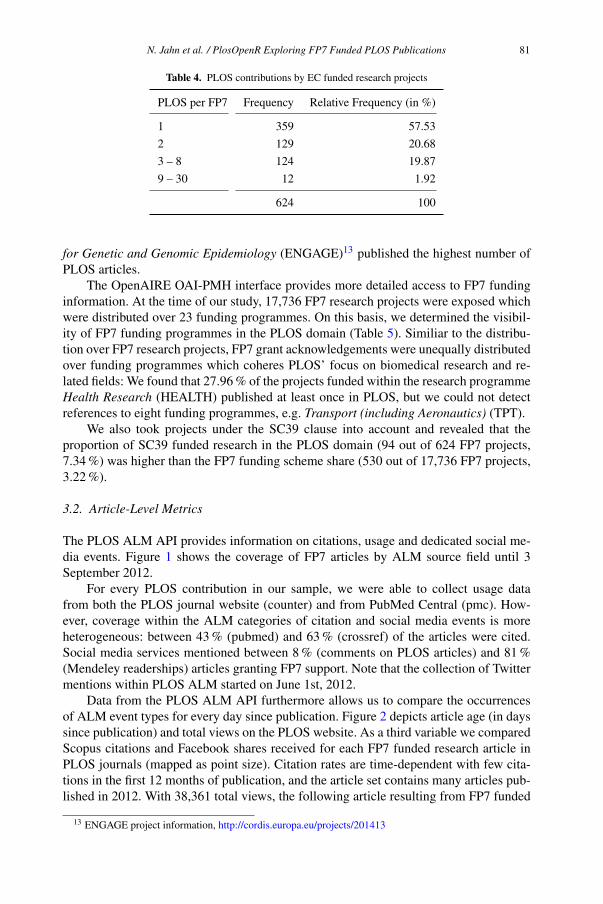
Table 4. PLOS contributions by EC funded research projects
PLOS per FP7 Frequency Relative Frequency (in %)
1 359 57.53
2 129 20.68
3 – 8 124 19.87
9 – 30 12 1.92
624 100
for Genetic and Genomic Epidemiology (ENGAGE)13 published the highest number of
PLOS articles.
The OpenAIRE OAI-PMH interface provides more detailed access to FP7 funding
information. At the time of our study, 17,736 FP7 research projects were exposed which
were distributed over 23 funding programmes. On this basis, we determined the visibil-
ity of FP7 funding programmes in the PLOS domain (Table 5). Similiar to the distribu-
tion over FP7 research projects, FP7 grant acknowledgements were unequally distributed
over funding programmes which coheres PLOS’ focus on biomedical research and re-
lated fields: We found that 27.96 % of the projects funded within the research programme
Health Research (HEALTH) published at least once in PLOS, but we could not detect
references to eight funding programmes, e.g. Transport (including Aeronautics) (TPT).
We also took projects under the SC39 clause into account and revealed that the
proportion of SC39 funded research in the PLOS domain (94 out of 624 FP7 projects,
7.34 %) was higher than the FP7 funding scheme share (530 out of 17,736 FP7 projects,
3.22 %).
3.2. Article-Level Metrics
The PLOS ALM API provides information on citations, usage and dedicated social me-
dia events. Figure 1 shows the coverage of FP7 articles by ALM source field until 3
September 2012.
For every PLOS contribution in our sample, we were able to collect usage data
from both the PLOS journal website (counter) and from PubMed Central (pmc). How-
ever, coverage within the ALM categories of citation and social media events is more
heterogeneous: between 43 % (pubmed) and 63 % (crossref) of the articles were cited.
Social media services mentioned between 8 % (comments on PLOS articles) and 81 %
(Mendeley readerships) articles granting FP7 support. Note that the collection of Twitter
mentions within PLOS ALM started on June 1st, 2012.
Data from the PLOS ALM API furthermore allows us to compare the occurrences
of ALM event types for every day since publication. Figure 2 depicts article age (in days
since publication) and total views on the PLOS website. As a third variable we compared
Scopus citations and Facebook shares received for each FP7 funded research article in
PLOS journals (mapped as point size). Citation rates are time-dependent with few cita-
tions in the first 12 months of publication, and the article set contains many articles pub-
lished in 2012. With 38,361 total views, the following article resulting from FP7 funded
13 ENGAGE project information, http://cordis.europa.eu/projects/201413
N. Jahn et al. / PlosOpenR Exploring FP7 Funded PLOS Publications 81
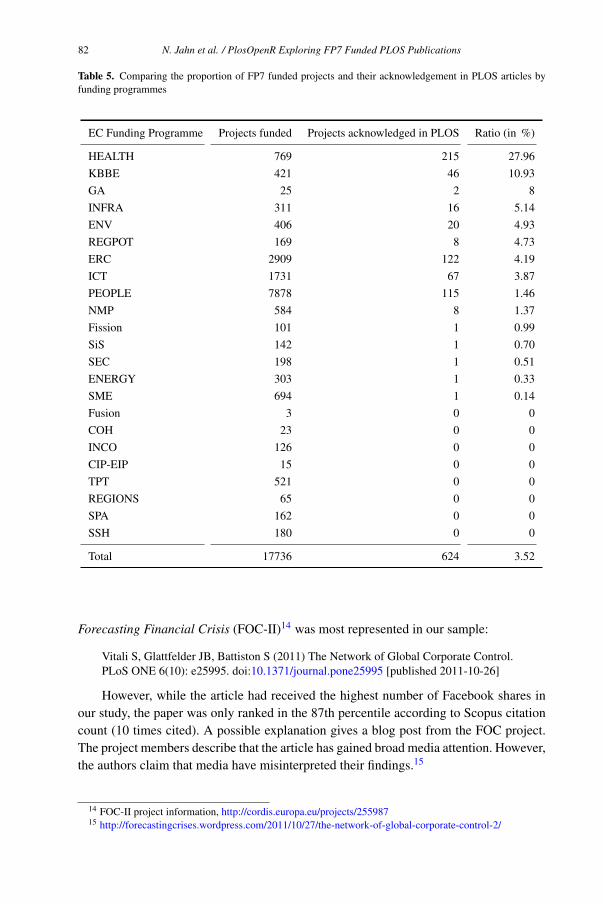
Table 5. Comparing the proportion of FP7 funded projects and their acknowledgement in PLOS articles by
funding programmes
Forecasting Financial Crisis (FOC-II)14 was most represented in our sample:
Vitali S, Glattfelder JB, Battiston S (2011) The Network of Global Corporate Control.
PLoS ONE 6(10): e25995. doi:10.1371/journal.pone25995 [published 2011-10-26]
However, while the article had received the highest number of Facebook shares in
our study, the paper was only ranked in the 87th percentile according to Scopus citation
count (10 times cited). A possible explanation gives a blog post from the FOC project.
The project members describe that the article has gained broad media attention. However,
the authors claim that media have misinterpreted their findings.15
14 FOC-II project information, http://cordis.europa.eu/projects/25598715 http://forecastingcrises.wordpress.com/2011/10/27/the-network-of-global-corporate-control-2/
Total 17736 624 3.52
HEALTH 769 215 27.96
KBBE 421 46 10.93
GA 25 2 8
INFRA 311 16 5.14
ENV 406 20 4.93
REGPOT 169 8 4.73
ERC 2909 122 4.19
ICT 1731 67 3.87
PEOPLE 7878 115 1.46
NMP 584 8 1.37
Fission 101 1 0.99
SiS 142 1 0.70
SEC 198 1 0.51
ENERGY 303 1 0.33
SME 694 1 0.14
Fusion 3 0 0
COH 23 0 0
INCO 126 0 0
CIP-EIP 15 0 0
TPT 521 0 0
REGIONS 65 0 0
SPA 162 0 0
SSH 180 0 0
EC Funding Programme Projects funded Projects acknowledged in PLOS Ratio (in %)
N. Jahn et al. / PlosOpenR Exploring FP7 Funded PLOS Publications82
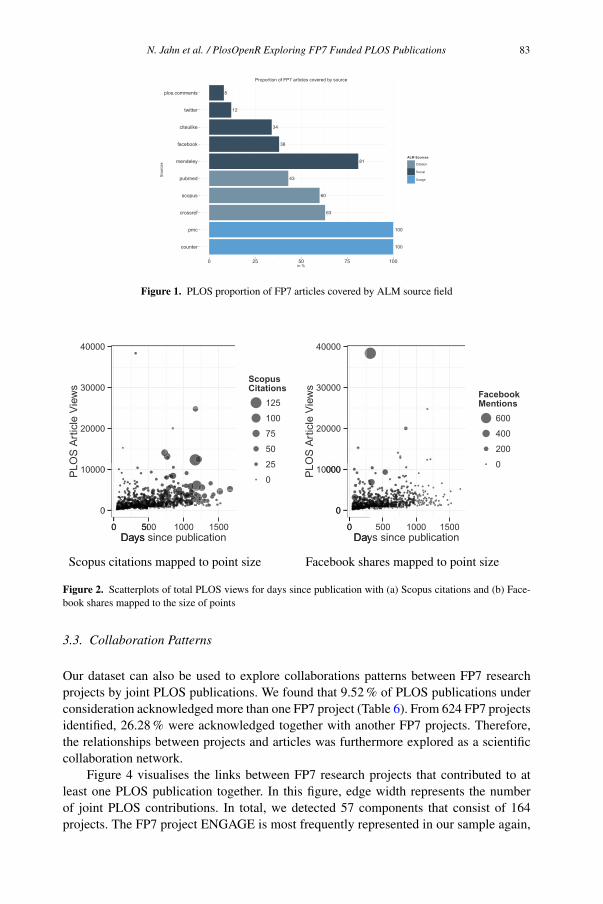
8
38
34
81
12
43
60
63
100
100counter
pmc
crossref
scopus
pubmed
mendeley
citeulike
plos.comments
0 25 50 75 100in %
Sou
rces
ALM Sources
Citation
Social
Usage
Proportion of FP7 articles covered by source
Figure 1. PLOS proportion of FP7 articles covered by ALM source field
Figure 2. Scatterplots of total PLOS views for days since publication with (a) Scopus citations and (b) Face-
book shares mapped to the size of points
3.3. Collaboration Patterns
Our dataset can also be used to explore collaborations patterns between FP7 research
projects by joint PLOS publications. We found that 9.52 % of PLOS publications under
consideration acknowledged more than one FP7 project (Table 6). From 624 FP7 projects
identified, 26.28 % were acknowledged together with another FP7 projects. Therefore,
the relationships between projects and articles was furthermore explored as a scientific
collaboration network.
Figure 4 visualises the links between FP7 research projects that contributed to at
least one PLOS publication together. In this figure, edge width represents the number
of joint PLOS contributions. In total, we detected 57 components that consist of 164
projects. The FP7 project ENGAGE is most frequently represented in our sample again,
600
400
200
0
Facebook shares mapped to point size
Facebook Mentions
0 500 1000 1500Days since publication
PLO
S A
rtic
le V
iew
s
0
10000
20000
30000
40000
125
100
75
50
25
0
Scopus citations mapped to point size
ScopusCitations
0 500 1000 1500Days since publication
PLO
S A
rtic
le V
iew
s
0
10000
20000
30000
40000
N. Jahn et al. / PlosOpenR Exploring FP7 Funded PLOS Publications 83
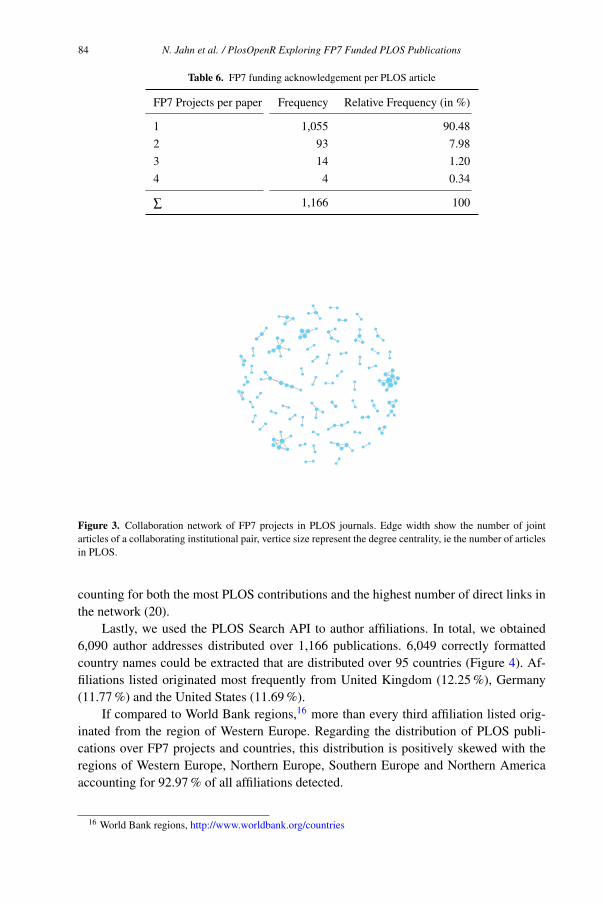
Table 6. FP7 funding acknowledgement per PLOS article
FP7 Projects per paper Frequency Relative Frequency (in %)
1 1,055 90.48
2 93 7.98
3 14 1.20
4 4 0.34
∑ 1,166 100
Figure 3. Collaboration network of FP7 projects in PLOS journals. Edge width show the number of joint
articles of a collaborating institutional pair, vertice size represent the degree centrality, ie the number of articles
in PLOS.
counting for both the most PLOS contributions and the highest number of direct links in
the network (20).
Lastly, we used the PLOS Search API to author affiliations. In total, we obtained
6,090 author addresses distributed over 1,166 publications. 6,049 correctly formatted
country names could be extracted that are distributed over 95 countries (Figure 4). Af-
filiations listed originated most frequently from United Kingdom (12.25 %), Germany
(11.77 %) and the United States (11.69 %).
If compared to World Bank regions,16 more than every third affiliation listed orig-
inated from the region of Western Europe. Regarding the distribution of PLOS publi-
cations over FP7 projects and countries, this distribution is positively skewed with the
regions of Western Europe, Northern Europe, Southern Europe and Northern America
accounting for 92.97 % of all affiliations detected.
16 World Bank regions, http://www.worldbank.org/countries
N. Jahn et al. / PlosOpenR Exploring FP7 Funded PLOS Publications84
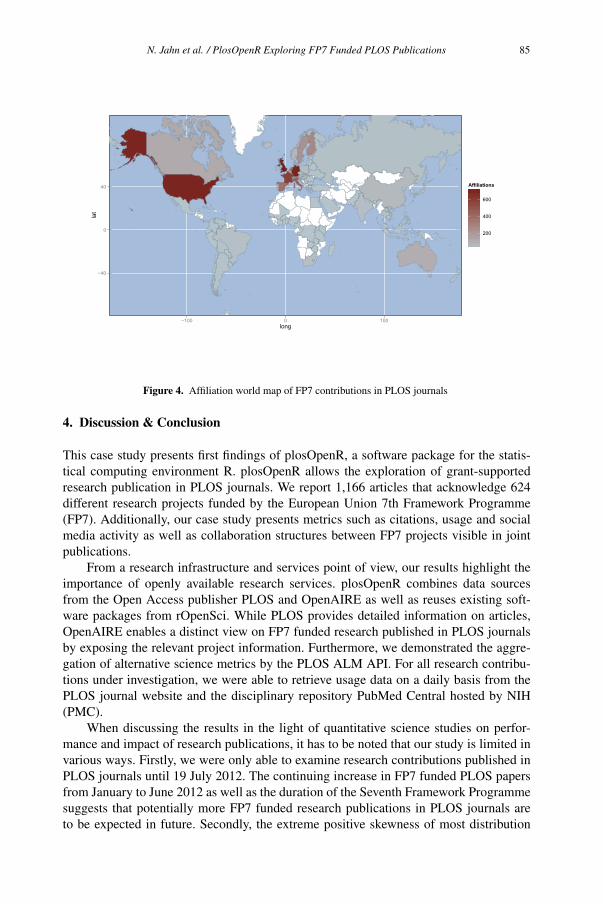
−40
0
40
−100 0 100long
lat
200
400
600
Affiliations
Figure 4. Affiliation world map of FP7 contributions in PLOS journals
4. Discussion & Conclusion
This case study presents first findings of plosOpenR, a software package for the statis-
tical computing environment R. plosOpenR allows the exploration of grant-supported
research publication in PLOS journals. We report 1,166 articles that acknowledge 624
different research projects funded by the European Union 7th Framework Programme
(FP7). Additionally, our case study presents metrics such as citations, usage and social
media activity as well as collaboration structures between FP7 projects visible in joint
publications.
From a research infrastructure and services point of view, our results highlight the
importance of openly available research services. plosOpenR combines data sources
from the Open Access publisher PLOS and OpenAIRE as well as reuses existing soft-
ware packages from rOpenSci. While PLOS provides detailed information on articles,
OpenAIRE enables a distinct view on FP7 funded research published in PLOS journals
by exposing the relevant project information. Furthermore, we demonstrated the aggre-
gation of alternative science metrics by the PLOS ALM API. For all research contribu-
tions under investigation, we were able to retrieve usage data on a daily basis from the
PLOS journal website and the disciplinary repository PubMed Central hosted by NIH
(PMC).
When discussing the results in the light of quantitative science studies on perfor-
mance and impact of research publications, it has to be noted that our study is limited in
various ways. Firstly, we were only able to examine research contributions published in
PLOS journals until 19 July 2012. The continuing increase in FP7 funded PLOS papers
from January to June 2012 as well as the duration of the Seventh Framework Programme
suggests that potentially more FP7 funded research publications in PLOS journals are
to be expected in future. Secondly, the extreme positive skewness of most distribution
N. Jahn et al. / PlosOpenR Exploring FP7 Funded PLOS Publications 85
under considerations demands careful analysis and interpretation. Especially, it has to be
noted that our findings only partially cover all FP7 funding projects and programmes due
to the disciplinary scope of PLOS.
Particular care needs to be taken if future studies rank research articles according to
the different metrics in use and develop comparative indicators that rely on these data.
For instance, our exploration of Scopus citation counts in comparison with the social
media event type Facebook shares on the article level revealed that public media attention
has effects on analysing and interpreting research publications. In addition, whereas the
majority of usage data and social web activity happens in the days and months after
publication, citation data are accumulating much more slowly. The set of FP7 funded
PLOS articles that we identified should therefore be reanalyzed at least two years after
the last paper in the set has been published. However, with data sources and visualization
methods suggested, plosOpenR provides tools for easy on-time exploration of PLOS
ALM in order to identify irregular patterns and motivate qualitative investigation.
Future work and studies on PLOS ALM will focus on main problem areas [9]. With
the evolving European federation of usage-data providers, OpenAIRE has the potential
to provide additional information about usage events and might complement PLOS ALM
as PMC already does.
Acknowledgements
We thank Harry Dimitropoulos for applying his text mining/rule-based named entity
recognition approach on our sample. Jochen Schirrwagen gratefully acknowledges sup-
port from the European Commission (FP7-INFRA-2007-1.2.1, Grant Agreement no.
246686).
References
[1] Priem J, Groth P, Taraborelli D. The Altmetrics Collection. PLoS ONE. 2012;7(11):e48753. Available
from: http://dx.doi.org/10.1371/journal.pone.0048753.
[2] OpenAIRE. OpenAIRE Guidelines for Usage Statistics v1.0; 2011. Available from: http:
//www.openaire.eu/en/about-openaire/publications-presentations/publications/
doc_details/314-openaire-guidelines-for-usage-statistics-v10.
[3] Boettiger C, Lang DT, Wainwright PC. rfishbase: exploring, manipulating and visualizing FishBase data
from R. Journal of Fish Biology. 2012;81(6):2030–2039. Available from: http://dx.doi.org/10.
1111/j.1095-8649.2012.03464.x.
[4] Boettiger C, Lang DT. Treebase: an R package for discovery, access and manipulation of online phyloge-
nies. Methods in Ecology and Evolution. 2012;3(6):1060–1066. Available from: http://dx.doi.org/
10.1111/j.2041-210X.2012.00247.x.
[5] R Core Team. R: A Language and Environment for Statistical Computing. Vienna, Austria; 2012. Avail-
able from: http://www.R-project.org.
[6] Manghi P, et al. OpenAIRE - data model specification; 2010. Available from: http://puma.isti.cnr.
it/dfdownload.php?ident=/cnr.isti/2010-EC-016.
[7] Newman MEJ. The structure of scientific collaboration networks. Proceedings of the National Academy
of Sciences. 2001;98(2):404–409. Available from: http://dx.doi.org/10.1073/pnas.98.2.404.
[8] Manghi P, Bolikowski L, Manold N, Schirrwagen J, Smith T. OpenAIREplus: the European Scholarly
Communication Data Infrastructure. D-Lib Magazine. 2012 Sep;18(9/10). Available from: http://dx.
doi.org/10.1045/september2012-manghi.
[9] ALM Workshop 2012 Report, PLOS ALM; 2012. figshare. Available from: http://dx.doi.org/10.
6084/m9.figshare.98828.
N. Jahn et al. / PlosOpenR Exploring FP7 Funded PLOS Publications86

Extended Abstracts

This page intentionally left blank
Making Sense of a Flat List of Terms into
Linked Open Data SKOS Vocabularies
Helder Noel FIRMINO
a,1
and Ana Alice BAPTISTA
a
a
CentroAlgoritmi, University of Minho, Guimarães, Portugal
Abstract. Problem and Objectives. ANACOM (Portuguese National Authority on
Communications) is the regulator, supervisor and representative of the
communications sector in Portugal. Through the years, ANACOM has been
developing a kind of a flat controlled vocabulary: a list of controlled terms,
without any structure and without specific a priori relations to the DC properties in
use. One of the requirements of the project now in hands is to organize that list
into one or more controlled vocabularies, relate them with other LOD
vocabularies, encode them in SKOS and make them open in at least two languages
(Portuguese and English).
Methodological Approach. We will adopt a hybrid approach, combining the
best features of two methodologies: Ontology Development 101(1) and the
“Process and Methodology for Developing Core Vocabularies” used by the
European Programme ISA (2). We will use qualitative research techniques, such as
interviews and focus groups to analyse and validate the relations between the
terms.
Expected Results. This article presents a work in progress comprised of the
whole process starting on the organization of the terms and ending in the first
version of the controlled vocabularies encoded in SKOS.
Keywords. Linked open data, SKOS, Controled Vocabularies
Full text available at: http://elpub.scix.net/cgi-bin/works/Home
1
Corresponding Author: Helder Noel Firmino, CentroAlgoritmi, University of Minho, Portugal; E-mail:
Mining the Digital Information NetworksN. Lavesson et al. (Eds.)© 2013 The authors and IOS Press.This article is published online with Open Access by IOS Press and distributed under the termsof the Creative Commons Attribution Non-Commercial License.
89
Does Openness and Open Access Policy
Relate to the Success of Universities
Pekka OLSBO
a,1
a
Jyväskylö University Library
Abstract. The universities of the world are ranked by several different research
institutions. In this study we will take a closer look at the Ranking Web of
Universities (RWU) ranking, because it claims to be more extensive than the
others and because its focus is on academic web presence of the universities. RWU
has analyzed over 21 000 universities and the actual ranking covers 12 000
universities. This paper examines the internet visibility of the University of
Jyväskylä and eight European countries and how the openness of universities has
developed during last two editions of the Ranking Web of Universities. The
Finnish Academy published a report The state of scientific research in Finland
2012 in October 2012. In this report The Academy is analyzing the relative
citation impact of eight European countries. Analysis shows the good values of
Switzerland, Netherlands and Denmark. If we analyze the statistics in the RWU
and the Ranking Web of Repositories we might find connections between the
success of universities, ranking in openness and repositories in Switzerland,
Netherlands and Denmark. From the comparison of eight European countries we
can find out that at least in Netherlands and Sweden there is a deep connection
between the ranking of universities, repositories and the openness of the
universities. But the most interesting developments can be seen, if we look at the
trends of these numbers and figures. If we compare the top 5 universities of these
countries we can see, that Finland, Denmark and Norway have improved their
placing in openness substantially compared to Switzerland and even the whole
RWU. These same countries seem to be in their way up also if we look at the
development of relative citation impact in recent years. One explaining factor
could be the Open Access policy of these countries and universities. Is it due to
proper Open Access policy of the country, coincidence or unreliability of the
methodology of Ranking Web of Universities is hard to say yet.
Keywords. Internet Visibility, Relative Citation Impact, Institutional Repositories
Full text available at: http://elpub.scix.net/cgi-bin/works/Home
1
Corresponding Author: Pekka Olsbo, Jyväskylä University Library, Finland; E-mail: [email protected].
Mining the Digital Information NetworksN. Lavesson et al. (Eds.)
© 2013 The authors and IOS Press.This article is published online with Open Access by IOS Press and distributed under the terms
of the Creative Commons Attribution Non-Commercial License.
90
Usage Data of an Open Access e-Journal
in a Digital Repository
Teresa S. WELSH
a
and Stacy CREEL
b,1
a
The University of Southern Mississippi
b
The University of Southern Mississippi
Abstract. The University of Southern Mississippi’s School of Library and
Information Science (SLIS) publishes SLIS Connecting in the university’s digital
repository, Aquila Digital Community (http://aquila.usm.edu/), which is hosted
through Digital Commons. The purpose of SLIS Connecting is “to share news,
information and research with future students, current students, alumni, faculty,
and the general population through selected faculty publications, invited student
publications, refereed publications, and through regular columns” [1]. The first
issue was electronically published in February 2012 and the second in October
2012. The third issue was published in February 2013 and contains the first paper
submitted from an author not affiliated with SLIS. SLIS Connecting is currently
indexed in Google Search and in Google Scholar. From the first issue of SLIS
Connecting in February 2012 through March 2013, there were over 7,000 page
views. Eighty-three percent were from U.S. While the patterns in the United States
align closely to the student and alumni distribution as expected; the international
pattern at first glance seems somewhat unexpected, but there are several possible
reasons for the unexpected international reach. This extended abstract presents the
spatial analysis of usage data of SLIS Connecting in the United States and abroad.
[1] SLIS Connecting [homepage on the Internet]. Hattiesburg, MS: USM SLIS.
[cited 3 January 2013]. Available from http://aquila.usm.edu/slisconnecting/
Keywords. Digital Repositories, Geographic Distribution
Full text available at: http://elpub.scix.net/cgi-bin/works/Home
1
Stacy L. Creel, Assistant Professor, 118 College Drive #5146, Hattiesburg, MS 39406 Stacy.Creel@usm.
edu.
Mining the Digital Information NetworksN. Lavesson et al. (Eds.)© 2013 The authors and IOS Press.This article is published online with Open Access by IOS Press and distributed under the termsof the Creative Commons Attribution Non-Commercial License.
91
Publisher Interest Towards a Role
for Journals in Data-Sharing:
The Findings of the JoRD Project
Marianne BAMKIN
a,1
, Jane SMITH
a
, Paul STURGES
b
, Azhar HUSSEIN
a
and Bill HUBBARDa
a
Centre for Research Communication, University of Nottingham
b
Emeritus Professor, Loughborough University
Abstract. The sharing of the data generated by research projects is increasingly
being recognised as an academic priority by funders and researchers. For example,
out of 110 listed funders on the JULIET 2 service, 32 have data policies of some
form. The topic has been discussed by national and international organisations,
for example, ICSU (the International Council for Science), the OECD
(Organisation for Economic Co-operation and Development) and the UK’s Royal
Society. The public statements that emerge from these scientific bodies call for
both research transparency and freely available access to research data created
with public funding for possible reuse. The rights associated with the sharing of
data and the environment in which it can be done is also of interest to publishers.
This interest can be attributed to two motivating factors: to support the academic
function of data such as the corroboration of research findings and the
facilitation of the re-use of data; and to respond to a strategic, commercial
development, for instance, an engagement with the rights, process and
environment of data sharing. Currently some publishers are introducing
contractual policies on the archiving and sharing of data in addition to policies
governing the deposit and sharing of research articles through repositories.
The issue of policies on sharing set out by academic journals has been raised
by scientific organisations, such as the US National Academy of Sciences,
which urges journals to make clear statements of their sharing policies. On the
other hand, the publishing community whilst broadly supporting the principle of
open and accessible research data expresses concerns over the intellectual property
implications of archiving shared data.
Keywords. Journal Data Policies, Research Data Policies
Full text available at: http://elpub.scix.net/cgi-bin/works/Home
1
Corresponding Author: Marianne Bamkin, University of Nottingham, Centre for Research
Communications; E-mail: [email protected].
Mining the Digital Information NetworksN. Lavesson et al. (Eds.)
© 2013 The authors and IOS Press.This article is published online with Open Access by IOS Press and distributed under the terms
of the Creative Commons Attribution Non-Commercial License.
92
Opening up Digital Publications –
Suggestions for Making Humanities
Data Available for Research
Henriette ROUED-CUNLIFFE
a,1
a
Bavarian Academy of Sciences and Humanitites, University of Munich
Abstract. Currently the trend in digital publishing of Humanities data seems to
be moving towards openness and interoperability. In this abstract I will examine
to what extent and in what way current digital publications are open and
accessible. My hypothesis is that while many digital publications are currently
made available online and can be searched and viewed by the general public, very
few are available to researchers in a meaningful way. By meaningful I mean that
external researchers can search and export data for reuse and are possibly even
encouraged to define their own search criteria. I believe that this is the true
essence of data sharing. Following this, I will propose one approach, using XML
and Web Services, to creating a digital publication of Humanities data that would
be open to the research community in a meaningful way, as defined above.
Keywords. External Researchers, XML, Web Services
Full text available at: http://elpub.scix.net/cgi-bin/works/Home
1
Corresponding Author: Henriette Roued-Cunliffe, Ludwig-Maximilians Universität, Munich, Germany;
E-mail: [email protected].
Mining the Digital Information NetworksN. Lavesson et al. (Eds.)© 2013 The authors and IOS Press.This article is published online with Open Access by IOS Press and distributed under the termsof the Creative Commons Attribution Non-Commercial License.
93
Repositories Recreated – Working Towards
Improved Interoperability and Integration
by a Co-Operative Approach in Sweden
Stefan ANDERSSON
a,1
and Aina SVENSSON
a
a
Electronic Publishing Centre, Uppsala University Library
Abstract. Recently the technological and organizational infrastructures of
institutional repositories have been questioned. For example the British so-called
Finch report from last summer argued that further development, as well as higher
standards of accessibility of repositories, are needed in order to make them better
integrated and interoperable to ultimately bring greater use by both authors and
readers. Not only the technical frameworks and presumably low usage levels are
criticized but also the lack of “clear policies on such matters as the content they
will accept, the uses to which it may be put, and the role that they will play in
preservation”. The report concludes that: “In practice patterns of deposit are
patchy”.
As in the UK, today, all universities and university colleges in Sweden,
except a couple of very small and specialized ones, do have an institutional
repository. A majority (around 80%) are working together on a co-operative basis
within the DiVA Publishing System with the Electronic Publishing Centre at
Uppsala University Library acting as the technical and organizational hub.
Because the system is jointly funded, and the members contribute according to
their size, it has been possible even for smaller institutions with limited resources
to run a repository with exactly the same functionalities as the biggest universities.
In this presentation we want to demonstrate the ever-increasing importance
of institutional repositories in Sweden. Starting more than a decade ago the
DiVA Consortium has, for some time, been addressing the problems now raised
by the Finch report in a number of areas.
Keywords. Research Information, Long-term Preservation, DiVA, Sweden
Full text available at: http://elpub.scix.net/cgi-bin/works/Home
1
Corresponding Author: Stefan Andersson, Uppsala University Library, Sweden; E-mail: Stefan.
Mining the Digital Information NetworksN. Lavesson et al. (Eds.)
© 2013 The authors and IOS Press.This article is published online with Open Access by IOS Press and distributed under the terms
of the Creative Commons Attribution Non-Commercial License.
94
Towards an e-Publishing Library Service
in Humanities and Social Sciences:
A Feasibility Study
Rosa DI CESAREa,1
, Silvia GIANNINIa
and Daniela LUZIb
a National Research Council, Institute for Research on Population and Social Policies,
Rome, Italy
b National Research Council, Institute of Information Science and Technology,
Pisa, Italy
Abstract. Introduction. Many surveys have been promoted and/or supported by
SPARC (Scholarly Publishing and Academic Resources Coalition) and ARL
(American Research Libraries) to gain understanding of the initiatives and
projects undertaken by universities and/or research institutions in the development
of value-added services to manage in-house publications. These surveys
considered the advantages of using open source software to manage digital
contents and pointed out critical issues in the development of these services,
stressing the necessity of integrating them with other digital repositories. Case
studies of successful strategies are also reported, highlighting the research context,
type of products and/or collections to be managed with e-publishing services.
Aim. This paper intends to describe a methodology used to analyze the
editorial production of CNR Institutes belonging to the Department of
Humanities and Social Sciences. This analysis is considered a pre-requisite to
design a feasibility study with the aim of developing an e-publishing service
tailored to HSS characteristics. To reach this aim the paper describes in particular
the characteristics of editorial products defining a set of quality criteria for current
production. The result of this analysis can provide insight into the identification of
weak and strong points that have to be addressed when developing a new and
sustainable e-publishing service.
Survey design. To gain insight into the characteristics of editorial products
we identified a set of variables that express stability (start date, number of years
and frequency of publication); editorial quality (presence of standardized
bibliographic elements and codes; attribution of Copyright/Creative commons;
Peer-review process) and visibility (indexed in national/international catalogues
and/or archives, access modes). For the purpose of our analysis the results of the
survey are described distinguishing between the editorial products entirely
managed in-house and those that are published and/or distributed by
commercial publishers. Moreover, results are also reported by type of editorial
products (Monograph series, journals and e-journals and report series)
considering that each type of product has specific modes of publishing and
editorial process.
Results. CNR Institutes in HSS produce different types of editorial products
in a stable way and with continuity over time. There is a consistent number of
series that have published for more than 20 years and editorial activity is keeping
pace with new-born products that also include e-Journals. No major differences
emerged in the editorial quality of in-house and external products, especially if we
consider formal editorial aspects. The selection of content depends on the type of
1
Corresponding Author: Rosa Di Cesare, National Research Council, Institute for Research on Population
and Social Policies, Rome, Italy; E-mail: [email protected].
Mining the Digital Information NetworksN. Lavesson et al. (Eds.)© 2013 The authors and IOS Press.This article is published online with Open Access by IOS Press and distributed under the termsof the Creative Commons Attribution Non-Commercial License.
95

products, while content evaluation of in-house publishing is not so diffused as
well as the attribution of copyright/creative commons. The introduction of an e-
publishing service could support more efficiently the peer-review process and also
improve visibility thanks to their additional services embedded in their platform
that support all the activities connected with the content exposure and retrieval in
indexing and abstracting services. This is particularly important in HSS.
In the future we intend to further analyze the organization context where
editorial activities are managed carrying out a questionnaire-based survey to
explore the role of libraries and/or other stakeholders involved in this process as
well as researchers’ needs when publishing their results.
Keywords. Journal Data Policies, Research Data Policies
Full text available at: http://elpub.scix.net/cgi-bin/works/Home
R. Di Cesare et al. / Towards an e-Publishing Library Service in Humanities and Social Sciences96
Making Social Interactions Accessible
in Online Social Networks
Fredrik ERLANDSSON
a,1
, Roosbeh NIAb
, Henric JOHNSON
a
and Felix WU
b
a
Blekinge Institute of Technology
b
University of California, Davis
Abstract. Recently, online social networks, OSNs, have gained significant
popularity and are among the most popular ways to use the Internet. Additionally,
researchers have become more interested in using the social interaction networks,
SINs[1], in order to further enhance and personalize their services[2]. OSNs are
also redefining roles within the publishing industry, allowing publishers and
authors to reach and engage with readers directly[3]. However, SINs are not very
easily available as of today through the current APIs provided by most OSNs.
Such applications would therefore spend tremendous amount of time trying to
gather the required SINs for their services. Therefore, our research problem is how
we can design a system that makes social interactions in OSNs accessible. This
also refers to the problem of how to crawl OSNs in a structured way, which is the
focus of this short paper.
Keywords. Data Mining, Crawling, Social Interactions
Full text available at: http://elpub.scix.net/cgi-bin/works/Home
1
Corresponding Author: Fredrik Erlandsson, Blekinge Institute of Technology, 371 79 Karlskrona; E-mail:
Mining the Digital Information NetworksN. Lavesson et al. (Eds.)© 2013 The authors and IOS Press.This article is published online with Open Access by IOS Press and distributed under the termsof the Creative Commons Attribution Non-Commercial License.
97

This page intentionally left blank
Subject Index
3D interaction 13
3D visualization and navigation 13
7th framework programme 77
adaptive hypertext 3
algorithms 3
article-level metrics 77
clustering 13
conference management system 45
controled vocabularies 89
copyright 23
cover sheets 23
crawling 97
data mining 97
DCAP 33
deduplication 57
design 3
design science research 33
development of DCAP 33
digital humanities 67
digital libraries 67
digital repositories 91
DiVA 94
Dublin core 57
Dublin core application profile 33
experimentation 3
external researchers 93
force-directed placement 13
full text 67
geographic distribution 91
H.3.3 information search and
retrieval/information filtering 3
H.5.1 multimedia information
systems/evaluation/
methodology 3
H.5.4 hypertext/hypermedia/theory 3
I.2.0 general/cognitive simulation 3
I.2.6 learning/connectionism and
neural nets 3
information retrieval 13
institutional repositories 23, 90
internet visibility 90
journal data policies 92, 95
k-means 13
linked open data 45, 89
long-term preservation 94
Me4DCAP 33
metadata 33, 57
method 33
OAI-PMH 57
open access 57, 77
open bibliographic data 45
OpenAIRE 77
PLOS 77
portals 67
R 77
record linkage 57
relative citation impact 90
research data policies 92, 95
research evaluation 77
research information 94
research infrastructures 67
retrieval models 3
search process 3
semantic web 33
SKOS 89
social interactions 97
spreading activation 3
statistical computing 77
survey 23
Sweden 94
text analysis 23
theory 3
web services 93
XML 93
Mining the Digital Information NetworksN. Lavesson et al. (Eds.)© 2013 The authors and IOS Press.This article is published online with Open Access by IOS Press and distributed under the termsof the Creative Commons Attribution Non-Commercial License.
99

This page intentionally left blank
Author Index
Abente, M.J. 13
Amado Alves, M. 3
Andersson, S. 94
Bamkin, M. 92
Baptista, A.A. 33, 89
Berndt, R. 45
Caldera, C. 45
Creel, S. 91
Curado Malta, M. 33
de Antonio, A. 13
Di Cesare, R. 95
Erlandsson, F. 97
Fellner, D.W. 45
Fenner, M. 77
Firmino, H.N. 89
Freire, N. 67
Giannini, S. 95
Hubbard, B. 92
Hussein, A. 92
Jahn, N. 77
Johnson, H. 97
Klepel, D. 13
Lavesson, N. v
Linde, P. v
Luzi, D. 95
Moral, C. 13
Nia, R. 97
Olsbo, P. 90
Polydoratou, P. v
Roued-Cunliffe, H. 93
Schirrwagen, J. 77
Smith, J. 92
Sturges, P. 92
Svensson, A. 94
Taylor, S. 23
Tonkin, E.L. 23
Tourte, G.J.L. 23
Welsh, T.S. 91
Wendykier, P. 57
Wu, F. 97
Mining the Digital Information NetworksN. Lavesson et al. (Eds.)© 2013 The authors and IOS Press.This article is published online with Open Access by IOS Press and distributed under the termsof the Creative Commons Attribution Non-Commercial License.
101

This page intentionally left blank

This page intentionally left blank

This page intentionally left blank