Embed Size (px)
Citation preview
AGENDA ITEM: 1
MILPITAS PLANNING COMMISSION AGENDA REPORT
NEW BUSINESS Meeting Date: May 27, 2009
APPLICATION Conceptual General Plan Housing Element Amendment (No. 09-0002) SUMMARY: LOCATION: Citywide RECOMMENDATION: Staff recommends the Planning Commission approve the Conceptual
General Plan Housing Element Amendment Update and forward recommendation to the City Council.
PROJECT DATA: N/A General Plan/ Zoning Designation: All Residential Zoning Districts
Overlay District: N/A Specific Plan: None PREPARD BY: Felix Reliford ATTACHMENTS: A. Draft Housing Element (Previously Distributed)
B. Negative Declaration (Previously Distributed) C. Letter from Richard Ruth-dated May 20, 2009
General Plan Housing Element Amendment and Negative Declaration Page 2
BACKGROUND The Housing Element is one of the seven mandatory elements of a General Plan that are required by the California Government Code. The Housing Element is unique from the other elements in that it must comply with specific provisions within the Government Code. The following are the major provisions which needs to be addressed in the Element:
• Review of prior Housing Element (2002) including analysis of housing production in comparison to the City’s regional housing needs allocation (RHNA) determined by the Association of Bay Area Governments (ABAG).
• An analysis of the City’s current and future housing needs
• An inventory and analysis of housing resources
• An analysis of governmental and non-governmental constraints to housing production
• A housing plan setting forth goals, policies, programs and qualified objectives to address the City’s housing needs.
Housing Elements must be updated every five years and the City’s last Housing Element was certified by the California Department of Housing and Community Development (HCD) in 2002. The State granted Bay Area cities an extension to complete their updates to allow ABAG additional time to complete the RHNA process. The planning period for this version of the Housing Element is 2009-2014. Housing Element Public Review Process On November 6 and 13, 2008, staff conducted two community meetings on the Draft Housing Element Update to obtain public input and comments on the document prior to the submittal before the Planning Commission and City Council. The first meeting was held for Housing Professionals and the second meeting for Milpitas residents.
The Draft Housing Element Update has been advertised weekly for the public review and comments period from May 5 thru 26 in the Milpitas Post. Copies of the documents were made available in the Milpitas Public Library and City Hall for public review. Also, notices and copies of the documents were mailed to 51 different organizations, agencies, groups and other interested parties. Copies of the Housing Element were provided to the public upon requested.
A Note of Intent to Adopt a Negative Declaration (and the public hearing for the Planning Commission meeting) was advertised and sent to the County for the CEQA required 30 days posting and to the State of California Office of Planning and Research (OPR), the State environmental clearinghouse agency.
General Plan Housing Element Amendment and Negative Declaration Page 3
Previously Housing Element 2002 During the previous Housing Element Period, the City accomplished several major goals, which includes the following:
• Created a Transit-Oriented Overlay Zone that increases densities. • Established a Mixed-Use Zoning District in the Zoning Ordinance. • Modified the zoning in the Town Center Zoning District to allow residential development. • Changed the Zoning Ordinance to permit mixed use and residential developments “by right’
in the Midtown Specific Plan Area. • Maintained a minimum housing density of 20 du/acre in the Midtown and Transit Area Specific
Plans. Most new developments exceed this minimum density. • Continued to work with Housing Authority of San Clara County to maintain affordability of
expired units at Sunnyhills Apartments. • Purchased additional wastewater capacity to accommodate infrastructure necessary for new
housing development. • Provided approximately $36 million from the Redevelopment Agency in financial assist and
support affordable housing developments, which created over 900 affordable units. • Amended the Density Bonus Ordinance so that it is consistent with State Law. • Provided financial assistance to first-time homebuyers to mixed income levels. • Supported homeless services and housing in a number of ways. • Provided $2.4 million in developer impact fees to three projects during the last housing element
period. • Provided referrals and outreach materials to help low-income seniors reduce energy
consumption. • Provided funding to Project Sentinel, a fair housing agency that monitors housing
discrimination and provides information and referrals. • Provided public information on housing and housing opportunities on the City’s website, Cable
TV and the Milpitas Post. • Provided public information to developers regarding Title 24 and ADA compliance and to
disabled persons about housing opportunities and resources. • Provided $925,000 to the Housing Trust Fund of Santa Clara County to support affordable
housing projects within Milpitas. • Provided $15.6 million towards the development of the DeVries Place Senior Housing Project.
Progress in Achieving Regional Housing Needs Allocation (RHNA) One of the major requirements of the Housing Element process is the need to address the Regional Housing Needs Allocation from ABAG for the reporting period from 1999-2006. A total of 2,419 housing units were built during this period. The total difference between the RHNA numbers (4,348) and the actual number housing built or permitted is 1,929 units The chart below illustrates the City accomplished in meeting the housing goals during the last housing element period.
General Plan Housing Element Amendment and Negative Declaration Page 4
2002 Housing Element-RHNA (1999-2006) Units Built/
Permitted Regional Housing Needs Allocation
Percent Goal Achieved
Total Units 2,419 4,348 55.6% Very Low-Income 405 698 58.0% Low-Income 134 351 38.2% Moderate-Income 250 1,146 21.8% Above Moderate-Income 1,630 2,153 75.7% Current General Plan Housing Element and Negative Declaration (2009-2014) The current housing element will run from June 30, 2009 until December 31, 2014. During this time period, the City’s received a Regional Housing Needs Allocation of 2,487 units which includes the following income categories: Very Low Low Moderate Above
Moderate Total
City of Milpitas
689 421 441 936 2,487
Percentage Distribution
27.7% 16.9% 17.7% 37.6% 100%
The Milpitas RHNA allocation represents about four percent (4%) of the total Santa Clara County RHHA figure 60,338 housing units. The Draft Housing Element identifies enough adequate housing sites to meet the 2,487 RHNA target. The following is a list of new requirements that must be addressed in the Housing Element:
• Additional information regarding the identification of inventory for adequate housing sites • Zoning for a variety of housing types including special need populations “by right” instead of
by conditional use. This will require the City to amend the Zoning Ordinance in the near future to address this mandate.
• Must demonstrate that local government’s zoning, development standards and processing requirements encourage and facilitate all types of housing for farm-workers
• Required to identify residential districts in which manufacturing housing is allowed • Single Room Occupancy (SRO’s) will require the City to amend its Zoning Ordinance to permit
this type of residential use in select districts or it will require the City to adopt an SRO Ordinance
• Homeless and Transitional Shelters requires the City to identify residential zones for homeless shelters and transitional housing as a land use “by right”.
• Transitional and Permanent Housing, SB2 authorizes sites for supportive transitional and permanent housing need to be identified. This will also require future amend to the zoning ordinance.
Several of these Housing Element State mandated requirements are included in the current documents, whereas, others will require future zoning ordinance amendments.
General Plan Housing Element Amendment and Negative Declaration Page 5
The current housing element also includes several new policies for the Planning Commission and City Council’s consideration:
• Establishing the Lift Zone Program to improve local neighborhoods • Support housing to meet special needs (as required by the State) • Permit manufacturing homes in R1 zoning districts (as required by the State) • Explore the feasibility of encouraging new residential developers to provide space for future
childcare facilities. • Promote use of passive solar devices and promote energy audits in existing homes
Consideration for Above-Moderate Income Housing During the City Council’s review of the previous Housing Marketing Study, the Council directed staff to look at the potential for executive-luxury style homes within the City. A review of the City’s land use database provided by the County of Santa Clara Assessor’s Office and City data indicates that there are 29 vacant residentially designated sites where new luxury housing could be built. These sites are in scattered locations, with most of the site located in the hillside area. At the current General Plan and zoning densities, these sites could yield approximately 119 above moderate-income units. Based on the lot size and the existing homes in the vicinity, most of these sites would be appropriate for luxury single-family homes. The one existing underdeveloped parcel which has been identified in the Housing Element as a potentially housing site with 4.85 acres on North Park Victoria Drive (adjacent to the hillside area), which based on its location and size could potentially make a good candidate for luxury homes. It should also be note that the Planning Commission and City Council approved the Landmark Tower project which also could provide accommodate luxury homes with views. The pending redevelopment proposal for Milpitas Square with residential, professional office or hotel would also be a prime location for luxury housing. Environmental Review Process-Next Steps in the Process Because the General Plan Draft Housing Element Amendment is only conceptual until the City Council has approved the document and the document is sent to Housing and Community Development (HCD) to review and certify, no environmental action is required until HCD has commented on the Housing Element and staff has responded to their comments. Upon receipt, HCD has 60 days to review the documents. Staff will return at that time for Planning Commission and City Council final approval. Recommendation:
1) Open the Public Hearing and take Testimony. 2) Close the Public Hearing. 3) Approve the Conceptual General Plan Housing Element Update and forward recommendation to the City Council.
CITY OF MILPITAS
HOUSING ELEMENT UPDATE Public Review Draft
May 1, 2009
ATTACHMENT A
i
Table of Contents
I. INTRODUCTION.......................................................................................................... 1
A. Preparation of the Housing Element Update ......................................................................................................1
B. Public Participation in the Housing Element Update .........................................................................................2
II. ASSESSMENT OF PRIOR HOUSING ELEMENT...................................................... 4
A. Progress in Implementation of 2002 Housing Element Programs.....................................................................4
B. Progress in Achieving RHNA Goals......................................................................................................................8
III. HOUSING NEEDS ASSESSMENT............................................................................ 9
A. Population and Employment Trends ..................................................................................................................11 1) Population Growth..............................................................................................................................................11 2) Existing and Projected Employment ..................................................................................................................12 3) Projections of Population, Employed Residents and Employment.....................................................................13
B. Household Characteristics ...................................................................................................................................13 1) Number and Type of Households .......................................................................................................................13 2) Existing and Projected Incomes..........................................................................................................................14 3) Housing Cost Burdens ........................................................................................................................................17 4) Extremely Low-Income Households ..................................................................................................................19 5) Affordable Rental Costs and Home Prices .........................................................................................................20 6) Overcrowding .....................................................................................................................................................23
C. Housing Stock Characteristics.............................................................................................................................24 1) Information Sources ...........................................................................................................................................24 2) Housing Types and Occupancy Levels...............................................................................................................24 3) Overall Housing Conditions ...............................................................................................................................26 4) Targeted Housing Condition Survey ..................................................................................................................28 5) Rental Housing Costs, Trends, and Affordability...............................................................................................30 6) Homeownership Costs, Trends, and Affordability .............................................................................................32
D. Special Housing Needs..........................................................................................................................................34 1) Elderly Households ............................................................................................................................................34 2) Persons with Disabilities ....................................................................................................................................40 3) Large Households...............................................................................................................................................42 4) Female-Headed Households ...............................................................................................................................45 5) Farmworkers.......................................................................................................................................................46 6) Homeless ............................................................................................................................................................47
E. Opportunities for Energy Conservation .............................................................................................................50
F. Affordable Housing and at Risk Projects............................................................................................................51 1) Inventory of Existing Affordable Units .............................................................................................................51 2) At-Risk Projects.................................................................................................................................................54
ii
IV. SITES INVENTORY................................................................................................. 57
A. Projected Housing Needs......................................................................................................................................57
B. Sites Inventory.......................................................................................................................................................57
C. Additional Considerations ..................................................................................................................................69 1) Site Considerations for Above Moderate-Income Households..........................................................................69 2) Adequacy of Infrastructure and Services...........................................................................................................69 3) Environmental Constraints ................................................................................................................................70
C. Zoning for a Variety of Housing Types...............................................................................................................71 1) Farmworker Housing..........................................................................................................................................71 2) Manufactured Housing .......................................................................................................................................72 3) SRO Housing......................................................................................................................................................72 4) Homeless Shelters and Transitional Housing .....................................................................................................73 5) Transitional and Permanent Supportive Housing ...............................................................................................73
D. Housing Resources...............................................................................................................................................73 1) Federal Programs................................................................................................................................................73 2) State Programs...................................................................................................................................................74 3) Local Programs..................................................................................................................................................76
V. HOUSING CONSTRAINTS ..................................................................................... 78
A. Introduction ..........................................................................................................................................................78
B. Potential Government Constraints.....................................................................................................................78 1) General Plan .......................................................................................................................................................78 2) Zoning Ordinance...............................................................................................................................................79 3) Site Development Standards...............................................................................................................................83 4) Standards for Second Units ................................................................................................................................85 5) Urban Growth Boundary ....................................................................................................................................86 6) Density Bonus Law ...........................................................................................................................................87 7) Building Codes and Enforcement......................................................................................................................88 8) Site Improvement Requirements .......................................................................................................................89 9) Design Review...................................................................................................................................................89 10) Permit Processing .............................................................................................................................................90 11) Development Fees ...........................................................................................................................................91 12) State of California Article 34...........................................................................................................................93 13) Infrastructure and Public Facility Constraints .................................................................................................93 14) Environmental Constraints ...............................................................................................................................97
C. Assessment of Potential Barriers........................................................................................................................98
D. Housing for Persons with Disabilities ................................................................................................................99
E. Potential Non-Governmental Constraints .......................................................................................................100 1) Land Costs .......................................................................................................................................................100 2) Construction Costs............................................................................................................................................100 3) Financing ..........................................................................................................................................................101 4) Housing Production Costs ................................................................................................................................102 5) Affordable Housing Constraints .......................................................................................................................102
iii
G) Policies to Overcome Constraints ...................................................................................................................105
VI. HOUSING PLAN ................................................................................................... 106
A. Identification of Adequate Sites........................................................................................................................106
B. Housing & Neighborhood Conservation ..........................................................................................................107
C. New Housing Production...................................................................................................................................109
D. Housing Diversity and Affordability................................................................................................................110
E. Fair Housing.......................................................................................................................................................113
F. Energy Conservation Opportunities.................................................................................................................113
G. Remove Government Constraints ....................................................................................................................114
VII. FIVE-YEAR IMPLEMENTATION PLAN.............................................................. 116
VIII. QUANTIFIED OBJECTIVES ............................................................................... 122
IX. OTHER REQUIREMENTS .................................................................................... 123
A. Consistency with the General Plan and Other Planning Documents .............................................................123 1) General Plan .....................................................................................................................................................123 2) City of Milpitas Consolidated Plan...................................................................................................................123 3) City of Milpitas Redevelopment Agency Implementation Plan .......................................................................123
B. Notification of Housing Element to Water and Sewer Providers ..................................................................123
C. Review of Conservation and Safety Elements Pursuant to AB 162...............................................................124
CITY OF MILPITAS 2009-2014 HOUSING ELEMENT UPDATE BIBLIOGRAPHY... 125
APPENDIX A: HOUSING ELEMENT UPDATE PUBLIC MEETINGS........................ A-1
APPENDIX B: MILPITAS HOUSING ELEMENT ACCOMPLISHMENTS (1999-2006) ………………………………………………………………………………………………….B-1
APPENDIX C: METHODOLOGY FOR MILPITAS HOUSING CONDITION SURVEY, 2008 ............................................................................................................................ C-1
APPENDIX D: GLOSSARY OF TERMS.................................................................... D-1
iv
List of Tables Table II.1: Summary of 2002 Housing Element Accomplishments .............................................. 6 Table II.2: Comparison of Regional Housing Needs Allocation with Units Built or Permitted City of Milpitas (1999-2006) .......................................................................................................... 8 Table III.1: Population Information for Milpitas and Santa Clara County (2000-2008)............. 11 Table III.2: Age of Population in Milpitas and Santa Clara County, 2008 .................................. 12 Table III.3: Job Growth by Employment Sector, City of Milpitas (2005-2015) ......................... 12 Table III.4: Summary of Population, Employed Residents and Employment Projections, Milpitas Sphere of Influence (2005-2015).................................................................................... 13 Table III.5: Household Information for Milpitas and Santa Clara County (2000-2008)............. 14 Table III.6: Household Composition for Milpitas and Santa Clara County, 2008 ....................... 14 Table III.7: Income Distribution in Milpitas (1999-2008)............................................................ 15 Table III.8: Mean Household Income in Constant Dollars for Milpitas and Santa Clara County (2000-2005)................................................................................................................................... 16 Table III.9: Definitions of Income Categories for Milpitas and Santa Clara County, Based on State Income Limits ...................................................................................................................... 16 Table III.10: Milpitas Housing Costs as a Percentage of Income, by Household Income and Tenure, 1999 ................................................................................................................................. 18 Table III.11: Housing Cost Burdens for Lower-Income Households in 1999, City of Milpitas and Santa Clara County ....................................................................................................................... 19 Table III.12: Housing Cost Burdens for Extremely Low-Income Households, City of Milpitas, 1999............................................................................................................................................... 20 Table III.13: Ability to Pay for Housing by Income Level, City of Milpitas, 2008 ..................... 22 Table III.14: Overcrowding by Tenure, City of Milpitas and Santa Clara County, 2000 ............ 23 Table III.15: Housing Stock by Type and Vacancy for Milpitas and Santa Clara County (2000-2008) ............................................................................................................................................. 26 Table III.16: Age of Housing Stock, City of Milpitas, 2008 ........................................................ 27 Table III.17: Overall Property Conditions, Housing Survey ........................................................ 29 Table III.18: Property Condition by Structure Type..................................................................... 29 Table III.19: Fair Market Rents and Average Advertised Rents, City of Milpitas, 2008............. 31 Table III.20: Changes in Single Family Sales Prices in Milpitas (2001-2008) ............................ 32 Table III.21: Changes in Condominium Sales Prices in Milpitas (2001-2008)............................ 33 Table III.22: Growth in Senior Population in Milpitas and Santa Clara County (2000-2008)..... 34 Table III.23: Estimated Growth in Senior Households by Tenure in Milpitas (2000-2008)........ 35 Table III.24: Housing Cost Burdens for One-to-Two Person Senior-Headed Households, City of Milpitas, 1999 ............................................................................................................................... 36 Table III.25: One-to-Two Person Senior Headed Households, by Income and Tenure, City of Milpitas, 1999 ............................................................................................................................... 36 Table III.26: Incidence of High Cost Burdens among Lower-Income, Senior Headed Households with One to Two Persons, City of Milpitas, 1999 ........................................................................ 37 Table III.27: Disabled Population Five Years and Older, City of Milpitas, 2000........................ 40 Table III.28: Types of Disabilities for Persons Five Years and Older, Milpitas, 2000 ................ 40 Table III.29: Large Households in Milpitas, 2008........................................................................ 43 Table III.30: Number of Bedrooms in Milpitas Housing Units, by Tenure, 2000 ....................... 44
v
Table III.31: Income Levels of Large Households with Five or More Related Persons, by Tenure, Milpitas, 1999 ............................................................................................................................... 44 Table III.32: Female-Headed Family Households in Milpitas (2000-2008) ................................ 46 Table III.33: Estimated Homelessness in Santa Clara County, 2007 ........................................... 47 Table III.34: Estimated Homeless Subpopulations in Santa Clara County, 2007 ........................ 48 Table III.35: Subsidized and Restricted Affordable Housing in Milpitas, 2009 ......................... 52 Table III.36: Comparison of Costs to Preserve or Replace 149 Affordable Units at Sunnyhills Apartments.................................................................................................................................... 55 Table IV.1: Milpitas Regional Housing Needs Allocation by Income, 2007-2014...................... 57 Table IV.2: Summary of Current Milpitas Residential Development Projects Compared with RHNA Numbers (2009)................................................................................................................ 58 Table IV.3: Summary of Potential Sites for Single and Multifamily Housing, City of Milpitas 60 Table IV.4: List of Additional Potential Housing Sites, City of Milpitas ................................... 62 Table IV.5: List of New Projects - Under Construction, Approved, and Planned - City of Milpitas March 2009..................................................................................................................... 67 Table IV.6: Projects Receiving Assistance from the City of Milpitas Housing 1999-2009........ 77 Table V.1: Residential Zoning District Regulations..................................................................... 81 Table V.2: Residential Zoning District Regulations as Modified by Overlay Districts ............... 82 Table V.3: Residential Land Use Zoning Heights and Setbacks .................................................. 84 Table V.4: Residential Land Use Zoning Heights and Setbacks as Modified by Overlay Districts....................................................................................................................................................... 85 Table V.5: Milpitas Density Bonus Law ..................................................................................... 88 Table V.6: City of Milpitas Residential Development Fees ........................................................ 92 Table V.7: Estimated Development Costs of a Single Family House, City of Milpitas............ 101 Table V.8: Redevelopment Agency and City of Milpitas Assistance for Affordable Housing Units............................................................................................................................................ 104 Table VII.1: Five-Year Implementation Plan ............................................................................ 117 Table VIII.1: Summary of Quantified Objectives, City of Milpitas (2007-2014)..................... 122
List of Figures Figure IV.1: Location Map of Potential Sites for New Residential Development .......................61 Figure IV.2: Location Map of Current Residential Projects .........................................................66
1
I. INTRODUCTION
A. Preparation of the Housing Element Update In accordance with California State Law, California cities must have an adopted General Plan and the General Plan must contain a Housing Element. While all elements of a General Plan are reviewed and revised regularly to ensure that the plan remains current, state law requires that the Housing Element be updated every five years. State law also dictates the issues that the Housing Element must address and furthermore requires the element to be reviewed by the California Department of Housing and Community Development (HCD) to assure that it meets the minimum requirements established by Government Code §65580-65589.8. This process is commonly referred to as “certifying” the Housing Element. The major requirement for the Housing Element is that it requires cities to plan to meet their existing and projected housing needs including their share of the regional housing need. The Association of Bay Area Governments (ABAG) recently completed the Regional Housing Needs Allocation (RHNA). As part of this process, ABAG worked with regional and local governments to develop a methodology for distributing the nine-county Bay Area's housing need (as determined by HCD) to all local governments in the region. Each city and county has received an allocation of housing units, broken down by income categories. Cities and counties must identify adequate sites zoned at adequate densities to meet this housing allocation, also referred to as the RHNA numbers. The planning period for this version of the Housing Element is 2009-2014. In response to the allocations, each city and county in the Bay Area will have to review, update and adopt its Housing Element by June 30, 2009. The prior Milpitas Housing Element, certified by HCD in 2002, is the basis for the current Housing Element update. However, all sections in the 2002 Housing Element have been reviewed and updated for several reasons. First, since the last housing element, there have been changes in State law. These changes affect a number of sections in the housing element. For example, State law now requires much more detailed information about available housing sites, including identification of sites that can be used for special housing needs, for example, units targeted to extremely low-income households, the disabled, and the homeless. Also, there is more of an emphasis on energy conservation for new construction and rehabilitation. Secondly, the City of Milpitas has undergone changes since the 2002 Housing Element. For example, a Transit Specific Plan has been adopted, and the Zoning Ordinance has been updated to reflect requirements of both the Midtown and the Transit Area Specific Plans These changes
2
include increased densities and reduced parking requirements. New policies adopted by the City represent the development approach encouraged by HCD, since they are helpful in promoting in-fill development and transit use. Thus, Milpitas is in a good position to comply with the latest Housing Element requirements.
B. Public Participation in the Housing Element Update The City held two public meetings in November 2008. The first, held on November 6, 2008 was with housing professionals. The second meeting open to the general public was held on November 13, 2008. Both meetings were noticed on the City’s website and in the local newspaper. In addition, the City created a lengthy list of housing professionals who were sent invitations to the November 6th meeting via email. A small group showed up at the housing professionals meeting, and a slightly larger group attended the public meeting. The purpose of these public meetings was to provide comments on housing policy to the Planning Department staff and consultant for consideration in the preparation of the preliminary draft Housing Element. Summary comments from these meetings are presented in Appendix A to the Housing Element. At the public meeting, questionnaires were distributed to participants to learn more about housing needs, problems and possible strategies to address problems. Subsequently, this questionnaire was distributed electronically to the list of housing professionals. In addition to these public meetings, information on the Housing Element Update was posted on the City’s website. Residents were encouraged to contact the Planning & Neighborhood Services Department with comments and questions. In addition, to these public meetings, background research was conducted as part of the Housing Element preparation process. This background work included interviews with numerous staff from the City of Milpitas, the County of Santa Clara, and as well as staff at a variety of social service agencies and other interested organizations that serve the Milpitas community. The names of these organizations are presented in the Bibliography attached to the Housing Element. Finally, before the adoption of the draft Housing Element, the Planning Commission and the City Council will conduct public hearings in May and June. Following this introduction, the Housing Element includes the following major components:
• A review of the prior (2002) housing element, including an analysis of housing production in comparison to mandated housing goals.
3
• An analysis of the City’s current and future housing needs. • An inventory and analysis of housing resources. • An analysis of governmental and non-governmental constraints to housing production. • A housing plan setting forth goals, policies, programs and quantified objectives to
address the City’s housing needs.
4
II. ASSESSMENT OF PRIOR HOUSING ELEMENT This chapter reviews and evaluates the City’s progress in implementing the 2002 Housing Element’s programs. In addition, it analyzes the difference between projected housing need (as defined by the RHNA numbers) and actual housing production between 1999 and 2006. The City of Milpitas supports affordable housing and is strongly committed to facilitating a diversity of housing types. These commitments are observed in a number of ways. For example, during the last housing element period, the City provided support to three subsidized housing developments (DeVries Place Senior Housing, Aspen Family Apartments, and Senior Solutions’ group homes). In addition, as part of the affordable housing agreement between a new market rate project at Town Center and the City of Milpitas, the City required that the developer pay for the rehabilitation of four units. These units are now rent restricted for 55 years and are part of the City’s affordable housing supply for very low-income households. Finally, the City’s Zoning Code encourages that twenty percent of all market rate housing be affordable and allows densities of up to 75 units per acre in the Transit Oriented Development Overlay District (TOD) areas. The following sections present information on the progress made by Milpitas in its implementation of the housing programs set forth in the 2002 Housing Element, as well as its progress in achieving its 1999-2006 RHNA goals.
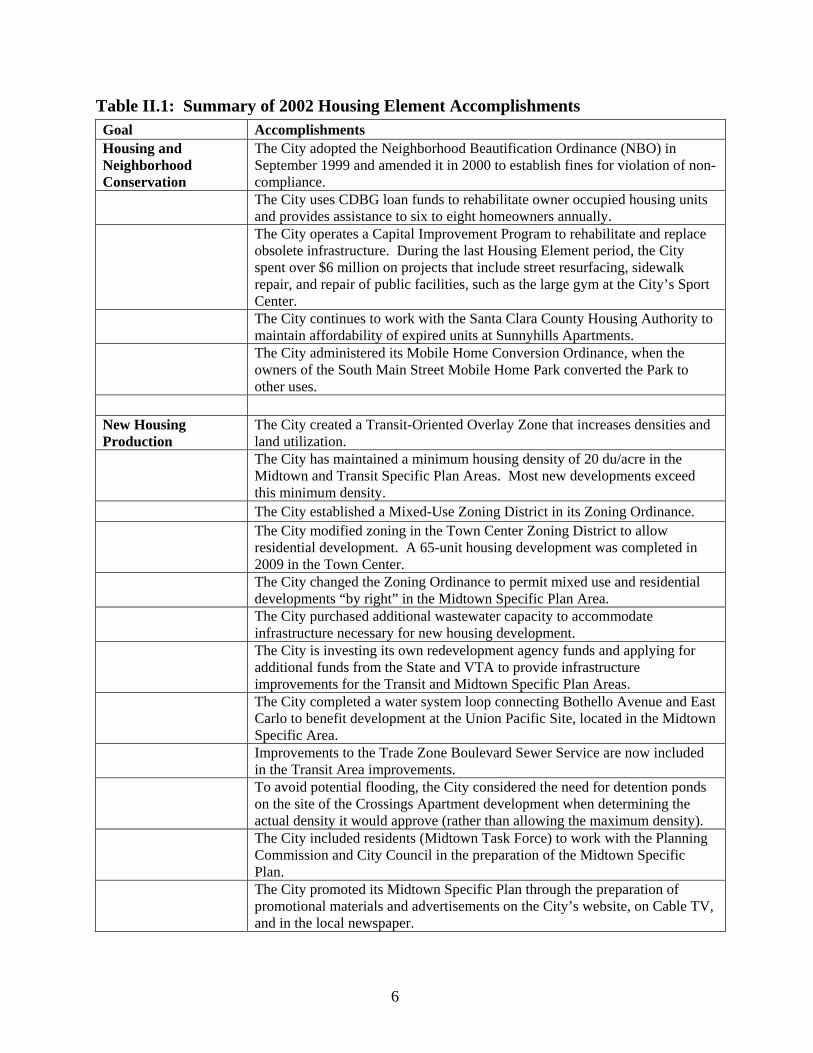
A. Progress in Implementation of 2002 Housing Element Programs Table II.1 provides a summary of the 2002 Housing Element’s accomplishments. A detailed list and assessment of the housing programs included in the last Housing Element is provided in Appendix B. The City of Milpitas has established a strong housing program. At the center of its strategy is the creation of the Midtown and Transit Specific Plan Areas. These Specific Plan areas provide the following benefits for new market rate and affordable housing production:
• The City changed its Zoning Ordinance to accommodate high density residential and mixed use zones. These zoning designations establish a minimum density (ranging from 21 to 41 units per acre) and maximum densities, ranting from 20 to 60 units per acre. Builders have been active in these residential zones, attracted to the high density zoning that is not provided by other Silicon Valley Cities.
• The City adopted a Transit-Oriented Overlay Zone that increases the maximum densities in the high density residential zones to 75 units per acre (R5 and MXD3) and decreases
5
parking requirements. • The Transit Area Specific Plan EIR was completed during this time period and can be
used as a programmatic environmental document for future residential development in the Transit Area Specific Plan Area.
• The City helps pay for needed infrastructure in these two specific plan areas to facilitate residential development.
Other achievements include successful implementation of the condominium and mobile home conversion ordinances to protect renters, operation of programs that rehabilitate and retrofit housing units, and the provision of financial assistance for facilities and services that help the homeless. Finally, the City has adopted policies to encourage that twenty percent of all new housing units be affordable in new developments. To help developers comply with this requirement, the City provides funds for mortgage financing, impact fees, and loans to help projects located in the redevelopment area comply with the affordable housing requirement. There are many policies and programs from the 2002 Housing Element Update that will be carried forward to the 2009-2014 Housing Element Update. These are presented in Chapter VI of the updated Housing Element.
6
Table II.1: Summary of 2002 Housing Element Accomplishments Goal Accomplishments Housing and Neighborhood Conservation
The City adopted the Neighborhood Beautification Ordinance (NBO) in September 1999 and amended it in 2000 to establish fines for violation of non-compliance.
The City uses CDBG loan funds to rehabilitate owner occupied housing units and provides assistance to six to eight homeowners annually.
The City operates a Capital Improvement Program to rehabilitate and replace obsolete infrastructure. During the last Housing Element period, the City spent over $6 million on projects that include street resurfacing, sidewalk repair, and repair of public facilities, such as the large gym at the City’s Sport Center.
The City continues to work with the Santa Clara County Housing Authority to maintain affordability of expired units at Sunnyhills Apartments.
The City administered its Mobile Home Conversion Ordinance, when the owners of the South Main Street Mobile Home Park converted the Park to other uses.
New Housing Production
The City created a Transit-Oriented Overlay Zone that increases densities and land utilization.
The City has maintained a minimum housing density of 20 du/acre in the Midtown and Transit Specific Plan Areas. Most new developments exceed this minimum density.
The City established a Mixed-Use Zoning District in its Zoning Ordinance.
The City modified zoning in the Town Center Zoning District to allow residential development. A 65-unit housing development was completed in 2009 in the Town Center.
The City changed the Zoning Ordinance to permit mixed use and residential developments “by right” in the Midtown Specific Plan Area.
The City purchased additional wastewater capacity to accommodate infrastructure necessary for new housing development.
The City is investing its own redevelopment agency funds and applying for additional funds from the State and VTA to provide infrastructure improvements for the Transit and Midtown Specific Plan Areas.
The City completed a water system loop connecting Bothello Avenue and East Carlo to benefit development at the Union Pacific Site, located in the Midtown Specific Area.
Improvements to the Trade Zone Boulevard Sewer Service are now included in the Transit Area improvements.
To avoid potential flooding, the City considered the need for detention ponds on the site of the Crossings Apartment development when determining the actual density it would approve (rather than allowing the maximum density).
The City included residents (Midtown Task Force) to work with the Planning Commission and City Council in the preparation of the Midtown Specific Plan.
The City promoted its Midtown Specific Plan through the preparation of promotional materials and advertisements on the City’s website, on Cable TV, and in the local newspaper.
7
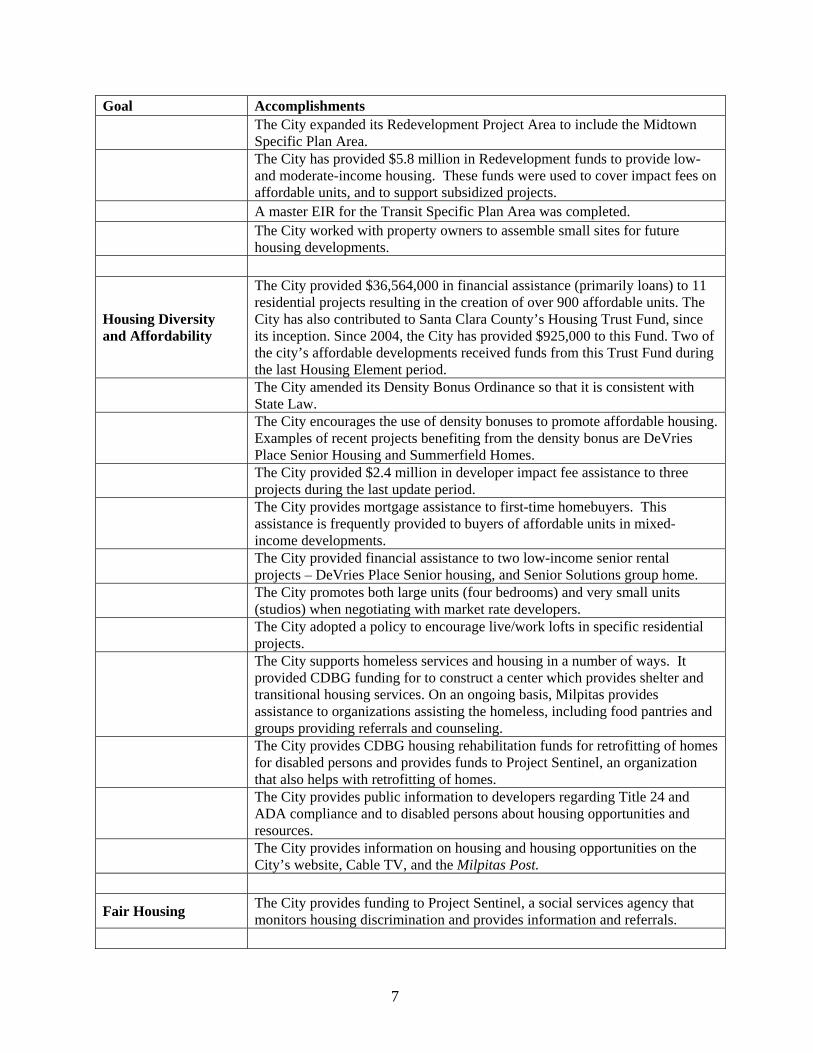
Goal Accomplishments
The City expanded its Redevelopment Project Area to include the Midtown Specific Plan Area.
The City has provided $5.8 million in Redevelopment funds to provide low- and moderate-income housing. These funds were used to cover impact fees on affordable units, and to support subsidized projects.
A master EIR for the Transit Specific Plan Area was completed.
The City worked with property owners to assemble small sites for future housing developments.
Housing Diversity and Affordability
The City provided $36,564,000 in financial assistance (primarily loans) to 11 residential projects resulting in the creation of over 900 affordable units. The City has also contributed to Santa Clara County’s Housing Trust Fund, since its inception. Since 2004, the City has provided $925,000 to this Fund. Two of the city’s affordable developments received funds from this Trust Fund during the last Housing Element period.
The City amended its Density Bonus Ordinance so that it is consistent with State Law.
The City encourages the use of density bonuses to promote affordable housing. Examples of recent projects benefiting from the density bonus are DeVries Place Senior Housing and Summerfield Homes.
The City provided $2.4 million in developer impact fee assistance to three projects during the last update period.
The City provides mortgage assistance to first-time homebuyers. This assistance is frequently provided to buyers of affordable units in mixed-income developments.
The City provided financial assistance to two low-income senior rental projects – DeVries Place Senior housing, and Senior Solutions group home.
The City promotes both large units (four bedrooms) and very small units (studios) when negotiating with market rate developers.
The City adopted a policy to encourage live/work lofts in specific residential projects.
The City supports homeless services and housing in a number of ways. It provided CDBG funding for to construct a center which provides shelter and transitional housing services. On an ongoing basis, Milpitas provides assistance to organizations assisting the homeless, including food pantries and groups providing referrals and counseling.
The City provides CDBG housing rehabilitation funds for retrofitting of homes for disabled persons and provides funds to Project Sentinel, an organization that also helps with retrofitting of homes.
The City provides public information to developers regarding Title 24 and ADA compliance and to disabled persons about housing opportunities and resources.
The City provides information on housing and housing opportunities on the City’s website, Cable TV, and the Milpitas Post.
Fair Housing The City provides funding to Project Sentinel, a social services agency that monitors housing discrimination and provides information and referrals.
8
Goal Accomplishments
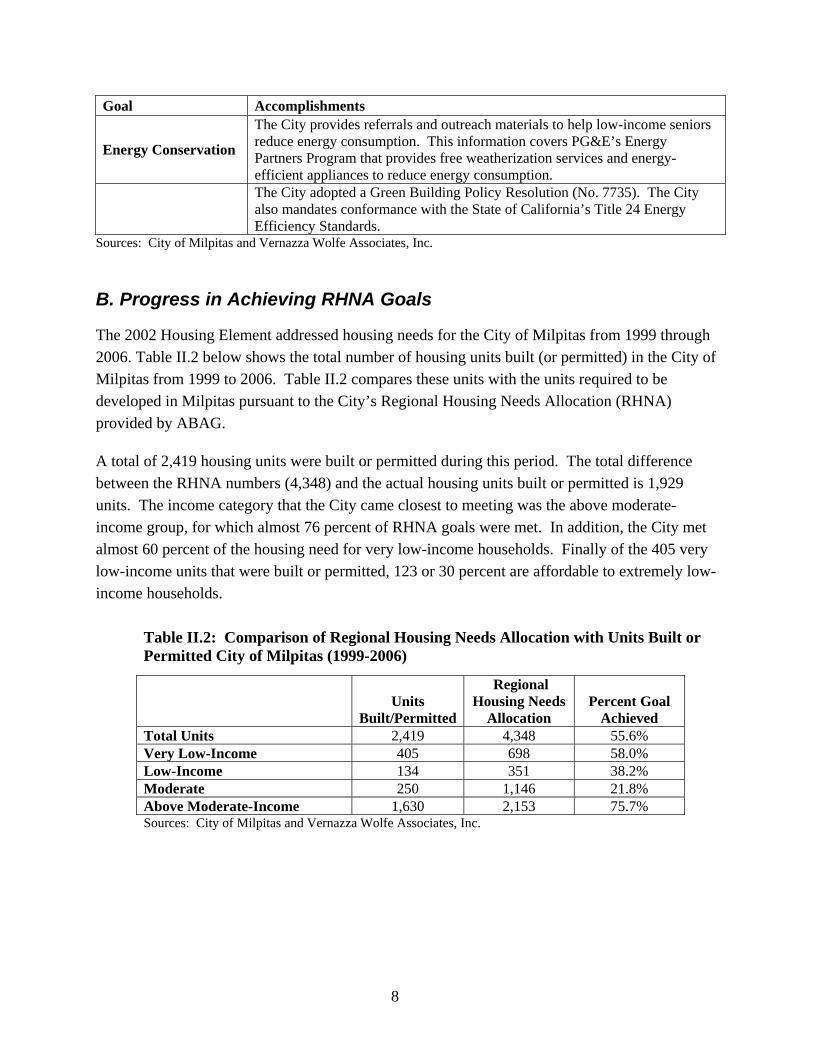
Energy Conservation
The City provides referrals and outreach materials to help low-income seniors reduce energy consumption. This information covers PG&E’s Energy Partners Program that provides free weatherization services and energy-efficient appliances to reduce energy consumption.
The City adopted a Green Building Policy Resolution (No. 7735). The City also mandates conformance with the State of California’s Title 24 Energy Efficiency Standards.
Sources: City of Milpitas and Vernazza Wolfe Associates, Inc.
B. Progress in Achieving RHNA Goals
The 2002 Housing Element addressed housing needs for the City of Milpitas from 1999 through 2006. Table II.2 below shows the total number of housing units built (or permitted) in the City of Milpitas from 1999 to 2006. Table II.2 compares these units with the units required to be developed in Milpitas pursuant to the City’s Regional Housing Needs Allocation (RHNA) provided by ABAG.
A total of 2,419 housing units were built or permitted during this period. The total difference between the RHNA numbers (4,348) and the actual housing units built or permitted is 1,929 units. The income category that the City came closest to meeting was the above moderate-income group, for which almost 76 percent of RHNA goals were met. In addition, the City met almost 60 percent of the housing need for very low-income households. Finally of the 405 very low-income units that were built or permitted, 123 or 30 percent are affordable to extremely low-income households.
Table II.2: Comparison of Regional Housing Needs Allocation with Units Built or Permitted City of Milpitas (1999-2006)
Units
Built/Permitted
Regional Housing Needs
Allocation Percent Goal
Achieved Total Units 2,419 4,348 55.6% Very Low-Income 405 698 58.0% Low-Income 134 351 38.2% Moderate 250 1,146 21.8% Above Moderate-Income 1,630 2,153 75.7% Sources: City of Milpitas and Vernazza Wolfe Associates, Inc.
9
III. HOUSING NEEDS ASSESSMENT The purpose of the Housing Needs Assessment is to describe housing, economic, and demographic conditions in Milpitas, assess the demand for housing for households at all income levels, and document the demand for housing to serve various special needs populations. The Housing Needs Assessment also provides information on opportunities for energy conservation and analysis of any assisted housing projects at-risk of converting to market rate projects. The Housing Needs Assessment is intended to assist Milpitas in developing housing goals and formulating policies and programs that address local housing needs. At the present time, there is no single source of information to use to describe existing demographic and housing conditions, since the 2000 Census information is out-dated, and the next Census will not be conducted until 2010. Consequently, several sources of information were used to describe existing conditions in Milpitas. These include the following:
• The 2000 Census, supplemented by 2008 estimates provided by Claritas, Inc. and housing unit estimates provided by the State of California, Department of Finance, provides information on population, number of households, household size, vacancy rates, and other demographic and housing characteristics.
• ABAG 2007 Projections provides employment and income projections. • Other sources of economic information such as information from the Employment
Development Department, website rental listings, multiple listing service, and other published data.
• Interviews with key informants provided information on special needs housing. Finally, to facilitate an understanding of how the characteristics of Milpitas are similar to, or different from, other nearby communities, this Housing Needs Assessment presents some comparative data for all of Santa Clara County. A summary of relevant trends in demographic, economic, and housing conditions based on the detailed analyses in the Chapter is presented below.
10
Demographic Trends
• The City continued to add population between 2000 and 2008, reaching an estimated population figure of 65,754 in 2008. The number of households also grew during the same time period.
• Almost half the City’s population is below 35 years of age. • Milpitas remains a family oriented city. For example, the average household size of 3.5
persons is higher in Milpitas than in Santa Clara Count and over 80 percent of all households are family households.
• While nominal median income rose between 2000 and 2008 (from $84,429 to $97,870), real household incomes (adjusted for inflation) have dropped.
• About one-third of all Milpitas households pay more than 30 percent of their income on housing costs. This percentage is higher for lower-income and extremely low-income households, as well as for renters.
Employment Growth
• Employment growth between 2005 and 2015 is expected to reach 11 percent, or an increase of over 5,000 jobs.
• The growth in employed residents will exceed growth in population or growth in employment, so that there should be a better jobs/housing imbalance by 2015.
Housing Trends
• While only about 20 percent of Milpitas households live in overcrowded units (as defined by standards provided by Department of Housing and Urban Development [HUD] standards), the percentage of renters in overcrowded units is more than double the percentage of owners living in overcrowded units.1
• Almost 60 percent of all housing units are currently single family units. However, this ratio will decline, since the majority of new residential development projects are multifamily properties.
• The ratio of owners to renters is higher in Milpitas than in the County; 70 percent of Milpitas households own their own homes.
• Over half of all housing units were constructed since 1970. Aside from isolated pockets, the housing stock is in good condition.
• Starting in 2006, average rents started to increase. In comparison, sales prices have decreased since 2006.
1 According to HUD, a unit is overcrowded if there are more than 1.01 persons per room.
11
• Housing affordability continues to be a problem for lower-income households. • There continues to be more demand than supply for affordable senior housing, larger
housing units, and housing for other special needs groups, such as the disabled and the homeless.
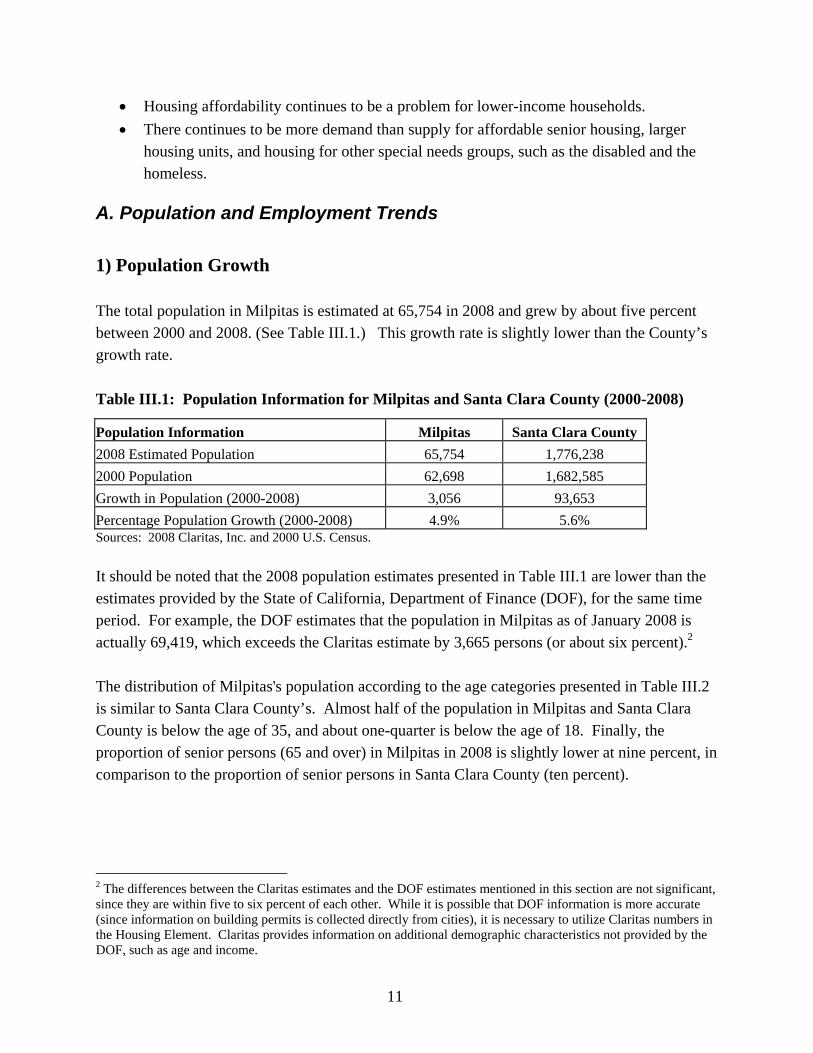
A. Population and Employment Trends 1) Population Growth The total population in Milpitas is estimated at 65,754 in 2008 and grew by about five percent between 2000 and 2008. (See Table III.1.) This growth rate is slightly lower than the County’s growth rate. Table III.1: Population Information for Milpitas and Santa Clara County (2000-2008)
Population Information Milpitas Santa Clara County 2008 Estimated Population 65,754 1,776,238 2000 Population 62,698 1,682,585 Growth in Population (2000-2008) 3,056 93,653 Percentage Population Growth (2000-2008) 4.9% 5.6% Sources: 2008 Claritas, Inc. and 2000 U.S. Census. It should be noted that the 2008 population estimates presented in Table III.1 are lower than the estimates provided by the State of California, Department of Finance (DOF), for the same time period. For example, the DOF estimates that the population in Milpitas as of January 2008 is actually 69,419, which exceeds the Claritas estimate by 3,665 persons (or about six percent).2 The distribution of Milpitas's population according to the age categories presented in Table III.2 is similar to Santa Clara County’s. Almost half of the population in Milpitas and Santa Clara County is below the age of 35, and about one-quarter is below the age of 18. Finally, the proportion of senior persons (65 and over) in Milpitas in 2008 is slightly lower at nine percent, in comparison to the proportion of senior persons in Santa Clara County (ten percent).
2 The differences between the Claritas estimates and the DOF estimates mentioned in this section are not significant, since they are within five to six percent of each other. While it is possible that DOF information is more accurate (since information on building permits is collected directly from cities), it is necessary to utilize Claritas numbers in the Housing Element. Claritas provides information on additional demographic characteristics not provided by the DOF, such as age and income.
12
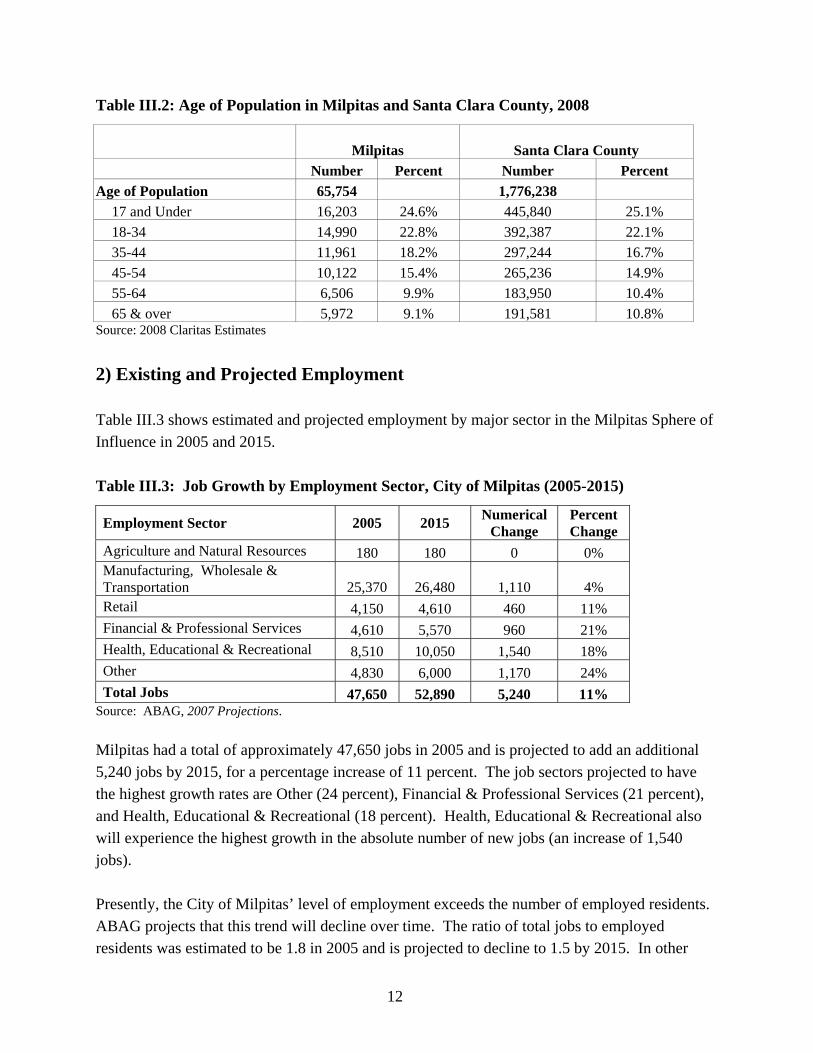
Table III.2: Age of Population in Milpitas and Santa Clara County, 2008
Milpitas Santa Clara County
Number Percent Number Percent Age of Population 65,754 1,776,238
17 and Under 16,203 24.6% 445,840 25.1% 18-34 14,990 22.8% 392,387 22.1% 35-44 11,961 18.2% 297,244 16.7% 45-54 10,122 15.4% 265,236 14.9% 55-64 6,506 9.9% 183,950 10.4% 65 & over 5,972 9.1% 191,581 10.8%
Source: 2008 Claritas Estimates
2) Existing and Projected Employment Table III.3 shows estimated and projected employment by major sector in the Milpitas Sphere of Influence in 2005 and 2015. Table III.3: Job Growth by Employment Sector, City of Milpitas (2005-2015)
Employment Sector 2005 2015 Numerical Change
Percent Change
Agriculture and Natural Resources 180 180 0 0% Manufacturing, Wholesale & Transportation 25,370 26,480 1,110 4% Retail 4,150 4,610 460 11% Financial & Professional Services 4,610 5,570 960 21% Health, Educational & Recreational 8,510 10,050 1,540 18% Other 4,830 6,000 1,170 24% Total Jobs 47,650 52,890 5,240 11%
Source: ABAG, 2007 Projections. Milpitas had a total of approximately 47,650 jobs in 2005 and is projected to add an additional 5,240 jobs by 2015, for a percentage increase of 11 percent. The job sectors projected to have the highest growth rates are Other (24 percent), Financial & Professional Services (21 percent), and Health, Educational & Recreational (18 percent). Health, Educational & Recreational also will experience the highest growth in the absolute number of new jobs (an increase of 1,540 jobs). Presently, the City of Milpitas’ level of employment exceeds the number of employed residents. ABAG projects that this trend will decline over time. The ratio of total jobs to employed residents was estimated to be 1.8 in 2005 and is projected to decline to 1.5 by 2015. In other
13
words, for every employed resident in Milpitas in 2005, there were 1.8 jobs, and this number is projected to decline to 1.5 jobs per employed resident by 2015.
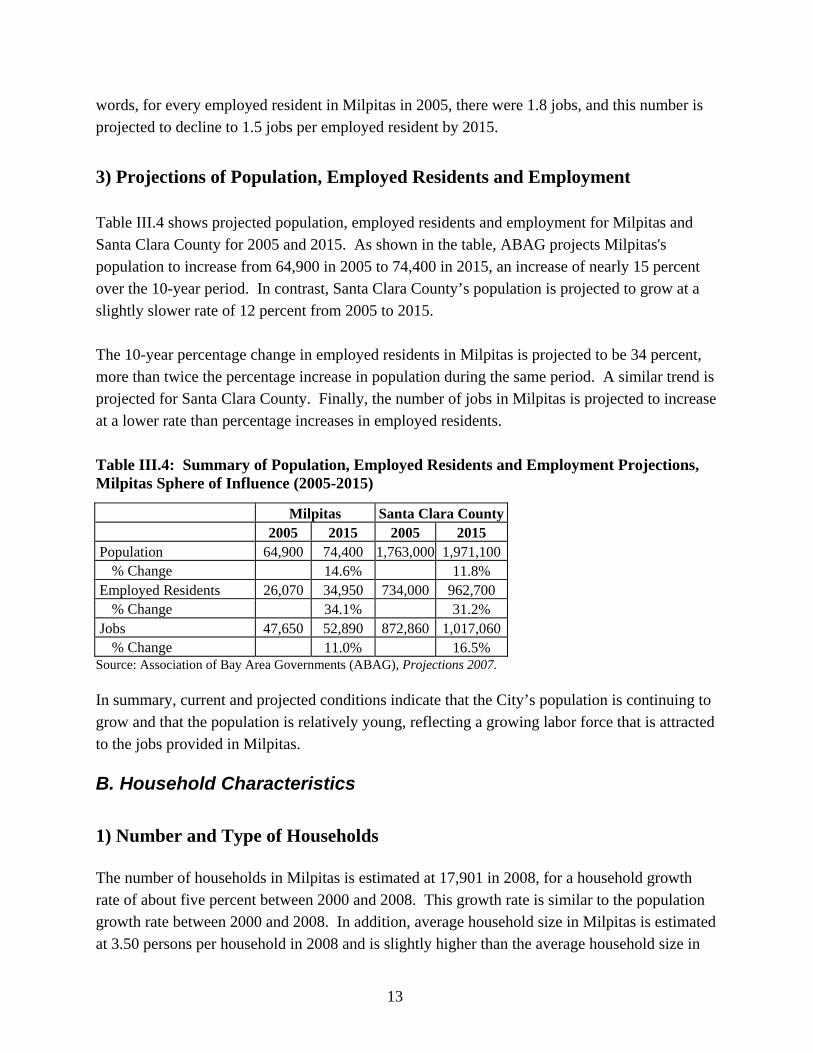
3) Projections of Population, Employed Residents and Employment Table III.4 shows projected population, employed residents and employment for Milpitas and Santa Clara County for 2005 and 2015. As shown in the table, ABAG projects Milpitas's population to increase from 64,900 in 2005 to 74,400 in 2015, an increase of nearly 15 percent over the 10-year period. In contrast, Santa Clara County’s population is projected to grow at a slightly slower rate of 12 percent from 2005 to 2015. The 10-year percentage change in employed residents in Milpitas is projected to be 34 percent, more than twice the percentage increase in population during the same period. A similar trend is projected for Santa Clara County. Finally, the number of jobs in Milpitas is projected to increase at a lower rate than percentage increases in employed residents. Table III.4: Summary of Population, Employed Residents and Employment Projections, Milpitas Sphere of Influence (2005-2015)
Milpitas Santa Clara County 2005 2015 2005 2015 Population 64,900 74,400 1,763,000 1,971,100
% Change 14.6% 11.8% Employed Residents 26,070 34,950 734,000 962,700
% Change 34.1% 31.2% Jobs 47,650 52,890 872,860 1,017,060
% Change 11.0% 16.5% Source: Association of Bay Area Governments (ABAG), Projections 2007. In summary, current and projected conditions indicate that the City’s population is continuing to grow and that the population is relatively young, reflecting a growing labor force that is attracted to the jobs provided in Milpitas.
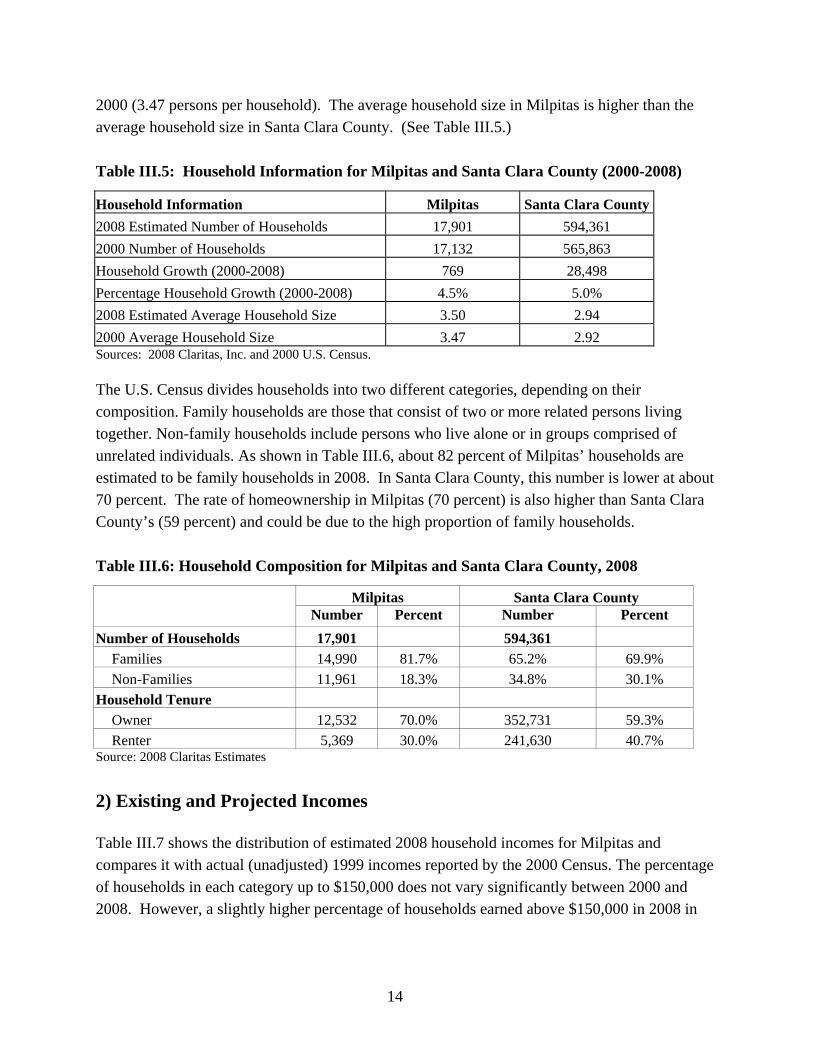
B. Household Characteristics 1) Number and Type of Households The number of households in Milpitas is estimated at 17,901 in 2008, for a household growth rate of about five percent between 2000 and 2008. This growth rate is similar to the population growth rate between 2000 and 2008. In addition, average household size in Milpitas is estimated at 3.50 persons per household in 2008 and is slightly higher than the average household size in
14
2000 (3.47 persons per household). The average household size in Milpitas is higher than the average household size in Santa Clara County. (See Table III.5.) Table III.5: Household Information for Milpitas and Santa Clara County (2000-2008)
Household Information Milpitas Santa Clara County 2008 Estimated Number of Households 17,901 594,361 2000 Number of Households 17,132 565,863 Household Growth (2000-2008) 769 28,498 Percentage Household Growth (2000-2008) 4.5% 5.0% 2008 Estimated Average Household Size 3.50 2.94 2000 Average Household Size 3.47 2.92 Sources: 2008 Claritas, Inc. and 2000 U.S. Census. The U.S. Census divides households into two different categories, depending on their composition. Family households are those that consist of two or more related persons living together. Non-family households include persons who live alone or in groups comprised of unrelated individuals. As shown in Table III.6, about 82 percent of Milpitas’ households are estimated to be family households in 2008. In Santa Clara County, this number is lower at about 70 percent. The rate of homeownership in Milpitas (70 percent) is also higher than Santa Clara County’s (59 percent) and could be due to the high proportion of family households. Table III.6: Household Composition for Milpitas and Santa Clara County, 2008
Milpitas Santa Clara County Number Percent Number Percent
Number of Households 17,901 594,361 Families 14,990 81.7% 65.2% 69.9% Non-Families 11,961 18.3% 34.8% 30.1%
Household Tenure Owner 12,532 70.0% 352,731 59.3% Renter 5,369 30.0% 241,630 40.7%
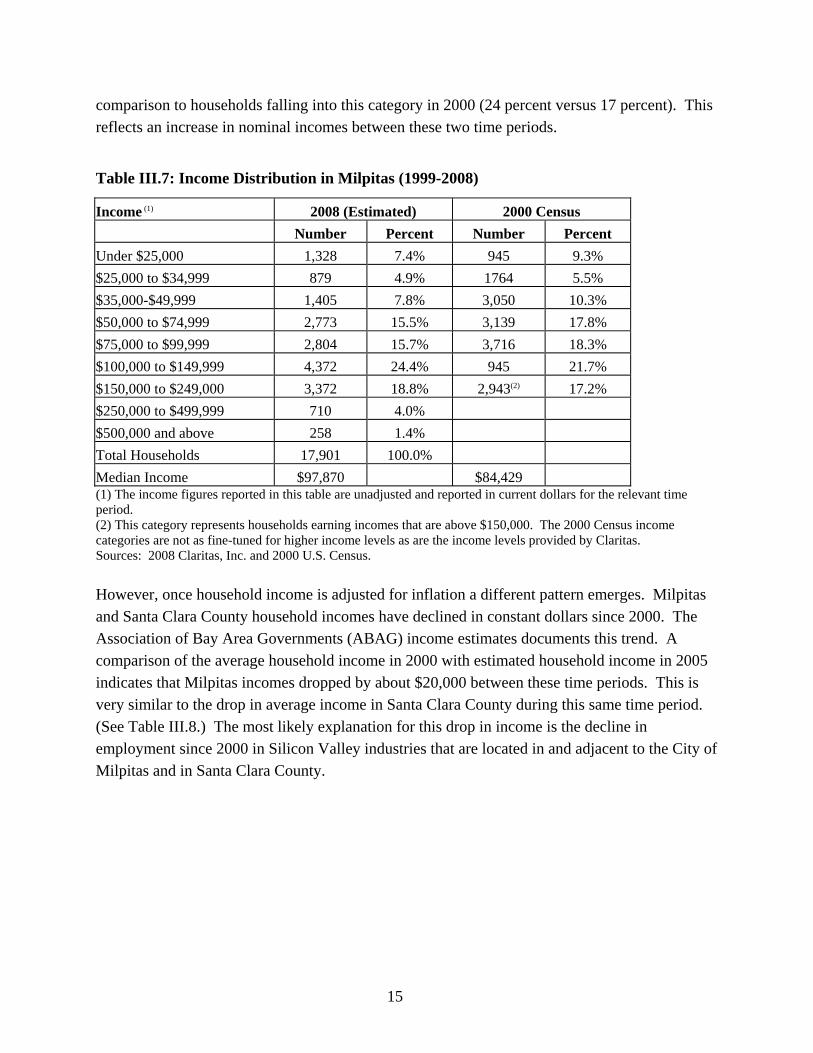
Source: 2008 Claritas Estimates 2) Existing and Projected Incomes Table III.7 shows the distribution of estimated 2008 household incomes for Milpitas and compares it with actual (unadjusted) 1999 incomes reported by the 2000 Census. The percentage of households in each category up to $150,000 does not vary significantly between 2000 and 2008. However, a slightly higher percentage of households earned above $150,000 in 2008 in
15
comparison to households falling into this category in 2000 (24 percent versus 17 percent). This reflects an increase in nominal incomes between these two time periods.
Table III.7: Income Distribution in Milpitas (1999-2008)
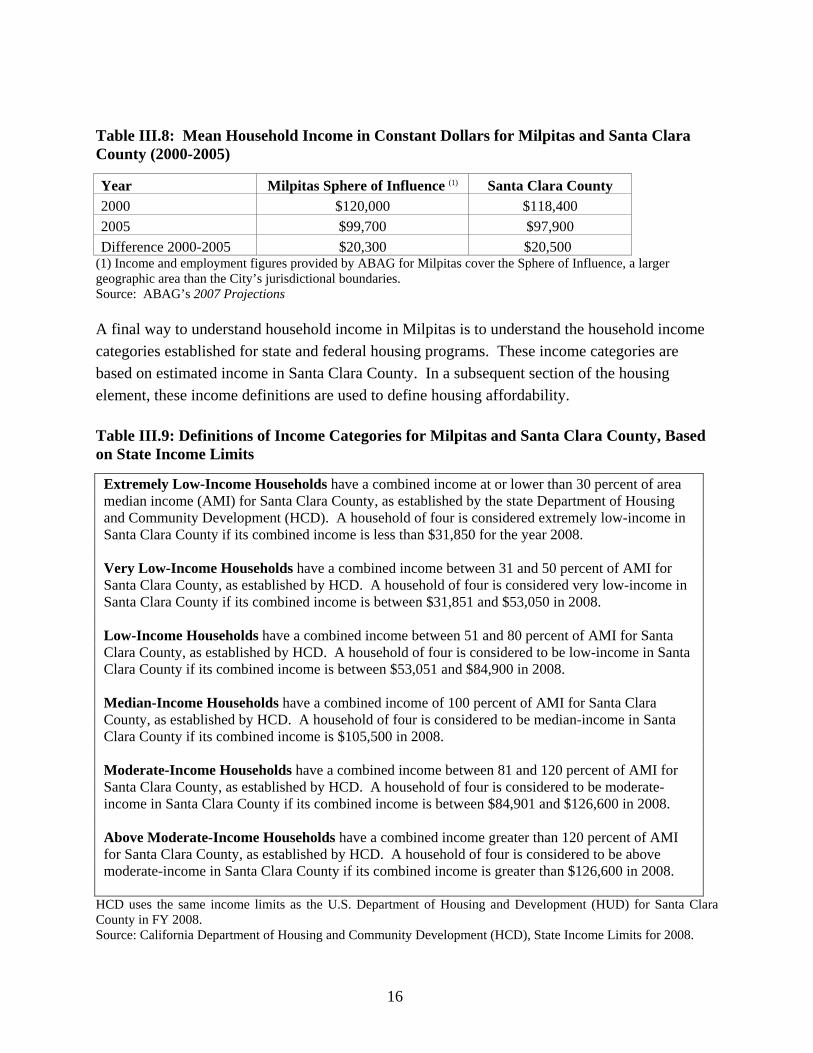
Income (1) 2008 (Estimated) 2000 Census Number Percent Number Percent Under $25,000 1,328 7.4% 945 9.3% $25,000 to $34,999 879 4.9% 1764 5.5% $35,000-$49,999 1,405 7.8% 3,050 10.3% $50,000 to $74,999 2,773 15.5% 3,139 17.8% $75,000 to $99,999 2,804 15.7% 3,716 18.3% $100,000 to $149,999 4,372 24.4% 945 21.7% $150,000 to $249,000 3,372 18.8% 2,943(2) 17.2% $250,000 to $499,999 710 4.0% $500,000 and above 258 1.4% Total Households 17,901 100.0% Median Income $97,870 $84,429 (1) The income figures reported in this table are unadjusted and reported in current dollars for the relevant time period. (2) This category represents households earning incomes that are above $150,000. The 2000 Census income categories are not as fine-tuned for higher income levels as are the income levels provided by Claritas. Sources: 2008 Claritas, Inc. and 2000 U.S. Census. However, once household income is adjusted for inflation a different pattern emerges. Milpitas and Santa Clara County household incomes have declined in constant dollars since 2000. The Association of Bay Area Governments (ABAG) income estimates documents this trend. A comparison of the average household income in 2000 with estimated household income in 2005 indicates that Milpitas incomes dropped by about $20,000 between these time periods. This is very similar to the drop in average income in Santa Clara County during this same time period. (See Table III.8.) The most likely explanation for this drop in income is the decline in employment since 2000 in Silicon Valley industries that are located in and adjacent to the City of Milpitas and in Santa Clara County.
16
Table III.8: Mean Household Income in Constant Dollars for Milpitas and Santa Clara County (2000-2005)
Year Milpitas Sphere of Influence (1) Santa Clara County 2000 $120,000 $118,400 2005 $99,700 $97,900 Difference 2000-2005 $20,300 $20,500
(1) Income and employment figures provided by ABAG for Milpitas cover the Sphere of Influence, a larger geographic area than the City’s jurisdictional boundaries. Source: ABAG’s 2007 Projections A final way to understand household income in Milpitas is to understand the household income categories established for state and federal housing programs. These income categories are based on estimated income in Santa Clara County. In a subsequent section of the housing element, these income definitions are used to define housing affordability. Table III.9: Definitions of Income Categories for Milpitas and Santa Clara County, Based on State Income Limits
Extremely Low-Income Households have a combined income at or lower than 30 percent of area median income (AMI) for Santa Clara County, as established by the state Department of Housing and Community Development (HCD). A household of four is considered extremely low-income in Santa Clara County if its combined income is less than $31,850 for the year 2008. Very Low-Income Households have a combined income between 31 and 50 percent of AMI for Santa Clara County, as established by HCD. A household of four is considered very low-income in Santa Clara County if its combined income is between $31,851 and $53,050 in 2008. Low-Income Households have a combined income between 51 and 80 percent of AMI for Santa Clara County, as established by HCD. A household of four is considered to be low-income in Santa Clara County if its combined income is between $53,051 and $84,900 in 2008. Median-Income Households have a combined income of 100 percent of AMI for Santa Clara County, as established by HCD. A household of four is considered to be median-income in Santa Clara County if its combined income is $105,500 in 2008. Moderate-Income Households have a combined income between 81 and 120 percent of AMI for Santa Clara County, as established by HCD. A household of four is considered to be moderate-income in Santa Clara County if its combined income is between $84,901 and $126,600 in 2008. Above Moderate-Income Households have a combined income greater than 120 percent of AMI for Santa Clara County, as established by HCD. A household of four is considered to be above moderate-income in Santa Clara County if its combined income is greater than $126,600 in 2008.
HCD uses the same income limits as the U.S. Department of Housing and Development (HUD) for Santa Clara County in FY 2008. Source: California Department of Housing and Community Development (HCD), State Income Limits for 2008.
17
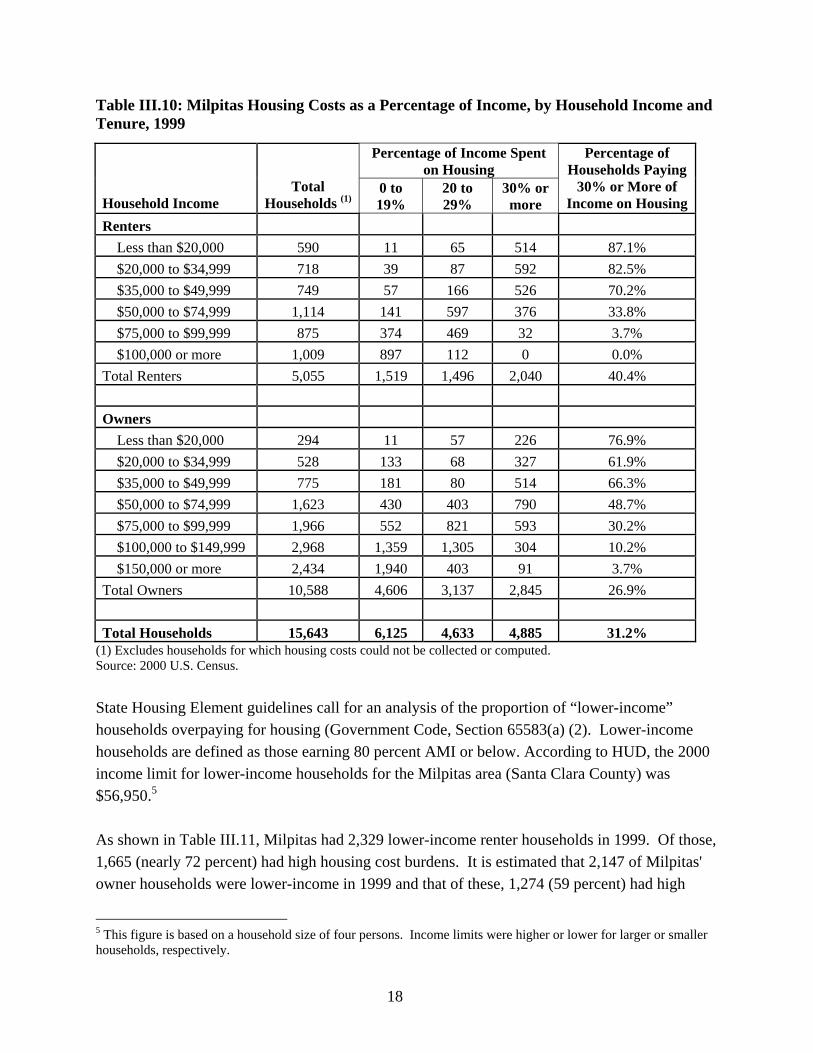
3) Housing Cost Burdens According to state standards, a household is considered to be overpaying for housing, and therefore facing a housing cost burden, if gross monthly housing costs require more than 30 percent of gross monthly income. Households paying more than 50 percent of gross monthly income are considered to have severe cost burdens or are severely overpaying. Table III.10 presents information on housing cost burden by tenure and household income levels as of 1999. This table is based on information provided by HUD’s cross-tabulations of 2000 Census data.3 As shown, approximately 31 percent of all Milpitas households experienced high housing cost burdens in 1999. Housing cost burdens were greatest for renters – more than 40 percent of all Milpitas renters (for a total of 2,040 households) paid more than 30 percent of their incomes for housing costs in 1999. Renter households earning less than $50,000 per year were much more likely to have high cost burdens than households with annual incomes greater than $50,000. For households earning less than $20,000 per year, the percentage of renters with high cost burdens increased to 87 percent. For households with annual incomes between $20,000 and $34,999, nearly 83 percent had high cost burdens. A smaller percentage of Milpitas homeowners (27 percent) had high cost burdens in 1999. A total of 2,845 homeowners had high cost burdens in 1999.4 This included 62 percent of households earning between $20,000 and $34,999, and 66 percent of households with annual incomes between $35,000 and $49,999. A substantial percentage of households earning close to median income also faced high housing cost burdens in 1999. For households earning between $50,000 and $74,999 per year, which is roughly comparable to 80 to 100 percent of area median income, a third of renter households and nearly half of homeowners paid more than 30 percent of their incomes on housing costs.
3 CHAS data tables are compiled by the US Department of Housing and Urban Development, based on a special tabulation derived from the U.S. Census. 4 Monthly homeownership costs calculated by the US Census include mortgage payments; real estate taxes; fire, hazard and flood insurance; utilities (electricity, gas, and water and sewer); and heating fuels (oil, coal, kerosene, wood, etc.). It also includes, where appropriate, monthly condominium fees or mobile home costs such as ground rents.
18
Table III.10: Milpitas Housing Costs as a Percentage of Income, by Household Income and Tenure, 1999
Percentage of Income Spent on Housing
Household Income Total
Households (1) 0 to 19%
20 to 29%
30% or more
Percentage of Households Paying
30% or More of Income on Housing
Renters Less than $20,000 590 11 65 514 87.1% $20,000 to $34,999 718 39 87 592 82.5% $35,000 to $49,999 749 57 166 526 70.2% $50,000 to $74,999 1,114 141 597 376 33.8% $75,000 to $99,999 875 374 469 32 3.7% $100,000 or more 1,009 897 112 0 0.0%
Total Renters 5,055 1,519 1,496 2,040 40.4% Owners
Less than $20,000 294 11 57 226 76.9% $20,000 to $34,999 528 133 68 327 61.9% $35,000 to $49,999 775 181 80 514 66.3% $50,000 to $74,999 1,623 430 403 790 48.7% $75,000 to $99,999 1,966 552 821 593 30.2% $100,000 to $149,999 2,968 1,359 1,305 304 10.2% $150,000 or more 2,434 1,940 403 91 3.7%
Total Owners 10,588 4,606 3,137 2,845 26.9% Total Households 15,643 6,125 4,633 4,885 31.2%
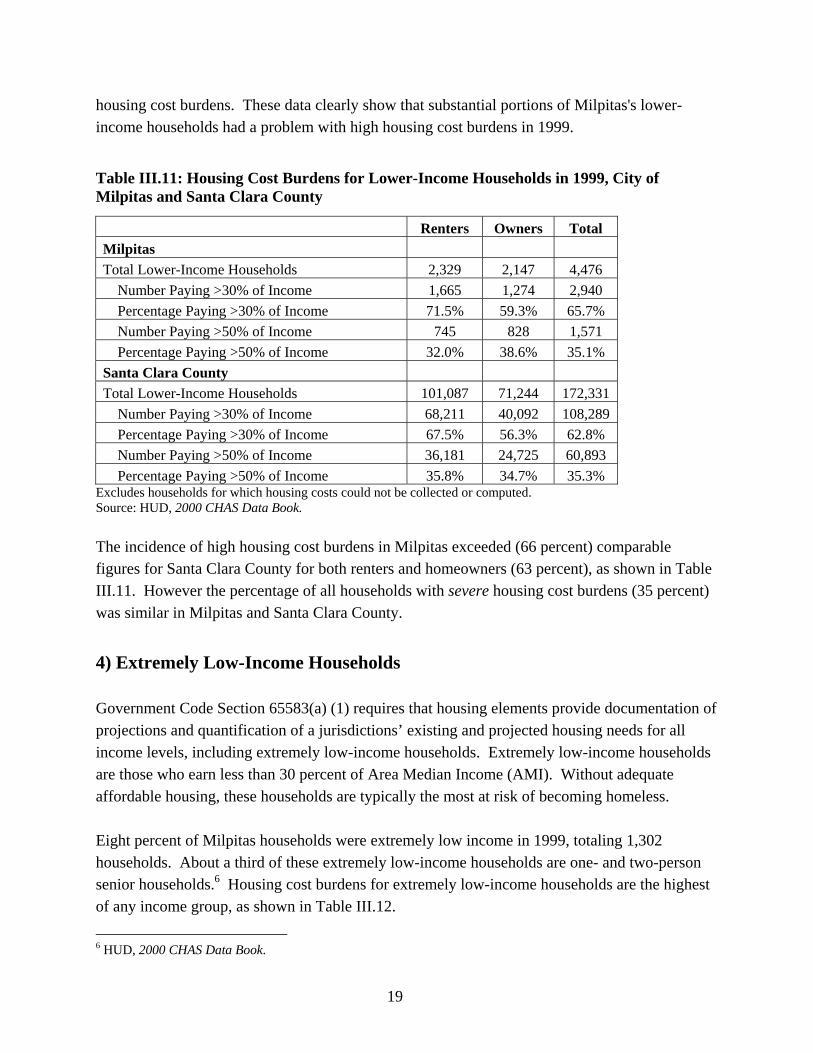
(1) Excludes households for which housing costs could not be collected or computed. Source: 2000 U.S. Census. State Housing Element guidelines call for an analysis of the proportion of “lower-income” households overpaying for housing (Government Code, Section 65583(a) (2). Lower-income households are defined as those earning 80 percent AMI or below. According to HUD, the 2000 income limit for lower-income households for the Milpitas area (Santa Clara County) was $56,950.5 As shown in Table III.11, Milpitas had 2,329 lower-income renter households in 1999. Of those, 1,665 (nearly 72 percent) had high housing cost burdens. It is estimated that 2,147 of Milpitas' owner households were lower-income in 1999 and that of these, 1,274 (59 percent) had high
5 This figure is based on a household size of four persons. Income limits were higher or lower for larger or smaller households, respectively.
19
housing cost burdens. These data clearly show that substantial portions of Milpitas's lower-income households had a problem with high housing cost burdens in 1999.
Table III.11: Housing Cost Burdens for Lower-Income Households in 1999, City of Milpitas and Santa Clara County
Renters Owners Total Milpitas Total Lower-Income Households 2,329 2,147 4,476
Number Paying >30% of Income 1,665 1,274 2,940 Percentage Paying >30% of Income 71.5% 59.3% 65.7% Number Paying >50% of Income 745 828 1,571 Percentage Paying >50% of Income 32.0% 38.6% 35.1%
Santa Clara County Total Lower-Income Households 101,087 71,244 172,331
Number Paying >30% of Income 68,211 40,092 108,289 Percentage Paying >30% of Income 67.5% 56.3% 62.8% Number Paying >50% of Income 36,181 24,725 60,893 Percentage Paying >50% of Income 35.8% 34.7% 35.3%
Excludes households for which housing costs could not be collected or computed. Source: HUD, 2000 CHAS Data Book. The incidence of high housing cost burdens in Milpitas exceeded (66 percent) comparable figures for Santa Clara County for both renters and homeowners (63 percent), as shown in Table III.11. However the percentage of all households with severe housing cost burdens (35 percent) was similar in Milpitas and Santa Clara County.
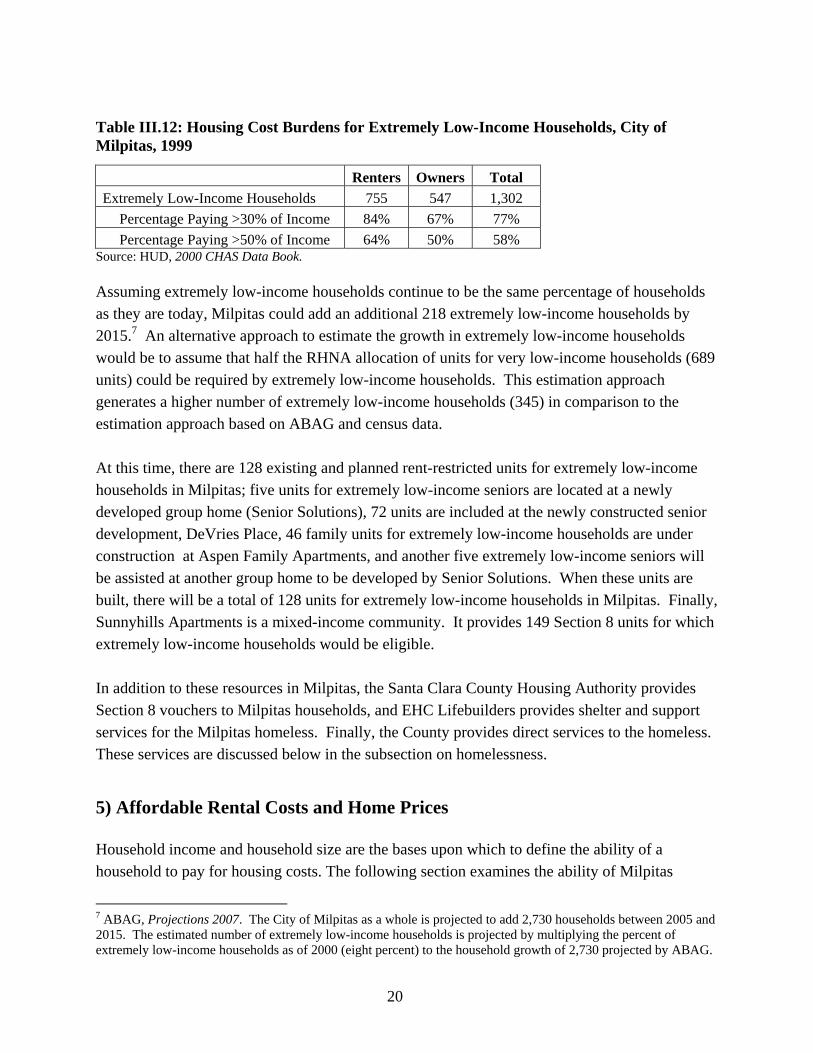
4) Extremely Low-Income Households Government Code Section 65583(a) (1) requires that housing elements provide documentation of projections and quantification of a jurisdictions’ existing and projected housing needs for all income levels, including extremely low-income households. Extremely low-income households are those who earn less than 30 percent of Area Median Income (AMI). Without adequate affordable housing, these households are typically the most at risk of becoming homeless. Eight percent of Milpitas households were extremely low income in 1999, totaling 1,302 households. About a third of these extremely low-income households are one- and two-person senior households.6 Housing cost burdens for extremely low-income households are the highest of any income group, as shown in Table III.12.
6 HUD, 2000 CHAS Data Book.
20
Table III.12: Housing Cost Burdens for Extremely Low-Income Households, City of Milpitas, 1999
Renters Owners Total Extremely Low-Income Households 755 547 1,302
Percentage Paying >30% of Income 84% 67% 77% Percentage Paying >50% of Income 64% 50% 58%
Source: HUD, 2000 CHAS Data Book. Assuming extremely low-income households continue to be the same percentage of households as they are today, Milpitas could add an additional 218 extremely low-income households by 2015.7 An alternative approach to estimate the growth in extremely low-income households would be to assume that half the RHNA allocation of units for very low-income households (689 units) could be required by extremely low-income households. This estimation approach generates a higher number of extremely low-income households (345) in comparison to the estimation approach based on ABAG and census data. At this time, there are 128 existing and planned rent-restricted units for extremely low-income households in Milpitas; five units for extremely low-income seniors are located at a newly developed group home (Senior Solutions), 72 units are included at the newly constructed senior development, DeVries Place, 46 family units for extremely low-income households are under construction at Aspen Family Apartments, and another five extremely low-income seniors will be assisted at another group home to be developed by Senior Solutions. When these units are built, there will be a total of 128 units for extremely low-income households in Milpitas. Finally, Sunnyhills Apartments is a mixed-income community. It provides 149 Section 8 units for which extremely low-income households would be eligible. In addition to these resources in Milpitas, the Santa Clara County Housing Authority provides Section 8 vouchers to Milpitas households, and EHC Lifebuilders provides shelter and support services for the Milpitas homeless. Finally, the County provides direct services to the homeless. These services are discussed below in the subsection on homelessness.
5) Affordable Rental Costs and Home Prices Household income and household size are the bases upon which to define the ability of a household to pay for housing costs. The following section examines the ability of Milpitas
7 ABAG, Projections 2007. The City of Milpitas as a whole is projected to add 2,730 households between 2005 and 2015. The estimated number of extremely low-income households is projected by multiplying the percent of extremely low-income households as of 2000 (eight percent) to the household growth of 2,730 projected by ABAG.
21
households at various income levels to pay for housing. This analysis is presented by the household income categories defined in Table III.9. Table III.13 shows maximum affordable monthly rents and maximum affordable purchase prices for extremely low-, very low-, low-, median- and moderate-income households in Santa Clara County (including Milpitas). Since income categories vary by household size, information is presented for households ranging in size from one to five persons. For example: a three-person household classified as low-income (or 80 percent of AMI) with an annual income of up to $76,400 could afford to pay $1,910 monthly gross rent (including utilities) or purchase a $206,006 house, assuming a five percent down payment. While affordable rents are defined as requiring no more than 30 percent of income, affordable home prices for owners vary according to income level and range between 30 and 35 percent.8 Later subsections of this Housing Needs Assessment Chapter show that the current rents and sales prices for much of the Milpitas housing stock is priced beyond the affordable levels defined in Table III.13.
8 For example, the percentage of income paid for ownership costs for lower-income households is 30% of gross income, but median- and moderate-income households are assumed to be able to pay 35% of gross income for ownership costs.
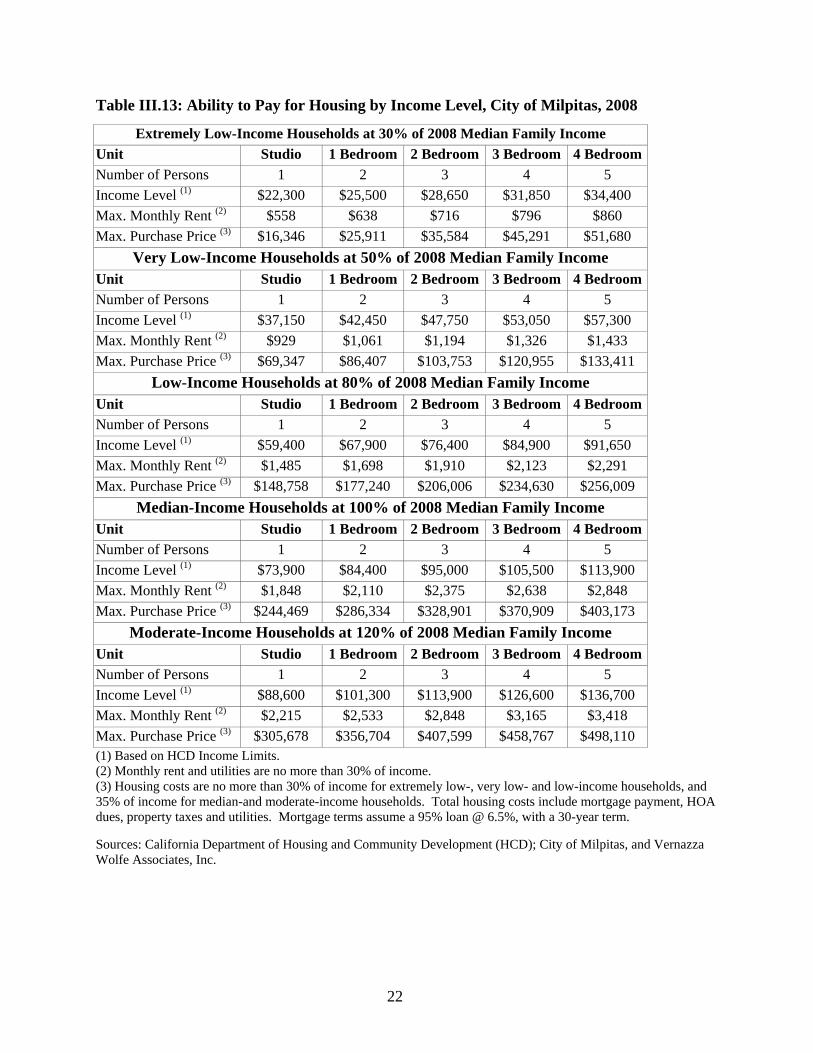
22
Table III.13: Ability to Pay for Housing by Income Level, City of Milpitas, 2008
Extremely Low-Income Households at 30% of 2008 Median Family Income Unit Studio 1 Bedroom 2 Bedroom 3 Bedroom 4 Bedroom Number of Persons 1 2 3 4 5 Income Level (1) $22,300 $25,500 $28,650 $31,850 $34,400 Max. Monthly Rent (2) $558 $638 $716 $796 $860 Max. Purchase Price (3) $16,346 $25,911 $35,584 $45,291 $51,680
Very Low-Income Households at 50% of 2008 Median Family Income Unit Studio 1 Bedroom 2 Bedroom 3 Bedroom 4 Bedroom Number of Persons 1 2 3 4 5 Income Level (1) $37,150 $42,450 $47,750 $53,050 $57,300 Max. Monthly Rent (2) $929 $1,061 $1,194 $1,326 $1,433 Max. Purchase Price (3) $69,347 $86,407 $103,753 $120,955 $133,411
Low-Income Households at 80% of 2008 Median Family Income Unit Studio 1 Bedroom 2 Bedroom 3 Bedroom 4 Bedroom Number of Persons 1 2 3 4 5 Income Level (1) $59,400 $67,900 $76,400 $84,900 $91,650 Max. Monthly Rent (2) $1,485 $1,698 $1,910 $2,123 $2,291 Max. Purchase Price (3) $148,758 $177,240 $206,006 $234,630 $256,009
Median-Income Households at 100% of 2008 Median Family Income Unit Studio 1 Bedroom 2 Bedroom 3 Bedroom 4 Bedroom Number of Persons 1 2 3 4 5 Income Level (1) $73,900 $84,400 $95,000 $105,500 $113,900 Max. Monthly Rent (2) $1,848 $2,110 $2,375 $2,638 $2,848 Max. Purchase Price (3) $244,469 $286,334 $328,901 $370,909 $403,173
Moderate-Income Households at 120% of 2008 Median Family Income Unit Studio 1 Bedroom 2 Bedroom 3 Bedroom 4 Bedroom Number of Persons 1 2 3 4 5 Income Level (1) $88,600 $101,300 $113,900 $126,600 $136,700 Max. Monthly Rent (2) $2,215 $2,533 $2,848 $3,165 $3,418 Max. Purchase Price (3) $305,678 $356,704 $407,599 $458,767 $498,110 (1) Based on HCD Income Limits. (2) Monthly rent and utilities are no more than 30% of income. (3) Housing costs are no more than 30% of income for extremely low-, very low- and low-income households, and 35% of income for median-and moderate-income households. Total housing costs include mortgage payment, HOA dues, property taxes and utilities. Mortgage terms assume a 95% loan @ 6.5%, with a 30-year term. Sources: California Department of Housing and Community Development (HCD); City of Milpitas, and Vernazza Wolfe Associates, Inc.
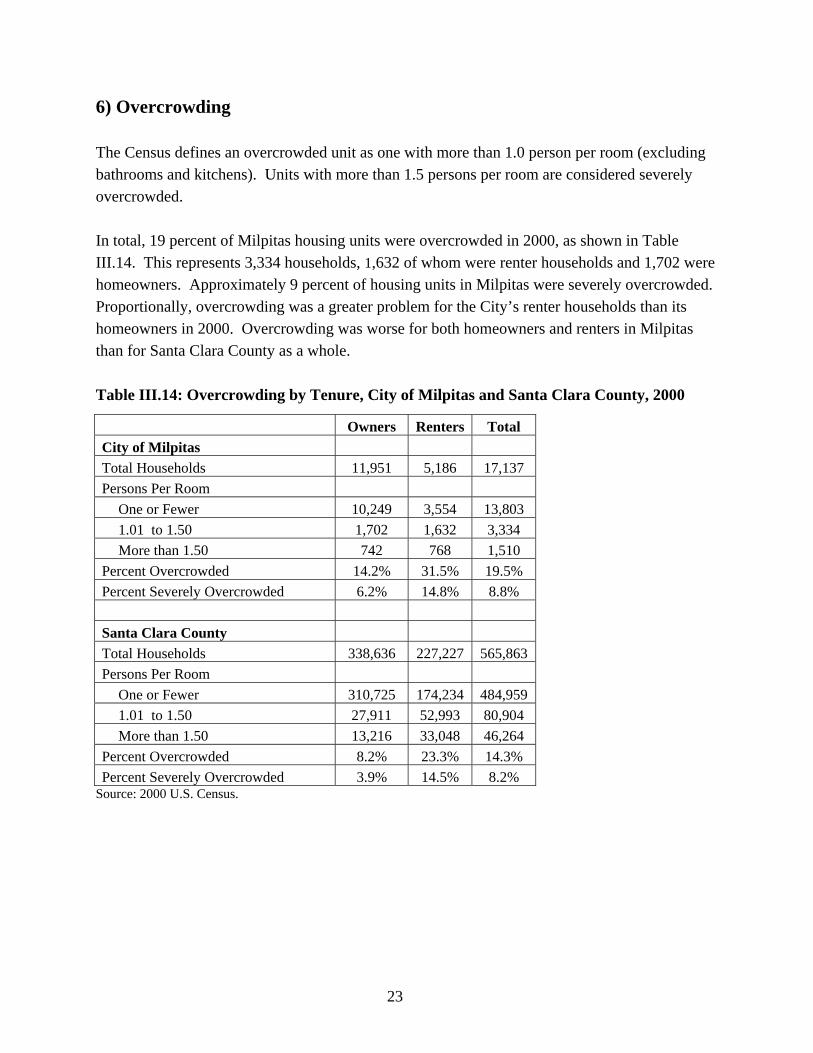
23
6) Overcrowding The Census defines an overcrowded unit as one with more than 1.0 person per room (excluding bathrooms and kitchens). Units with more than 1.5 persons per room are considered severely overcrowded. In total, 19 percent of Milpitas housing units were overcrowded in 2000, as shown in Table III.14. This represents 3,334 households, 1,632 of whom were renter households and 1,702 were homeowners. Approximately 9 percent of housing units in Milpitas were severely overcrowded. Proportionally, overcrowding was a greater problem for the City’s renter households than its homeowners in 2000. Overcrowding was worse for both homeowners and renters in Milpitas than for Santa Clara County as a whole. Table III.14: Overcrowding by Tenure, City of Milpitas and Santa Clara County, 2000
Owners Renters Total City of Milpitas Total Households 11,951 5,186 17,137 Persons Per Room
One or Fewer 10,249 3,554 13,803 1.01 to 1.50 1,702 1,632 3,334 More than 1.50 742 768 1,510
Percent Overcrowded 14.2% 31.5% 19.5% Percent Severely Overcrowded 6.2% 14.8% 8.8% Santa Clara County Total Households 338,636 227,227 565,863 Persons Per Room
One or Fewer 310,725 174,234 484,959 1.01 to 1.50 27,911 52,993 80,904 More than 1.50 13,216 33,048 46,264
Percent Overcrowded 8.2% 23.3% 14.3% Percent Severely Overcrowded 3.9% 14.5% 8.2%
Source: 2000 U.S. Census.
24
C. Housing Stock Characteristics 1) Information Sources There are three sources of information for 2008 housing unit counts. These include the State of California Department of Finance Population and Housing Estimates (DOF); Claritas, Inc., a private company that provides housing and population estimates and projections, and the City of Milpitas’ building records. However, information provided by these sources differs. For example, the lowest count of housing unit growth between 2000 and 2008 is the DOF estimate of 1,709 housing units. In comparison, Claritas’ estimate for growth in the number of housing units is higher during the same period at 1,917 units (a difference of 208 units). Finally, according to the City, a total of 3,318 housing permits were issued between 1999 and 2006. All three sources of information are used in the Housing Element.
• DOF is the source of information for 2008 housing unit counts by type of housing (single family, multifamily, etc.), and occupancy status.
• Claritas estimates are used for 2008 tenure and age of housing information. • City of Milpitas records are used in describing the number and type of units that have
been permitted since January 1, 2007. Finally, a targeted housing condition survey was conducted to supplement the information provided by these other data sources. Results from this survey are presented below.
2) Housing Types and Occupancy Levels Table III.15 presents information on the housing stock of Milpitas and Santa Clara County in 2000 and 2008. In 2008, single family detached units accounted for the majority of housing in Milpitas, comprising nearly 58 percent of the total. When detached and attached single family units are considered together, they make up more than two-thirds of the total existing housing stock. While single family units constitute a slightly larger proportion of the total housing stock in Milpitas than in Santa Clara County as a whole, single family units declined as a percentage of total housing units in Milpitas between 2000 and 2008.
In contrast, multifamily properties represent a growing percentage of total housing units in Milpitas. As shown in Table III.15, multifamily properties with more than five units grew from
25
12.6 to 18.5 percent of the total housing stock between 2000 and 2008. With few exceptions, all housing built in Milpitas since 2000 has been multifamily.9
In 2000, a majority of five-plus unit properties had between 5 and 20 units, and just over a third of all five-plus unit properties had more than 50 units.10 While information provided by the California Department of Finance (DOF) for 2008 does not provide details about how many units are presently in large multifamily properties, a recent market study prepared for the City found that of the 3,492 housing units that were under construction or had been recently approved as of February 2008, the average density was 34 units to the acre.11 In fact, 98% of new housing in Milpitas is multifamily. This trend reflects the City’s policy to develop denser housing in the Midtown and Transit Area Specific Plan Areas.
The percentage of mobile home units in Milpitas’s housing stock has remained relatively constant between 2000 and 2008, at just over three percent of total housing stock. These units have been governed by rent control since 1992. Table III.15 also shows the number of occupied units and the percentage of vacant units. It is important to note that these counts include all vacant units, including those units held vacant for seasonal use; not all of the vacant units are actually offered for sale or for rent. Milpitas is shown as having a very low vacancy rate of 1.34 percent in 2008, which is slightly lower than the vacancy rate for Santa Clara County.
9 Vernazza Wolfe Associates, Inc., City of Milpitas Market Study, 2008. 10 2000 U.S. Census. 11 Vernazza Wolfe Associates, Inc., City of Milpitas Market Study, 2008.
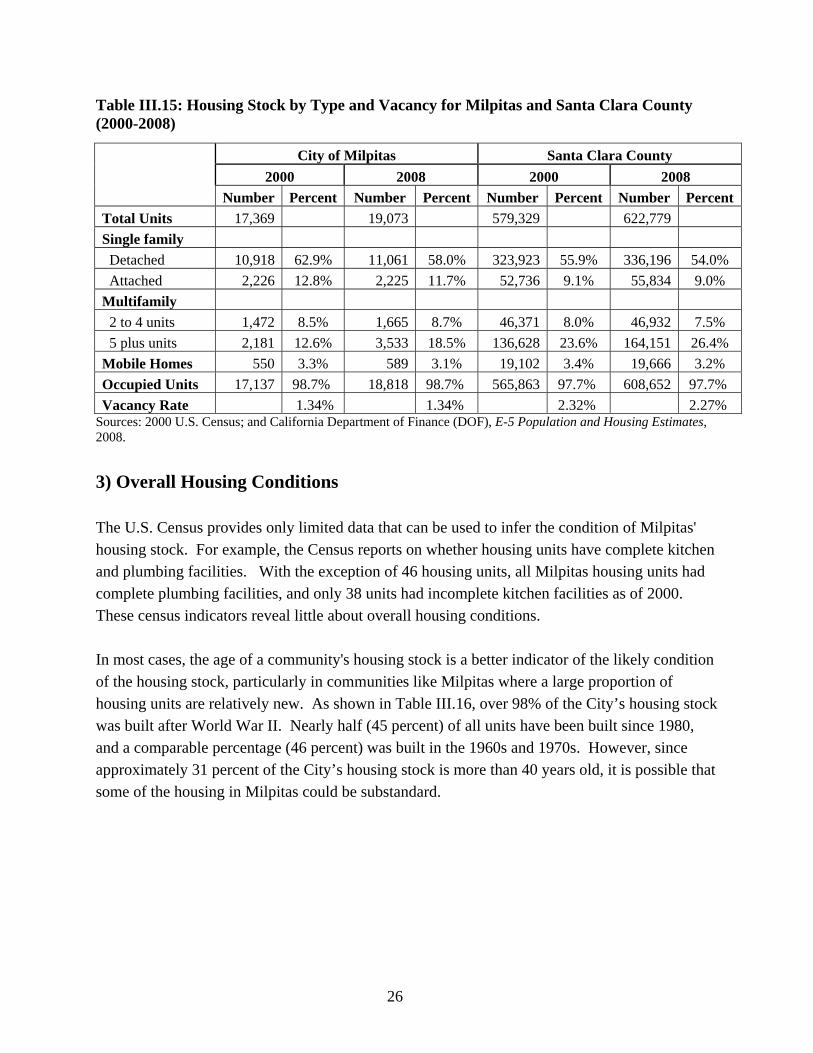
26
Table III.15: Housing Stock by Type and Vacancy for Milpitas and Santa Clara County (2000-2008)
City of Milpitas Santa Clara County 2000 2008 2000 2008 Number Percent Number Percent Number Percent Number PercentTotal Units 17,369 19,073 579,329 622,779 Single family Detached 10,918 62.9% 11,061 58.0% 323,923 55.9% 336,196 54.0% Attached 2,226 12.8% 2,225 11.7% 52,736 9.1% 55,834 9.0% Multifamily 2 to 4 units 1,472 8.5% 1,665 8.7% 46,371 8.0% 46,932 7.5% 5 plus units 2,181 12.6% 3,533 18.5% 136,628 23.6% 164,151 26.4% Mobile Homes 550 3.3% 589 3.1% 19,102 3.4% 19,666 3.2% Occupied Units 17,137 98.7% 18,818 98.7% 565,863 97.7% 608,652 97.7% Vacancy Rate 1.34% 1.34% 2.32% 2.27%
Sources: 2000 U.S. Census; and California Department of Finance (DOF), E-5 Population and Housing Estimates, 2008.
3) Overall Housing Conditions The U.S. Census provides only limited data that can be used to infer the condition of Milpitas' housing stock. For example, the Census reports on whether housing units have complete kitchen and plumbing facilities. With the exception of 46 housing units, all Milpitas housing units had complete plumbing facilities, and only 38 units had incomplete kitchen facilities as of 2000. These census indicators reveal little about overall housing conditions. In most cases, the age of a community's housing stock is a better indicator of the likely condition of the housing stock, particularly in communities like Milpitas where a large proportion of housing units are relatively new. As shown in Table III.16, over 98% of the City’s housing stock was built after World War II. Nearly half (45 percent) of all units have been built since 1980, and a comparable percentage (46 percent) was built in the 1960s and 1970s. However, since approximately 31 percent of the City’s housing stock is more than 40 years old, it is possible that some of the housing in Milpitas could be substandard.
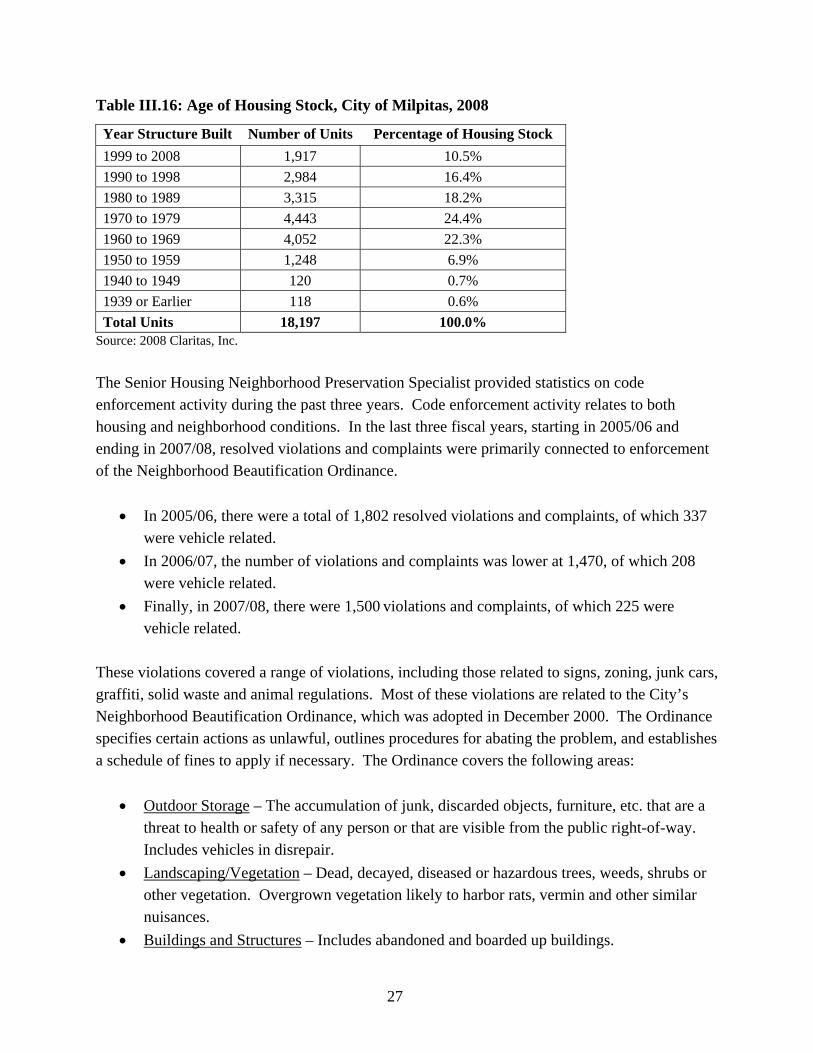
27
Table III.16: Age of Housing Stock, City of Milpitas, 2008
Year Structure Built Number of Units Percentage of Housing Stock 1999 to 2008 1,917 10.5% 1990 to 1998 2,984 16.4% 1980 to 1989 3,315 18.2% 1970 to 1979 4,443 24.4% 1960 to 1969 4,052 22.3% 1950 to 1959 1,248 6.9% 1940 to 1949 120 0.7% 1939 or Earlier 118 0.6% Total Units 18,197 100.0%
Source: 2008 Claritas, Inc. The Senior Housing Neighborhood Preservation Specialist provided statistics on code enforcement activity during the past three years. Code enforcement activity relates to both housing and neighborhood conditions. In the last three fiscal years, starting in 2005/06 and ending in 2007/08, resolved violations and complaints were primarily connected to enforcement of the Neighborhood Beautification Ordinance.
• In 2005/06, there were a total of 1,802 resolved violations and complaints, of which 337 were vehicle related.
• In 2006/07, the number of violations and complaints was lower at 1,470, of which 208 were vehicle related.
• Finally, in 2007/08, there were 1,500 violations and complaints, of which 225 were vehicle related.
These violations covered a range of violations, including those related to signs, zoning, junk cars, graffiti, solid waste and animal regulations. Most of these violations are related to the City’s Neighborhood Beautification Ordinance, which was adopted in December 2000. The Ordinance specifies certain actions as unlawful, outlines procedures for abating the problem, and establishes a schedule of fines to apply if necessary. The Ordinance covers the following areas:
• Outdoor Storage – The accumulation of junk, discarded objects, furniture, etc. that are a threat to health or safety of any person or that are visible from the public right-of-way. Includes vehicles in disrepair.
• Landscaping/Vegetation – Dead, decayed, diseased or hazardous trees, weeds, shrubs or other vegetation. Overgrown vegetation likely to harbor rats, vermin and other similar nuisances.
• Buildings and Structures – Includes abandoned and boarded up buildings.
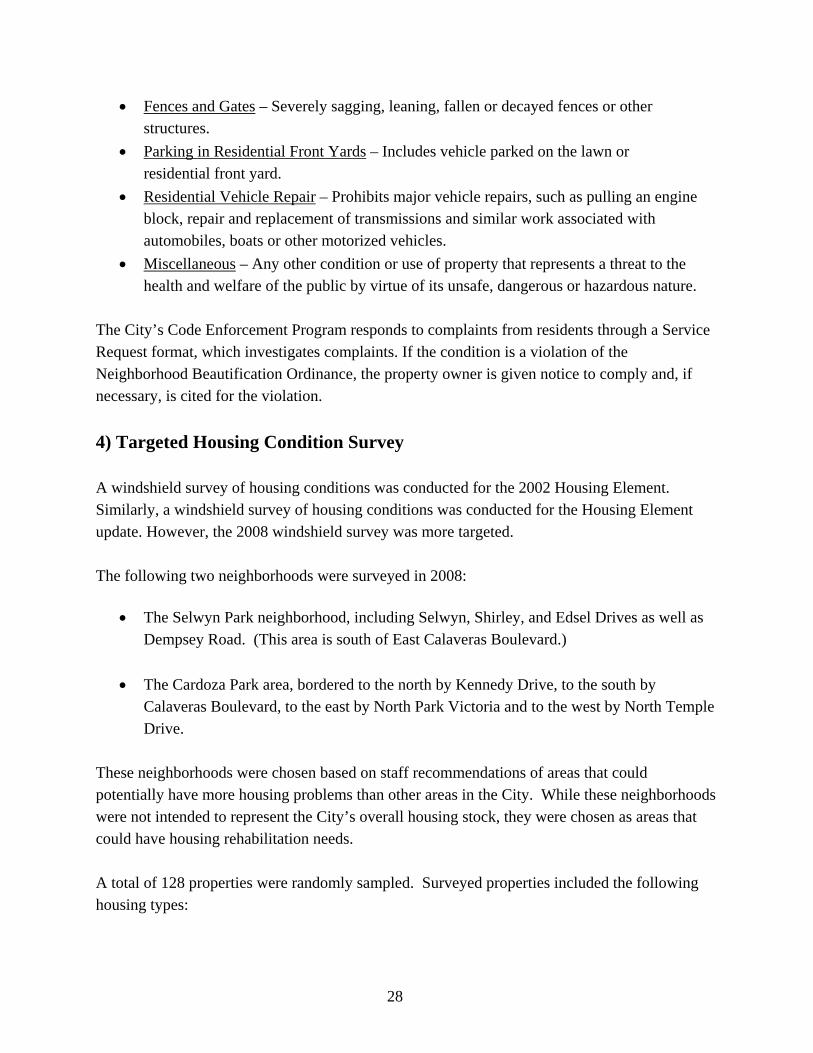
28
• Fences and Gates – Severely sagging, leaning, fallen or decayed fences or other structures.
• Parking in Residential Front Yards – Includes vehicle parked on the lawn or residential front yard.
• Residential Vehicle Repair – Prohibits major vehicle repairs, such as pulling an engine block, repair and replacement of transmissions and similar work associated with automobiles, boats or other motorized vehicles.
• Miscellaneous – Any other condition or use of property that represents a threat to the health and welfare of the public by virtue of its unsafe, dangerous or hazardous nature.
The City’s Code Enforcement Program responds to complaints from residents through a Service Request format, which investigates complaints. If the condition is a violation of the Neighborhood Beautification Ordinance, the property owner is given notice to comply and, if necessary, is cited for the violation. 4) Targeted Housing Condition Survey A windshield survey of housing conditions was conducted for the 2002 Housing Element. Similarly, a windshield survey of housing conditions was conducted for the Housing Element update. However, the 2008 windshield survey was more targeted. The following two neighborhoods were surveyed in 2008:
• The Selwyn Park neighborhood, including Selwyn, Shirley, and Edsel Drives as well as Dempsey Road. (This area is south of East Calaveras Boulevard.)
• The Cardoza Park area, bordered to the north by Kennedy Drive, to the south by
Calaveras Boulevard, to the east by North Park Victoria and to the west by North Temple Drive.
These neighborhoods were chosen based on staff recommendations of areas that could potentially have more housing problems than other areas in the City. While these neighborhoods were not intended to represent the City’s overall housing stock, they were chosen as areas that could have housing rehabilitation needs. A total of 128 properties were randomly sampled. Surveyed properties included the following housing types:
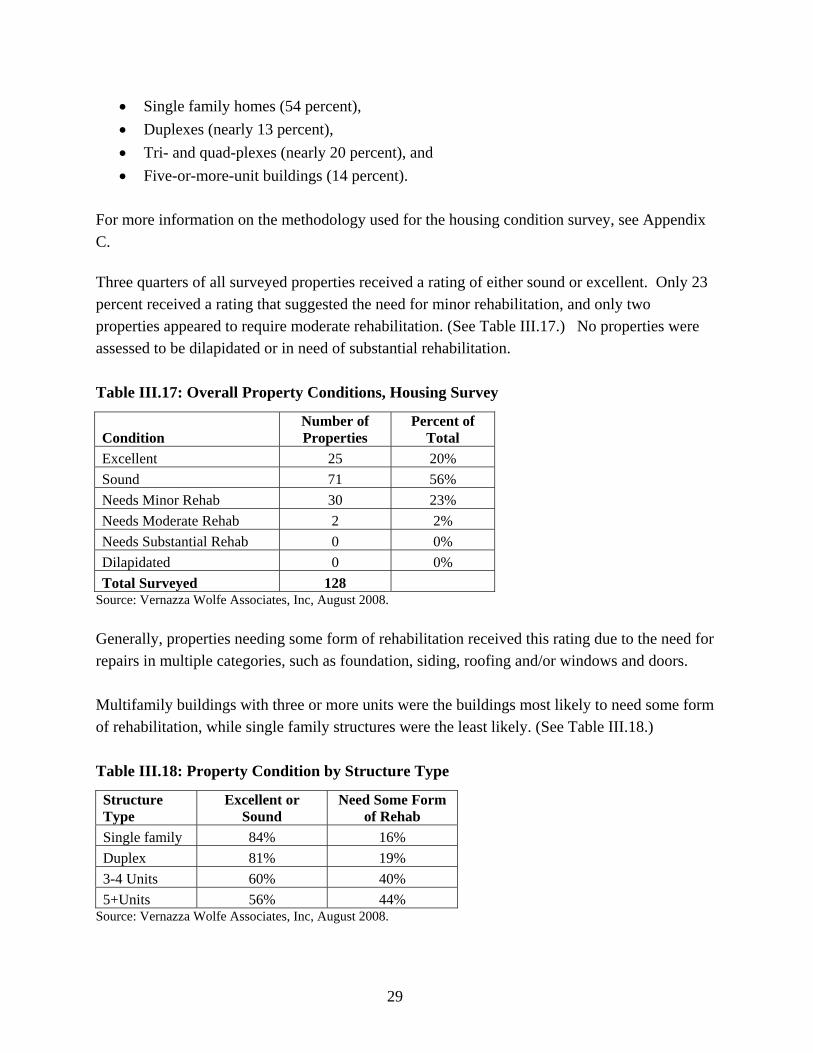
29
• Single family homes (54 percent), • Duplexes (nearly 13 percent), • Tri- and quad-plexes (nearly 20 percent), and • Five-or-more-unit buildings (14 percent).
For more information on the methodology used for the housing condition survey, see Appendix C. Three quarters of all surveyed properties received a rating of either sound or excellent. Only 23 percent received a rating that suggested the need for minor rehabilitation, and only two properties appeared to require moderate rehabilitation. (See Table III.17.) No properties were assessed to be dilapidated or in need of substantial rehabilitation. Table III.17: Overall Property Conditions, Housing Survey
Condition Number of Properties
Percent of Total
Excellent 25 20% Sound 71 56% Needs Minor Rehab 30 23% Needs Moderate Rehab 2 2% Needs Substantial Rehab 0 0% Dilapidated 0 0% Total Surveyed 128
Source: Vernazza Wolfe Associates, Inc, August 2008. Generally, properties needing some form of rehabilitation received this rating due to the need for repairs in multiple categories, such as foundation, siding, roofing and/or windows and doors. Multifamily buildings with three or more units were the buildings most likely to need some form of rehabilitation, while single family structures were the least likely. (See Table III.18.) Table III.18: Property Condition by Structure Type
Structure Type
Excellent or Sound
Need Some Form of Rehab
Single family 84% 16% Duplex 81% 19% 3-4 Units 60% 40% 5+Units 56% 44%
Source: Vernazza Wolfe Associates, Inc, August 2008.
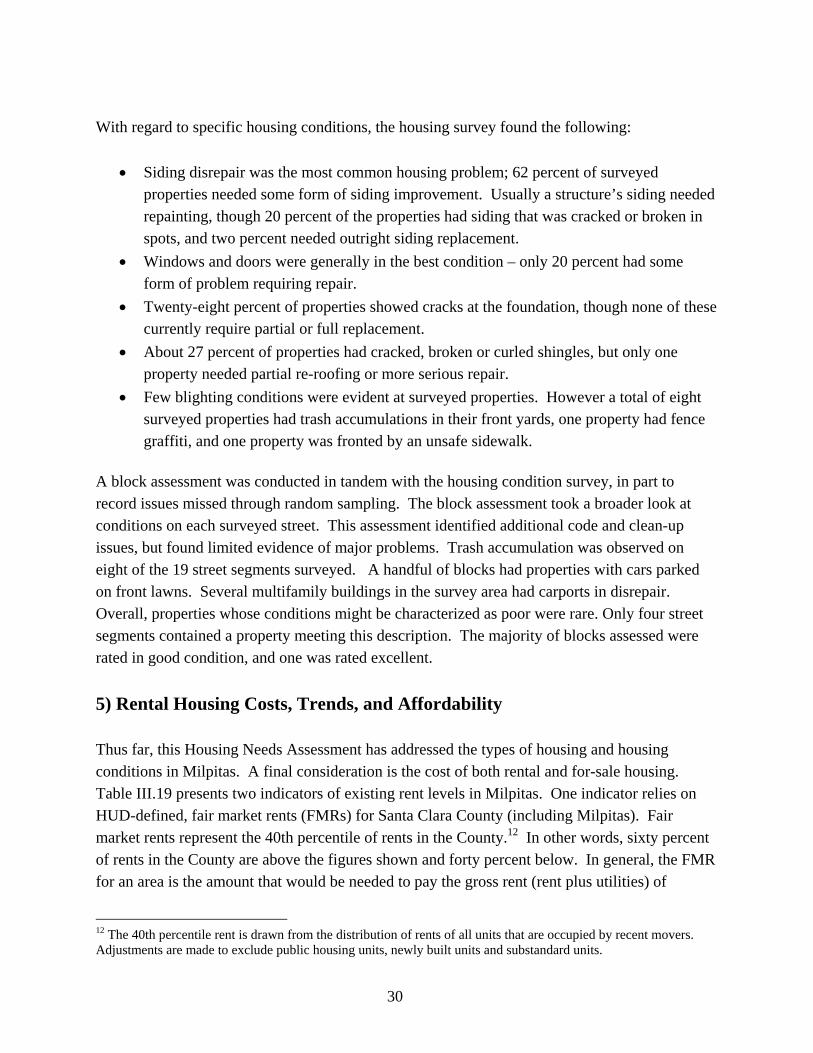
30
With regard to specific housing conditions, the housing survey found the following:
• Siding disrepair was the most common housing problem; 62 percent of surveyed properties needed some form of siding improvement. Usually a structure’s siding needed repainting, though 20 percent of the properties had siding that was cracked or broken in spots, and two percent needed outright siding replacement.
• Windows and doors were generally in the best condition – only 20 percent had some form of problem requiring repair.
• Twenty-eight percent of properties showed cracks at the foundation, though none of these currently require partial or full replacement.
• About 27 percent of properties had cracked, broken or curled shingles, but only one property needed partial re-roofing or more serious repair.
• Few blighting conditions were evident at surveyed properties. However a total of eight surveyed properties had trash accumulations in their front yards, one property had fence graffiti, and one property was fronted by an unsafe sidewalk.
A block assessment was conducted in tandem with the housing condition survey, in part to record issues missed through random sampling. The block assessment took a broader look at conditions on each surveyed street. This assessment identified additional code and clean-up issues, but found limited evidence of major problems. Trash accumulation was observed on eight of the 19 street segments surveyed. A handful of blocks had properties with cars parked on front lawns. Several multifamily buildings in the survey area had carports in disrepair. Overall, properties whose conditions might be characterized as poor were rare. Only four street segments contained a property meeting this description. The majority of blocks assessed were rated in good condition, and one was rated excellent. 5) Rental Housing Costs, Trends, and Affordability Thus far, this Housing Needs Assessment has addressed the types of housing and housing conditions in Milpitas. A final consideration is the cost of both rental and for-sale housing. Table III.19 presents two indicators of existing rent levels in Milpitas. One indicator relies on HUD-defined, fair market rents (FMRs) for Santa Clara County (including Milpitas). Fair market rents represent the 40th percentile of rents in the County.12 In other words, sixty percent of rents in the County are above the figures shown and forty percent below. In general, the FMR for an area is the amount that would be needed to pay the gross rent (rent plus utilities) of
12 The 40th percentile rent is drawn from the distribution of rents of all units that are occupied by recent movers. Adjustments are made to exclude public housing units, newly built units and substandard units.
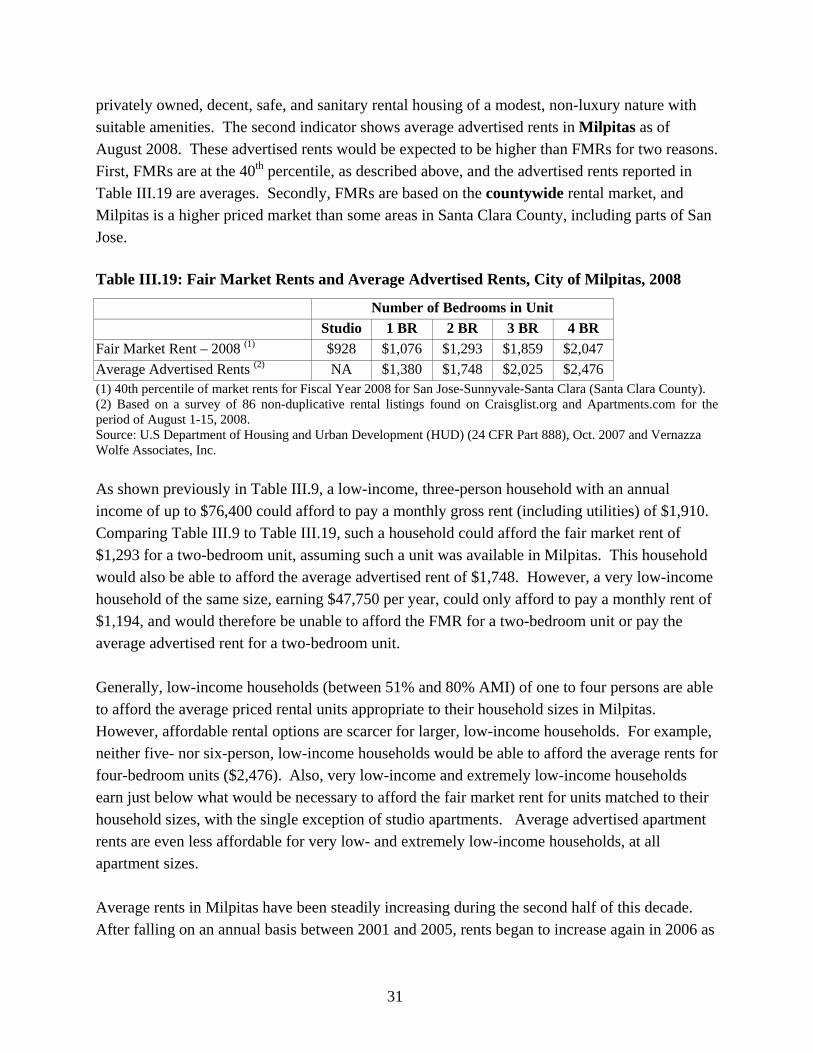
31
privately owned, decent, safe, and sanitary rental housing of a modest, non-luxury nature with suitable amenities. The second indicator shows average advertised rents in Milpitas as of August 2008. These advertised rents would be expected to be higher than FMRs for two reasons. First, FMRs are at the 40th percentile, as described above, and the advertised rents reported in Table III.19 are averages. Secondly, FMRs are based on the countywide rental market, and Milpitas is a higher priced market than some areas in Santa Clara County, including parts of San Jose. Table III.19: Fair Market Rents and Average Advertised Rents, City of Milpitas, 2008
Number of Bedrooms in Unit Studio 1 BR 2 BR 3 BR 4 BR Fair Market Rent – 2008 (1) $928 $1,076 $1,293 $1,859 $2,047 Average Advertised Rents (2) NA $1,380 $1,748 $2,025 $2,476 (1) 40th percentile of market rents for Fiscal Year 2008 for San Jose-Sunnyvale-Santa Clara (Santa Clara County). (2) Based on a survey of 86 non-duplicative rental listings found on Craisglist.org and Apartments.com for the period of August 1-15, 2008. Source: U.S Department of Housing and Urban Development (HUD) (24 CFR Part 888), Oct. 2007 and Vernazza Wolfe Associates, Inc. As shown previously in Table III.9, a low-income, three-person household with an annual income of up to $76,400 could afford to pay a monthly gross rent (including utilities) of $1,910. Comparing Table III.9 to Table III.19, such a household could afford the fair market rent of $1,293 for a two-bedroom unit, assuming such a unit was available in Milpitas. This household would also be able to afford the average advertised rent of $1,748. However, a very low-income household of the same size, earning $47,750 per year, could only afford to pay a monthly rent of $1,194, and would therefore be unable to afford the FMR for a two-bedroom unit or pay the average advertised rent for a two-bedroom unit. Generally, low-income households (between 51% and 80% AMI) of one to four persons are able to afford the average priced rental units appropriate to their household sizes in Milpitas. However, affordable rental options are scarcer for larger, low-income households. For example, neither five- nor six-person, low-income households would be able to afford the average rents for four-bedroom units ($2,476). Also, very low-income and extremely low-income households earn just below what would be necessary to afford the fair market rent for units matched to their household sizes, with the single exception of studio apartments. Average advertised apartment rents are even less affordable for very low- and extremely low-income households, at all apartment sizes. Average rents in Milpitas have been steadily increasing during the second half of this decade. After falling on an annual basis between 2001 and 2005, rents began to increase again in 2006 as
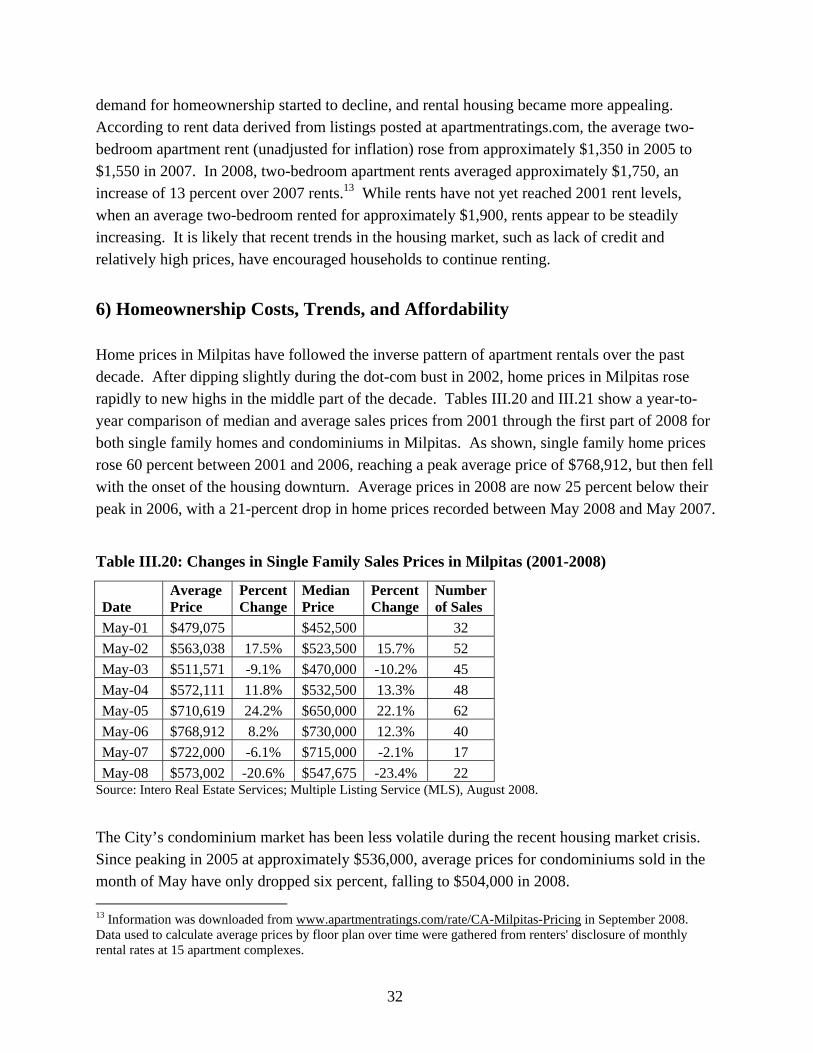
32
demand for homeownership started to decline, and rental housing became more appealing. According to rent data derived from listings posted at apartmentratings.com, the average two-bedroom apartment rent (unadjusted for inflation) rose from approximately $1,350 in 2005 to $1,550 in 2007. In 2008, two-bedroom apartment rents averaged approximately $1,750, an increase of 13 percent over 2007 rents.13 While rents have not yet reached 2001 rent levels, when an average two-bedroom rented for approximately $1,900, rents appear to be steadily increasing. It is likely that recent trends in the housing market, such as lack of credit and relatively high prices, have encouraged households to continue renting.
6) Homeownership Costs, Trends, and Affordability Home prices in Milpitas have followed the inverse pattern of apartment rentals over the past decade. After dipping slightly during the dot-com bust in 2002, home prices in Milpitas rose rapidly to new highs in the middle part of the decade. Tables III.20 and III.21 show a year-to-year comparison of median and average sales prices from 2001 through the first part of 2008 for both single family homes and condominiums in Milpitas. As shown, single family home prices rose 60 percent between 2001 and 2006, reaching a peak average price of $768,912, but then fell with the onset of the housing downturn. Average prices in 2008 are now 25 percent below their peak in 2006, with a 21-percent drop in home prices recorded between May 2008 and May 2007.
Table III.20: Changes in Single Family Sales Prices in Milpitas (2001-2008)
Date Average Price
Percent Change
Median Price
Percent Change
Number of Sales
May-01 $479,075 $452,500 32 May-02 $563,038 17.5% $523,500 15.7% 52 May-03 $511,571 -9.1% $470,000 -10.2% 45 May-04 $572,111 11.8% $532,500 13.3% 48 May-05 $710,619 24.2% $650,000 22.1% 62 May-06 $768,912 8.2% $730,000 12.3% 40 May-07 $722,000 -6.1% $715,000 -2.1% 17 May-08 $573,002 -20.6% $547,675 -23.4% 22
Source: Intero Real Estate Services; Multiple Listing Service (MLS), August 2008. The City’s condominium market has been less volatile during the recent housing market crisis. Since peaking in 2005 at approximately $536,000, average prices for condominiums sold in the month of May have only dropped six percent, falling to $504,000 in 2008. 13 Information was downloaded from www.apartmentratings.com/rate/CA-Milpitas-Pricing in September 2008. Data used to calculate average prices by floor plan over time were gathered from renters' disclosure of monthly rental rates at 15 apartment complexes.
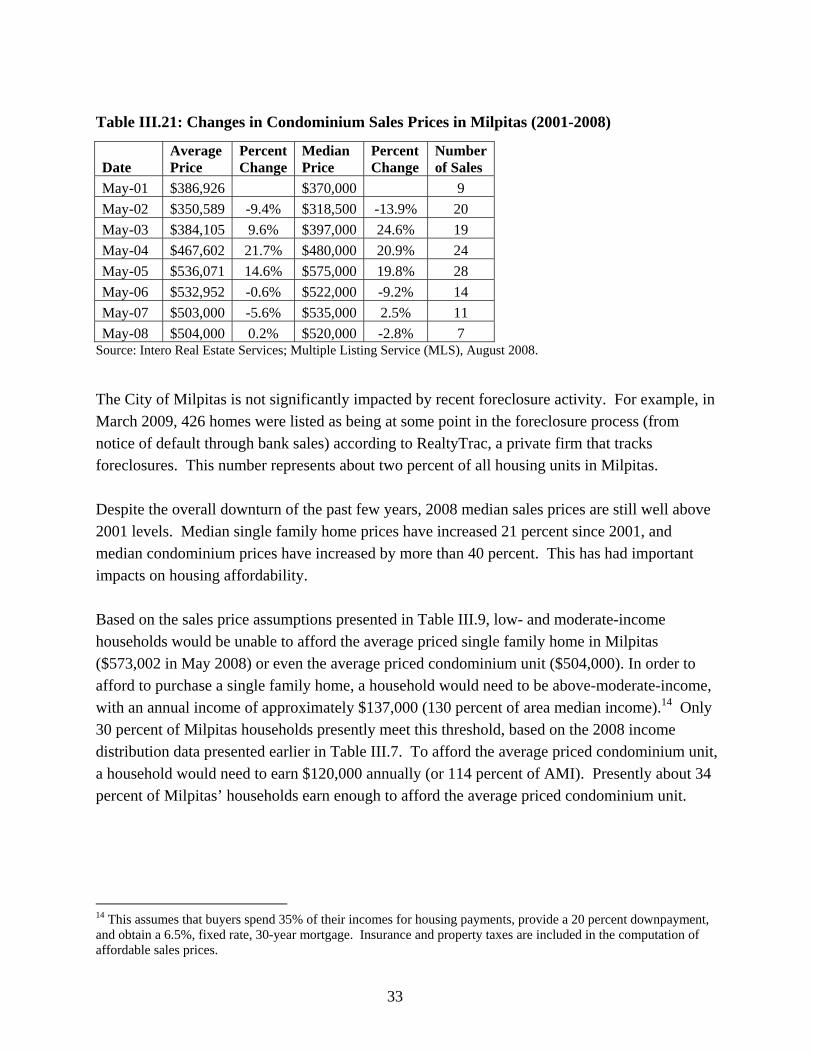
33
Table III.21: Changes in Condominium Sales Prices in Milpitas (2001-2008)
Date Average Price
Percent Change
Median Price
Percent Change
Number of Sales
May-01 $386,926 $370,000 9 May-02 $350,589 -9.4% $318,500 -13.9% 20 May-03 $384,105 9.6% $397,000 24.6% 19 May-04 $467,602 21.7% $480,000 20.9% 24 May-05 $536,071 14.6% $575,000 19.8% 28 May-06 $532,952 -0.6% $522,000 -9.2% 14 May-07 $503,000 -5.6% $535,000 2.5% 11 May-08 $504,000 0.2% $520,000 -2.8% 7
Source: Intero Real Estate Services; Multiple Listing Service (MLS), August 2008. The City of Milpitas is not significantly impacted by recent foreclosure activity. For example, in March 2009, 426 homes were listed as being at some point in the foreclosure process (from notice of default through bank sales) according to RealtyTrac, a private firm that tracks foreclosures. This number represents about two percent of all housing units in Milpitas. Despite the overall downturn of the past few years, 2008 median sales prices are still well above 2001 levels. Median single family home prices have increased 21 percent since 2001, and median condominium prices have increased by more than 40 percent. This has had important impacts on housing affordability. Based on the sales price assumptions presented in Table III.9, low- and moderate-income households would be unable to afford the average priced single family home in Milpitas ($573,002 in May 2008) or even the average priced condominium unit ($504,000). In order to afford to purchase a single family home, a household would need to be above-moderate-income, with an annual income of approximately $137,000 (130 percent of area median income).14 Only 30 percent of Milpitas households presently meet this threshold, based on the 2008 income distribution data presented earlier in Table III.7. To afford the average priced condominium unit, a household would need to earn $120,000 annually (or 114 percent of AMI). Presently about 34 percent of Milpitas’ households earn enough to afford the average priced condominium unit.
14 This assumes that buyers spend 35% of their incomes for housing payments, provide a 20 percent downpayment, and obtain a 6.5%, fixed rate, 30-year mortgage. Insurance and property taxes are included in the computation of affordable sales prices.
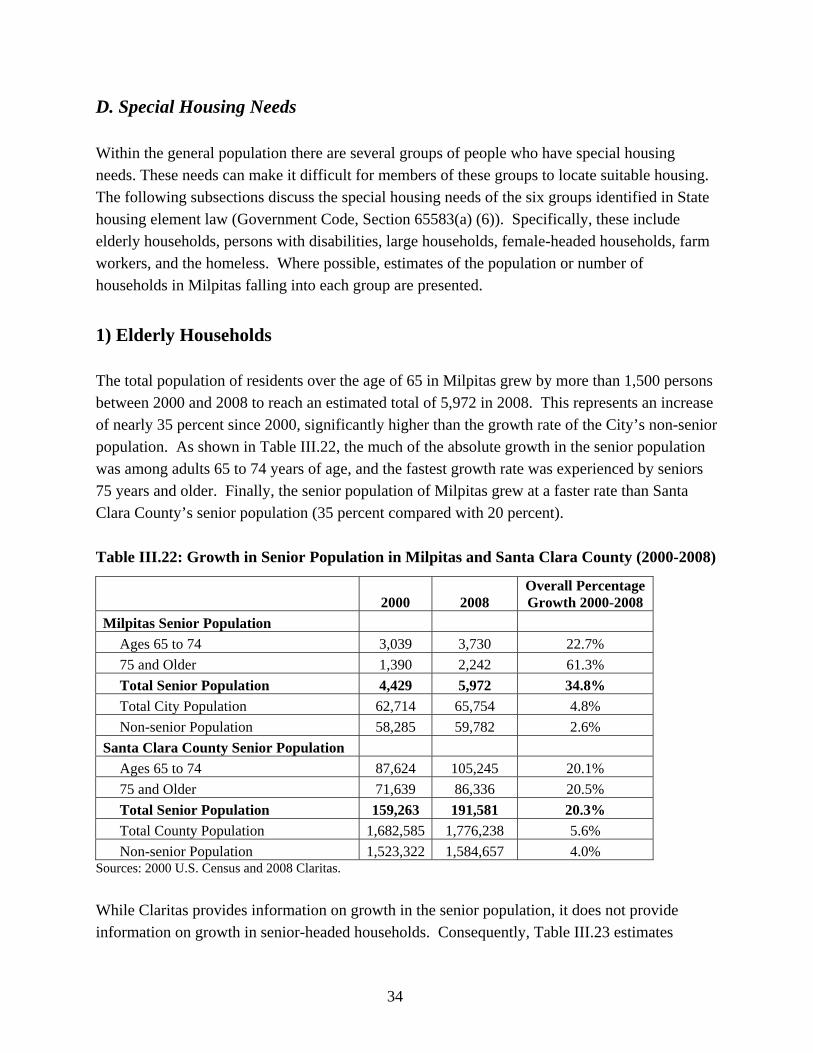
34
D. Special Housing Needs Within the general population there are several groups of people who have special housing needs. These needs can make it difficult for members of these groups to locate suitable housing. The following subsections discuss the special housing needs of the six groups identified in State housing element law (Government Code, Section 65583(a) (6)). Specifically, these include elderly households, persons with disabilities, large households, female-headed households, farm workers, and the homeless. Where possible, estimates of the population or number of households in Milpitas falling into each group are presented.
1) Elderly Households The total population of residents over the age of 65 in Milpitas grew by more than 1,500 persons between 2000 and 2008 to reach an estimated total of 5,972 in 2008. This represents an increase of nearly 35 percent since 2000, significantly higher than the growth rate of the City’s non-senior population. As shown in Table III.22, the much of the absolute growth in the senior population was among adults 65 to 74 years of age, and the fastest growth rate was experienced by seniors 75 years and older. Finally, the senior population of Milpitas grew at a faster rate than Santa Clara County’s senior population (35 percent compared with 20 percent). Table III.22: Growth in Senior Population in Milpitas and Santa Clara County (2000-2008)
2000 2008 Overall Percentage Growth 2000-2008
Milpitas Senior Population Ages 65 to 74 3,039 3,730 22.7% 75 and Older 1,390 2,242 61.3% Total Senior Population 4,429 5,972 34.8% Total City Population 62,714 65,754 4.8% Non-senior Population 58,285 59,782 2.6%
Santa Clara County Senior Population Ages 65 to 74 87,624 105,245 20.1% 75 and Older 71,639 86,336 20.5% Total Senior Population 159,263 191,581 20.3% Total County Population 1,682,585 1,776,238 5.6% Non-senior Population 1,523,322 1,584,657 4.0%
Sources: 2000 U.S. Census and 2008 Claritas. While Claritas provides information on growth in the senior population, it does not provide information on growth in senior-headed households. Consequently, Table III.23 estimates
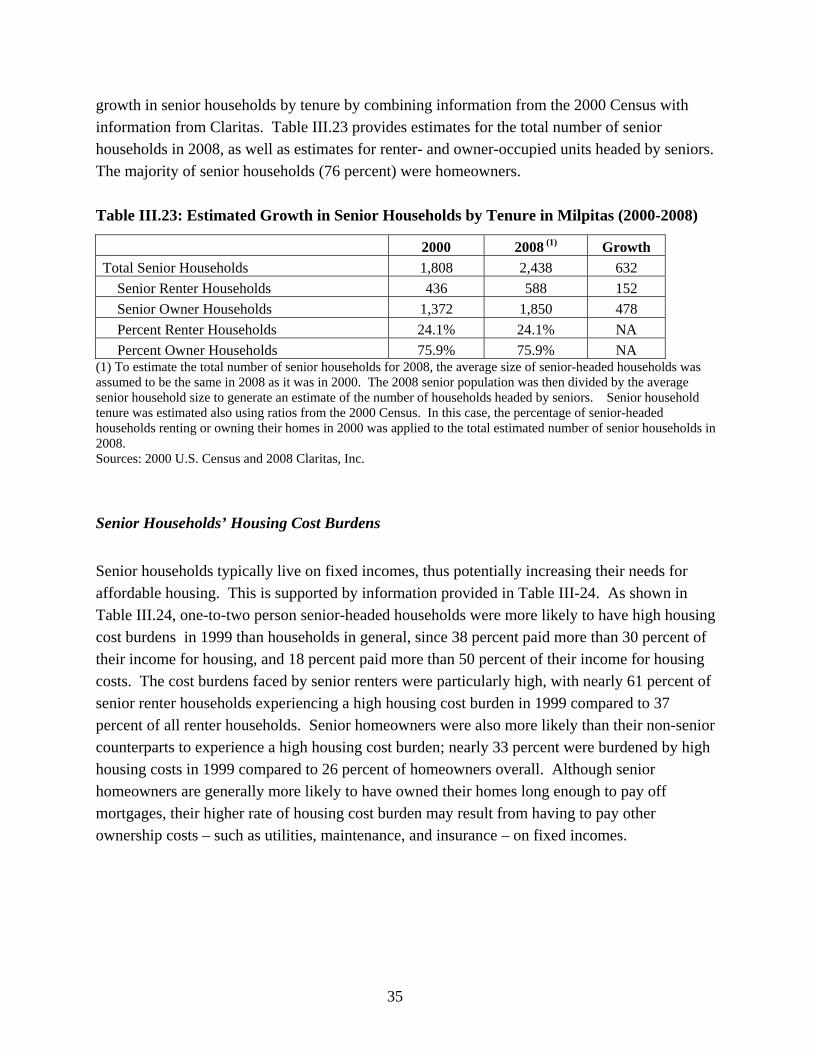
35
growth in senior households by tenure by combining information from the 2000 Census with information from Claritas. Table III.23 provides estimates for the total number of senior households in 2008, as well as estimates for renter- and owner-occupied units headed by seniors. The majority of senior households (76 percent) were homeowners. Table III.23: Estimated Growth in Senior Households by Tenure in Milpitas (2000-2008)
2000 2008 (1) Growth Total Senior Households 1,808 2,438 632
Senior Renter Households 436 588 152 Senior Owner Households 1,372 1,850 478 Percent Renter Households 24.1% 24.1% NA Percent Owner Households 75.9% 75.9% NA
(1) To estimate the total number of senior households for 2008, the average size of senior-headed households was assumed to be the same in 2008 as it was in 2000. The 2008 senior population was then divided by the average senior household size to generate an estimate of the number of households headed by seniors. Senior household tenure was estimated also using ratios from the 2000 Census. In this case, the percentage of senior-headed households renting or owning their homes in 2000 was applied to the total estimated number of senior households in 2008. Sources: 2000 U.S. Census and 2008 Claritas, Inc. Senior Households’ Housing Cost Burdens Senior households typically live on fixed incomes, thus potentially increasing their needs for affordable housing. This is supported by information provided in Table III-24. As shown in Table III.24, one-to-two person senior-headed households were more likely to have high housing cost burdens in 1999 than households in general, since 38 percent paid more than 30 percent of their income for housing, and 18 percent paid more than 50 percent of their income for housing costs. The cost burdens faced by senior renters were particularly high, with nearly 61 percent of senior renter households experiencing a high housing cost burden in 1999 compared to 37 percent of all renter households. Senior homeowners were also more likely than their non-senior counterparts to experience a high housing cost burden; nearly 33 percent were burdened by high housing costs in 1999 compared to 26 percent of homeowners overall. Although senior homeowners are generally more likely to have owned their homes long enough to pay off mortgages, their higher rate of housing cost burden may result from having to pay other ownership costs – such as utilities, maintenance, and insurance – on fixed incomes.
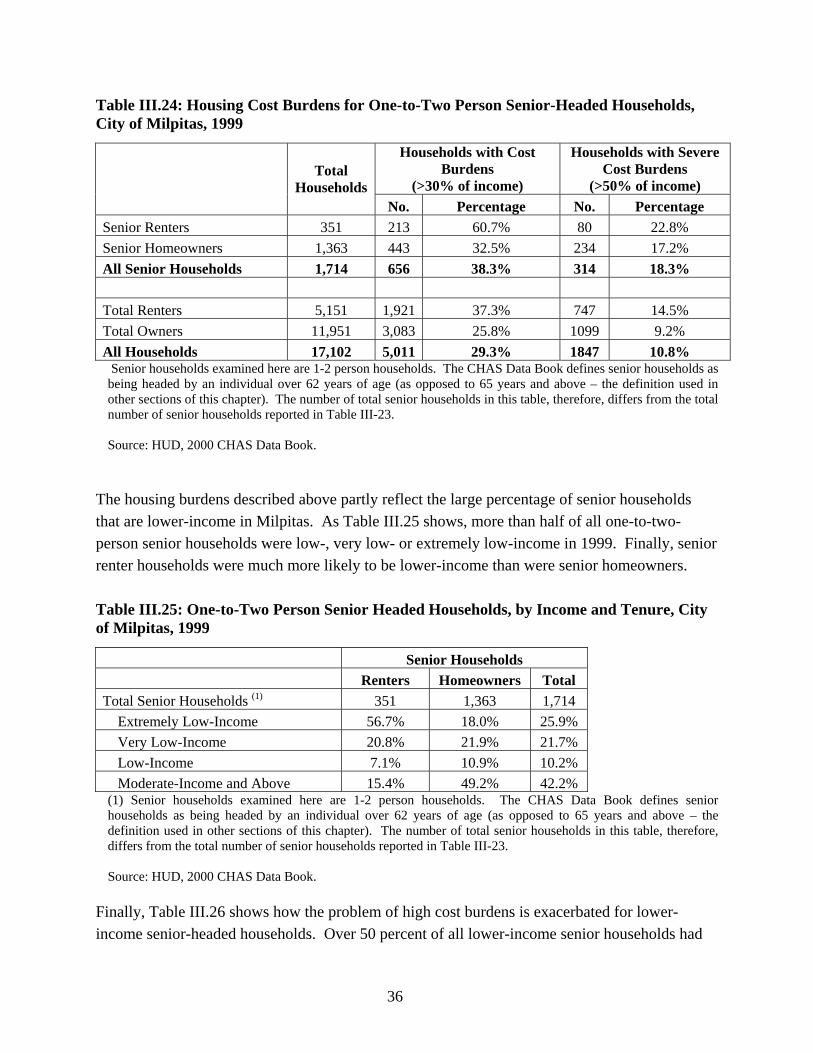
36
Table III.24: Housing Cost Burdens for One-to-Two Person Senior-Headed Households, City of Milpitas, 1999
Households with Cost Burdens
(>30% of income)
Households with Severe Cost Burdens
(>50% of income)
Total Households
No. Percentage No. Percentage Senior Renters 351 213 60.7% 80 22.8% Senior Homeowners 1,363 443 32.5% 234 17.2% All Senior Households 1,714 656 38.3% 314 18.3% Total Renters 5,151 1,921 37.3% 747 14.5% Total Owners 11,951 3,083 25.8% 1099 9.2% All Households 17,102 5,011 29.3% 1847 10.8% Senior households examined here are 1-2 person households. The CHAS Data Book defines senior households as being headed by an individual over 62 years of age (as opposed to 65 years and above – the definition used in other sections of this chapter). The number of total senior households in this table, therefore, differs from the total number of senior households reported in Table III-23. Source: HUD, 2000 CHAS Data Book.
The housing burdens described above partly reflect the large percentage of senior households that are lower-income in Milpitas. As Table III.25 shows, more than half of all one-to-two- person senior households were low-, very low- or extremely low-income in 1999. Finally, senior renter households were much more likely to be lower-income than were senior homeowners. Table III.25: One-to-Two Person Senior Headed Households, by Income and Tenure, City of Milpitas, 1999
Senior Households Renters Homeowners Total Total Senior Households (1) 351 1,363 1,714
Extremely Low-Income 56.7% 18.0% 25.9% Very Low-Income 20.8% 21.9% 21.7% Low-Income 7.1% 10.9% 10.2% Moderate-Income and Above 15.4% 49.2% 42.2%
(1) Senior households examined here are 1-2 person households. The CHAS Data Book defines senior households as being headed by an individual over 62 years of age (as opposed to 65 years and above – the definition used in other sections of this chapter). The number of total senior households in this table, therefore, differs from the total number of senior households reported in Table III-23.
Source: HUD, 2000 CHAS Data Book.
Finally, Table III.26 shows how the problem of high cost burdens is exacerbated for lower-income senior-headed households. Over 50 percent of all lower-income senior households had
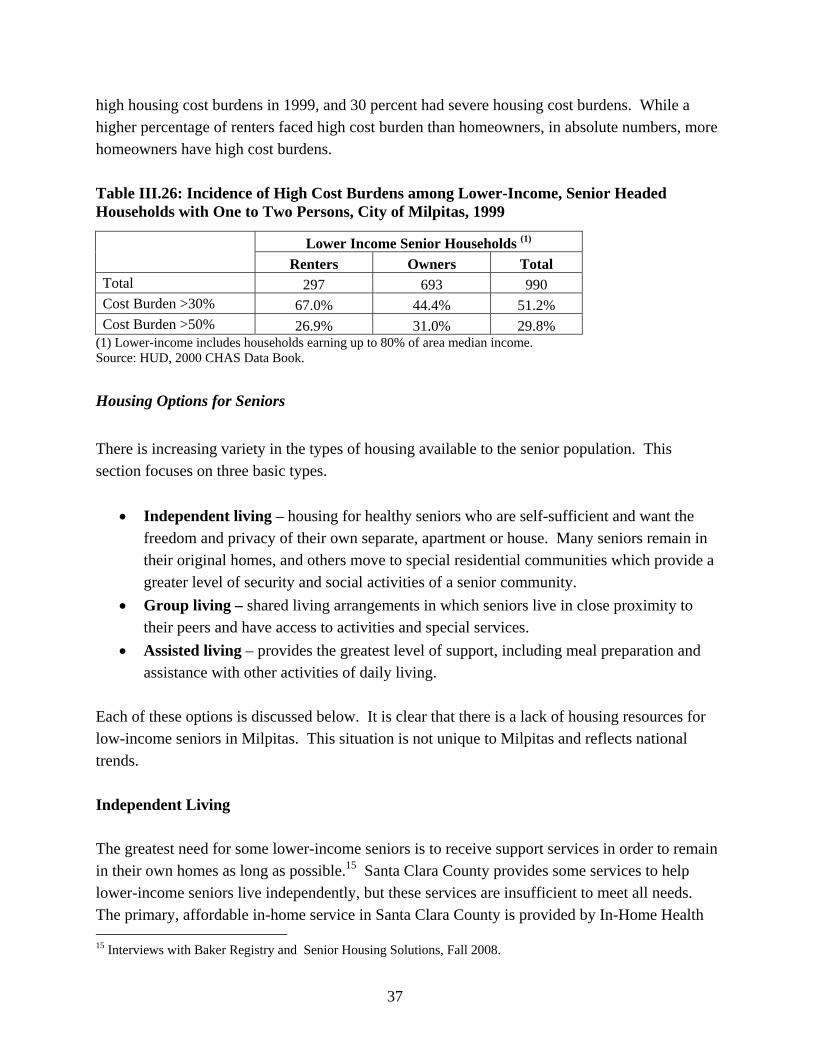
37
high housing cost burdens in 1999, and 30 percent had severe housing cost burdens. While a higher percentage of renters faced high cost burden than homeowners, in absolute numbers, more homeowners have high cost burdens. Table III.26: Incidence of High Cost Burdens among Lower-Income, Senior Headed Households with One to Two Persons, City of Milpitas, 1999
Lower Income Senior Households (1) Renters Owners Total Total 297 693 990 Cost Burden >30% 67.0% 44.4% 51.2% Cost Burden >50% 26.9% 31.0% 29.8%
(1) Lower-income includes households earning up to 80% of area median income. Source: HUD, 2000 CHAS Data Book. Housing Options for Seniors There is increasing variety in the types of housing available to the senior population. This section focuses on three basic types.
• Independent living – housing for healthy seniors who are self-sufficient and want the freedom and privacy of their own separate, apartment or house. Many seniors remain in their original homes, and others move to special residential communities which provide a greater level of security and social activities of a senior community.
• Group living – shared living arrangements in which seniors live in close proximity to their peers and have access to activities and special services.
• Assisted living – provides the greatest level of support, including meal preparation and assistance with other activities of daily living.
Each of these options is discussed below. It is clear that there is a lack of housing resources for low-income seniors in Milpitas. This situation is not unique to Milpitas and reflects national trends. Independent Living The greatest need for some lower-income seniors is to receive support services in order to remain in their own homes as long as possible.15 Santa Clara County provides some services to help lower-income seniors live independently, but these services are insufficient to meet all needs. The primary, affordable in-home service in Santa Clara County is provided by In-Home Health 15 Interviews with Baker Registry and Senior Housing Solutions, Fall 2008.

38
Services (IHHS), and the Multi-Service Program (MSP). IHHS provides help with cooking, housekeeping, and transportation. MSP offers teams of professionals who provide services like medication monitoring. The Council on Aging coordinates both service providers, and operates with limited state funding. These services meet a very small portion of the need.16 Since the senior population is projected to nearly double by the year 2020, demand for these in-home services can be expected to increase dramatically as well.17 An alternative to receiving support services in one’s own home is to live in an independent living development designed for seniors. Presently there are two affordable housing developments for lower-income seniors in Milpitas. The newer of the two, Devries Place, was completed in February of 2008. It was fully occupied in a short period of time. All 102 units are priced to be affordable to very low- and extremely low-income seniors. The development is located in a mixed-use district at the north end of the Midtown Specific Plan Area. The new Valley Health Center will be built next door to Devries Place in 2009, and a new Milpitas Public Library across the street has been completed and is open. Retail and transit are also within a short walking distance. Terrace Gardens, built in 1989, provides 148 units for very low-income seniors. A meal program is included. The development is located behind a shopping center, providing residents with easy access to retail goods, groceries and services. Waiting lists at each of these developments are substantial, providing strong evidence of unmet need. More than 150 people are on the waiting list for Devries Place, and new applicants are reportedly added to the list on a daily basis. Terrace Gardens also maintains a waiting list. This list ranges between several months to two years, depending on the affordability category and unit turnover. Additionally, in Fall 2008, there were 330 seniors from Milpitas on Santa Clara County’s Housing Authority’s Section 8 voucher waiting list. This is in addition to 116 Milpitas senior households that already have vouchers. Finally, the Barbara Lee Senior Center located in Milpitas reports that it receives between 30 and 40 inquiries from seniors for low-income housing per month. This request level remained steady during 2008. The City is building a new Senior Center and anticipates completion in late 2010.
16 Interview with the Executive Director, Senior Housing Solutions, August 26, 2008. 17 Projections of the County’s senior population are reported in Community for a Lifetime: A Ten Year Strategic Plan to Advance the Well-Being of Older Adults in Santa Clara County, The City of San Jose and the County of Santa Clara, 2005, p.13.
39
Affordable Group Living Senior Housing Solutions is a leading developer in Santa Clara County of shared senior housing, in which older adults share large, single family homes. Presently this non-profit operates a total of nine houses countywide, providing rooms for 37 seniors. Another three homes were under construction in the County in 2008. Four to five extremely low-income residents live in each house. In 2007, Senior Housing Solutions located its first shared home in Milpitas near Abel Street and Marylinn Drive. As of mid-2008, 130 people were on their waiting list. Ten of these individuals live in Milpitas. Senior Housing Solutions expects its waiting list to double once it advertises its new homes.18 The City of Milpitas has authorized another grant of $750,000 to Senior Housing Solutions for the development of another group house that will serve five extremely low-income seniors. Finally, the City supports a request for funding by Senior Housing Solutions to the Housing Trust Fund of Santa Clara County. Milpitas has pledged an additional $100,000 in support for this funding request to the Housing Trust Fund. Assisted Living Residential care facilities for the elderly (RCFE’s) offer state-licensed assisted living for people who need minimal assistance with personal care such as bathing, dressing, and grooming, and who need or want communal meals and social contact. Presently, there are a total of five licensed residential care homes for the elderly in Milpitas, with a combined capacity of 30 beds.19 The City provides CDBG funds to Catholic Charities of Santa Clara County Long Term Care Ombudsman Program to seek resolution to problems of seniors, to advocate for the rights of residents in long-term care facilities, and to investigate complaints. RCFE’s in Santa Clara County cost typically between $1,200 and $10,000 per month, with relatively few facilities at the low end of the price scale (even assuming shared rooms and minimal personal care), and more options in the $3000 to $4000 range.20 For those seniors who receive Supplemental Security Income (SSI), their benefit levels would cover only a small portion of this cost. In addition, neither Medi-Cal nor Medicaid assistance can be used to pay for rooms at RCFEs. This mismatch between income and residential costs underscores a need for more affordably priced residential care facilities.
18 Interview with Executive Director, Senior Housing Solutions, August 26, 2008. 19 State of California Community Care Licensing Division, Directory Report: Santa Clara County, April, 2008. 20 Interviews with Santa Clara Long-Term Care Ombudsman Program, Senior Registry and Baker Registry, September-October, 2008.
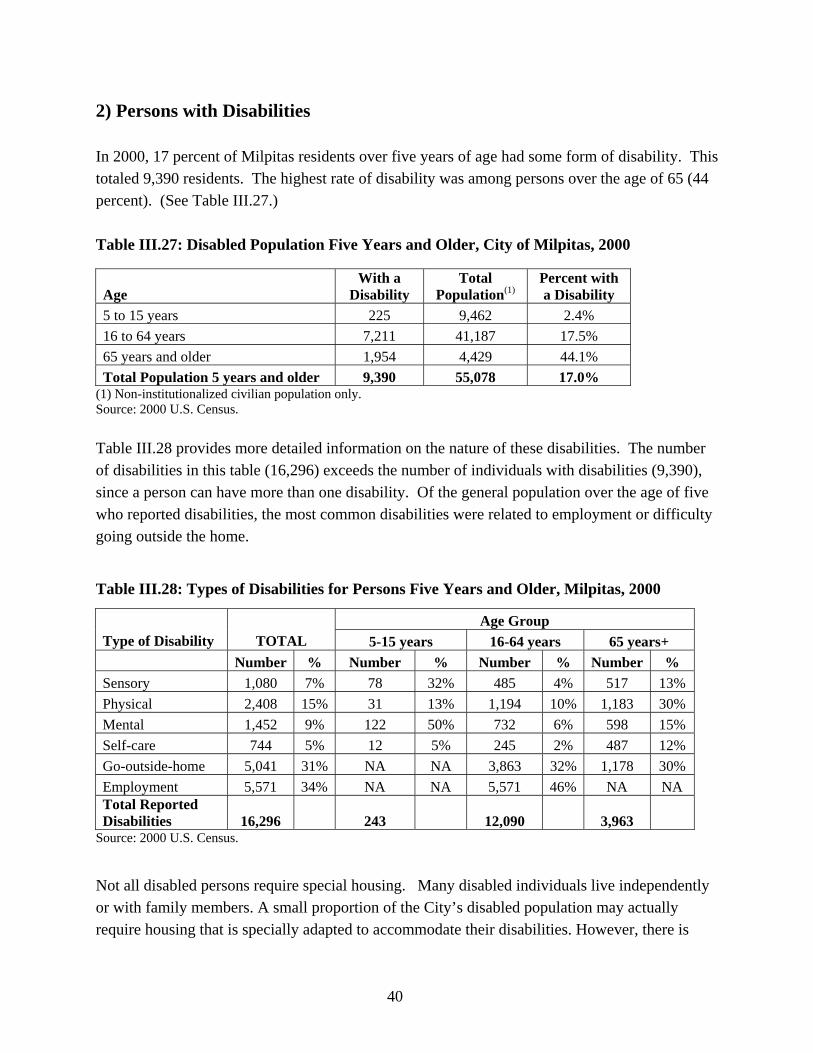
40
2) Persons with Disabilities In 2000, 17 percent of Milpitas residents over five years of age had some form of disability. This totaled 9,390 residents. The highest rate of disability was among persons over the age of 65 (44 percent). (See Table III.27.) Table III.27: Disabled Population Five Years and Older, City of Milpitas, 2000
Age With a
Disability Total
Population(1) Percent with a Disability
5 to 15 years 225 9,462 2.4% 16 to 64 years 7,211 41,187 17.5% 65 years and older 1,954 4,429 44.1% Total Population 5 years and older 9,390 55,078 17.0%
(1) Non-institutionalized civilian population only. Source: 2000 U.S. Census. Table III.28 provides more detailed information on the nature of these disabilities. The number of disabilities in this table (16,296) exceeds the number of individuals with disabilities (9,390), since a person can have more than one disability. Of the general population over the age of five who reported disabilities, the most common disabilities were related to employment or difficulty going outside the home.
Table III.28: Types of Disabilities for Persons Five Years and Older, Milpitas, 2000
Age Group Type of Disability TOTAL 5-15 years 16-64 years 65 years+ Number % Number % Number % Number % Sensory 1,080 7% 78 32% 485 4% 517 13% Physical 2,408 15% 31 13% 1,194 10% 1,183 30% Mental 1,452 9% 122 50% 732 6% 598 15% Self-care 744 5% 12 5% 245 2% 487 12% Go-outside-home 5,041 31% NA NA 3,863 32% 1,178 30% Employment 5,571 34% NA NA 5,571 46% NA NA Total Reported Disabilities 16,296 243 12,090 3,963
Source: 2000 U.S. Census. Not all disabled persons require special housing. Many disabled individuals live independently or with family members. A small proportion of the City’s disabled population may actually require housing that is specially adapted to accommodate their disabilities. However, there is
41
unmet need for affordable housing for disabled adults. For example, the Santa Clara County’s Housing Authority’s waiting list for Section 8 vouchers in 2008 included 191 Milpitas residents with disabilities. To understand the special housing needs of the City’s disabled population, this subsection provides information on three categories of disabled adults. These include housing for individuals with mental illness, the developmentally disabled, and the physically disabled. Housing for Individuals with Mental Illness The typical housing need for individuals with mental illness includes one-bedroom units, single room occupancy units (SRO’s), or shared housing. Each type of housing also requires supportive services. With the passage of the Mental Health Services Act in 2004, Santa Clara County Mental Health received $19 million to buy and build units for severely mentally ill individuals who are homeless or nearly homeless. The County’s Housing Plus Fund has also given the Mental Health Department $4 million for this purpose. County Mental Health expects to build about 150 units of supportive housing with these combined funds. Two affordable projects that provide supportive services are in the pipeline. These projects are funded through Mental Health Services Act and will be located in Santa Clara and San Jose. Other projects are being considered for Sunnyvale and San Jose. No housing developments for mentally ill homeless individuals are currently planned for Milpitas. However, according to the Mental Health Department, these resources are inadequate to meet the total need for affordable, supportive housing. According to the most recent census of the homeless, it is estimated that 23% of the 7,202 sheltered and unsheltered homeless individuals in Santa Clara County are mentally ill.21 Thus, the planned 150 housing units will fall short of the need represented by more than 1,600 estimated mentally ill homeless in the County.
Private organizations like InnVision operate a continuum of supportive housing options for homeless mentally ill individuals in Santa Clara County. These services are based in San Jose. For example, Julian Street Inn provides 70 emergency shelter beds to clients diagnosed with a mental illness. Stevens House provides transitional housing for eight “graduates” of the Julian
21 The information on the percent of the homeless population that is mentally ill is from the 2007 Homeless Census and Survey. Also, the estimate of the number of mentally ill homeless is likely to be conservative, since it is based on surveyed homeless who identified themselves as mentally ill.
42
Street Inn. A third housing development operated by InnVision provides permanent supportive housing for mentally ill single women.
Housing for the Developmentally Disabled Developmentally disabled individuals live with mental retardation, cerebral palsy, autism or other forms of learning or cognitive disabilities. According to the San Andreas Regional Center in Santa Clara County, there is a growing need for housing for the developmentally disabled in Milpitas. The Center estimates that 310 developmentally disabled individuals presently live in Milpitas. The vast majority lives with a parent, relative or legal guardian. The Housing Choice Coalition is the affordable housing arm of the San Andreas Regional Center and works with non-profits throughout Santa Clara County to develop special needs affordable housing coupled with supportive services that can allow developmentally disabled adults live independently. In 2008, there were a total of 1,400 developmentally disabled individuals on the Housing Choice Coalition’s waiting list for affordable housing. The Coalition has helped create 200 units in the past 11 years, and has five more projects in the pipeline. None of these developments is located in Milpitas. There are presently 10 residential care facilities in Milpitas for developmentally disabled adults, with a combined capacity to serve 57 individuals. Most operate to serve non-ambulatory disabled adults. Housing for the Physically Disabled The Silicon Valley Independent Living Center (SVILC) receives more than 245 requests each year for the placement of disabled persons in accessible housing. Only a small percentage of these persons can actually be placed because of the shortage of special housing and its cost. Since most of the individuals contacting SVILC are extremely low-income, they cannot afford market-rate rents. According to SVILC, twenty Milpitas residents contacted the Center for services in 2007. Out of the sixteen individuals who contacted the Center for housing, only four were actually placed. This low placement rate is due to a lack of accessible, affordable housing.
3) Large Households Large households, defined as households with five or more members, require housing units with three or more bedrooms in order not to be overcrowded. Since large households are frequently
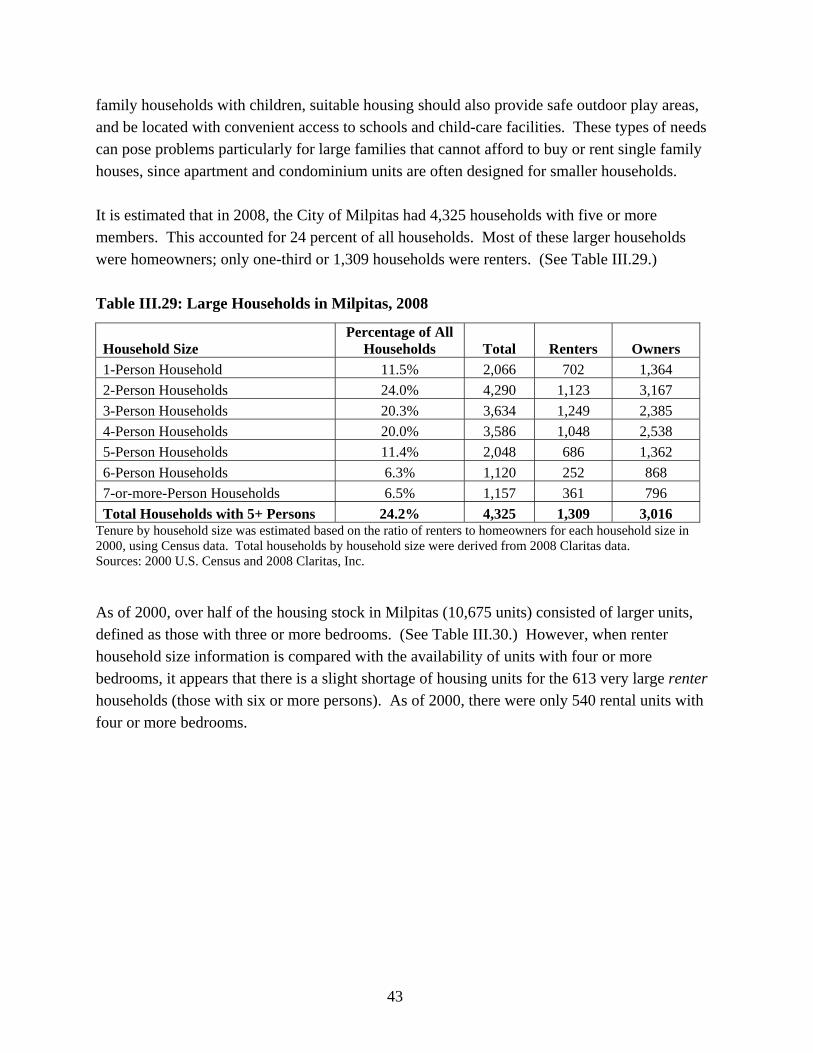
43
family households with children, suitable housing should also provide safe outdoor play areas, and be located with convenient access to schools and child-care facilities. These types of needs can pose problems particularly for large families that cannot afford to buy or rent single family houses, since apartment and condominium units are often designed for smaller households. It is estimated that in 2008, the City of Milpitas had 4,325 households with five or more members. This accounted for 24 percent of all households. Most of these larger households were homeowners; only one-third or 1,309 households were renters. (See Table III.29.) Table III.29: Large Households in Milpitas, 2008
Household Size Percentage of All
Households Total Renters Owners 1-Person Household 11.5% 2,066 702 1,364 2-Person Households 24.0% 4,290 1,123 3,167 3-Person Households 20.3% 3,634 1,249 2,385 4-Person Households 20.0% 3,586 1,048 2,538 5-Person Households 11.4% 2,048 686 1,362 6-Person Households 6.3% 1,120 252 868 7-or-more-Person Households 6.5% 1,157 361 796 Total Households with 5+ Persons 24.2% 4,325 1,309 3,016
Tenure by household size was estimated based on the ratio of renters to homeowners for each household size in 2000, using Census data. Total households by household size were derived from 2008 Claritas data. Sources: 2000 U.S. Census and 2008 Claritas, Inc.
As of 2000, over half of the housing stock in Milpitas (10,675 units) consisted of larger units, defined as those with three or more bedrooms. (See Table III.30.) However, when renter household size information is compared with the availability of units with four or more bedrooms, it appears that there is a slight shortage of housing units for the 613 very large renter households (those with six or more persons). As of 2000, there were only 540 rental units with four or more bedrooms.
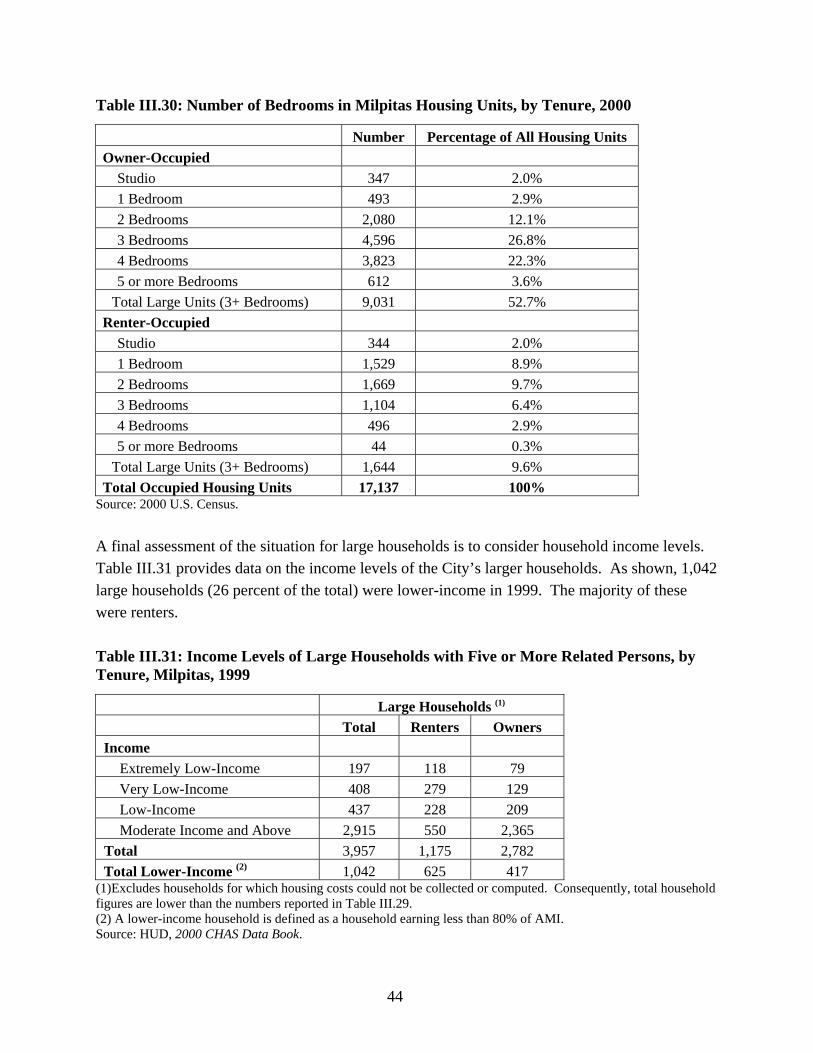
44
Table III.30: Number of Bedrooms in Milpitas Housing Units, by Tenure, 2000
Number Percentage of All Housing Units Owner-Occupied
Studio 347 2.0% 1 Bedroom 493 2.9% 2 Bedrooms 2,080 12.1% 3 Bedrooms 4,596 26.8% 4 Bedrooms 3,823 22.3% 5 or more Bedrooms 612 3.6%
Total Large Units (3+ Bedrooms) 9,031 52.7% Renter-Occupied
Studio 344 2.0% 1 Bedroom 1,529 8.9% 2 Bedrooms 1,669 9.7% 3 Bedrooms 1,104 6.4% 4 Bedrooms 496 2.9% 5 or more Bedrooms 44 0.3%
Total Large Units (3+ Bedrooms) 1,644 9.6% Total Occupied Housing Units 17,137 100%
Source: 2000 U.S. Census. A final assessment of the situation for large households is to consider household income levels. Table III.31 provides data on the income levels of the City’s larger households. As shown, 1,042 large households (26 percent of the total) were lower-income in 1999. The majority of these were renters. Table III.31: Income Levels of Large Households with Five or More Related Persons, by Tenure, Milpitas, 1999
Large Households (1)
Total Renters Owners Income
Extremely Low-Income 197 118 79 Very Low-Income 408 279 129 Low-Income 437 228 209 Moderate Income and Above 2,915 550 2,365
Total 3,957 1,175 2,782 Total Lower-Income (2) 1,042 625 417
(1)Excludes households for which housing costs could not be collected or computed. Consequently, total household figures are lower than the numbers reported in Table III.29. (2) A lower-income household is defined as a household earning less than 80% of AMI. Source: HUD, 2000 CHAS Data Book.
45
When planning for new multifamily housing developments, therefore, the provision of housing for the largest households is an important consideration. The new and proposed units in the City of Milpitas are not large, primarily because they are multifamily units. Over half of the new units recently built or under construction have an average size below 1,050 square feet. In contrast, of the approximately 530 re-sales of existing single family homes in 2006, the median size was 1,588 square feet, and the average size was 1,712 square feet, significantly larger than new multifamily housing units.
The number of bedrooms in the new multifamily units also reflects the size difference between existing single family housing stock and new housing development. In new developments, the median number of bedrooms is two; in comparison the median number of bedrooms in existing single family units that sold in 2006 was three. Finally, out of 2,662 new housing units built since 2000, there are only 11 four-bedroom units, and less than half of all units (1,068 units out of 2,662) consist of three or more bedrooms. The need for an adequate supply of rental units for very large renter households (mentioned above) is magnified for lower-income, very large renter households whose limited incomes may preclude them from renting single family homes with four or more bedrooms.
4) Female-Headed Households Female-headed households are households of at least two persons (related or unrelated) headed by a woman. As of 2008, it is estimated that there are 1,940 female-headed households in Milpitas, representing 11 percent of all households in 2008.22 (See Table III.32.) A very small proportion of female-headed households in Milpitas (approximately one percent) fall below the poverty level. This is lower than overall poverty rate among Milpitas’ households in 2008 (estimated at three percent).
22 A female-headed household is defined as a family or non-family household, headed by a female, consisting of at least two persons.
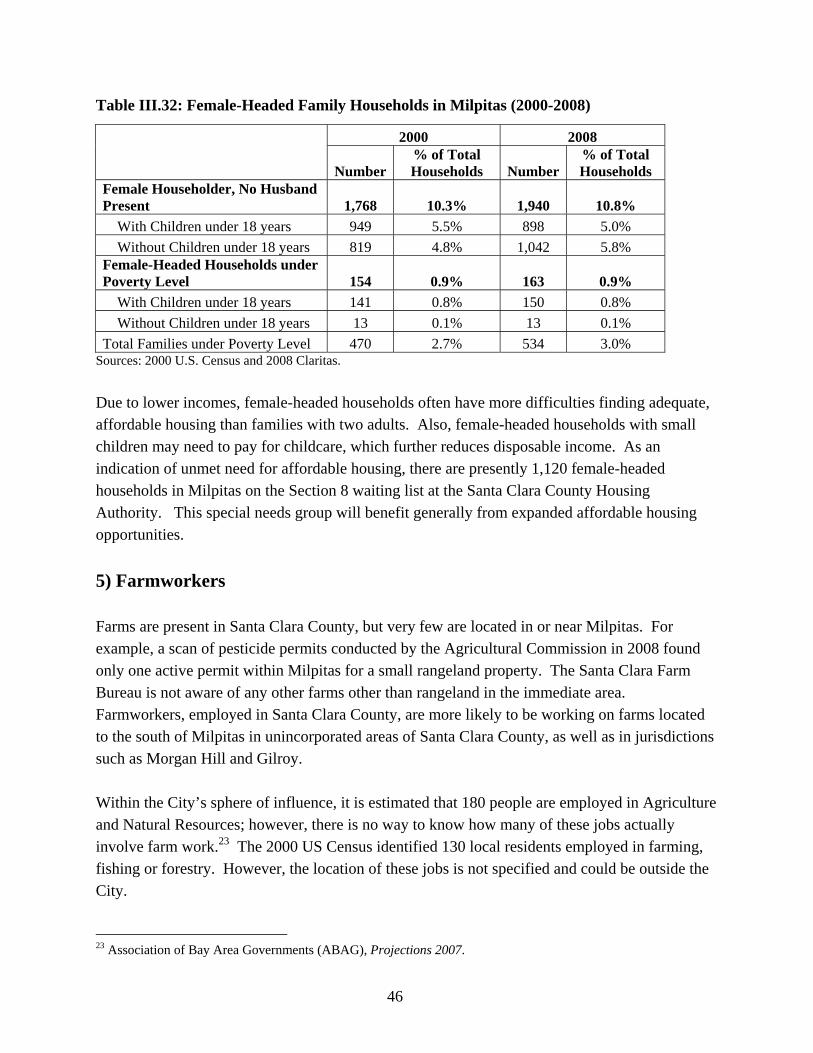
46
Table III.32: Female-Headed Family Households in Milpitas (2000-2008)
2000 2008
Number% of Total Households Number
% of Total Households
Female Householder, No Husband Present 1,768 10.3% 1,940 10.8%
With Children under 18 years 949 5.5% 898 5.0% Without Children under 18 years 819 4.8% 1,042 5.8%
Female-Headed Households under Poverty Level 154 0.9% 163 0.9%
With Children under 18 years 141 0.8% 150 0.8% Without Children under 18 years 13 0.1% 13 0.1%
Total Families under Poverty Level 470 2.7% 534 3.0% Sources: 2000 U.S. Census and 2008 Claritas. Due to lower incomes, female-headed households often have more difficulties finding adequate, affordable housing than families with two adults. Also, female-headed households with small children may need to pay for childcare, which further reduces disposable income. As an indication of unmet need for affordable housing, there are presently 1,120 female-headed households in Milpitas on the Section 8 waiting list at the Santa Clara County Housing Authority. This special needs group will benefit generally from expanded affordable housing opportunities. 5) Farmworkers Farms are present in Santa Clara County, but very few are located in or near Milpitas. For example, a scan of pesticide permits conducted by the Agricultural Commission in 2008 found only one active permit within Milpitas for a small rangeland property. The Santa Clara Farm Bureau is not aware of any other farms other than rangeland in the immediate area. Farmworkers, employed in Santa Clara County, are more likely to be working on farms located to the south of Milpitas in unincorporated areas of Santa Clara County, as well as in jurisdictions such as Morgan Hill and Gilroy. Within the City’s sphere of influence, it is estimated that 180 people are employed in Agriculture and Natural Resources; however, there is no way to know how many of these jobs actually involve farm work.23 The 2000 US Census identified 130 local residents employed in farming, fishing or forestry. However, the location of these jobs is not specified and could be outside the City. 23 Association of Bay Area Governments (ABAG), Projections 2007.
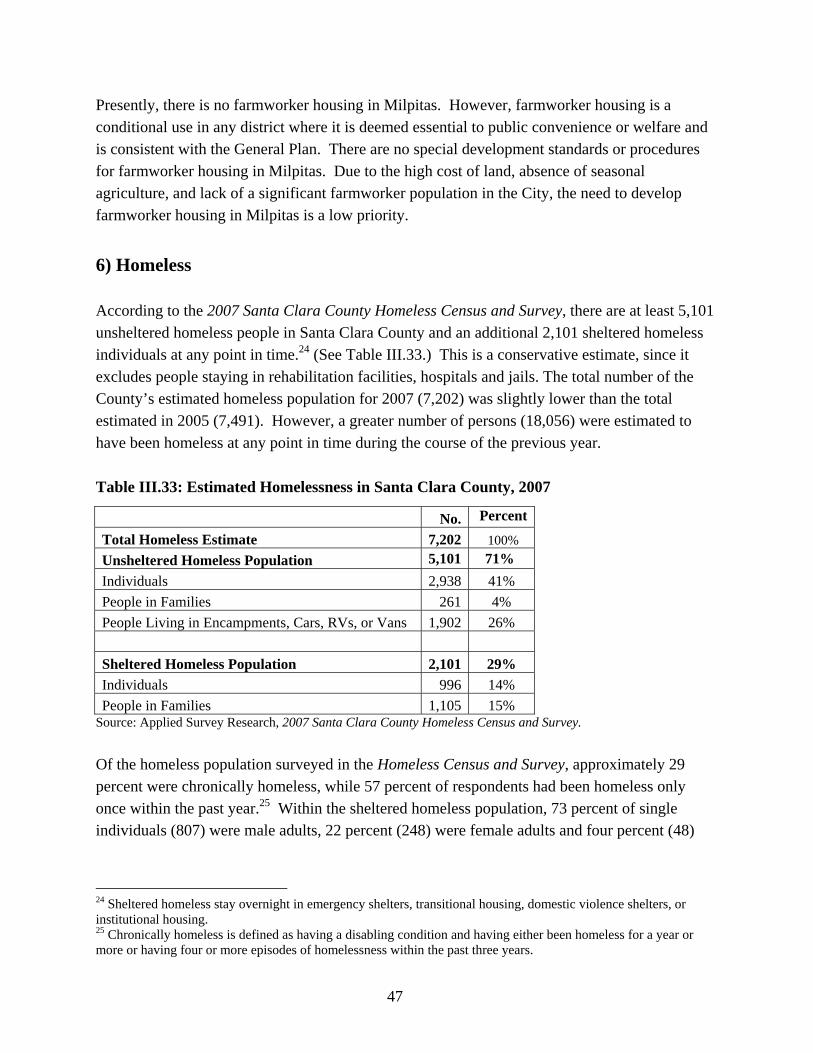
47
Presently, there is no farmworker housing in Milpitas. However, farmworker housing is a conditional use in any district where it is deemed essential to public convenience or welfare and is consistent with the General Plan. There are no special development standards or procedures for farmworker housing in Milpitas. Due to the high cost of land, absence of seasonal agriculture, and lack of a significant farmworker population in the City, the need to develop farmworker housing in Milpitas is a low priority.
6) Homeless According to the 2007 Santa Clara County Homeless Census and Survey, there are at least 5,101 unsheltered homeless people in Santa Clara County and an additional 2,101 sheltered homeless individuals at any point in time.24 (See Table III.33.) This is a conservative estimate, since it excludes people staying in rehabilitation facilities, hospitals and jails. The total number of the County’s estimated homeless population for 2007 (7,202) was slightly lower than the total estimated in 2005 (7,491). However, a greater number of persons (18,056) were estimated to have been homeless at any point in time during the course of the previous year. Table III.33: Estimated Homelessness in Santa Clara County, 2007
No. Percent
Total Homeless Estimate 7,202 100% Unsheltered Homeless Population 5,101 71% Individuals 2,938 41% People in Families 261 4% People Living in Encampments, Cars, RVs, or Vans 1,902 26% Sheltered Homeless Population 2,101 29% Individuals 996 14% People in Families 1,105 15%
Source: Applied Survey Research, 2007 Santa Clara County Homeless Census and Survey. Of the homeless population surveyed in the Homeless Census and Survey, approximately 29 percent were chronically homeless, while 57 percent of respondents had been homeless only once within the past year.25 Within the sheltered homeless population, 73 percent of single individuals (807) were male adults, 22 percent (248) were female adults and four percent (48)
24 Sheltered homeless stay overnight in emergency shelters, transitional housing, domestic violence shelters, or institutional housing. 25 Chronically homeless is defined as having a disabling condition and having either been homeless for a year or more or having four or more episodes of homelessness within the past three years.
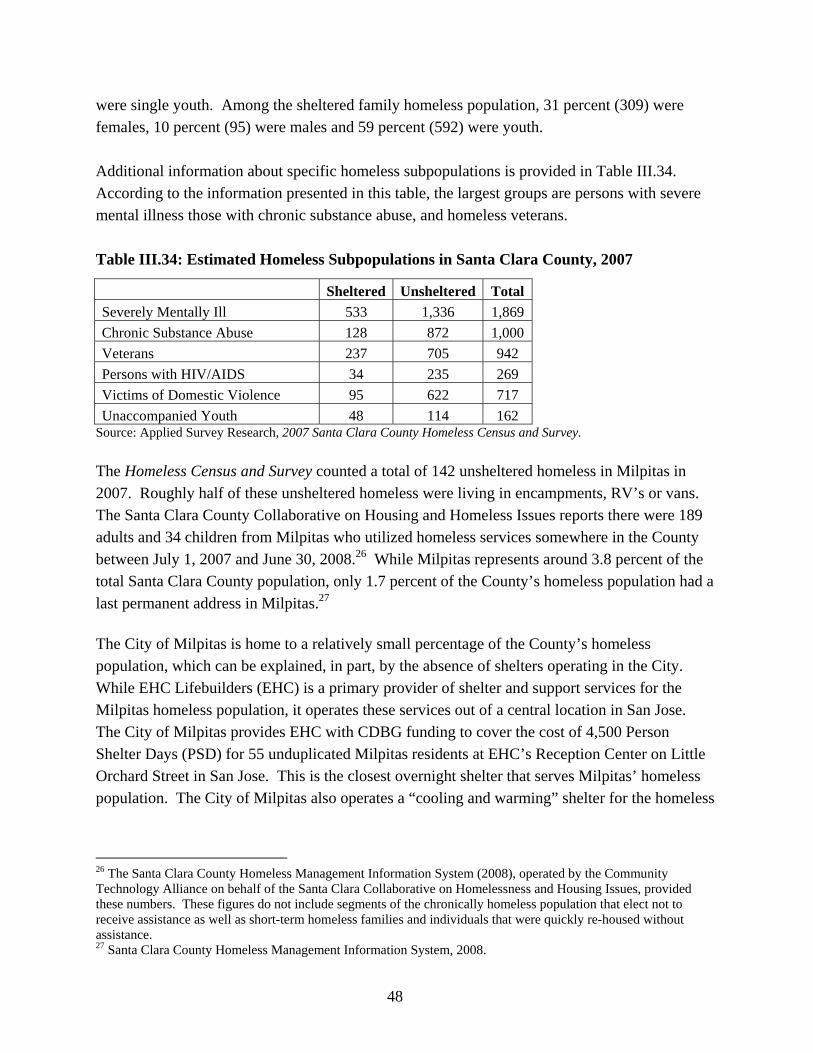
48
were single youth. Among the sheltered family homeless population, 31 percent (309) were females, 10 percent (95) were males and 59 percent (592) were youth. Additional information about specific homeless subpopulations is provided in Table III.34. According to the information presented in this table, the largest groups are persons with severe mental illness those with chronic substance abuse, and homeless veterans. Table III.34: Estimated Homeless Subpopulations in Santa Clara County, 2007
Sheltered Unsheltered Total Severely Mentally Ill 533 1,336 1,869 Chronic Substance Abuse 128 872 1,000 Veterans 237 705 942 Persons with HIV/AIDS 34 235 269 Victims of Domestic Violence 95 622 717 Unaccompanied Youth 48 114 162
Source: Applied Survey Research, 2007 Santa Clara County Homeless Census and Survey.
The Homeless Census and Survey counted a total of 142 unsheltered homeless in Milpitas in 2007. Roughly half of these unsheltered homeless were living in encampments, RV’s or vans. The Santa Clara County Collaborative on Housing and Homeless Issues reports there were 189 adults and 34 children from Milpitas who utilized homeless services somewhere in the County between July 1, 2007 and June 30, 2008.26 While Milpitas represents around 3.8 percent of the total Santa Clara County population, only 1.7 percent of the County’s homeless population had a last permanent address in Milpitas.27
The City of Milpitas is home to a relatively small percentage of the County’s homeless population, which can be explained, in part, by the absence of shelters operating in the City. While EHC Lifebuilders (EHC) is a primary provider of shelter and support services for the Milpitas homeless population, it operates these services out of a central location in San Jose. The City of Milpitas provides EHC with CDBG funding to cover the cost of 4,500 Person Shelter Days (PSD) for 55 unduplicated Milpitas residents at EHC’s Reception Center on Little Orchard Street in San Jose. This is the closest overnight shelter that serves Milpitas’ homeless population. The City of Milpitas also operates a “cooling and warming” shelter for the homeless
26 The Santa Clara County Homeless Management Information System (2008), operated by the Community Technology Alliance on behalf of the Santa Clara Collaborative on Homelessness and Housing Issues, provided these numbers. These figures do not include segments of the chronically homeless population that elect not to receive assistance as well as short-term homeless families and individuals that were quickly re-housed without assistance. 27 Santa Clara County Homeless Management Information System, 2008.
49
in the City’s Sports Center, but does not provide overnight housing there. In addition, during the Winter, the City provides daytime warming centers at the City’s Community and Senior Centers. Despite its relatively small homeless population, however, the City of Milpitas has been collaborating with other jurisdictions in Santa Clara County to address the homeless problem regionally, due to the shifting nature of homelessness in Santa Clara County and the tendency of people to move between cities to find work or housing. This collaboration includes supporting regional efforts to build additional transitional and permanent housing with supportive services. As of January 2007, Santa Clara County provided the following resources:
• 744 year-round shelter beds (320 for families, 424 for individuals); • 250 seasonal shelter beds; • 1,445 transitional housing beds (1,064 for families, 381 for individuals), and • 1,170 permanent supportive housing beds (724 for families, 446 for individuals).
An additional 283 beds of permanent supportive housing were under development as of early 2007.28 Unmet need for 121 transitional housing beds and 2,346 permanent supportive housing beds remains, according to the Santa Clara Collaborative on Housing and Homeless Issues. The need for emergency shelter beds is harder to gauge. Emergency shelters for individuals in the County tend to be full, and shelters for families are almost always full, though this does not necessarily suggest a need for more shelter beds at present time according to the County Collaborative.29 The Santa Clara County Housing Authority sets aside two types of vouchers for chronically homeless individuals, totaling 200 Section 8 vouchers. The waiting list for these vouchers is lengthy and closed. Additionally, the Housing Authority offers Shelter Plus Care vouchers for people with disabilities. These are coupled with case management and supportive services. The waiting list for these is closed as well.
28 Santa Clara County Collaborative on Housing and Homeless Issues, San Jose/Santa Clara City & County Continuum of Care Application, 2007. 29 Interview with Secretary of the Board, Santa Clara County Collaborative on Housing and Homeless Issues, August 29, 2008.
50
E. Opportunities for Energy Conservation The purpose of assessing opportunities for energy conservation is to document how the City assists residential development to conserve energy and secondly to understand how energy conservation can reduce overall housing costs by reducing PG&E bills. The City of Milpitas primarily facilitates energy conservation through its residential development and zoning policies. These policies are reflected in the Midtown and Transit Area Specific Plans which recommend that the City undertake rezoning of many underutilized parcels to higher densities. The Specific Area Plans also recommended the use of a Transit Oriented Development Overlay District that provides for higher building heights for the R3, R4, MXD, and MXD3 districts. Through the adoption of higher densities near transit, the City encourages the use of transit which reduces reliance on private automobiles and associated carbon emissions. In addition, the City’s Transit Area Specific Plan (TASP) promotes walking and biking for short internal trips. For example, the TASP requires new development to install sidewalks, and the City intends to provide pedestrian bridges over major streets, such as Great Mall Parkway, Capitol Avenue, and Montague Expressway. The City continues to enforce California Energy Commission’s Title 24 standards for energy efficiency. Finally, in 2008, the City adopted Resolution No. 7735 for Green Building Policies. A summary of the key provisions of this Resolution which covers both residential and non-residential building is as follows:
• The U.S. Green Building Council’s LEED rating system for non-residential buildings and Built It Green’s GreenPoint Rated system for residential buildings have been adopted as the official green building standards for the City of Milpitas.
• Planning applications for new buildings submitted after March 1, 2008 must include a completed LEED or GreenPoint Rated checklist for informational purposes.
• New city buildings and renovation projects over 5,000 square feet initiated after March 1, 2008 are now required to be evaluated for feasibility to achieve at least a LEED Silver certification.
• Finally, the City will be adopting a Green Building Ordinance by the end of 2009. In addition, the City provides outreach on an ongoing basis to residents about the Pacific Gas and Electric Energy Partners Program. This program provides low-income customers with free weatherization services and energy-efficient appliances to reduce gas and electricity uses. This
51
is the principal way in which the City currently promotes energy conservation opportunities unrelated to new development or renovations.
F. Affordable Housing and at Risk Projects 1) Inventory of Existing Affordable Units The City of Milpitas is home to seven affordable housing developments (including an acquisition/rehabilitation of a four-plex), and ten mixed-income developments, including four that are under construction. Additional mixed-income developments have been approved. (See Chapter IV.) Table III.35 presents the inventory of affordable housing units in the City of Milpitas. There are 1,151 affordable housing units in Milpitas. One of these units is a group home serving five extremely low-income seniors; there are 730 units available to very low-income households, 186 units available to low-income households, and finally, there are 234 units earmarked for moderate-income households. This table also indicates the earliest dates of termination of affordability restrictions for each of the listed projects. Of the 17 affordable and mixed-income projects listed in Table III.35, six have affordability restrictions which are not subject to expiration, and ten have restrictions which will expire beyond the planning horizon of this Housing Element. However, affordability restrictions for 149 affordable units at Sunnyhills Apartments are due to expire in 2011.
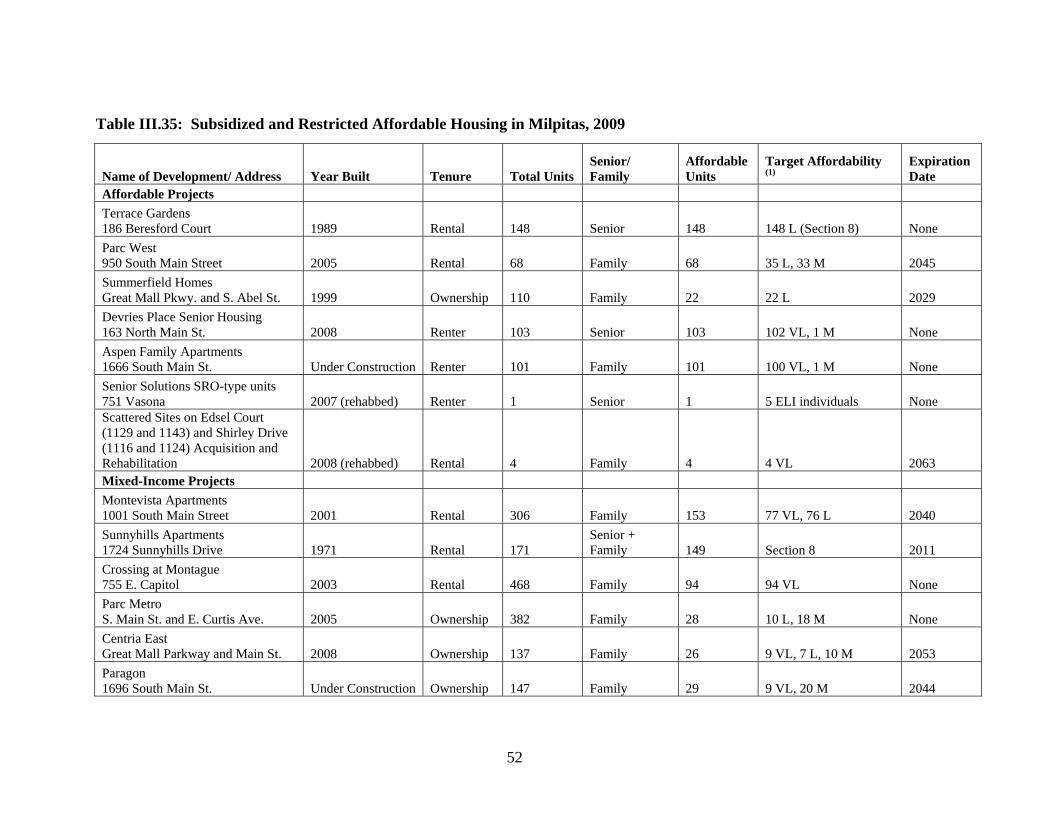
52
Table III.35: Subsidized and Restricted Affordable Housing in Milpitas, 2009
Name of Development/ Address Year Built Tenure Total Units Senior/ Family
Affordable Units
Target Affordability (1)
Expiration Date
Affordable Projects Terrace Gardens 186 Beresford Court 1989 Rental 148 Senior 148 148 L (Section 8) None Parc West 950 South Main Street 2005 Rental 68 Family 68 35 L, 33 M 2045 Summerfield Homes Great Mall Pkwy. and S. Abel St. 1999 Ownership 110 Family 22 22 L 2029 Devries Place Senior Housing 163 North Main St. 2008 Renter 103 Senior 103 102 VL, 1 M None Aspen Family Apartments 1666 South Main St. Under Construction Renter 101 Family 101 100 VL, 1 M None Senior Solutions SRO-type units 751 Vasona 2007 (rehabbed) Renter 1 Senior 1 5 ELI individuals None Scattered Sites on Edsel Court (1129 and 1143) and Shirley Drive (1116 and 1124) Acquisition and Rehabilitation 2008 (rehabbed) Rental 4 Family 4 4 VL 2063 Mixed-Income Projects Montevista Apartments 1001 South Main Street 2001 Rental 306 Family 153 77 VL, 76 L 2040 Sunnyhills Apartments 1724 Sunnyhills Drive 1971 Rental 171
Senior + Family 149 Section 8 2011
Crossing at Montague 755 E. Capitol 2003 Rental 468 Family 94 94 VL None Parc Metro S. Main St. and E. Curtis Ave. 2005 Ownership 382 Family 28 10 L, 18 M None Centria East Great Mall Parkway and Main St. 2008 Ownership 137 Family 26 9 VL, 7 L, 10 M 2053 Paragon 1696 South Main St. Under Construction Ownership 147 Family 29 9 VL, 20 M 2044
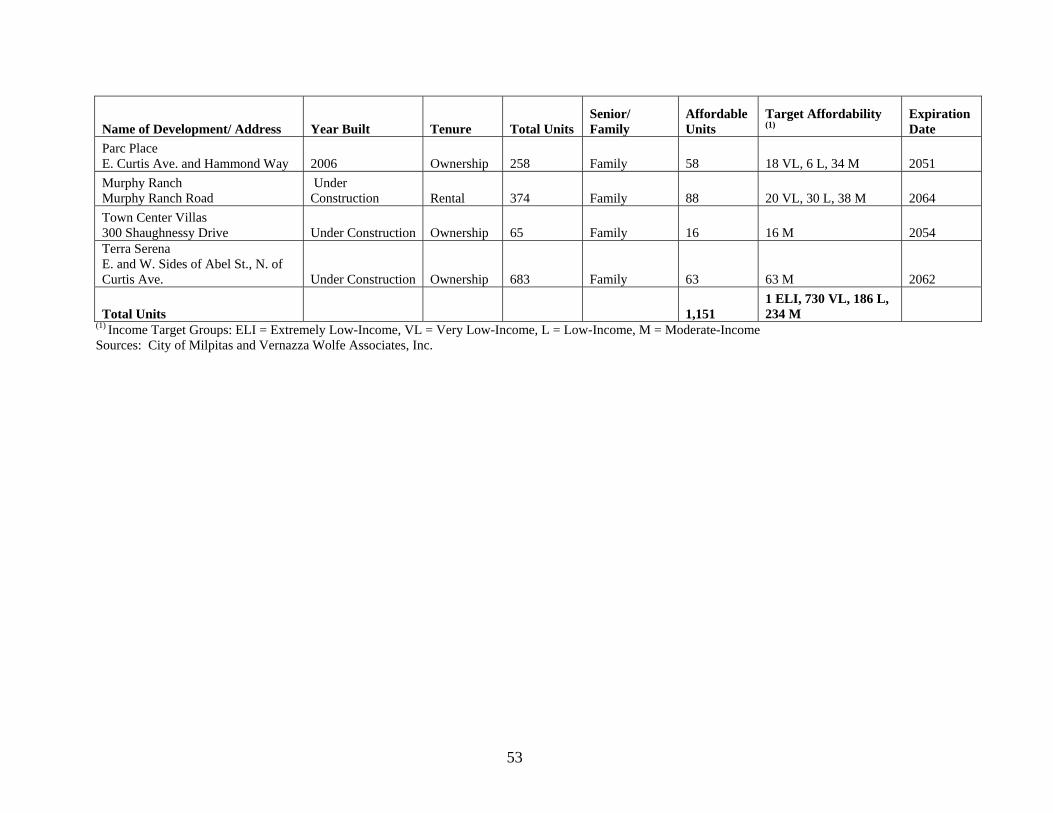
53
Name of Development/ Address Year Built Tenure Total Units Senior/ Family
Affordable Units
Target Affordability (1)
Expiration Date
Parc Place E. Curtis Ave. and Hammond Way 2006 Ownership 258 Family 58 18 VL, 6 L, 34 M 2051 Murphy Ranch Murphy Ranch Road
Under Construction Rental 374 Family 88 20 VL, 30 L, 38 M 2064
Town Center Villas 300 Shaughnessy Drive Under Construction Ownership 65 Family 16 16 M 2054 Terra Serena E. and W. Sides of Abel St., N. of Curtis Ave. Under Construction Ownership 683 Family 63 63 M 2062
Total Units 1,151 1 ELI, 730 VL, 186 L, 234 M
(1) Income Target Groups: ELI = Extremely Low-Income, VL = Very Low-Income, L = Low-Income, M = Moderate-Income Sources: City of Milpitas and Vernazza Wolfe Associates, Inc.
54
2) At-Risk Projects State law requires that housing elements include an inventory of all publicly assisted multifamily rental housing projects within the local jurisdiction that are at risk of conversion to uses other than low-income residential during the current planning period and the subsequent five years (2009 through 2019). For those units found to be at risk of conversion, the Housing Element must estimate the cost to preserve or replace the at-risk units, to identify the resources available to help in the preservation or replacement of those units, and to identify those organizations that could assist in these efforts. Since Sunnyhills Apartments is the only development at risk of market rate conversion, this subsection of the Housing Element provides information on preservation and replacement costs for the Sunnyhills at-risk units. Originally financed under the Section 236 and Section 8 programs in 1981, the project owner attempted to prepay their mortgage in 1990 under Sections 220 and 221 of the Low Income Housing Preservation and Resident Homeownership Act of 1990 (LIHPRHA). Originally a total of 104 units were supported through HUD project-based Section 8 vouchers. Through the efforts of the City and HUD, project sponsors entered into a revised Plan of Action in December 1991 in which project affordability restrictions were retained in exchange for a modest increase in rental payments, and funding of an additional 45 project-based Section 8 units, for a total of 149 affordable units. Under this revised 20-year agreement between HUD and the JMK Sunnyhills Investors II, affordability restrictions are in place until October 1, 2011. Currently, the subsidy provided averages $950 per unit monthly. According to the owner, HUD has not yet discussed the continuation of the project-based Section 8 subsidies. The total subsidy amount annually is $1,698,600 for the project or $11,400 per unit annually. According to the current owner, rents for the affordable units are low compared to market rate rents. The owner anticipates that, if HUD elects to renew the contract, the subsidy per unit will be increased substantially. One possibility is that the owner could decide to continue receiving Section 8 subsidies on a year-to-year basis. Preserve Affordability While it is difficult to estimate the exact cost to preserve the 149 affordable units, this analysis uses an annual subsidy amount of $1.7 million (a rounded amount of the current annual subsidy in 2008 dollars) as the basis for the estimate of preservation costs. This assumes that the property owner is willing to enter into a rental subsidy agreement with HUD, the Housing Authority of Santa Clara County, the City of Milpitas, or some other entity. Based, on this
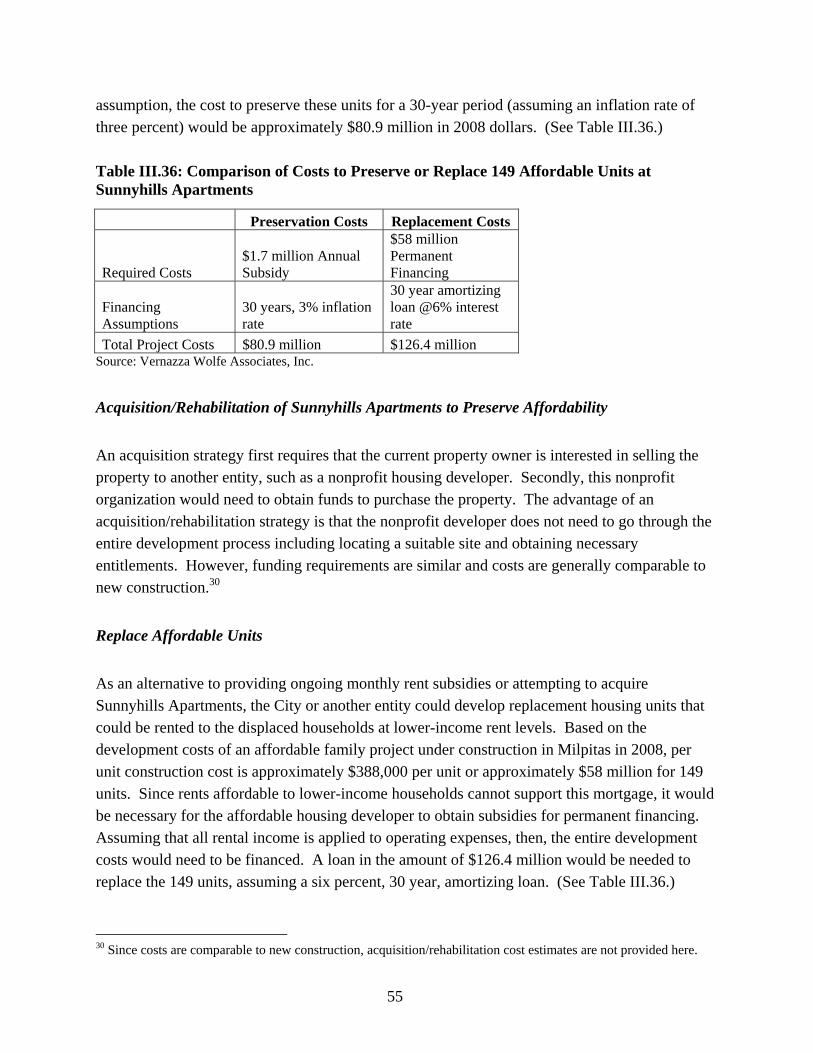
55
assumption, the cost to preserve these units for a 30-year period (assuming an inflation rate of three percent) would be approximately $80.9 million in 2008 dollars. (See Table III.36.) Table III.36: Comparison of Costs to Preserve or Replace 149 Affordable Units at Sunnyhills Apartments
Preservation Costs Replacement Costs
Required Costs $1.7 million Annual Subsidy
$58 million Permanent Financing
Financing Assumptions
30 years, 3% inflation rate
30 year amortizing loan @6% interest rate
Total Project Costs $80.9 million $126.4 million Source: Vernazza Wolfe Associates, Inc. Acquisition/Rehabilitation of Sunnyhills Apartments to Preserve Affordability An acquisition strategy first requires that the current property owner is interested in selling the property to another entity, such as a nonprofit housing developer. Secondly, this nonprofit organization would need to obtain funds to purchase the property. The advantage of an acquisition/rehabilitation strategy is that the nonprofit developer does not need to go through the entire development process including locating a suitable site and obtaining necessary entitlements. However, funding requirements are similar and costs are generally comparable to new construction.30 Replace Affordable Units As an alternative to providing ongoing monthly rent subsidies or attempting to acquire Sunnyhills Apartments, the City or another entity could develop replacement housing units that could be rented to the displaced households at lower-income rent levels. Based on the development costs of an affordable family project under construction in Milpitas in 2008, per unit construction cost is approximately $388,000 per unit or approximately $58 million for 149 units. Since rents affordable to lower-income households cannot support this mortgage, it would be necessary for the affordable housing developer to obtain subsidies for permanent financing. Assuming that all rental income is applied to operating expenses, then, the entire development costs would need to be financed. A loan in the amount of $126.4 million would be needed to replace the 149 units, assuming a six percent, 30 year, amortizing loan. (See Table III.36.)
30 Since costs are comparable to new construction, acquisition/rehabilitation cost estimates are not provided here.

56
The City must consider what resources are available to help replace these units so that lower-income tenants would not be displaced in the event that Sunnyhills Apartments is redeveloped as a market rate development. The City could provide some financing from the City Redevelopment Agency and its CDBG Entitlement Funds. In addition, nonprofit developers in Milpitas have access to a range of funding options that could also be used to pay for the replacement of the Sunnyhills apartments. These sources include the following:
• Mortgage Revenue Bonds • State Grant Programs, such as MHP • HOME Program • Federal Grant Programs • Low Income Housing Tax Credits • Housing Trust Fund of Santa Clara County
If the owners of Sunnyhills Apartments decide to convert the project to a market rate use in late 2011, the City will need to develop a strategy to replace the 149 affordable units. In most situations this entails collaboration with an affordable housing developer. The City is experienced in collaborating with affordable housing developers. The DeVries Place Senior Housing development and Montevista Apartments are two examples of the private/public partnership that would be needed to replace the at-risk units at Sunnyhills Apartments.
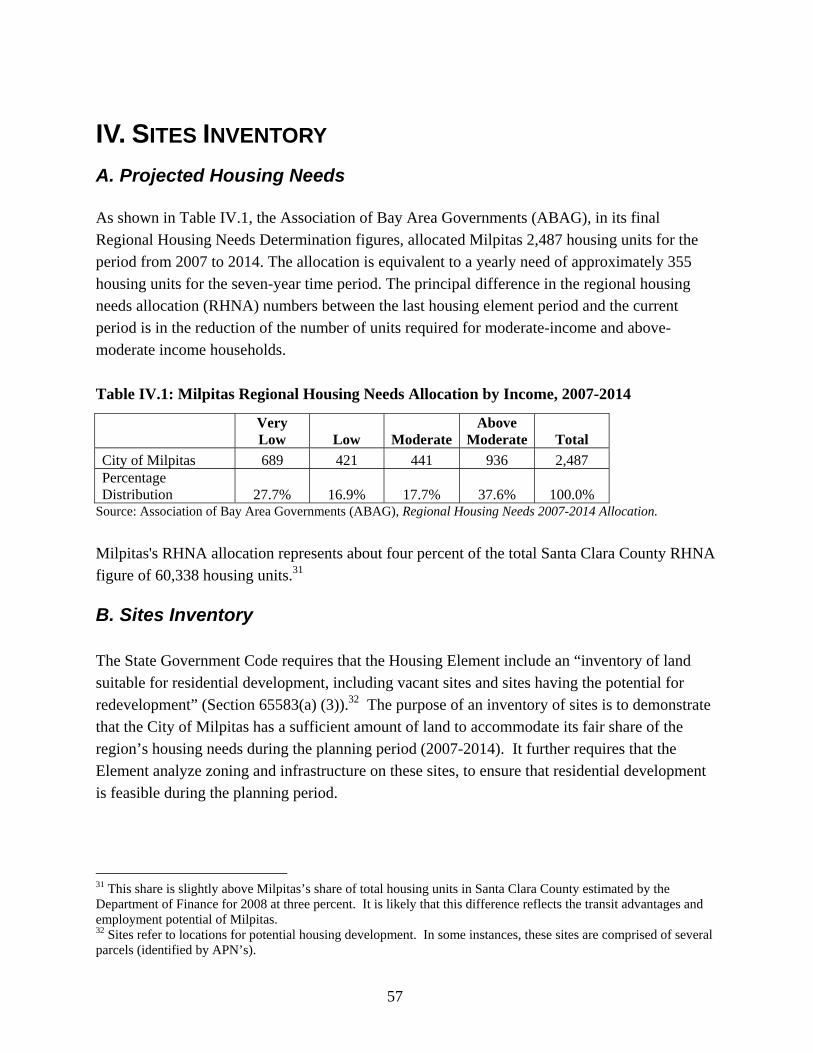
57
IV. SITES INVENTORY A. Projected Housing Needs As shown in Table IV.1, the Association of Bay Area Governments (ABAG), in its final Regional Housing Needs Determination figures, allocated Milpitas 2,487 housing units for the period from 2007 to 2014. The allocation is equivalent to a yearly need of approximately 355 housing units for the seven-year time period. The principal difference in the regional housing needs allocation (RHNA) numbers between the last housing element period and the current period is in the reduction of the number of units required for moderate-income and above-moderate income households. Table IV.1: Milpitas Regional Housing Needs Allocation by Income, 2007-2014
Very Low Low Moderate
Above Moderate Total
City of Milpitas 689 421 441 936 2,487 Percentage Distribution 27.7% 16.9% 17.7% 37.6% 100.0%
Source: Association of Bay Area Governments (ABAG), Regional Housing Needs 2007-2014 Allocation. Milpitas's RHNA allocation represents about four percent of the total Santa Clara County RHNA figure of 60,338 housing units.31
B. Sites Inventory The State Government Code requires that the Housing Element include an “inventory of land suitable for residential development, including vacant sites and sites having the potential for redevelopment” (Section 65583(a) (3)).32 The purpose of an inventory of sites is to demonstrate that the City of Milpitas has a sufficient amount of land to accommodate its fair share of the region’s housing needs during the planning period (2007-2014). It further requires that the Element analyze zoning and infrastructure on these sites, to ensure that residential development is feasible during the planning period.
31 This share is slightly above Milpitas’s share of total housing units in Santa Clara County estimated by the Department of Finance for 2008 at three percent. It is likely that this difference reflects the transit advantages and employment potential of Milpitas. 32 Sites refer to locations for potential housing development. In some instances, these sites are comprised of several parcels (identified by APN’s).
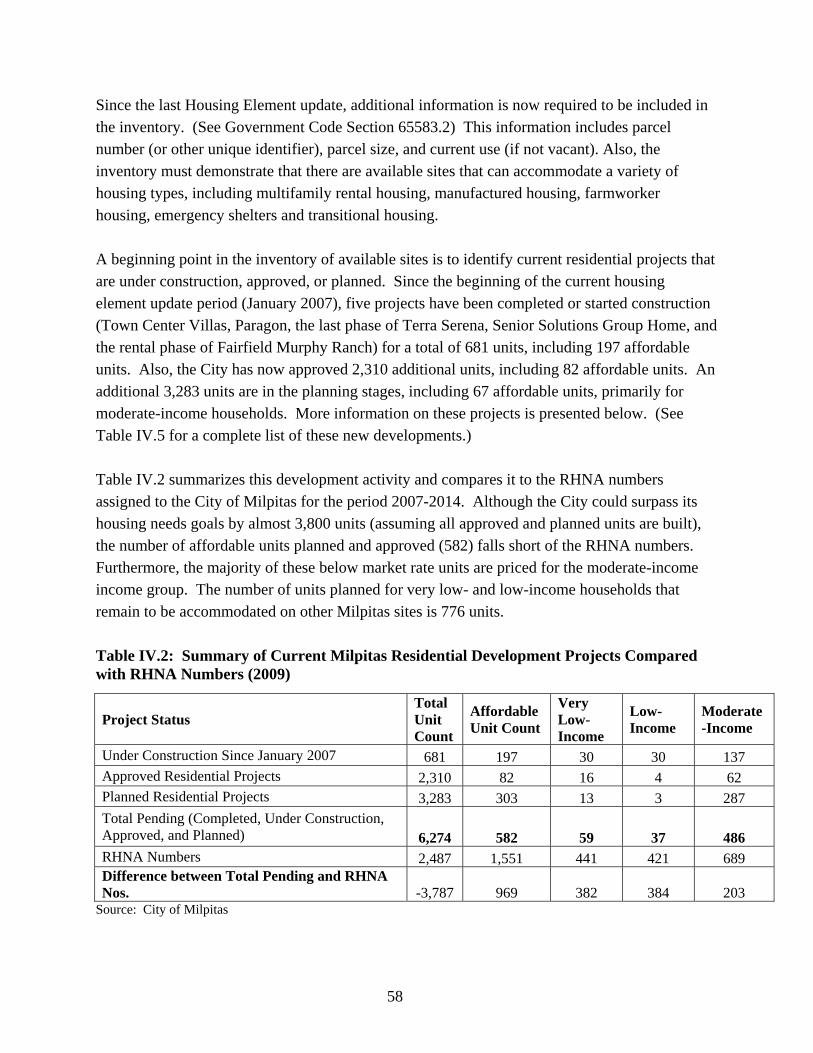
58
Since the last Housing Element update, additional information is now required to be included in the inventory. (See Government Code Section 65583.2) This information includes parcel number (or other unique identifier), parcel size, and current use (if not vacant). Also, the inventory must demonstrate that there are available sites that can accommodate a variety of housing types, including multifamily rental housing, manufactured housing, farmworker housing, emergency shelters and transitional housing. A beginning point in the inventory of available sites is to identify current residential projects that are under construction, approved, or planned. Since the beginning of the current housing element update period (January 2007), five projects have been completed or started construction (Town Center Villas, Paragon, the last phase of Terra Serena, Senior Solutions Group Home, and the rental phase of Fairfield Murphy Ranch) for a total of 681 units, including 197 affordable units. Also, the City has now approved 2,310 additional units, including 82 affordable units. An additional 3,283 units are in the planning stages, including 67 affordable units, primarily for moderate-income households. More information on these projects is presented below. (See Table IV.5 for a complete list of these new developments.) Table IV.2 summarizes this development activity and compares it to the RHNA numbers assigned to the City of Milpitas for the period 2007-2014. Although the City could surpass its housing needs goals by almost 3,800 units (assuming all approved and planned units are built), the number of affordable units planned and approved (582) falls short of the RHNA numbers. Furthermore, the majority of these below market rate units are priced for the moderate-income income group. The number of units planned for very low- and low-income households that remain to be accommodated on other Milpitas sites is 776 units. Table IV.2: Summary of Current Milpitas Residential Development Projects Compared with RHNA Numbers (2009)
Project Status Total Unit Count
Affordable Unit Count
Very Low-Income
Low-Income
Moderate-Income
Under Construction Since January 2007 681 197 30 30 137 Approved Residential Projects 2,310 82 16 4 62 Planned Residential Projects 3,283 303 13 3 287 Total Pending (Completed, Under Construction, Approved, and Planned) 6,274 582 59 37 486 RHNA Numbers 2,487 1,551 441 421 689 Difference between Total Pending and RHNA Nos. -3,787 969 382 384 203
Source: City of Milpitas
59
Thus, one of the remaining goals for the City is to identify additional sites that can be used to develop affordable housing, as well as special needs housing. Demonstrating an adequate land supply, however, is only part of the task. The City must also show that this supply is capable of supporting housing demand from all economic segments of the community. High land costs in the region make it difficult to meet the demand for affordable housing on sites that are designated for low densities. This is not a problem for the City of Milpitas, however, since it has zoned substantial areas of the City for high density residential and mixed use land uses. The majority of the City’s residential development potential is located in the areas covered by the Midtown and Transit Area Specific Plans. All of the Midtown Specific Plan Area is located in a redevelopment project area and all but 46 acres of the Transit Area Specific Plan Area is located in a redevelopment project area.33 Only two sites on the inventory list presented below (Table IV.4) are located outside these areas. The specific plan areas are in the midst of a transition from older industrial and heavy commercial uses to a mixed use community developed at urban densities. Over 2,000 units have been built or permitted in the City since 1999, and the majority of these are located in one of the specific plan areas. Additional units are now in the pipeline and are included as part of the 2007-2014 site inventory as new projects. The inventory of potential sites that are not included on the current projects list was developed from two sources.
• First, the City reviewed the list of available sites that were presented in the 2002 Housing Element. This original list presented information on 28 sites, many of which were comprised of more than one assessor’s parcel number (APN). From this original list, fewer than half of the original 28 sites are still potential development locations. These are included on the 2007-2014 site inventory.
• Secondly, the Transit Area Specific Plan identified six development opportunity areas
that could be redeveloped within the five years following plan adoption. This five-year period falls into the housing element update period of 2007-2014. Additional sites located in these areas are included in the site inventory. 34
33 The portion of the Transit Area that is not included in a redevelopment project area is the Piper Drive/Montague Expressway Area. There are three pending projects located in this area – Piper Towers, Citation, and Milpitas Station. 34 A market study prepared for the City in 2008 identified additional parcels that could be considered for residential development. These parcels are not zoned for residential use. These sites are not included on the site inventory list, since there are already a sufficient number of sites located in Milpitas that are zoned for residential use.
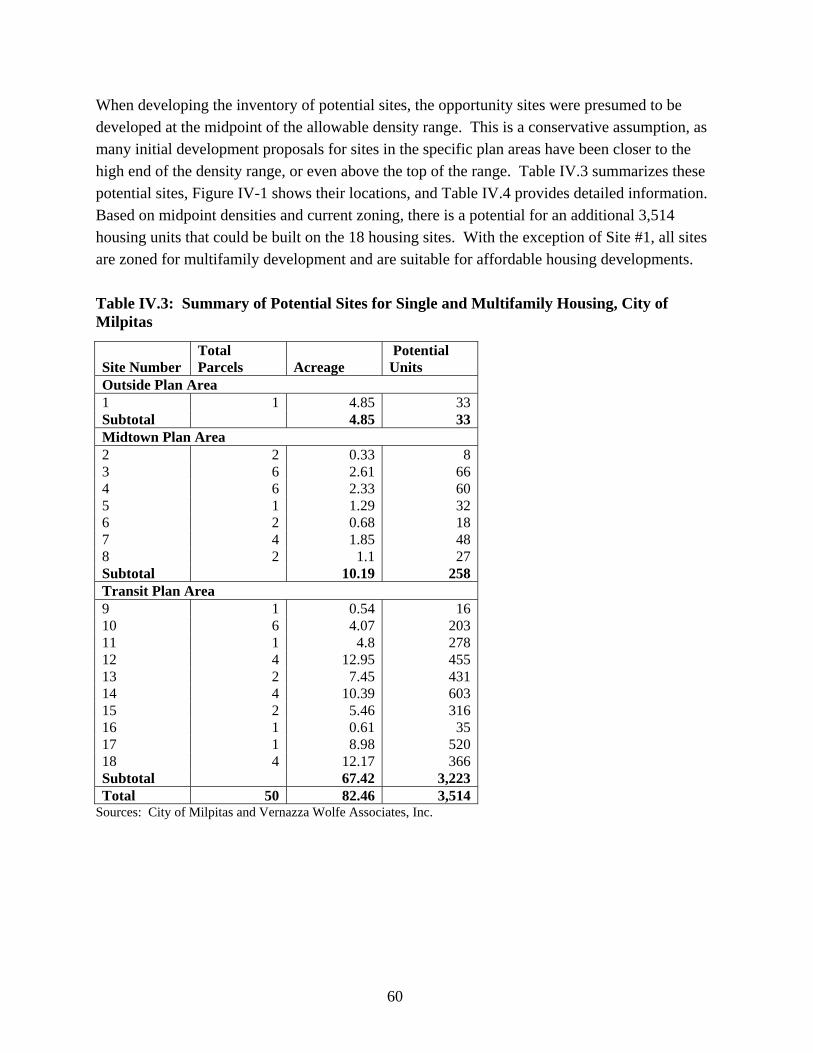
60
When developing the inventory of potential sites, the opportunity sites were presumed to be developed at the midpoint of the allowable density range. This is a conservative assumption, as many initial development proposals for sites in the specific plan areas have been closer to the high end of the density range, or even above the top of the range. Table IV.3 summarizes these potential sites, Figure IV-1 shows their locations, and Table IV.4 provides detailed information. Based on midpoint densities and current zoning, there is a potential for an additional 3,514 housing units that could be built on the 18 housing sites. With the exception of Site #1, all sites are zoned for multifamily development and are suitable for affordable housing developments. Table IV.3: Summary of Potential Sites for Single and Multifamily Housing, City of Milpitas
Site Number Total Parcels Acreage
Potential Units
Outside Plan Area 1 1 4.85 33Subtotal 4.85 33Midtown Plan Area 2 2 0.33 83 6 2.61 664 6 2.33 605 1 1.29 326 2 0.68 187 4 1.85 488 2 1.1 27Subtotal 10.19 258Transit Plan Area 9 1 0.54 1610 6 4.07 20311 1 4.8 27812 4 12.95 45513 2 7.45 43114 4 10.39 60315 2 5.46 31616 1 0.61 3517 1 8.98 52018 4 12.17 366Subtotal 67.42 3,223Total 50 82.46 3,514
Sources: City of Milpitas and Vernazza Wolfe Associates, Inc.
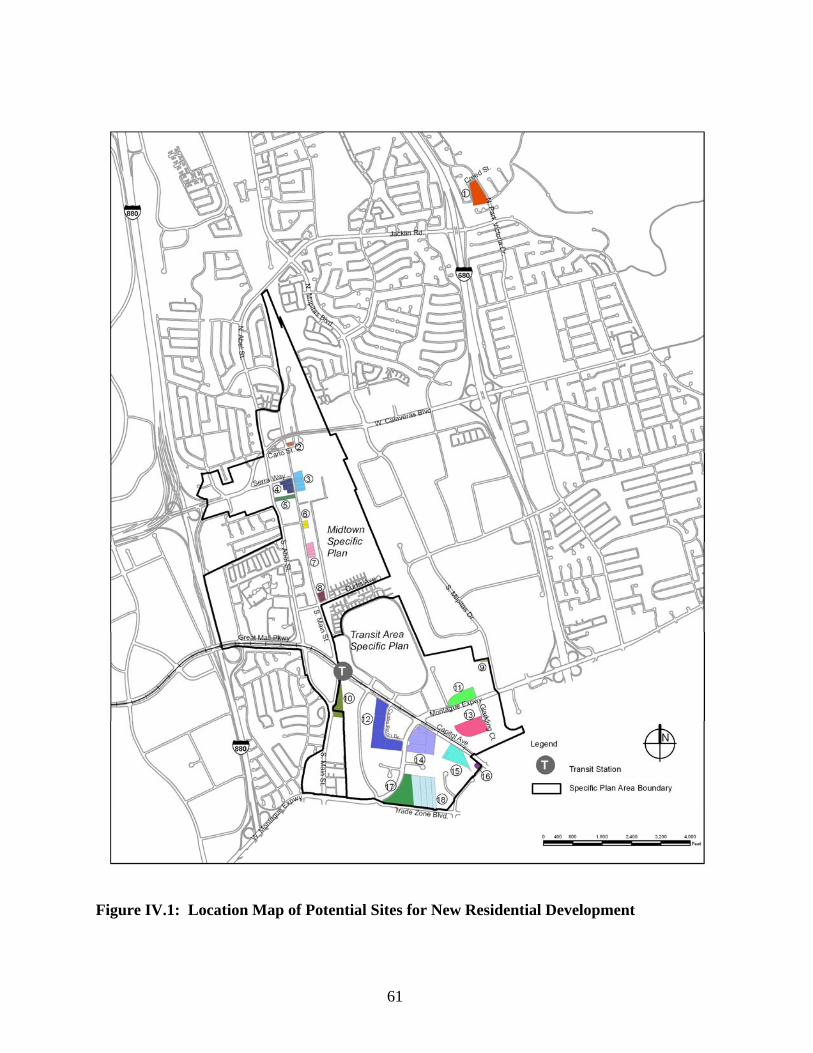
61
Figure IV.1: Location Map of Potential Sites for New Residential Development
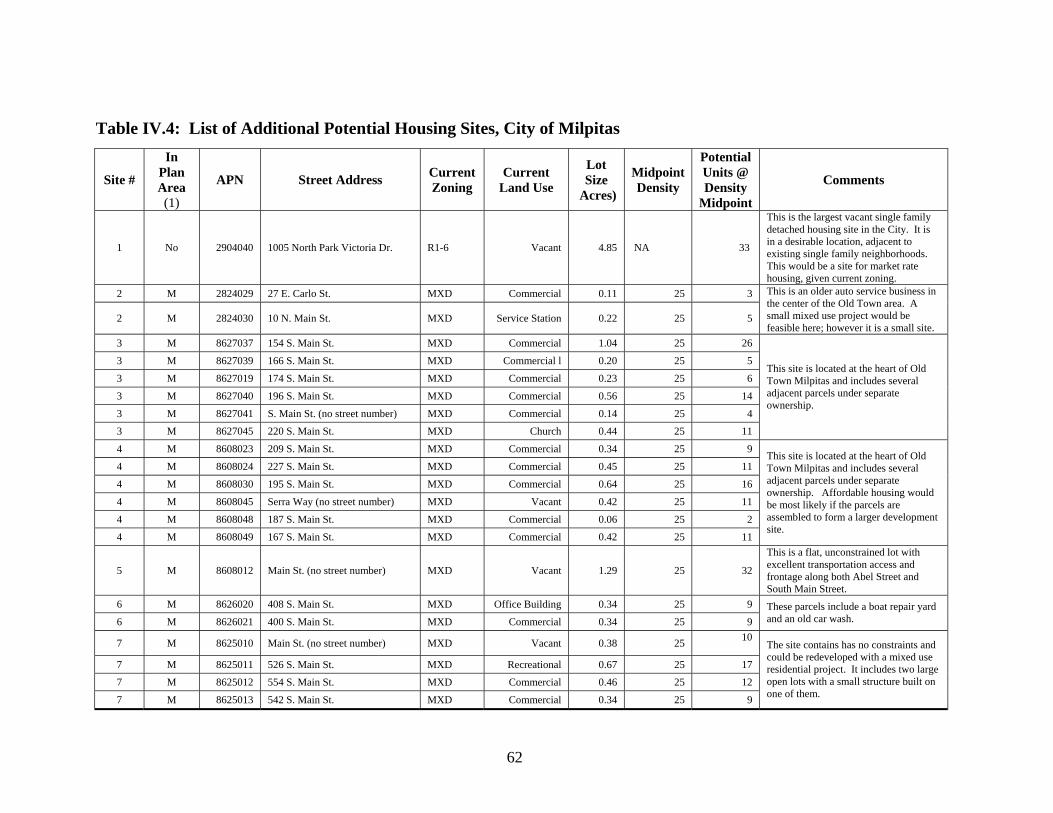
62
Table IV.4: List of Additional Potential Housing Sites, City of Milpitas
Site #
In Plan Area (1)
APN Street Address Current Zoning
Current Land Use
Lot Size
Acres)
Midpoint Density
Potential Units @ Density
Midpoint
Comments
1 No 2904040 1005 North Park Victoria Dr. R1-6 Vacant 4.85 NA 33
This is the largest vacant single family detached housing site in the City. It is in a desirable location, adjacent to existing single family neighborhoods. This would be a site for market rate housing, given current zoning.
2 M 2824029 27 E. Carlo St. MXD Commercial 0.11 25 3
2 M 2824030 10 N. Main St. MXD Service Station 0.22 25 5
This is an older auto service business in the center of the Old Town area. A small mixed use project would be feasible here; however it is a small site.
3 M 8627037 154 S. Main St. MXD Commercial 1.04 25 26
3 M 8627039 166 S. Main St. MXD Commercial l 0.20 25 5
3 M 8627019 174 S. Main St. MXD Commercial 0.23 25 6
3 M 8627040 196 S. Main St. MXD Commercial 0.56 25 14
3 M 8627041 S. Main St. (no street number) MXD Commercial 0.14 25 4
3 M 8627045 220 S. Main St. MXD Church 0.44 25 11
This site is located at the heart of Old Town Milpitas and includes several adjacent parcels under separate ownership.
4 M 8608023 209 S. Main St. MXD Commercial 0.34 25 9
4 M 8608024 227 S. Main St. MXD Commercial 0.45 25 11
4 M 8608030 195 S. Main St. MXD Commercial 0.64 25 16
4 M 8608045 Serra Way (no street number) MXD Vacant 0.42 25 11
4 M 8608048 187 S. Main St. MXD Commercial 0.06 25 2
4 M 8608049 167 S. Main St. MXD Commercial 0.42 25 11
This site is located at the heart of Old Town Milpitas and includes several adjacent parcels under separate ownership. Affordable housing would be most likely if the parcels are assembled to form a larger development site.
5 M 8608012 Main St. (no street number) MXD Vacant 1.29 25 32
This is a flat, unconstrained lot with excellent transportation access and frontage along both Abel Street and South Main Street.
6 M 8626020 408 S. Main St. MXD Office Building 0.34 25 9
6 M 8626021 400 S. Main St. MXD Commercial 0.34 25 9 These parcels include a boat repair yard and an old car wash.
7 M 8625010 Main St. (no street number) MXD Vacant 0.38 25 10
7 M 8625011 526 S. Main St. MXD Recreational 0.67 25 17
7 M 8625012 554 S. Main St. MXD Commercial 0.46 25 12
7 M 8625013 542 S. Main St. MXD Commercial 0.34 25 9
The site contains has no constraints and could be redeveloped with a mixed use residential project. It includes two large open lots with a small structure built on one of them.
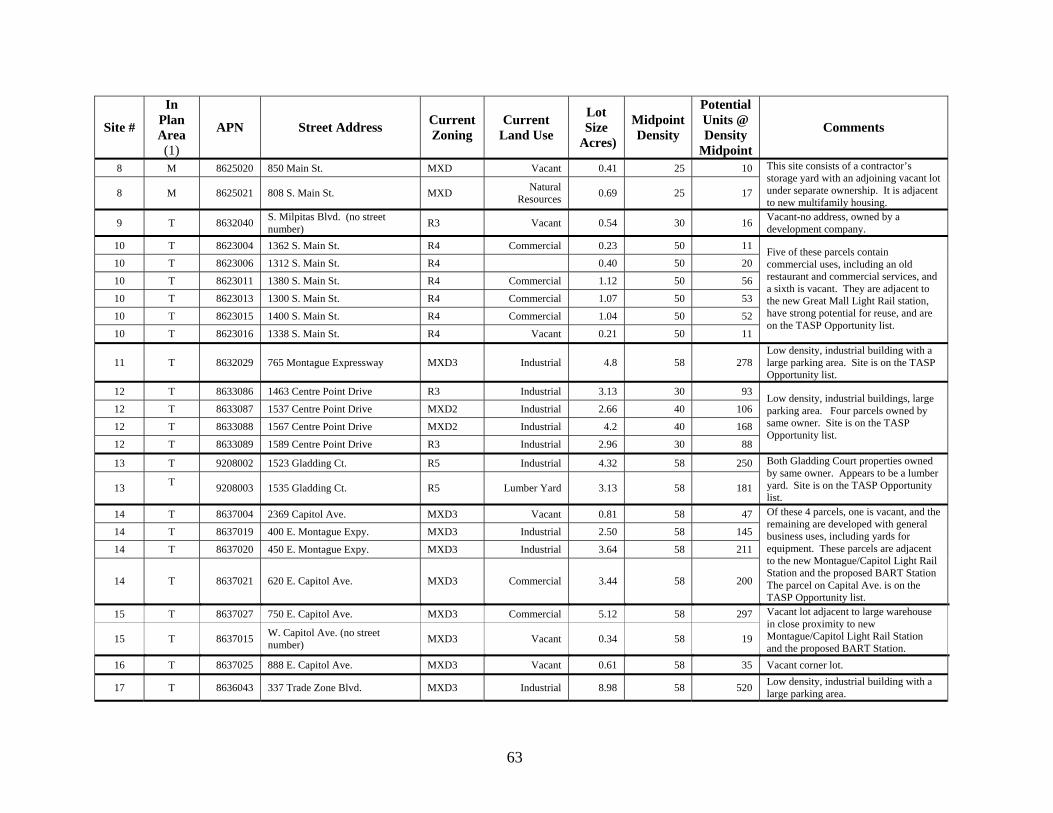
63
Site #
In Plan Area (1)
APN Street Address Current Zoning
Current Land Use
Lot Size
Acres)
Midpoint Density
Potential Units @ Density
Midpoint
Comments
8 M 8625020 850 Main St. MXD Vacant 0.41 25 10
8 M 8625021 808 S. Main St. MXD Natural Resources 0.69 25 17
This site consists of a contractor’s storage yard with an adjoining vacant lot under separate ownership. It is adjacent to new multifamily housing.
9 T 8632040 S. Milpitas Blvd. (no street number) R3 Vacant 0.54 30 16 Vacant-no address, owned by a
development company. 10 T 8623004 1362 S. Main St. R4 Commercial 0.23 50 11
10 T 8623006 1312 S. Main St. R4 0.40 50 20
10 T 8623011 1380 S. Main St. R4 Commercial 1.12 50 56
10 T 8623013 1300 S. Main St. R4 Commercial 1.07 50 53
10 T 8623015 1400 S. Main St. R4 Commercial 1.04 50 52
10 T 8623016 1338 S. Main St. R4 Vacant 0.21 50 11
Five of these parcels contain commercial uses, including an old restaurant and commercial services, and a sixth is vacant. They are adjacent to the new Great Mall Light Rail station, have strong potential for reuse, and are on the TASP Opportunity list.
11 T 8632029 765 Montague Expressway MXD3 Industrial 4.8 58 278 Low density, industrial building with a large parking area. Site is on the TASP Opportunity list.
12 T 8633086 1463 Centre Point Drive R3 Industrial 3.13 30 93
12 T 8633087 1537 Centre Point Drive MXD2 Industrial 2.66 40 106
12 T 8633088 1567 Centre Point Drive MXD2 Industrial 4.2 40 168
12 T 8633089 1589 Centre Point Drive R3 Industrial 2.96 30 88
Low density, industrial buildings, large parking area. Four parcels owned by same owner. Site is on the TASP Opportunity list.
13 T 9208002 1523 Gladding Ct. R5 Industrial 4.32 58 250
13 T 9208003 1535 Gladding Ct. R5 Lumber Yard 3.13 58 181
Both Gladding Court properties owned by same owner. Appears to be a lumber yard. Site is on the TASP Opportunity list.
14 T 8637004 2369 Capitol Ave. MXD3 Vacant 0.81 58 47
14 T 8637019 400 E. Montague Expy. MXD3 Industrial 2.50 58 145
14 T 8637020 450 E. Montague Expy. MXD3 Industrial 3.64 58 211
14 T 8637021 620 E. Capitol Ave. MXD3 Commercial 3.44 58 200
Of these 4 parcels, one is vacant, and the remaining are developed with general business uses, including yards for equipment. These parcels are adjacent to the new Montague/Capitol Light Rail Station and the proposed BART Station The parcel on Capital Ave. is on the TASP Opportunity list.
15 T 8637027 750 E. Capitol Ave. MXD3 Commercial 5.12 58 297
15 T 8637015 W. Capitol Ave. (no street number) MXD3 Vacant 0.34 58 19
Vacant lot adjacent to large warehouse in close proximity to new Montague/Capitol Light Rail Station and the proposed BART Station.
16 T 8637025 888 E. Capitol Ave. MXD3 Vacant 0.61 58 35 Vacant corner lot.
17 T 8636043 337 Trade Zone Blvd. MXD3 Industrial 8.98 58 520 Low density, industrial building with a large parking area.
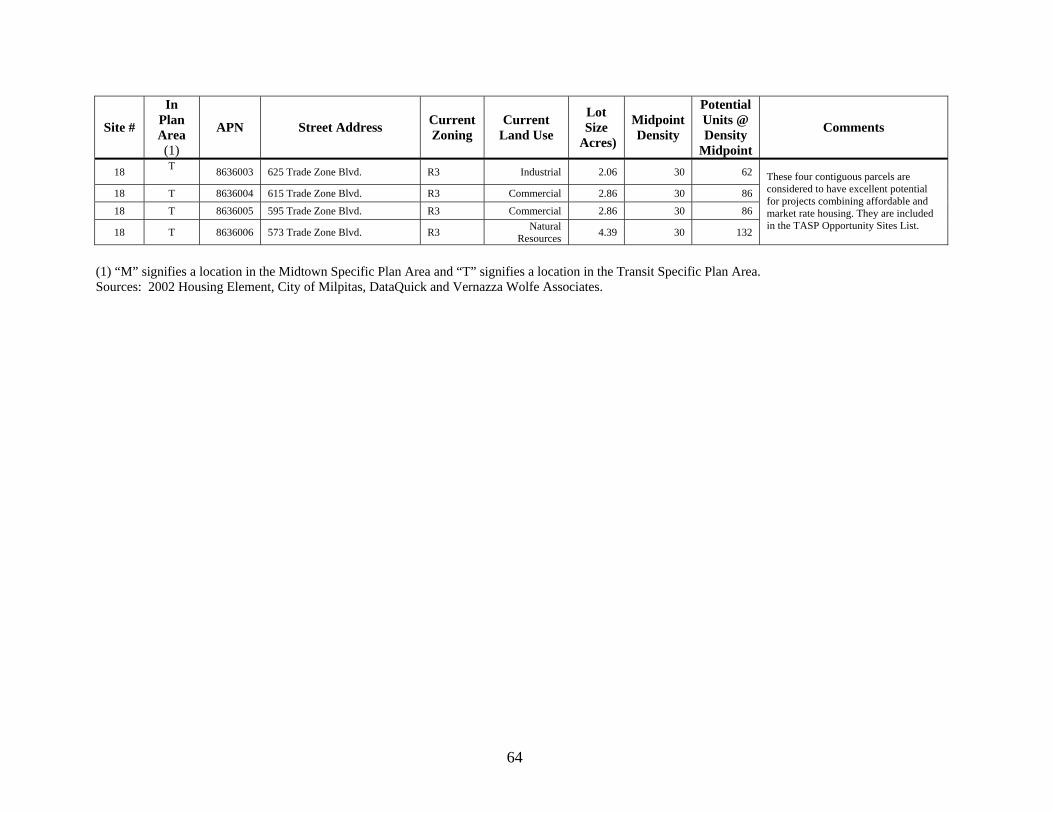
64
Site #
In Plan Area (1)
APN Street Address Current Zoning
Current Land Use
Lot Size
Acres)
Midpoint Density
Potential Units @ Density
Midpoint
Comments
18 T 8636003 625 Trade Zone Blvd. R3 Industrial 2.06 30 62
18 T 8636004 615 Trade Zone Blvd. R3 Commercial 2.86 30 86
18 T 8636005 595 Trade Zone Blvd. R3 Commercial 2.86 30 86
18 T 8636006 573 Trade Zone Blvd. R3 Natural Resources 4.39 30 132
These four contiguous parcels are considered to have excellent potential for projects combining affordable and market rate housing. They are included in the TASP Opportunity Sites List.
(1) “M” signifies a location in the Midtown Specific Plan Area and “T” signifies a location in the Transit Specific Plan Area. Sources: 2002 Housing Element, City of Milpitas, DataQuick and Vernazza Wolfe Associates.
65
There are four vacant sites included in this inventory. These are Sites 1, 5, 9 and 16, ranging in size from one-half acre to almost five acres. In addition, some of the parcels that are aggregated to create a site include vacant parcels. Table IV.4 identifies these as well. The sites vary in size. Those located in the Transit Area Specific Plan Area are larger than those in the Midtown Specific Plan Area. With the exception of Site #1 on North Park Victoria, the lowest density of the sites listed is R3, which allows densities up to 20 units per acre. The highest density (up to 75 units per acre) is allowed in the TOD overlay portions of the R5 and MXD3 zones. Nine parcels located at five sites are zoned as MXD3 and an additional site, consisting of two parcels, is zoned R5. Furthermore, minimum density requirements will ensure that the land is efficiently used, while development agreements and incentive programs will ensure that a significant portion of future housing will be affordable. Finally, as mentioned above, there are over 6,200 units that are under construction, approved, or under discussion. These units are located on additional sites, not included on Table IV.4. Table IV.5 provides a list of these current projects, and Figure IV.2 shows their locations. First, there is Town Center Villas, a 65-unit mixed-income single family development located at 1696 South Main Street and 75 Montague Expressway. This development is almost complete. Sixteen of these units will be affordable to moderate-income buyers. Two additional ownership projects include Paragon and a final phase of KB Homes Terra Serena development. A fourth development – the rental portion of the Fairfield Murphy Ranch Project - recently began construction. Of the 374 rental units to be developed at this site, 20 will be affordable to very low-income households, 30 will be affordable to low-income households, and 38 will be affordable to moderate-income households. Other current projects that will provide affordable units are as follows:
• The ownership portion of the Fairfield Murphy Ranch development will provide 44 affordable units, of which 37 will be for moderate-income households, and seven for very low-income households;
• The Matteson Condos will provide 19 affordable units, of which four will be for low-income households, and the remaining units for moderate-income households, and finally
• Apton Plaza (a rental development) will provide 10 units for low-income households and an additional nine units for very low-income households.
• Integral will provide 236 affordable units for moderate-income households. These affordable units are included in Table IV.2.
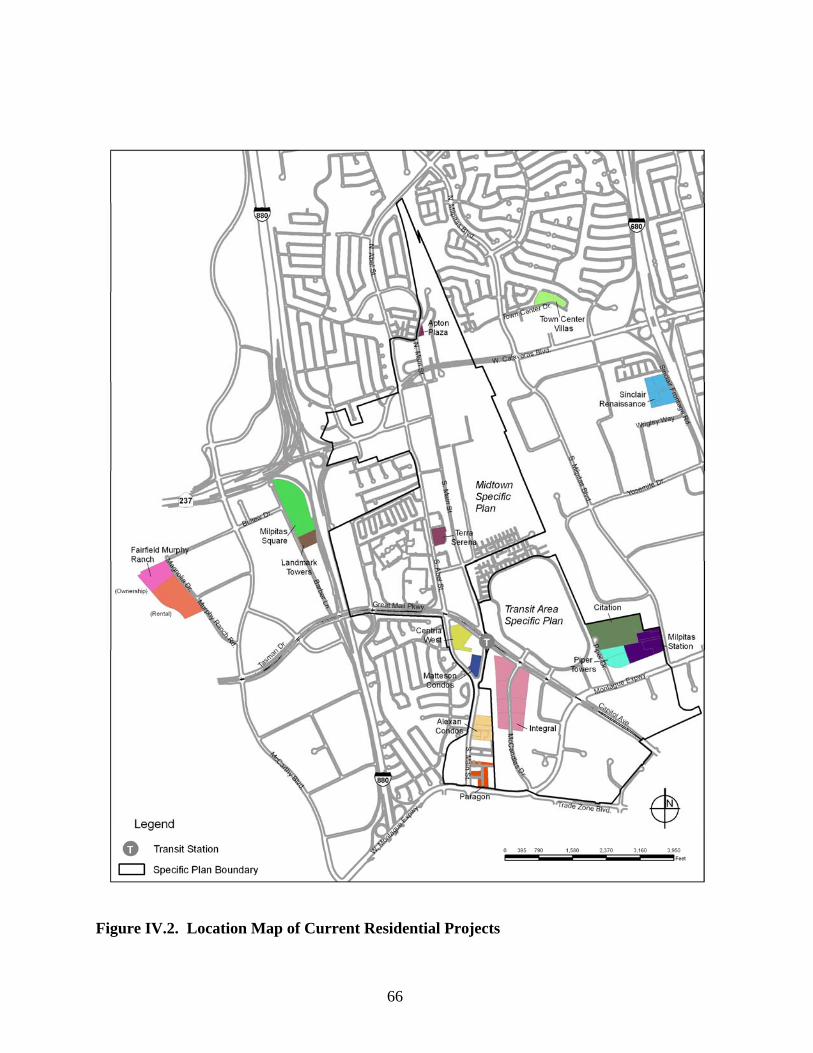
66
Figure IV.2. Location Map of Current Residential Projects
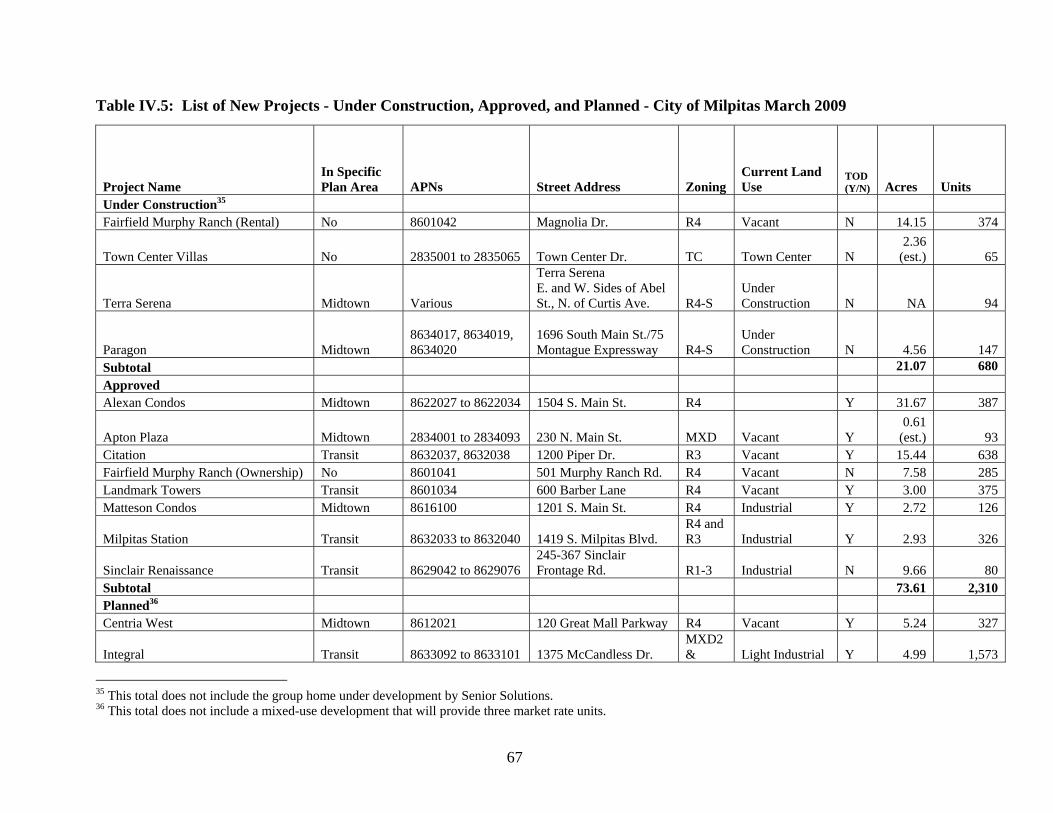
67
Table IV.5: List of New Projects - Under Construction, Approved, and Planned - City of Milpitas March 2009
Project Name In Specific Plan Area APNs Street Address Zoning
Current Land Use
TOD (Y/N) Acres Units
Under Construction35 Fairfield Murphy Ranch (Rental) No 8601042 Magnolia Dr. R4 Vacant N 14.15 374
Town Center Villas No 2835001 to 2835065 Town Center Dr. TC Town Center N 2.36
(est.) 65
Terra Serena Midtown Various
Terra Serena E. and W. Sides of Abel St., N. of Curtis Ave. R4-S
Under Construction N NA 94
Paragon Midtown 8634017, 8634019, 8634020
1696 South Main St./75 Montague Expressway R4-S
Under Construction N 4.56 147
Subtotal 21.07 680 Approved Alexan Condos Midtown 8622027 to 8622034 1504 S. Main St. R4 Y 31.67 387
Apton Plaza Midtown 2834001 to 2834093 230 N. Main St. MXD Vacant Y 0.61
(est.) 93 Citation Transit 8632037, 8632038 1200 Piper Dr. R3 Vacant Y 15.44 638 Fairfield Murphy Ranch (Ownership) No 8601041 501 Murphy Ranch Rd. R4 Vacant N 7.58 285 Landmark Towers Transit 8601034 600 Barber Lane R4 Vacant Y 3.00 375 Matteson Condos Midtown 8616100 1201 S. Main St. R4 Industrial Y 2.72 126
Milpitas Station Transit 8632033 to 8632040 1419 S. Milpitas Blvd. R4 and R3 Industrial Y 2.93 326
Sinclair Renaissance Transit 8629042 to 8629076 245-367 Sinclair Frontage Rd. R1-3 Industrial N 9.66 80
Subtotal 73.61 2,310 Planned36 Centria West Midtown 8612021 120 Great Mall Parkway R4 Vacant Y 5.24 327
Integral Transit 8633092 to 8633101 1375 McCandless Dr. MXD2& Light Industrial Y 4.99 1,573
35 This total does not include the group home under development by Senior Solutions. 36 This total does not include a mixed-use development that will provide three market rate units.
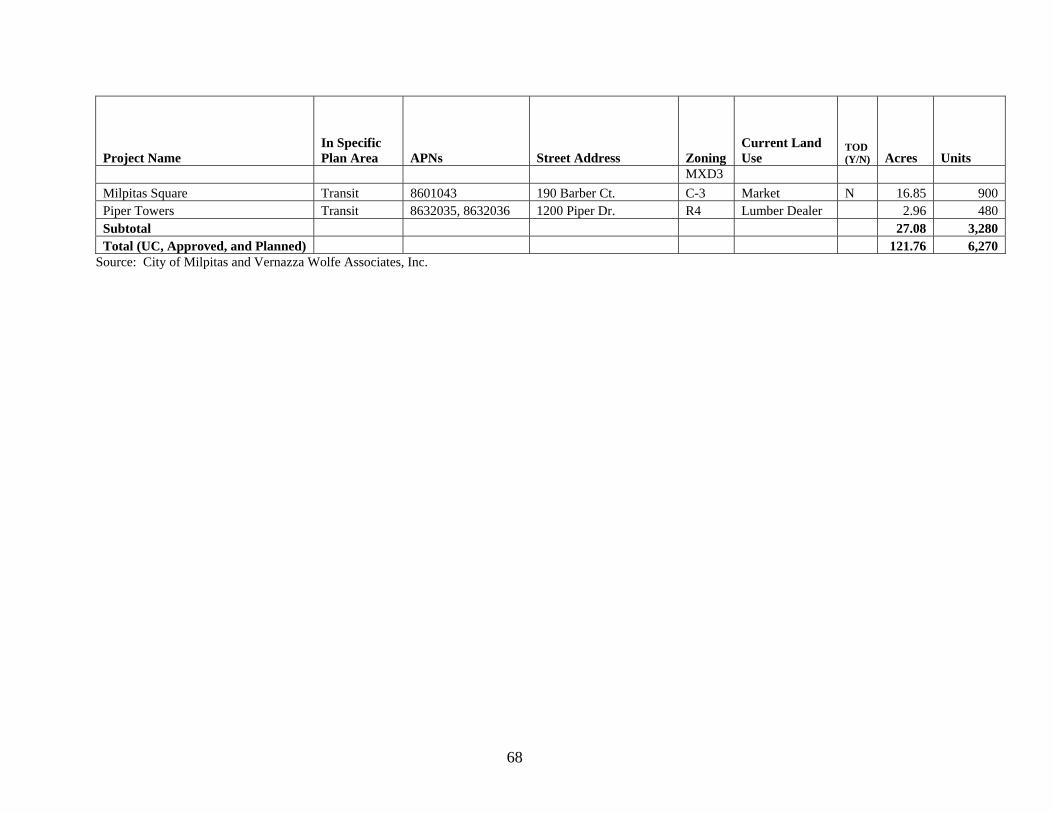
68
Project Name In Specific Plan Area APNs Street Address Zoning
Current Land Use
TOD (Y/N) Acres Units
MXD3 Milpitas Square Transit 8601043 190 Barber Ct. C-3 Market N 16.85 900 Piper Towers Transit 8632035, 8632036 1200 Piper Dr. R4 Lumber Dealer 2.96 480 Subtotal 27.08 3,280 Total (UC, Approved, and Planned) 121.76 6,270
Source: City of Milpitas and Vernazza Wolfe Associates, Inc.
69
C. Additional Considerations 1) Site Considerations for Above Moderate-Income Households A review of the land use database provided by the County of Santa Clara Assessor’s Office and the City of Milpitas indicates that there are 29 vacant residentially-designated sites where new housing could be possible. These sites are in scattered locations but are mostly in the northeastern part of the City, consisting of either empty lots within existing subdivisions (e.g., Calaveras Ridge Estates, Calera Creek Heights, Vista Ridge), or as larger undeveloped parcels that extend up from the base of the hills along Piedmont Road and Evans Road, or along the sloped portion of County Club Road. Most sites are located within the City’s Urban Growth Boundary and would be subject to the restrictions of voter-approved Hillside Residential Overlay District in the City’s Zoning Ordinance that specifies a density of one unit per 10 acres. At current General Plan and zoning densities, these sites could yield approximately 119 units. Most of these would be appropriate sites for luxury single family homes. One of the larger and more interesting sites that emerged from the site inventory discussed above is a 4.85 acre vacant parcel on North Park Victoria Drive. This site is listed on Table IV.4. It is located along the west side of North Park Victoria Drive and across from the intersection of Country Club Road, inside the Urban Growth Boundary and is zoned for residential use. It appears to be undeveloped except for a single family house located at the southeast corner of the property, a house that appears to have suffered fire damage and is currently unoccupied. The location and size of this parcel suggest that it might make a good candidate for luxury housing. This site could yield approximately 33 units under current zoning (R1-6 at seven units to the acre).
2) Adequacy of Infrastructure and Services Although Milpitas is a built-out city, the conversion of older industrial and commercial sites in the Specific Plan Areas to residential and mixed land uses requires that additional infrastructure investment be undertaken. Transportation access to these areas is excellent, since these areas are in close proximity to two major freeways, two light rail stations and a future BART Station. However, since Milpitas is located at a crossroads of Silicon Valley, there is a great deal of regional traffic. The City has adopted a transportation impact fee that will help pay for needed road improvements within the City. Until sufficient funds are collected from this fee, affected roads will be operating below an acceptable level of service. Finally, traffic congestion along the
70
major freeways is a regional problem that requires regional solutions. The Transit Area Specific Plan EIR recommended a Traffic Fee to contribute to address this issue. Aside from transportation issues, remaining infrastructure, such as water, sewers, and storm drains are adequate to support the planned growth in Milpitas.
A final consideration is the fire and emergency medical assistance services provided throughout Milpitas by the Milpitas Fire Department (MFD). The TASP EIR recommended that a “standards-of-coverage” analysis be conducted “to determine the precise impact on the department’s staffing, equipment and any required facility enhancements. In addition, the MFD will need to write an addendum to the City’s emergency management plan to address future development of the project area. Thus, future development of sites in the TASP area will need to address these issues related to fire and emergency medical assistance services. This Housing Element provides that similar consideration of the adequacy of fire and emergency medical assistance coverage be extended to all Housing Element sites, including those outside as well as inside the TASP area, at the time specific projects come up for review.
3) Environmental Constraints Chapter V addresses more generally the extent to which environmental considerations could be a constraint on new development in the City of Milpitas. These include potential earthquakes, flooding, and hillside erosion. In addition, since many of the potential sites are located in a transitional area changing from older industrial and heavy commercial uses to a mixed use community, it is possible that there are hazardous materials on some of the potential sites.
• Milpitas is subject to the same hazards from seismic activity as are other cities in the San Francisco Bay Area. However, since the sites presented above are not located on landfill, new development on these sites is not exposed to any greater risk from a potential earthquake.
• Some of the housing sites in the Transit Area are located within the 100-year floodplain.
Although flood depths would be very shallow, a combination of on-site and off-site improvements may still be required before building in areas that could experience potential flooding.
71
• Although development on the hillsides is theoretically possible, the area has serious seismic and landslide constraints. However since none of the sites included in the site inventory are located in the hillside area, this potential hazard is not a problem.
• None of the sites listed in the 2002 Housing Element that are still considered potential
sites for 2007-2014 are contaminated. The five sites that are Transit Area Specific Plan Opportunity sites and which were not included in the 2002 Housing Element are Sites 10, 11, 12, 15, and 17. Given prior land uses, it may be necessary to undertake a Phase I Environmental Site Assessment for these sites prior to residential development.
A final environmental issue relates to vibration levels that may affect future development inside and outside the TASP area related to the UPRR and BART right-of-way. To make sure that vibration levels do not exceed acceptable levels, the TASP includes mitigation measures to address potential issues related to vibration. Future development in this area will be subject to potential siting and/or construction features sufficient to reduce the impacts of ground vibration. This Housing Element provides that Housing Element sites outside the TASP but within 300 feet of an active UPRR and/or BART alignment be subject to an analysis of vibration impacts and be required to provide for vibration reduction consistent with the direction of TASP policies.
C. Zoning for a Variety of Housing Types In addition to the requirement of identifying potential sites for affordable housing, the City must identify districts within the City in which special needs housing can be constructed. The purpose of special housing is two-fold. First, it must be affordable, and secondly, the type of housing required should not be subject to any special conditions, aside from conforming to site and design standards. Each type of special needs housing is presented below along with recommendations regarding the appropriate zoning districts in which the type of housing can be located. In all cases, the City will need to modify its Zoning Ordinance to allow the special needs use “by right” rather than as a conditional use.
1) Farmworker Housing Health and Safety Code Sections 17021.5 and 17021.6 specify that the Housing Element must demonstrate that the local government’s zoning, development standards and processing requirements encourage and facilitate all types of housing for farmworkers. Appropriate zoning would allow multifamily units as well as dormitory-style housing. While there are two exclusions to this requirement, the City does not meet either of these; thus, it will be necessary to
72
modify the City’s Zoning Ordinance for the 9 AR Agricultural Residence District to allow farmworker housing as a use “by right.”37
2) Manufactured Housing Similar to farmworker housing, the City needs to identify those residential districts in which manufactured housing is allowed.38 Currently, there is no reference to manufactured housing in the Zoning Ordinance, only to mobile homes. With the exception of design requirements, a city can only subject the manufactured home and the lot on which it is placed to the same development standards which are required for a conventional single-family residential dwelling. Thus, the City will need to modify its Zoning Ordinance to permit manufactured housing in single family districts.
3) SRO Housing Single room occupancy units (SRO’s) are assumed to meet the needs of extremely low-income households. If a jurisdiction can show it is meeting the needs of extremely low-income households (below 30 percent AMI), then it is not required to consider SRO’s in its Zoning Ordinance. However, according to the housing needs identified in Chapter III for Milpitas, there are over 755 extremely low-income renter households in Milpitas, the vast majority of which were overpaying for housing in 1999. So this income group does have need for additional affordable housing. Furthermore, this group has not been helped by recent affordable housing construction which benefits the upper bound of the low-income group, i.e., 50 percent AMI instead of 30 percent AMI. Therefore, to meet these needs, the City will either need to amend its Zoning Ordinance to permit SRO housing in selected districts, or it will need to adopt an SRO Ordinance.
37 The two exclusions are as follows: If the City could demonstrate there are no agriculture workers working in Milpitas, this zoning change would not be needed. However, ABAG currently identifies 180 agricultural workers in Milpitas’ sphere of influence. (Employment information is presented in Chapter III of this Housing Element.) The second exclusion would be if the City’s Zoning Ordinance did not indicate any agricultural zoning districts, then it could be waived out of this requirement. However, there are two zoning districts that specify agricultural uses in Milpitas. 38 The applicable state law is Government Code Section 65852.3.
73
4) Homeless Shelters and Transitional Housing Chapter III discussed the need for housing services for homeless individuals and families in the City. To meet this need, the City will need to identify residential zones for homeless shelters and transitional housing as a land use “by right.”39 Thus, this is another area in which the Zoning Ordinance will need to be revised. Ideally, the zones to be identified will cover sites that are located near public services and facilities, including public transportation access.
5) Transitional and Permanent Supportive Housing Finally, as authorized under SB2, sites for supportive transitional and permanent housing need to be identified. Appropriate sites for supportive transition housing would also be located near services and facilities and be subject to the same permitting processes as other housing in the zone without undue special regulatory requirements. Again, it will be necessary to amend the current Zoning Ordinance to state that supportive transitional housing be allowed in specified districts, which include multifamily zones or mixed use zones. Since permanent supportive housing is very similar to regular multifamily housing, the City can amend its Zoning Ordinance to list supportive housing as one of the possible uses in multifamily zones.
D. Housing Resources The City of Milpitas has access to a variety of funding sources for affordable housing activities. These include federal, state, and local resources. These resources in combination with high density zoning in the Specific Plan Areas, has enabled (and will continue to enable) the City to provide affordable housing opportunities to its residents. 1) Federal Programs CDBG Program Through the CDBG program, the federal Department of Housing and Urban Development (HUD) provides funds to local governments for funding a wide range of housing and community
39 The current designation of group dwelling in the City’s Zoning Ordinance is not adequate, since a shelter or a transitional housing development is larger than a group dwelling.
74
development activities for low-income persons. The City of Milpitas is a CDBG Entitlement City and receives annual allocations directly from HUD. Based on previous allocations, Milpitas expects to receive an annual allocation of $579,009 and an additional $100,000 in Program Income from the Single Family Housing Rehabilitation Program for a total of $679,009. In accordance with established policies, Milpitas is committed to increasing and maintaining affordable housing in the City. CDBG funds are used for site acquisition, rehabilitation, first-time homebuyer assistance, development of emergency and transitional shelters and fair housing/housing counseling activities. Additional activities in support of the new construction of affordable housing include site clearance and the financing of related infrastructure and public facility improvements. HOME Program While Milpitas does not received HOME funds directly from HUD, Milpitas can compete for funds that are allocated by the State of California. Milpitas can work with affordable housing developers to support applications for these funds that can be used for all aspects of affordable housing development. Section 8 Assistance The Section 8 program is a federal program that provides rental assistance to very-low income persons in need of affordable housing. This program offers a voucher that pays the difference between the current fair market rent and what a tenant can afford to pay (e.g. 30 percent of household income). The voucher allows a tenant to select housing that may cost above the payment standard. However, in that situation, the tenant must pay the extra cost. At present, 618 Milpitas households receive Section 8 Vouchers. In addition, affordable housing developments can request project-based Section 8 assistance.
2) State Programs California Housing Finance Agency (CHFA) The California Housing Finance Agency operates several programs that help reduce the cost of housing. These programs, funded by the sale of tax-exempt bonds, provide permanent financing of affordable housing developments, as well as financing for homebuyers.
75
Housing Funds Authorized by State Propositions Since 2002, California voters have voted for two major housing funding programs. The first is referred to as Proposition 46. The funds from this program are now expended. The second Proposition, referred to as Housing and Emergency Shelter Trust Fund Act of 2006, or Proposition 1C, authorized $2.85 billion to be spent on affordable housing and other related activities. Funds from this Proposition still remain. Low Income Housing Tax Credit Program Created by the 1986 Tax Reform Act, the Low Income Housing Tax Credit Program (LIHTC) is used extensively by developers of affordable housing. Although enabling legislation was passed at the federal level, allocations of the tax credits are made by the State of California. Affordable housing developers utilize this program in combination with City and additional funding sources to encourage the construction and rehabilitation of rental housing for lower-income households. The program allows investors an annual tax credit over a ten-year period, provided that the housing meets affordable income requirements. The tax credit is typically sold to large investors at a syndication value. Mortgage Credit Certificate (MCC) Program The Mortgage Credit Certificate Program (MCC), authorized by Congress in 1984, provides financial assistance to first-time homebuyers. Similar to the LIHTC Program, the MCC Program was authorized by the federal government, but is administered by the State. The MCC tax credit reduces the federal income taxes of qualified borrowers purchasing qualified homes; thus having the effect of a mortgage subsidy. The current tax credit rate is 15 percent. The MCC reduces the amount of federal income taxes otherwise due to the federal government; however, the mortgage tax credit cannot be claimed as a refund. While the MCC is not a direct subsidy, it enables program participants to reduce their federal income tax withholdings, so that the MCC indirectly provides a monthly benefit. Santa Clara County administers the MCC Program on behalf of all participating cities located in the county. There are purchase price and income limits. For example, for a resale of an existing home, the sales price limit in 2008 was $570,000, and for a new home, the sales price limit was $630,000. Income limits for 2009 are $97,800 for a one- or two-person household and for a household with three or more persons, the limit is $112,470. This is between median- and moderate-incomes in Santa Clara County.
76
3) Local Programs Redevelopment Housing Setaside Funds In accordance with State law, the Milpitas Redevelopment Agency sets aside 20 percent of all tax increment revenues generated from its redevelopment project areas to fund housing projects that increase, improve or preserve the supply of affordable housing. Housing developed with these set-aside funds must remain affordable to low- and moderate-income households for at least 55 years for rentals and 45 years for ownership housing. Table IV.6 presents information on the assistance provided to mixed-income and affordable developments since 1999. Between 1999 and 2006, the City provided $23.6 million in grants and loans to projects that have built (or will build) 1,826 housing units, of which 785 will be affordable. Since January 2007, the City has authorized an additional expenditure of $6.3 million for developments that will add an additional 400 units, of which 128 will be affordable. The majority of these funds came from the Redevelopment Housing Setaside Fund. These funds provide direct assistance to developers, e.g., developer impact fee assistance, as well as second mortgages to homebuyers. The City’s last Five-Year Implementation Plan covers the time period from 2005 to 2010. According to this Plan, the City anticipates an additional $4.4 million in housing set-aside funds that can be used to support housing during FY 2009. Housing Trust Fund of Santa Clara County The Housing Trust Fund of Santa Clara County provides assistance to first-time homebuyers, the homeless (through the creation of shelters and other special housing programs), and provides loans for new affordable housing development. The City of Milpitas contributes to this Trust Fund and in 2009 allocated $925,000. First-time homebuyers in Milpitas are eligible to receive benefits from the Trust Fund. These benefits include downpayment assistance (up to $15,000 as a deferred loan) and mortgage assistance (below market interest rates and loans with a 40 year amortization). For both programs, there are household income limits. In the downpayment assistance program, the income range is between 60 percent and 100 percent AMI, and for the mortgage assistance program, the income limit is higher at 120 percent AMI.
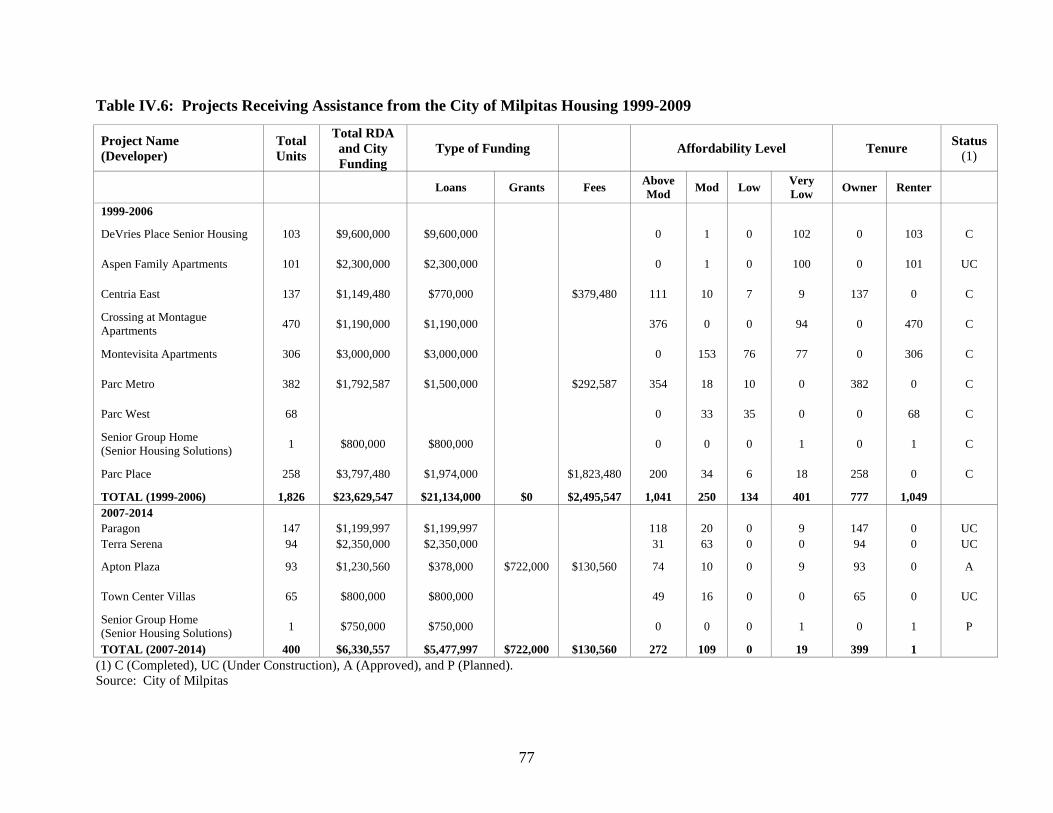
77
Table IV.6: Projects Receiving Assistance from the City of Milpitas Housing 1999-2009
Project Name (Developer)
Total Units
Total RDA and City Funding
Type of Funding Affordability Level Tenure Status (1)
Loans Grants Fees Above Mod Mod Low Very
Low Owner Renter
1999-2006
DeVries Place Senior Housing 103 $9,600,000 $9,600,000 0 1 0 102 0 103 C
Aspen Family Apartments 101 $2,300,000 $2,300,000 0 1 0 100 0 101 UC
Centria East 137 $1,149,480 $770,000 $379,480 111 10 7 9 137 0 C
Crossing at Montague Apartments 470 $1,190,000 $1,190,000 376 0 0 94 0 470 C
Montevisita Apartments 306 $3,000,000 $3,000,000 0 153 76 77 0 306 C
Parc Metro 382 $1,792,587 $1,500,000 $292,587 354 18 10 0 382 0 C
Parc West 68 0 33 35 0 0 68 C
Senior Group Home (Senior Housing Solutions) 1 $800,000 $800,000 0 0 0 1 0 1 C
Parc Place 258 $3,797,480 $1,974,000 $1,823,480 200 34 6 18 258 0 C
TOTAL (1999-2006) 1,826 $23,629,547 $21,134,000 $0 $2,495,547 1,041 250 134 401 777 1,049 2007-2014 Paragon 147 $1,199,997 $1,199,997 118 20 0 9 147 0 UC Terra Serena 94 $2,350,000 $2,350,000 31 63 0 0 94 0 UC
Apton Plaza 93 $1,230,560 $378,000 $722,000 $130,560 74 10 0 9 93 0 A
Town Center Villas 65 $800,000 $800,000 49 16 0 0 65 0 UC
Senior Group Home (Senior Housing Solutions) 1 $750,000 $750,000 0 0 0 1 0 1 P
TOTAL (2007-2014) 400 $6,330,557 $5,477,997 $722,000 $130,560 272 109 0 19 399 1 (1) C (Completed), UC (Under Construction), A (Approved), and P (Planned). Source: City of Milpitas
78
V. HOUSING CONSTRAINTS A. Introduction Housing Constraints are defined as government measures and non-government conditions that limit the amount or timing of residential development. Government regulations can potentially constrain the supply of housing available in a community if the regulations limit the opportunities to develop housing, impose requirements that unnecessarily increase the cost to develop housing, or make the development process so arduous as to discourage housing developers. State law requires housing elements to contain an analysis of the governmental constraints on housing maintenance, improvement, and development (Government Code, Section 65583(a) (4)). Non-governmental constraints (required to be analyzed under Government Code, Section 65583(a) (5)) cover land prices, construction costs, and financing. While local governments cannot control prices or costs, identification of these constraints can be helpful to Milpitas in formulating housing programs. Additional non-governmental factors that may constrain the production of affordable housing in Milpitas include infrastructure availability and environmental features.
B. Potential Government Constraints Government regulations affect housing costs by limiting the supply of buildable land, setting standards and allowable densities for development, and exacting fees for the construction of homes. Potential regulatory constraints include local land use policies (as defined in the Milpitas General Plan), zoning regulations and their accompanying development standards, subdivision regulations, urban limit lines, and development fees. Lengthy approval and processing times also may be regulatory constraints.
1) General Plan The last comprehensive update to the Milpitas General Plan occurred in 1994. During the last Housing Element update, the General Plan was amended to incorporate the land use designations, other policies, and design guidelines defined by the Midtown Specific Area Plan. Since the 2002 Housing Element, the General Plan has been updated to incorporate the land use designations, other policies, and design guidelines defined by the Transit Area Specific Plan.
79
With the recent amendments incorporating the Midtown and Transit Area Specific Plans, the General Plan identifies five categories of residential uses, distinguished from one another by unit type and density. These include R1 (with seven different subcategories depending on minimum lot size and three additional hillside categories), R2, R3, R4, and R5. In addition, there are three mixed use categories (MXD, MXD2 and MXD3) that allow residential development. Finally, there are three overlay districts that affect residential development, including the “S” Site and Architectural Overlay District (S District), the “MHP” Mobile Home Park Overlay District (MHP District), and the “TOD” Transit Oriented Development District (TOD District). 40 If there is inconsistency between regular zoning districts and requirements under an Overlay District, the Overlay District’s rules apply. The sites that benefit from the TOD Overlay District are located in the Transit Specific Plan Area. While the MHP Overlay District currently applies to a small area in the northwest portion of Milpitas zoned for Highway Services (where mobile home parks are currently located), the Mobile Home Park Overlay district could be combined with the R1-6, R2, R3-20 and HS districts. In addition to these zoning categories and overlay districts, the City’s two Specific Plans [Transit Area (Chapter 5) and Midtown Area (Chapter 8)] provide information on additional development requirements. The Zoning Ordinance does not repeat all the information provided in the specific plan documents. Again, as with the Overlay Districts, if there is an inconsistency between the Zoning Ordinance and the Specific Plan, the Specific Plan regulations prevail. If a standard is not listed in the Specific Plans, then the Zoning Ordinance prevails.
2) Zoning Ordinance Densities and Permitted Land Uses Table V-1 provides a summary of the zoning regulations for the five residential and three mixed-use categories that allow residential development. Except in the Hillside Overlay District, the R1 zoning designation spans a range of housing densities (from 4 to 17 dwelling units per gross acre) with minimum lot sizes ranging from 2,500 SF to 10,000 SF. In the Hillside Overlay District, housing densities range from three units per acre to 10 acres per unit, and consequently, minimum lot sizes are much greater and range from 14,520 SF up to 10 acres. Second units are permitted without a conditional use permit in all the R1 zones. The R2 district permits single
40 The Site and Architectural (S) Overlay District is not discussed in detail here. The S District does not impact the zoning parameters discussed in this section. Instead, the purpose of the S District is to encourage attractive development and avoid uses that could have negative impacts on the environment, adjacent land uses, traffic or lead to other negative externalities. The S District accomplishes this through the development review process.
80
family and duplex units, and the remaining residential zoning districts R3, R4, R5, and mixed use) permit multifamily housing. Parking Requirements Table V.1 also provides information on parking requirements specified in the Zoning Ordinance. For the R1 and R2 residential districts, two spaces per unit are required, if there are three or fewer bedrooms. If there are four or more bedrooms, three spaces per unit are required, plus one additional space for each additional bedroom. Parking requirements for R3, R4, R5, and the MXD categories are the same. These requirements are as follows:
• For studios, one covered space is required for each unit. • For one-bedroom units, 1.5 covered spaces are required. • For two- and three-bedroom units, two covered spaces are required per unit. • For four-bedroom units, three spaces are required, of which at least two must be
covered. • For five-bedroom units, four spaces are required, of which at least two must be
covered. • For guest parking requirements – projects with structured parking must provide 15
percent additional parking spaces over the required number of spaces. All of these spaces may be uncovered. For projects with private garages, 20 percent additional parking spaces are required. All of these spaces may be uncovered.
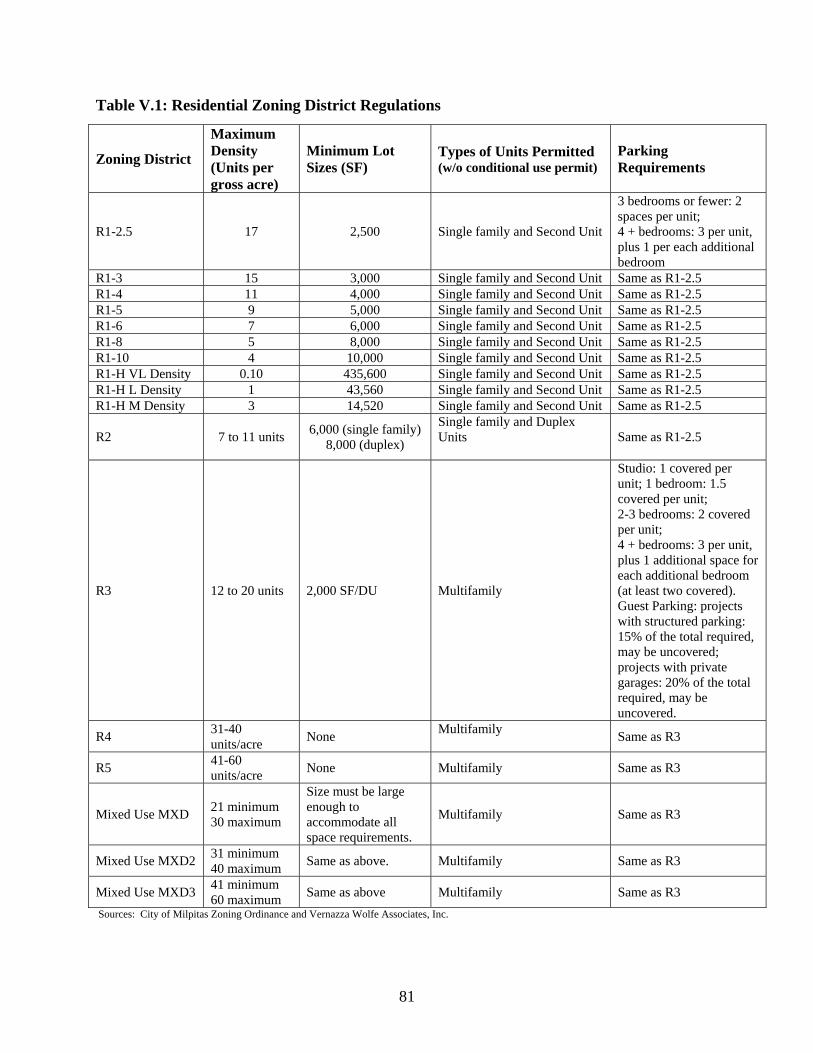
81
Table V.1: Residential Zoning District Regulations
Zoning District
Maximum Density (Units per gross acre)
Minimum Lot Sizes (SF)
Types of Units Permitted (w/o conditional use permit)
Parking Requirements
R1-2.5 17 2,500 Single family and Second Unit
3 bedrooms or fewer: 2 spaces per unit; 4 + bedrooms: 3 per unit, plus 1 per each additional bedroom
R1-3 15 3,000 Single family and Second Unit Same as R1-2.5 R1-4 11 4,000 Single family and Second Unit Same as R1-2.5 R1-5 9 5,000 Single family and Second Unit Same as R1-2.5 R1-6 7 6,000 Single family and Second Unit Same as R1-2.5 R1-8 5 8,000 Single family and Second Unit Same as R1-2.5 R1-10 4 10,000 Single family and Second Unit Same as R1-2.5 R1-H VL Density 0.10 435,600 Single family and Second Unit Same as R1-2.5 R1-H L Density 1 43,560 Single family and Second Unit Same as R1-2.5 R1-H M Density 3 14,520 Single family and Second Unit Same as R1-2.5
R2 7 to 11 units 6,000 (single family) 8,000 (duplex)
Single family and Duplex Units
Same as R1-2.5
R3 12 to 20 units 2,000 SF/DU Multifamily
Studio: 1 covered per unit; 1 bedroom: 1.5 covered per unit; 2-3 bedrooms: 2 covered per unit; 4 + bedrooms: 3 per unit, plus 1 additional space for each additional bedroom (at least two covered). Guest Parking: projects with structured parking: 15% of the total required, may be uncovered; projects with private garages: 20% of the total required, may be uncovered.
R4 31-40 units/acre None Multifamily
Same as R3
R5 41-60 units/acre None Multifamily Same as R3
Mixed Use MXD 21 minimum 30 maximum
Size must be large enough to accommodate all space requirements.
Multifamily Same as R3
Mixed Use MXD2 31 minimum 40 maximum Same as above. Multifamily Same as R3
Mixed Use MXD3 41 minimum 60 maximum Same as above Multifamily Same as R3
Sources: City of Milpitas Zoning Ordinance and Vernazza Wolfe Associates, Inc.
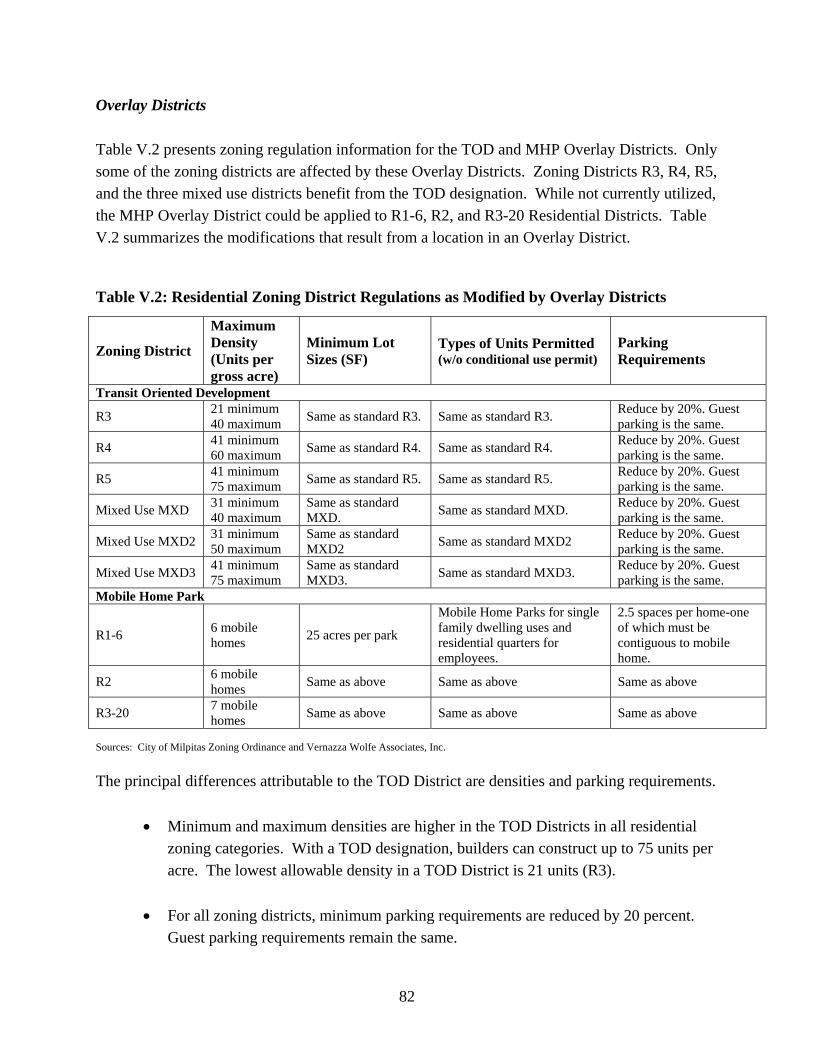
82
Overlay Districts Table V.2 presents zoning regulation information for the TOD and MHP Overlay Districts. Only some of the zoning districts are affected by these Overlay Districts. Zoning Districts R3, R4, R5, and the three mixed use districts benefit from the TOD designation. While not currently utilized, the MHP Overlay District could be applied to R1-6, R2, and R3-20 Residential Districts. Table V.2 summarizes the modifications that result from a location in an Overlay District. Table V.2: Residential Zoning District Regulations as Modified by Overlay Districts
Zoning District
Maximum Density (Units per gross acre)
Minimum Lot Sizes (SF)
Types of Units Permitted (w/o conditional use permit)
Parking Requirements
Transit Oriented Development
R3 21 minimum 40 maximum Same as standard R3. Same as standard R3. Reduce by 20%. Guest
parking is the same.
R4 41 minimum 60 maximum Same as standard R4. Same as standard R4. Reduce by 20%. Guest
parking is the same.
R5 41 minimum 75 maximum Same as standard R5. Same as standard R5. Reduce by 20%. Guest
parking is the same.
Mixed Use MXD 31 minimum 40 maximum
Same as standard MXD. Same as standard MXD. Reduce by 20%. Guest
parking is the same.
Mixed Use MXD2 31 minimum 50 maximum
Same as standard MXD2 Same as standard MXD2 Reduce by 20%. Guest
parking is the same.
Mixed Use MXD3 41 minimum 75 maximum
Same as standard MXD3. Same as standard MXD3. Reduce by 20%. Guest
parking is the same. Mobile Home Park
R1-6 6 mobile homes 25 acres per park
Mobile Home Parks for single family dwelling uses and residential quarters for employees.
2.5 spaces per home-one of which must be contiguous to mobile home.
R2 6 mobile homes Same as above Same as above Same as above
R3-20 7 mobile homes Same as above Same as above Same as above
Sources: City of Milpitas Zoning Ordinance and Vernazza Wolfe Associates, Inc. The principal differences attributable to the TOD District are densities and parking requirements.
• Minimum and maximum densities are higher in the TOD Districts in all residential zoning categories. With a TOD designation, builders can construct up to 75 units per acre. The lowest allowable density in a TOD District is 21 units (R3).
• For all zoning districts, minimum parking requirements are reduced by 20 percent.
Guest parking requirements remain the same.
83
The TOD District has two main purposes. The first is to support transit by increasing the number of residential units near stations and bus stops. The second and related purpose is to decrease parking requirements. This decrease is justified on the grounds that occupants of TOD units will use transit for some portion of work or personal trips, therefore lessening demand for auto use. However, the main purpose of the MHP Overlay District is to “promote the expansion and diversification of the available housing opportunities within the City of Milpitas by the establishment of standards for the creation of planned mobile home parks.” 41 The MHP Overlay District establishes a zoning designation that both permits and regulates mobile home parks. These regulations include parking requirements, minimum mobile home park size, and maximum densities.
3) Site Development Standards Through its Zoning Ordinance, the City of Milpitas enforces minimum site development standards for new residential developments. These standards include lot width, setbacks, lot coverage, and maximum building height. This information is readily available to the public and is posted on the City’s website. The City’s standards allow appropriate levels of development. Table V.3 summarizes height and setback standards by zoning district. Height Limits The standard height limit in the R1 and R2 zones is 30 feet. Again, there are different requirements for the Hillside Combining District. The maximum height in the three hillside districts is lower, at 17 feet. (See Table V.3.) In the R3, R4, R5, and Mixed Use Zones, maximum heights are considerably higher than in the R1 and R2 zones, ranging in height from 35 feet (R3) to 150 feet (MXD3). Setbacks Unlike other specifications, the setback requirements for the residential uses are somewhat similar except for the Hillside districts, R4, R5, and the Mixed Use zoning categories. For the most part, the front, side, and rear setbacks in the Hillside Combining District are greater than those that apply to other R1 zones. The setbacks in the R4, R5, and Mixed Use districts are slightly lower to permit efficient utilization of sites.
41 Paragraph A of Section XI-10-12.04 of the Zoning Code.
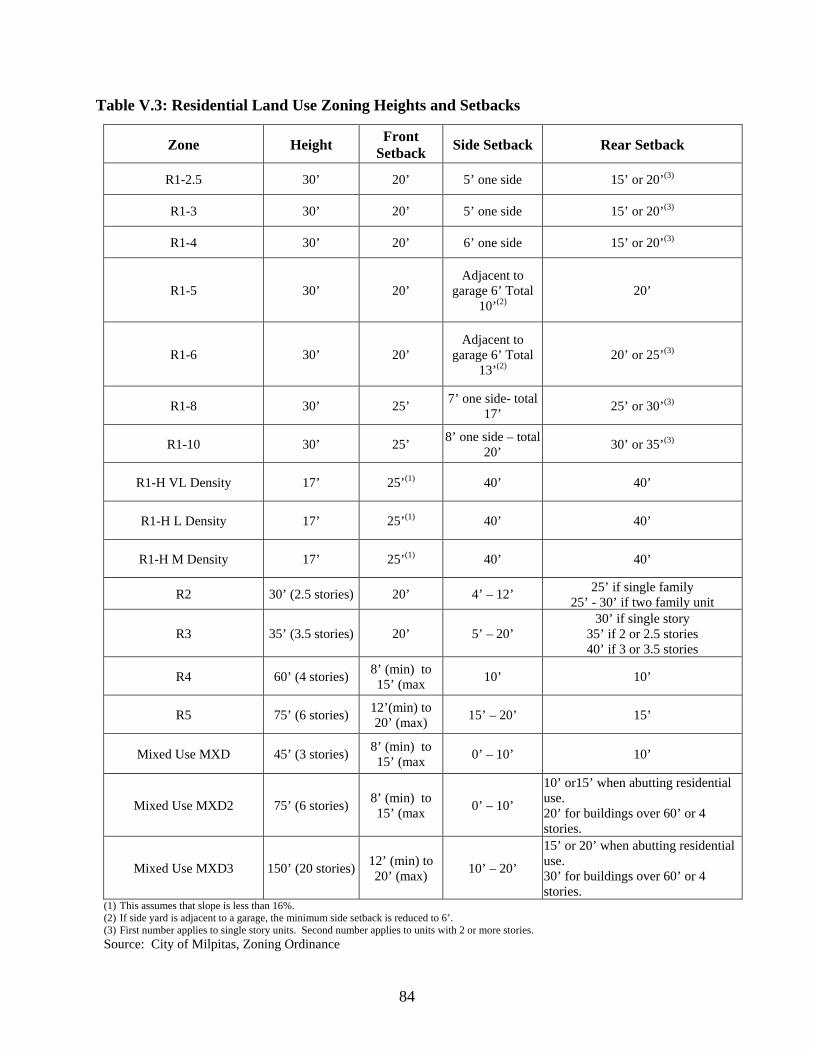
84
Table V.3: Residential Land Use Zoning Heights and Setbacks
Zone Height Front Setback Side Setback Rear Setback
R1-2.5 30’ 20’ 5’ one side 15’ or 20’(3)
R1-3 30’ 20’ 5’ one side 15’ or 20’(3)
R1-4 30’ 20’ 6’ one side 15’ or 20’(3)
R1-5 30’ 20’ Adjacent to
garage 6’ Total 10’(2)
20’
R1-6 30’ 20’ Adjacent to
garage 6’ Total 13’(2)
20’ or 25’(3)
R1-8 30’ 25’ 7’ one side- total 17’ 25’ or 30’(3)
R1-10 30’ 25’ 8’ one side – total 20’ 30’ or 35’(3)
R1-H VL Density 17’ 25’(1) 40’ 40’
R1-H L Density 17’ 25’(1) 40’ 40’
R1-H M Density 17’ 25’(1) 40’ 40’
R2 30’ (2.5 stories) 20’ 4’ – 12’ 25’ if single family 25’ - 30’ if two family unit
R3 35’ (3.5 stories) 20’ 5’ – 20’ 30’ if single story
35’ if 2 or 2.5 stories 40’ if 3 or 3.5 stories
R4 60’ (4 stories) 8’ (min) to 15’ (max 10’ 10’
R5 75’ (6 stories) 12’(min) to 20’ (max) 15’ – 20’ 15’
Mixed Use MXD 45’ (3 stories) 8’ (min) to 15’ (max 0’ – 10’ 10’
Mixed Use MXD2 75’ (6 stories) 8’ (min) to 15’ (max 0’ – 10’
10’ or15’ when abutting residential use. 20’ for buildings over 60’ or 4 stories.
Mixed Use MXD3 150’ (20 stories) 12’ (min) to 20’ (max) 10’ – 20’
15’ or 20’ when abutting residential use. 30’ for buildings over 60’ or 4 stories.
(1) This assumes that slope is less than 16%. (2) If side yard is adjacent to a garage, the minimum side setback is reduced to 6’. (3) First number applies to single story units. Second number applies to units with 2 or more stories. Source: City of Milpitas, Zoning Ordinance
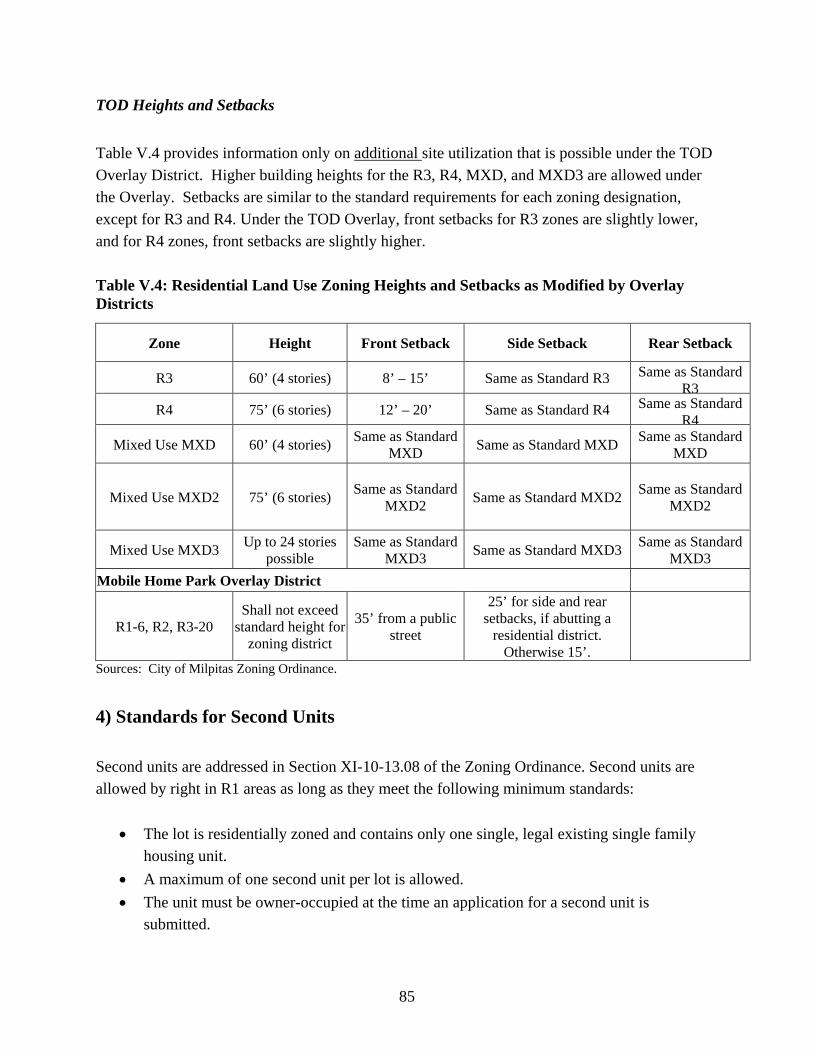
85
TOD Heights and Setbacks Table V.4 provides information only on additional site utilization that is possible under the TOD Overlay District. Higher building heights for the R3, R4, MXD, and MXD3 are allowed under the Overlay. Setbacks are similar to the standard requirements for each zoning designation, except for R3 and R4. Under the TOD Overlay, front setbacks for R3 zones are slightly lower, and for R4 zones, front setbacks are slightly higher. Table V.4: Residential Land Use Zoning Heights and Setbacks as Modified by Overlay Districts
Zone Height Front Setback Side Setback Rear Setback
R3 60’ (4 stories) 8’ – 15’ Same as Standard R3 Same as Standard R3
R4 75’ (6 stories) 12’ – 20’ Same as Standard R4 Same as Standard R4
Mixed Use MXD 60’ (4 stories) Same as Standard MXD Same as Standard MXD Same as Standard
MXD
Mixed Use MXD2 75’ (6 stories) Same as Standard MXD2 Same as Standard MXD2 Same as Standard
MXD2
Mixed Use MXD3 Up to 24 stories possible
Same as Standard MXD3 Same as Standard MXD3 Same as Standard
MXD3 Mobile Home Park Overlay District
R1-6, R2, R3-20 Shall not exceed
standard height for zoning district
35’ from a public street
25’ for side and rear setbacks, if abutting a
residential district. Otherwise 15’.
Sources: City of Milpitas Zoning Ordinance.
4) Standards for Second Units Second units are addressed in Section XI-10-13.08 of the Zoning Ordinance. Second units are allowed by right in R1 areas as long as they meet the following minimum standards:
• The lot is residentially zoned and contains only one single, legal existing single family housing unit.
• A maximum of one second unit per lot is allowed. • The unit must be owner-occupied at the time an application for a second unit is
submitted.
86
• The second unit may not be sold to a different owner than the owner of the main residence. However, the second unit may be rented.
• Attached second units cannot exceed 30% of the existing living area, with a maximum of 475 SF. If the attached second unit is located in the Hillside Combining District, the maximum area increases to 1,200 SF, as long as this does not represent more than 30% of the existing floor area of the primary housing unit.
• There are specified height and setback requirements, again, that vary between Hillside and non-Hillside areas. For example, there is a height limit of 15’ in the non-Hillside areas, and 17’ in the Hillside areas.
• One additional off-street parking space is required and may be tandem parking. • Other standards include the definition of minimum size (150 SF), the maximum number
of rooms (one bedroom and one kitchen), the requirement for a permanent foundation, and design and setback requirements (the second unit must fit in the existing unit’s footprint).
Based on these criteria, the City’s Zoning Ordinance does not present a constraint to second unit production, particularly since homeowners can develop second units “by right” and separate, covered parking is not required.
5) Urban Growth Boundary Milpitas voters approved this Urban Growth Boundary (UGB) in 1998. The UGB establishes an urban limit line. The boundary is intended to remain in place through 2018 and can only be amended through a majority vote of the electorate. The UGB was primarily created as a hillside protection measure. The Urban Growth Boundary has primarily impacted the above moderate-income housing market and has had little or no impact on low- and moderate-income households. The high cost of hillside construction, the prestige associated with a “view” or hillside home, and the general character of the area make it difficult to build more affordable housing in these areas. Utility and road extensions would be costly. Higher density housing in this area would require large-scale grading, cuts and fills, and would have substantial adverse environmental impacts. Moreover, the potential for landslides and wildfire in the hillside areas suggest that increasing population densities in these areas could be imprudent. However, a limited amount of development potential still exists beyond the Growth Boundary, subject to a slope density formula that dictates minimum lot sizes.
87
Aside from potential impacts on the luxury housing market, the City has mitigated impacts from the growth boundary on the supply of housing by significantly increasing the residential development potential of land within the existing urbanized area. The rezoning of several hundred acres of former commercial and industrial sites within the Specific Plan Areas to very high residential densities and mixed use development has more than compensated for the loss of development potential outside the Urban Growth Boundary. Moreover, the viability of affordable housing in the Specific Plan Areas is far greater than it would be on sites in the hillsides, given the higher densities permitted and the proximity to mass transit and urban services. Finally, the UGB is in keeping with the general principles of “smart growth” advocated by the Association of Bay Area Governments and planning agencies throughout the San Francisco Bay Area.
6) Density Bonus Law During the last Housing Element period, density bonuses had been granted through the use of a Density Bonus Combining District which could be applied in all residential zones, but which required an additional step in the development process. One of the program recommendations in the last Housing Element was to amend the City’s Density Bonus so that it would eliminate the Combining District approach and be consistent with State Law. Consequently, the City adopted a Density Bonus Ordinance (Section XI-10-54-15 of the Zoning Code) in 2005. The Density Bonus applies to all zoning districts that allow residential development, and the minimum project threshold size is five dwelling units. In addition to providing higher densities, the Ordinance also allows reduced parking standards. Table V.5 provides a summary of the key features of this Ordinance.
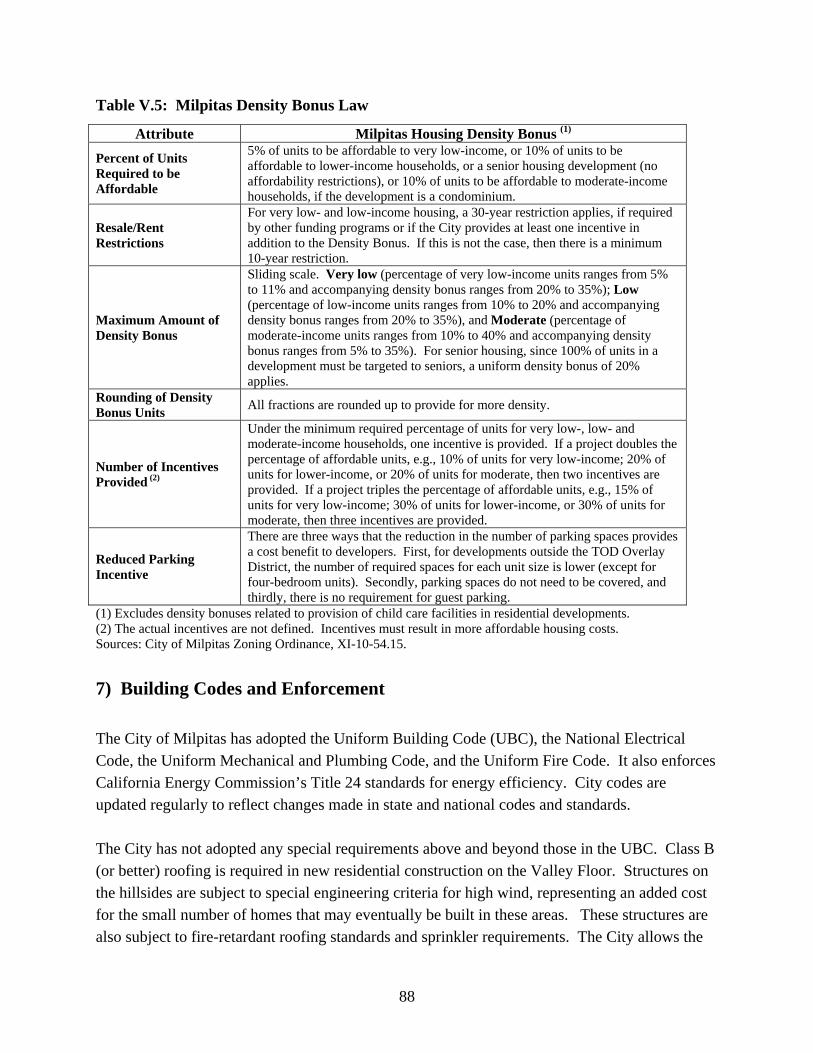
88
Table V.5: Milpitas Density Bonus Law
Attribute Milpitas Housing Density Bonus (1) Percent of Units Required to be Affordable
5% of units to be affordable to very low-income, or 10% of units to be affordable to lower-income households, or a senior housing development (no affordability restrictions), or 10% of units to be affordable to moderate-income households, if the development is a condominium.
Resale/Rent Restrictions
For very low- and low-income housing, a 30-year restriction applies, if required by other funding programs or if the City provides at least one incentive in addition to the Density Bonus. If this is not the case, then there is a minimum 10-year restriction.
Maximum Amount of Density Bonus
Sliding scale. Very low (percentage of very low-income units ranges from 5% to 11% and accompanying density bonus ranges from 20% to 35%); Low (percentage of low-income units ranges from 10% to 20% and accompanying density bonus ranges from 20% to 35%), and Moderate (percentage of moderate-income units ranges from 10% to 40% and accompanying density bonus ranges from 5% to 35%). For senior housing, since 100% of units in a development must be targeted to seniors, a uniform density bonus of 20% applies.
Rounding of Density Bonus Units All fractions are rounded up to provide for more density.
Number of Incentives Provided (2)
Under the minimum required percentage of units for very low-, low- and moderate-income households, one incentive is provided. If a project doubles the percentage of affordable units, e.g., 10% of units for very low-income; 20% of units for lower-income, or 20% of units for moderate, then two incentives are provided. If a project triples the percentage of affordable units, e.g., 15% of units for very low-income; 30% of units for lower-income, or 30% of units for moderate, then three incentives are provided.
Reduced Parking Incentive
There are three ways that the reduction in the number of parking spaces provides a cost benefit to developers. First, for developments outside the TOD Overlay District, the number of required spaces for each unit size is lower (except for four-bedroom units). Secondly, parking spaces do not need to be covered, and thirdly, there is no requirement for guest parking.
(1) Excludes density bonuses related to provision of child care facilities in residential developments. (2) The actual incentives are not defined. Incentives must result in more affordable housing costs. Sources: City of Milpitas Zoning Ordinance, XI-10-54.15.
7) Building Codes and Enforcement The City of Milpitas has adopted the Uniform Building Code (UBC), the National Electrical Code, the Uniform Mechanical and Plumbing Code, and the Uniform Fire Code. It also enforces California Energy Commission’s Title 24 standards for energy efficiency. City codes are updated regularly to reflect changes made in state and national codes and standards. The City has not adopted any special requirements above and beyond those in the UBC. Class B (or better) roofing is required in new residential construction on the Valley Floor. Structures on the hillsides are subject to special engineering criteria for high wind, representing an added cost for the small number of homes that may eventually be built in these areas. These structures are also subject to fire-retardant roofing standards and sprinkler requirements. The City allows the
89
use of the more flexible State Historic Building Code for historic structures, although the number of eligible structures is small. While the UBC contains no prohibitions on exterior building materials, the Midtown and Transit Area Specific Plans disallow certain materials. These include vinyl, aluminum, and T-111 siding, and horizontal sliding or plastic snap-in windows. These prohibitions should not affect housing affordability or production. For example, affordable housing projects in the City have used stucco or wood exteriors, allowing them to better blend with the surrounding community and convey an image of quality and durability.
8) Site Improvement Requirements Residential developers are responsible for constructing road, water, sewer, and storm drainage improvements on new housing sites. Where a project has off-site impacts, such as increased run-off or added congestion at a nearby intersection, developers may be responsible for additional expenses to offset impacts from their projects. The City’s Subdivision Ordinance, which is part of the City’s Municipal Code, establishes the requirements for new subdivisions, including local street rights-of-way and curb-to-curb widths, sanitary sewer and storm drainage lines, and easements. These requirements do not restrict market rate housing development. While there are no special provisions or exceptions in the Subdivision Ordinance for affordable units, the City Council has the discretion to consider such exceptions. The City allows narrower streets within new subdivisions if these streets are privately owned and maintained, and if safety and emergency access concerns are adequately addressed.
9) Design Review The City of Milpitas requires design review for projects within the “S” overlay zoning district only. These districts generally apply in commercial, industrial, and multifamily residential areas, and on the hillsides. Since most single family homes are outside the S district, alterations to individual homes (such as remodels and additions) are not usually subject to design review. New multifamily projects are typically evaluated through a site plan review process, which includes an evaluation of design attributes by the Planning Commission.
90
The City has not adopted citywide residential design guidelines, but has adopted guidelines for the Midtown and Transit Specific Plan Areas.42 These Guidelines cover site planning and building design, including massing, windows, materials, color, roof design, landscaping, signage, and lighting. In addition, there are specific guidelines by building type, covering mixed-use and multifamily residential. These Guidelines do not pose a constraint, and are intended to ameliorate concerns that could arise when very high density residential projects are proposed in a city, such as Milpitas, that had primarily consisted of single family homes. Subsurface parking is required in higher density housing and can extend no more than five feet above grade. While the cost of subsurface garages is high, the high densities allowed (up to 75 units per acre), can support the higher development costs of subsurface parking.
10) Permit Processing Permit processing time is not a development constraint in Milpitas. Small to medium-sized projects (less than 50 units) consistent with the General Plan and Zoning Ordinance typically receive final zoning and tentative map approval within three months after a complete application is submitted. Projects requiring an environmental impact report, a General Plan Amendment, or a major rezoning may require longer processing times. New subdivisions and multifamily construction are subject to environmental review, under the California Environmental Quality Act. One of the advantages of the two Specific Plan Environmental Impact Reports (EIRs) is that future projects are expected to rely heavily on those documents rather than preparing entirely new EIRs to assess broad-based and cumulative impacts (such as geologic hazards and air quality). Additional environmental review may still be required, but only if the project has the potential for impacts not already considered. Once zoning approval is obtained, building permit processing times are relatively short. The City is in compliance with the Permit Streamlining Act and typically issues building permits within six to eight weeks after complete applications are received. To expedite the process, an applicant may request an outside Plan Checker from the City’s approved list. Longer times, ranging from six to nine weeks, are possible for multifamily developments. Pre-development conferences and meetings with staff are encouraged before applications are submitted. In this way, concerns can be addressed early and subsequent delays can be avoided.
42 The Appendix to the Transit Area Specific Plan provides detailed design guideline information for new residential construction in both Specific Plan Areas.
91
11) Development Fees The City of Milpitas charges residential developers several different types of fees for services performed by City staff, including staff review of building plans and inspection of construction in progress. In addition, developers pay for sewer and water hook-ups, storm drainage connections, impact fees for schools, parks and traffic, and additional fees for fire and sewer facilities. Finally, developers of larger projects may incur costs in complying with the City’s Affordable Housing Policy, either by building the required affordable units, or by providing land or capital to affordable housing developers. Table V.6 shows total fees for two residential prototypes in Milpitas.
• The first prototype presented in Table V.6 is a single home that is a three-bedroom, two-story house. This prototype consists of 2,000 SF of interior space a 400 SF garage. It is sited on a 5,000 SF lot. The house is located outside the Hillside Combining District and the two Specific Plan Areas.
• The second prototype is a multifamily development that is wood-frame construction
consisting of 150 units on 4.5 acres (density is 34 units per acre). Each unit has two bedrooms and is 1,200 SF in size with 200 SF of parking space per unit. Again, this development is outside the two Specific Plan Areas. For this prototype, there are two variations. One assumes that the development is located outside the Transit Specific Plan Area, and the second assumes that the development is located inside the Transit Specific Plan Area.
According to the estimates presented in Table V.6, a single family home could pay $42,700 in development fees, and a multifamily unit (outside the Transit Specific Plan Area) would pay less, at approximately $28,600 in fees. Both figures are under-estimates of actual fees, since they do not include the City’s traffic impact fee which varies by location and is difficult to model. The City has also adopted a special Transit Area Impact Fee that covers impact fees for the sewer treatment plant and the Park In-Lieu Fee. This fee is also included in Table V.6 below.43 If the multifamily prototype were located in the Transit Area, it would pay fees totaling approximately $29,499 per unit.
43 In order to compare fees within the Transit Specific Plan Area with those outside the Transit Area, the component of the Transit Area Impact Fee that covers traffic impacts is not included in this fee estimate.
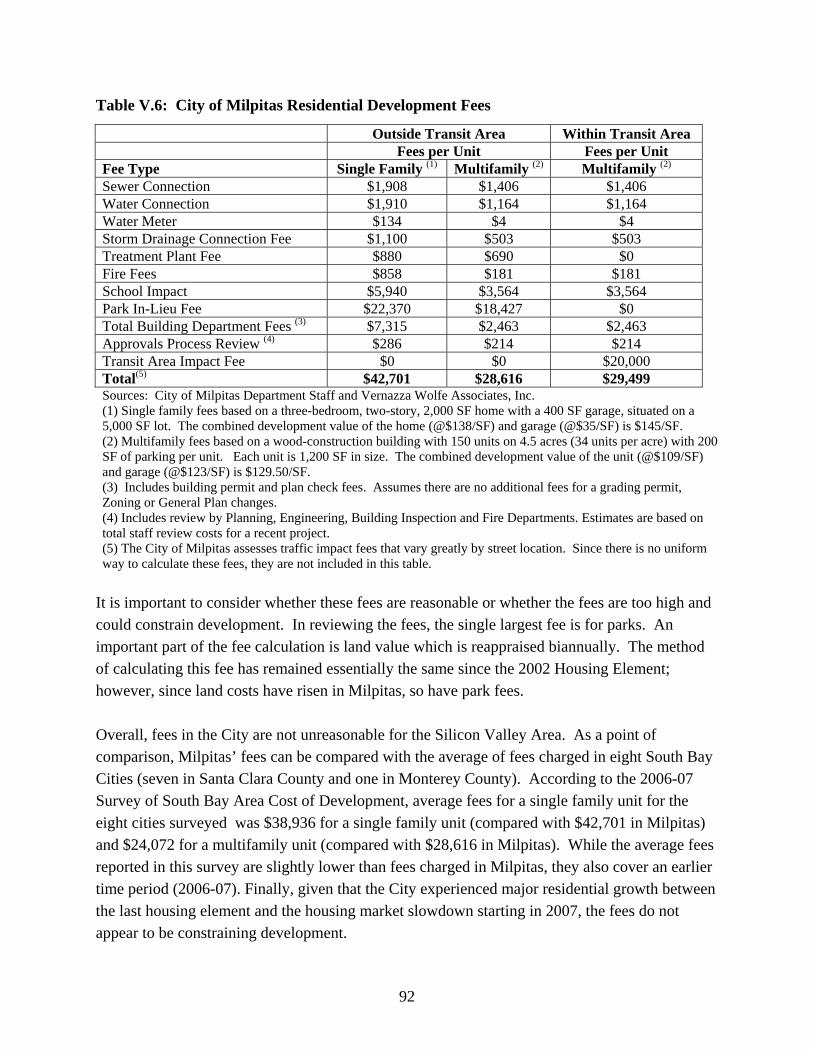
92
Table V.6: City of Milpitas Residential Development Fees
Outside Transit Area Within Transit Area Fees per Unit Fees per Unit Fee Type Single Family (1) Multifamily (2) Multifamily (2) Sewer Connection $1,908 $1,406 $1,406 Water Connection $1,910 $1,164 $1,164 Water Meter $134 $4 $4 Storm Drainage Connection Fee $1,100 $503 $503 Treatment Plant Fee $880 $690 $0 Fire Fees $858 $181 $181 School Impact $5,940 $3,564 $3,564 Park In-Lieu Fee $22,370 $18,427 $0 Total Building Department Fees (3) $7,315 $2,463 $2,463 Approvals Process Review (4) $286 $214 $214 Transit Area Impact Fee $0 $0 $20,000 Total(5) $42,701 $28,616 $29,499 Sources: City of Milpitas Department Staff and Vernazza Wolfe Associates, Inc. (1) Single family fees based on a three-bedroom, two-story, 2,000 SF home with a 400 SF garage, situated on a 5,000 SF lot. The combined development value of the home (@$138/SF) and garage (@$35/SF) is $145/SF. (2) Multifamily fees based on a wood-construction building with 150 units on 4.5 acres (34 units per acre) with 200 SF of parking per unit. Each unit is 1,200 SF in size. The combined development value of the unit (@$109/SF) and garage (@$123/SF) is $129.50/SF. (3) Includes building permit and plan check fees. Assumes there are no additional fees for a grading permit, Zoning or General Plan changes. (4) Includes review by Planning, Engineering, Building Inspection and Fire Departments. Estimates are based on total staff review costs for a recent project. (5) The City of Milpitas assesses traffic impact fees that vary greatly by street location. Since there is no uniform way to calculate these fees, they are not included in this table.
It is important to consider whether these fees are reasonable or whether the fees are too high and could constrain development. In reviewing the fees, the single largest fee is for parks. An important part of the fee calculation is land value which is reappraised biannually. The method of calculating this fee has remained essentially the same since the 2002 Housing Element; however, since land costs have risen in Milpitas, so have park fees. Overall, fees in the City are not unreasonable for the Silicon Valley Area. As a point of comparison, Milpitas’ fees can be compared with the average of fees charged in eight South Bay Cities (seven in Santa Clara County and one in Monterey County). According to the 2006-07 Survey of South Bay Area Cost of Development, average fees for a single family unit for the eight cities surveyed was $38,936 for a single family unit (compared with $42,701 in Milpitas) and $24,072 for a multifamily unit (compared with $28,616 in Milpitas). While the average fees reported in this survey are slightly lower than fees charged in Milpitas, they also cover an earlier time period (2006-07). Finally, given that the City experienced major residential growth between the last housing element and the housing market slowdown starting in 2007, the fees do not appear to be constraining development.
93
12) State of California Article 34 Article 34 of the State Constitution requires voter approval for specified “low rent” housing projects that involve certain types of public agency participation. Generally, a project is subject to Article 34 if more than 49 percent of its units will be rented to low-income persons, and if the City is the developer. If a project is subject to Article 34, it will require an approval from the local electorate. This can pose a constraint to the production of affordable housing, since the process to seek ballot approval for affordable housing projects can be costly and time consuming, with no guarantee of success. The provisions of Article 34 allow local jurisdictions to seek voter approval for “general authority” to develop low-income housing without identifying specific projects or sites. If the electorate approves general parameters for certain types of affordable housing development, the local jurisdiction will be able to move more quickly in response to housing opportunities that fall within those parameters. The City of Milpitas has not held an Article 34 election, since it does not directly build affordable housing. Instead, the City provides loans and grants to affordable housing developers and therefore does not trigger Article 34. So far, a lack of Article 34 authorization has not been a barrier in the production of affordable housing.
13) Infrastructure and Public Facility Constraints Most housing sites in Milpitas are in developed areas that are fully served by infrastructure. The conversion of older industrial and heavy commercial sites in the Specific Plan Areas to residential and mixed land uses require that additional infrastructure investment be undertaken. Furthermore, because many of the sites identified in Chapter IV are located in the Specific Plan Areas, it is very important to understand whether inadequacy of infrastructure could serve as a constraint to development during the Housing Element Update period. Adequacy of infrastructure to accommodate development in the Midtown Specific Plan Area was discussed in the 2002 Housing Element Update. The 2009 Housing Element Update focuses on the Transit Area Specific Plan Area, since it was adopted since the last Housing Element period. The Transit area provides opportunities for high density residential development with good freeway and transportation access.44 In addition, since the area is undergoing land use
44 This area enjoys close access to two freeways, two light rail stations, and a future BART station.
94
conversion from industrial and heavy commercial to residential and mixed uses, some of the parcels in the Transit Area are large in size, which facilitates multifamily development. This subsection discusses the need for infrastructure and public facilities that has been identified in the Transit Area Specific Plan EIR, as well as some information about infrastructure constraints elsewhere in the City. Roads Even in the absence of new development in the Transit Area, traffic congestion is already a problem in Milpitas during peak hours. The Environmental Impact Report for the Transit Area Specific Plan discusses impacts of planned growth in the area on the roads and highways in Milpitas. The Executive Summary of the EIR concludes that there will be significant, unavoidable environmental impacts on the transportation system. These include the following:
• Freeway speeds and delays on I-680, I-880, and SR-237 segments will be below the Congestion Management Program LOS Standards.
• There will be substandard roadway segment operation during peak hours along numerous roads.
• Growth in the Transit Area will contribute to substandard intersection operations during peak hours along 15 key intersections. However, impacts at two intersections are more easily mitigated than are impacts at other affected intersections.
In the detailed listing of impacts, 13 intersections are identified that could operate at unacceptable levels of service when the area is built out. These intersections are divided into two groups. The first group consists of roads that are not programmed for improvements and includes the following intersections:
1. Tasman/Alder Drive 2. McCarthy Boulevard/Alder Drive 3. Tasman Drive/N. First St. 4. Montague Expressway/Milpitas Boulevard 5. Montague Expressway/First Street
The second group consists of intersections that can be improved once funds are generated through a traffic fee. .
1. Tasman Drive/I-880 SB Ramps 2. Great Mall Parkway/I-880 NB Ramps 3. Montague Expressway/McCarthy Boulevard-O’Toole Avenue
95
4. N. Capitol Avenue/Trade Zone Boulevard-Cropley Avenue 5. Great Mall Parkway-E. Capitol Avenue/Montague Expressway 6. Montague Expressway/Zanker Road 7. Montague Expressway/S. Main Street-Oakland Road 8. Montague Expressway/McCandless Drive-Trade Zone
Between the time there is new development in the Transit Area and the point at which sufficient funds accumulate to pay for transportation improvements, the affected roads will be operating below an acceptable level of service. One of the principal motives in adopting a transit area is to encourage the use of transit. Thus, it is anticipated that the light rail system and proposed BART extension should also help manage future congestion, as will the improvement of bicycle and pedestrian facilities planned for the area.45 Water An updated Urban Water Management Plan was adopted by the City of Milpitas in December 2005. As described by this Plan, the City of Milpitas receives potable water from the San Francisco Public Utilities Commission (SFPUC) and the Santa Clara Valley Water District (SCVWD) and distributes this water to two separate areas of the City. In addition, the City receives recycled water from the San Jose/Santa Clara Water Pollution Control Plant (WPCP), South Bay Water Recycling Program. During normal rainfall periods, the City has sufficient water supply to meet water demands through 2030. However, the City could be impacted by drought shortages. During drought periods, the two water wholesalers may not have sufficient supplies to meet demand. When this situation occurs, it may be necessary to reduce water deliveries through drought rationing options, such as calls for voluntary water conservation or mandatory reductions. As described by the Milpitas Transit Area Infrastructure Financing Technical Report, the Transit Area is located primarily within the SCVWD’s service zones. The increase in water demand associated with redevelopment in this area can be met through supplies available from the SCVWD. The Transit Area Development Impact Fee will fund construction of the additional 45 In November 2008, voters in Santa Clara County passed an increase in the County sales tax to pay for the BART extension through Milpitas. While it is necessary to secure additional state and federal funding, the proposed BART Station in the Transit Area is becoming more of a reality. At this time, the planned Milpitas BART Station will be a below-grade station near Montague Expressway and Capitol Avenue, south of the Great Mall.
96
main lines needed to connect the development portions of the Transit Area to the City’s water system. The fee will also cover costs to connect the expansion of the City’s recycled water system to new development. (Recycled water is used for irrigation and may be used for industrial processes). In addition, new development will be required to install water saving devices required by the Uniform Plumbing Cod as adopted by the City of Milpitas. These devices reduce water consumption and consequently reduce wastewater. Wastewater Wastewater from Milpitas is directed to the WPCP for treatment. Improvements needed within the Transit Area to existing sewer mains are identified in the 2004 Sewer Master Plan Revisions and Draft 2007 Sewer Master Plan Update. The Transit Area Development Impact Fee will provide funds to construct the improvements necessary to transport wastewater from developing portions of the Transit Area to the City’s sewage treatment trunk lines connecting the City to the treatment plant. The additional capacity required to accommodate cumulative growth in the city along with the Transit Area growth can be accommodated by the City’s contracted capacity at the WPCP. The City has contractual rights to 14.25 mgd. Thus, the City could need to acquire an additional 0.75 mgd of capacity at the WPCP if needed. The City will monitor the increase in demand generated by growth throughout the City, including the net increase attributable to the Transit Area, to determine when additional capacity will be needed. Storm Drainage The Transit Specific Plan Area is located within the lower floodplain areas of local watersheds. Thus, it is subject to flood hazards. In fact, there are three zones that are categorized by FEMA as 100-year floodplains. Because of this situation, area-wide planning is required and special construction methods must be applied to development within much of the Transit Area. The 2001 Storm Drainage Master Plan identified improvements for the Transit Area. These include construction of a culvert and constructing additional drainage pipes. In addition to area-wide improvements, storm drainage studies for new development projects are performed on a case-by-case basis, with mitigation measures determined for each project. These measures may include on-site improvements, such as raising development sites with fill or
97
adding storm water retention pond, and off-site improvements, such as the widening of channels or culverts downstream. The improvements are typically financed by the developer as a condition of approval. Most of the large residential projects built during the last few years, including affordable projects, have been subject to storm drainage improvement requirements. While the storm drainage improvements add to development costs, they have not been a constraint to development as evidenced by the recent construction of housing projects in the floodplain. Solid Waste The City of Milpitas sends all of its recycling and garbage at the for processing at the Allied Waste Services (Allied) Recyclery and disposal at the Newby Island Sanitary Landfill (NISL) respectively. The City's collection and disposal contracts with Allied (and affiliate companies) end September 5, 2017. Recent studies estimate that the NISL may remain open until approximately 2025. However, this is dependant upon the facility obtaining an extension of its State permit. The City offers residential and commercial recycling programs and maintains outreach programs promoting source reduction and waste prevention. However, residential and commercial development in the Transit Area will increase recycling and garbage generation. The Transit Area EIR states that development in the Transit Area will not cause an appreciable change in the filling rate of the NISL. Based on the City's waste characterization study of 2002, this is primarily due to effective diversion rates (recycling program participation).
14) Environmental Constraints Housing production in Milpitas is constrained by steep hillsides on the east, wetlands on the west, and City boundaries on the north and south. Because of these physical limitations, future housing development will largely occur through infill and redevelopment. Although development on the hillsides is theoretically possible, the area has serious seismic and landslide constraints. Hillside homes would be expensive to construct and could have significant environmental impacts. Residents would be subject to ongoing geologic and wildfire risks. The entire City is located in a seismically active area. The closest fault to the Transit area is the Hayward Fault Zone, located two miles to the east. On sites throughout the Bay Area, housing must meet building code standards which reflect the area’s earthquake-related ground shaking and liquefaction hazards.
98
As mentioned earlier in this section, flooding is another environmental constraint that could affect housing production. Some of the housing sites in the Transit area are located within the 100-year floodplain. Although flood depths would be very shallow, a combination of on-site and off-site improvements may still be required before building in areas that could experience flooding. Although such environmental constraints could ultimately impact the cost of new housing, they are relatively common in the Bay Area. Natural hazards are a fact of life in Coastal California, and there are few steps the City can take to reduce their impact on housing costs without endangering public safety.
C. Assessment of Potential Barriers The City of Milpitas has demonstrated its support of higher density housing, particularly near transit. It has created two specific plans, rezoned many sites in the specific plan areas to higher densities and created a TOD Overlay District that further augments allowable residential densities. Other Zoning Ordinance changes have resulted in reduced setbacks, reduced parking requirements, and higher height limits. During the residential development boom period in the early part of this decade, builders responded to these changes by proposing and building many market housing units, as well as required affordable units. At this time, the Zoning Ordinance, other development standards, and the permitting process do not constitute barriers to development in Milpitas. The City continues to enforce its Urban Growth Boundary (UGB) that was approved by voters in 1998. While the UGB does restrict development on the City’s hillsides, it also protects the hillsides, reduces the possibility for landslides and wildfires that accompany development, and avoids the need for costly infrastructure extension. Most importantly, sites in the hillside areas would serve the luxury housing market only. Since the City has identified an excess number of sites to meet its RHNA allocations without development of the hillsides, the City has concluded that the UGB is not a barrier to housing development. Development fees have increased in Milpitas since the prior housing element, but this trend has not constrained development. In markets with high demand, these fees can be added to the cost of a new unit and not constrain development. Under weaker market conditions, there is an imbalance between development costs and likely revenues. However, this imbalance is not caused by the imposition of fees alone, but by sales prices that are too low to support new development costs. Finally, the City will provide developer impact fee assistance for affordable
99
housing units in mixed income developments built in the redevelopment project area by transferring housing setaside funds to the General Fund to cover these fees. Finally, a recent EIR prepared for the Transit Area Specific Plan identified several problems on local freeways and key intersections, some of which could operate at unacceptable levels of service, once the Transit Specific Plan Area is built out. The City has adopted a Transit Area Impact Fee that will be used to improve levels of service at some of the intersections. However, freeway congestion is a regional issue, and therefore requires a regional solution. In the long run, it is hoped that more development located near transit will reduce some of the auto trips associated with new development in the Transit Area.
D. Housing for Persons with Disabilities The City is in full compliance with the Federal Americans with Disabilities Act (ADA) and has been undertaking ADA retrofits of public buildings and facilities for many years. Milpitas also enforces Title 24 of the California Building Code, which is even more rigorous than the ADA in its accessibility requirements. The City provides applicants with a check list to assist them in developing Title 24/ADA compliant plans before they are submitted. Building Department staff is well versed in accessibility requirements. Also, the City requires ADA-compliant parking, accessible entries, accessible paths of travel through areas being altered, and handicap-accessible restrooms, drinking fountains and public phones. There are no zoning constraints to housing for the disabled in Milpitas. The City allows small group homes in all residential zones, and allows large group residential facilities in the R3 and R4 zones. There are no zoning, design review, or building code provisions that conflict with the goal of providing a barrier-free environment. Recently constructed and approved housing projects in Milpitas include units that can be accessed through elevators. In the case of DeVries Place, there are 99 accessible units that are located in a new building that includes an elevator. Furthermore, all new developments that exceed three stories include elevators. For example, recently constructed or approved developments, such as the Alexan Condos, Aspen Family, Centria East, Matteson Condos, and Paragon are all three or more stories. Existing affordable and mixed-income housing developments that provide accessible units to the disabled include Parc West (68 units) Monte Vista (76 units), Terrace Gardens (15 units), and the Crossings (11 units).
100
The City also provides outreach and assistance to seniors with mobility limitations by retrofitting their homes with wheelchair ramps, grab bars, and other features. The city provides CDBG funding to Rebuilding Together, a non-profit organization that provides safety repairs, accessibility, and mobility home improvements for six senior and very low-and low-income homeowners annually. In addition, the City participates in Project Sentinel’s retrofitting program.
E. Potential Non-Governmental Constraints Cost factors, such as financing, land, and construction costs are the principal non-governmental constraints to the development of affordable housing. These costs have been steadily increasing in Milpitas and throughout Santa Clara County. A new trend since the 2002 Housing Element has been a drop in housing prices (after 2006) while production costs have increased. This lowers profits to the point that new development is not feasible. In fact, many of residential projects in Milpitas that have received entitlements are not yet applying for building permits, since they are waiting for prices to rise to the point where development will be feasible. Because of these market conditions, it was necessary to estimate current development costs (and not try to obtain costs directly from developers). To simplify this estimation, a single family house is used as a prototype.
1) Land Costs Land costs are a major factor in the cost to build housing in Milpitas. According to an appraisal company that provides updated information on land values for the City’s Park Impact Fee, the 2007 average cost for land was $55/SF. This land value is a very approximate. For this price, the land would be unimproved. The main way that a jurisdiction can decrease the land cost component is by increasing the number of units that can be built on a given piece of land. The increased densities allowed in the Transit Oriented Development Overlay District provide a very good example of how the City has supports higher densities to decrease housing costs. For example, in the R5 and MXD3 zones allowable densities reach 75 dwelling units per acre.
2) Construction Costs Information on construction costs entered in Table V.7 is from the International Code Council and was provided by the City of Milpitas Building and Safety Department. The valuation data is effective as of September 2008. For the purposes of estimating the cost of a single family unit it
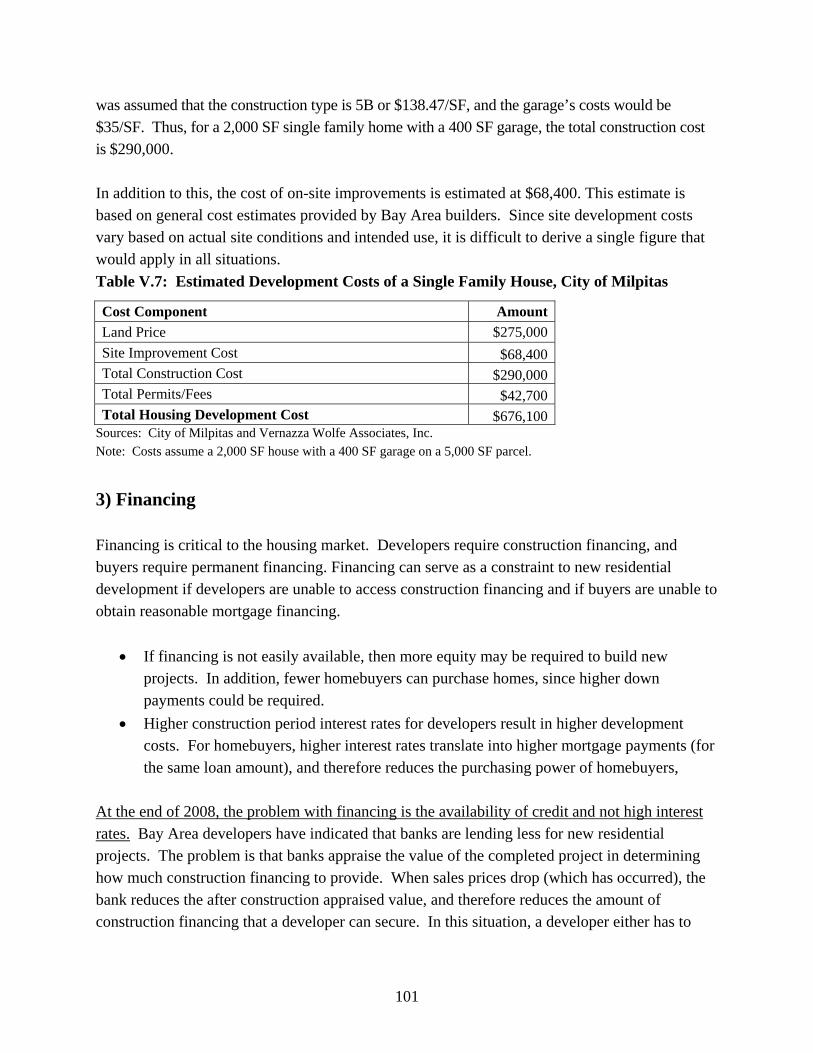
101
was assumed that the construction type is 5B or $138.47/SF, and the garage’s costs would be $35/SF. Thus, for a 2,000 SF single family home with a 400 SF garage, the total construction cost is $290,000. In addition to this, the cost of on-site improvements is estimated at $68,400. This estimate is based on general cost estimates provided by Bay Area builders. Since site development costs vary based on actual site conditions and intended use, it is difficult to derive a single figure that would apply in all situations. Table V.7: Estimated Development Costs of a Single Family House, City of Milpitas
Cost Component AmountLand Price $275,000Site Improvement Cost $68,400 Total Construction Cost $290,000Total Permits/Fees $42,700Total Housing Development Cost $676,100
Sources: City of Milpitas and Vernazza Wolfe Associates, Inc. Note: Costs assume a 2,000 SF house with a 400 SF garage on a 5,000 SF parcel.
3) Financing Financing is critical to the housing market. Developers require construction financing, and buyers require permanent financing. Financing can serve as a constraint to new residential development if developers are unable to access construction financing and if buyers are unable to obtain reasonable mortgage financing.
• If financing is not easily available, then more equity may be required to build new projects. In addition, fewer homebuyers can purchase homes, since higher down payments could be required.
• Higher construction period interest rates for developers result in higher development costs. For homebuyers, higher interest rates translate into higher mortgage payments (for the same loan amount), and therefore reduces the purchasing power of homebuyers,
At the end of 2008, the problem with financing is the availability of credit and not high interest rates. Bay Area developers have indicated that banks are lending less for new residential projects. The problem is that banks appraise the value of the completed project in determining how much construction financing to provide. When sales prices drop (which has occurred), the bank reduces the after construction appraised value, and therefore reduces the amount of construction financing that a developer can secure. In this situation, a developer either has to
102
raise more equity to invest in a project, or postpone development. At this time, developers are delaying projects. For homebuyers, it is necessary to pay a higher down payment than in the immediate past. Furthermore, borrowers must demonstrate credit worthiness and adequate incomes, so that loan applications meet standard underwriting criteria. While strict adherence to underwriting criteria was not required during the last eight years, the return to stricter standards is consistent with loan standards prior to 2001.
4) Housing Production Costs As shown in Table V.7, total development costs for a 2,000 SF single family home on a 5,000 SF lot is $676,100, including land, site improvements, construction costs, and development fees. This figure does not include developer profit, payments to equity partners, or marketing costs. According to the figures shown in Table III.13, none of Milpitas' lower- or moderate-income households could afford to purchase a new home in Milpitas. Although many newly constructed homes, particularly condominiums are smaller than 2,000 SF, these would still not be affordable to low- and moderate-income households. In fact, in order to afford the new home described in Table V.7, a household would need an income of at least $161,000 as well as savings of approximately $135,000 for a downpayment. Based on current household incomes, this income level would place the household at 153% AMI.
The two cost components that have increased the most since the 2002 Housing Element are permits/fees, and land costs. The current fees charged by the City are not excessive and are vital to supporting city departments that review, approve, and monitor new building activity. In addition, impact fees are required to pay for the expansion of public facilities, particularly parks that are required to serve new residents. Finally, although the land cost per SF is now $55 (in comparison to $45/SF in the last housing element) is relatively high for the single family house example in Table V.7, it should be remembered that land costs per unit would be much lower for multifamily housing.
5) Affordable Housing Constraints In addition to the constraints to market rate housing development discussed above, affordable housing projects face additional constraints. These are listed below.
103
Financing Constraints Multiple funding sources are needed to construct an affordable housing project, since substantial subsidies are required to make the units affordable to very low-, low- and moderate-income households. It is not unusual to see six or more financing sources required to make a project financially feasible. Each of these sources may have different requirements and application deadlines, and some sources may require that the project has already successfully secured financing commitments. Since financing is so critical and is also generally competitive, organizations and agencies that provide funding often can effectively dictate the type and sizes of projects. Thus, in some years senior housing may be favored by financing programs, while in other years family housing may be preferred. Target income levels can also vary from year to year. This situation has worsened in 2008 for two reasons. Similar to market rate development, lenders have reduced appraised values for completed affordable projects. This reduces the amount of funds provided to a project by conventional lenders. Secondly, tax credits are no longer selling on a one for one basis. In other words, once a project has received authorization to sell a specified amount of tax credits to equity investors, the investors are no longer purchasing the credits at face value, but are purchasing them at a discount. (Tax credits are not worth as much to investors if their incomes have dropped.) The City helps to lessen the financing constraint for affordable housing development by providing loans (either to the developer or to first-time homebuyers), developer impact fee assistance, and sometimes grants for affordable housing. The City’s Redevelopment Agency (20% Low-Income Housing Set-Aside Funds) provides the majority of the funds that are used to assist affordable housing units in two ways. First, the City also provides assistance to non-profit developers, such as Mid-Peninsula Housing Coalition, to build projects that are completely affordable. The City also helps market rate developers that are encouraged to provide affordable units under Section XI-10-6.03 (Affordable Housing) in the Zoning Code.46 Section XI-10-6.03 of the Zoning Code requires that affordable housing units be provided in all new housing projects. The City of Milpitas negotiates the number of affordable units on a project by project basis. The City’s goal is that 20 percent of all new units built be affordable.
46 XI-10-6.03 Affordable Housing: Affordable housing units should be provided in all new housing projects. While twenty percent (20%) is the minimum goal, affordable unit requirements will be determined on a project by project basis, taking into consideration the size and location of the project, the type of housing unit, proximity to transit and the mix of affordable units in the vicinity. (Ord. 38.777 (8) (part), 6/17/08)
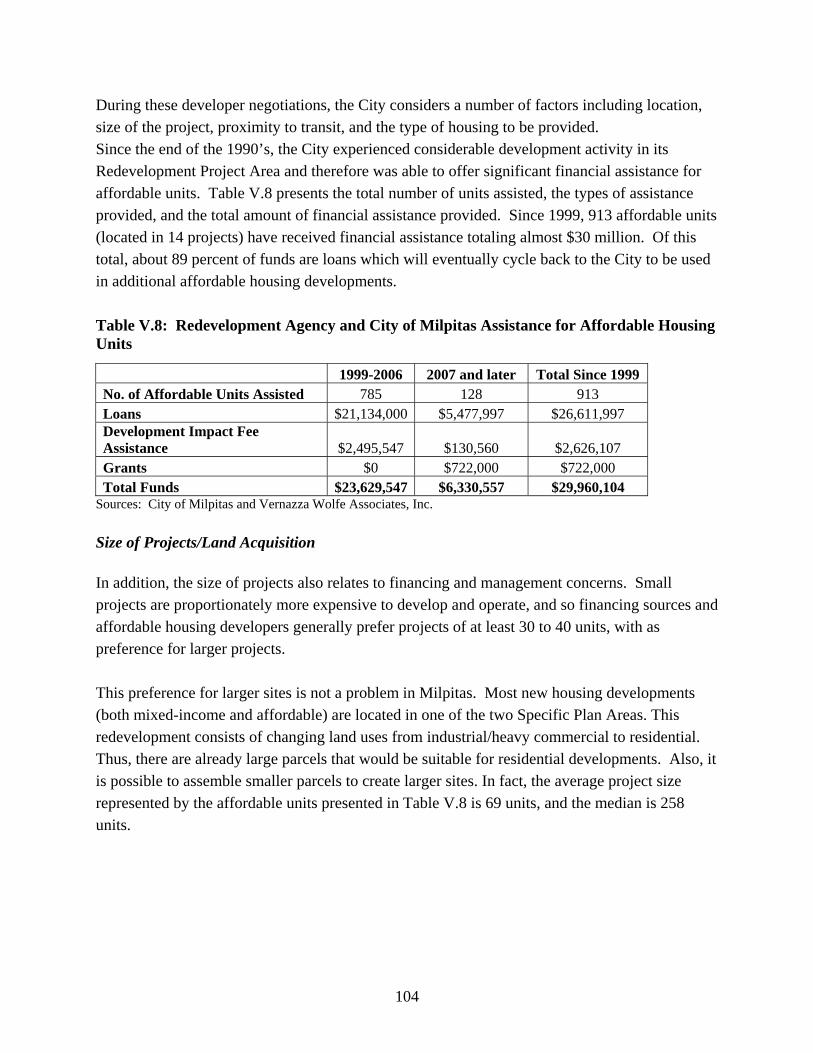
104
During these developer negotiations, the City considers a number of factors including location, size of the project, proximity to transit, and the type of housing to be provided. Since the end of the 1990’s, the City experienced considerable development activity in its Redevelopment Project Area and therefore was able to offer significant financial assistance for affordable units. Table V.8 presents the total number of units assisted, the types of assistance provided, and the total amount of financial assistance provided. Since 1999, 913 affordable units (located in 14 projects) have received financial assistance totaling almost $30 million. Of this total, about 89 percent of funds are loans which will eventually cycle back to the City to be used in additional affordable housing developments. Table V.8: Redevelopment Agency and City of Milpitas Assistance for Affordable Housing Units
1999-2006 2007 and later Total Since 1999 No. of Affordable Units Assisted 785 128 913 Loans $21,134,000 $5,477,997 $26,611,997 Development Impact Fee Assistance $2,495,547 $130,560 $2,626,107 Grants $0 $722,000 $722,000 Total Funds $23,629,547 $6,330,557 $29,960,104
Sources: City of Milpitas and Vernazza Wolfe Associates, Inc. Size of Projects/Land Acquisition In addition, the size of projects also relates to financing and management concerns. Small projects are proportionately more expensive to develop and operate, and so financing sources and affordable housing developers generally prefer projects of at least 30 to 40 units, with as preference for larger projects. This preference for larger sites is not a problem in Milpitas. Most new housing developments (both mixed-income and affordable) are located in one of the two Specific Plan Areas. This redevelopment consists of changing land uses from industrial/heavy commercial to residential. Thus, there are already large parcels that would be suitable for residential developments. Also, it is possible to assemble smaller parcels to create larger sites. In fact, the average project size represented by the affordable units presented in Table V.8 is 69 units, and the median is 258 units.
105
G) Policies to Overcome Constraints The rising costs of land, construction, and financing described above are outside the ability of the City of Milpitas to change. However, there are two ways in which the City has attempted to mitigate these constraints.
• First, land costs are estimated to average $55/SF. The 2002 Housing Element stated that land costs were $45/SF, based on costs in downtown San Jose. While the market determines land prices, the City can reduce the land cost per unit by allowing higher densities. The City has accomplished this for sites in the Midtown and Transit Specific Plan Areas.
• Secondly, since affordable housing developments face the same increasing development
costs as do market rate units, the City has provided substantial financial assistance to new developments to help reduce these high costs. Since 1999, the City has provided (or pledged) almost $40 million in assistance that has benefited (or will benefit) almost 2,000 units.
106
VI. HOUSING PLAN Based on the needs, resources, and constraints identified above, this chapter presents the housing plan for the City of Milpitas for the 2009-2014 planning period. The City has established this plan in consideration of its own local needs and priorities, as well as its obligations under State Housing Element law. The Housing Plan is structured as a series of goals and related policies. Related to each policy, there are one or more programs that the City will implement over the 2009-2014 planning period. These programs are summarized in a Five-Year Implementation Plan which presents the programs together with implementing agencies, funding sources and time-frames for implementation. Finally, the Housing Plan sets forth quantified objectives for housing construction, rehabilitation and conservation for the Housing Element planning period.
A. Identification of Adequate Sites Goal Goal G-1: Provide Adequate Sites for Housing Development in the City of Milpitas. The City of Milpitas will maintain adequate sites to accommodate its share of the regional housing need, including sites that would be appropriate for the development of housing affordable to very low-, low-, moderate- and above moderate-income households. Implementing Policies and Programs Policy A-1: The City will facilitate land acquisition and site assembly.
The City will continue to work with local property owners to assemble small sites for future developments.
Policy A-2: While the City is able to accommodate its share of the regional housing need without rezoning during the current Housing Element period, it has demonstrated a willingness to consider land use redesignation in order to accommodate specific projects.
The City will consider land use redesignations if they are needed.
107
B. Housing & Neighborhood Conservation Goals Goal B-1: Maintain High Quality Residential Environments The maintenance and improvement of the quality of life of existing neighborhoods is a high priority for the City of Milpitas. Goal B-2: Preserve Housing Resources Milpitas will strive to maintain and preserve existing housing resources, including both affordable and market rate units. Implementing Policies and Programs Policy B-1: The City will continue to enforce housing codes and regulations to correct code violations in the most expeditious manner to protect the integrity of housing while minimizing the displacement of residents. The City will work to have all dwelling units that cannot be rehabilitated demolished, so that hazards will be eliminated, and land will become available for new housing.
The City will continue to enforce its existing codes through its Code Enforcement Program, utilizing all available authorities to compel property owners to correct code violations. This program has been strengthened through the passage of the Neighborhood Beautification Ordinance (NBO), which establishes guidelines for the overall maintenance and preservation of neighborhoods citywide. Through its Replacement/Relocation Program, the City will assist any household displaced through code enforcement activities to relocate to other suitable and affordable housing.
Policy B-2: The City will continue to provide assistance for the rehabilitation of housing units occupied by very low-income and low-income households during the next five-year Housing Element Planning Period.
Through the Housing Rehabilitation Program, the City will provide funds to assist very low- and low-income owner households to undertake repairs to their homes to bring them up to standard condition and prolong the useful life of the local housing stock. The City will give priority for participation in this program to very low-, and low-income
108
homeowners who are subject to code enforcement actions that could otherwise lead to displacement of residents. Assuming adequate CDBG funding, the City will continue assisting between six and eight low-income homeowners annually. The City adopted a Lift Zone Program in the City in 2009. The purpose of this program is to bring together residents and property owners to strengthen neighborhoods through neighborhood clean-up, blight removal, and housing rehabilitation. The City will continue to provide CDBG funds to Rebuilding Together to preserve affordable housing. This program provides safety, accessibility, and mobility repairs to mobile and single family homes owned by very low- and low-income households.
Policy B-3: The City will monitor the need to replace infrastructure as needed to conserve older neighborhoods.
When updating its Capital Improvement Program and associated budget, the City of Milpitas will allocate resources to rehabilitate and/or replace infrastructure in older neighborhoods whose infrastructure is approaching obsolescence.
Policy B-4: Milpitas will collaborate with other public and private entities to ensure that no lower-income residents are adversely impacted by the conversion of existing affordable housing projects to market rate rents.
The City will continue to monitor the status of the 149 units at risk of conversion to market rates at Sunnyhills Apartments. The City will work with the Santa Clara County Housing Authority, U.S. Department of Housing and Urban Development, and the property owner to insure the continuation of subsidies to the 149 low-income renters. If notice is received that the owner will convert the property to market rate use, the City will immediately contact qualified and interested non-profit organizations to begin developing plans to replace the affordable units.
Policy B-5: The City will maintain the existing stock of affordable housing provided through the private market and provide tenant protections for apartment units at risk of condominium conversion.
The City will continue to administer a condominium conversion ordinance that was enacted with the intention of minimizing the negative impacts of conversions on the rental market.
109
The City will continue to administer a mobile home rent control ordinance that regulates rental rates and landlord tenant relations for the three mobile home parks in Milpitas.
C. New Housing Production Goal Goal C-1: Facilitate New Housing Production The City of Milpitas will take necessary steps to promote new housing development and remove public infrastructure constraints to new housing development. Implementing Policies and Programs Policy C-1: The City will continue to use its planning tools to facilitate housing production.
The Transit Area Specific Plan EIR can be used to expedite environmental review for subsequent projects that are consistent with the Transit Area Specific Plan. The City will continue to implement the planning and design guidelines specified in the Midtown and Transit Area Specific Plans, including the minimum density requirements in the TOD Overlay Districts and in all MXD zones (ranging from 21 to 41 units per acre, depending on zoning designation).
Policy C-2: The City will continue to address public infrastructure constraints to housing production where feasible.
The City will continue to coordinate sanitary and storm sewer improvements with the Cities of San Jose and Santa Clara and other relevant agencies if needed to acquire sufficient wastewater capacity to serve residential development. Measures to be explored include the reduction of wastewater flows (through water conservation programs) and the purchase of surplus capacity from other agencies using the regional water pollution control plant. The City will continue to work with the Santa Clara Valley Water District to reduce the extent of the flood plain on the housing sites identified in the Midtown Specific Plan. On an ongoing basis, the City will explore alternatives to the on-site retention of stormwater on each housing site, including the development of an area wide retention
110
pond or allowances for porous pavement and other pervious surfaces which can absorb runoff.
The City will continue to pursue state and federal grants and other financial measures to reduce the cost of off-site traffic improvements for housing developers in the City. This could also include the use of redevelopment funds to offset costs for projects that include a significant number of affordable housing units. The City will continue to monitor additional infrastructure improvements needed for access to the Union Pacific Site.
D. Housing Diversity and Affordability Goals Goal D-1: Promote Housing Affordability for both Renters and Homeowners The City of Milpitas will use available resources to expand the number of new housing units affordable to extremely low-, very-low, low- and moderate-income households. Goal D-2: Support Housing to Meet Special Needs The City of Milpitas strives to increase the range of housing opportunities for all residents, including those with special needs and those unable to afford market rate housing within the community. The City of Milpitas will place a priority on construction of housing that is appropriate to meet the needs of special needs populations. Goal D-3: Support Housing Diversity and Creativity in Residential Development In recognition of the diverse needs of Milpitas’ households, the City supports creativity in the design and development of housing projects. Implementing Policies and Programs Policy D-1: The City will facilitate the development of at least 441 new housing units affordable to moderate-income households, 421 units affordable to low-income households and 689 new housing units affordable to very low-income households.
The City will continue to operate its Below-Market Rate Financing Program for new construction. Funds for this program are provided through Redevelopment Housing Set-Asides, CDBG, and other available resources, such as in-lieu payments, that can be used to finance affordable housing.
111
Policy D-2: The City of Milpitas will continue to target the provision of at least 20 percent affordable units within new multifamily residential projects.
The City will continue to promote affordable units in residential projects. In conformance with Section XI-10-6.03 of the City’s Zoning Ordinance, affordable housing requirements are negotiated on a project-by-project basis, aiming for a minimum percentage (20 percent) of affordable units in all housing developments.
Policy D-3: The City will provide density bonuses and other incentives for projects which provide affordable units.
The City will continue to provide density bonuses under its amended Ordinance.
On a project-by-project basis, the City will continue to assist developers pay for development fees for housing developments that provide low-income units.
Policy D-4: The City will promote the ability of lower- and moderate-income households to become homeowners.
The City will continue to provide assistance to first-time homebuyers to purchase below market rate units.
Policy D-5: Milpitas will support housing services for the homeless.
The City will continue to facilitate the development of emergency and transitional housing through financial and/or other incentives.
The City will continue to support emergency services and housing resources consistent with the City’s ongoing commitment to and participation in the Santa Clara County Continuum of Care Plan.
Policy D-6: The City will continue efforts to improve housing opportunities for disabled households in Milpitas.
• Provide funds (through CDBG and other programs) to local non-profits, such as Rebuilding Together, assisting residents with home retrofits.
• Include units appropriate for disabled households within new housing developments. • Enforce Title 24 of the California Building Code, and the Americans with Disabilities
Act (ADA) when reviewing proposed development plans.
112
• Assist disabled residents with information on housing resources and suitable housing opportunities in the community.
Policy D-7: The City will continue to encourage developers to provide new units that meet the needs of both very small and large households.
In reviewing proposed projects, City staff shall attempt to obtain the inclusion of studio and four-bedroom units in new projects as feasible through incentives, including financial and regulatory.
Policy D-8: In public outreach efforts, the City will convey to the community that affordable housing can be attractive, enhance the quality of life, and provide an essential resource for long-time Milpitas residents and workers.
The City will consider establishing a public education campaign that provides examples of affordable, award-winning projects that are compatible with Milpitas neighborhoods.
Policy D-9: The City will support housing alternatives, such as live/work lofts and manufactured housing.
Live work lofts are a conditional use in R4 zones and permitted use in R5 zones. Consistent with the Midtown Specific Plan, the City will favorably consider applications for live work lofts as one housing type to address the changing needs of Milpitas residents. The City will modify the Zoning Ordinance to permit manufactured housing in R1 zones, subject to the meeting of architectural requirements as well as the same development standards to which conventional single-family residential dwellings on the same lot would be subject.
Policy D-10: The City will support the inclusion of space for child care facilities in new residential developments.
The provision of space for child care facilities at major new residential developments permits the integration of this needed service in residential areas as they are developed. The City will explore the feasibility of encouraging new residential developers to provide space for future child care facilities.
113
E. Fair Housing Goal Goal E-1: Eliminate Housing Discrimination Milpitas values diversity of its population and protection of housing rights for its citizens. The City strives to ensure that all households have equal access to the City’s housing resources. Implementing Policies and Programs Policy E-1: The City will work to eliminate all unlawful discrimination in housing with respect to age, race, gender, sexual orientation, marital or familial status, ethnic background, medical condition, or other arbitrary factors, so that all residents can obtain decent housing throughout the City.
The City will work with appropriate Local, State and Federal Agencies to ensure that fair housing laws are enforced.
The City will continue to implement its ordinances and policies prohibiting discrimination in housing practices.
The City will carry out necessary actions to address any impediments to fair housing choice identified in the City’s HUD-mandated Analysis of Impediments to Fair Housing.
The City will continue to distribute information on fair housing laws through flyers brochures, public service announcements and other means.
The City will continue to fund an appropriate agency, such as Project Sentinel, to advocate for Milpitas households that may have experienced unfair or illegal housing practices.
F. Energy Conservation Opportunities Goal Goal F-1: Promote Energy Conservation in Residential Development
114
The City of Milpitas will promote energy efficiency in residential development within the City, including reduction of energy use through better design and construction in individual homes, and also through energy efficient urban design. Implementing Policies and Programs Policy F-1: The City will continue to undertake a variety of activities to achieve energy efficiency in residential development in conformance with State laws.
The City will continue to partner with local utility providers to promote participation of Milpitas’ low-income residents in available energy efficiency programs, such as PG&E's Energy Partners Program. The City will continue to promote use of passive solar devices and promote energy audits of existing homes. The City will adopt a Green Building Ordinance by the end of 2009.
The City will continue to encourage the incorporation of energy-saving principles in the design and planning of new residential developments, including features such as solar orientation. The City will continue to encourage mixed-use and transit-oriented development at transit nodes.
In accordance with the Green Building Policy Resolution adopted in February 2008, the City will continue to require that planning applications for new buildings include a completed LEED or GreenPoint Rated checklist.
G. Remove Government Constraints Goals Goal G-1: Continue to Promote Land Use Policies and Development Standards to Facilitate Housing Production. During the last Housing Element Period, Milpitas made extensive changes to its Zoning Ordinance in order to provide high density, transit oriented development in its specific plan areas. Housing developed in these areas will continue to provide opportunities for affordable
115
and workforce housing, will reduce the jobs housing imbalance in Milpitas, and promote the use of alternative means of transportation, such as transit. Goal G-2: Remove Government Constraints to the Production of Special Needs Housing Milpitas supports the development of special needs housing. The City will take necessary steps to remove government constraints to the development of affordable housing serving special needs populations. Implementing Policies and Programs Policy G-1: The City will continue to enforce land use policies and development standards that facilitate affordable housing production.
The City continues to enforce its development standards including minimum housing densities, mixed use zoning, and intensive land utilization in its TOD areas. These standards support both regional housing goals and financial feasibility goals required by developers.
Policy G-2: The City will modify its Zoning Ordinance to ensure that there are opportunities for special needs housing.
The City will modify the Zoning Ordinance to identify zones for homeless shelters as a “by right” land use. The City will modify the Zoning Ordinance to identify zones for transitional housing as a “by right” land use.
The City will modify the Zoning Ordinance to identify zones for permanent supportive housing as a “by right” land use. The City will modify the Zoning Ordinance to identify zones for farmworker housing as a use “by right.” The City will modify the Zoning Ordinance to identify zones for SRO Developments as a “by right” land use.
116
VII. FIVE-YEAR IMPLEMENTATION PLAN The Five-Year Implementation Plan presented below summarizes the City’s Housing Plan. For each program, information is provided on the responsible department(s), funding source(s), and the time frame. The majority of programs are ongoing. The key funding sources include department budgets, Redevelopment Agency Housing Funds, and the CDBG Program.
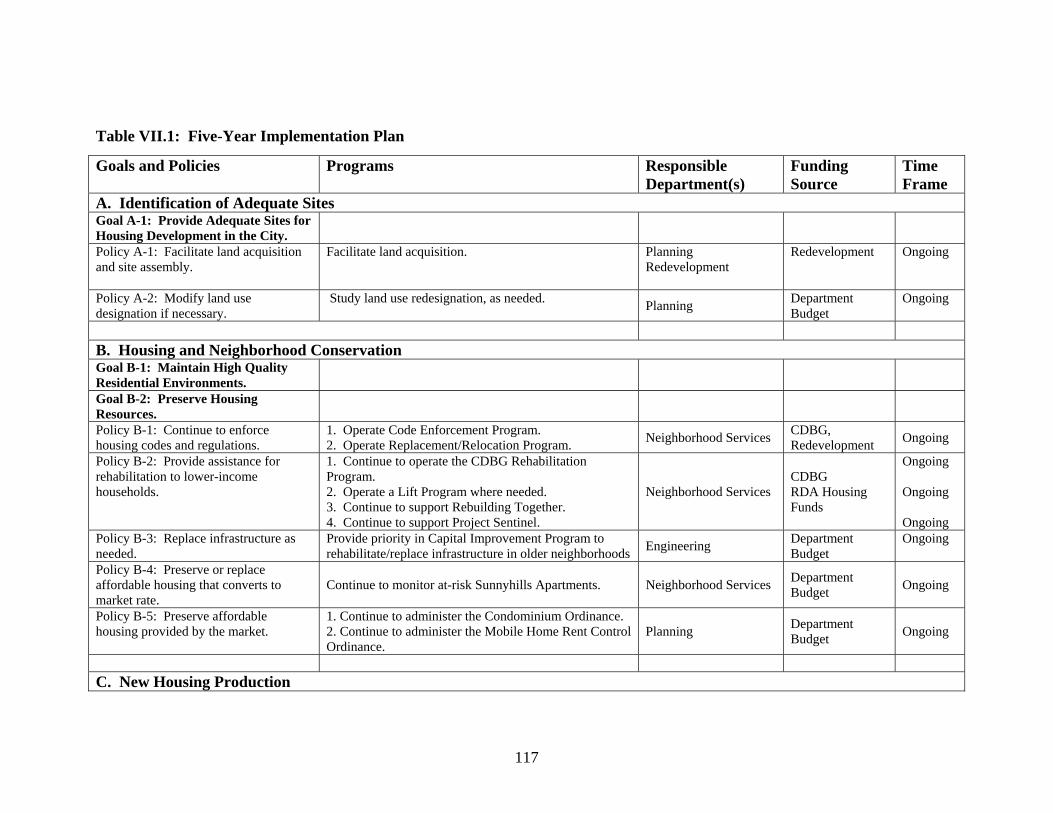
117
Table VII.1: Five-Year Implementation Plan
Goals and Policies Programs Responsible Department(s)
Funding Source
Time Frame
A. Identification of Adequate Sites Goal A-1: Provide Adequate Sites for Housing Development in the City.
Policy A-1: Facilitate land acquisition and site assembly.
Facilitate land acquisition.
Planning Redevelopment
Redevelopment
Ongoing
Policy A-2: Modify land use designation if necessary.
Study land use redesignation, as needed. Planning Department Budget
Ongoing
B. Housing and Neighborhood Conservation Goal B-1: Maintain High Quality Residential Environments.
Goal B-2: Preserve Housing Resources.
Policy B-1: Continue to enforce housing codes and regulations.
1. Operate Code Enforcement Program. 2. Operate Replacement/Relocation Program. Neighborhood Services CDBG,
Redevelopment Ongoing
Policy B-2: Provide assistance for rehabilitation to lower-income households.
1. Continue to operate the CDBG Rehabilitation Program. 2. Operate a Lift Program where needed. 3. Continue to support Rebuilding Together. 4. Continue to support Project Sentinel.
Neighborhood Services CDBG RDA Housing Funds
Ongoing Ongoing Ongoing
Policy B-3: Replace infrastructure as needed.
Provide priority in Capital Improvement Program to rehabilitate/replace infrastructure in older neighborhoods Engineering Department
Budget Ongoing
Policy B-4: Preserve or replace affordable housing that converts to market rate.
Continue to monitor at-risk Sunnyhills Apartments. Neighborhood Services Department Budget Ongoing
Policy B-5: Preserve affordable housing provided by the market.
1. Continue to administer the Condominium Ordinance. 2. Continue to administer the Mobile Home Rent Control Ordinance.
Planning Department Budget Ongoing
C. New Housing Production
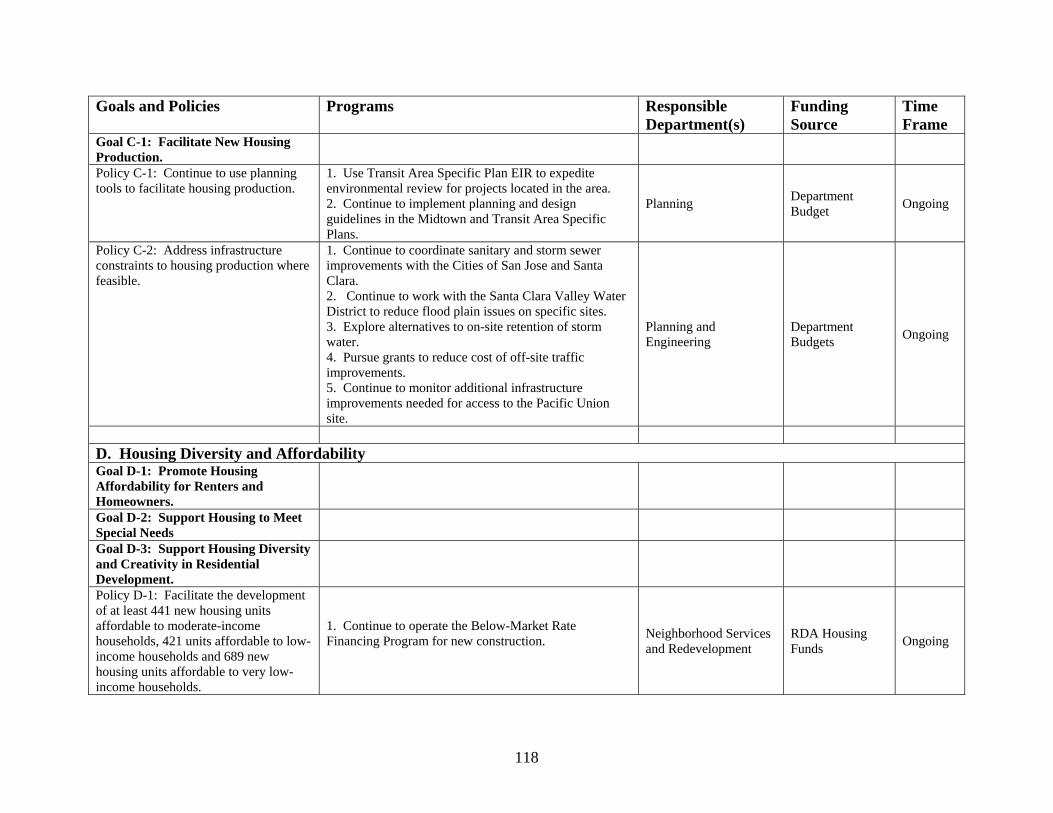
118
Goals and Policies Programs Responsible Department(s)
Funding Source
Time Frame
Goal C-1: Facilitate New Housing Production.
Policy C-1: Continue to use planning tools to facilitate housing production.
1. Use Transit Area Specific Plan EIR to expedite environmental review for projects located in the area. 2. Continue to implement planning and design guidelines in the Midtown and Transit Area Specific Plans.
Planning Department Budget Ongoing
Policy C-2: Address infrastructure constraints to housing production where feasible.
1. Continue to coordinate sanitary and storm sewer improvements with the Cities of San Jose and Santa Clara. 2. Continue to work with the Santa Clara Valley Water District to reduce flood plain issues on specific sites. 3. Explore alternatives to on-site retention of storm water. 4. Pursue grants to reduce cost of off-site traffic improvements. 5. Continue to monitor additional infrastructure improvements needed for access to the Pacific Union site.
Planning and Engineering
Department Budgets Ongoing
D. Housing Diversity and Affordability Goal D-1: Promote Housing Affordability for Renters and Homeowners.
Goal D-2: Support Housing to Meet Special Needs
Goal D-3: Support Housing Diversity and Creativity in Residential Development.
Policy D-1: Facilitate the development of at least 441 new housing units affordable to moderate-income households, 421 units affordable to low-income households and 689 new housing units affordable to very low-income households.
1. Continue to operate the Below-Market Rate Financing Program for new construction.
Neighborhood Services and Redevelopment
RDA Housing Funds Ongoing
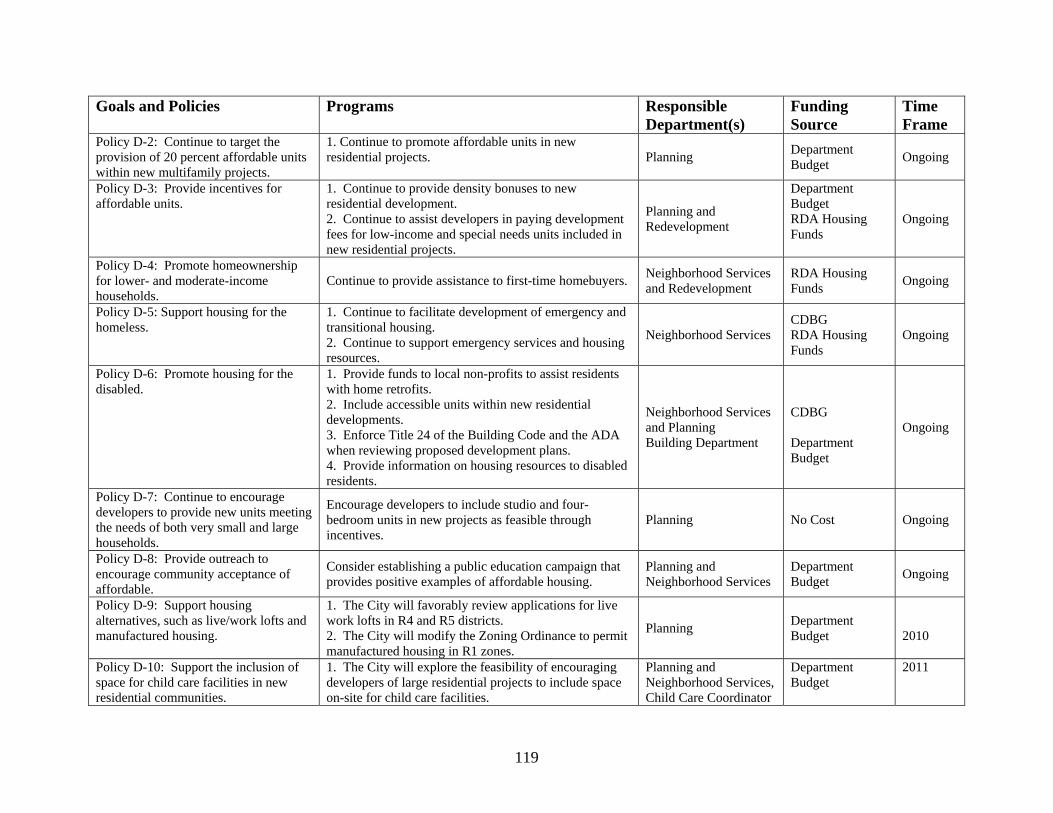
119
Goals and Policies Programs Responsible Department(s)
Funding Source
Time Frame
Policy D-2: Continue to target the provision of 20 percent affordable units within new multifamily projects.
1. Continue to promote affordable units in new residential projects. Planning Department
Budget Ongoing
Policy D-3: Provide incentives for affordable units.
1. Continue to provide density bonuses to new residential development. 2. Continue to assist developers in paying development fees for low-income and special needs units included in new residential projects.
Planning and Redevelopment
Department Budget RDA Housing Funds
Ongoing
Policy D-4: Promote homeownership for lower- and moderate-income households.
Continue to provide assistance to first-time homebuyers. Neighborhood Services and Redevelopment
RDA Housing Funds Ongoing
Policy D-5: Support housing for the homeless.
1. Continue to facilitate development of emergency and transitional housing. 2. Continue to support emergency services and housing resources.
Neighborhood Services CDBG RDA Housing Funds
Ongoing
Policy D-6: Promote housing for the disabled.
1. Provide funds to local non-profits to assist residents with home retrofits. 2. Include accessible units within new residential developments. 3. Enforce Title 24 of the Building Code and the ADA when reviewing proposed development plans. 4. Provide information on housing resources to disabled residents.
Neighborhood Services and Planning Building Department
CDBG Department Budget
Ongoing
Policy D-7: Continue to encourage developers to provide new units meeting the needs of both very small and large households.
Encourage developers to include studio and four-bedroom units in new projects as feasible through incentives.
Planning No Cost Ongoing
Policy D-8: Provide outreach to encourage community acceptance of affordable.
Consider establishing a public education campaign that provides positive examples of affordable housing.
Planning and Neighborhood Services
Department Budget Ongoing
Policy D-9: Support housing alternatives, such as live/work lofts and manufactured housing.
1. The City will favorably review applications for live work lofts in R4 and R5 districts. 2. The City will modify the Zoning Ordinance to permit manufactured housing in R1 zones.
Planning Department Budget
2010
Policy D-10: Support the inclusion of space for child care facilities in new residential communities.
1. The City will explore the feasibility of encouraging developers of large residential projects to include space on-site for child care facilities.
Planning and Neighborhood Services, Child Care Coordinator
Department Budget
2011
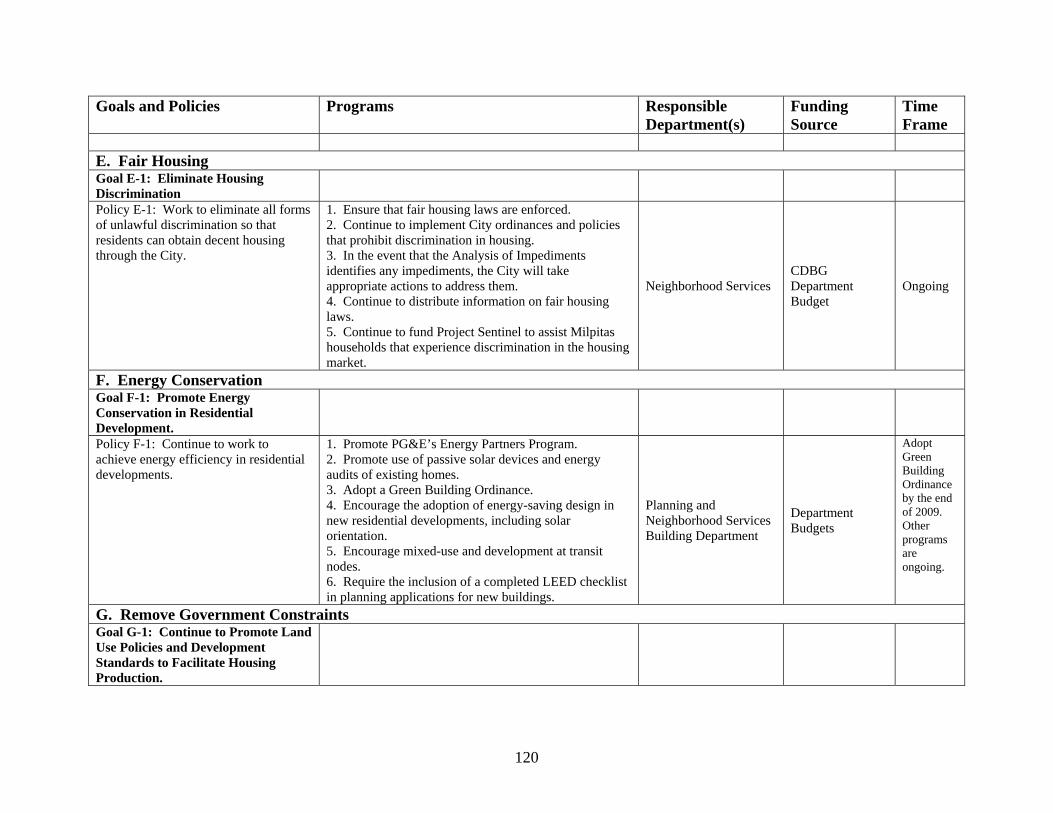
120
Goals and Policies Programs Responsible Department(s)
Funding Source
Time Frame
E. Fair Housing Goal E-1: Eliminate Housing Discrimination
Policy E-1: Work to eliminate all forms of unlawful discrimination so that residents can obtain decent housing through the City.
1. Ensure that fair housing laws are enforced. 2. Continue to implement City ordinances and policies that prohibit discrimination in housing. 3. In the event that the Analysis of Impediments identifies any impediments, the City will take appropriate actions to address them. 4. Continue to distribute information on fair housing laws. 5. Continue to fund Project Sentinel to assist Milpitas households that experience discrimination in the housing market.
Neighborhood Services CDBG Department Budget
Ongoing
F. Energy Conservation Goal F-1: Promote Energy Conservation in Residential Development.
Policy F-1: Continue to work to achieve energy efficiency in residential developments.
1. Promote PG&E’s Energy Partners Program. 2. Promote use of passive solar devices and energy audits of existing homes. 3. Adopt a Green Building Ordinance. 4. Encourage the adoption of energy-saving design in new residential developments, including solar orientation. 5. Encourage mixed-use and development at transit nodes. 6. Require the inclusion of a completed LEED checklist in planning applications for new buildings.
Planning and Neighborhood Services Building Department
Department Budgets
Adopt Green Building Ordinance by the end of 2009. Other programs are ongoing.
G. Remove Government Constraints Goal G-1: Continue to Promote Land Use Policies and Development Standards to Facilitate Housing Production.
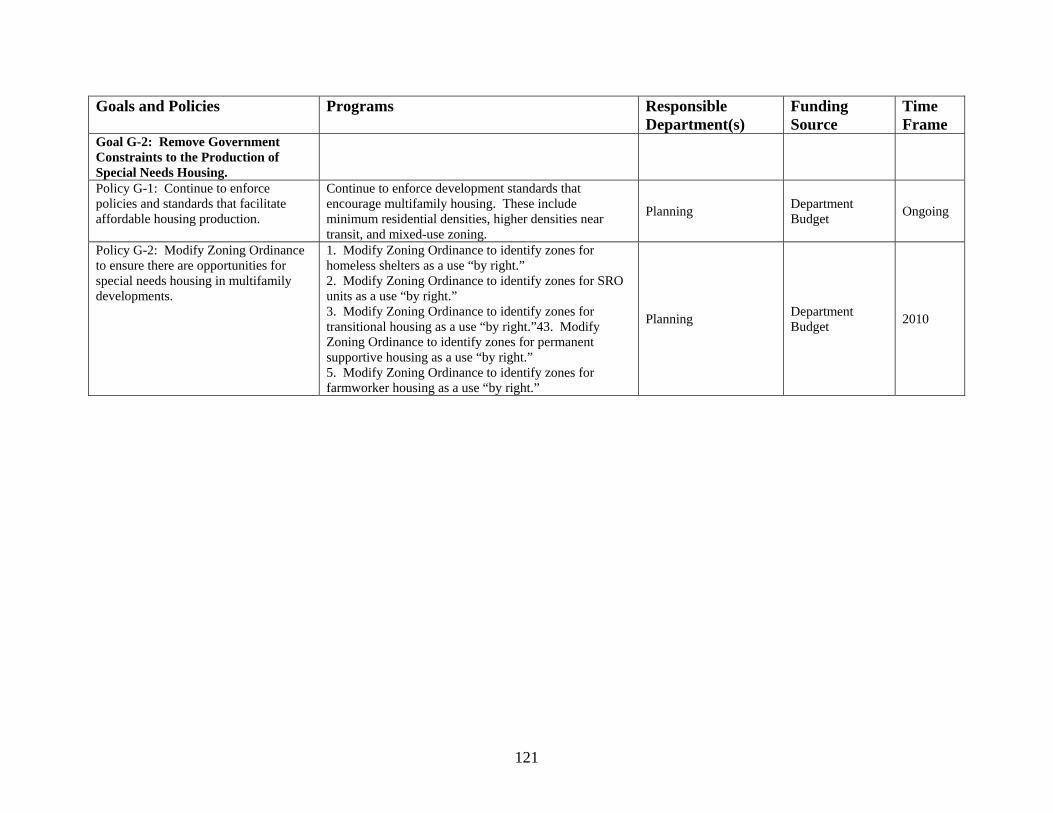
121
Goals and Policies Programs Responsible Department(s)
Funding Source
Time Frame
Goal G-2: Remove Government Constraints to the Production of Special Needs Housing.
Policy G-1: Continue to enforce policies and standards that facilitate affordable housing production.
Continue to enforce development standards that encourage multifamily housing. These include minimum residential densities, higher densities near transit, and mixed-use zoning.
Planning Department Budget Ongoing
Policy G-2: Modify Zoning Ordinance to ensure there are opportunities for special needs housing in multifamily developments.
1. Modify Zoning Ordinance to identify zones for homeless shelters as a use “by right.” 2. Modify Zoning Ordinance to identify zones for SRO units as a use “by right.” 3. Modify Zoning Ordinance to identify zones for transitional housing as a use “by right.”43. Modify Zoning Ordinance to identify zones for permanent supportive housing as a use “by right.” 5. Modify Zoning Ordinance to identify zones for farmworker housing as a use “by right.”
Planning Department Budget 2010
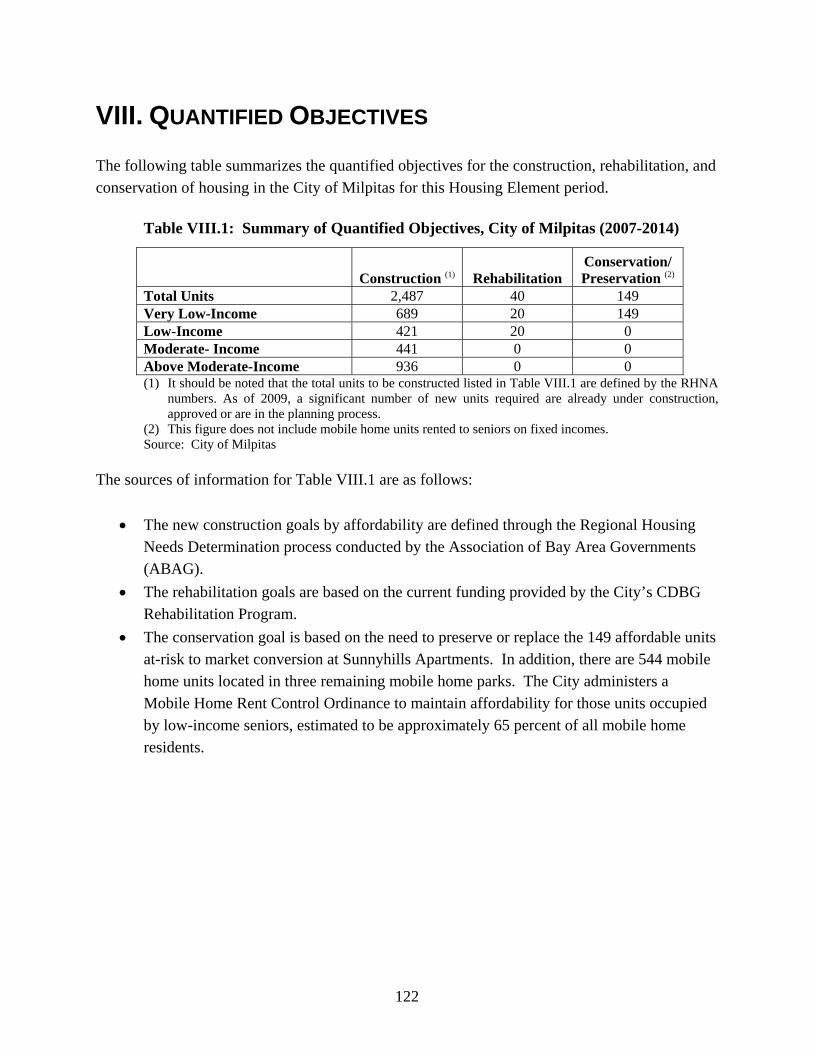
122
VIII. QUANTIFIED OBJECTIVES The following table summarizes the quantified objectives for the construction, rehabilitation, and conservation of housing in the City of Milpitas for this Housing Element period.
Table VIII.1: Summary of Quantified Objectives, City of Milpitas (2007-2014)
Construction (1) Rehabilitation Conservation/ Preservation (2)
Total Units 2,487 40 149 Very Low-Income 689 20 149 Low-Income 421 20 0 Moderate- Income 441 0 0 Above Moderate-Income 936 0 0 (1) It should be noted that the total units to be constructed listed in Table VIII.1 are defined by the RHNA
numbers. As of 2009, a significant number of new units required are already under construction, approved or are in the planning process.
(2) This figure does not include mobile home units rented to seniors on fixed incomes. Source: City of Milpitas
The sources of information for Table VIII.1 are as follows:
• The new construction goals by affordability are defined through the Regional Housing Needs Determination process conducted by the Association of Bay Area Governments (ABAG).
• The rehabilitation goals are based on the current funding provided by the City’s CDBG Rehabilitation Program.
• The conservation goal is based on the need to preserve or replace the 149 affordable units at-risk to market conversion at Sunnyhills Apartments. In addition, there are 544 mobile home units located in three remaining mobile home parks. The City administers a Mobile Home Rent Control Ordinance to maintain affordability for those units occupied by low-income seniors, estimated to be approximately 65 percent of all mobile home residents.
123
IX. OTHER REQUIREMENTS
A. Consistency with the General Plan and Other Planning Documents
1) General Plan A comprehensive update of the City’s General Plan was conducted in 1994. Several amendments have occurred since then. For example, changes were made to the General Plan to incorporate the Midtown and Transit Area Specific Plans, including revisions to the General Plan land use map and text for consistency among these planning documents. The 2009-2014 Housing Element is consistent with the General Plan. In the event that future changes to the Zoning Ordinance or other regulations governing the City of Milpitas result in any inconsistencies between the Housing Element policies and the General Plan, the City will determine the most appropriate means to achieve overall General Plan consistency.
2) City of Milpitas Consolidated Plan The City’s most recent Consolidated Plan covers the period 2007-2012. The 2009-2014 Milpitas Housing Element is consistent with the program and policy goals in this Consolidated Plan. In addition, information from the Consolidated Plan was utilized in the Housing Element update.
3) City of Milpitas Redevelopment Agency Implementation Plan The City last updated its Five-Year Implementation Plan in 2006. The 2009-2014 Milpitas Housing Element is consistent with the goals and expenditures outlined in this Plan.
B. Notification of Housing Element to Water and Sewer Providers Upon adoption and certification of this Housing Element, the City of Milpitas will provide a copy of the Housing Element to the San Francisco Public Utilities Commission, the Santa Clara Valley Water District, and the Milpitas Department of Engineering in the City of Milpitas, pursuant to Government Code Section 65589.7. The purpose of this notification is to ensure that these providers of water and sewer services place a priority for proposed housing developments for lower-income households in their current and future resource or service allocations.
124
C. Review of Conservation and Safety Elements Pursuant to AB 162 Assembly Bill 162 requires that the City of Milpitas review, and if necessary, to identify new information for its Conservation Element at the time the Housing Element is revised. The purpose of this review is to identify rivers, creeks, streams, flood corridors, riparian habitat, and land that may accommodate floodwater for purposes of groundwater recharge and stormwater management. In addition, the Safety Element will be reviewed to identify information regarding flood hazards that could affect development on the potential sites listed in the Housing Element.
125
CITY OF MILPITAS 2009-2014 HOUSING ELEMENT UPDATE BIBLIOGRAPHY Documents (including documents downloaded from websites) 2006-07 Survey of South Bay Area Cost of Development ABAG, Projections 2007, Dec. 2006. Applied Survey Research, 2007 Santa Clara County Homeless Census and Survey, 2007. California Department of Finance (DOF), E-5 Population and Housing Estimates, 2008. California Department of Housing and Community Development (HCD), State Income Limits for 2008. Claritas, Demographic Snapshot Report: Milpitas and Santa Clara County, 2008. Economic & Planning Systems, Milpitas Transit Area Infrastructure Financing Technical Report (2008) Intero Real Estate Services, Home Prices in Milpitas, by Year, www.sccrealestate.com, August 2008. City of Milpitas Analysis of Impediments to Fair Housing Choice (2004) prepared by Project Sentinel City of Milpitas Consolidated Plan (2007-2012) City of Milpitas General Plan Housing Element, Adopted by the Milpitas City Council, October 22, 2002. City of Milpitas Market Study (February 2008) City of Milpitas, Milpitas Midtown Specific Plan (2002) City of Milpitas, Milpitas Transit Area Specific Plan and Environmental Impact Report (2007) City of Milpitas, Urban Water Management Plan, Adopted December 2005. City of Milpitas Zoning Ordinance (from the City’s website, continuously updated) The City of San Jose and the County of Santa Clara, Community for a Lifetime: A Ten Year Strategic Plan to Advance the Well-Being of Older Adults in Santa Clara County, 2005.
126
Santa Clara County Housing Authority, 2008 Utility Allowances Schedule, Oct. 2007. San Jose/Santa Clara City & County Continuum of Care, 2007 Continuum of Care Application: Exhibit 1, 2007. State of California Community Care Licensing Division, Directory Report: Santa Clara County, April, 2008. United States Bureau of the Census. 2000 Summary File 3 (SF 3) - Sample Data. US Department of Housing and Urban Development (HUD), 2000 CHAS Data Book. U.S Department of Housing and Urban Development (HUD), (24 CFR Part 888), Oct. 2007. Vernazza Wolfe Associates, Inc., DeVries Place Senior Housing Market Study DeVries Place prepared for National Equity Fund (2006). www.apartments.com -- rental listings for August 1-15, 2008. www.apartmentratings.com/rate/CA-Milpitas-Pricing.html -- average rent trends for Milpitas -- accessed September 8, 2008. www.craigslist.com -- rental listings for August 1-15, 2008. Agencies and Individuals Contacted Barbara Lee Senior Center, August 22, 2008. City of Milpitas Engineering Division, December 2, 2008. City of Milpitas Fire Department, , December 2, 2008. City of Milpitas Planning and Neighborhood Services Department, Ongoing Communications. City of Milpitas, Building Inspections Department, November 24, 2008. Community Technology Alliance, Program Coordinator, September 3, 2008. DataQuick (2009) First Community Housing, Executive Director, September 11, 2008. Housing Choices Coalition, Acting Executive Director, September 5, 2008. InnVision, VP of Operations, August 29, 2008.
127
JMK Sunnyhills Investors II, email received on January 22, 2009. San Andreas Regional Center, Resources Specialist, September 3, 2008. Santa Clara County Assessor’s Office (2009) Santa Clara County Mental Health, Housing Development Consultant, August 26, 2008. Santa Clara Housing Authority, Housing Programs Analyst, August 29, 2008. Santa Clara Ombudsman Office, Director of Long-Term Support Services, September 9, 2008. Senior Housing Solutions, Executive Director, August 26, 2008. Silicon Valley Independent Living Center, Director of Community Services, September 12, 2008 and December 19, 2008.
A-1
APPENDIX A: HOUSING ELEMENT UPDATE PUBLIC MEETINGS
Two public meetings were convened prior to the writing of the Housing Element update. The first meeting was held in the afternoon of November 6, 2008, and the second meeting was held in the evening of November 13, 2008. These meetings had several goals:
• Explain the housing element update process. • Explain current housing needs and conditions. • Elicit suggestions regarding housing problems and possible solutions.
The City distributed summary tables of early findings. Also, participants were asked to complete questionnaires. Since many housing professionals who were invited to the meeting did not attend, these questionnaires were sent out electronically for follow-up. A summary of comments expressed at these meetings is presented below.
Market Rate Housing • One resident felt that there remains demand for luxury housing in Milpitas that is unmet
since new residential development in the hills is zoned for one unit per ten acres in accordance with the Hillside Ordinance. This Ordinance was adopted after the electorate voted to constrain development in the hills. The resident suggested that the Hillside Ordinance be mentioned as a luxury housing constraint. However, staff attending the meeting mentioned that much of the hillside area cannot be developed since it is parkland or part of the San Francisco watershed. Also, the Hillside Ordinance has not constrained market rate or affordable housing development.
• When affordable sales prices at both the upper and lower ranges of the income
distribution in Milpitas are compared with sales prices of homes recently sold, there is a mismatch at both ends of this distribution. In other words, proportionately, there are fewer units selling for under $459,000 than there are households that can afford such units, and fewer units priced above $1,150,000 than there are households that can afford higher cost housing.
A-2
Issues Related to New Development in the Specific Plan Areas
• What about the lack of infrastructure to industrially zoned land that could be converted to residential uses? New development will pay for this infrastructure. The Financing Plan for the Transit Area Specific Plan has established a plan to pay for infrastructure.
• Traffic congestion is already a problem at certain intersections, such as Main and
Montague and 237 and Main. More development in the Transit Area will worsen already bad congestion problems. Thus, the City should work with VTA to run more small buses, not large buses, for transportation. This could decrease some of the traffic congestion.
• Milpitas schools need to accommodate increases in school enrollment related to new
development in the Transit Area. Land has been set aside in the Specific Plan to accommodate the need for new schools.
Additional Issues
• Although the reduction of parking requirements is a possible cost offset to developers who provide affordable housing, the result of this policy is a lack of parking in certain areas. This parking problem exists in areas where street widths are too narrow to allow parking on both sides, as well as space for two-way traffic flow. The built environment (such as street widths planned for lower residential densities) no longer serves the needs of current residents, who live more densely in multifamily and single family neighborhoods, often due to doubling up in units or extended families occupying the same unit.
• The link between the housing element and other services, such as education and parks
occurs in the land use element, not the housing element.
• Overcrowded units are more and more of a problem in Milpitas. Multigenerational families, often recent immigrants, share the same unit. Staff mentioned that this overcrowding problem is included in CDBG reports. Some of the streets affected include Adams-Temple-Selwyn.
• Another source of overcrowding is changing lifestyles. For example, when new condo
projects were first built, young urban professionals moved in. Now, several years later, these couples are having children, resulting in overcrowding.
A-3
• Since the railroad tracks bisect Milpitas, there are only four major streets to use to travel east/west. These include 237, Abel/Jacklin, Dixon Landing Road, and Montague Expressway. Thus, these streets are more congested.
• A first-time homebuyer program is needed. This helps stabilize the community. Also, a
first-time homebuyer program for school employees would be a good idea. (The City currently establishes preferences for new school teachers in the mixed-income developments. In fact, three or four teachers moved into very low-income units at Parc Place when the project first opened. The City continues to provide outreach about affordable units to teachers. However, a housing program that targets $40,000 annual incomes would not help teachers with more experience or teachers with spouses who earn higher incomes. Therefore, a school employee homebuyer program targeted to a higher income group should be considered.
• There appears to be an increase in the number of homeless persons in Milpitas. There are
cooling and warming areas in the City for the homeless. The Sports Center is one example. It is possible that more homeless services are needed in Milpitas.
• When asked by staff whether residents at the meeting thought that child care facilities
should be required at larger developments, there did not appear to be strong sentiments one way or another.
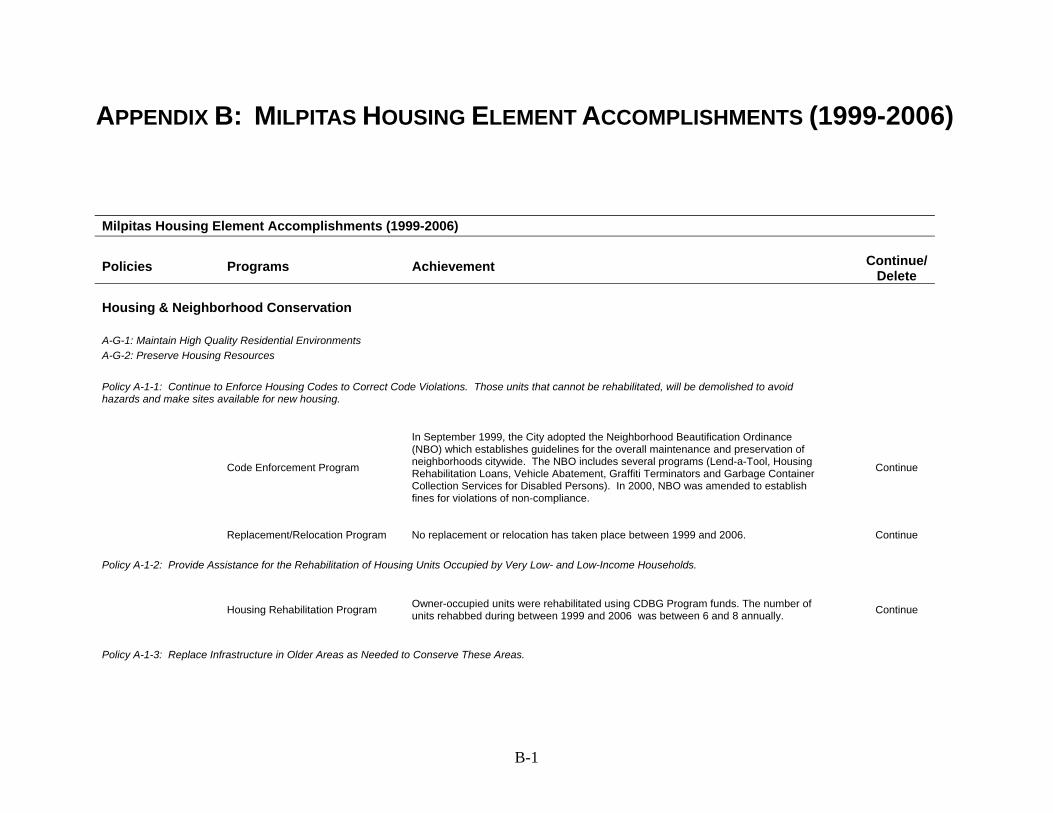
B-1
APPENDIX B: MILPITAS HOUSING ELEMENT ACCOMPLISHMENTS (1999-2006) Milpitas Housing Element Accomplishments (1999-2006)
Policies Programs Achievement Continue/ Delete
Housing & Neighborhood Conservation
A-G-1: Maintain High Quality Residential Environments A-G-2: Preserve Housing Resources Policy A-1-1: Continue to Enforce Housing Codes to Correct Code Violations. Those units that cannot be rehabilitated, will be demolished to avoid hazards and make sites available for new housing.
Code Enforcement Program
In September 1999, the City adopted the Neighborhood Beautification Ordinance (NBO) which establishes guidelines for the overall maintenance and preservation of neighborhoods citywide. The NBO includes several programs (Lend-a-Tool, Housing Rehabilitation Loans, Vehicle Abatement, Graffiti Terminators and Garbage Container Collection Services for Disabled Persons). In 2000, NBO was amended to establish fines for violations of non-compliance.
Continue
Replacement/Relocation Program No replacement or relocation has taken place between 1999 and 2006. Continue Policy A-1-2: Provide Assistance for the Rehabilitation of Housing Units Occupied by Very Low- and Low-Income Households.
Housing Rehabilitation Program Owner-occupied units were rehabilitated using CDBG Program funds. The number of units rehabbed during between 1999 and 2006 was between 6 and 8 annually. Continue
Policy A-1-3: Replace Infrastructure in Older Areas as Needed to Conserve These Areas.
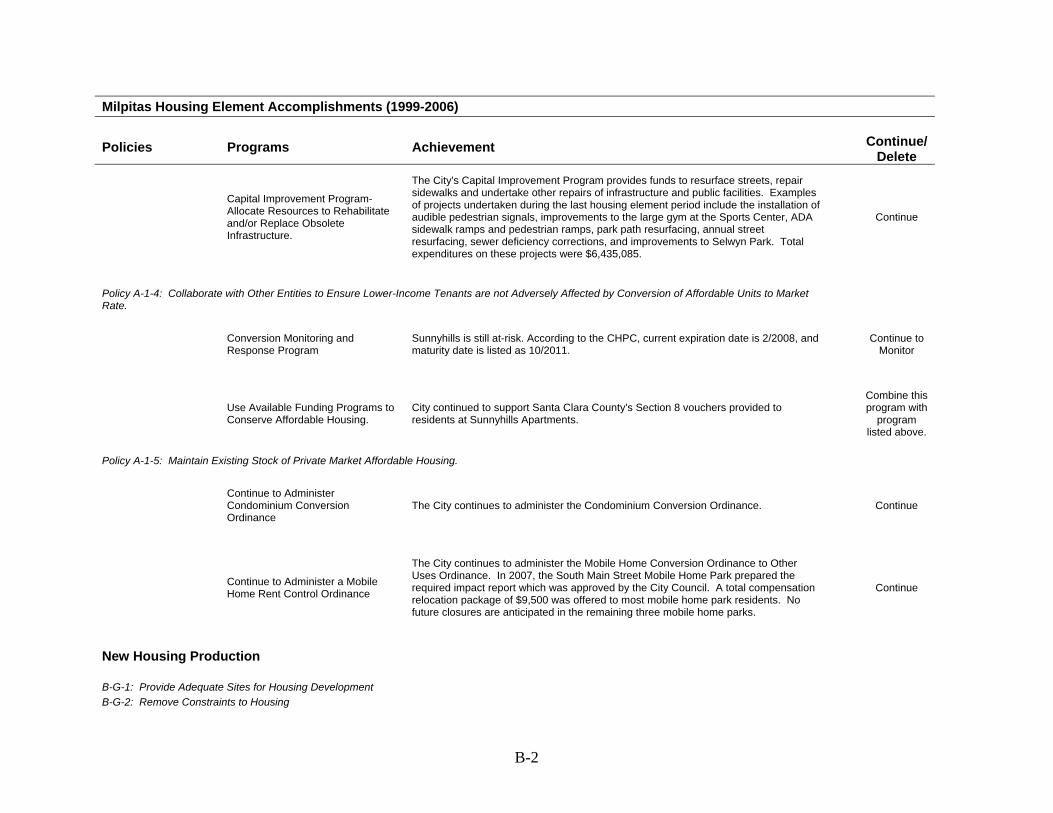
B-2
Milpitas Housing Element Accomplishments (1999-2006)
Policies Programs Achievement Continue/ Delete
Capital Improvement Program-Allocate Resources to Rehabilitate and/or Replace Obsolete Infrastructure.
The City's Capital Improvement Program provides funds to resurface streets, repair sidewalks and undertake other repairs of infrastructure and public facilities. Examples of projects undertaken during the last housing element period include the installation of audible pedestrian signals, improvements to the large gym at the Sports Center, ADA sidewalk ramps and pedestrian ramps, park path resurfacing, annual street resurfacing, sewer deficiency corrections, and improvements to Selwyn Park. Total expenditures on these projects were $6,435,085.
Continue
Policy A-1-4: Collaborate with Other Entities to Ensure Lower-Income Tenants are not Adversely Affected by Conversion of Affordable Units to Market Rate.
Conversion Monitoring and Response Program
Sunnyhills is still at-risk. According to the CHPC, current expiration date is 2/2008, and maturity date is listed as 10/2011. Continue to
Monitor
Use Available Funding Programs to Conserve Affordable Housing.
City continued to support Santa Clara County's Section 8 vouchers provided to residents at Sunnyhills Apartments.
Combine this program with
program listed above.
Policy A-1-5: Maintain Existing Stock of Private Market Affordable Housing.
Continue to Administer Condominium Conversion Ordinance
The City continues to administer the Condominium Conversion Ordinance. Continue
Continue to Administer a Mobile Home Rent Control Ordinance
The City continues to administer the Mobile Home Conversion Ordinance to Other Uses Ordinance. In 2007, the South Main Street Mobile Home Park prepared the required impact report which was approved by the City Council. A total compensation relocation package of $9,500 was offered to most mobile home park residents. No future closures are anticipated in the remaining three mobile home parks.
Continue
New Housing Production B-G-1: Provide Adequate Sites for Housing Development B-G-2: Remove Constraints to Housing
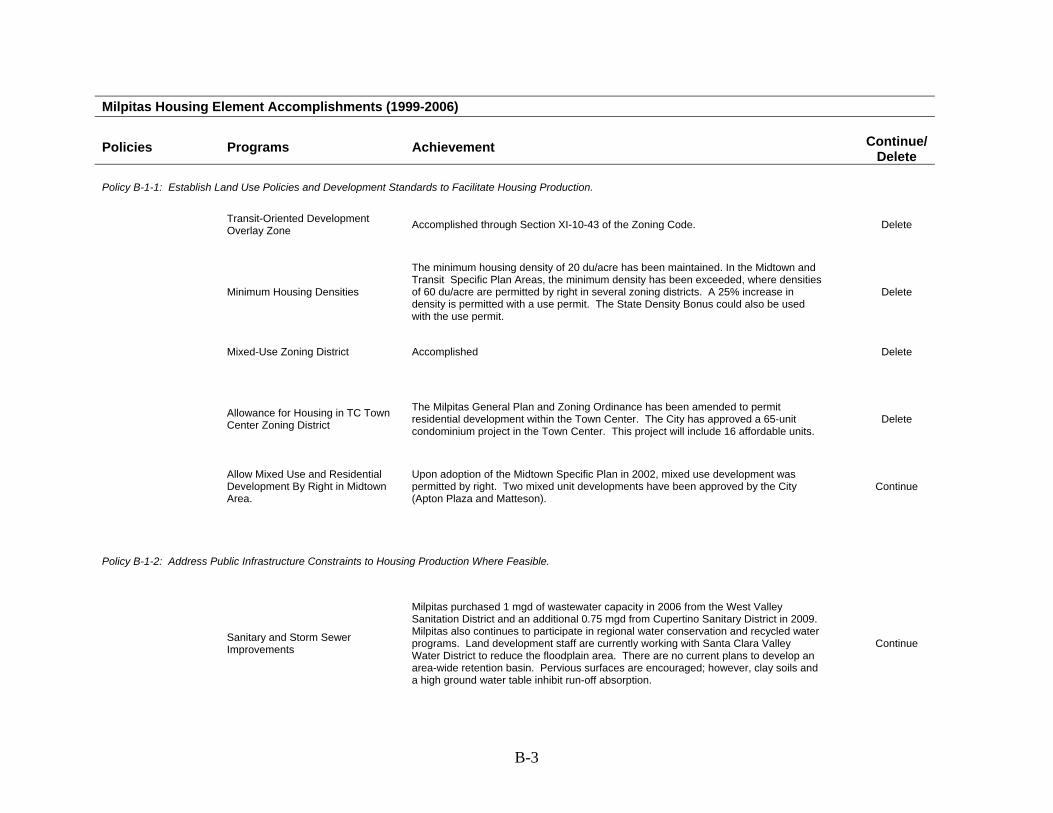
B-3
Milpitas Housing Element Accomplishments (1999-2006)
Policies Programs Achievement Continue/ Delete
Policy B-1-1: Establish Land Use Policies and Development Standards to Facilitate Housing Production.
Transit-Oriented Development Overlay Zone Accomplished through Section XI-10-43 of the Zoning Code. Delete
Minimum Housing Densities
The minimum housing density of 20 du/acre has been maintained. In the Midtown and Transit Specific Plan Areas, the minimum density has been exceeded, where densities of 60 du/acre are permitted by right in several zoning districts. A 25% increase in density is permitted with a use permit. The State Density Bonus could also be used with the use permit.
Delete
Mixed-Use Zoning District Accomplished Delete
Allowance for Housing in TC Town Center Zoning District
The Milpitas General Plan and Zoning Ordinance has been amended to permit residential development within the Town Center. The City has approved a 65-unit condominium project in the Town Center. This project will include 16 affordable units.
Delete
Allow Mixed Use and Residential Development By Right in Midtown Area.
Upon adoption of the Midtown Specific Plan in 2002, mixed use development was permitted by right. Two mixed unit developments have been approved by the City (Apton Plaza and Matteson).
Continue
Policy B-1-2: Address Public Infrastructure Constraints to Housing Production Where Feasible.
Sanitary and Storm Sewer Improvements
Milpitas purchased 1 mgd of wastewater capacity in 2006 from the West Valley Sanitation District and an additional 0.75 mgd from Cupertino Sanitary District in 2009. Milpitas also continues to participate in regional water conservation and recycled water programs. Land development staff are currently working with Santa Clara Valley Water District to reduce the floodplain area. There are no current plans to develop an area-wide retention basin. Pervious surfaces are encouraged; however, clay soils and a high ground water table inhibit run-off absorption.
Continue
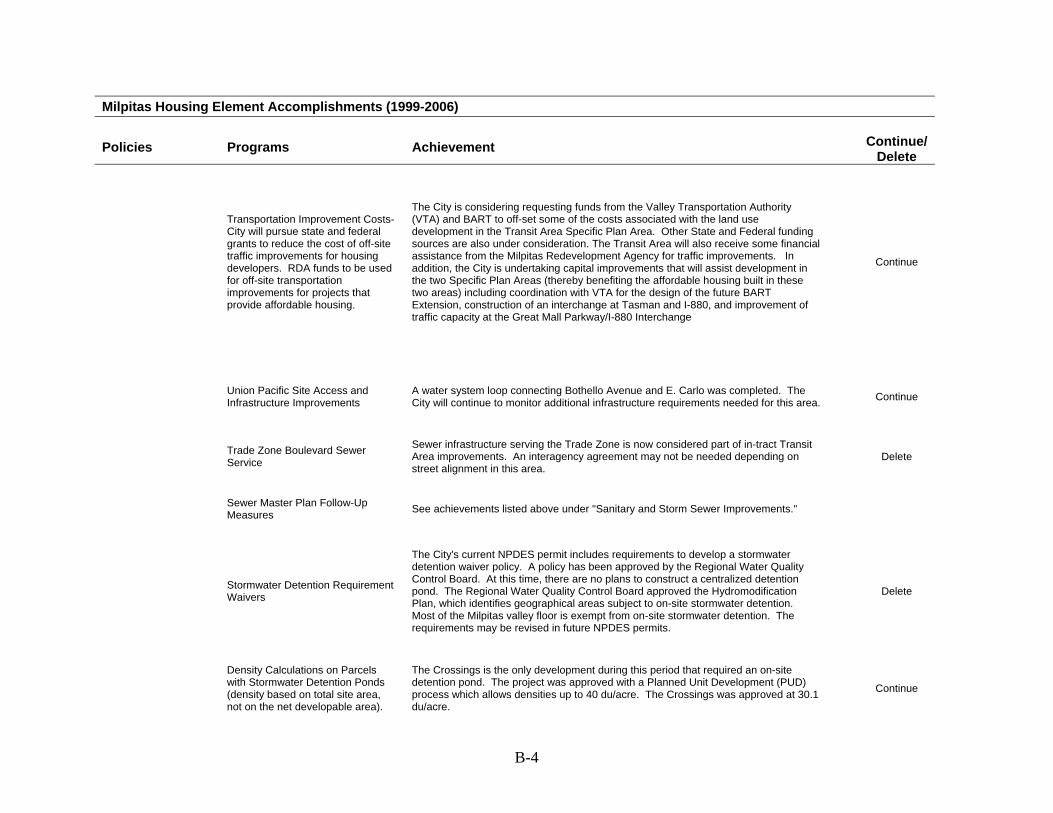
B-4
Milpitas Housing Element Accomplishments (1999-2006)
Policies Programs Achievement Continue/ Delete
Transportation Improvement Costs-City will pursue state and federal grants to reduce the cost of off-site traffic improvements for housing developers. RDA funds to be used for off-site transportation improvements for projects that provide affordable housing.
The City is considering requesting funds from the Valley Transportation Authority (VTA) and BART to off-set some of the costs associated with the land use development in the Transit Area Specific Plan Area. Other State and Federal funding sources are also under consideration. The Transit Area will also receive some financial assistance from the Milpitas Redevelopment Agency for traffic improvements. In addition, the City is undertaking capital improvements that will assist development in the two Specific Plan Areas (thereby benefiting the affordable housing built in these two areas) including coordination with VTA for the design of the future BART Extension, construction of an interchange at Tasman and I-880, and improvement of traffic capacity at the Great Mall Parkway/I-880 Interchange
Continue
Union Pacific Site Access and Infrastructure Improvements
A water system loop connecting Bothello Avenue and E. Carlo was completed. The City will continue to monitor additional infrastructure requirements needed for this area. Continue
Trade Zone Boulevard Sewer Service
Sewer infrastructure serving the Trade Zone is now considered part of in-tract Transit Area improvements. An interagency agreement may not be needed depending on street alignment in this area.
Delete
Sewer Master Plan Follow-Up Measures See achievements listed above under "Sanitary and Storm Sewer Improvements."
Stormwater Detention Requirement Waivers
The City's current NPDES permit includes requirements to develop a stormwater detention waiver policy. A policy has been approved by the Regional Water Quality Control Board. At this time, there are no plans to construct a centralized detention pond. The Regional Water Quality Control Board approved the Hydromodification Plan, which identifies geographical areas subject to on-site stormwater detention. Most of the Milpitas valley floor is exempt from on-site stormwater detention. The requirements may be revised in future NPDES permits.
Delete
Density Calculations on Parcels with Stormwater Detention Ponds (density based on total site area, not on the net developable area).
The Crossings is the only development during this period that required an on-site detention pond. The project was approved with a Planned Unit Development (PUD) process which allows densities up to 40 du/acre. The Crossings was approved at 30.1 du/acre.
Continue
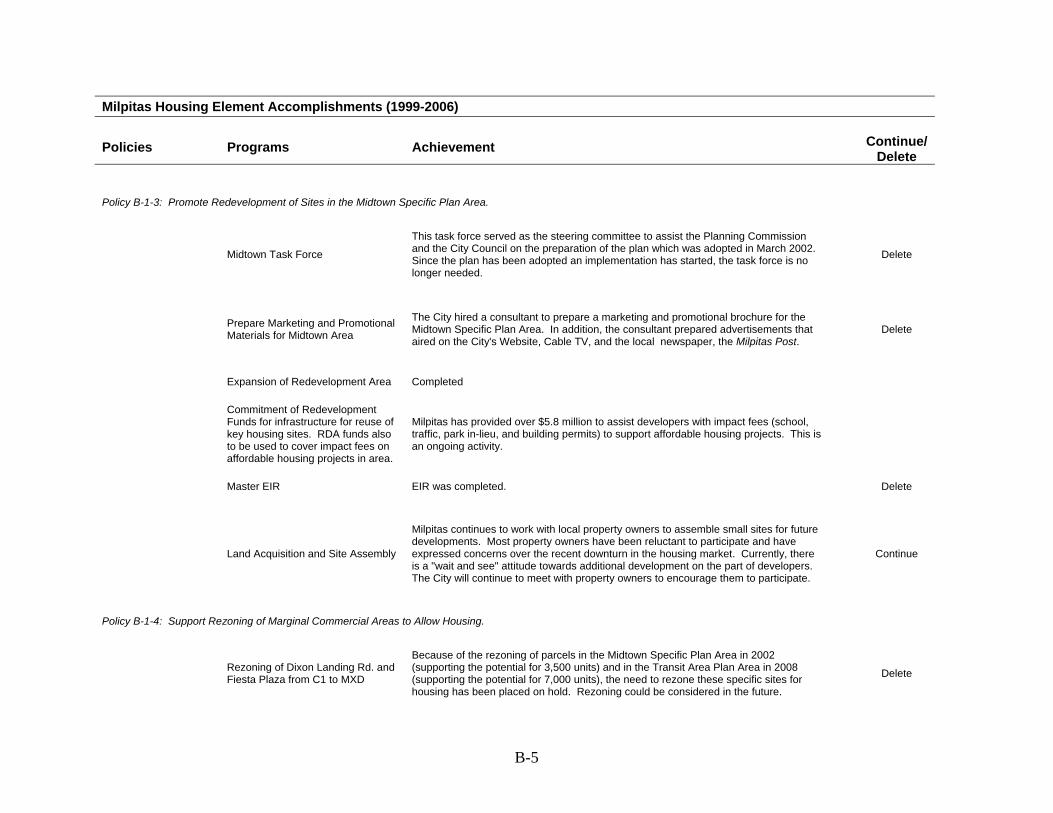
B-5
Milpitas Housing Element Accomplishments (1999-2006)
Policies Programs Achievement Continue/ Delete
Policy B-1-3: Promote Redevelopment of Sites in the Midtown Specific Plan Area.
Midtown Task Force
This task force served as the steering committee to assist the Planning Commission and the City Council on the preparation of the plan which was adopted in March 2002. Since the plan has been adopted an implementation has started, the task force is no longer needed.
Delete
Prepare Marketing and Promotional Materials for Midtown Area
The City hired a consultant to prepare a marketing and promotional brochure for the Midtown Specific Plan Area. In addition, the consultant prepared advertisements that aired on the City's Website, Cable TV, and the local newspaper, the Milpitas Post.
Delete
Expansion of Redevelopment Area Completed
Commitment of Redevelopment Funds for infrastructure for reuse of key housing sites. RDA funds also to be used to cover impact fees on affordable housing projects in area.
Milpitas has provided over $5.8 million to assist developers with impact fees (school, traffic, park in-lieu, and building permits) to support affordable housing projects. This is an ongoing activity.
Master EIR EIR was completed. Delete
Land Acquisition and Site Assembly
Milpitas continues to work with local property owners to assemble small sites for future developments. Most property owners have been reluctant to participate and have expressed concerns over the recent downturn in the housing market. Currently, there is a "wait and see" attitude towards additional development on the part of developers. The City will continue to meet with property owners to encourage them to participate.
Continue
Policy B-1-4: Support Rezoning of Marginal Commercial Areas to Allow Housing.
Rezoning of Dixon Landing Rd. and Fiesta Plaza from C1 to MXD
Because of the rezoning of parcels in the Midtown Specific Plan Area in 2002 (supporting the potential for 3,500 units) and in the Transit Area Plan Area in 2008 (supporting the potential for 7,000 units), the need to rezone these specific sites for housing has been placed on hold. Rezoning could be considered in the future.
Delete
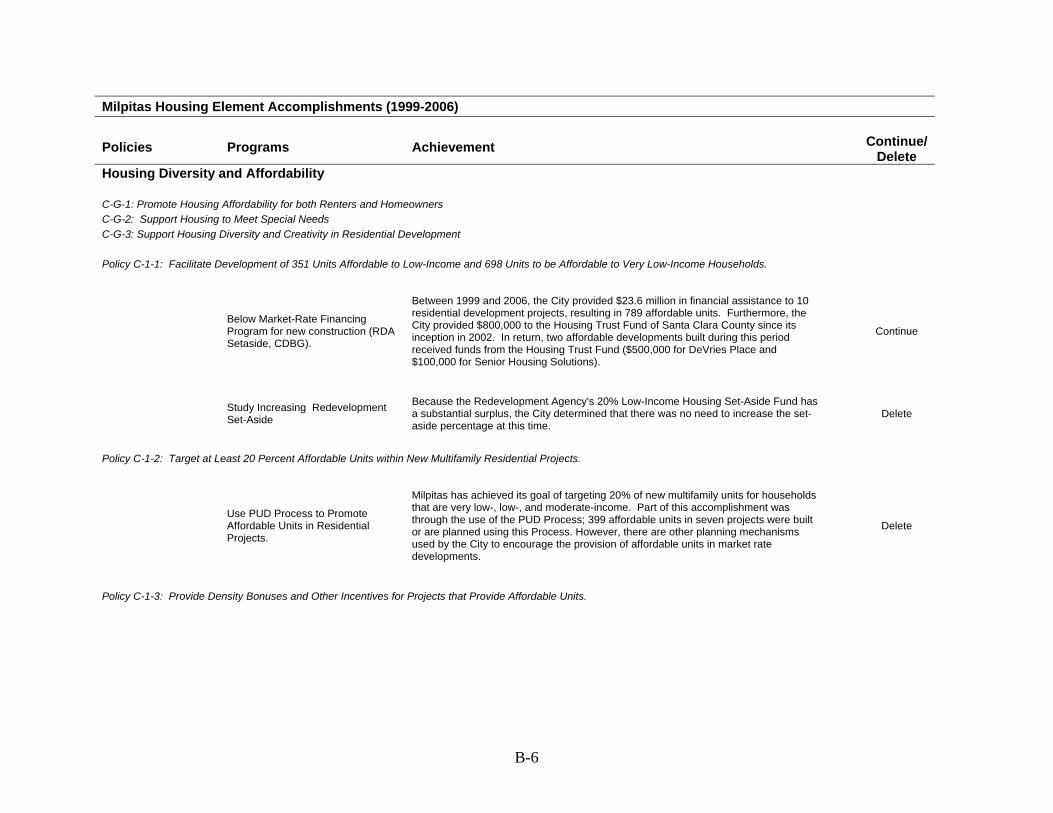
B-6
Milpitas Housing Element Accomplishments (1999-2006)
Policies Programs Achievement Continue/ Delete
Housing Diversity and Affordability C-G-1: Promote Housing Affordability for both Renters and Homeowners C-G-2: Support Housing to Meet Special Needs C-G-3: Support Housing Diversity and Creativity in Residential Development Policy C-1-1: Facilitate Development of 351 Units Affordable to Low-Income and 698 Units to be Affordable to Very Low-Income Households.
Below Market-Rate Financing Program for new construction (RDA Setaside, CDBG).
Between 1999 and 2006, the City provided $23.6 million in financial assistance to 10 residential development projects, resulting in 789 affordable units. Furthermore, the City provided $800,000 to the Housing Trust Fund of Santa Clara County since its inception in 2002. In return, two affordable developments built during this period received funds from the Housing Trust Fund ($500,000 for DeVries Place and $100,000 for Senior Housing Solutions).
Continue
Study Increasing Redevelopment Set-Aside
Because the Redevelopment Agency's 20% Low-Income Housing Set-Aside Fund has a substantial surplus, the City determined that there was no need to increase the set-aside percentage at this time.
Delete
Policy C-1-2: Target at Least 20 Percent Affordable Units within New Multifamily Residential Projects.
Use PUD Process to Promote Affordable Units in Residential Projects.
Milpitas has achieved its goal of targeting 20% of new multifamily units for households that are very low-, low-, and moderate-income. Part of this accomplishment was through the use of the PUD Process; 399 affordable units in seven projects were built or are planned using this Process. However, there are other planning mechanisms used by the City to encourage the provision of affordable units in market rate developments.
Delete
Policy C-1-3: Provide Density Bonuses and Other Incentives for Projects that Provide Affordable Units.
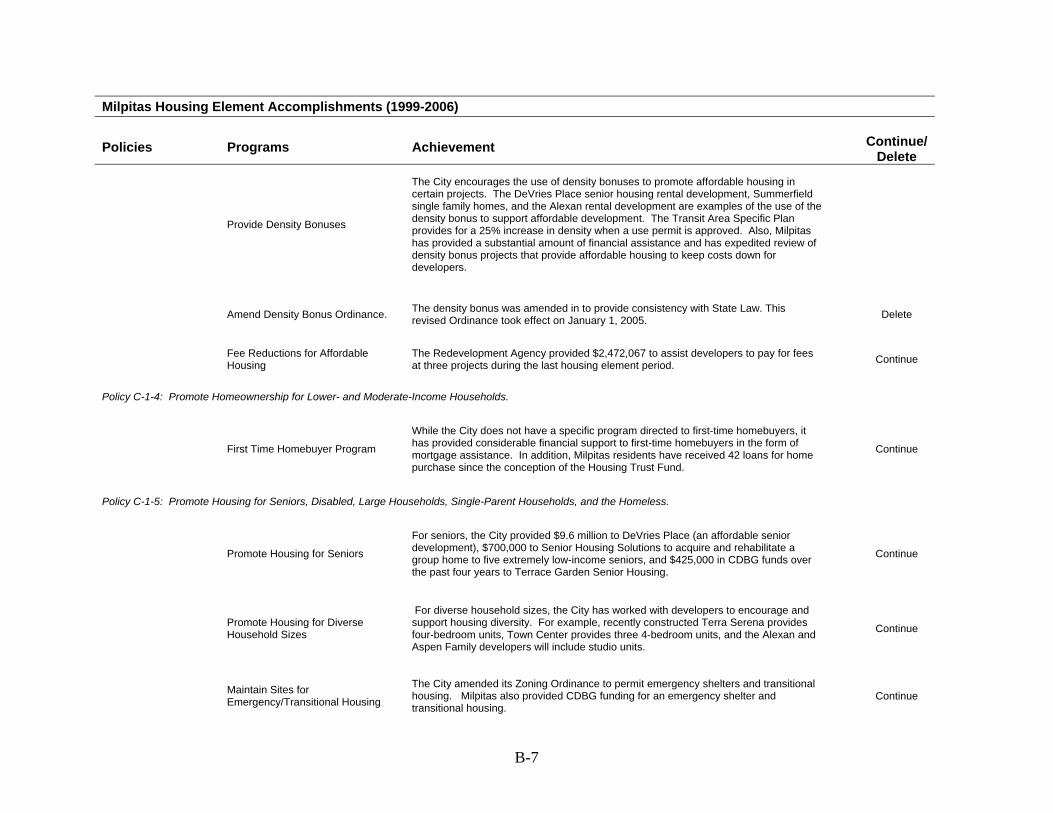
B-7
Milpitas Housing Element Accomplishments (1999-2006)
Policies Programs Achievement Continue/ Delete
Provide Density Bonuses
The City encourages the use of density bonuses to promote affordable housing in certain projects. The DeVries Place senior housing rental development, Summerfield single family homes, and the Alexan rental development are examples of the use of the density bonus to support affordable development. The Transit Area Specific Plan provides for a 25% increase in density when a use permit is approved. Also, Milpitas has provided a substantial amount of financial assistance and has expedited review of density bonus projects that provide affordable housing to keep costs down for developers.
Amend Density Bonus Ordinance. The density bonus was amended in to provide consistency with State Law. This revised Ordinance took effect on January 1, 2005. Delete
Fee Reductions for Affordable Housing
The Redevelopment Agency provided $2,472,067 to assist developers to pay for fees at three projects during the last housing element period. Continue
Policy C-1-4: Promote Homeownership for Lower- and Moderate-Income Households.
First Time Homebuyer Program
While the City does not have a specific program directed to first-time homebuyers, it has provided considerable financial support to first-time homebuyers in the form of mortgage assistance. In addition, Milpitas residents have received 42 loans for home purchase since the conception of the Housing Trust Fund.
Continue
Policy C-1-5: Promote Housing for Seniors, Disabled, Large Households, Single-Parent Households, and the Homeless.
Promote Housing for Seniors
For seniors, the City provided $9.6 million to DeVries Place (an affordable senior development), $700,000 to Senior Housing Solutions to acquire and rehabilitate a group home to five extremely low-income seniors, and $425,000 in CDBG funds over the past four years to Terrace Garden Senior Housing.
Continue
Promote Housing for Diverse Household Sizes
For diverse household sizes, the City has worked with developers to encourage and support housing diversity. For example, recently constructed Terra Serena provides four-bedroom units, Town Center provides three 4-bedroom units, and the Alexan and Aspen Family developers will include studio units.
Continue
Maintain Sites for Emergency/Transitional Housing
The City amended its Zoning Ordinance to permit emergency shelters and transitional housing. Milpitas also provided CDBG funding for an emergency shelter and transitional housing.
Continue
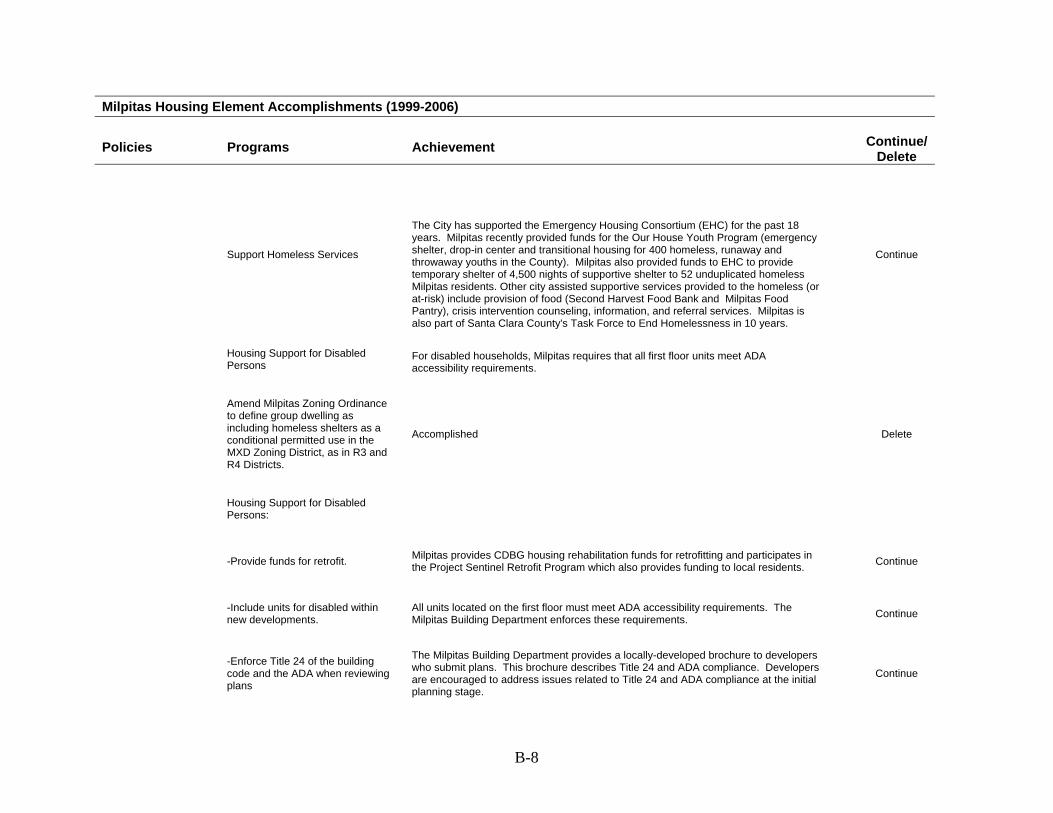
B-8
Milpitas Housing Element Accomplishments (1999-2006)
Policies Programs Achievement Continue/ Delete
Support Homeless Services
The City has supported the Emergency Housing Consortium (EHC) for the past 18 years. Milpitas recently provided funds for the Our House Youth Program (emergency shelter, drop-in center and transitional housing for 400 homeless, runaway and throwaway youths in the County). Milpitas also provided funds to EHC to provide temporary shelter of 4,500 nights of supportive shelter to 52 unduplicated homeless Milpitas residents. Other city assisted supportive services provided to the homeless (or at-risk) include provision of food (Second Harvest Food Bank and Milpitas Food Pantry), crisis intervention counseling, information, and referral services. Milpitas is also part of Santa Clara County's Task Force to End Homelessness in 10 years.
Continue
Housing Support for Disabled Persons
For disabled households, Milpitas requires that all first floor units meet ADA accessibility requirements.
Amend Milpitas Zoning Ordinance to define group dwelling as including homeless shelters as a conditional permitted use in the MXD Zoning District, as in R3 and R4 Districts.
Accomplished Delete
Housing Support for Disabled Persons:
-Provide funds for retrofit. Milpitas provides CDBG housing rehabilitation funds for retrofitting and participates in the Project Sentinel Retrofit Program which also provides funding to local residents. Continue
-Include units for disabled within new developments.
All units located on the first floor must meet ADA accessibility requirements. The Milpitas Building Department enforces these requirements. Continue
-Enforce Title 24 of the building code and the ADA when reviewing plans
The Milpitas Building Department provides a locally-developed brochure to developers who submit plans. This brochure describes Title 24 and ADA compliance. Developers are encouraged to address issues related to Title 24 and ADA compliance at the initial planning stage.
Continue
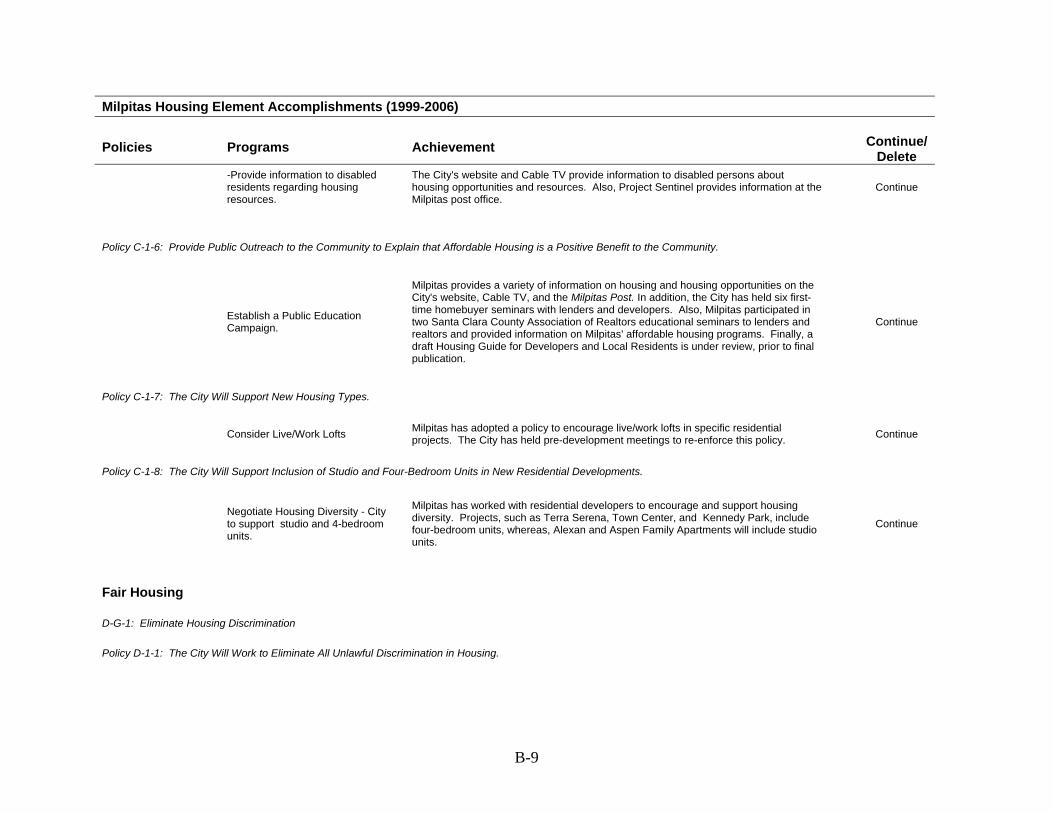
B-9
Milpitas Housing Element Accomplishments (1999-2006)
Policies Programs Achievement Continue/ Delete
-Provide information to disabled residents regarding housing resources.
The City's website and Cable TV provide information to disabled persons about housing opportunities and resources. Also, Project Sentinel provides information at the Milpitas post office.
Continue
Policy C-1-6: Provide Public Outreach to the Community to Explain that Affordable Housing is a Positive Benefit to the Community.
Establish a Public Education Campaign.
Milpitas provides a variety of information on housing and housing opportunities on the City's website, Cable TV, and the Milpitas Post. In addition, the City has held six first-time homebuyer seminars with lenders and developers. Also, Milpitas participated in two Santa Clara County Association of Realtors educational seminars to lenders and realtors and provided information on Milpitas' affordable housing programs. Finally, a draft Housing Guide for Developers and Local Residents is under review, prior to final publication.
Continue
Policy C-1-7: The City Will Support New Housing Types.
Consider Live/Work Lofts Milpitas has adopted a policy to encourage live/work lofts in specific residential projects. The City has held pre-development meetings to re-enforce this policy. Continue
Policy C-1-8: The City Will Support Inclusion of Studio and Four-Bedroom Units in New Residential Developments.
Negotiate Housing Diversity - City to support studio and 4-bedroom units.
Milpitas has worked with residential developers to encourage and support housing diversity. Projects, such as Terra Serena, Town Center, and Kennedy Park, include four-bedroom units, whereas, Alexan and Aspen Family Apartments will include studio units.
Continue
Fair Housing D-G-1: Eliminate Housing Discrimination Policy D-1-1: The City Will Work to Eliminate All Unlawful Discrimination in Housing.
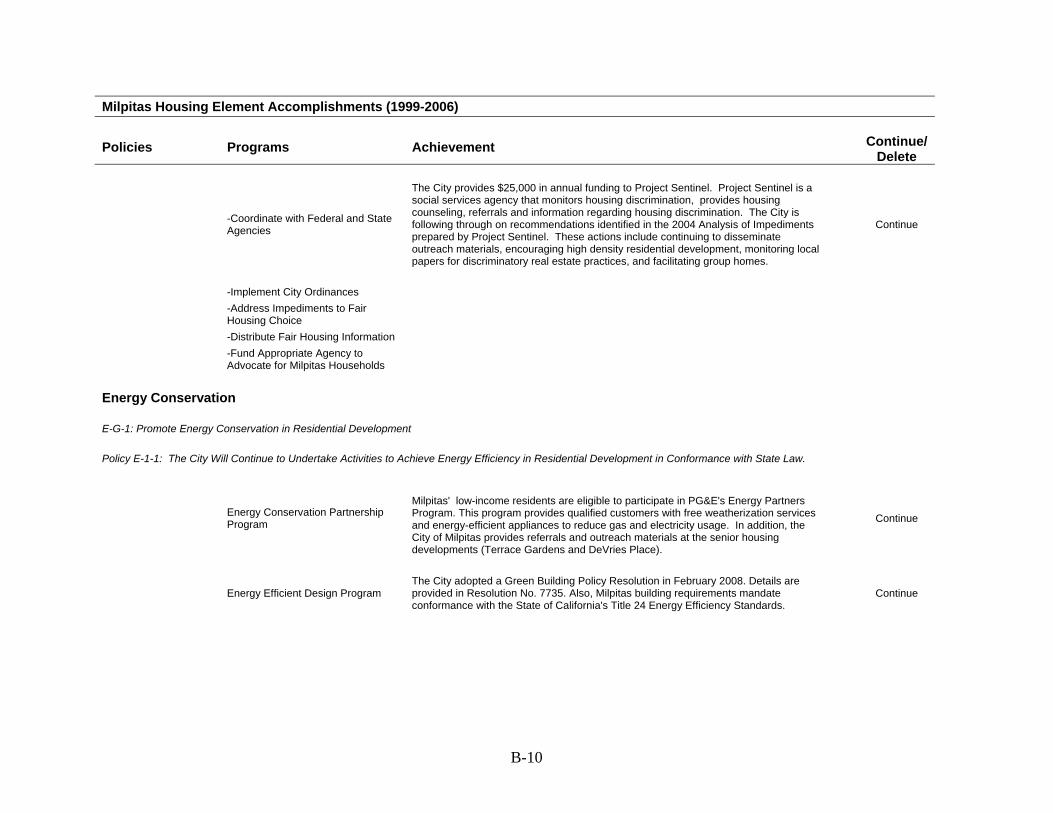
B-10
Milpitas Housing Element Accomplishments (1999-2006)
Policies Programs Achievement Continue/ Delete
-Coordinate with Federal and State Agencies
The City provides $25,000 in annual funding to Project Sentinel. Project Sentinel is a social services agency that monitors housing discrimination, provides housing counseling, referrals and information regarding housing discrimination. The City is following through on recommendations identified in the 2004 Analysis of Impediments prepared by Project Sentinel. These actions include continuing to disseminate outreach materials, encouraging high density residential development, monitoring local papers for discriminatory real estate practices, and facilitating group homes.
Continue
-Implement City Ordinances
-Address Impediments to Fair Housing Choice
-Distribute Fair Housing Information
-Fund Appropriate Agency to Advocate for Milpitas Households
Energy Conservation E-G-1: Promote Energy Conservation in Residential Development Policy E-1-1: The City Will Continue to Undertake Activities to Achieve Energy Efficiency in Residential Development in Conformance with State Law.
Energy Conservation Partnership Program
Milpitas' low-income residents are eligible to participate in PG&E's Energy Partners Program. This program provides qualified customers with free weatherization services and energy-efficient appliances to reduce gas and electricity usage. In addition, the City of Milpitas provides referrals and outreach materials at the senior housing developments (Terrace Gardens and DeVries Place).
Continue
Energy Efficient Design Program The City adopted a Green Building Policy Resolution in February 2008. Details are provided in Resolution No. 7735. Also, Milpitas building requirements mandate conformance with the State of California's Title 24 Energy Efficiency Standards.
Continue
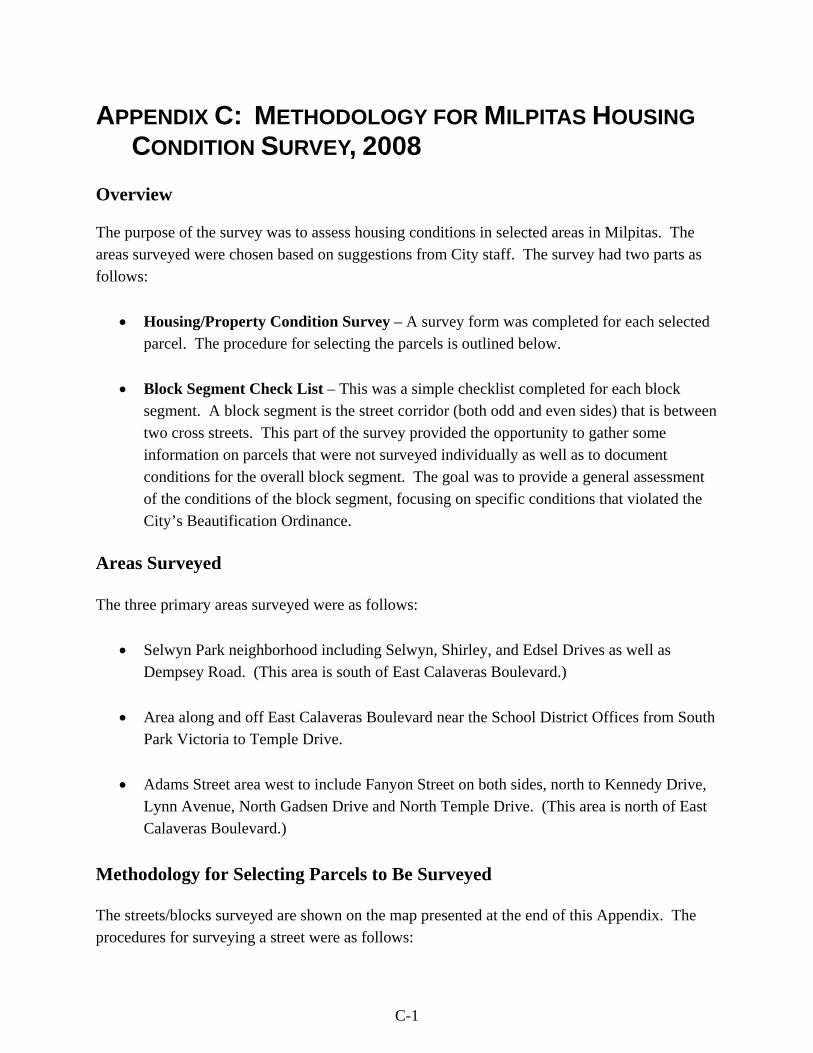
C-1
APPENDIX C: METHODOLOGY FOR MILPITAS HOUSING CONDITION SURVEY, 2008
Overview The purpose of the survey was to assess housing conditions in selected areas in Milpitas. The areas surveyed were chosen based on suggestions from City staff. The survey had two parts as follows:
• Housing/Property Condition Survey – A survey form was completed for each selected parcel. The procedure for selecting the parcels is outlined below.
• Block Segment Check List – This was a simple checklist completed for each block
segment. A block segment is the street corridor (both odd and even sides) that is between two cross streets. This part of the survey provided the opportunity to gather some information on parcels that were not surveyed individually as well as to document conditions for the overall block segment. The goal was to provide a general assessment of the conditions of the block segment, focusing on specific conditions that violated the City’s Beautification Ordinance.
Areas Surveyed The three primary areas surveyed were as follows:
• Selwyn Park neighborhood including Selwyn, Shirley, and Edsel Drives as well as Dempsey Road. (This area is south of East Calaveras Boulevard.)
• Area along and off East Calaveras Boulevard near the School District Offices from South
Park Victoria to Temple Drive.
• Adams Street area west to include Fanyon Street on both sides, north to Kennedy Drive, Lynn Avenue, North Gadsen Drive and North Temple Drive. (This area is north of East Calaveras Boulevard.)
Methodology for Selecting Parcels to Be Surveyed The streets/blocks surveyed are shown on the map presented at the end of this Appendix. The procedures for surveying a street were as follows:
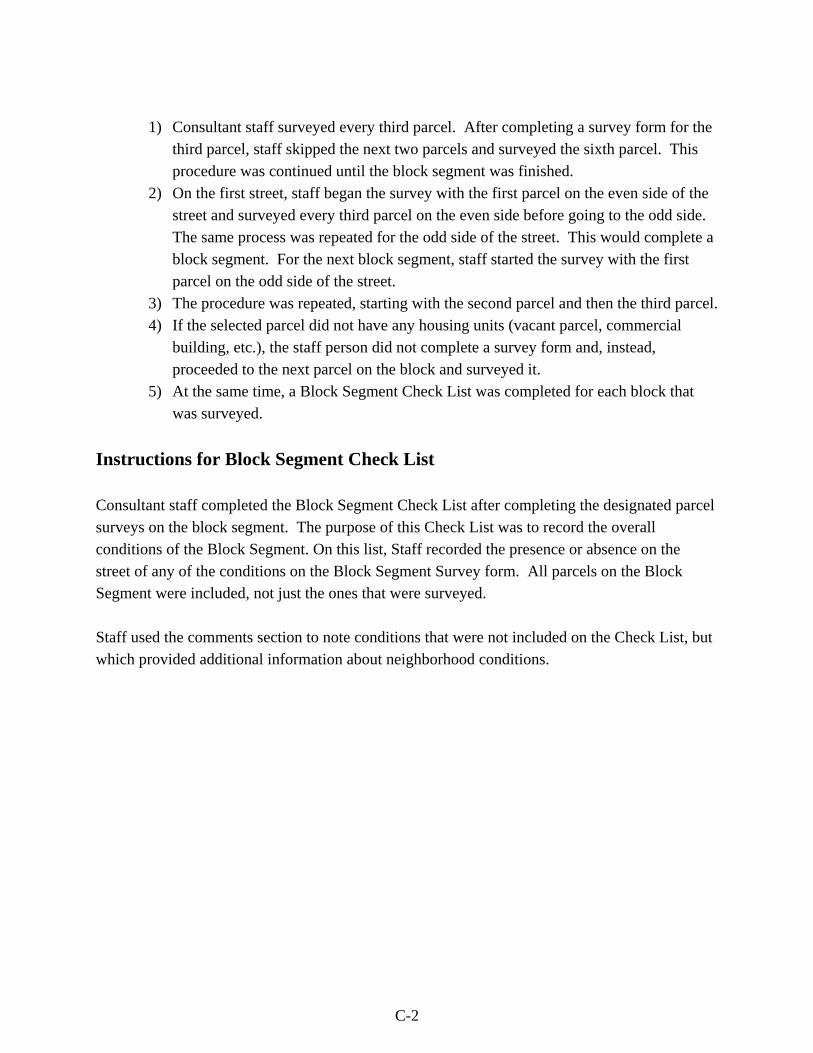
C-2
1) Consultant staff surveyed every third parcel. After completing a survey form for the
third parcel, staff skipped the next two parcels and surveyed the sixth parcel. This procedure was continued until the block segment was finished.
2) On the first street, staff began the survey with the first parcel on the even side of the street and surveyed every third parcel on the even side before going to the odd side. The same process was repeated for the odd side of the street. This would complete a block segment. For the next block segment, staff started the survey with the first parcel on the odd side of the street.
3) The procedure was repeated, starting with the second parcel and then the third parcel. 4) If the selected parcel did not have any housing units (vacant parcel, commercial
building, etc.), the staff person did not complete a survey form and, instead, proceeded to the next parcel on the block and surveyed it.
5) At the same time, a Block Segment Check List was completed for each block that was surveyed.
Instructions for Block Segment Check List Consultant staff completed the Block Segment Check List after completing the designated parcel surveys on the block segment. The purpose of this Check List was to record the overall conditions of the Block Segment. On this list, Staff recorded the presence or absence on the street of any of the conditions on the Block Segment Survey form. All parcels on the Block Segment were included, not just the ones that were surveyed. Staff used the comments section to note conditions that were not included on the Check List, but which provided additional information about neighborhood conditions.
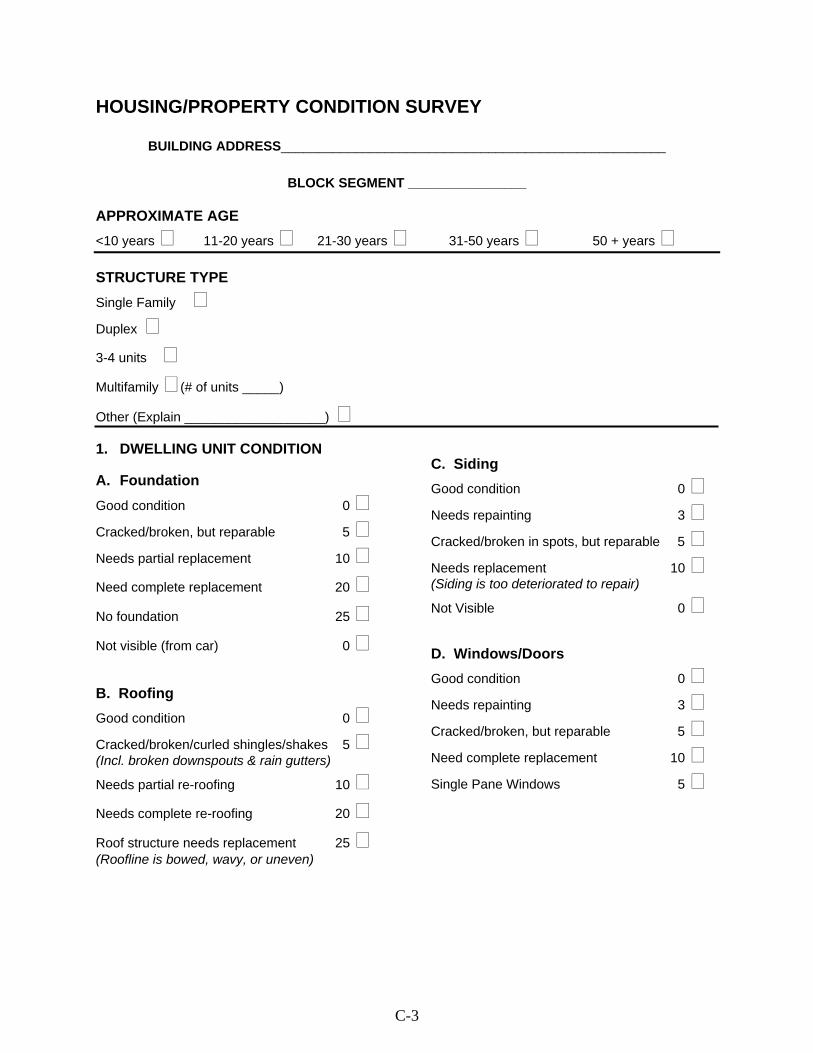
C-3
HOUSING/PROPERTY CONDITION SURVEY
BUILDING ADDRESS____________________________________________________
BLOCK SEGMENT ________________ APPROXIMATE AGE
<10 years 11-20 years 21-30 years 31-50 years 50 + years STRUCTURE TYPE Single Family Duplex
3-4 units Multifamily (# of units _____)
Other (Explain ___________________)
1. DWELLING UNIT CONDITION A. Foundation Good condition 0 Cracked/broken, but reparable 5
Needs partial replacement 10
Need complete replacement 20 No foundation 25 Not visible (from car) 0 B. Roofing Good condition 0 Cracked/broken/curled shingles/shakes 5 (Incl. broken downspouts & rain gutters)
Needs partial re-roofing 10
Needs complete re-roofing 20 Roof structure needs replacement 25 (Roofline is bowed, wavy, or uneven)
C. Siding Good condition 0 Needs repainting 3
Cracked/broken in spots, but reparable 5
Needs replacement 10 (Siding is too deteriorated to repair)
Not Visible 0 D. Windows/Doors Good condition 0 Needs repainting 3
Cracked/broken, but reparable 5
Need complete replacement 10 Single Pane Windows 5
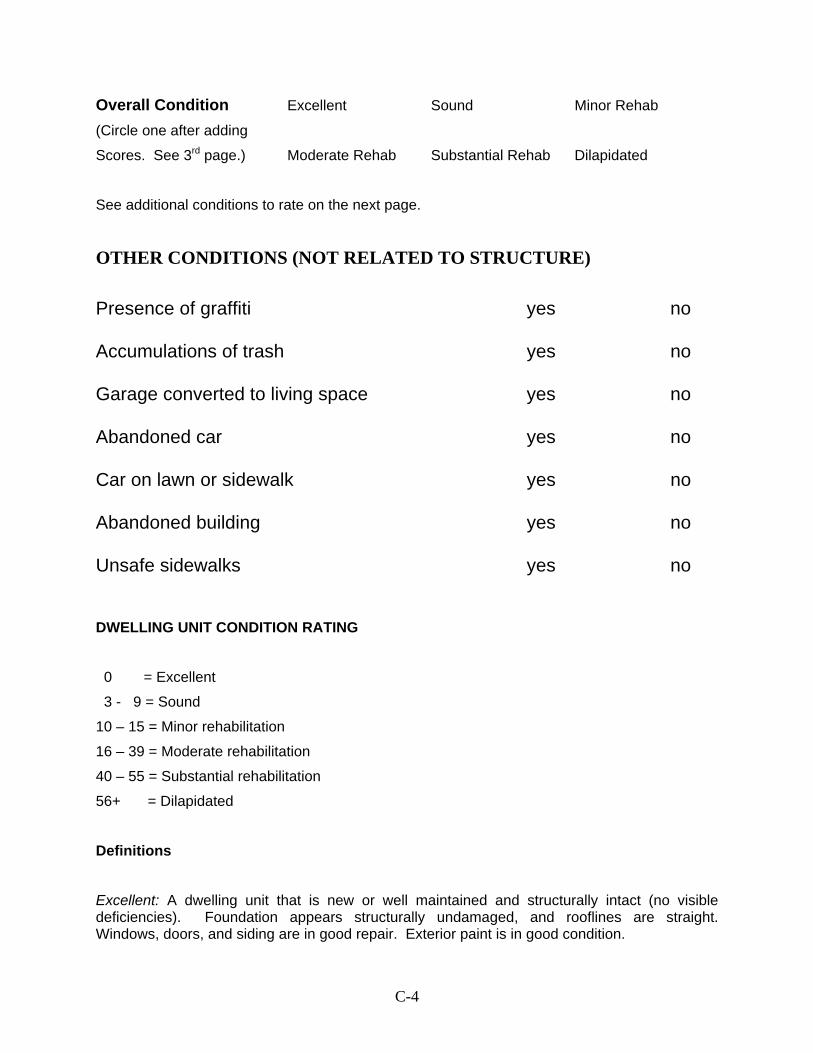
C-4
Overall Condition Excellent Sound Minor Rehab
(Circle one after adding
Scores. See 3rd page.) Moderate Rehab Substantial Rehab Dilapidated
See additional conditions to rate on the next page.
OTHER CONDITIONS (NOT RELATED TO STRUCTURE) Presence of graffiti yes no Accumulations of trash yes no Garage converted to living space yes no Abandoned car yes no Car on lawn or sidewalk yes no Abandoned building yes no Unsafe sidewalks yes no
DWELLING UNIT CONDITION RATING 0 = Excellent
3 - 9 = Sound
10 – 15 = Minor rehabilitation
16 – 39 = Moderate rehabilitation
40 – 55 = Substantial rehabilitation
56+ = Dilapidated
Definitions
Excellent: A dwelling unit that is new or well maintained and structurally intact (no visible deficiencies). Foundation appears structurally undamaged, and rooflines are straight. Windows, doors, and siding are in good repair. Exterior paint is in good condition.
C-5
Sound: A dwelling unit that requires minor deferred maintenance, such repainting, window repairs, the replacement of a few shingles on the roof, or the repair of cracks in the foundation.
Minor Rehabilitation: A dwelling unit that shows signs of multiple instances of deferred maintenance, or that requires the repair of one major component.
Moderate Rehabilitation: A dwelling unit that requires multiple repairs and the replacement of a major component.
Substantial Rehabilitation: A dwelling unit that requires the repair or replacement of all exterior components.
Dilapidated: A dwelling unit that suffers from excessive neglect, appears structurally unsound and not safe for human habitation, and may not be feasible to rehabilitate.
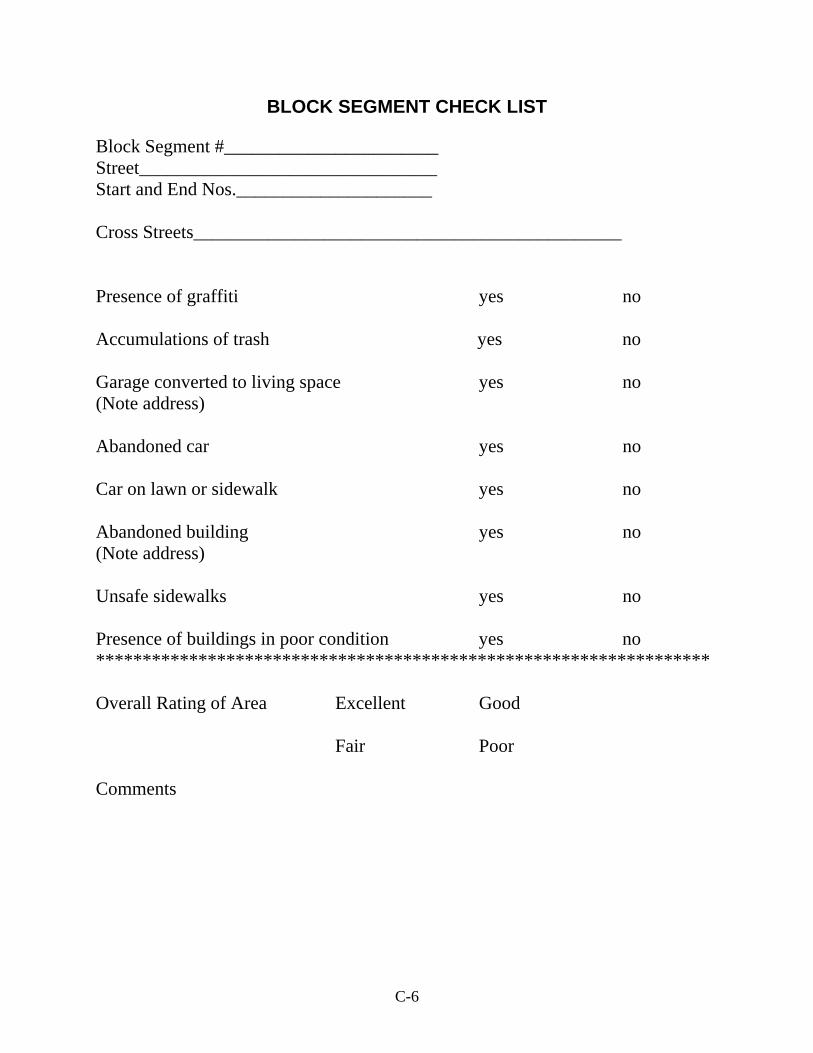
C-6
BLOCK SEGMENT CHECK LIST
Block Segment #_______________________ Street________________________________ Start and End Nos._____________________ Cross Streets______________________________________________ Presence of graffiti yes no Accumulations of trash yes no Garage converted to living space yes no (Note address) Abandoned car yes no Car on lawn or sidewalk yes no Abandoned building yes no (Note address) Unsafe sidewalks yes no Presence of buildings in poor condition yes no ****************************************************************** Overall Rating of Area Excellent Good Fair Poor Comments
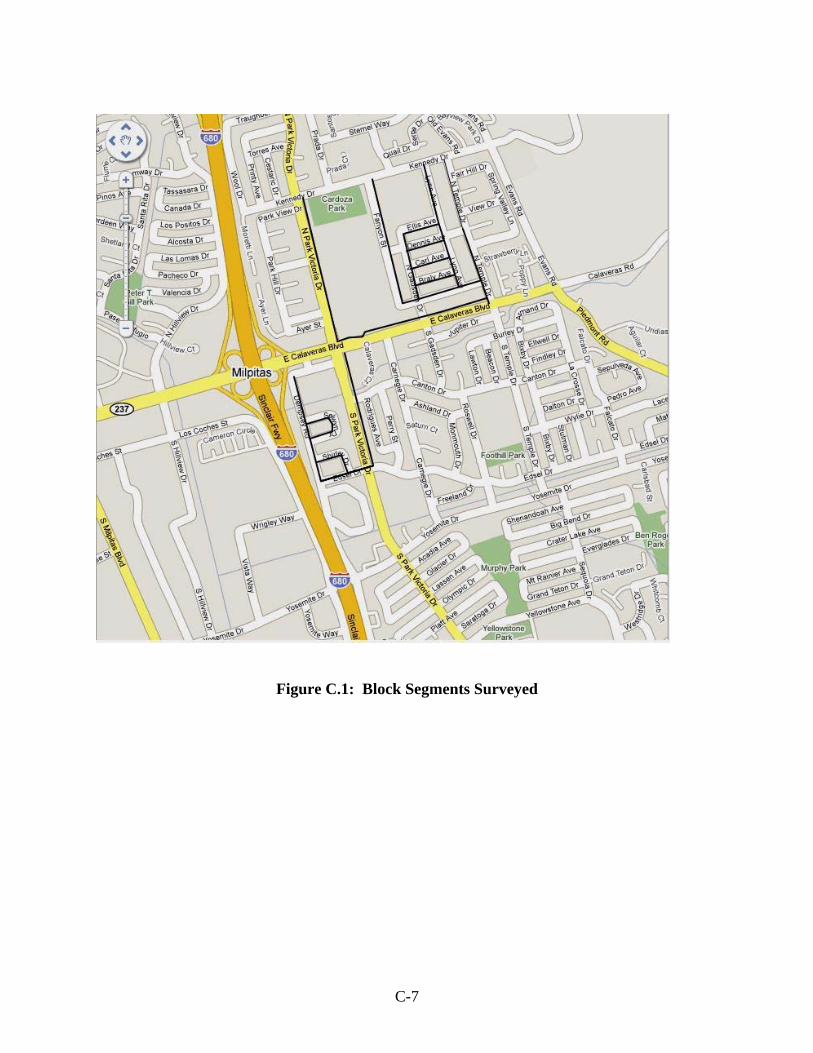
C-7
Figure C.1: Block Segments Surveyed
D-1
APPENDIX D: GLOSSARY OF TERMS
Acre: A unit of land measure equal to 43,560 square feet.
Affordability Restrictions: A property title agreement which places resale or rental restrictions on a housing unit.
Affordable Housing: Under state and federal statutes, housing which costs no more than 30 to 35 percent of gross household income. Housing costs can be defined differently for renters and includes include rent and utilities. Costs for homeowners include mortgage payments and may also include utilities, taxes, insurance, homeowner association fees, and related costs.
Assisted Housing: Housing that has received subsidies (such as low interest loans, density bonuses, direct financial assistance, etc.) by federal, state, or local housing programs in exchange for restrictions requiring a certain number of housing units to be affordable to very low, low, and moderate income households.
Association of Bay Area Governments (ABAG): The regional government agency authorized by the federal and state government to address regional planning issues in the nine Bay Area Counties.
At-Risk Housing: Assisted rental housing that is at risk of losing its status as housing affordable for very low-, low-, and moderate-income residents due to the expiration of federal, state or local agreements.
California Department of Housing and Community Development - HCD: The state department responsible for administering State-sponsored housing programs and for reviewing housing elements to determine compliance with State housing law.
Census: The official decennial enumeration of the population conducted by the federal government.
Community Development Block Grant (CDBG): A grant program administered by the U.S. Department of Housing and Urban Development (HUD). This program allots money to cities and counties for housing rehabilitation and community development activities, including public facilities and economic development. Condominium: A building or group of buildings in which units are owned individually, but the structure, common areas and facilities are owned by all owners on a proportional, undivided
D-2
basis.
Density: The number of dwelling units per unit of land. Density usually is expressed “per acre,” e.g., a development with 100 units located on 20 acres has density of 5.0 units per acre.
Density Bonus: The allowance of additional residential units beyond the maximum for which the parcel is otherwise permitted usually in exchange for the provision of affordable housing units at the same site.
Development Impact Fees: A fee or charge imposed on developers to pay for a jurisdiction’s costs of providing services to new development.
Dwelling Unit: One or more rooms, designed, occupied or intended for occupancy as separate living quarters, with cooking, sleeping and sanitary facilities provided within the unit for the exclusive use of a household.
Dwelling, Multifamily: A building containing two or more dwelling units for the use of individual households; an apartment or condominium building is an example of this dwelling unit type.
Dwelling, Single family Attached: A one-family dwelling attached to one or more other one-family dwellings by a common vertical wall. Row houses and town homes are examples of this dwelling unit type.
Dwelling, Single-family Detached: A dwelling, not attached to any other dwelling, which is designed for and occupied by not more than one family and is surrounded by open space or yards.
Elderly Household: Elderly households are (family or non-family) households in which the head is age 65 or older. Elderly households may also be referred to as senior households.
Emergency Shelter: An emergency shelter is a facility that provides shelter to homeless families and/or homeless individuals on a limited short-term basis.
Fair Market Rent (FMR): Fair Market Rents (FMRs) are freely set rental rates defined by HUD as the median gross rents charged for available standard units in a county or Standard Metropolitan Statistical Area (SMSA). Fair Market Rents are used for the Section 8 Rental Program and other HUD programs.
First-Time Home Buyer: Defined by HUD as an individual or family who has not owned a home during the three-year period preceding the purchase of a home. Jurisdictions may adopt
D-3
local definitions for first-time home buyer programs which differ from non-federally funded programs.
General Plan: The General Plan is a legal document, adopted by the legislative body of a City or County, setting forth policies regarding long-term development. California law requires the preparation of seven elements or chapters in the General Plan: Land Use, Housing, Circulation, Conservation, Open Space, Noise, and Safety.
Group Quarters: A facility which houses groups of unrelated persons not living in households (U.S. Census definition). Examples of group quarters include institutions, dormitories, shelters, military quarters, assisted living facilities and other quarters, including single-room occupancy
HOME Program: The HOME Investment Partnership Act, Title II of the National Affordable Housing Act of 1990 is a Federal program administered by HUD which provides formula grants to States and localities to fund activities that build, buy, and/or rehabilitate affordable housing for rent or home ownership or provide direct rental assistance to low-income people.
Homeless: Unsheltered homeless are families and individuals whose primary nighttime residence is a public or private place not designed for, or ordinarily used as, a regular sleeping accommodation for human beings (e.g., the street, sidewalks, cars, vacant and abandoned buildings). Sheltered homeless are families and persons whose primary nighttime residence is a supervised publicly or privately operated shelter (e.g., emergency, transitional, battered women, and homeless youth shelters; and commercial hotels or motels used to house the homeless).
Household: The US Census Bureau defines a household as all persons living in a housing unit whether or not they are related. A single person living in an apartment as well as a family living in a house is considered a household. Households do not include individuals living in dormitories, prisons, convalescent homes, or other group quarters.
Household Income: The total income of all the persons living in a household. Household income is commonly grouped into income categories based upon household size, and income, relative to the regional median family income. The following categories are used in the Housing Element:
Extremely Low-: Households earning less than 30% of County median family income Very Low-: Households earning less than 50% of County median family income Low-: Households earning 51% to 80% of the County median family income Moderate-: Households earning 81% to 120% of County median family income Above Moderate-: Households earning above 120% of County median family income
D-4
Housing Subsidy: Housing subsidies refer to government assistance aimed at reducing housing sales or rent prices to more affordable levels.
Housing Unit: A room or group of rooms used by one or more individuals living separately from others in the structure, with direct access to the outside or to a public hall and containing separate toilet and kitchen facilities.
Large Household: A household with 5 or more members.
Manufactured Housing: Housing that is constructed of manufactured components, assembled partly at the site rather than totally at the site. Also referred to as modular housing.
Market-Rate Housing: Housing which is available on the open market without any subsidy. The price for housing is determined by the market forces of supply and demand and varies by location.
Median Income: The annual income for each household size within a region which is defined annually by HUD. Half of the households in the region have incomes above the median and half have incomes below the median.
Mobile Home: A structure, transportable in one or more sections, which is at least 8 feet in width and 32 feet in length, is built on a permanent chassis and designed to be used as a dwelling unit when connected to the required utilities, either with or without a permanent foundation.
Overcrowding: As defined by the U.S. Census, a household with greater than 1.01 persons per room, excluding bathrooms, kitchens, hallways, and porches. Severe overcrowding is defined as households with greater than 1.51 persons per room.
Overpayment or Cost Burden: The extent to which gross housing costs, including utility costs, exceed 30 percent of gross household income, based on data published by the U.S. Census Bureau. Severe overpayment, or cost burden, exists if gross housing costs exceed 50 percent of gross income.
Parcel: The basic unit of land entitlement. A designated area of land established by plat, subdivision, or otherwise legally defined and permitted to be used, or built upon.
Redevelopment Agency: California Community Redevelopment Law provides authority to establish a Redevelopment Agency with the scope and financing mechanisms necessary to remedy blight and provide stimulus to eliminate deteriorated conditions. The law provides for the planning, development, redesign, clearance, reconstruction, or rehabilitation, or any
D-5
combination of these, and the provision of public and private improvements as may be appropriate or necessary in the interest of the general welfare by the Agency. Redevelopment law requires an Agency to set aside 20 percent of all tax increment dollars generated from each redevelopment project area for the purpose of increasing and improving the community’s supply of housing for low- and moderate-income households.
Regional Housing Needs Assessment Plan (RHNA): The Regional Housing Needs Assessment is based on the share of the region’s future housing need that is assigned to each jurisdiction within the ABAG area. These housing needs numbers serve as the basis for the update of the Housing Element.
Rehabilitation: The upgrading of a building previously in a dilapidated or substandard condition for human habitation or use.
Second Unit: A dwelling unit accessory to a main single-family dwelling on a parcel of land and which meets the requirements of XI-10-13.08 of the Zoning Ordinance.
Section 8 Rental Voucher/Certificate Program: A tenant-based rental assistance program that subsidizes a family’s rent in a privately owned house or apartment. The program is administered by Santa Clara County Housing Authority for Milpitas residents. Assistance payments are based on 30 percent of household annual income. Households with incomes of 50 percent or below the area median income are eligible to participate in the program.
Service Needs: The particular services required by special populations, typically including needs such as transportation, personal care, housekeeping, counseling, meals, case management, personal emergency response, and other services preventing premature institutionalization and assisting individuals to continue living independently.
Single Room Occupancy (SRO): A SRO is a cluster of residential units of a smaller size than normally found in multiple dwellings within a residential hotel, motel, or facility providing sleeping or living facilities in which sanitary facilities may be provided within the unit and/or shared, and kitchen or cooking facilities may be provided within the unit or shared within the housing project.
Special Needs Groups: Those segments of the population which have a more difficult time finding decent affordable housing due to special circumstances. Under California Housing Element statutes, these special needs groups consist of the elderly, people with disabilities, large families with five or more members, female-headed households with children, farmworkers and the homeless.
D-6
Specific Plan: A specific plan covers a defined portion of a jurisdiction and is incorporated into the City’s General Plan. Detailed information regarding design guidelines and implementation steps may be included in a Specific Plan. The City of Milpitas has adopted two Specific Plans – one for the Midtown Area and a second for the Transit Area.
Substandard Housing: Housing which does not meet the minimum standards in State Housing Code. Jurisdictions may adopt more stringent local definitions of substandard housing. Substandard units which are structurally sound and for which the cost of rehabilitation is economically warranted are considered suitable for rehabilitation. Substandard units which are structurally unsound and for which the cost of rehabilitation is considered infeasible are considered in need of replacement.
Supportive Housing: Housing with a supporting environment, such as group homes or single room occupancy (SRO) housing and other housing that includes a supportive service component such as those defined below.
Supportive Services: Services provided to residents of supportive housing for the purpose of facilitating the independence of residents. Some examples are case management, medical or psychological counseling and supervision, child care, transportation, and job training.
Transitional Housing: Transitional housing is temporary (often six months to two years) housing for a homeless individual or family who is transitioning to permanent housing. Transitional housing often includes a supportive services component (e.g. job skills training, rehabilitation counseling, etc.) to allow individuals to gain necessary life skills in support of independent living.
U.S. Department of Housing and Urban Development (HUD): The cabinet level department of the federal government responsible for housing, housing assistance, and urban development at the national level. Housing programs administered through HUD include Community Development Block Grant (CDBG), HOME and Section 8, among others.
Zoning: A land use regulatory measure enacted by local government. Zoning district regulations governing lot size, building bulk, placement, and other development standards vary from district to district, but must be uniform within the same district. Each city and county adopts a zoning ordinance specifying these regulations.
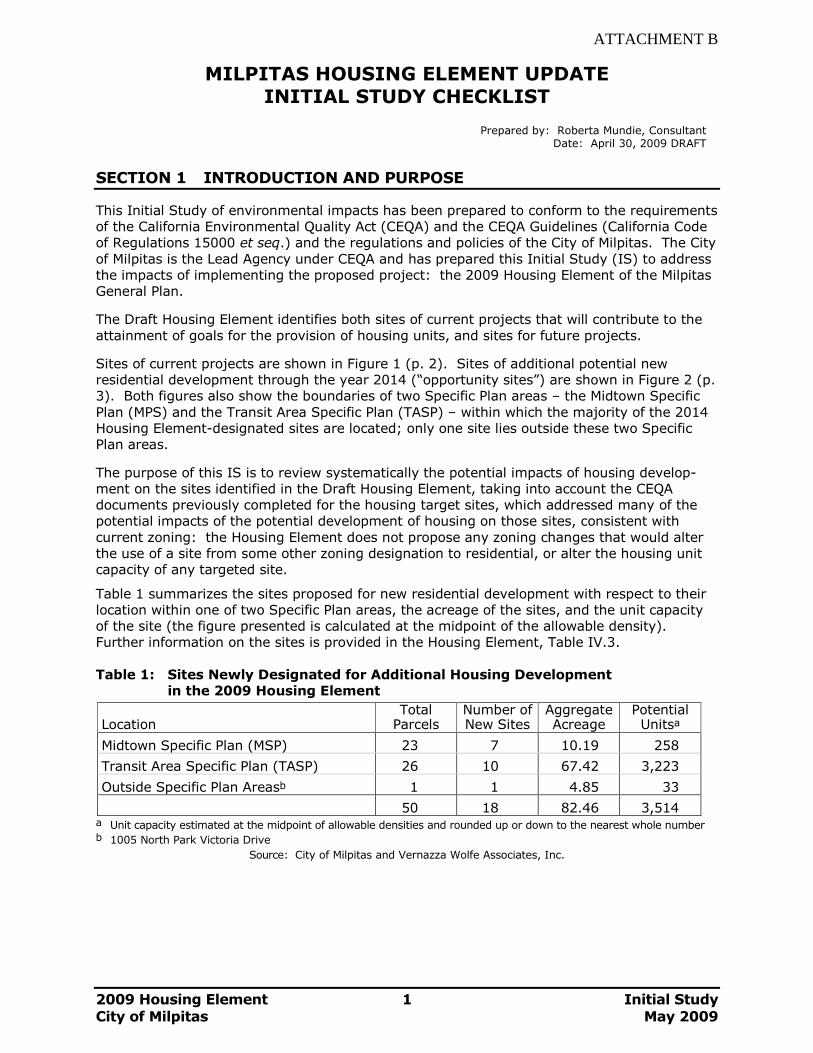
2009 Housing Element 1 Initial Study
City of Milpitas May 2009
MILPITAS HOUSING ELEMENT UPDATE INITIAL STUDY CHECKLIST
Prepared by: Roberta Mundie, Consultant
Date: April 30, 2009 DRAFT
SECTION 1 INTRODUCTION AND PURPOSE
This Initial Study of environmental impacts has been prepared to conform to the requirements
of the California Environmental Quality Act (CEQA) and the CEQA Guidelines (California Code
of Regulations 15000 et seq.) and the regulations and policies of the City of Milpitas. The City
of Milpitas is the Lead Agency under CEQA and has prepared this Initial Study (IS) to address
the impacts of implementing the proposed project: the 2009 Housing Element of the Milpitas
General Plan.
The Draft Housing Element identifies both sites of current projects that will contribute to the
attainment of goals for the provision of housing units, and sites for future projects.
Sites of current projects are shown in Figure 1 (p. 2). Sites of additional potential new
residential development through the year 2014 (“opportunity sites”) are shown in Figure 2 (p.
3). Both figures also show the boundaries of two Specific Plan areas – the Midtown Specific
Plan (MPS) and the Transit Area Specific Plan (TASP) – within which the majority of the 2014
Housing Element-designated sites are located; only one site lies outside these two Specific
Plan areas.
The purpose of this IS is to review systematically the potential impacts of housing develop-
ment on the sites identified in the Draft Housing Element, taking into account the CEQA
documents previously completed for the housing target sites, which addressed many of the
potential impacts of the potential development of housing on those sites, consistent with
current zoning: the Housing Element does not propose any zoning changes that would alter
the use of a site from some other zoning designation to residential, or alter the housing unit
capacity of any targeted site.
Table 1 summarizes the sites proposed for new residential development with respect to their
location within one of two Specific Plan areas, the acreage of the sites, and the unit capacity
of the site (the figure presented is calculated at the midpoint of the allowable density).
Further information on the sites is provided in the Housing Element, Table IV.3.
Table 1: Sites Newly Designated for Additional Housing Development
in the 2009 Housing Element
Location
Total Parcels
Number of New Sites
Aggregate Acreage
Potential Unitsa
Midtown Specific Plan (MSP) 23 7 10.19 258
Transit Area Specific Plan (TASP) 26 10 67.42 3,223
Outside Specific Plan Areasb 1 1 4.85 33
50 18 82.46 3,514 a Unit capacity estimated at the midpoint of allowable densities and rounded up or down to the nearest whole number b 1005 North Park Victoria Drive
Source: City of Milpitas and Vernazza Wolfe Associates, Inc.
ATTACHMENT B
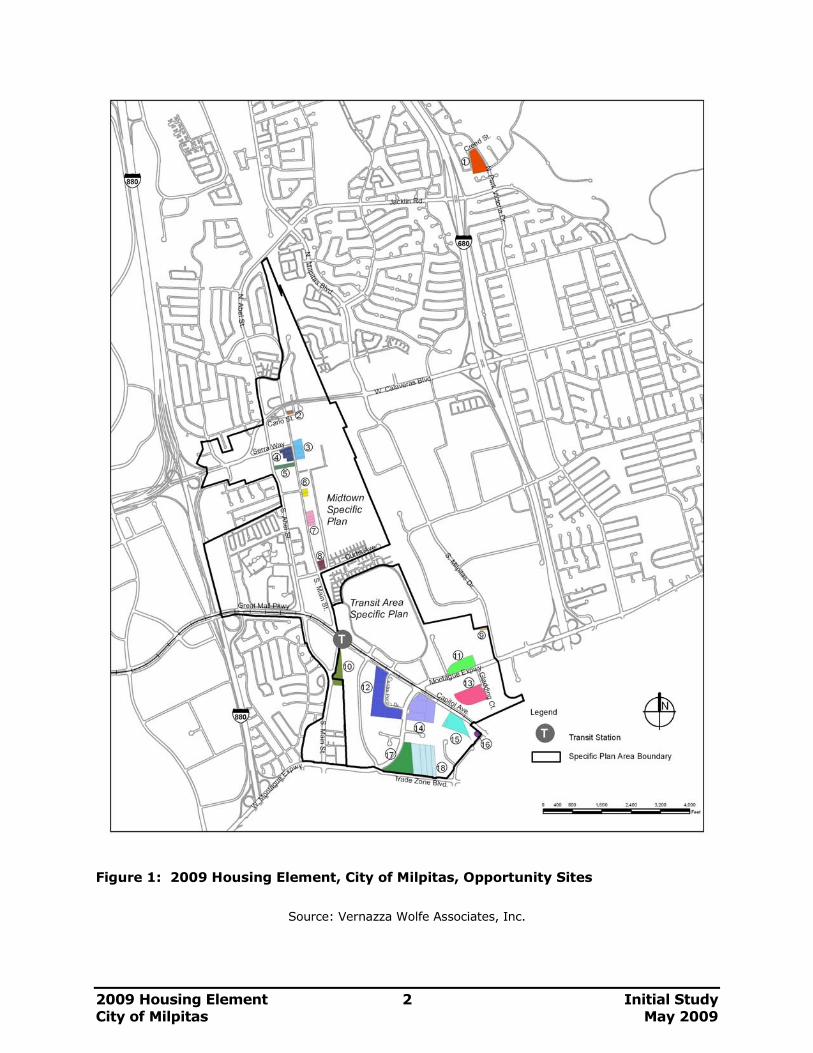
2009 Housing Element 2 Initial Study
City of Milpitas May 2009
Figure 1: 2009 Housing Element, City of Milpitas, Opportunity Sites
Source: Vernazza Wolfe Associates, Inc.
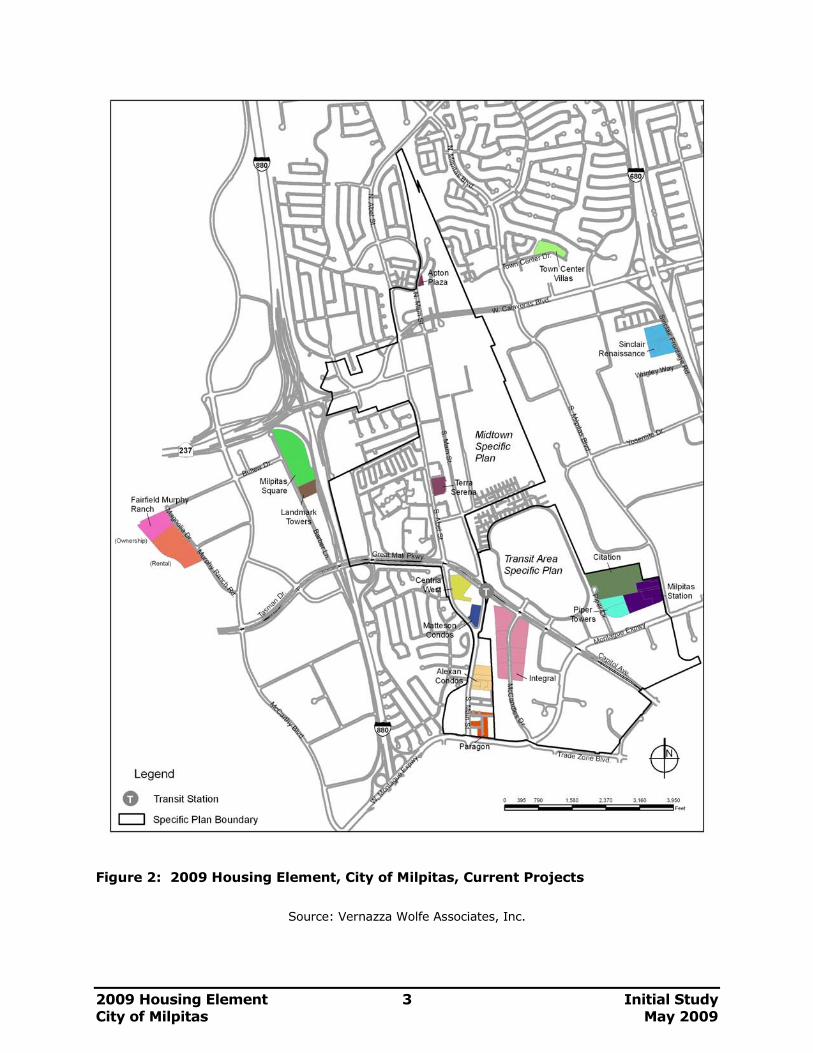
2009 Housing Element 3 Initial Study
City of Milpitas May 2009
Figure 2: 2009 Housing Element, City of Milpitas, Current Projects
Source: Vernazza Wolfe Associates, Inc.
2009 Housing Element 4 Initial Study
City of Milpitas May 2009
Seventeen (17) of the 18 sites designated for additional housing development in the 2009
Housing Element have previously received CEQA review as part of Specific Plans with certified
Environmental Impact Reports (EIRs)1: the Midtown Specific Plan (MSP) EIR and the Transit
Area Specific Plan (TASP) EIR. This earlier CEQA coverage is described in Section 3.4 (p. 8)
below. The record of prior environmental review enables this IS to “tier off” from the earlier
CEQA documents, which are hereby incorporated by reference. Tiering off the comprehensive
CEQA review of the earlier projects makes evaluations of “no impact” or “less-than-significant
impact” appropriate when supported by the mitigation recommendations and findings of the
earlier documents.
The site outside the two Specific Plan areas proposed for additional housing development
under the 2009 Housing Element was previously subject to CEQA review in the course of a
rezoning.2 The review was documented in an Environmental Impact Assessment (EIA) that
served as the basis for publication of a Negative Declaration. The EIA addressed a 30-unit
project, specifying that “If a new project with more than 30 units were to be proposed at a
later date, additional environmental review may be required to further analyze impacts such
as traffic, geology, water, sewer, and schools.” As shown in Table 1, it is possible that more
than 30 units may be proposed for this site (Table 1 provides a figure of 33); therefore,
review of any application for this site will include consideration of whether additional
environmental review should be required.
SECTION 2 PROJECT INFORMATION
2.1 PROJECT TITLE General Plan Amendment No. 09-002
2.2 PROJECT LOCATION
The project boundaries are coterminous with the Milpitas Planning Area, and include the
City of Milpitas and the unincorporated Milpitas sphere of influence. Milpitas encom-
passes 13.63 square miles and is located in northern Santa Clara County, California. It
is adjoined on the north by Fremont, on the south and west by San Jose, and on the
east by steeply sloping lands in unincorporated Santa Clara County. Milpitas is bisected
north-to-south by Interstates 680 and 880 and west-to-east by State Highway 237.
2.3 LEAD AGENCY NAME AND ADDRESS
City of Milpitas, 455 East Calaveras Blvd. Milpitas, CA 95035
2.4 PROJECT SPONSOR'S NAME AND ADDRESS
Same as Lead Agency
2.5 CONTACT PERSON
Felix Reliford, Principal Housing Planner, 408-586-3071
2.6 GENERAL PLAN AND ZONING DESIGNATIONS
Various, as the project includes the entire area covered by the Milpitas General Plan and
the Milpitas Zoning Map.
1 Midtown Milpitas Specific Plan EIR, certified March 19, 2002; Transit Area Specific Plan EIR, certified June 3, 2008. 2 The site at 1005 North Park Victoria Drive was reviewed in an Initial Study at the time the property was
zoned/rezoned and annexed to the City of Milpitas (August 28, 1990). Environmental Impact Analysis No. 554 provided the foundation for the Negative Declaration adopted by the City Council in 1990.
2009 Housing Element 5 Initial Study
City of Milpitas May 2009
SECTION 3 PROJECT DESCRIPTION
3.1 DESCRIPTION OF PROJECT
The project, General Plan Amendment No. 09-0002, is the updated Housing Element of
the Milpitas General Plan. The new Element would replace the 2002 Housing Element,
establishing updated policies and programs relating to housing construction, preserva-
tion, and affordability. Completion of this update is required by State law.
The Element must show that the City can accommodate its fair share of the region's
housing needs over the duration of this Housing Element update. Milpitas' fair share
“assignment” for the 2007-2014 period, as determined by ABAG, is 2,487 units. As of
March 2009, 681 units are under construction, another 2,310 units have been approved,
and 3,283 units are in the planning process. These units surpass the RHNA numbers by
3,787 units. However, since the majority of units in the pipeline are market rate, the
City has identified additional sites to accommodate the unmet need of approximately
969 affordable units.
The major components of the Housing Element are a Needs Assessment, an Analysis of
Constraints and Resources, and a Housing Plan. The Needs Assessment describes
housing, economic and demographic conditions in Milpitas to assess the demand for
housing for various income groups and persons with special needs. The Constraints and
Resources Analysis identifies (a) potential constraints to housing production in the City
(such as zoning standards), (b) potential sites for new housing construction, and (c)
resources available to encourage affordable housing development on the identified sites.
This analysis indicates that the City has sufficient land to accommodate its fair share
assignment, but must take a number of actions to facilitate construction.
The majority of the City's housing sites are in the Midtown Milpitas Specific Plan (MSP)
and the Transit Area Specific Plan (TASP) areas. These two plan areas cover approxi-
mately 1,000 acres in south central Milpitas. Their Specific Plans, adopted in 2002 and
2008, respectively, promote the construction of high-density housing on former com-
mercial and industrial sites near light rail stations and a future BART station. The
Specific Plans facilitate redevelopment through land use designation changes, public and
private improvements, urban design recommendations and development standards, and
a development strategy.
Over 6,300 new housing units that are under construction or in the pipeline have been
identified in the Housing Element. Because the City's current housing capacity substan-
tially exceeds its fair share assignment, no changes to the City's General Plan Map or
Zoning Map to increase the number of allowable units in the City are proposed. In other
words, adoption of the Housing Element will not change allowable densities or
development entitlements on any site in the City. While some zoning changes are
proposed, these changes will not result in the need to increase General Plan buildout.
The Housing Plan includes guiding principles, quantified objectives for the next five
years, and specific recommendations for implementation. Major components of the
Housing Plan are summarized in the boxed section below.
Provision of Adequate Sites for Housing Development
The guiding principle is to maintain adequate sites to accommodate the City’s share of
regional housing needs.
Actions include:
� Facilitating land acquisition and site assembly.
� Considering land use redesignations if they are needed.
2009 Housing Element 6 Initial Study
City of Milpitas May 2009
Housing & Neighborhood Conservation
The guiding principles are to maintain high quality residential environments and to maintain
and preserve existing housing resources, including both affordable and market rate units.
Actions include:
� Continuing to enforce housing codes and regulations.
� Assisting any household displaced through code enforcement activities to relocate.
� Continuing to provide assistance for the rehabilitation of affordable housing units.
� Adopting and operating a Lift Zone Program.
� Continuing to provide CDBG funds to Rebuilding Together.
� Monitoring the need to replace infrastructure as needed.
� Collaborating with other public and private entities to preserve affordable housing.
� Maintaining the existing stock of affordable housing provided through the private market.
� Providing protections for tenants living in units at risk of condominium conversion.
� Administering a mobile home rent control ordinance.
New Housing Production
The guiding principle is to facilitate new housing production.
Actions include:
� Continuing to facilitate housing production.
� Continuing to address public infrastructure constraints to housing production where
feasible.
Housing Diversity and Affordability
The guiding principles are to expand the number of new affordable housing units, support
housing for persons with special needs, and support diversity and creativity in housing
development.
Actions include:
� Targeting the provision of at least 20 percent affordable units within new multifamily
residential projects.
� Providing density bonuses and other incentives for projects which provide affordable
units.
� Assisting developers pay for development fees for housing developments that provide
low-income units.
� Promoting the ability of lower- and moderate-income households to become
homeowners.
� Facilitating the development of emergency and transitional housing through financial
and/or other incentives.
� Continuing to improve housing opportunities for disabled households in Milpitas.
� Continuing to encourage developers to provide new units that meet the needs of both
very small and large households.
� Conveying to the community that affordable housing can be an essential resource for
long-time Milpitas residents and workers.
� Supporting housing alternatives, such as live/work lofts and manufactured housing.
� Modifying the Zoning Ordinance to permit manufactured housing in R1 zones
� Supporting the inclusion of space for child care facilities in new residential
developments.
2009 Housing Element 7 Initial Study
City of Milpitas May 2009
Fair Housing
The guiding principle is to eliminate housing discrimination.
Actions include:
� Working with appropriate local, state, and federal agencies to advocate on behalf of local
households on discrimination issues.
� Implementing ordinances and policies prohibiting discrimination.
� Implementing actions to address problems identified in the Analysis of Impediments to
Fair Housing.
� Distributing information on fair housing laws.
� Funding agencies to advocate for Milpitas households.
Energy Conservation
The guiding principle is to reduce household energy costs by promoting energy efficiency and
weatherization
Actions include:
� Partnering with local utilities to promote energy efficiency and home retrofits
� Incorporating energy-saving principles in the design and planning of new residential
development
� Promoting use of passive solar devices and energy audits.
� Adopting a Green Building Ordinance.
� Encouraging mixed-use and transit-oriented development at transit nodes.
� Requiring planning applications for new buildings to include a completed LEED or
GreenPoint Rated checklist.
Government Constraints
The guiding principle is to remove government constraints to the production of special needs
housing.
Actions include:
� Continuing to enforce land use policies and development standards that facilitate
affordable housing production.
� Modifying the Zoning Ordinance to identify zones for homeless shelters, transitional
housing, permanent supportive housing, and farmworker housing, as land uses “by
right.”
� Modifying the Zoning Ordinance to identify zones for SRO Developments as a “by right”
land use.
3.2 SURROUNDING LAND USES AND SETTING:
Milpitas includes a variety of residential, commercial, industrial, public, and open space
land uses. Residential areas are located primarily east of Interstate 880 in the northern
and eastern parts of the City. Industrial uses are located primarily in the southern part
of the City and in the area west of Interstate 880. Commercial uses are located along
major thoroughfares, around major freeway interchanges, and at the Great Mall, the
largest regional shopping mall in the Bay Area.
While land uses in most of the City are stable, the Specific Plan areas are in transition
from trucking and industrial areas to mixed use areas, including offices, high-tech
industry, high-density housing, and retail uses.
2009 Housing Element 8 Initial Study
City of Milpitas May 2009
Land to the north and south of the City is urbanized and includes a mix of residential
and industrial uses. Land to the west includes some urbanized industrial and institu-
tional land in San Jose, the regional wastewater plant, and wetlands associated with San
Francisco Bay. Land to the east is primarily open space and includes foothills of the
Diablo Range.
3.3 PREVIOUS CEQA REVIEW OF 2009 HOUSING ELEMENT SITES:
The Housing Element as a whole is a project that formalizes the City’s commitment to
providing housing, that documents its capacity to provide its “fair share” of regional
housing as is required under State law, and that lays out strategies and programs to
assure that housing goals will be met. For Milpitas, housing development is part of the
vision of a community growing in ways that, over time, provide greater access to transit,
reduce automobile dependence, and improve air quality as compared with less urban,
more dispersed residential development patterns.
These considerations form the basis of the Transit Area Specific Plan approved by
Milpitas in 2008. A significant proportion of the sites designated for housing under the
2009 Housing Element – nearly 92 percent – are located in the TASP area. This is an
area of central Milpitas in transition to housing from previous industrial and commercial
uses: a new community of urban, higher-density residential uses in a transit-rich
environment that includes two light rail stations, a future BART station, and numerous
bus routes.
Most of the balance of the 2009 Housing Element sites – about 7 percent – are located
in the adjacent Midtown Specific Plan area, and the rest – less than 1 percent – at a
peripheral site (1005 North Park Victoria Drive). The latter site, in common with the
sites in the two Specific Plan areas, is also located within Milpitas’s urbanized area and it
is also a reuse site.
All of these sites have been subject to previous CEQA review including identification and
mitigation of impacts.
The previous CEQA documents on the previous Specific Plan projects describe a
mitigation framework for many impacts that has been established through Milpitas’s
General Plan and through policies and programs that make the Specific Plans largely
self-mitigating. For some impacts, however, full mitigation was not found to be feasible.
In the TASP, significant and unavoidable impacts were identified that Milpitas cannot
feasibly implement: congestion on certain road segments and at certain intersections
and exceedances of some population-based and vehicle-miles-traveled-based air quality
standards.
Recognizing the fact that most but not all of the significant effects identified in the TASP
EIR could be substantially mitigated, and acting on its belief that the unavoidable
environmental effects identified in the EIR will be substantially lessened by the policies
and regulations incorporated into the TASP project, the Milpitas City Council made a
Statement of Overriding Considerations (SOC), having determined that the unavoidable
impacts would be outweighed by the housing, social, environmental, economic, and
other benefits of the project.
Because the vast majority of the housing sites designated in the 2009 Housing Element
are within the TASP and covered by that EIR, they are also covered by the Statement of
Overriding Considerations.
For the earlier Midtown Specific Plan, the Milpitas City Council also recognized unavoid-
able adverse impacts and also found that those impacts would be outweighed by the
need of the City’ to implement long-range planning for the Midtown area, including a
2009 Housing Element 9 Initial Study
City of Milpitas May 2009
mixed-use community with transit oriented housing, a central community gathering
place, and industrial and commercial uses.
Both Statements of Overriding Considerations articulate the substantial benefits to the
City resulting from the Specific Plan, and both SOCs are available for public review,
together with their Draft and Final EIRs, as described on p. 42 of this Initial Study.
These self-mitigating Specific Plans, accompanied by determinations on the part of the
City that remaining unavoidable impacts were outweighed by important benefits to the
City of Milpitas, provide full CEQA coverage for more than 99 percent of the 2009
Housing Element sites identified in Table 1.
This Initial Study reviews the CEQA topics individually, providing a systematic summary
of the setting and review of the potential impacts and their mitigation. As described
below, the 2009 Housing Element results in no potential significant impacts that have
not already been addressed by one or more of the previous CEQA documents, or (in a
small number of instances) it would result in a small number of potential impacts that
would be pre-mitigated as provided for in Chapter IV.C of the Housing Element itself.
3.4 OTHER PUBLIC AGENCIES WHOSE APPROVAL IS REQUIRED (e.g., permits, financing approval, or participation agreement)
California Department of Housing and Community Development
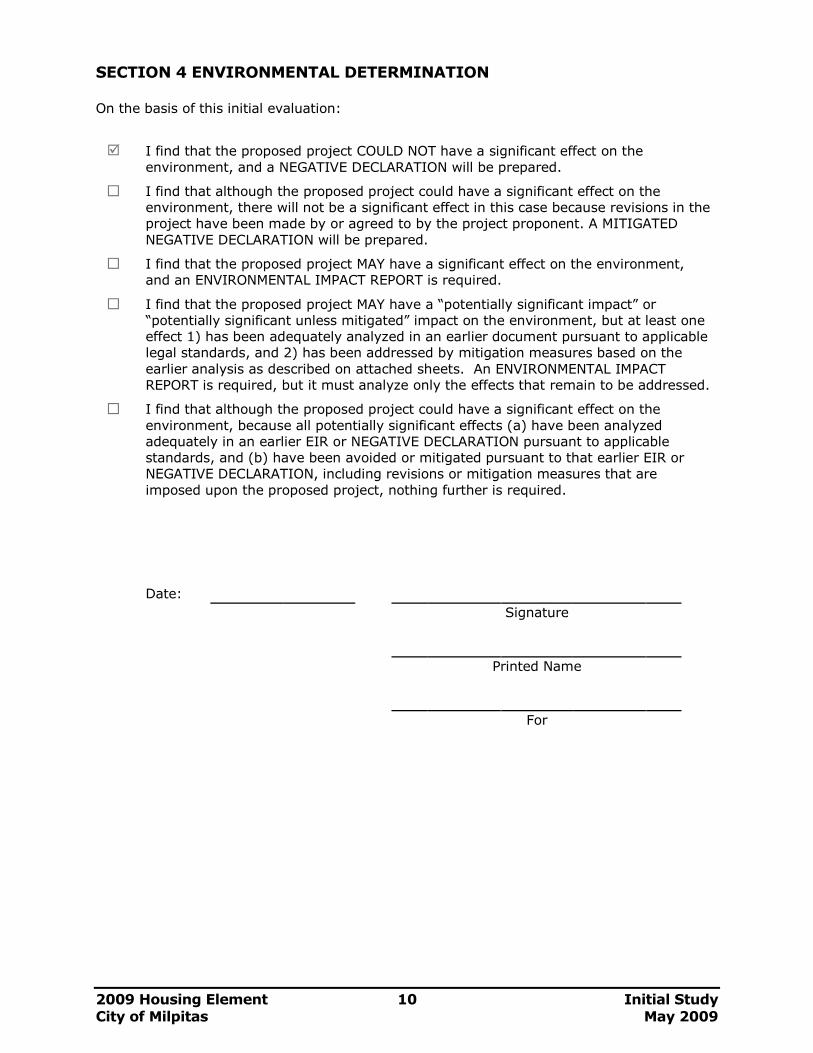
2009 Housing Element 10 Initial Study
City of Milpitas May 2009
SECTION 4 ENVIRONMENTAL DETERMINATION On the basis of this initial evaluation:
� I find that the proposed project COULD NOT have a significant effect on the
environment, and a NEGATIVE DECLARATION will be prepared.
� I find that although the proposed project could have a significant effect on the
environment, there will not be a significant effect in this case because revisions in the
project have been made by or agreed to by the project proponent. A MITIGATED
NEGATIVE DECLARATION will be prepared.
� I find that the proposed project MAY have a significant effect on the environment,
and an ENVIRONMENTAL IMPACT REPORT is required.
� I find that the proposed project MAY have a “potentially significant impact” or
“potentially significant unless mitigated” impact on the environment, but at least one
effect 1) has been adequately analyzed in an earlier document pursuant to applicable
legal standards, and 2) has been addressed by mitigation measures based on the
earlier analysis as described on attached sheets. An ENVIRONMENTAL IMPACT
REPORT is required, but it must analyze only the effects that remain to be addressed.
� I find that although the proposed project could have a significant effect on the
environment, because all potentially significant effects (a) have been analyzed
adequately in an earlier EIR or NEGATIVE DECLARATION pursuant to applicable
standards, and (b) have been avoided or mitigated pursuant to that earlier EIR or
NEGATIVE DECLARATION, including revisions or mitigation measures that are
imposed upon the proposed project, nothing further is required.
Date:
Signature
Printed Name
For
2009 Housing Element 11 Initial Study
City of Milpitas May 2009
SECTION 5 ENVIRONMENTAL CHECKLIST AND DISCUSSION OF IMPACTS
5.1 ENVIRONMENTAL FACTORS POTENTIALLY AFFECTED – CHECKLIST SUMMARY
The environmental factors checked below would be potentially affected by this project,
involving at least one impact that is a “Potentially Significant Impact” as indicated by the
checklist on the following pages.
� Aesthetics � Agricultural Resources � Air Quality
� Biological Resources � Cultural Resources � Geology / Soils
� Hazards / Hazardous Materials � Hydrology / Water Quality � Land Use / Planning
� Mineral Resources � Noise � Population / Housing
� Public Services � Recreation � Transportation / Traffic
� Utilities / Service Systems � Mandatory Findings of Significance
5.2 ENVIRONMENTAL CHECKLIST
The environmental checklist presented below, as recommended in the California
Environmental Quality Act (CEQA) Guidelines, identifies environmental impacts that
could occur if the proposed project is implemented. The right-hand column in the
checklist lists the source(s) for the answer to each question. The sources cited are
identified at the end of the checklist.
The CEQA topics are listed alphabetically, followed by the responses to the checklist
questions.
Following the checklist is a description of the setting as relevant to that CEQA topic and
a discussion of checklist responses. For responses indicated as “Less Than Significant
With Mitigation Incorporated,” reference is made to previous CEQA documents, incor-
porated by reference, in which mitigation programs have been provided. Additional
mitigation measures are set forth under several topics to extend prior mitigation
programs to include added housing sites.
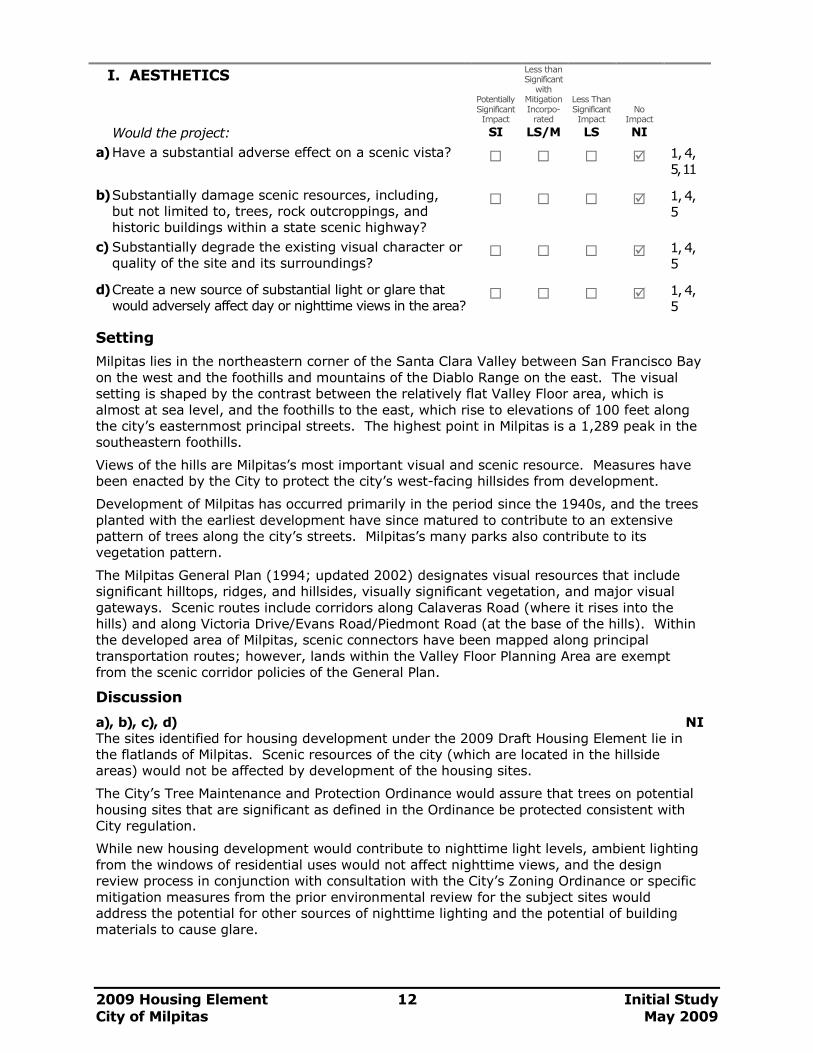
2009 Housing Element 12 Initial Study
City of Milpitas May 2009
I. AESTHETICS
Potentially Significant Impact
Less than Significant with
Mitigation Incorpo-rated
Less Than Significant Impact
No
Impact
Would the project: SI LS/M LS NI
a) Have a substantial adverse effect on a scenic vista? � � � � 1, 4,
5, 11
b) Substantially damage scenic resources, including,
but not limited to, trees, rock outcroppings, and
historic buildings within a state scenic highway?
� � � � 1, 4,
5
c) Substantially degrade the existing visual character or
quality of the site and its surroundings? � � � � 1, 4,
5
d) Create a new source of substantial light or glare that
would adversely affect day or nighttime views in the area? � � � � 1, 4,
5
Setting
Milpitas lies in the northeastern corner of the Santa Clara Valley between San Francisco Bay
on the west and the foothills and mountains of the Diablo Range on the east. The visual
setting is shaped by the contrast between the relatively flat Valley Floor area, which is
almost at sea level, and the foothills to the east, which rise to elevations of 100 feet along
the city’s easternmost principal streets. The highest point in Milpitas is a 1,289 peak in the
southeastern foothills.
Views of the hills are Milpitas’s most important visual and scenic resource. Measures have
been enacted by the City to protect the city’s west-facing hillsides from development.
Development of Milpitas has occurred primarily in the period since the 1940s, and the trees
planted with the earliest development have since matured to contribute to an extensive
pattern of trees along the city’s streets. Milpitas’s many parks also contribute to its
vegetation pattern.
The Milpitas General Plan (1994; updated 2002) designates visual resources that include
significant hilltops, ridges, and hillsides, visually significant vegetation, and major visual
gateways. Scenic routes include corridors along Calaveras Road (where it rises into the
hills) and along Victoria Drive/Evans Road/Piedmont Road (at the base of the hills). Within
the developed area of Milpitas, scenic connectors have been mapped along principal
transportation routes; however, lands within the Valley Floor Planning Area are exempt
from the scenic corridor policies of the General Plan.
Discussion
a), b), c), d) NI
The sites identified for housing development under the 2009 Draft Housing Element lie in
the flatlands of Milpitas. Scenic resources of the city (which are located in the hillside
areas) would not be affected by development of the housing sites.
The City’s Tree Maintenance and Protection Ordinance would assure that trees on potential
housing sites that are significant as defined in the Ordinance be protected consistent with
City regulation.
While new housing development would contribute to nighttime light levels, ambient lighting
from the windows of residential uses would not affect nighttime views, and the design
review process in conjunction with consultation with the City’s Zoning Ordinance or specific
mitigation measures from the prior environmental review for the subject sites would
address the potential for other sources of nighttime lighting and the potential of building
materials to cause glare.
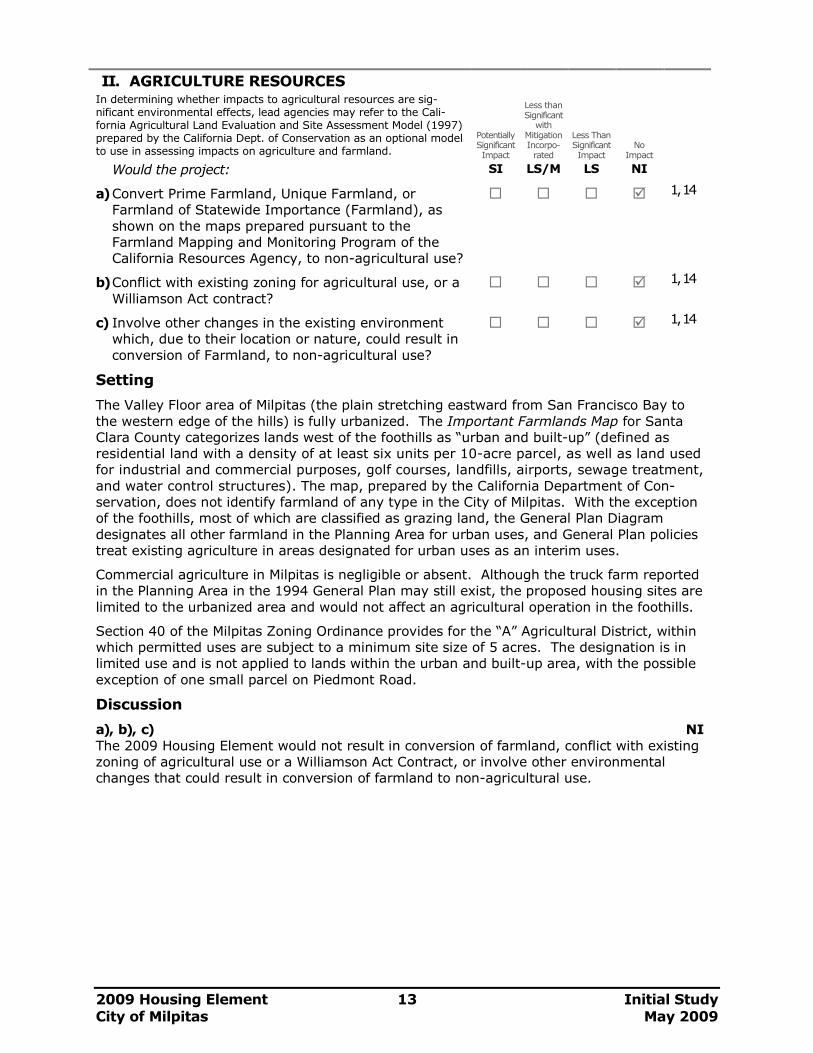
2009 Housing Element 13 Initial Study
City of Milpitas May 2009
II. AGRICULTURE RESOURCES In determining whether impacts to agricultural resources are sig-nificant environmental effects, lead agencies may refer to the Cali-fornia Agricultural Land Evaluation and Site Assessment Model (1997) prepared by the California Dept. of Conservation as an optional model to use in assessing impacts on agriculture and farmland.
Potentially Significant Impact
Less than Significant with
Mitigation Incorpo-rated
Less Than Significant Impact
No
Impact
Would the project: SI LS/M LS NI
a) Convert Prime Farmland, Unique Farmland, or
Farmland of Statewide Importance (Farmland), as
shown on the maps prepared pursuant to the
Farmland Mapping and Monitoring Program of the
California Resources Agency, to non-agricultural use?
� � � � 1, 14
b) Conflict with existing zoning for agricultural use, or a
Williamson Act contract? � � � � 1, 14
c) Involve other changes in the existing environment
which, due to their location or nature, could result in
conversion of Farmland, to non-agricultural use?
� � � � 1, 14
Setting
The Valley Floor area of Milpitas (the plain stretching eastward from San Francisco Bay to
the western edge of the hills) is fully urbanized. The Important Farmlands Map for Santa
Clara County categorizes lands west of the foothills as “urban and built-up” (defined as
residential land with a density of at least six units per 10-acre parcel, as well as land used
for industrial and commercial purposes, golf courses, landfills, airports, sewage treatment,
and water control structures). The map, prepared by the California Department of Con-
servation, does not identify farmland of any type in the City of Milpitas. With the exception
of the foothills, most of which are classified as grazing land, the General Plan Diagram
designates all other farmland in the Planning Area for urban uses, and General Plan policies
treat existing agriculture in areas designated for urban uses as an interim uses.
Commercial agriculture in Milpitas is negligible or absent. Although the truck farm reported
in the Planning Area in the 1994 General Plan may still exist, the proposed housing sites are
limited to the urbanized area and would not affect an agricultural operation in the foothills.
Section 40 of the Milpitas Zoning Ordinance provides for the “A” Agricultural District, within
which permitted uses are subject to a minimum site size of 5 acres. The designation is in
limited use and is not applied to lands within the urban and built-up area, with the possible
exception of one small parcel on Piedmont Road.
Discussion
a), b), c) NI
The 2009 Housing Element would not result in conversion of farmland, conflict with existing
zoning of agricultural use or a Williamson Act Contract, or involve other environmental
changes that could result in conversion of farmland to non-agricultural use.
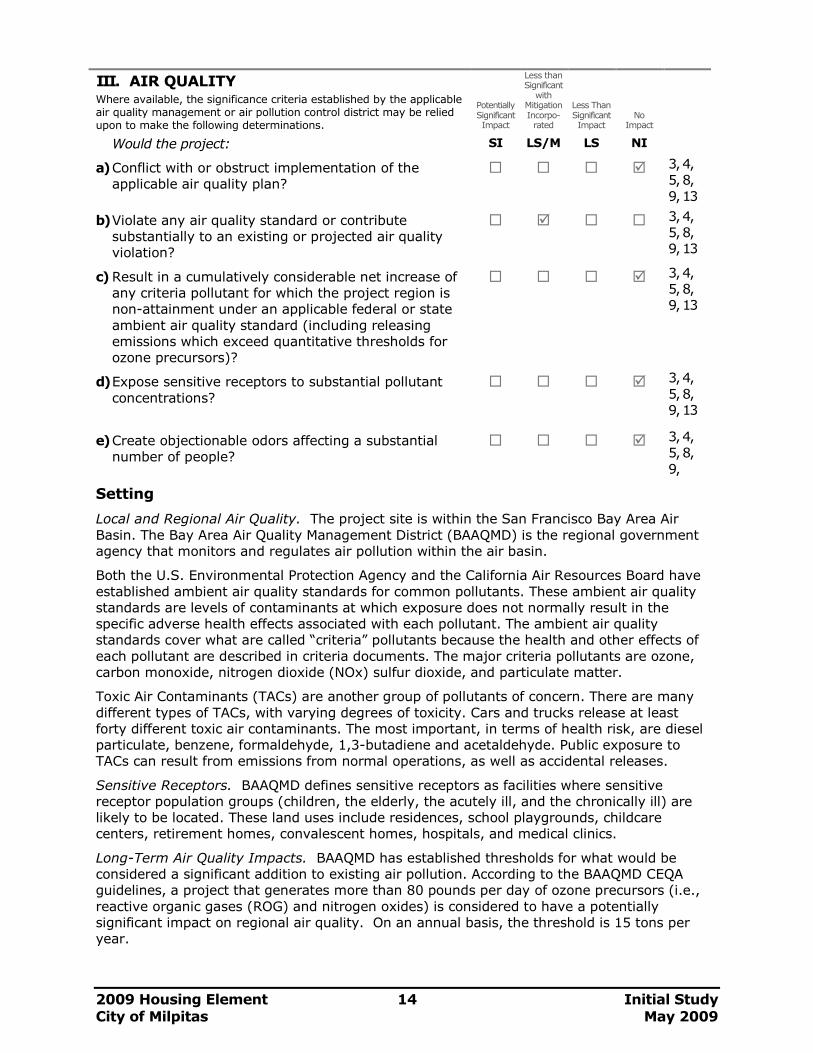
2009 Housing Element 14 Initial Study
City of Milpitas May 2009
III. AIR QUALITY Where available, the significance criteria established by the applicable air quality management or air pollution control district may be relied upon to make the following determinations.
Potentially Significant Impact
Less than Significant with
Mitigation Incorpo-rated
Less Than Significant Impact
No
Impact
Would the project: SI LS/M LS NI
a) Conflict with or obstruct implementation of the
applicable air quality plan? � � � � 3, 4,
5, 8,
9, 13
b) Violate any air quality standard or contribute
substantially to an existing or projected air quality
violation?
� � � � 3, 4,
5, 8,
9, 13
c) Result in a cumulatively considerable net increase of
any criteria pollutant for which the project region is
non-attainment under an applicable federal or state
ambient air quality standard (including releasing
emissions which exceed quantitative thresholds for
ozone precursors)?
� � � � 3, 4,
5, 8,
9, 13
d) Expose sensitive receptors to substantial pollutant
concentrations? � � � � 3, 4,
5, 8,
9, 13
e) Create objectionable odors affecting a substantial
number of people? � � � � 3, 4,
5, 8,
9,
Setting
Local and Regional Air Quality. The project site is within the San Francisco Bay Area Air
Basin. The Bay Area Air Quality Management District (BAAQMD) is the regional government
agency that monitors and regulates air pollution within the air basin.
Both the U.S. Environmental Protection Agency and the California Air Resources Board have
established ambient air quality standards for common pollutants. These ambient air quality
standards are levels of contaminants at which exposure does not normally result in the
specific adverse health effects associated with each pollutant. The ambient air quality
standards cover what are called “criteria” pollutants because the health and other effects of
each pollutant are described in criteria documents. The major criteria pollutants are ozone,
carbon monoxide, nitrogen dioxide (NOx) sulfur dioxide, and particulate matter.
Toxic Air Contaminants (TACs) are another group of pollutants of concern. There are many
different types of TACs, with varying degrees of toxicity. Cars and trucks release at least
forty different toxic air contaminants. The most important, in terms of health risk, are diesel
particulate, benzene, formaldehyde, 1,3-butadiene and acetaldehyde. Public exposure to
TACs can result from emissions from normal operations, as well as accidental releases.
Sensitive Receptors. BAAQMD defines sensitive receptors as facilities where sensitive
receptor population groups (children, the elderly, the acutely ill, and the chronically ill) are
likely to be located. These land uses include residences, school playgrounds, childcare
centers, retirement homes, convalescent homes, hospitals, and medical clinics.
Long-Term Air Quality Impacts. BAAQMD has established thresholds for what would be
considered a significant addition to existing air pollution. According to the BAAQMD CEQA
guidelines, a project that generates more than 80 pounds per day of ozone precursors (i.e.,
reactive organic gases (ROG) and nitrogen oxides) is considered to have a potentially
significant impact on regional air quality. On an annual basis, the threshold is 15 tons per
year.
2009 Housing Element 15 Initial Study
City of Milpitas May 2009
AIR QUALITY, continued
For a project that does not individually have significant operational air quality impacts, the
determination of a significant cumulative air quality impact is based upon an evaluation of
the consistency of the project with the local general plan and of that general plan with the
most current Clean Air Plan (CAP).
Short-Term Air Quality Impacts. Construction-related air quality impacts associated with a
proposed project would be the result of dust-generating activities and exhaust emissions of
construction equipment. Due to the negligible amount and short duration of these impacts,
all are considered to be less than significant, except for the activities generating dust.
Demolition, excavation and grading operations, and release of dust from exposed earth as a
result of wind or movements of construction vehicles are potential sources of fugitive parti-
culate matter associated with construction activities. The effects of these dust-generating
activities include increased dustfall and locally-elevated levels of PM10 downwind of the con-
struction site. Construction dust also has the potential for creating a nuisance at nearby
properties. If uncontrolled, dust generated by construction activities could be a significant
impact.
Discussion
Adoption of the 2009 Housing Element would accommodate housing and population growth
consistent with the Milpitas General Plan, the Midtown Specific Plan, and the Transit Area
Specific Plan. All of these plans/projects have had their own CEQA reviews, and all will be
subject to the air quality mitigation measures in those earlier documents.
The TASP provides air quality monitoring data for the Milpitas area (Table 3.6-1), as well as
applicable standards (Table 3.6-2). Air quality topics are discussed individually below.
a) NI
The Bay Area is a non-attainment area for ozone standards. The cumulative effect of the
Housing Element on attainment status would be positive. The Housing Element emphasizes
the provision of housing opportunities close to job centers, thereby reducing the need to
commute by automobile, resulting in lower vehicle miles traveled and associated emissions
as compared to a more dispersed development pattern. Therefore, a “no impact” finding is
appropriate.
b) LS/M
The Bay Area is a non-attainment area for PM10 standards. Construction-related air quality
impacts associated with new residential development would be the result of dust-creating
activities and the exhaust emissions of construction equipment. Due to the negligible
amount and short duration of these impacts, all are considered to be less than significant,
except for the activities generating dust. If uncontrolled, dust generated by construction
activities could be a significant impact.
Dust control measures have been imposed under previous EIRs for the Specific Plan and
project areas in which new residential development under the Housing Element are
expected to be located. For any new residential development outside those areas, dust
control measures would be prescribed as needed as future projects are proposed.
c) NI
The development of new housing under the 2009 Housing Element would lead to additional
automobile traffic and congestion, contributing to pollution in the Bay Area. The population
increases envisioned by the 2009 Housing Element do not, however, exceed the totals
attributed to Milpitas by regional agencies, including BAAQMD’s regional air quality plan
(CAP, 2005), which was based on ABAG’s Projections 2003 population forecast.
Milpitas was projected by ABAG in the 2003 document to attain a population of about
79,400 in 2015 (or, by interpolation, about 78,200 by 2014). By adding 2,487 housing
2009 Housing Element 16 Initial Study
City of Milpitas May 2009
AIR QUALITY, continued
units as called for in the RHNA (see p. 5), the draft 2009 Housing Element would result in
an increase in the population of Milpitas of about 7,460 to a 2014 total of about 76,880 if
the average household size is three.3 Housing units added under the Housing Element
would not result in an increase over the ABAG populations used in the AQMD plan, and the
Housing Element is consistent with the District’s growth assumptions.
EIRs on the Midtown Specific Plan and the Transit Area Specific Plan found that the scale of
the housing development envisioned would trigger a finding of significant unavoidable
impact due to impacts on cumulative regional air quality and conflict with attainment of the
regional air quality plan.4 While current population levels and the housing requirements
associated with the 2009 Housing Element appear to be consistent with the regional air
quality plan, the impact on cumulative regional air quality remains.
The Milpitas City Council adopted Statements of Overriding Considerations (SOCs) for the
Midtown Specific Plan and the Transit Area Specific Plan as discussed above in Section 3.3.
The SOCs express the belief that the transit-related land use pattern that these local
plans/projects emphasize is conducive to decreased reliance on the automobile and the
reduction of vehicle miles traveled as compared with non-infill sites elsewhere in the region.
Under these circumstances, the finding of “no impact” is appropriate.
d) LS/M
Some of the housing sites identified in the 2009 Housing Element are located along major
arterials or are close to industrial and commercial uses. The potential for air quality
impacts would be present if housing were to be constructed close to sources of carbon
monoxide, PM10, or other pollutants. Housing is already permitted on these sites, however,
and the policies of the Housing Element would not increase the potential for adverse
impacts. Mitigation measures will be prescribed as needed.
e) NI No objectionable odor generation is associated with conventional housing development. Exposure to odors from other sources is mitigated by distance. It is also regulated by the AQMD’s Regulation 7 (see TASP, p. 3.6-4)
3 Recent housing construction in Milpitas has shifted toward higher density units, and the draft Housing Element would
reinforce that trend. Therefore, while Milpitas’s average household size has historically exceeded 3 persons, the average household size of new units built under the housing element is likely to be lower. Milpitas’s 2007 Housing Market Report states that “Recent development trends in Milpitas indicate that the zoning regulations and ordinances adopted by the City are encouraging higher density housing near transit and other transportation corridors. . . . In comparison to existing densities in the City, the new housing is built at much higher densities and is primarily multifamily.” If the average household size of the newer, higher-density units averages 2.5, the population associated with 2,487 units would be about 6,220 yielding a 2014 population of about 75,640 – well below the ABAG projection.
4 The EIRs for these Specific Plans and their applicable Statements of Overriding Considerations are listed in the source key at the end of this IS and they are available for public review, together with their Draft and Final EIRs, at the Milpitas Planning Department. Note that the scale of development assumed for 1005 North Park Victoria Drive (33 units, as presented in Table 1) is not of a magnitude that would trigger a finding of significant unavoidable air quality impact.
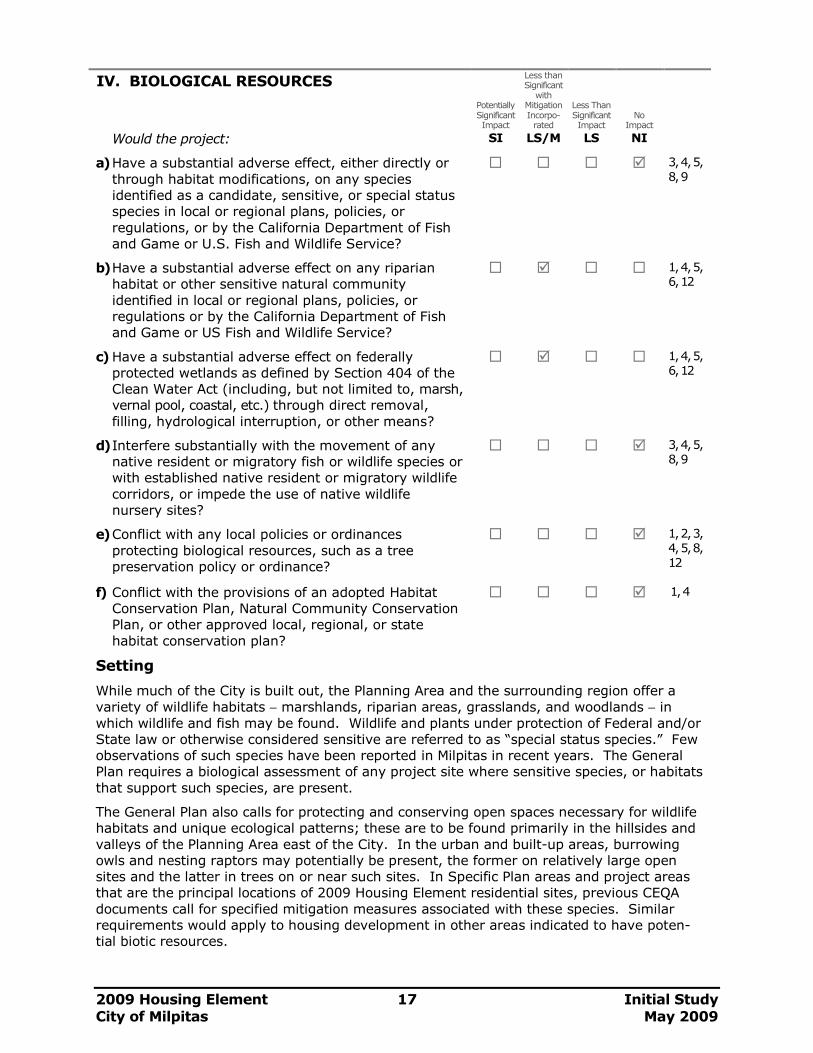
2009 Housing Element 17 Initial Study
City of Milpitas May 2009
IV. BIOLOGICAL RESOURCES
Potentially Significant Impact
Less than Significant with
Mitigation Incorpo-rated
Less Than Significant Impact
No
Impact
Would the project: SI LS/M LS NI
a) Have a substantial adverse effect, either directly or
through habitat modifications, on any species
identified as a candidate, sensitive, or special status
species in local or regional plans, policies, or
regulations, or by the California Department of Fish
and Game or U.S. Fish and Wildlife Service?
� � � � 3, 4, 5,
8, 9
b) Have a substantial adverse effect on any riparian
habitat or other sensitive natural community
identified in local or regional plans, policies, or
regulations or by the California Department of Fish
and Game or US Fish and Wildlife Service?
� � � � 1, 4, 5,
6, 12
c) Have a substantial adverse effect on federally
protected wetlands as defined by Section 404 of the
Clean Water Act (including, but not limited to, marsh,
vernal pool, coastal, etc.) through direct removal,
filling, hydrological interruption, or other means?
� � � � 1, 4, 5,
6, 12
d) Interfere substantially with the movement of any
native resident or migratory fish or wildlife species or
with established native resident or migratory wildlife
corridors, or impede the use of native wildlife
nursery sites?
� � � � 3, 4, 5,
8, 9
e) Conflict with any local policies or ordinances
protecting biological resources, such as a tree
preservation policy or ordinance?
� � � � 1, 2, 3,
4, 5, 8,
12
f) Conflict with the provisions of an adopted Habitat
Conservation Plan, Natural Community Conservation
Plan, or other approved local, regional, or state
habitat conservation plan?
� � � � 1, 4
Setting
While much of the City is built out, the Planning Area and the surrounding region offer a
variety of wildlife habitats − marshlands, riparian areas, grasslands, and woodlands − in
which wildlife and fish may be found. Wildlife and plants under protection of Federal and/or
State law or otherwise considered sensitive are referred to as “special status species.” Few
observations of such species have been reported in Milpitas in recent years. The General
Plan requires a biological assessment of any project site where sensitive species, or habitats
that support such species, are present.
The General Plan also calls for protecting and conserving open spaces necessary for wildlife
habitats and unique ecological patterns; these are to be found primarily in the hillsides and
valleys of the Planning Area east of the City. In the urban and built-up areas, burrowing
owls and nesting raptors may potentially be present, the former on relatively large open
sites and the latter in trees on or near such sites. In Specific Plan areas and project areas
that are the principal locations of 2009 Housing Element residential sites, previous CEQA
documents call for specified mitigation measures associated with these species. Similar
requirements would apply to housing development in other areas indicated to have poten-
tial biotic resources.
2009 Housing Element 18 Initial Study
City of Milpitas May 2009
BIOLOGICAL RESOURCES, continued
The Milpitas Tree Maintenance and Protection Ordinance protects trees and stands of trees
of particular quality, age, size, location, or historical interest.
Discussion
a), d), e), f) NI
The potential for biological resources on the sites of potential new housing development
identified in the 2009 Housing Element has been considered in CEQA documents on
previous Specific Plans and projects. The Milpitas Tree Maintenance and Protection
Ordinance protects trees identified under the ordinance as possessing particular
importance. Urban areas of Milpitas are not covered by a habitat or conservation plan.
b), c) LS/M
Sites proposed for development would be subject to General Plan protection of biotic
resources, which requires a biological assessment of any project site where sensitive
species are present, or habitats that support known sensitive species. It is unlikely that
many such sites are included in the 2009 Draft Housing Element sites list, because most of
those sites are in the already urbanized area, and some represent sites already developed
(but underutilized).
State law requires that, prior to new development in areas that border creeks and with
potential riparian habitat, applicants coordinate with the California Department of Fish and
Game and take measures indicated by that agency if the proposed development requires a
Streambed Alteration Agreement in order to proceed. That agreement (if required) may
include required mitigations of biological impacts, if the development is found to pose the
potential for biological impacts.
Most reaches of the intermittent streams within the Valley Floor area of Milpitas have been
channelized, resulting in the absence of riparian habitat associated with those streams.
Therefore, Housing Element sites are unlikely to be associated with potential impacts on
riparian habitat. Should the potential for such an impact occur, however, compliance with
State law and with the policy direction provided in existing Milpitas planning documents –
the General Plan, the MSP, and the TASP – provides for mitigation of biological impacts.
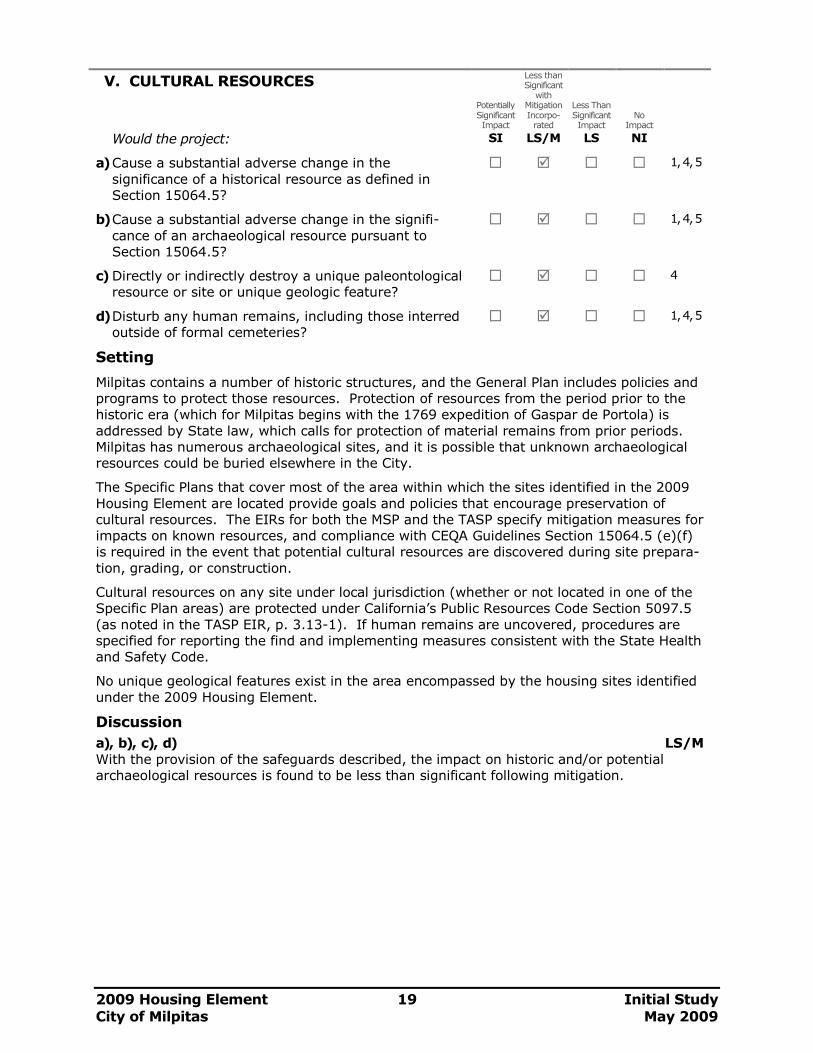
2009 Housing Element 19 Initial Study
City of Milpitas May 2009
V. CULTURAL RESOURCES
Potentially Significant Impact
Less than Significant with
Mitigation Incorpo-rated
Less Than Significant Impact
No
Impact
Would the project: SI LS/M LS NI
a) Cause a substantial adverse change in the
significance of a historical resource as defined in
Section 15064.5?
� � � � 1, 4, 5
b) Cause a substantial adverse change in the signifi-
cance of an archaeological resource pursuant to
Section 15064.5?
� � � � 1, 4, 5
c) Directly or indirectly destroy a unique paleontological
resource or site or unique geologic feature? � � � � 4
d) Disturb any human remains, including those interred
outside of formal cemeteries? � � � � 1, 4, 5
Setting
Milpitas contains a number of historic structures, and the General Plan includes policies and
programs to protect those resources. Protection of resources from the period prior to the
historic era (which for Milpitas begins with the 1769 expedition of Gaspar de Portola) is
addressed by State law, which calls for protection of material remains from prior periods.
Milpitas has numerous archaeological sites, and it is possible that unknown archaeological
resources could be buried elsewhere in the City.
The Specific Plans that cover most of the area within which the sites identified in the 2009
Housing Element are located provide goals and policies that encourage preservation of
cultural resources. The EIRs for both the MSP and the TASP specify mitigation measures for
impacts on known resources, and compliance with CEQA Guidelines Section 15064.5 (e)(f)
is required in the event that potential cultural resources are discovered during site prepara-tion, grading, or construction.
Cultural resources on any site under local jurisdiction (whether or not located in one of the
Specific Plan areas) are protected under California’s Public Resources Code Section 5097.5
(as noted in the TASP EIR, p. 3.13-1). If human remains are uncovered, procedures are
specified for reporting the find and implementing measures consistent with the State Health
and Safety Code.
No unique geological features exist in the area encompassed by the housing sites identified
under the 2009 Housing Element.
Discussion
a), b), c), d) LS/M
With the provision of the safeguards described, the impact on historic and/or potential
archaeological resources is found to be less than significant following mitigation.
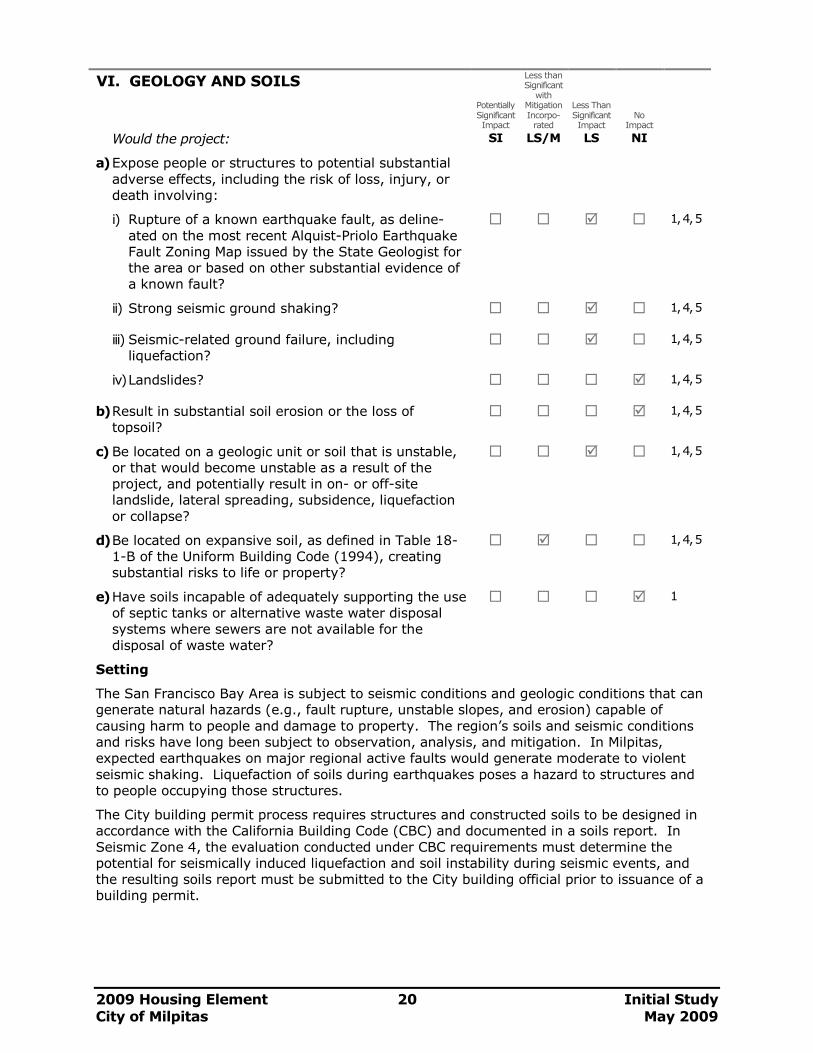
2009 Housing Element 20 Initial Study
City of Milpitas May 2009
VI. GEOLOGY AND SOILS
Potentially Significant Impact
Less than Significant with
Mitigation Incorpo-rated
Less Than Significant Impact
No
Impact
Would the project: SI LS/M LS NI
a) Expose people or structures to potential substantial
adverse effects, including the risk of loss, injury, or
death involving:
i) Rupture of a known earthquake fault, as deline-
ated on the most recent Alquist-Priolo Earthquake
Fault Zoning Map issued by the State Geologist for
the area or based on other substantial evidence of
a known fault?
� � � � 1, 4, 5
ii) Strong seismic ground shaking? � � � � 1, 4, 5
iii) Seismic-related ground failure, including
liquefaction? � � � � 1, 4, 5
iv) Landslides? � � � � 1, 4, 5
b) Result in substantial soil erosion or the loss of
topsoil? � � � � 1, 4, 5
c) Be located on a geologic unit or soil that is unstable,
or that would become unstable as a result of the
project, and potentially result in on- or off-site
landslide, lateral spreading, subsidence, liquefaction
or collapse?
� � � � 1, 4, 5
d) Be located on expansive soil, as defined in Table 18-
1-B of the Uniform Building Code (1994), creating
substantial risks to life or property?
� � � � 1, 4, 5
e) Have soils incapable of adequately supporting the use
of septic tanks or alternative waste water disposal
systems where sewers are not available for the
disposal of waste water?
� � � � 1
Setting
The San Francisco Bay Area is subject to seismic conditions and geologic conditions that can
generate natural hazards (e.g., fault rupture, unstable slopes, and erosion) capable of
causing harm to people and damage to property. The region’s soils and seismic conditions
and risks have long been subject to observation, analysis, and mitigation. In Milpitas,
expected earthquakes on major regional active faults would generate moderate to violent
seismic shaking. Liquefaction of soils during earthquakes poses a hazard to structures and
to people occupying those structures.
The City building permit process requires structures and constructed soils to be designed in
accordance with the California Building Code (CBC) and documented in a soils report. In
Seismic Zone 4, the evaluation conducted under CBC requirements must determine the
potential for seismically induced liquefaction and soil instability during seismic events, and
the resulting soils report must be submitted to the City building official prior to issuance of a
building permit.
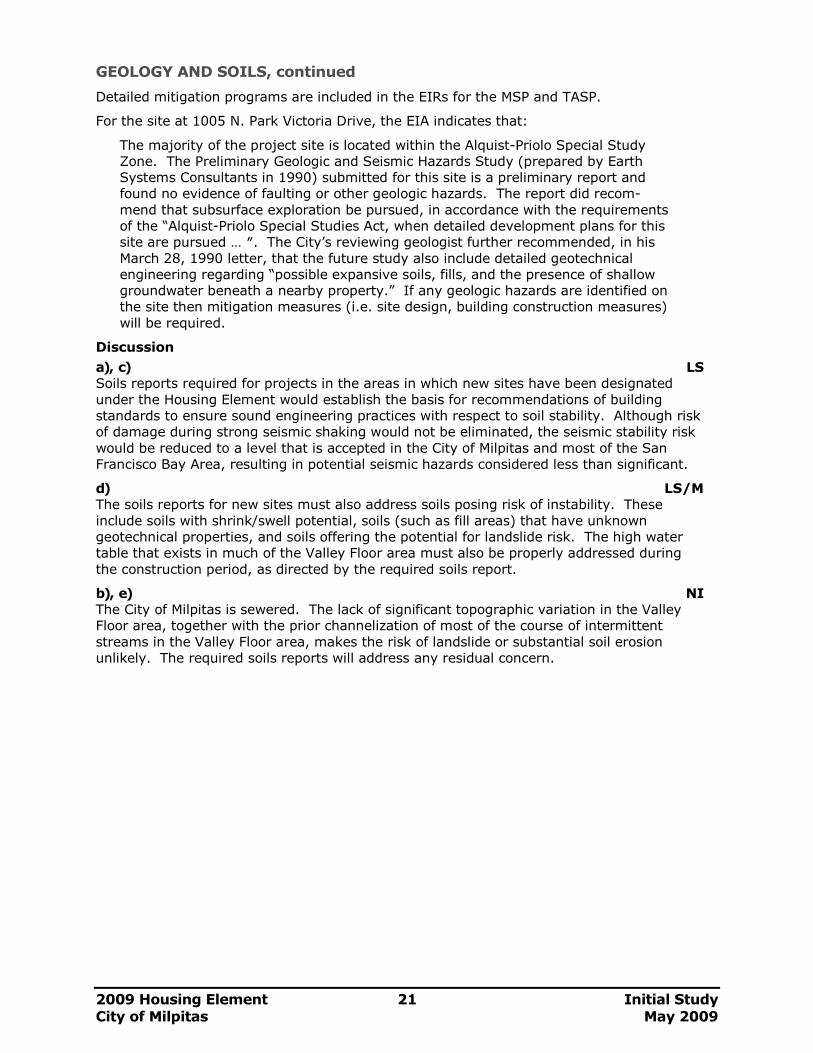
2009 Housing Element 21 Initial Study
City of Milpitas May 2009
GEOLOGY AND SOILS, continued
Detailed mitigation programs are included in the EIRs for the MSP and TASP.
For the site at 1005 N. Park Victoria Drive, the EIA indicates that:
The majority of the project site is located within the Alquist-Priolo Special Study
Zone. The Preliminary Geologic and Seismic Hazards Study (prepared by Earth
Systems Consultants in 1990) submitted for this site is a preliminary report and
found no evidence of faulting or other geologic hazards. The report did recom-
mend that subsurface exploration be pursued, in accordance with the requirements
of the “Alquist-Priolo Special Studies Act, when detailed development plans for this
site are pursued … ″. The City’s reviewing geologist further recommended, in his
March 28, 1990 letter, that the future study also include detailed geotechnical
engineering regarding “possible expansive soils, fills, and the presence of shallow
groundwater beneath a nearby property.” If any geologic hazards are identified on
the site then mitigation measures (i.e. site design, building construction measures)
will be required.
Discussion
a), c) LS
Soils reports required for projects in the areas in which new sites have been designated
under the Housing Element would establish the basis for recommendations of building
standards to ensure sound engineering practices with respect to soil stability. Although risk
of damage during strong seismic shaking would not be eliminated, the seismic stability risk
would be reduced to a level that is accepted in the City of Milpitas and most of the San
Francisco Bay Area, resulting in potential seismic hazards considered less than significant.
d) LS/M
The soils reports for new sites must also address soils posing risk of instability. These
include soils with shrink/swell potential, soils (such as fill areas) that have unknown
geotechnical properties, and soils offering the potential for landslide risk. The high water
table that exists in much of the Valley Floor area must also be properly addressed during
the construction period, as directed by the required soils report.
b), e) NI
The City of Milpitas is sewered. The lack of significant topographic variation in the Valley
Floor area, together with the prior channelization of most of the course of intermittent
streams in the Valley Floor area, makes the risk of landslide or substantial soil erosion
unlikely. The required soils reports will address any residual concern.
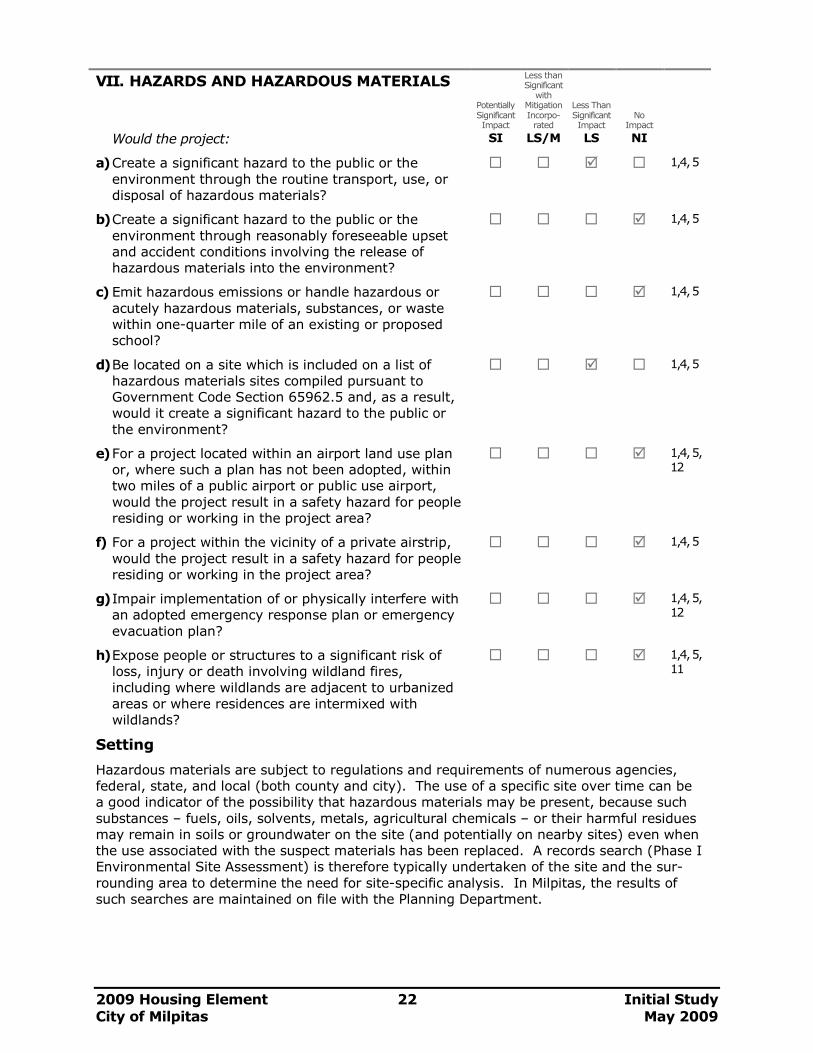
2009 Housing Element 22 Initial Study
City of Milpitas May 2009
VII. HAZARDS AND HAZARDOUS MATERIALS
Potentially Significant Impact
Less than Significant with
Mitigation Incorpo-rated
Less Than Significant Impact
No
Impact
Would the project: SI LS/M LS NI
a) Create a significant hazard to the public or the
environment through the routine transport, use, or
disposal of hazardous materials?
� � � � 1,4, 5
b) Create a significant hazard to the public or the
environment through reasonably foreseeable upset
and accident conditions involving the release of
hazardous materials into the environment?
� � � � 1,4, 5
c) Emit hazardous emissions or handle hazardous or
acutely hazardous materials, substances, or waste
within one-quarter mile of an existing or proposed
school?
� � � � 1,4, 5
d) Be located on a site which is included on a list of
hazardous materials sites compiled pursuant to
Government Code Section 65962.5 and, as a result,
would it create a significant hazard to the public or
the environment?
� � � � 1,4, 5
e) For a project located within an airport land use plan
or, where such a plan has not been adopted, within
two miles of a public airport or public use airport,
would the project result in a safety hazard for people
residing or working in the project area?
� � � � 1,4, 5,
12
f) For a project within the vicinity of a private airstrip,
would the project result in a safety hazard for people
residing or working in the project area?
� � � � 1,4, 5
g) Impair implementation of or physically interfere with
an adopted emergency response plan or emergency
evacuation plan?
� � � � 1,4, 5,
12
h) Expose people or structures to a significant risk of
loss, injury or death involving wildland fires,
including where wildlands are adjacent to urbanized
areas or where residences are intermixed with
wildlands?
� � � � 1,4, 5,
11
Setting
Hazardous materials are subject to regulations and requirements of numerous agencies,
federal, state, and local (both county and city). The use of a specific site over time can be
a good indicator of the possibility that hazardous materials may be present, because such
substances – fuels, oils, solvents, metals, agricultural chemicals – or their harmful residues
may remain in soils or groundwater on the site (and potentially on nearby sites) even when
the use associated with the suspect materials has been replaced. A records search (Phase I
Environmental Site Assessment) is therefore typically undertaken of the site and the sur-
rounding area to determine the need for site-specific analysis. In Milpitas, the results of
such searches are maintained on file with the Planning Department.
2009 Housing Element 23 Initial Study
City of Milpitas May 2009
HAZARD AND HAZARDOUS MATERIALS, continued
Areas of Milpitas that have been occupied in the past by agricultural, industrial, some com-
mercial (e.g., service stations and dry clearing establishments) and/or transportation uses
are among those being considered for new residential development. The identification and
remediation of such uses is essential to assure that future residents will not be exposed to
hazardous materials in and around their homes. This is particularly true for populations
that are especially susceptible to the effects of hazardous materials, including children, the
elderly, and the infirm.
Other sources of hazardous materials, including asbestos and lead in buildings, can also
pose hazards that require abatement as a part of demolition.
Milpitas maintains an emergency plan to deal with natural or man-made disasters. Open
lands in the hilly portions of the Planning Area are characterized by seasonally dry
vegetation that can be subject to wildfires.
Discussion
a), d) LS
Procedures for the identification and mitigation of hazardous materials on or near specific
sites or to releases of such materials in the area of such sites have been established that
provide for mitigation of such conditions, as described in CEQA documents for the Specific
Plan areas within which the majority of Housing Element sites are located. The same legal
and regulatory requirements and procedures apply to all sites whether or not addressed in
previous CEQA documents. These requirements are designed to protect the public from
risks associated with known hazardous materials.
With respect to the N. Park Victoria Drive site, the EIA observed that, given its previous
orchard use (1960s and earlier), soil chemistry conditions of the site are probably similar to
those in most other areas of Milpitas; pesticide use was considered less probable than
might be the case with intensive row crops or agricultural use extending into the 1970s or
beyond. A Level One Environmental Site Assessment was conducted with specific
recommendations to the City relating to further soils testing and notifications.
With legal and regulatory requirements in place, along with specific recommendations for
the N. Park Victoria Drive site, impacts on hazards and hazardous materials have been
mitigated and a finding of less than significant impact is appropriate.
b), c), e), f), g), h) NI
Conventional residential development is not normally associated with the release of haz-
ardous materials. Milpitas does not include any public or private airports or air strips and
has no areas within an airport land use plan (the Norman Y. Mineta San Jose International
Airport is the closest, at a distance of about five miles). No inconsistency with the City’s
emergency plans (which provide for evacuation under appropriate conditions) or the
emergency plans of any other local agencies has been noted; see, however, the discussion
under XIII. Public Services−Fire (p. 30), where an extension of the TASP mitigation program
is recommended.
Housing Element sites are all located in the urbanized Valley Floor area and are not subject
to additional fire safety requirements applicable to the City’s Hillside Area.
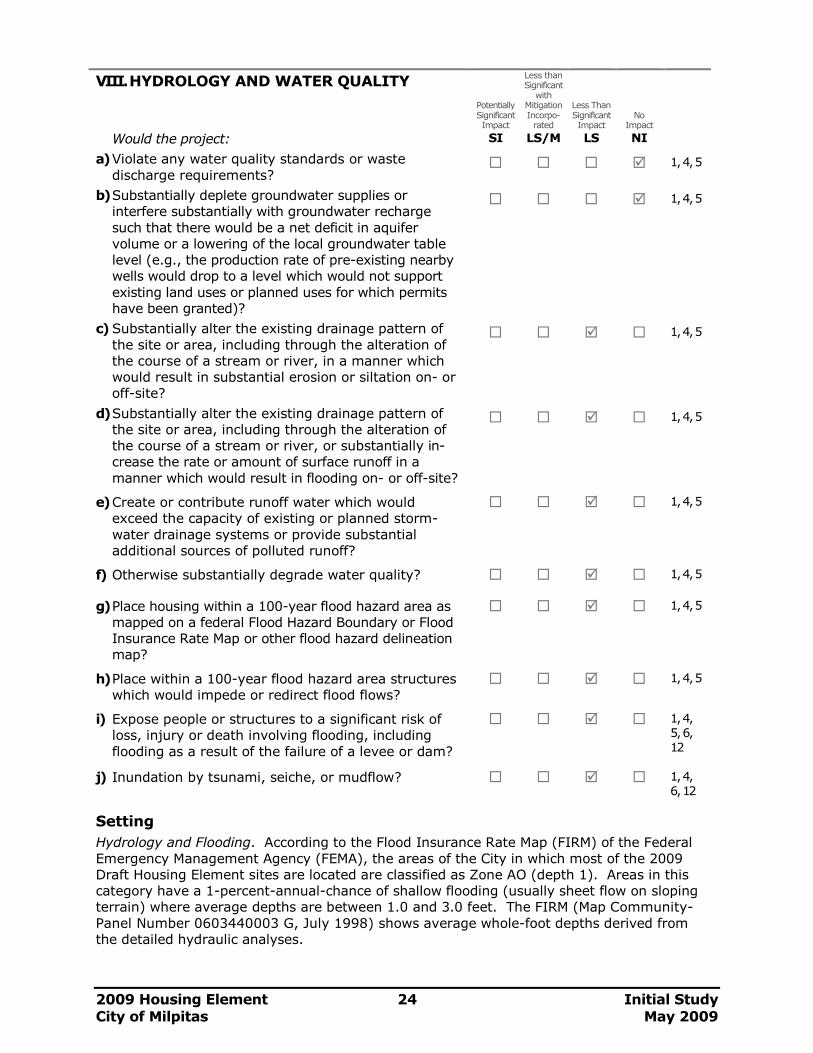
2009 Housing Element 24 Initial Study
City of Milpitas May 2009
VIII. HYDROLOGY AND WATER QUALITY
Potentially Significant Impact
Less than Significant with
Mitigation Incorpo-rated
Less Than Significant Impact
No
Impact
Would the project: SI LS/M LS NI
a) Violate any water quality standards or waste
discharge requirements? � � � � 1, 4, 5
b) Substantially deplete groundwater supplies or
interfere substantially with groundwater recharge
such that there would be a net deficit in aquifer
volume or a lowering of the local groundwater table
level (e.g., the production rate of pre-existing nearby
wells would drop to a level which would not support
existing land uses or planned uses for which permits
have been granted)?
� � � � 1, 4, 5
c) Substantially alter the existing drainage pattern of
the site or area, including through the alteration of
the course of a stream or river, in a manner which
would result in substantial erosion or siltation on- or
off-site?
� � � � 1, 4, 5
d) Substantially alter the existing drainage pattern of
the site or area, including through the alteration of
the course of a stream or river, or substantially in-
crease the rate or amount of surface runoff in a
manner which would result in flooding on- or off-site?
� � � � 1, 4, 5
e) Create or contribute runoff water which would
exceed the capacity of existing or planned storm-
water drainage systems or provide substantial
additional sources of polluted runoff?
� � � � 1, 4, 5
f) Otherwise substantially degrade water quality? � � � � 1, 4, 5
g) Place housing within a 100-year flood hazard area as
mapped on a federal Flood Hazard Boundary or Flood
Insurance Rate Map or other flood hazard delineation
map?
� � � � 1, 4, 5
h) Place within a 100-year flood hazard area structures
which would impede or redirect flood flows? � � � � 1, 4, 5
i) Expose people or structures to a significant risk of
loss, injury or death involving flooding, including
flooding as a result of the failure of a levee or dam?
� � � � 1, 4,
5, 6,
12
j) Inundation by tsunami, seiche, or mudflow? � � � � 1, 4,
6, 12
Setting
Hydrology and Flooding. According to the Flood Insurance Rate Map (FIRM) of the Federal
Emergency Management Agency (FEMA), the areas of the City in which most of the 2009
Draft Housing Element sites are located are classified as Zone AO (depth 1). Areas in this
category have a 1-percent-annual-chance of shallow flooding (usually sheet flow on sloping
terrain) where average depths are between 1.0 and 3.0 feet. The FIRM (Map Community-
Panel Number 0603440003 G, July 1998) shows average whole-foot depths derived from
the detailed hydraulic analyses.
2009 Housing Element 25 Initial Study
City of Milpitas May 2009
HYDROLOGY AND WATER QUALITY, continued
Drainage. The City of Milpitas owns and maintains the municipal storm drainage system in
the City’s Valley Floor area, where the 2009 Housing Element sites are located.
Water Quality. New development is required to comply with Provision C.3 of the National
Pollutant Discharge Elimination System/NPDES countywide permit. The C.3 requirements
seek to reduce water pollution by both reducing the volume of stormwater runoff and the
amount of pollutants that are contained within the runoff. Methods used to achieve these
objectives can include measures such as a reduction in impervious surfaces, onsite deten-
tion facilities, biofiltration swales, settlement/debris basins, and others, depending on the
characteristics of the site and the project. A construction project is required to obtain an
individual NPDES permit supported by the preparation of a Stormwater Pollution Preven-
tion Plan (SWPPP) for construction of facilities. The SWPPP would be comprised of best
management practices (BMPs) for construction of facilities.
Discussion
Several Milpitas General Plan provisions relating to management of flood risk and other
surface water management issues are subject to more frequent updating procedures under
the provisions of AB 162. A plan for complying with the new requirements is currently
being formulated.
a) NI
New development under the 2009 Draft Housing Element would have waste discharge
characteristics typical of residential uses, without exceptional characteristics that might
violate discharge standards or requirements.
b) NI
Housing in Milpitas does not rely on the local aquifer as a water supply source; thus, there
would be no impacts to groundwater associated with increased pumping or consumption.
The conversion of older industrial and commercial uses to residential uses is unlikely to
increase the amount of impervious surface coverage in the City, since sites to be converted
tend to have a higher proportion of impervious surface coverage than residential uses.
c) LS
Housing construction could create the potential for erosion and sedimentation if soil is not
properly stockpiled and contained. The Milpitas General Plan as well as the Specific Plans in
which most of the housing sites in the 2009 Draft Housing Element area are located contain
policies and standards to ensure that Best Management Practices (BMPs) are followed
during construction to avoid such impacts. The City implements a number of regulatory
programs which prevent construction sediment from reaching local waterways. Existing
regulatory programs are sufficient to reduce this impact to a less-than-significant level.
d) LS
Redevelopment of older commercial and industrial sites for housing, as anticipated in the
Housing Element, could alter drainage patterns and increase surface runoff on some
properties. The net change in runoff rates would be minimal because the impervious
surface coverage on the City's future housing sites (many of which are developed
currently in non-residential uses) is already high.
The Element does not propose altering residential development standards in a manner
which would cause runoff to increase (for instance, increasing allowable lot coverage or
reducing setbacks), and it does not propose changes to local drainage plans. Both the
MSP and the TASP EIRs determined that impacts on drainage within those Specific Plan
Areas would be adequately addressed by City standards and by improvements and
requirements built into the Specific Plans. The site at 1005 North Park Victoria Drive, a
smaller site, would be required to meet City standards relating to surface water
management; the EIA on that rezoning did not find a potential for adverse impact.
2009 Housing Element 26 Initial Study
City of Milpitas May 2009
HYDROLOGY AND WATER QUALITY, continued e) LS
The draft Housing Element includes an action program to waive or reduce on-site
stormwater detention requirements for infill and transit-oriented housing projects in the
Midtown area. It also promotes the development of a centralized storm water detention
pond. The purpose of these actions is to avoid the need to dedicate land on each future
housing site for stormwater retention, thereby maximizing the potential number of units
that can be built. The City will continue to work with the Regional Water Quality Control
Board to explore the feasibility of these measures. Drainage impacts for individual
projects will continue to be evaluated on a case-by-case basis. Taking these policies and
procedures into account, the impact of the Housing Element on runoff and surface water
quality would be less than significant.
f) LS
The Housing Element promotes additional housing and population in Milpitas to achieve
the City's regional fair share assignment. The additional residents could increase the
potential for water pollution through vehicle use, household activities, construction,
wastewater disposal, etc. Continued implementation of stormwater pollution prevention
measures (such as public education, illicit discharge control, construction BMPs, etc.)
should reduce impacts to less than significant levels.
g), h) and i) LS
Housing sites within the two Specific Plan areas are generally located within a shallow
flood plain (Zone AO). Milpitas requires fill to be imported on these sites prior to con-
struction, thereby raising the base elevation and ensuring that the structures themselves
are relatively free from flood hazards. The Housing Element does not propose land use
map or zoning changes that would increase development potential in these or other areas
of the City.
The Midtown Specific Plan EIR confirmed that no mitigation was required for this impact,
as existing flood hazards do not pose a risk to life or property, and enforcement of the
Flood Plain Management Ordinance and FEMA guidelines sufficiently reduce future hazard
levels.
The Transit Area Specific Plan EIR includes, in its Implementation Plan, the requirement
that a Master Grading and Storm Drainage Plan be prepared for each subdistrict of the
TASP area prior to approval of Zoning Permits for new buildings in that subdistrict; it also
calls for the establishment of a funding mechanism to recoup the cost of developing those
Master Plans. TASP Policies 6.1, 6.2, and 6.3 describe how TASP developments within the
100-year hazard zone are to be designed and regulated to respond to requirements of the
Federal Emergency Management Agency (FEMA), the National Flood Insurance Program,
Milpitas construction standards, and TASP urban design standards; TASP Policies 6.4 and
6.6 require that storm drain infrastructure shall adequately serve new development and
meet City standards, and that improvements be provided within the Transit Area that
were identified in the Milpitas 2001 Storm Drainage Master Plan and any updates to that
plan.
The housing site located at 1005 North Park Victoria Drive was not found in its EIA to lie
within a floodplain or a floodplain. Given the size of this site relative to the local drainage
basin and available facilities, as well as the City’s requirements for on-site drainage
improvements, the impact on flooding is not considered significant.
j) LS
A tsunami originating in the Pacific Ocean would dissipate in the San Francisco Bay and,
therefore, pose a negligible hazard to the study area. A seiche (seismically-induced
wave) could potentially occur in Sandy Wool Lake under the certain circumstances,
thereby potentially flooding downstream areas; however the risk of a seiche of sufficient
2009 Housing Element 27 Initial Study
City of Milpitas May 2009
magnitude to have such an effect is low. In general, risk of mudflow at the residential
sites included in the 2009 Housing Element is minimized by distance, and also by the
barrier created by Interstate 680. A single site, 1005 North Park Victoria Drive, is located
east of I-680, but in the judgment of Milpitas engineering staff is not considered to be at
significant risk of mudflows. The previous CEQA review of this site found no potential
flooding risk impact.
IX. LAND USE AND PLANNING
Potentially Significant Impact
Less than Significant with
Mitigation Incorpo-rated
Less Than Significant Impact
No
Impact
Would the project: SI LS/M LS NI
a) Physically divide an established community? � � � � 1, 4, 5
b) Conflict with any applicable land use plan, policy, or
regulation of an agency with jurisdiction over the
project (including, but not limited to the general
plan, specific plan, local coastal program, or zoning
ordinance) adopted for the purpose of avoiding or
mitigating an environmental effect?
� � � � 1, 4, 5
c) Conflict with any applicable habitat conservation plan
or natural community conservation plan? � � � � 1, 12
Setting
Replacement of non-residential uses by residential uses has been an important trend not
only in Milpitas but in most cities bordering on San Francisco Bay in recent years. Thus, in
both the MSP and the TASP, it is the conversion to residential use from other uses that has
been the focus of planning efforts. These Specific Plans and the additional 2009 Housing
Element site noted in Table 1, take into account the increasingly residential character of a
neighborhood and the ways in which establishing/expanding residential uses strengthens
that character. The MSP and the TASP are incorporated into the Milpitas General Plan, and
zoning is brought into conformity as the General Plan is implemented.
Discussion
a), b), c) NI
This topic was not discussed in the MSP and TASP EIRs, indicating a “No Impact” finding in
the CEQA evaluations conducted for those two Specific Plans.
For residential uses as proposed under the 2009 Draft Housing Element, particularly since
the vast majority are in Specific Plan areas under the City’s General Plan umbrella, items a)
and b) do not apply. Additional housing in the Specific Plan areas would tend to strengthen
these areas as emerging residential communities, rather than creating community divisions.
Item c) does not apply because no conservation plan of the type referred to in the
Guidelines exists for the Valley Floor area of Milpitas.
2009 Housing Element 28 Initial Study
City of Milpitas May 2009
X. MINERAL RESOURCES
Potentially Significant Impact
Less than Significant with
Mitigation Incorpo-rated
Less Than Significant Impact
No
Impact
Would the project: SI LS/M LS NI
a) Result in the loss of availability of a known mineral
resource that would be of value to the region and the
residents of the state?
� � � � 1, 4, 5
b) Result in the loss of availability of a locally-important
mineral resource recovery site delineated on a local
general plan, specific plan or other land use plan?
� � � � 1, 4, 5
Setting
Housing sites in the 2009 Draft Housing Element are located in the Valley Floor area of
Milpitas, which is an urban and built up area in which urban development takes priority
over the potential for mineral development (if any).
Discussion
a), b) NI No mineral resources have been identified in the Valley Floor area of Milpitas.
2009 Housing Element 29 Initial Study
City of Milpitas May 2009
XI. NOISE
Potentially Significant Impact
Less than Significant with
Mitigation Incorpo-rated
Less Than Significant Impact
No
Impact
Would the project: SI LS/M LS NI
a) [Result in] Exposure of persons to or generation of
noise levels in excess of standards established in the
local general plan or noise ordinance, or applicable
standards of other agencies?
� � � � 1, 4,
5, 6
b) [Result in] Exposure of persons to or generation of
excessive groundborne vibration or groundborne
noise levels?
� � � � 1, 4,
5, 6
c) [Result in] A substantial permanent increase in
ambient noise levels in the project vicinity above
levels existing without the project?
� � � � 1, 4,
5, 6
d) [Result in] A substantial temporary or periodic
increase in ambient noise levels in the project
vicinity above levels existing without the project?
� � � � 1, 4,
5, 6
e) For a project located within an airport land use plan
or, where such a plan has not been adopted, within
two miles of a public airport or public use airport,
would the project expose people residing or working
in the project area to excessive noise levels?
� � � � 1, 4,
5, 6
f) For a project within the vicinity of a private airstrip,
would the project expose people residing or working
in the project area to excessive noise levels?
� � � � 1, 12
Setting
The City of Milpitas has an array of commercial, industrial, and transportation uses that can
be the source of noise and groundborne vibrations potentially affecting noise- and/or
vibration-sensitive uses, which include housing. The Milpitas General Plan as well as the
MSP and the TASP establish measures to assure that impacts on residential development
will be within acceptable levels.
Milpitas does not have an airport and does not lie within an area to which an airport land
use plan is applicable, and it does not have any private air strips.
Discussion
a) LS/M
General Plan policies relating to noise come into play when residential development is pro-
posed for areas in which noise from neighboring uses (including highway and rail traffic)
may result in unsatisfactory noise environments for housing. Milpitas General Plan policies
6I: 1-6, 9-10, and 14-16 address residential noise levels, both interior and exterior. Site
design, building orientation, street layout, and traffic management (such as implementation
of truck routes, avoidance of “cut-through” traffic, and speed limit enforcement) can jointly
reduce noise exposure and render sites conditionally acceptable for residential use.
At some sites, particularly those adjacent to major transportation facilities (including future
BART lines), sound barriers will be required to reduce noise impacts to acceptable levels for
ground floor uses; such walls would not, however, shield buildings above the ground level.
2009 Housing Element 30 Initial Study
City of Milpitas May 2009
NOISE, continued
Where it is uncertain that full adherence to General Plan noise policies would be sufficient to
assure appropriate noise levels, acoustical analysis is required on a project-by-project basis
to analyze noise impacts relating to the completed development and to make sure that
noise environments in the “normally unacceptable” category can be mitigated to the
“conditionally acceptable” level. Such measures typically include additional noise insulation
through building construction techniques (including window standards) to reduce interior
noise levels.
The environmental review for the 1005 N. Park Victoria Drive site found that neither the
proposed development nor its context would result in an adverse impact relating to noise.
b) LS/M
Groundborne vibration is not normally a concern in outdoor areas. In residential interiors,
annoyance occurs almost as soon as it is perceived. Reducing vibration to the less-than-
perceptible level is adequate to result in no significant impact (given that the vibration
levels involved at perception are far below those that would cause physical damage to
buildings).
To make sure that vibration levels not exceed acceptable levels, the TASP includes mitiga-
tion measures IX.01 (application of Federal Transit Administration/FTA criteria for ground-
borne vibration, TASP EIR Table 5-5) and IX.02 (vibration impact analysis for sites within
300 feet of active UPRR and BART alignments and specification of mitigation requirements)
The TASP EIR provides an information base and analytical approach relating to groundborne
vibration for consultation with respect to any Housing Element sites, outside as well as inside
the TASP area. By applying the TASP approach, a determination can be made about whether
specific individual projects shall be conditioned to include siting and/or construction features
sufficient to reduce the impacts of groundborne vibration to the less-than-significant level.
This provision has been included in the Housing Element, Chapter 4.C.
c) NI
The project – provision of additional housing – would not itself result in a permanent
increase in ambient noise levels in the areas in which it would be provided.
d) LS
The project – provision of additional housing – would result in substantial temporary or
periodic increase in ambient noise levels during project construction. Mitigation measures
included in the MSP and the TASP, as well as General Plan policies relating to noise, would
reduce construction noise impacts to the less-than-significant level.
The EIA for the 1005 North Park Victoria Drive site called for preparation of a noise report
by an acoustical engineer prior to approval of a tentative map or specific development. The
report, which was to be subject to City review and approval, was to provide estimates of
noise impacts on future project residents from I-680 traffic and any other source of noise
impacts, and to specify noise attenuation and reductions in response to the noise impact
estimates. Therefore, in conjunction with the site review for any future residential
development on this site, a noise study may be required. If potentially significant impacts
are identified, the City may require that those impacts be mitigated to the less-than-
significant level.
e), f) NI
See VII Hazards and Hazardous Materials, discussion of e) and f).
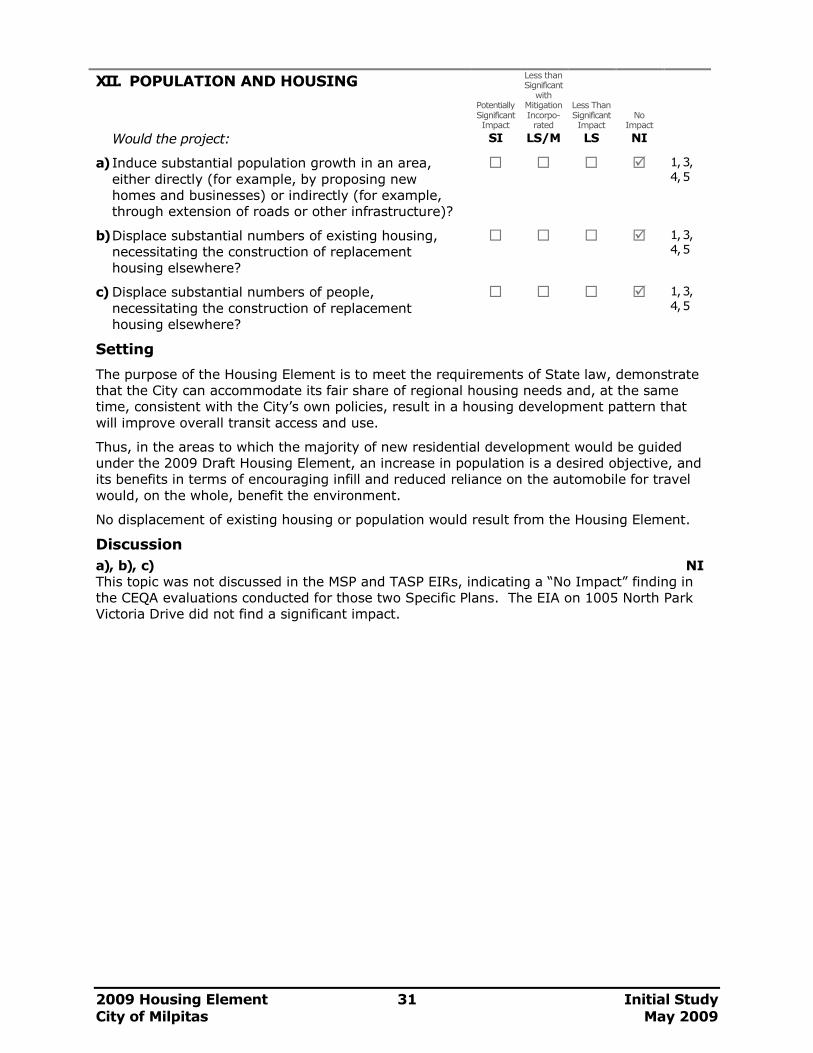
2009 Housing Element 31 Initial Study
City of Milpitas May 2009
XII. POPULATION AND HOUSING
Potentially Significant Impact
Less than Significant with
Mitigation Incorpo-rated
Less Than Significant Impact
No
Impact
Would the project: SI LS/M LS NI
a) Induce substantial population growth in an area,
either directly (for example, by proposing new
homes and businesses) or indirectly (for example,
through extension of roads or other infrastructure)?
� � � � 1, 3,
4, 5
b) Displace substantial numbers of existing housing,
necessitating the construction of replacement
housing elsewhere?
� � � � 1, 3,
4, 5
c) Displace substantial numbers of people,
necessitating the construction of replacement
housing elsewhere?
� � � � 1, 3,
4, 5
Setting
The purpose of the Housing Element is to meet the requirements of State law, demonstrate
that the City can accommodate its fair share of regional housing needs and, at the same
time, consistent with the City’s own policies, result in a housing development pattern that
will improve overall transit access and use.
Thus, in the areas to which the majority of new residential development would be guided
under the 2009 Draft Housing Element, an increase in population is a desired objective, and
its benefits in terms of encouraging infill and reduced reliance on the automobile for travel
would, on the whole, benefit the environment.
No displacement of existing housing or population would result from the Housing Element.
Discussion
a), b), c) NI
This topic was not discussed in the MSP and TASP EIRs, indicating a “No Impact” finding in
the CEQA evaluations conducted for those two Specific Plans. The EIA on 1005 North Park
Victoria Drive did not find a significant impact.
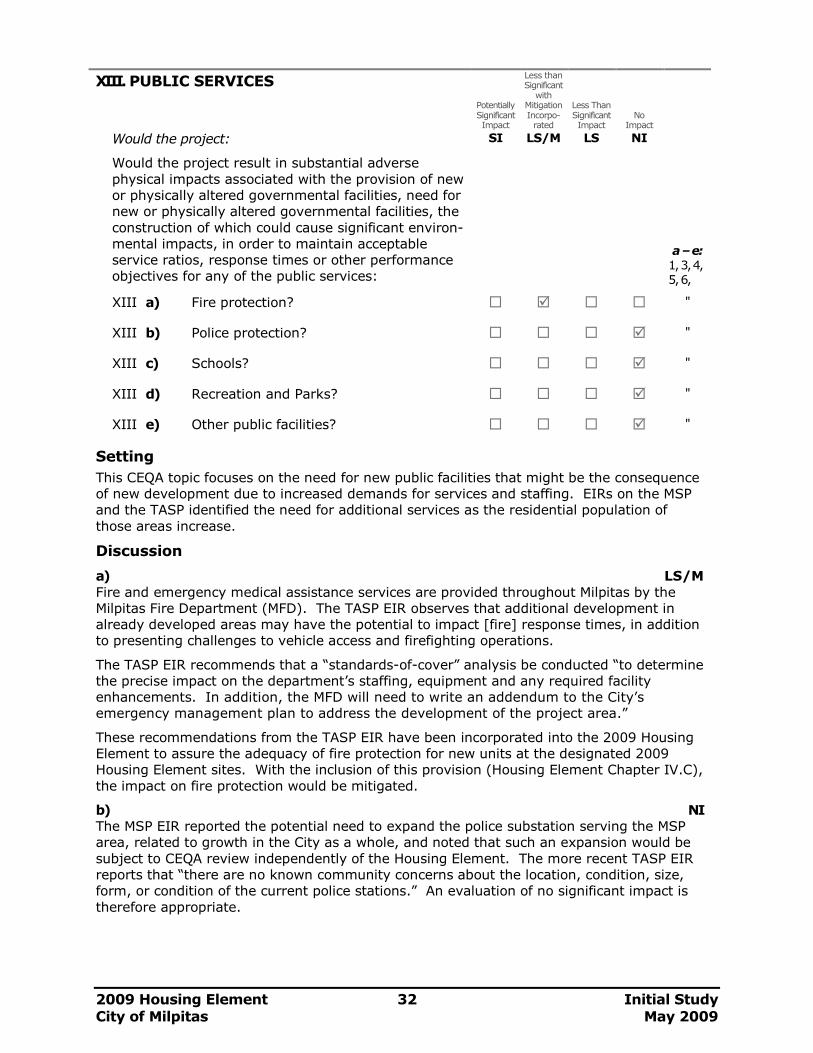
2009 Housing Element 32 Initial Study
City of Milpitas May 2009
XIII. PUBLIC SERVICES
Potentially Significant Impact
Less than Significant with
Mitigation Incorpo-rated
Less Than Significant Impact
No
Impact
Would the project: SI LS/M LS NI
Would the project result in substantial adverse
physical impacts associated with the provision of new
or physically altered governmental facilities, need for
new or physically altered governmental facilities, the
construction of which could cause significant environ-
mental impacts, in order to maintain acceptable
service ratios, response times or other performance
objectives for any of the public services:
a – e:
1, 3, 4,
5, 6,
XIII a) Fire protection? � � � � "
XIII b) Police protection? � � � � "
XIII c) Schools? � � � � "
XIII d) Recreation and Parks? � � � � "
XIII e) Other public facilities? � � � � "
Setting
This CEQA topic focuses on the need for new public facilities that might be the consequence
of new development due to increased demands for services and staffing. EIRs on the MSP
and the TASP identified the need for additional services as the residential population of
those areas increase.
Discussion
a) LS/M
Fire and emergency medical assistance services are provided throughout Milpitas by the
Milpitas Fire Department (MFD). The TASP EIR observes that additional development in
already developed areas may have the potential to impact [fire] response times, in addition
to presenting challenges to vehicle access and firefighting operations.
The TASP EIR recommends that a “standards-of-cover” analysis be conducted “to determine
the precise impact on the department’s staffing, equipment and any required facility
enhancements. In addition, the MFD will need to write an addendum to the City’s
emergency management plan to address the development of the project area.”
These recommendations from the TASP EIR have been incorporated into the 2009 Housing
Element to assure the adequacy of fire protection for new units at the designated 2009
Housing Element sites. With the inclusion of this provision (Housing Element Chapter IV.C),
the impact on fire protection would be mitigated.
b) NI
The MSP EIR reported the potential need to expand the police substation serving the MSP
area, related to growth in the City as a whole, and noted that such an expansion would be
subject to CEQA review independently of the Housing Element. The more recent TASP EIR
reports that “there are no known community concerns about the location, condition, size,
form, or condition of the current police stations.” An evaluation of no significant impact is
therefore appropriate.
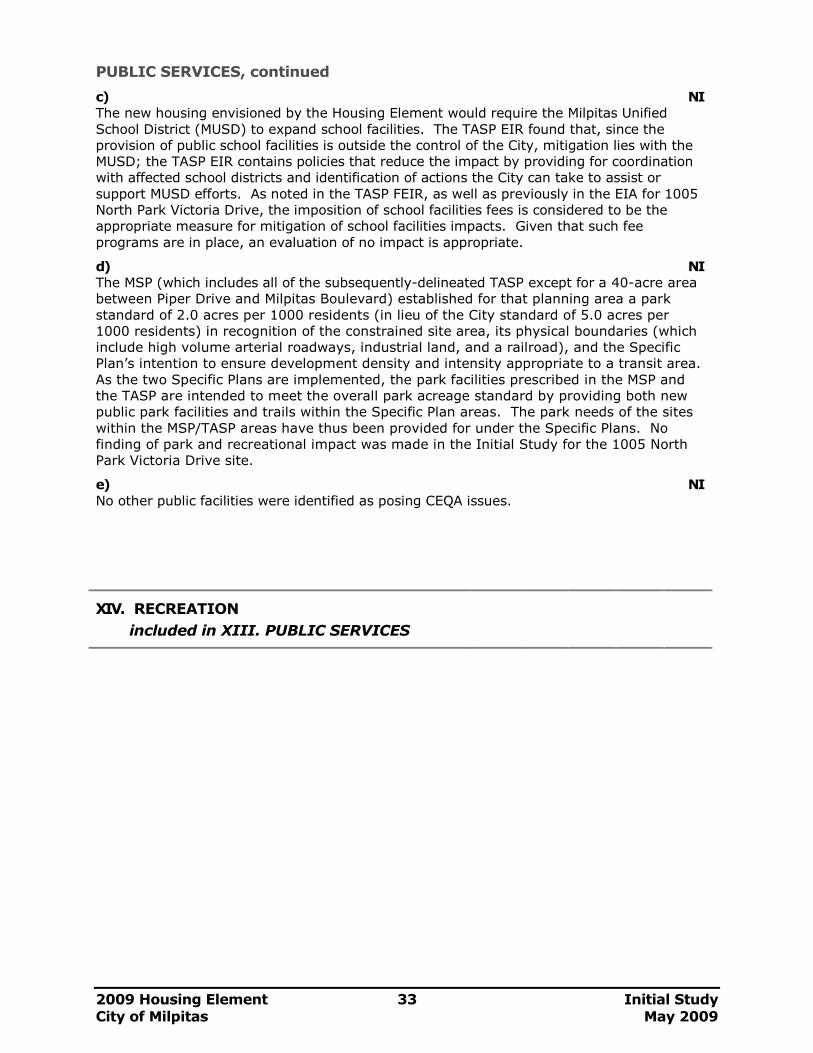
2009 Housing Element 33 Initial Study
City of Milpitas May 2009
PUBLIC SERVICES, continued
c) NI
The new housing envisioned by the Housing Element would require the Milpitas Unified
School District (MUSD) to expand school facilities. The TASP EIR found that, since the
provision of public school facilities is outside the control of the City, mitigation lies with the
MUSD; the TASP EIR contains policies that reduce the impact by providing for coordination
with affected school districts and identification of actions the City can take to assist or
support MUSD efforts. As noted in the TASP FEIR, as well as previously in the EIA for 1005
North Park Victoria Drive, the imposition of school facilities fees is considered to be the
appropriate measure for mitigation of school facilities impacts. Given that such fee
programs are in place, an evaluation of no impact is appropriate.
d) NI
The MSP (which includes all of the subsequently-delineated TASP except for a 40-acre area
between Piper Drive and Milpitas Boulevard) established for that planning area a park
standard of 2.0 acres per 1000 residents (in lieu of the City standard of 5.0 acres per
1000 residents) in recognition of the constrained site area, its physical boundaries (which
include high volume arterial roadways, industrial land, and a railroad), and the Specific
Plan’s intention to ensure development density and intensity appropriate to a transit area.
As the two Specific Plans are implemented, the park facilities prescribed in the MSP and
the TASP are intended to meet the overall park acreage standard by providing both new
public park facilities and trails within the Specific Plan areas. The park needs of the sites
within the MSP/TASP areas have thus been provided for under the Specific Plans. No
finding of park and recreational impact was made in the Initial Study for the 1005 North
Park Victoria Drive site.
e) NI No other public facilities were identified as posing CEQA issues.
XIV. RECREATION
included in XIII. PUBLIC SERVICES
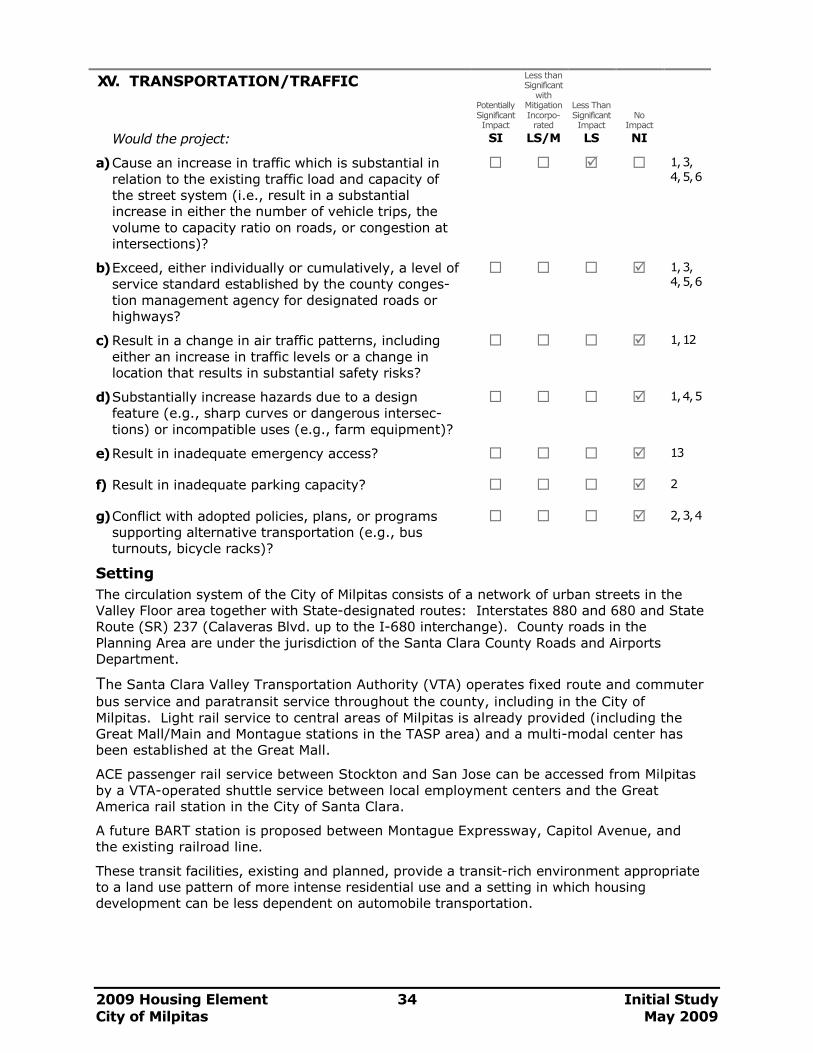
2009 Housing Element 34 Initial Study
City of Milpitas May 2009
XV. TRANSPORTATION/TRAFFIC
Potentially Significant Impact
Less than Significant with
Mitigation Incorpo-rated
Less Than Significant Impact
No
Impact
Would the project: SI LS/M LS NI
a) Cause an increase in traffic which is substantial in
relation to the existing traffic load and capacity of
the street system (i.e., result in a substantial
increase in either the number of vehicle trips, the
volume to capacity ratio on roads, or congestion at
intersections)?
� � � � 1, 3,
4, 5, 6
b) Exceed, either individually or cumulatively, a level of
service standard established by the county conges-
tion management agency for designated roads or
highways?
� � � � 1, 3,
4, 5, 6
c) Result in a change in air traffic patterns, including
either an increase in traffic levels or a change in
location that results in substantial safety risks?
� � � � 1, 12
d) Substantially increase hazards due to a design
feature (e.g., sharp curves or dangerous intersec-
tions) or incompatible uses (e.g., farm equipment)?
� � � � 1, 4, 5
e) Result in inadequate emergency access? � � � � 13
f) Result in inadequate parking capacity? � � � � 2
g) Conflict with adopted policies, plans, or programs
supporting alternative transportation (e.g., bus
turnouts, bicycle racks)?
� � � � 2, 3, 4
Setting
The circulation system of the City of Milpitas consists of a network of urban streets in the
Valley Floor area together with State-designated routes: Interstates 880 and 680 and State
Route (SR) 237 (Calaveras Blvd. up to the I-680 interchange). County roads in the
Planning Area are under the jurisdiction of the Santa Clara County Roads and Airports
Department.
The Santa Clara Valley Transportation Authority (VTA) operates fixed route and commuter
bus service and paratransit service throughout the county, including in the City of
Milpitas. Light rail service to central areas of Milpitas is already provided (including the
Great Mall/Main and Montague stations in the TASP area) and a multi-modal center has
been established at the Great Mall.
ACE passenger rail service between Stockton and San Jose can be accessed from Milpitas
by a VTA-operated shuttle service between local employment centers and the Great
America rail station in the City of Santa Clara.
A future BART station is proposed between Montague Expressway, Capitol Avenue, and
the existing railroad line.
These transit facilities, existing and planned, provide a transit-rich environment appropriate
to a land use pattern of more intense residential use and a setting in which housing
development can be less dependent on automobile transportation.
2009 Housing Element 35 Initial Study
City of Milpitas May 2009
TRANSPORTATION, continued
Because much of the City is built out, the Circulation Element of the Milpitas General plan
identified the primary traffic issues in Milpitas as the feasibility of improvements (space is
limited) and the achievement of an acceptable traffic service level. The Circulation Element
and the Housing Element are complementary in reflecting the fact that, while development
of additional housing would increase traffic, it would also make public transit access
easier/more convenient to a higher residential population and further strengthen the
potential for future enrichment of the transit network.
Discussion
a) LS
The Housing Element would not increase the City’s development capacity: no land use plan
or density changes are proposed. Thus, the Element would not result in traffic projections
exceeding those of the Santa Clara Valley Transportation Authority (VTA).
b) NI Housing units included in the draft Housing Element lie primarily within areas of Milpitas in
which the General Plan, through existing Specific Plans, recognizes Milpitas’s role as a
transit hub and provides for location of higher-density housing adjacent to transition
stations. While additional vehicular trips generated by new housing could result in lower
levels of service (LOS) on Milpitas streets and roads, these impacts are identified and,
where feasible, these impacts were mitigated in prior environmental documents, including
those on the Midtown Specific Plan and the Transit Area Specific Plan. The policy basis of
these plans focuses on creating an urban community with a network of transit and other
non-automobile travel modes so that dependence on the automobile is reduced.
The EIA on the 1005 North Park Victoria Drive site observes that the project would add 300
average daily trips on North Park Victoria Drive: an increase of no more than 4.5 percent.
No traffic impact was found relating to this increase in traffic levels.
c), d) NI There is no aviation facility in Milpitas and the Housing Element does not propose any street
construction.
e) NI
Through site plan review, the planning process assures that adequate emergency access to
individual residential uses is provided. Overall emergency access is discussed above under
XIII. Public Services−Fire (p. 30).
f) NI
Parking requirements and requirements for alternative transportation would subject to
review as part of project approval.
g) NI
Overall, the Housing Element would have a positive impact on plans and programs
supporting alternative transportation by promoting higher density housing around transit
stations and in close proximity to employment centers.
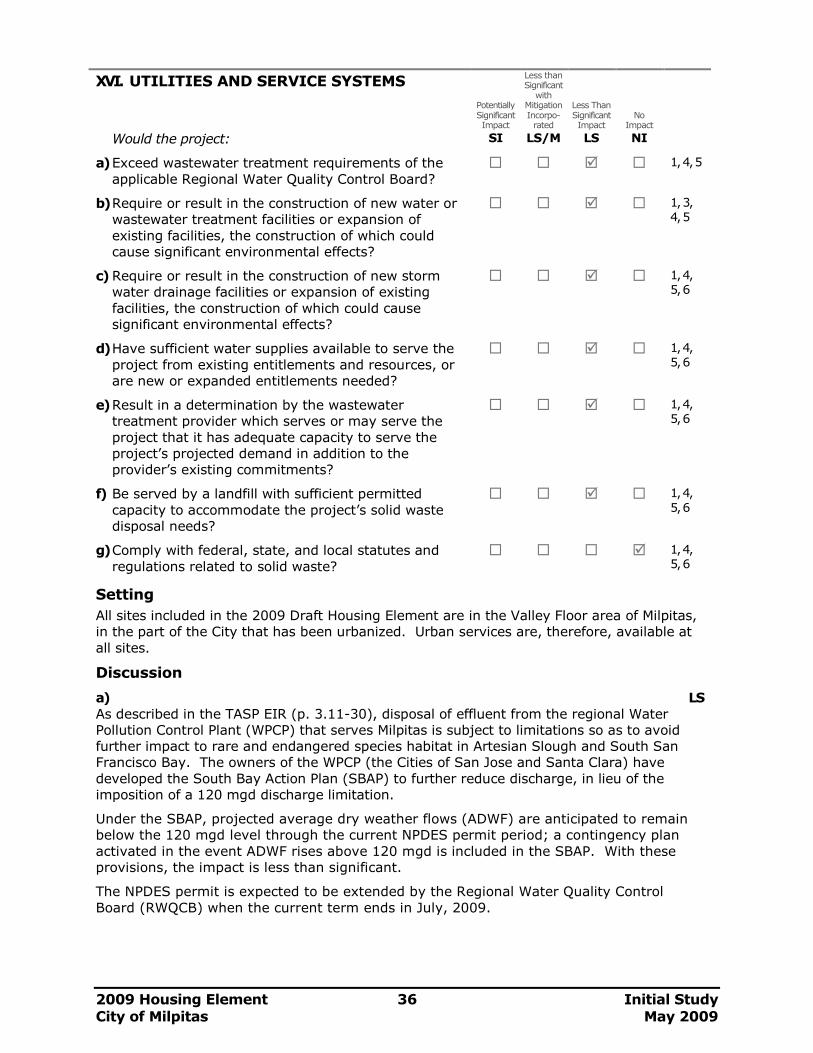
2009 Housing Element 36 Initial Study
City of Milpitas May 2009
XVI. UTILITIES AND SERVICE SYSTEMS
Potentially Significant Impact
Less than Significant with
Mitigation Incorpo-rated
Less Than Significant Impact
No
Impact
Would the project: SI LS/M LS NI
a) Exceed wastewater treatment requirements of the
applicable Regional Water Quality Control Board? � � � � 1, 4, 5
b) Require or result in the construction of new water or
wastewater treatment facilities or expansion of
existing facilities, the construction of which could
cause significant environmental effects?
� � � � 1, 3,
4, 5
c) Require or result in the construction of new storm
water drainage facilities or expansion of existing
facilities, the construction of which could cause
significant environmental effects?
� � � � 1, 4,
5, 6
d) Have sufficient water supplies available to serve the
project from existing entitlements and resources, or
are new or expanded entitlements needed?
� � � � 1, 4,
5, 6
e) Result in a determination by the wastewater
treatment provider which serves or may serve the
project that it has adequate capacity to serve the
project’s projected demand in addition to the
provider’s existing commitments?
� � � � 1, 4,
5, 6
f) Be served by a landfill with sufficient permitted
capacity to accommodate the project’s solid waste
disposal needs?
� � � � 1, 4,
5, 6
g) Comply with federal, state, and local statutes and
regulations related to solid waste? � � � � 1, 4,
5, 6
Setting
All sites included in the 2009 Draft Housing Element are in the Valley Floor area of Milpitas,
in the part of the City that has been urbanized. Urban services are, therefore, available at
all sites.
Discussion
a) LS
As described in the TASP EIR (p. 3.11-30), disposal of effluent from the regional Water
Pollution Control Plant (WPCP) that serves Milpitas is subject to limitations so as to avoid
further impact to rare and endangered species habitat in Artesian Slough and South San
Francisco Bay. The owners of the WPCP (the Cities of San Jose and Santa Clara) have
developed the South Bay Action Plan (SBAP) to further reduce discharge, in lieu of the
imposition of a 120 mgd discharge limitation.
Under the SBAP, projected average dry weather flows (ADWF) are anticipated to remain
below the 120 mgd level through the current NPDES permit period; a contingency plan
activated in the event ADWF rises above 120 mgd is included in the SBAP. With these
provisions, the impact is less than significant.
The NPDES permit is expected to be extended by the Regional Water Quality Control
Board (RWQCB) when the current term ends in July, 2009.
2009 Housing Element 37 Initial Study
City of Milpitas May 2009
UTILITIES AND SERVICE SYSTEMS, continued
b) NI The buildout of the TASP as described in its EIR would result in an increase in sewage
generation over the level estimated for this area in the Milpitas 2004 Sewer Master Plan.
Several sewer improvement projects are included in the TASP that are intended to
accommodate the additional flows associated with the increase in residential development
expected with the Transit Area (see TASP EIR, p. 3.11-24). With these improvements
incorporated in the TASP, the impact is less than significant, and no mitigation measures
are required. The environmental documents for the MSP and the other Housing Element
site (1005 North Park Victoria Drive) did not identify a significant sewage capacity impact.
c) LS The MSP states that runoff flows associated with that Specific Plan would be lower than
those associated with the previous General Plan, due to the lower runoff volume character-
istic of high-density residential development as compared to commercial, office, and
industrial uses. No additional stormwater system trunk facilities were found to be needed;
Within the TASP area, improvements called for in the 2001 Storm Drainage Master Plan
(would be implemented. At the 1005 North Park Victoria site, a potential for infiltration was
found but, given the size of the site relative to the local drainage basin and available
facilities, as well as the City’s requirements for on-site drainage improvements, the impact
was considered not significant.
d) LS/M
Water needs for Milpitas are met by a combination of water purchases from the San
Francisco PUC and the Santa Clara Valley Water Districts (SCVWD). The MSP EIR
reported that the increase in housing units associated with that Plan would lie within the
population level characterized in SCVWD’s projections as its “upper bound.” Water supply
impacts of the MSP were, therefore, found less than significant.
The TSP EIR, in reviewing overall City water demand, found (under guidelines laid out in
SB 610) a need for additional allotments of water supply from SCVWD, reporting that the
needed increase of approximately 1.0 mgd “will be adequately offset by the supplies
available from SCVWD.” Therefore, the impact of the increase in demand was found to
been less than significant with the additional water supply allocations.
Both Specific Plan EIRs note, as stated in the MSP EIR, that “during drought years the
demand will exceed supply as early as 2007, depending on the severity of the drought.”
Drought conditions are expected to be alleviated via emergency wells and increased use
of recycled water to offset potable water demand. (TASP p. 3.11-2)
The EIA for the 1005 North Park Victoria Drive site found that the impact of that project on
the water supply would be significant unless mitigated. Therefore, in conjunction with the
site review for any future development on this site, a review of the adequacy of the water
supply to serve this site may be required. If potentially significant impacts are identified,
the City may require that those impacts be mitigated to the less-than-significant level.
e) NS
The increase in residential units intended under the Housing Element would add to flows in
the City’s sanitary sewer system and its discharge to the Regional San Jose/Santa Clara
Water Pollution Control Plant (WPCP). While the EIR for 1005 N. Park Victoria Drive found
no significant impact on sewerage and wastewater treatment, overall the development of
housing under the Housing Element would have a cumulative effect on wastewater
collection, treatment and discharge needs.
The MSP provided for the shortfall in Milpitas’s treatment capacity at the WPCP via mitigation
Measure Util-1 (MSP EIR p. 3.5-13), calling for participation in the WPCP Action Plan projects
to reduce existing wastewater flows and participation in the South Bay Water Recycling
Program, and pursuing additional recycled water opportunities whenever available.
2009 Housing Element 38 Initial Study
City of Milpitas May 2009
UTILITIES AND SERVICE SYSTEMS, continued
In the period between the City’s certification of the MSP EIR and the preparation of the
TASP EIR, Milpitas purchased an additional one (1) mgd (millions of gallons per day) of flow
capacity from the West Valley Sanitation District, raising its WPCP capacity from 12.5 mgd
to 13.5 mgd. Daily flows as of the time reported in the TASP EIR were generally between 8
and 9 mgd, with wet weather flows (December 2006) reported at 9.358 mgd.
Over half of the sites included in the 2002 Housing Element EIR remain in the 2009 Draft
Housing Element. The number of “new” sites, as presented in Table 1, is about 18, with a
capacity of 3,500 housing units, but these units would replace previously developed uses
within the two Specific Plan areas, for which utility service needs were included in the
previous Specific Plans and their EIRs. Therefore, the Specific Plan assessments of impacts
on treatment capacity and the mitigation of those impacts remain applicable, making a
finding of a less-than-significant impact appropriate.
The TASP EIR observes that “Much of the infrastructure within the WPCP is at or beyond its
original design life.” Thus, portions of the facilities are expected to require upgrading or
replacement during the life of the residential development included in the 2009 Draft
Housing Element. This is not an impact of the project, but is it a factor in the future envi-
ronmental setting that Milpitas and the other two parties in the Master Agreement for
Wastewater Treatment (the Cities of Santa Clara and San Jose) will face in coming years.
The TASP EIR reported that the San Jose Environmental Services Department, which
operates and maintains the treatment plant, was proceeding with determining interim
capital improvements needed at the plant over the next 5 to 10 year period.
f), g) NI Milpitas disposes of solid waste at the Newby Island Sanitary Landfill, which is owned by
Allied Waste/BFI and located in the City of San Jose. The landfill accepts non-hazardous
waste only: solid waste, recyclables, and compostable materials. The City of Milpitas
participates in Santa Clara County's Hazardous Waste Program, which provides a drop-off
site for residents (and other small generators).
The City’s contract with the landfill runs through 2017; the facility is anticipated to close in
2023. Although the destination of solid waste from the Housing Element sites (and the rest
of Milpitas) is unknown after that date, the TASP EIR cites the 2005 EIR for the North San
Jose Development Policies Update project to the effect that Santa Clara County’s Integrated
Waste Management Plan includes sufficient landfill capacity for the County’s projected
needs for at least 30 years. The TASP EIR reports that BFI has assured the City that the
amount of waste generated from the TASP area would not cause an appreciable change to
the filling rate of the landfill. Compliance with Milpitas’s Source Reduction and Recycling
Program and MSP policies further ensure that impacts on landfill would be less than
significant.
No impacts on solid waste were found for the 1005 North Park Victoria Drive site.
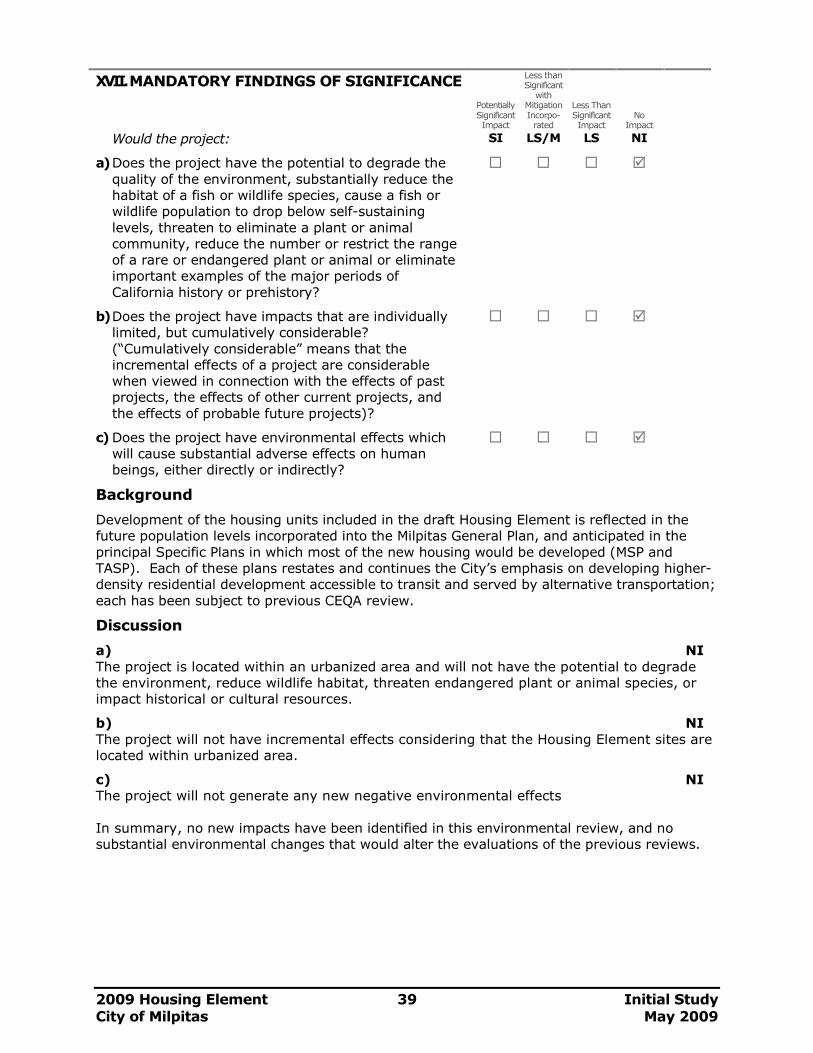
2009 Housing Element 39 Initial Study
City of Milpitas May 2009
XVII. MANDATORY FINDINGS OF SIGNIFICANCE
Potentially Significant Impact
Less than Significant with
Mitigation Incorpo-rated
Less Than Significant Impact
No
Impact
Would the project: SI LS/M LS NI
a) Does the project have the potential to degrade the
quality of the environment, substantially reduce the
habitat of a fish or wildlife species, cause a fish or
wildlife population to drop below self-sustaining
levels, threaten to eliminate a plant or animal
community, reduce the number or restrict the range
of a rare or endangered plant or animal or eliminate
important examples of the major periods of
California history or prehistory?
� � � �
b) Does the project have impacts that are individually
limited, but cumulatively considerable?
(“Cumulatively considerable” means that the
incremental effects of a project are considerable
when viewed in connection with the effects of past
projects, the effects of other current projects, and
the effects of probable future projects)?
� � � �
c) Does the project have environmental effects which
will cause substantial adverse effects on human
beings, either directly or indirectly?
� � � �
Background
Development of the housing units included in the draft Housing Element is reflected in the
future population levels incorporated into the Milpitas General Plan, and anticipated in the
principal Specific Plans in which most of the new housing would be developed (MSP and
TASP). Each of these plans restates and continues the City’s emphasis on developing higher-
density residential development accessible to transit and served by alternative transportation;
each has been subject to previous CEQA review.
Discussion
a) NI
The project is located within an urbanized area and will not have the potential to degrade
the environment, reduce wildlife habitat, threaten endangered plant or animal species, or
impact historical or cultural resources.
b) NI
The project will not have incremental effects considering that the Housing Element sites are
located within urbanized area.
c) NI
The project will not generate any new negative environmental effects
In summary, no new impacts have been identified in this environmental review, and no
substantial environmental changes that would alter the evaluations of the previous reviews.
2009 Housing Element 40 Initial Study
City of Milpitas May 2009
Global Climate Change Impacts (Cumulative Impacts and Long-Term Environmental Goals)
Setting
Global climate change is the alteration of the earth’s weather including its temperature,
precipitation, and wind patterns. Global temperatures are affected by naturally-occurring and
anthropogenic-generated atmospheric gases, such as carbon dioxide, methane, and nitrous
oxide. These “greenhouse” gases (GHG) allow sunlight into the Earth’s atmosphere but
prevent radiative heat from escaping into outer space, with an outcome that is referred as the
“greenhouse” effect. The world’s leading climate scientists have reached consensus that
global climate change is under way and is very likely caused by humans.
Agencies at the international, national, state, and local levels are considering strategies to
control emissions of the greenhouse gases that contribute to global warming; however, no
comprehensive strategy is being implemented on a global scale that addresses climate
change.
In California, a multi-agency “Climate Action Team” has identified a range of strategies and
the Air Resources Board, under Assembly Bill (AB) 32, has been designated to adopt the main
plan for reducing California's GHG emissions by January 1, 2009, and various regulations and
other initiatives for reducing GHG emissions by January 1, 2011. AB 32 requires achievement
by 2020 of a statewide greenhouse gas emissions limit equivalent to 1990 emissions, and the
adoption of rules and regulations to achieve the maximum technologically feasible and cost-
effective greenhouse gas emissions reductions. By 2050, the state plans to reduce emissions
to 80 percent below 1990 levels.
Although California has established programs to reduce greenhouse gas emissions, there are
no established standards for gauging the significance of greenhouse gas emissions. Neither
CEQA nor the CEQA Guidelines provide any methodology for analysis of greenhouse gases.
Given the global scope of global climate change, the challenge under CEQA is for a Lead
Agency to translate the issue down to the level of a CEQA document for a specific project in a
way that is meaningful to the decision-making process. Under CEQA, the essential questions
are whether a project creates or contributes to an environmental impact or is subject to
impacts from the environment in which it would occur, and what mitigation measures are
available to avoid or reduce impacts.
Discussion
Sites designated for housing under the 2009 Housing Element update are all located in an
established urban area served by existing infrastructure (rather than at greenfield sites), and
the vast majority of these sites (about 99 percent) are located in Specific Plan areas for which
previous EIRs have established mitigation measures to reduce vehicle trips and energy use.
In an effort to disclose environmental impacts and to conform with the CEQA Guidelines
[Section 16064(b)], it is the City’s position that, based on the nature of the Housing Element,
the locations of the designated housing sites, and the measures established in the prior
Specific Plans the proposed project would not impede the state’s ability to reach the emission
reduction limits/standards set forth by the State of California by Executive Order S-3-05 and
AB 32.
Although quantitative measures of climate change have not yet been readily accepted, there
are other ways to measure impacts and reduce GHG. The Transit Area Specific Plan functions
for the City of Milpitas as a whole as a guiding document for the development of intensified
housing and commercial uses near transit hubs. It imposes mitigation directly on all Housing
Element units within its boundaries, and it establishes a basis for mitigation for all other
housing in the City of Milpitas. While the EIR for the TASP identified a significant and
unavoidable impact relating to air quality, development near transit stations, over the long
2009 Housing Element 41 Initial Study
City of Milpitas May 2009
run, will reduce vehicle trips, and subsequently reduce vehicle emissions. Continuing
intensification of the housing supply in the Valley Floor of Milpitas, where transit service is
available and is planned for further intensification, will strengthen the effects of the mitigation
measures implemented within the TASP.
Conclusion: With the concentration of housing and jobs near transit hubs, the 2009 Housing
Element would not make a cumulatively considerable contribution to global climate change.
[Less Than Significant Cumulative Impact]
2009 Housing Element 42 Initial Study
City of Milpitas May 2009
SOURCE KEY
1 Milpitas General Plan, 1994, Updated 2002
2 City of Milpitas, City Ordinances
3 2002 Housing Element Update, Initial Study Checklist, August/October 2002
4 Milpitas Transit Area Specific Plan, Draft Environmental Impact Report, October 2007; Final Environmental Impact Report, May 2008; Statement of Overriding Considerations (City Council Resolution 7759), June 3, 2008
5 Midtown Specific Plan, Draft Environmental Impact Report, October 2001; Final Environmental Impact Report, January 2002; Statement of Overriding Considerations (City Council Resolution 7150), March 19, 2002
6 Environmental Impact Assessment (EIA) and Negative Declaration, Annexation and Rezoning of 1005 N. Park Victoria Drive at County Club Drive, August 28, 1990
7 1880 N. Milpitas Blvd. (formerly 1884 N. Main Street), Environmental Assessment 2006-9, October 19, 2006
8 Murphy Ranch Residential Project, Draft Environmental Impact Report, June 2007; Final Environmental Impact Report, October 16, 2007
9 McCandless Mixed Use Project, Initial Study, November 2008
10 513 Los Coches Street, Initial Study, March 2009
11 Aerial Maps, City of Milpitas
12 Staff, City of Milpitas.
13 Bay Area Air Quality Management District, Ambient Air Quality Standards & Bay Area Attainment Status, December 30, 2008
14 Department of Conservation, State of California, Important Farmlands Map, Santa Clara County, 2006
CURRENT RESIDENTIAL PROJECTS OUTSIDE THE MIDTOWN SPECIFIC
PLAN (MSP) AND THE TRANSIT AREA SPECIFIC PLAN (TASP)
Project CEQA Document CEQA Review Date Landmark Towers FEIR November 18, 2008 Milpitas Square DEIR (published April, 2009) pending Murphy Ranch Residential Project FEIR October 16, 2007 Sinclair Renaissance Mitigated Negative Declaration August 5, 2008 Town Center Villas Mitigated Negative Declaration March, 2004
AVAILABILITY FOR PUBLIC REVIEW
City of Milpitas planning and environmental documents are available for public review as
follows: City of Milpitas City Hall 455 E. Calaveras Blvd. 8:00 a.m. to 5:00 p.m. (Mon.-Fri.)
City of Milpitas Public Library
160 N. Main Street 10:00 a.m. to 9:00 p.m. (Mon.-Thurs.); 10:00 a.m. to 6:00 p.m. (Fri.-Sun.)
2009 Housing Element 43 Initial Study
City of Milpitas May 2009
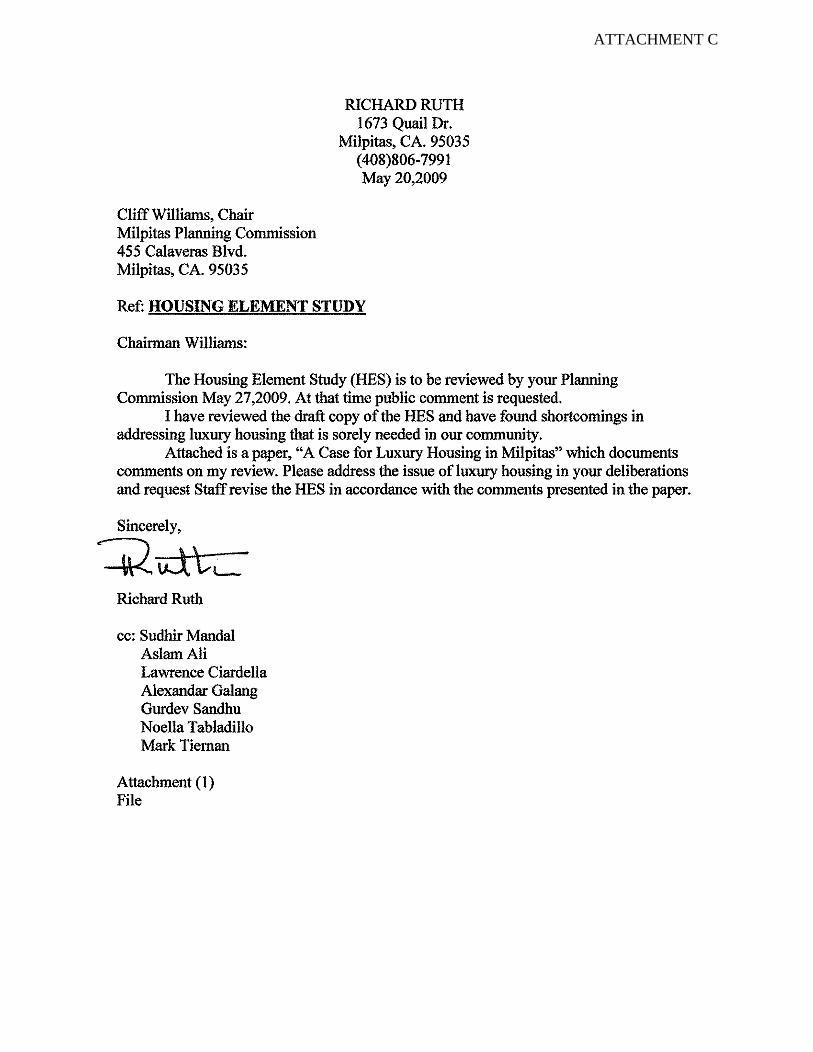
ATTACHMENT C