Embed Size (px)
Citation preview

MIDDLE SCHOOL STEM
ADVENTURES
IN PARTNERSHIP WITH:
FOLLOW US - @SFGRADVENTURE JOIN THE CONVERSATION: #PHYSICSDAY1
2017 EDITION
WRITTEN BY: TOM PATERSON

1
SIX FLAGS GREAT ADVENTURE
MIDDLE STEM ADVENTURES WORKBOOK
TABLE OF CONTENTS
RESOURCE MATERIALS
PAGE 2
INTRODUCTION AND LEARNING GOALS
PAGE 3
MAKING MEASUREMENTS AND MATHEMATICAL MODELS
RIDES
PAGES 4 - 10
THE BIG WHEEL (ADVENTURE ALLEY)
PAGES 11 – 18
ENCHANTED TEACUPS (FANTASY FOREST)
PAGES 19 – 22
HARLEY QUINN CRAZY TRAIN (LAKEFRONT)
PAGES 23 – 25
THE BUCCANEER (LAKEFRONT)
PAGES 26 – 28
GOING IN CIRCLES
PAGES 29 – 34
ESTIMATION AND PLANNING
2
INTRODUCTION
Six Flags Great Adventure is more than just a theme park – it provides an outstanding resource for
educators to share with their students. It provides students with the unique opportunity to provide
first-hand experience for many of the concepts that are taught in Physical Science courses such as
acceleration, rotational motion, conservation of energy, and forces – big and small – that are simply
impossible to demonstrate in the classroom environment. There are also multiple opportunities to
apply STEM thinking and skills to the real world applications that the park provides. Every aspect of the
park uses these skills to make the daily operations possible – from collecting tickets on the way in, to
sending riders on thrilling rides at incredible speeds. While the day at the park will be a ‘fun’ activity, it
is also a day of hands-on learning and practical application of the topics they have worked throughout
the year to master.
LEARNING GOALS
This workbook was designed to provide an opportunity to reinforce and assess skills and topics taught in
the average middle school STEM curriculum. Students need not to have taken any specialized STEM-
style classes, instead it is centered around bringing together concepts students will have learned as part
of their standard Math and Science courses. Students should have a basic understanding of:
• Newton’s Laws of Motion
• Forces
• Circular Motion
• Energy
• Geometry
• Estimation
Students will:
• Collect physical data for analysis
• Predict, experience, and document forces acting on a rider at different points during a ride
• Apply mathematical models to find and compare quantitative values
INSTRUCTIONAL PREPARATION
Prior to going to the park, have students familiarize themselves with the workbook and the questions
they will be asked. It is important for students to understand what measurements they will need to
make (timing, counting, sensations, etc.) and when they need to make them (while waiting in line, while
riding, while observing from another location). Having the students understand what is expected of
them is the single biggest indicator of success in completing this packet! It is worth class time to go
through, explain, and answer questions.
3
Making Measurements
The only tool you will need for making measurements is something that will measure an elapsed time in
seconds. You can use a stopwatch, wristwatch, or cell phone app. Most measurements will be over the
course of many seconds, so having a very precise instrument is not necessary.
The other data you will be collecting will use you as the instrument – you will use your eyes to count and
make observations, and you will use your body and brain to “feel” forces exerted on you. No fancy
equipment necessary!
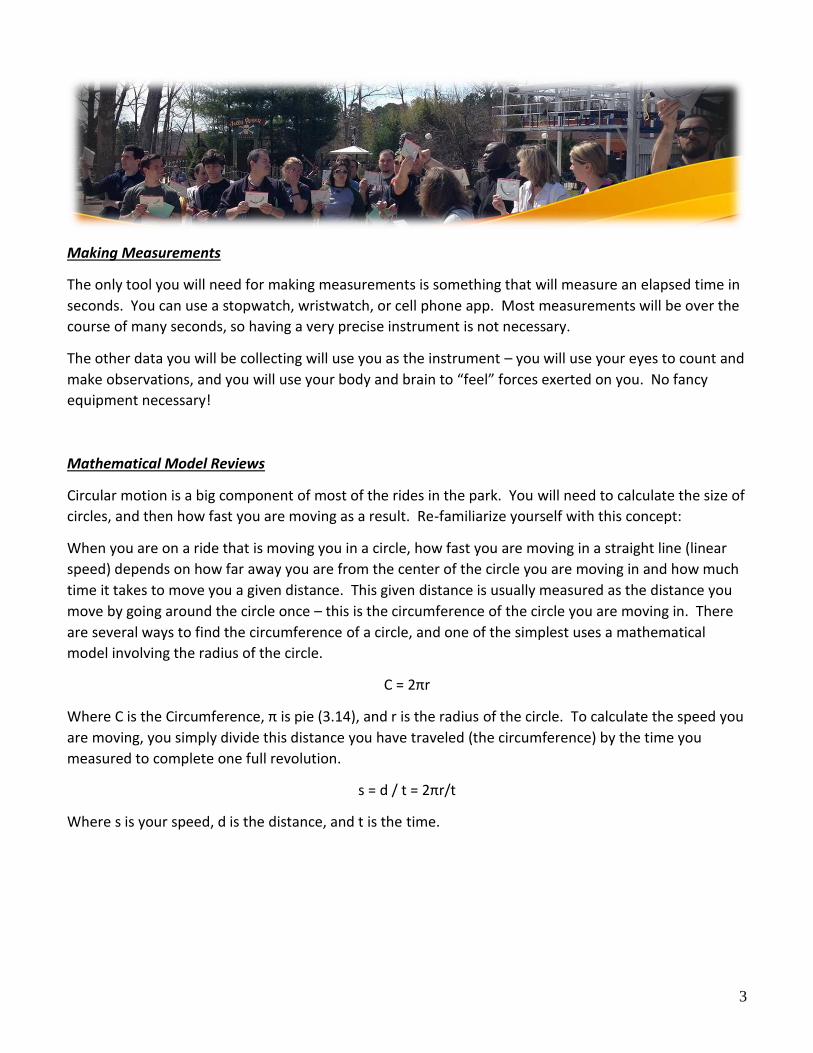
Mathematical Model Reviews
Circular motion is a big component of most of the rides in the park. You will need to calculate the size of
circles, and then how fast you are moving as a result. Re-familiarize yourself with this concept:
When you are on a ride that is moving you in a circle, how fast you are moving in a straight line (linear
speed) depends on how far away you are from the center of the circle you are moving in and how much
time it takes to move you a given distance. This given distance is usually measured as the distance you
move by going around the circle once – this is the circumference of the circle you are moving in. There
are several ways to find the circumference of a circle, and one of the simplest uses a mathematical
model involving the radius of the circle.
C = 2πr
Where C is the Circumference, π is pie (3.14), and r is the radius of the circle. To calculate the speed you
are moving, you simply divide this distance you have traveled (the circumference) by the time you
measured to complete one full revolution.
s = d / t = 2πr/t
Where s is your speed, d is the distance, and t is the time.
4
THE
BIG WHEEL
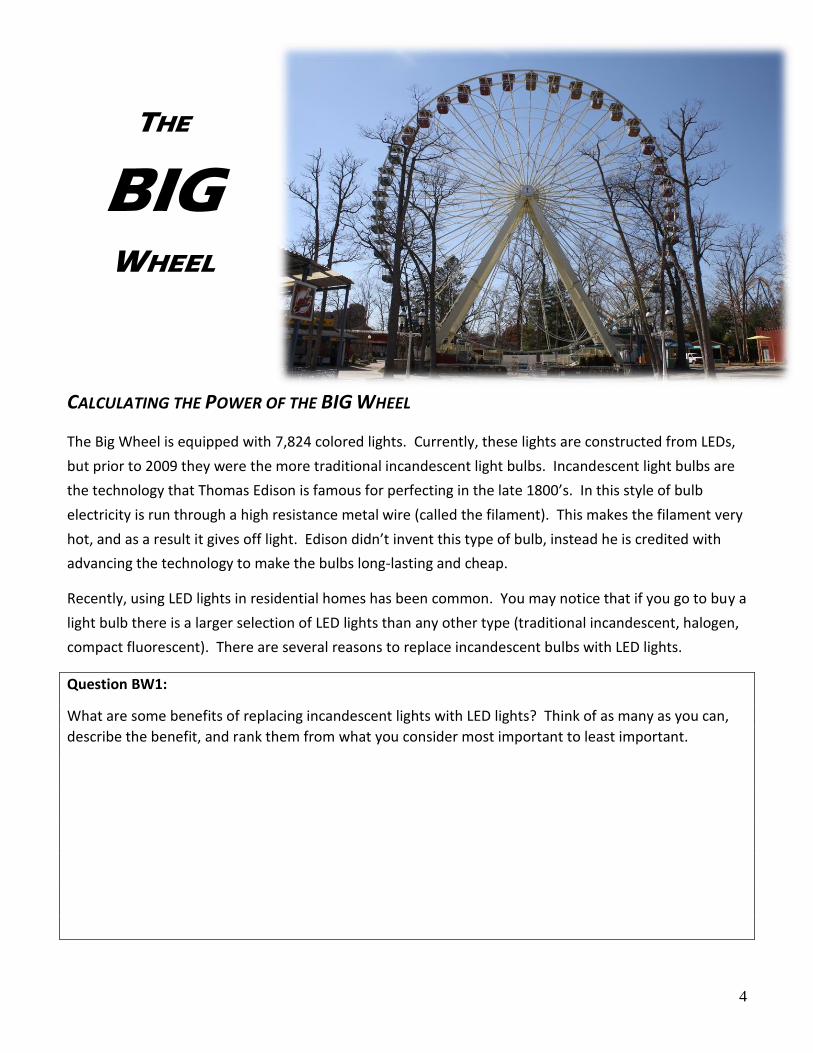
CALCULATING THE POWER OF THE BIG WHEEL
The Big Wheel is equipped with 7,824 colored lights. Currently, these lights are constructed from LEDs,
but prior to 2009 they were the more traditional incandescent light bulbs. Incandescent light bulbs are
the technology that Thomas Edison is famous for perfecting in the late 1800’s. In this style of bulb
electricity is run through a high resistance metal wire (called the filament). This makes the filament very
hot, and as a result it gives off light. Edison didn’t invent this type of bulb, instead he is credited with
advancing the technology to make the bulbs long-lasting and cheap.
Recently, using LED lights in residential homes has been common. You may notice that if you go to buy a
light bulb there is a larger selection of LED lights than any other type (traditional incandescent, halogen,
compact fluorescent). There are several reasons to replace incandescent bulbs with LED lights.
Question BW1:
What are some benefits of replacing incandescent lights with LED lights? Think of as many as you can,
describe the benefit, and rank them from what you consider most important to least important.
5
Power is a measure of how much Energy is
produced or consumed over a given amount of
time. For light bulbs the common unit for
Power is the Watt (W). This unit tells us how
much Energy (measured in a unit called the
Joule) is consumed by a bulb every second it is
in operation. For example, a 100 W light bulb
consumes 100 Joules of electrical energy every
second.
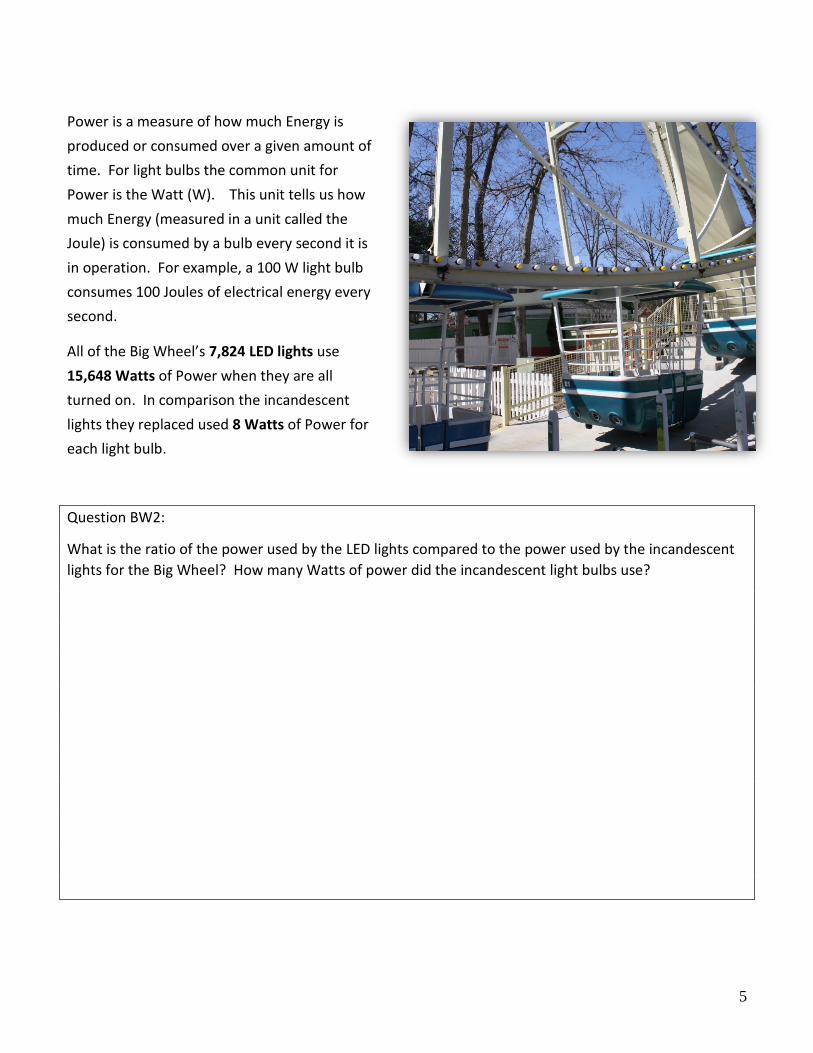
All of the Big Wheel’s 7,824 LED lights use
15,648 Watts of Power when they are all
turned on. In comparison the incandescent
lights they replaced used 8 Watts of Power for
each light bulb.
Question BW2:
What is the ratio of the power used by the LED lights compared to the power used by the incandescent
lights for the Big Wheel? How many Watts of power did the incandescent light bulbs use?

6
ALL LIT UP
Using less lights that consume less power result in
lower energy costs. The relationship between
energy use and energy cost is directly proportional –
if your energy use goes up by double, then the
energy cost is double. If your energy use goes down
by half, then the energy cost is half.
The incandescent lights had cost Six Flags
approximately $160 per day in electricity to light up
the Big Wheel.
Question BW3:
Approximately how much does the electricity the LED lights use cost Six Flags per day?
Question BW4:
How much money did Six Flags save by converting from incandescent lights to LED lights over the course
of a year? Assume that the park is open for 180 days per year and the Big Wheel’s lights are on for 12
hours each day.
Extra credit: How much does Six Flags pay for electricity (per kWh)?
7
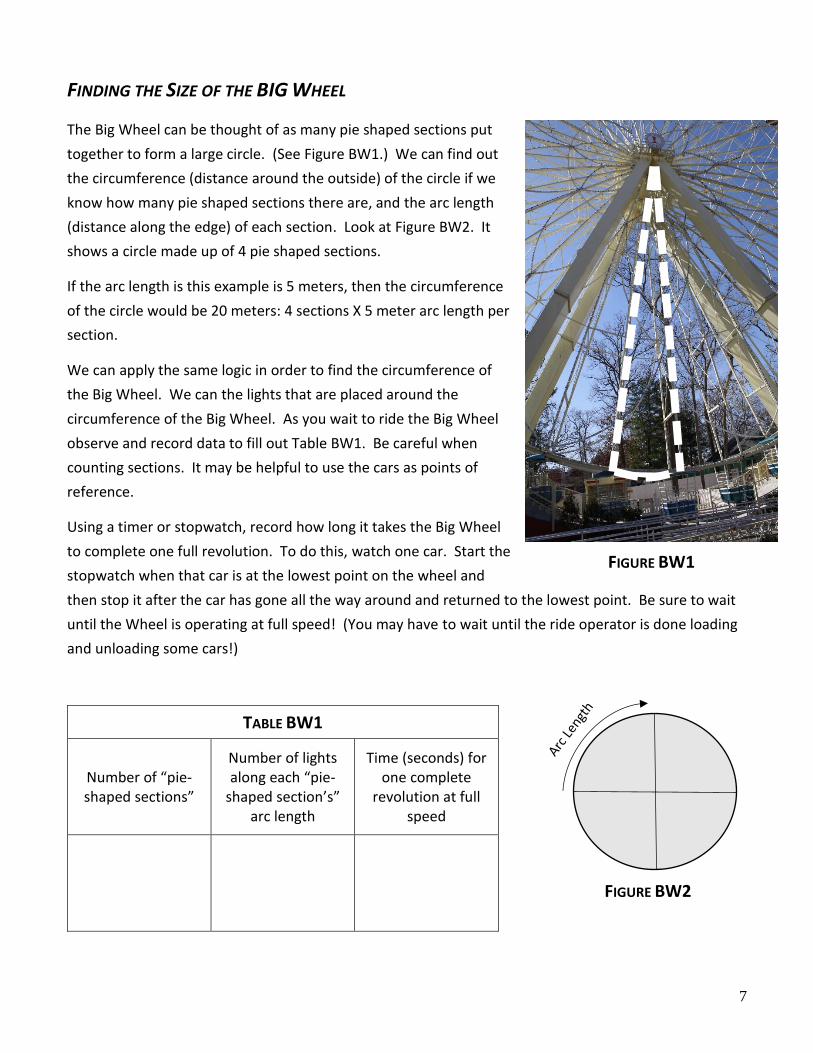
FINDING THE SIZE OF THE BIG WHEEL
The Big Wheel can be thought of as many pie shaped sections put
together to form a large circle. (See Figure BW1.) We can find out
the circumference (distance around the outside) of the circle if we
know how many pie shaped sections there are, and the arc length
(distance along the edge) of each section. Look at Figure BW2. It
shows a circle made up of 4 pie shaped sections.
If the arc length is this example is 5 meters, then the circumference
of the circle would be 20 meters: 4 sections X 5 meter arc length per
section.
We can apply the same logic in order to find the circumference of
the Big Wheel. We can the lights that are placed around the
circumference of the Big Wheel. As you wait to ride the Big Wheel
observe and record data to fill out Table BW1. Be careful when
counting sections. It may be helpful to use the cars as points of
reference.
Using a timer or stopwatch, record how long it takes the Big Wheel
to complete one full revolution. To do this, watch one car. Start the
stopwatch when that car is at the lowest point on the wheel and
then stop it after the car has gone all the way around and returned to the lowest point. Be sure to wait
until the Wheel is operating at full speed! (You may have to wait until the ride operator is done loading
and unloading some cars!)
TABLE BW1
Number of “pie-shaped sections”
Number of lights along each “pie-
shaped section’s” arc length
Time (seconds) for one complete
revolution at full speed
FIGURE BW1
FIGURE BW2

8
We know that the distance between lights along the circumference of the Big Wheel is 7.5 inches. Use
this information and the data you collected to determine the circumference of the Big Wheel in meters.
Question BW5: (put your answers on the lines, show your work below)
What is the length of each section’s edge? ______________
What is the circumference of the Big Wheel? _____________
SPEED OF THE BIG WHEEL
We are interested in finding out how fast are you moving while you are riding in a Big Wheel car. This is
called your linear speed. To figure this out recall that Speed can be found by dividing the distance
traveled by the time it takes to travel it. For the Big Wheel, the distance traveled is approximately the
circumference of the Big Wheel.
Question BW6:
Using the information you calculated about the size of the Big Wheel and the measurement you took for
the time of one full revolution, calculate the speed of a rider on the Big Wheel:

9
Question BW7:
Does your linear speed when you are on a circular ride like the Big Wheel depend on the size of the ride?
What would happen to your linear speed if the Big Wheel was smaller, but took the same amount of
time to complete one revolution?
Question BW8:
Kingda Ka propels riders to a speed of approximately 125 miles per hour. How many times faster is this
speed compared to the Speed of a rider on the Big Wheel?
PATH OF THE RIDERS ON THE BIG WHEEL
Question BW9:
Watch how the cars move as the Big Wheel rotates. What do you notice about the orientation of the
cars as they move from the bottom of the wheel to the top? Do you think that the Speed of a rider on
the Big Wheel is always the same as they move through one full revolution? (Assume the ride operator
is not speeding up or slowing down the wheel during this revolution.) Hint: Do you think the riders are
moving along a perfect circle? How would this affect the distance the riders are travelling? When you
are moving in a circle, what determines your linear speed?
10
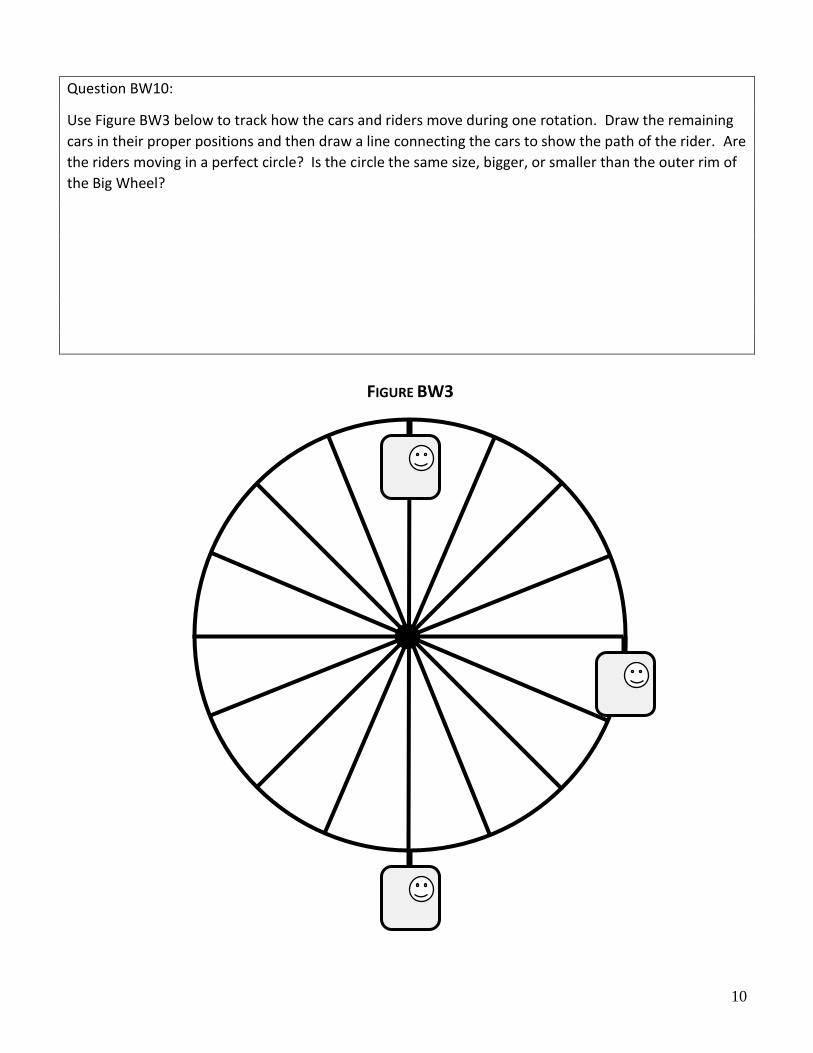
Question BW10:
Use Figure BW3 below to track how the cars and riders move during one rotation. Draw the remaining
cars in their proper positions and then draw a line connecting the cars to show the path of the rider. Are
the riders moving in a perfect circle? Is the circle the same size, bigger, or smaller than the outer rim of
the Big Wheel?
FIGURE BW3
11
ENCHANTED TEACUPS
The Enchanted Teacups, like many theme park rides, uses
circular motion (moving in circles) to provide riders with
thrills and excitement, and in this case riders can control
some of the motion by spinning their Tea Cup about its axis!
Creating thrills with circular motion doesn’t necessarily mean you have to be traveling very fast; most of
the sensations you feel are the result of changing the direction you are moving in. Because you are
moving in circles, your direction of motion is always changing.
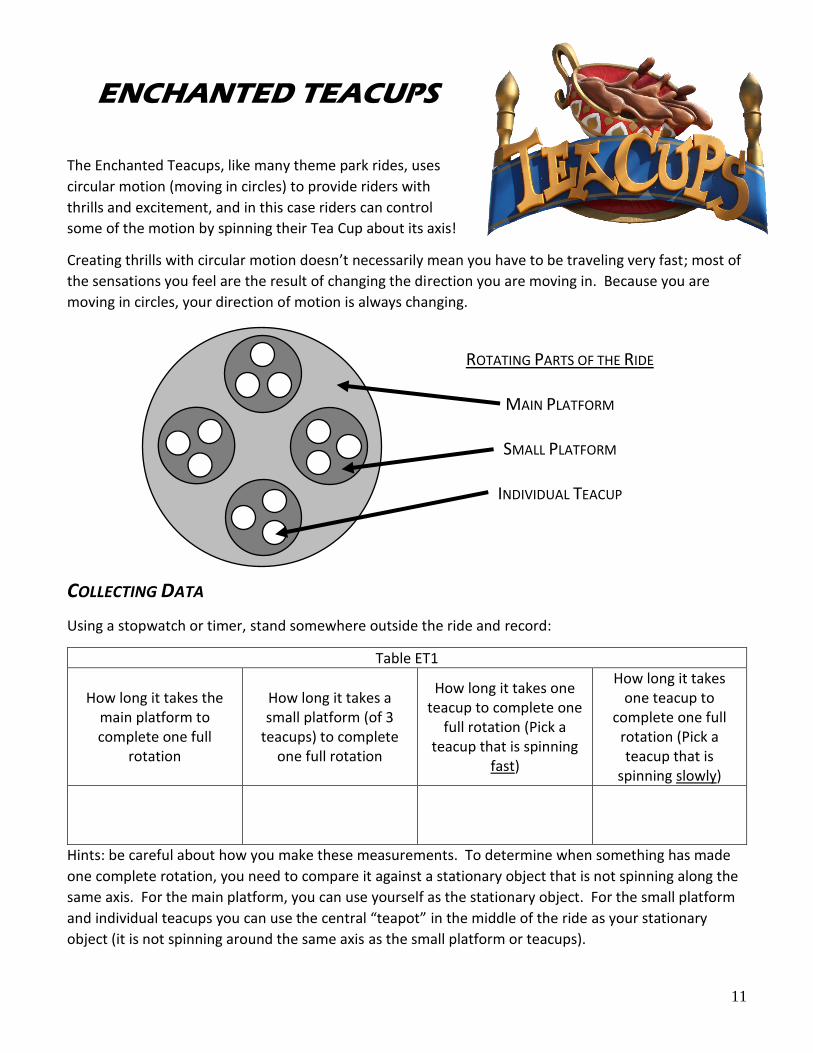
COLLECTING DATA
Using a stopwatch or timer, stand somewhere outside the ride and record:
Table ET1
How long it takes the main platform to complete one full
rotation
How long it takes a small platform (of 3
teacups) to complete one full rotation
How long it takes one teacup to complete one
full rotation (Pick a teacup that is spinning
fast)
How long it takes one teacup to
complete one full rotation (Pick a teacup that is
spinning slowly)
Hints: be careful about how you make these measurements. To determine when something has made
one complete rotation, you need to compare it against a stationary object that is not spinning along the
same axis. For the main platform, you can use yourself as the stationary object. For the small platform
and individual teacups you can use the central “teapot” in the middle of the ride as your stationary
object (it is not spinning around the same axis as the small platform or teacups).
ROTATING PARTS OF THE RIDE
MAIN PLATFORM
SMALL PLATFORM
INDIVIDUAL TEACUP

12
Also record how many times each platform
rotates during one full run of the ride (from
the very start of the ride’s motion to the point
that it comes to a complete stop):
Table ET2
Number of main platform rotations
Number of small platform (of 3
teacups) rotations
The Teacup ride provides thrills by spinning riders in circular motion in multiple ways, and in different
sized circles (main platform, small platform, individual teacups).
Question ET1:
Do you notice any patterns with the spinning motion of the ride’s platforms? What is the ratio of small
platform rotations to main platform rotations?
Question ET2:
Do you notice any patterns with the spinning motion of the individual teacups? Can you determine a
ratio of small platform rotations to teacup rotations?

13
EXPERIENCING FORCES ON THE RIDE
Get on the ride and do not spin the teacup, just let things move by themselves. After the ride starts,
describe what is happening when you feel “pushed” inside the teacup.
Question ET3:
When you feel the maximum push (force), where are you relative to the center of the ride (the teapot)?
Are you close to it, or far from it? Are you moving towards it, or spinning away from it?
Question ET4:
What is the reason that you feel different forces throughout the duration of the ride? Describe how
your motion is changing as the ride moves. Use the figure below to model how one teacup (T) travels as
it moves in one full revolution of the main platform as seen from above. (Sketch its path)
T
14
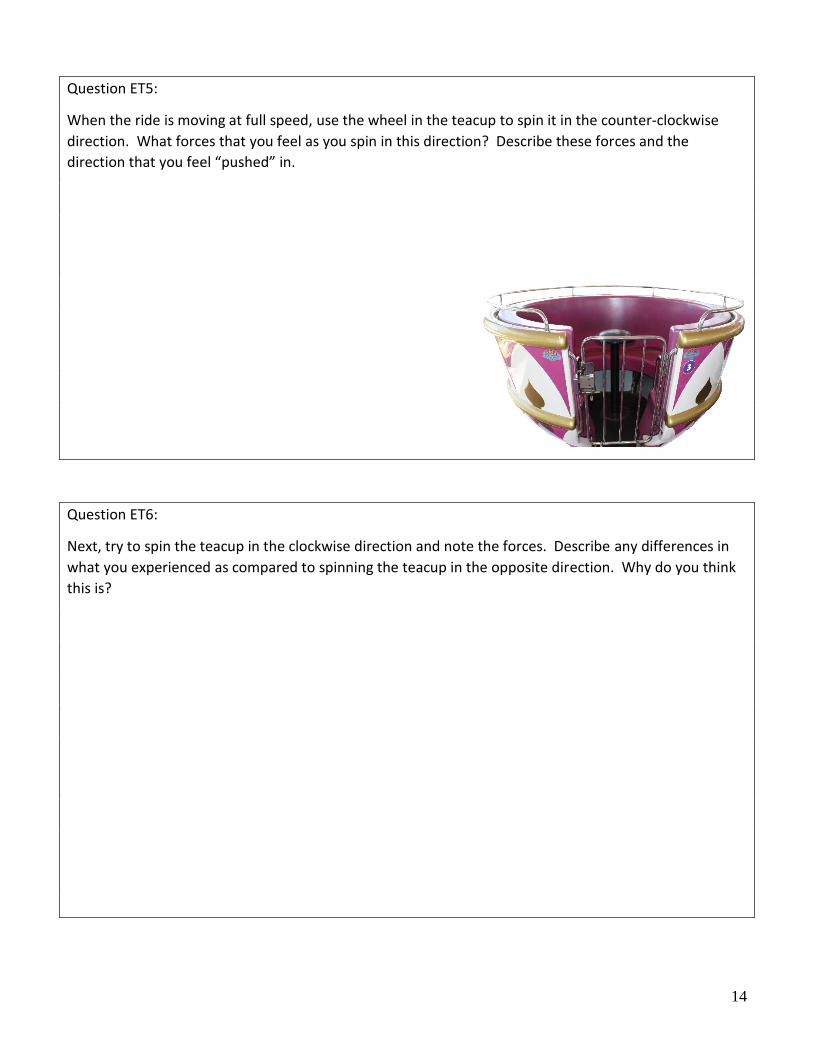
Question ET5:
When the ride is moving at full speed, use the wheel in the teacup to spin it in the counter-clockwise
direction. What forces that you feel as you spin in this direction? Describe these forces and the
direction that you feel “pushed” in.
Question ET6:
Next, try to spin the teacup in the clockwise direction and note the forces. Describe any differences in
what you experienced as compared to spinning the teacup in the opposite direction. Why do you think
this is?

15
MOVING IN CIRCLES
The teacups ride is thrilling (and for some people sickening) because it is moving you in three different
circular patterns at the same time. By understanding how the ride moves, we can use our timing data
and some of the ride specifications to make calculations about the speed it moves us at.
Look at the picture below. It shows one of the small platforms taken apart for maintenance. The
teacups are removed, and you can see the axis that they spin around.
The small platform spins about its center –
the picture to the right shows the underside
of the platform with the gear used to make it
turn and the bearing is spins about.
Teacups’ axis of rotation
Gear driven by a motor to make the small
platform rotate
Bearing for small platform (Axis of Rotation)

16
CALCULATING YOUR SPEED
Using the information in the table below, calculate the speed that the different parts of the ride are
moving as a result of the spinning motion. Again, we will be determining this speed as measured by a
stationary object not spinning about the same axis. (For example, we are calculating the speed of the
small platform as measured by an observer standing on the main platform.)
Question ET 7: Use the given measurements for radius to calculate the speeds
Table ET2 Radius (r) in meters
Radius (r) in inches
Time (t) for 1 revolution
(from Table ET1) in seconds
Speed (m/s) S = (2πr/t)
Speed (mph) S= (2πr/t)
Main Platform
165
Small Platform
61
Teacup – slow spin
28
Teacup – fast spin
28
The teacups have a bearing at its axis of rotation,
but is not driven by any gears. This means the riders
and the motion of the other platforms dictate how
the teacup spins.
Teacup interior without floor and axis of
rotation wheel
Bearing
17
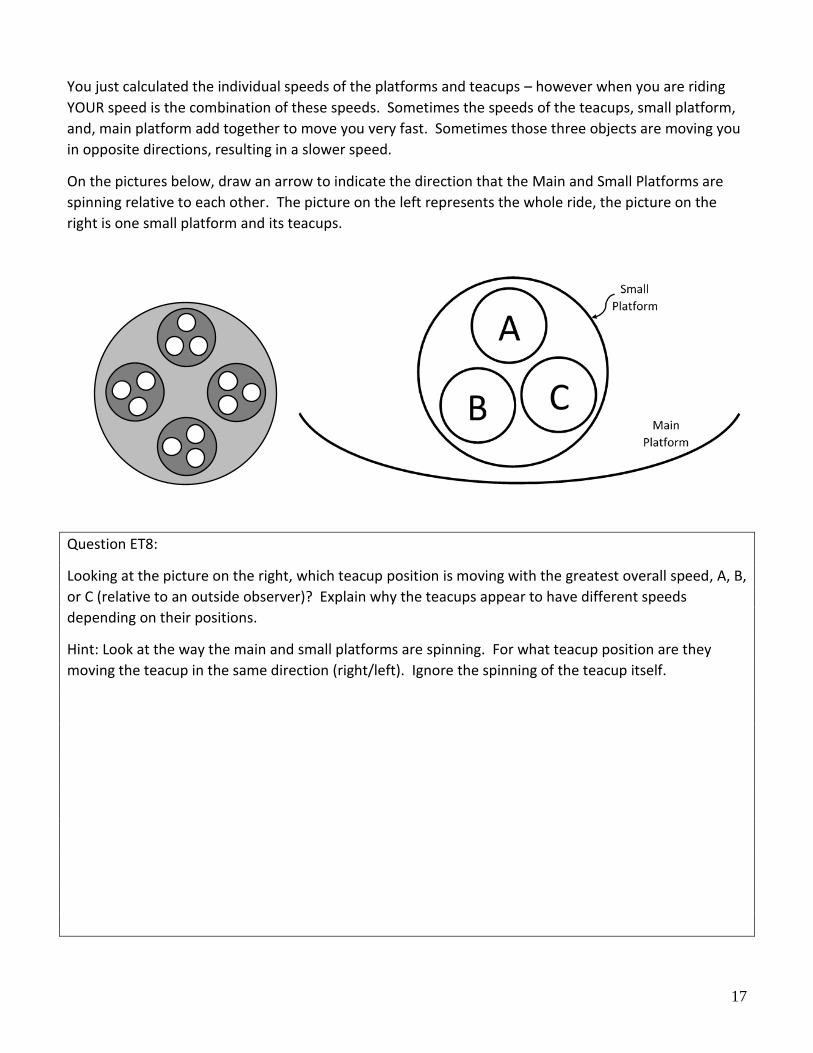
You just calculated the individual speeds of the platforms and teacups – however when you are riding
YOUR speed is the combination of these speeds. Sometimes the speeds of the teacups, small platform,
and, main platform add together to move you very fast. Sometimes those three objects are moving you
in opposite directions, resulting in a slower speed.
On the pictures below, draw an arrow to indicate the direction that the Main and Small Platforms are
spinning relative to each other. The picture on the left represents the whole ride, the picture on the
right is one small platform and its teacups.
Question ET8:
Looking at the picture on the right, which teacup position is moving with the greatest overall speed, A, B,
or C (relative to an outside observer)? Explain why the teacups appear to have different speeds
depending on their positions.
Hint: Look at the way the main and small platforms are spinning. For what teacup position are they
moving the teacup in the same direction (right/left). Ignore the spinning of the teacup itself.

18
Question ET9:
Using the data from Table ET2, estimate the maximum and minimum speed that a teacup could be moving
(relative to an outside observer) as a result of the rotation motions without considering the spinning
motion of the teacup itself.
Table ET3 Minimum Speed Maximum Speed
Teacup Position A
Teacup Position B
Question ET10:
For a rider in teacup position “A”, which direction would they need to spin the teacup in (Clockwise or
Counter-Clockwise) to “cancel out” the speed due to the main and small platforms (relative to an outside
observer)? Sketch your prediction below using arrows to indicate the directions of each component (main
platform, small platform, and teacup).
At what position do you think it would be hardest to “cancel out” your speed due to the small and main
platforms, at teacup position A, B, or C? Why? Try this out on the ride to see if you are right.

19
HARLEY QUINN CRAZY TRAIN
FINDING THE ENERGY FOR MOTION
Harley Quinn Crazy Train is a compact roller coaster that
features a very long train and lots of turns and curves.
Like almost all roller coaster cars, Harley Quinn Crazy Train
does not have motors, engines, or any other device
attached to it that pushes itself along. They are simply unpowered cars with wheels that ride along a
track. It gets the energy for its motion by being raised to a high point and then gravity does the rest.
Question HQ1:
Many roller coasters use a chain or a cable to pull the car up the lift
hill. Harley Quinn Crazy Train uses a different system. Look at the
track in the load station and on the lift hill. (Look at the underside of
the lift hill track.) Describe what you see. How does the train get
pushed up the hill? Where does the energy to do this come from?
Question HQ2:
Why do you think Harley Quinn Crazy Train uses this method to push the car? To answer this, compare
Harley Quinn Crazy Train to other roller coaster trains at Six Flags such as Nitro or Batman.

20
Question HQ3:
At what point during the ride does Harley Quinn Crazy Train have the most energy? What form is this
energy in at that point? How did it get that energy?
Question HQ4:
It has been said that a roller coaster can never reach a point higher than it did at its initial drop hill. It is
very likely that a real roller coaster could not even achieve the same height as the initial drop hill. This
indicates that the train lost converted some of its energy into another form that it can’t use for motion
anymore. What are some of the “lost” forms of energy in this scenario that the train loses and can
never get back?

21
FAST THRILLS
Question HQ5:
Harley Quinn Crazy Train is a very long roller coaster car. Sometimes when part of the train is “falling”
another part of the train is moving upwards. At any given point in time, which part of the train moves
faster, the front or the back? Explain your reasoning.
Question HQ6:
The sensations you feel on Harley Quinn Crazy Train depend on what position in the car you are riding.
Ride Harley Quinn Crazy Train twice – once sitting near the front of the car, once sitting near the back of
the car. Describe the difference in the rides. Which one was more thrilling? Why?
22
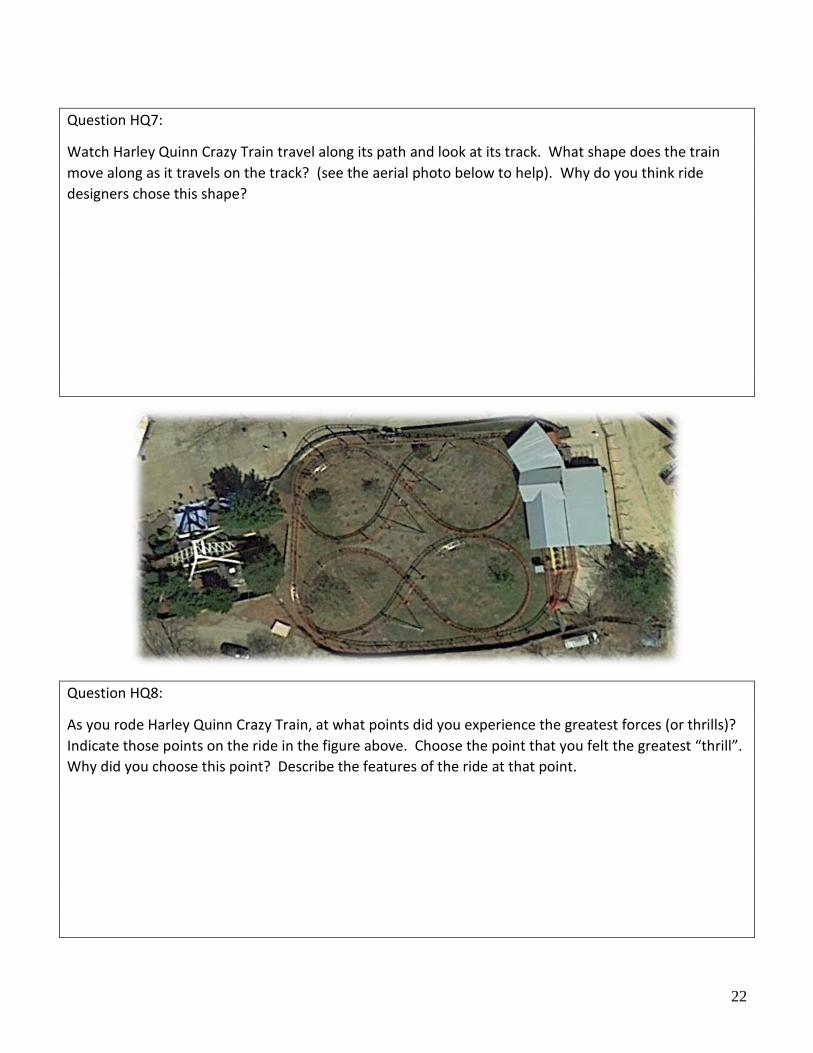
Question HQ7:
Watch Harley Quinn Crazy Train travel along its path and look at its track. What shape does the train
move along as it travels on the track? (see the aerial photo below to help). Why do you think ride
designers chose this shape?
Question HQ8:
As you rode Harley Quinn Crazy Train, at what points did you experience the greatest forces (or thrills)?
Indicate those points on the ride in the figure above. Choose the point that you felt the greatest “thrill”.
Why did you choose this point? Describe the features of the ride at that point.

23
THE BUCCANEER
CALCULATING THE SWING
The Buccaneer can be modeled as a large pendulum, as it
swings back and forth. It does use a motor to push it along
(you can find this as drive wheels in the platform under the
ship), but the approximation to a pendulum is good enough.
Watch the Buccaneer as it swings back and forth. Observe and time how long it takes the ship to swing
back and forth one time (the period (T) of its motion), when it is running at full speed – this is when the
ship is reaching its highest points.
Question B1:
What is the period (T) of the Buccaneer’s motion?
The period of a pendulum can be represented with the mathematical model: 𝑇 = 2𝜋√𝐿
𝑔
Where T is the period in seconds, L is the length of the pendulum in meters, and g is the acceleration
due to gravity. Here on Earth, g is 9.8 m/s2.
Question B2:
If the engineers at Six Flags wanted to make a larger version of the Buccaneer ride (making every part of
it 3 times as big), what would happen to the time it takes for the ship to swing back and forth once (the
period)? If you think it would change, calculate how much the period would change by.

24
CHOOSING YOUR THRILL LEVELS
Riders can choose where to sit while riding the
Buccaneer. They can sit either in the middle of the ship,
or at either one of its ends (Top Rows).
Stand back and watch the Buccaneer as it goes through
one full ride. Look at the riders who chose the middle
seats.
Question B3:
For a rider sitting in the middle of the ship, what do you notice about the height that they get above the
ground as the ship swings back and forth?
Question B4:
Now watch a rider sitting in a “top row”. How does the height that they get above the ground as the
ship swings compare to a rider in the middle rows?
Question B5:
Is there a difference in the height a top row rider is off the ground depending on if they are sitting on the
right side of the ship or the left side of the ship? (Watch the ship swing back and forth several times to
answer this question.)

25
Ride the Buccaneer multiple times, changing where you sit on the ship. Each time you ride, think about
the forces you are experiencing, and the sensations your body perceives as a result. Be sure to ride once
in the middle of the ship, and at least once in a top row, either on the left or right side of the ship. Have
a partner ride on the opposite top row side to compare your experience with.
We are mostly interested in the ship at three positions: A, B, and C.
Focus on the sensation of feeling “heavy”, “light”, “weightless”, or “normal” as you ride. A sensation of
“heavy” would make you feel like you are being pushed into your seat. “Light” would feel like you are
being slightly lifted up. “Weightless” is a floating sensation, and “normal” is how you feel if you were
sitting still.
Fill in Table B1 below with the sensations that you (and your partners) feel throughout the ride at each
position, depending at which location on the ship you are sitting at. Use these abbreviations when filling
in the table: H (heavy), L (light), W (weightless), N (normal). If you feel VERY light or VERY heavy, use
multiple letters (LL or HHH, etc.) to represent your sensation!
Table B1 Position A Position B Position C
Right Side
Middle
Left Side
Position A Position B Position C
26
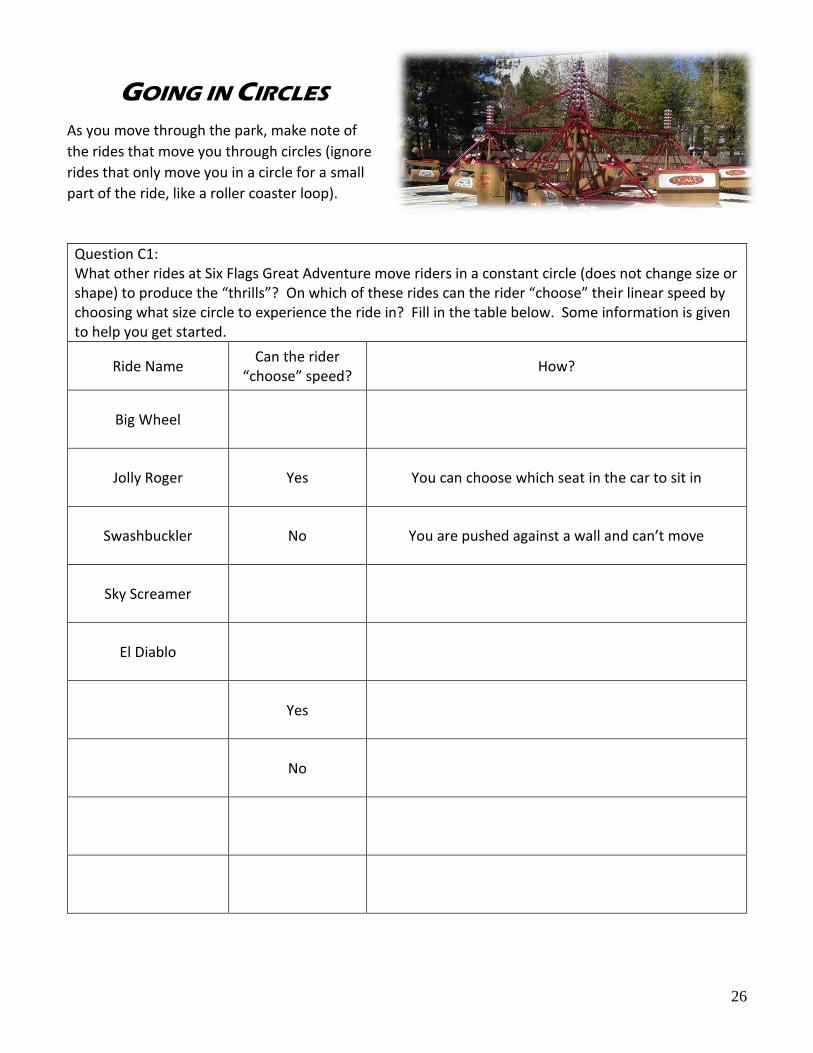
GOING IN CIRCLES
As you move through the park, make note of
the rides that move you through circles (ignore
rides that only move you in a circle for a small
part of the ride, like a roller coaster loop).
Question C1: What other rides at Six Flags Great Adventure move riders in a constant circle (does not change size or shape) to produce the “thrills”? On which of these rides can the rider “choose” their linear speed by choosing what size circle to experience the ride in? Fill in the table below. Some information is given to help you get started.
Ride Name Can the rider
“choose” speed? How?
Big Wheel
Jolly Roger Yes You can choose which seat in the car to sit in
Swashbuckler No You are pushed against a wall and can’t move
Sky Screamer
El Diablo
Yes
No

27
Question C2:
What is the “choice” the rider can make if they want to experience the greatest
linear speed for these circular motion rides?
Question C3:
Newton’s First Law of Motion tells us that a body that is in motion will continue
in that path of motion unless acted upon by an outside force. When you are on
a ride that is moving you in a circular path, are you changing your path of
motion? What is the outside force acting on you? (Give an example.) How do you know if an outside
force is acting on you?
Question C4:
You have probably seen signs at some rides indicating that larger riders should sit in a certain seat. Are
they at every ride? What “types” of rides are you more likely to see these signs? Explain why the park
wants larger/heavier riders to sit in the “outside” seat of the car.

28
GOING NOWHERE, FAST
When you are on a ride that moves you in a circle, you don’t really go anywhere, but that doesn’t mean
you aren’t moving fast! Compare the speeds of some circular motion rides at Six Flags to figure out
which is the circular speed champ!
Question C5
Radius of Rider’s Motion
(meters)
Period of Rotation at full speed
(seconds)
Distance Traveled by the Rider over
one Period (meters)
Speed of the Rider (m/s)
Carousel (inner horses) 3.5 m
Carousel (outer horses) 5.0 m
Swashbuckler 6.0 m
Sky Screamer 14.9 m
El Diablo 8.4 m
Big Wheel 19.6
Jolly Roger 6.1 m
Teacups (main platform) 4.2 m

29
ESTIMATION AND PLANNING Six Flags Great Adventure has many thrilling rides and experiences which are popular with most of the people
who come to the park. This popularity sometimes mean you need to wait in line to get on your ride! In this
section you will calculate how many riders can be moved through a ride every hour. It may help you plan future
visits by maximizing your ride times!
To do this, you will need to observe a few things:
How many riders can ride at one time (during one “Cycle” of the ride) – count the number of seats in a roller
coaster train, or the maximum capacity of another ride
How long the ride lasts – use a timer to determine how much time goes by from the start of a ride to the
completion of the ride. This would be when a roller coaster train leaves the station and then returns, or when
another ride starts moving and then stops. This time is usually very consistent.
How much time it takes to load and unload riders – this is the time it takes to
get people on and off the ride. This time can be variable since some people
take longer than others. You should start timing this as soon as a ride stops,
and then stop your timer when it starts again for the next group of riders. You
should make several measurements of this and then take the average. For
roller coaster with multiple cars running this time may be zero!
Use Table EP1 and EP2 to fill in your data, then perform the calculations to
determine the RPH value (riders per hour).
Here is an example calculation from a ride that is no longer at Six Flags:
The Enterprise (later renamed the Spin Meister) was a circular motion ride that
used a swinging arm to move riders from horizontal to vertical, causing them to be
upside down as they passed through the highest point of the ride.
Ride Name Maximum
Capacity per Ride Ride Duration
(seconds)
Average Load / Unload Time
(seconds)
RPH – Riders per Hour
Enterprise 42 85 220
Step 1: Find out how many “rides” can happen per hour by adding together the Ride Duration time and
the Average Load/Unload Time. This combination of these two times is called the “Cycle Time”.
Cycle Time = Ride Duration Time + Load/Unload Time = 85 s + 220 s = 305 seconds
Step 2: Calculate the number of Cycles per hour by dividing one hour by the Cycle Time. Watch units!
Cycles per Hour (CPH) = 3600 seconds per Hour / 305 seconds = 11.8 Cycles per Hour
Step 3: Calculate the Riders per Hour (RPH) by multiplying together the Maximum Capacity per Ride
(MC) and the Cycles per Hour (CPH)
RPH = MC x CPH = (42 Riders) x (11.8 Cycles per Hour) = 496 Riders per Hour
30
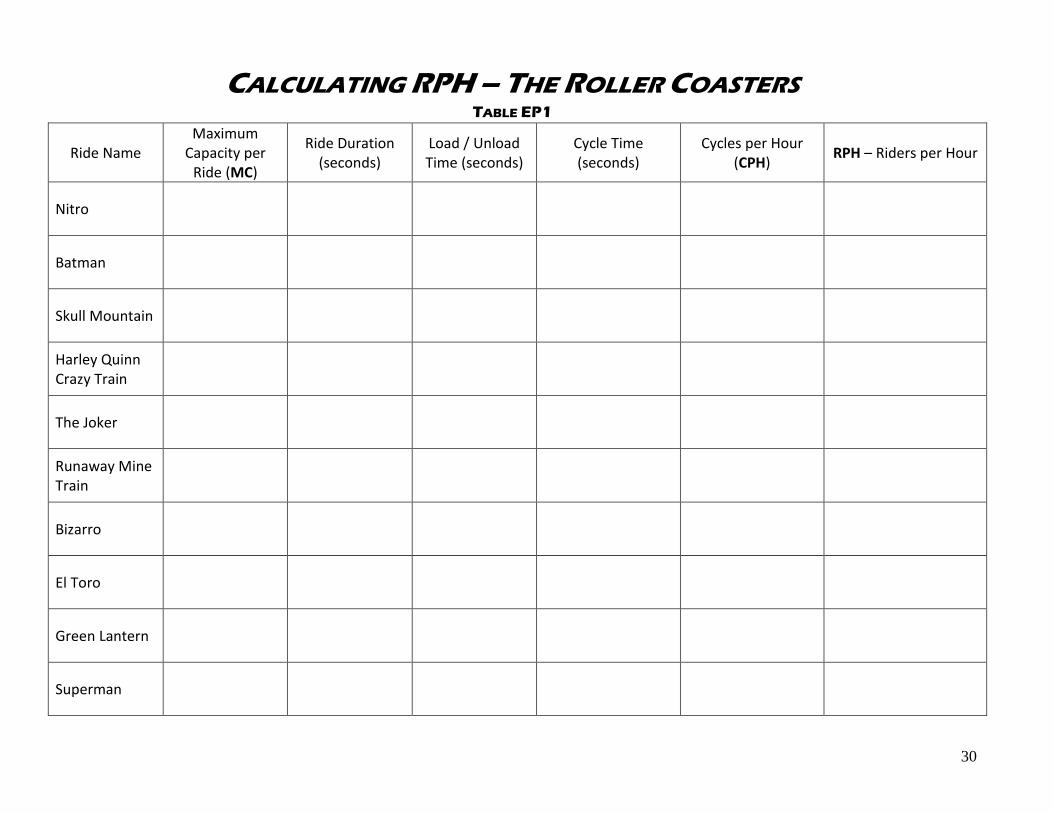
CALCULATING RPH – THE ROLLER COASTERS TABLE EP1
Ride Name Maximum
Capacity per Ride (MC)
Ride Duration (seconds)
Load / Unload Time (seconds)
Cycle Time (seconds)
Cycles per Hour (CPH)
RPH – Riders per Hour
Nitro
Batman
Skull Mountain
Harley Quinn Crazy Train
The Joker
Runaway Mine Train
Bizarro
El Toro
Green Lantern
Superman

31
CALCULATING RPH – THE AMUSEMENT RIDES TABLE EP2
Ride Name Maximum
Capacity per Ride (MC)
Ride Duration (seconds)
Load / Unload Time (seconds)
Cycle Time (seconds)
Cycles per Hour (CPH)
RPH – Riders per Hour
Buccaneer
Jolly Roger
Swashbuckler
Sky Screamer
Deja Vu
The Twister
Fender Benders
Carousel
Enchanted Teacups
El Diablo

32
Question EP1:
Based on the data you have collected and the calculations you
have made, which rides at Six Flags are capable of moving the
most riders through it during a normal day? Explain what
specific factors about the ride contribute to their high RPH
numbers.
Question EP2:
If you worked at Six Flags and were responsible for increasing RPH, what steps would you take? Choose
2 rides you examined and make specific suggestions about how to increase RPH.

33
Question EP3:
Create a “ride plan” for a day at Six Flags to experience the most number of rides during your visit.
Make a list of the rides you would choose to get on, and the order in which you would do so. Hint: there
are more factors to consider than just a high RPH – remember, your goal is to ride as many rides as
possible.
Use the following constraints as you make your plan:
You have 6 hours to ride, starting at 11AM
It takes you 5 minutes to walk from one ride to the next one
You can only choose one ride to go on twice
You need to alternate the Roller Coasters and Amusement Rides (your body needs to recover!)
To help you with this, you are given an estimate of how many people are currently waiting for a ride at
any given time.
Ride Name # People Waiting
Ride Name # People Waiting
Ride Name # People Waiting
Buccaneer 120 Carousel 60 The Joker 850
Jolly Roger 35 Enchanted
Teacups 45
Runaway Mine Train
210
Swashbuckler 105 El Diablo 55 Bizarro 450
Sky Screamer 210 Nitro 900 El Toro 600
Deja Vu 60 Batman 425 Green Lantern 550
The Twister 75 Skull Mountain 215 Superman 725
Fender Benders
80 Harley Quinn Crazy Train
165
Example Calculation: If you had calculated that Green Lantern has a RPH of 672 Riders per Hour, you
would then use that with the estimation of people waiting to determine the wait time for the ride:
Wait Time = (Number of People Waiting) / RPH
Wait Time = 550 𝑅𝑖𝑑𝑒𝑟𝑠
672 𝑅𝑖𝑑𝑒𝑟𝑠 𝑝𝑒𝑟 𝐻𝑜𝑢𝑟= 0.82 ℎ𝑟𝑠 Convert hrs to minutes: 0.82 hrs X 60
𝑚𝑖𝑛
ℎ𝑟 = 49 minutes
This means your wait time at Green Lantern would likely be 49 minutes

34
RIDE PLAN Fill out your Ride Plan in the table below using the information you calculated (RPH) and the estimate of
how many people are waiting in line. You may not need to use all the spaces provided!
Ride # Ride Name Arrival Time Departure Time Time to walk to next Ride
1 11:00 am 5 minutes
2 5 minutes
3 5 minutes
5 minutes
5 minutes
5 minutes
5 minutes
5 minutes
5 minutes
5 minutes
5 minutes
5 minutes
5 minutes