Embed Size (px)
Citation preview

Q1 2019
MIDDLE MARKET M&A UPDATE
Page 2
M&A MARKET SUMMARY
*Based on Canadian publicly disclosed transactions in the enterprise value range of $5 million to $500 million. Currency in USD. Source: S&P Capital IQ
CANADIAN MID-MARKET
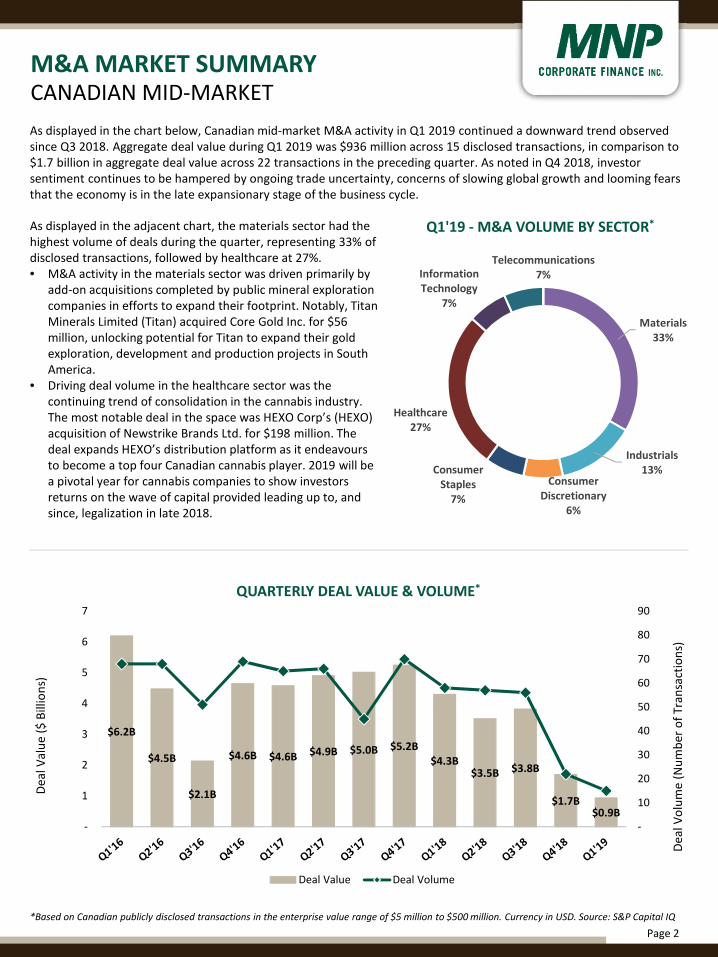
As displayed in the chart below, Canadian mid-market M&A activity in Q1 2019 continued a downward trend observed since Q3 2018. Aggregate deal value during Q1 2019 was $936 million across 15 disclosed transactions, in comparison to $1.7 billion in aggregate deal value across 22 transactions in the preceding quarter. As noted in Q4 2018, investor sentiment continues to be hampered by ongoing trade uncertainty, concerns of slowing global growth and looming fears that the economy is in the late expansionary stage of the business cycle.
Materials33%
Industrials13%
Consumer Discretionary
6%
Consumer Staples
7%
Healthcare27%
Information Technology
7%
Telecommunications7%
Q1'19 - M&A VOLUME BY SECTOR*
$6.2B
$4.5B
$2.1B
$4.6B $4.6B $4.9B $5.0B $5.2B $4.3B
$3.5B $3.8B
$1.7B $0.9B
-
10
20
30
40
50
60
70
80
90
-
1
2
3
4
5
6
7
Dea
l Vo
lum
e (N
um
ber
of
Tran
sact
ion
s)
Dea
l Val
ue
($ B
illio
ns)
QUARTERLY DEAL VALUE & VOLUME*
Deal Value Deal Volume
As displayed in the adjacent chart, the materials sector had the highest volume of deals during the quarter, representing 33% of disclosed transactions, followed by healthcare at 27%. • M&A activity in the materials sector was driven primarily by
add-on acquisitions completed by public mineral exploration companies in efforts to expand their footprint. Notably, Titan Minerals Limited (Titan) acquired Core Gold Inc. for $56 million, unlocking potential for Titan to expand their gold exploration, development and production projects in South America.
• Driving deal volume in the healthcare sector was the continuing trend of consolidation in the cannabis industry. The most notable deal in the space was HEXO Corp’s (HEXO) acquisition of Newstrike Brands Ltd. for $198 million. The deal expands HEXO’s distribution platform as it endeavours to become a top four Canadian cannabis player. 2019 will be a pivotal year for cannabis companies to show investors returns on the wave of capital provided leading up to, and since, legalization in late 2018.

Page 3
EQUITY MARKETS
*Sector performance based on the price change of each corresponding sector index over the quarter.**Q1 performance as of March 31, 2019.Source: Capital IQ, Linde Equity, Baird.
As shown in the graph below, both the TSX Composite and S&P 500 posted double-digit percentage gains in Q1 2019. The TSX Composite increased by 9.2%, fully recovering from December’s sell-off, while the S&P 500 recorded a gain of 12.9%, nearly reversing the 14.3% decline in Q4 2018. Equities were pushed higher in both indices due to dovish turns by both the Bank of Canada (BoC) and the Federal Reserve (Fed) on interest rates and improved rhetoric around U.S.-China trade negotiations.
As displayed in the adjacent table, each sector within the TSX Composite posted gains of at least 8% in Q1 2019. The healthcare sector was the leading performer due to the strong performance of cannabis stocks. Information technology finished second, returning 26.7% largely on strength from Shopify. On March 8, 2019, Shopify was added to the S&P/TSX 60 Index, which further increased demand for the stock, as funds that tracked the Index rebalanced accordingly. The telecommunications and consumer staples sector both achieved all-time highs in Q1 as prospects for reductions in interest rates made these traditionally higher dividend-yielding sectors more attractive. The two largest Canadian sectors – financials and energy – generated more moderate gains as their large weightings diluted overall sector gains from rising higher.
Q1 2019 SECTOR PERFORMANCE*
9.2%
12.9%
-4.0%
-2.0%
0.0%
2.0%
4.0%
6.0%
8.0%
10.0%
12.0%
14.0%
16.0%
Jan-2019 Feb-2019 Mar-2019
NORTH AMERICAN EQUITY INDICES - Q1 2019 PERFORMANCE**
TSX Composite S&P 500
The S&P 500 rebounded across the board in Q1 2019. Having endured a difficult Q4 in 2018, information technology was the strongest performing sector with a quarterly gain of 19.3%. Technology giants Apple and Microsoft rose more than 16.0% each during the quarter. Outside of information technology, higher oil prices boosted the energy sector while optimism around U.S.-China trade negotiations strengthened industrials. The worst-performing sectors were financials and healthcare, with mid single-digit gains. The banks gained 7.1% for the quarter as the yield curve inverted and domestic growth indicated a pending deceleration. Healthcare generated more muted gains due to a Democratic proposal to replace private medical benefits with a government-run single payer system.
Sector TSX
Composite S&P 500
Consumer Discretionary 10. 0% 14.3%
Consumer Staples 9.8% 11.6%
Energy 9.3% 13.1%
Financials 9.2% 7.1%
Healthcare 41.5% 7.6%
Industrials 14.6% 16.1%
Information Technology 26.7% 19.3%
Materials 9.4% 9.2%
Telecommunication 8.9% 12.2%
Utilities 14.9% 11.9%
Page 4
TREASURY YIELDS
Source: Capital IQ, Bank of Canada, Federal Reserve.
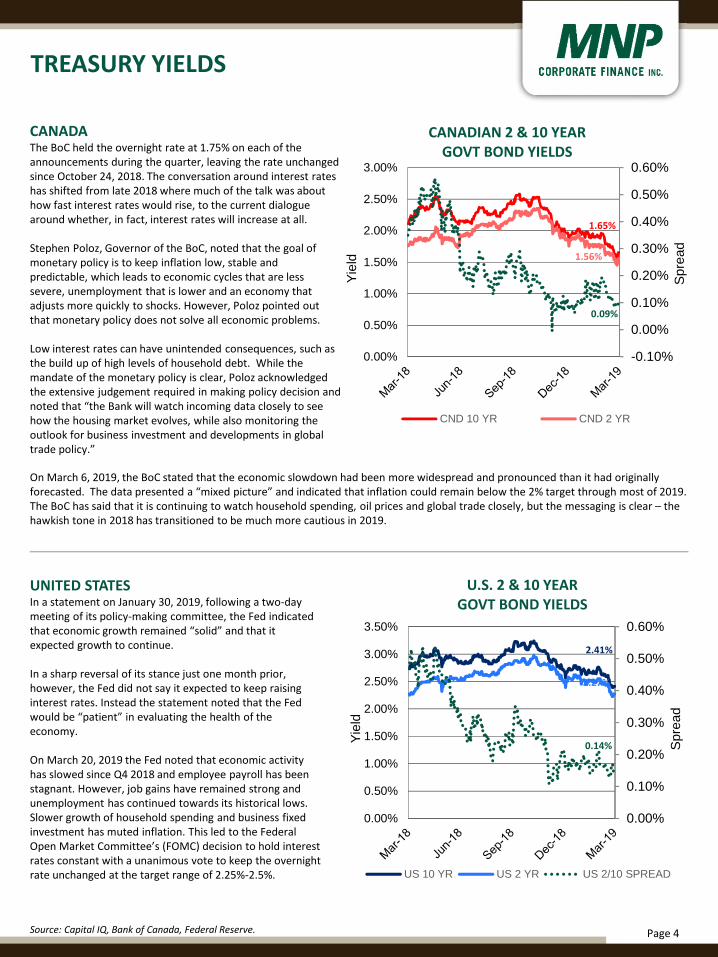
On March 6, 2019, the BoC stated that the economic slowdown had been more widespread and pronounced than it had originally forecasted. The data presented a “mixed picture” and indicated that inflation could remain below the 2% target through most of 2019. The BoC has said that it is continuing to watch household spending, oil prices and global trade closely, but the messaging is clear – the hawkish tone in 2018 has transitioned to be much more cautious in 2019.
-0.10%
0.00%
0.10%
0.20%
0.30%
0.40%
0.50%
0.60%
0.00%
0.50%
1.00%
1.50%
2.00%
2.50%
3.00%
Spre
ad
Yie
ld
CANADIAN 2 & 10 YEARGOVT BOND YIELDS
CND 10 YR CND 2 YR
1.65%
1.56%
0.09%
CANADAThe BoC held the overnight rate at 1.75% on each of the announcements during the quarter, leaving the rate unchanged since October 24, 2018. The conversation around interest rates has shifted from late 2018 where much of the talk was about how fast interest rates would rise, to the current dialogue around whether, in fact, interest rates will increase at all.
Stephen Poloz, Governor of the BoC, noted that the goal of monetary policy is to keep inflation low, stable and predictable, which leads to economic cycles that are less severe, unemployment that is lower and an economy that adjusts more quickly to shocks. However, Poloz pointed out that monetary policy does not solve all economic problems.
Low interest rates can have unintended consequences, such as the build up of high levels of household debt. While the mandate of the monetary policy is clear, Poloz acknowledged the extensive judgement required in making policy decision and noted that “the Bank will watch incoming data closely to see how the housing market evolves, while also monitoring the outlook for business investment and developments in global trade policy.”
UNITED STATESIn a statement on January 30, 2019, following a two-day meeting of its policy-making committee, the Fed indicated that economic growth remained “solid” and that it expected growth to continue.
In a sharp reversal of its stance just one month prior, however, the Fed did not say it expected to keep raising interest rates. Instead the statement noted that the Fed would be “patient” in evaluating the health of the economy.
On March 20, 2019 the Fed noted that economic activity has slowed since Q4 2018 and employee payroll has been stagnant. However, job gains have remained strong and unemployment has continued towards its historical lows. Slower growth of household spending and business fixed investment has muted inflation. This led to the Federal Open Market Committee’s (FOMC) decision to hold interest rates constant with a unanimous vote to keep the overnight rate unchanged at the target range of 2.25%-2.5%.
0.00%
0.10%
0.20%
0.30%
0.40%
0.50%
0.60%
0.00%
0.50%
1.00%
1.50%
2.00%
2.50%
3.00%
3.50%
Spre
ad
Yie
ld
U.S. 2 & 10 YEARGOVT BOND YIELDS
US 10 YR US 2 YR US 2/10 SPREAD
2.41%
2.27%
0.14%

Page 5
TREASURY YIELDS
Source: Statistics Canada; Globe and Mail; Forbes
An inverted yield curve typically indicates a market that is very late in its cycle with a downturn looming. While the scope and scale of the downturn is unknown, if it were to approach recessionary territory, government policy makers have historically used fiscal tools to stimulate economic growth, including interest rate cuts. During past recessions, those interest rate cuts have been in the range of 4%-5% in efforts to incentivize consumers to spend their way out of that recession. Currently, the U.S. benchmark rate sits at 2.25%-2.5% with the Canadian overnight rate even lower at 1.75%. This limits the Central Banks’ ability to use interest rates as a fiscal stimulus to drive the economy out of a recession. If a recession were to occur, rates cannot be cut much further before they are at zero.
It’s easy to look retrospectively and wonder why Jerome Powell and Stephen Poloz did not increase rates at a quicker pace. The answer is that they tried to do so, but had a difficult time raising rates without drastically impacting the stock and housing market and pushing the economy into a downward spiral. Why is the economy so sensitive to minor increases in rates? The root answer is household debt. Household debt has increased dramatically over this economic cycle. During the period from 2010 to 2018, total household liabilities (mortgages, plus credit card and other debt) to disposable income before interest payments increased every year in Canada except one, climbing from 1.52x to 1.68x, despite efforts to incentivize households to de-lever. Going forward, policy options to stimulate the economy are limited, if they are required.
0.00%
0.50%
1.00%
1.50%
2.00%
2.50%
CANADIAN GOVERNMENT BOND YIELD CURVES
CND 31-Mar-19 CND Last Quarter CND Last Year
0.00%
0.50%
1.00%
1.50%
2.00%
2.50%
3.00%
3.50%
U.S. GOVERNMENT BOND YIELD CURVES
US 31-Mar-19 US Last Quarter US Last Year
Page 6
COMMODITY MARKETS
Source: Capital IQ, Kitco, GoldSilver, CNN, CNBC, Natural Gas Intel
67.6
50.0
55.0
60.0
65.0
70.0
75.0
$U
SD/B
arre
l
CRUDE OIL - BRENT (ICE)
Historical Pricing Future Contracts
1,294
1,270
1,280
1,290
1,300
1,310
1,320
1,330
1,340
1,350
1,360
$U
SD/o
z.
GOLD (COMEX)
Historical Pricing Future Contracts
2.7
2.0
2.2
2.4
2.6
2.8
3.0
3.2
3.4
$/m
m B
TU
NATURAL GAS (HENRY HUB)
Historical Pricing Future Contracts
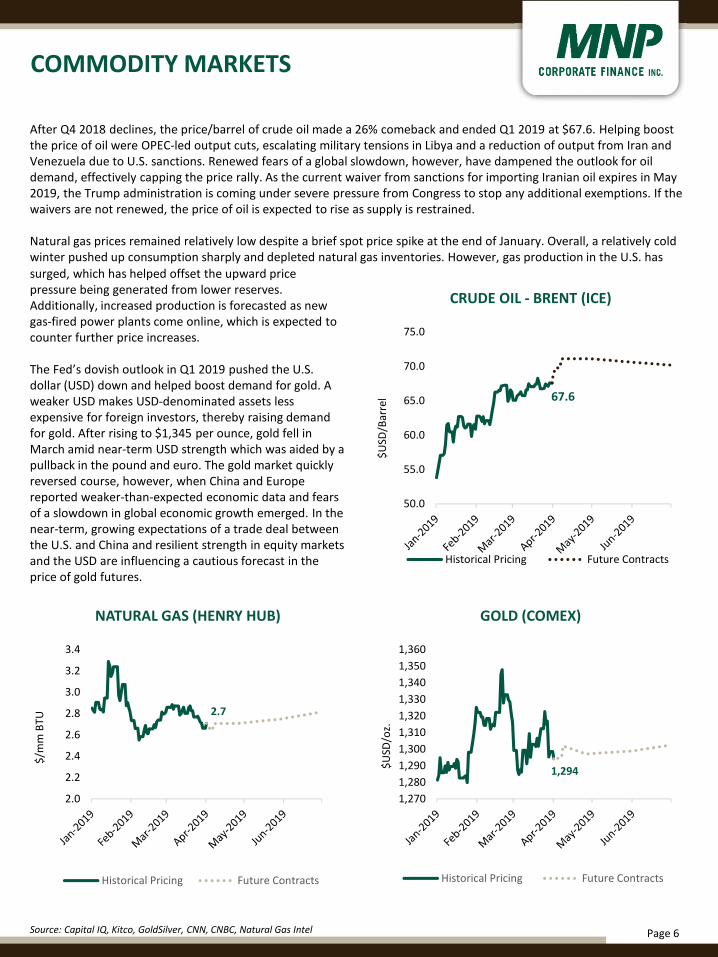
After Q4 2018 declines, the price/barrel of crude oil made a 26% comeback and ended Q1 2019 at $67.6. Helping boost the price of oil were OPEC-led output cuts, escalating military tensions in Libya and a reduction of output from Iran and Venezuela due to U.S. sanctions. Renewed fears of a global slowdown, however, have dampened the outlook for oil demand, effectively capping the price rally. As the current waiver from sanctions for importing Iranian oil expires in May 2019, the Trump administration is coming under severe pressure from Congress to stop any additional exemptions. If the waivers are not renewed, the price of oil is expected to rise as supply is restrained.
Natural gas prices remained relatively low despite a brief spot price spike at the end of January. Overall, a relatively coldwinter pushed up consumption sharply and depleted natural gas inventories. However, gas production in the U.S. has
surged, which has helped offset the upward price pressure being generated from lower reserves. Additionally, increased production is forecasted as new gas-fired power plants come online, which is expected to counter further price increases.
The Fed’s dovish outlook in Q1 2019 pushed the U.S. dollar (USD) down and helped boost demand for gold. A weaker USD makes USD-denominated assets less expensive for foreign investors, thereby raising demand for gold. After rising to $1,345 per ounce, gold fell in March amid near-term USD strength which was aided by a pullback in the pound and euro. The gold market quickly reversed course, however, when China and Europe reported weaker-than-expected economic data and fears of a slowdown in global economic growth emerged. In the near-term, growing expectations of a trade deal between the U.S. and China and resilient strength in equity markets and the USD are influencing a cautious forecast in the price of gold futures.

Page 7
CANADIAN ECONOMIC UPDATE
*Exchange rate data as of March 31st, 2019.**Provincial Economic Outlook, March, 2019. RBC Capital Markets Economic Research and TD Economics ResearchSources: S&P Capital IQ
The Canadian dollar (CAD) strengthened approximately 2% against the USD during Q1 2019, which was largely underpinned by a rebound in West Texas Intermediate and Western Canadian Select oil prices. The increase in Canadian oil prices was influenced by a temporary cut in Albertan oil production aimed to shore up oil prices, which took effect on January 1, 2019.
Unemployment Rate (percent)**
Year Canada
2017 6.3%
2018 5.8%
2019F 5.9%
2020F 5.8%
Housing Starts(thousands)**
Year Canada
2017 220
2018 213
2019F 198
2020F 196
CPI(YoY % change)**
Year Canada
2017 1.6%
2018 2.0%
2019F 1.5%
2020F 2.0%
Year Canada
2017 3.0%
2018 1.8%
2019F 1.4%
2020F 1.8%
Real GDP Growth(% change, chain-weighted)**
1.24
1.26
1.28
1.3
1.32
1.34
1.36
CA
D P
er U
SD
CAD/USD EXCHANGE RATE*
Historical Forecast
The Canadian Consumer Price Index (CPI) edged higher through the first quarter of 2019, with January, February and March reading 1.4%, 1.5% and 1.9%, respectively on a year-over-year basis. Overall, with the CPI slightly below the 2% inflation target, the BoC is expected to be patient when deciding to adjust interest rates. This is consistent with the BoC’s decision to hold rates steady throughout the quarter, in addition to striking a cautious tone indicating policy stimulus is still needed. As a result, Canadians will feel less pressure on borrowing costs for the time-being, which is a welcomed change after interest rate increases experienced since 2017.
Against an uncertain geopolitical backdrop and fears that the economy is late into the expansionary stage of the business cycle, the Canadian economy has shown several optimistic signals. Notably, January GDP bounced back after two straight months of declines and Alberta oil production is expected to return back to normal levels later this year, which presents a positive outlook for economic growth in the country.

Page 8Page 8
ABOUT MNPCF
MNPCF LOCAL & GLOBAL REACH
MNP Corporate Finance (MNPCF) has a dedicated team of over 50merger, acquisition, and transaction professionals across Canada.MNPCF works with clients in virtually all industries as they prepare,plan and execute transactions.
Our typical transactions range in value between $5 million and $300million.
INDUSTRY EXPERIENCE
• Transportation
• Construction
• Financial Services
• Technology
• Energy
• Oil & Gas
• Real Estate
• Food & Beverage
• Retail & Distribution
• Manufacturing
• Automotive
• Materials
• Health Care
• Pharmaceutical
SERVICES
• Buy-side M&A Advisory
• Acquisitions
• Due Diligence/Quality of Earnings (QOE)
• Sell-side QOE
• Sell-side M&A Advisory
• Divestitures
• Strategic Planning
• Financing (debt and equity)
SAMPLE OFRECENTLY CLOSED DEALS
(NATIONAL)
Page 9Page 9
DEAL EXPERIENCE
Over the past 10 years we have completed in excess of 250transactions. Our team has transaction experience in a widerange of industries, with diverse enterprise values rangingbetween $3 million and $300 million.
HANDS-ON APPROACH
Current M&A transactions require a hands-on approachfrom start to finish, including the active engagement of seniorresources. Our senior resources are dedicated to our clientsand are available as necessary and appropriate. We keep ourclients regularly informed of the engagement status, issueswe are encountering, successes and overall progress.
INTERNATIONAL REACH
MNP is a participating firm within Praxity, a unique globalalliance of independent accounting/advisory firms created toanswer global business needs. As a member of Praxity, we areable to offer access to corporate finance, accounting and taxadvisory services worldwide.
INTEGRATED SERVICE OFFERING
We draw on the vast experience and deep specialistknowledge network of our partners locally, nationally andinternationally as specialty issues arise, such as pretransaction tax planning, transaction structuring, estateplanning, valuation, due diligence, performance improvementand risk management.
ABOUT MNPCF
SAMPLE OFRECENTLY CLOSED DEALS
(NATIONAL)

Page 10
ABOUT MNPCF
Aleem Bandali
778.374.2140 [email protected]
Aleem has worked on transactions ranging between $3 million and $30 billion in Canada, the United States andinternationally in a diverse range of industries.
Aleem has a Master of Business Administration (MBA) degree from the University of Oregon College of Business,a Juris Doctor (JD) degree from the University of Oregon School of Law and a Bachelor of Arts degree (BA) fromthe University of British Columbia. Aleem has also completed the Mergers and Acquisitions program at HarvardBusiness School.Managing Director
Dale Antonsen
250.979.2578 [email protected]
Based in Kelowna, Dale initiates and executes business strategies and transactions designed to help clientsrealize their goals in complex situations.
Dale’s client base is involved in a range of industries, including oil and gas services, real estate capital marketsand development, manufacturing and distribution, construction and contracting and casino gaming andentertainment.
Managing Director
Managing Director
Johnny Earl
604.637.1504 [email protected]
Johnny specializes in diligence and other transaction advisory requirements relating to acquisitions anddivestitures. Johnny has worked on transactions ranging from deal values below $5 million up to over $1 billion,in North America, the U.K, Asia and Africa.
Johnny holds a Bachelor of Economics from Durham University in the U.K., and has a designation from theInstitute of Chartered Accountants of England and Wales.
Brett Franklin
204.336.6190 [email protected]
Based in Winnipeg, Brett develops and implements creative business strategies for clients in all industry sectorsand in all stages of the business life cycle.
With a diverse background in financial services, including banking, private equity, hedge funds and structuredinvestment products, Brett has the knowledge and ability to resolve challenging financial issues and developpractical solutions to even the most difficult problems.
PresidentMNP Corporate
Finance

Page 11
ABOUT MNPCF
Jason Burgess
905.225.1324 [email protected]
Based in St. Catharines, Jason helps private and public businesses navigate complex transactions so they canachieve their strategic and financial goals.
Jason draws on more than 25 years of experience in public practice and in the public sector to help clients withmergers and acquisitions, debt financing, performance improvement and due diligence.
Managing Director
Mike Reynolds
587.702.5909 [email protected]
Based in Calgary, Mike advises on mergers, acquisitions, divestitures, and financing options.
Mike has more than 18 years of industry experience in corporate finance, turnarounds and restructurings,private equity, and venture capital. He has worked on transactions in Canada, the United States and Europe andhas experience in numerous industries
Managing Director
Mark Regehr
780.969.1404 [email protected]
Based in Edmonton, Mark assists mid-market clients preparing for succession, including the sale of theirbusiness or planning for growth through acquisitions, mergers and financing.
Mark has a proven track record of securing financing, finding buyers and assisting through the merger andacquisition process. He also offers expertise in the areas of business planning, financial structure and financialmodeling.
Managing Director
Patrick Khouzam
514.228.7874 [email protected]
Based in Montreal, Patrick specializes in assisting mid-sized, privately owned businesses maximize their valuethrough strategic planning and targeted initiatives.
Backed by almost two decades of experience working within the financial sector in Quebec, Patrick specializes inmerger and acquisitions, raising capital, due diligence and general business transaction advice.
Managing Director

Page 12
ABOUT MNPCF
Stephen Shaw
416.515.3883 [email protected]
Based in Toronto, Stephen initiates and executes business strategies and transactions designed to realize clients’goals in complex situations.
His client base is involved in a range of industries, including aerospace and defense; manufacturing anddistribution; transportation and logistics; industrial and consumer products; agri-food and automotive.
Managing Director
Craig Maloney
902.493.5430 [email protected]
Based in Halifax, Craig specializes in helping family-owned businesses with mergers and acquisitions andcorporate finance issues.
Craig’s services include business valuation and pricing analysis, helping owners establish relationships withlenders and source capital, assisting with business planning and management structuring and creating financialmodels for budgeting and forecasting.
Managing Director
Managing Director
John Caggianiello
416.513.4177 [email protected]
Based in Toronto, John specializes in assisting mid sized entrepreneurial private and public companies andinstitutional investors with their due diligence and transaction advisory requirements.
Drawing on his investigative and advisory expertise working with private equity firms, alternative lenders,lawyers and bankers, John provides comprehensive due diligence solutions to help his clients accurately assessrisks associated with their investment decisions.
Dan Porter
416.515.3877 [email protected]
Based in Toronto, Dan has 30 years of experience helping public and private companies in a wide range ofindustries, including: aviation, railways, trucking, mining, leasing, printing and in manufacturing.
Working closely with his clients, Dan provides advice and develops innovative and creative financing solutions inmany areas such as structured products, senior debt restructuring, raising new senior revolving or term debt,sourcing or restructuring mezzanine or subordinated debt and assisting with or structuring asset or businessdivestitures.Managing Director