Embed Size (px)
Citation preview

THESIS FOR THE DEGREE OF DOCTOR OF PHILOSOPHY
Microtechnologies for Single-cell Studies
Shijun Xu
Department of Chemical and Biological Engineering
CHALMERS UNIVERSITY OF TECHNOLOGY
Göteborg, Sweden 2014

ii
Microtechnologies for Single-cell Studies Shijun Xu
ISBN: 978-91-7597-063-9
© Shijun Xu, 2014
Doktorsavhandlingar vid Chalmers tekniska högskola
Ny serie nr 3744
ISSN 0346-718X
Department of Chemical and Biological Engineering
Chalmers University of Technology
SE-41296 Göteborg
Sweden
Telephone + 46 (0)31-772 1000
Printed by Chalmers Reproservice
Göteborg, Sweden 2014

iii
Microtechnologies for Single-cell Studies Shijun Xu Department of Chemical and Biological Engineering Chalmers University of Technology
Abstract This thesis describes the development and application of microdevice-based techniques and methods for single cell studies, which include determinations of intracellular enzymatic activity, the influence of temperature on enzymatic activity in single-cells, instant assessment of single-cell viability, and directed chemical cell-to-cell communication between nanotube-interconnected cells.
The initial focus was on the development of new approaches for single-cell studies using the benefit of microfluidic superfusion. Using the “Dynaflow” microflow superfusion device, intracellular enzymes in single cells could be directly titrated to map their function and performance under different external conditions. An estimation of intracellular enzyme activity was achieved using a newly established analytical model which was applied to the titration data. Subsequently, a novel microfluidic superfusion device, the multifunctional pipette, was applied to selected single cells. This technology generates a virtual flow cell at the size scale of a mammalian cell in an open volume, able to create an isolated chemical environment around it. We demonstrated instant assessment of single cell viability in different cell lines with high efficiency, and measured the influence of temperature, which was locally adjusted with an IR fiber laser heating microprobe, on the enzyme activity in single cells. Furthermore, a single-cell electroporation protocol was established using microelectrodes integrated into the multifunctional pipette, with which the uptake of calcium ions by the cell was quantified. The original focus was extended to investigations of chemical communication between single cells, using micromanipulation and injection techniques to form intercellular connections. In the first study, lipid nanotubes were artificially generated between two biological cells, and ions as well as an enzyme substrate were shown to migrate between them. In a subsequent investigation, the formation of interconnecting protrusions between adherent cells was initiated and directed by appropriately micropatterned Teflon AF surfaces. Tunneling nanotube-like interconnections were formed in a controlled manner, and their transport capabilities were examined by means of the Multifunctional Pipette. The set of microtechnology-based methods and techniques established in this work provides exciting experimental opportunities for single adherent cell studies, and has the potential to open new application areas. Keywords: Single-cell studies, intracellular enzyme assay, single-cell viability, cell-to-cell communication, microfluidic superfusion, Multifunction al Pipette, laser microheating, single-cell electroporation.

iv

v
LIST OF PUBLICATIONS
Paper I. J. Olofsson‖, S. Xu‖, G. D. M. Jeffries, A. Jesorka, H. Bridle, I. Isaksson, S. G. Weber, and O. Orwar Probing Enzymatic Activity inside single cells Anal. Chem., 2013, 9(85), 10125-10133
Paper II. H. Zhang, S. Xu, G. D. M. Jeffries, O. Orwar and A. Jesorka Artificial nanotube connections and transport of molecular cargo between mammalian cells Nano Communication Networks, 2013, 12(4), 197-204
Paper III. S. Xu, A. Kim, A. Jesorka and G. D. M. Jeffries A Rapid Microfluidic Technique for Viability Determination of Adherent Single Cells
Submitted Manuscript
Paper IV. S. Xu, A. Ainla, K. Jardemark, A. Jesorka and G. D. M. Jeffries A Heating-Superfusion Platform Technology for Single Cell Investigations Submitted Manuscript
Paper V. H. Zhang, A. Kim, S. Xu, G. D. M. Jeffries and A. Jesorka Microgap Closing by Cellular Processes: Critical Length-Scales and Membrane Morphology
Manuscript
Paper VI. A. Ainla, S. Xu, Ni. Sanchez, G. D. M. Jeffries & A. Jesorka Single-cell electroporation using a multifunctional pipette
Lab on a Chip, 2012, 12(22), 4605-4609.

vi
CONTRIBUTION TO THE PUBLICATIONS
Paper I. Designed some of experiments and performed all of the experiment. Analyzed data and Designed figure. Participate design and develop model. Wrote most of the paper. Paper II. Participated in the biological experiments. Designed some of figures. Contributed to the writing of the paper. Paper III. Proposed concept of cell viability test using new method. Designed and performed all of the experiments. Designed figures and wrote the paper. Paper IV. Proposed concept of probing temperature influence on intracellular enzyme using a new technique. Designed and performed all of the experiments. Designed figures and wrote most of the paper. Paper V. Participated to design of some experiment. Participated in all biological experiments and performed the data evaluation of the transport experiments. Designed some of the figures. Contributed to the writing of the paper. Paper VI. Participated in all biological experiments. Contributed to design figures and wrote paper.

vii
Table of Contents
Chapter 1: Introduction ................................................................................................................................. 1
Chapter 2: Enzymes ...................................................................................................................................... 5
2.1 Enzymatic Reaction Kinetics .............................................................................................................. 6
2.1.1 Enzymatic Reaction Order ........................................................................................................... 6
2.1.1.1 Zero Order Reaction ............................................................................................................... 7
2.1.1.2 First Order Reaction ............................................................................................................... 7
2.1.1.3 Second Order Reaction .......................................................................................................... 8
2.1.2 Michaelis-Menten Kinetics .......................................................................................................... 9
2.2 Enzyme Inhibition ............................................................................................................................. 11
2.2.1 Competitive Inhibition ............................................................................................................... 12
2.2.1 Noncompetitive Inhibition ......................................................................................................... 13
2.2.1 Uncompetitive Inhibition ........................................................................................................... 14
2.3 Macromolecular Crowding ............................................................................................................... 15
2.3.1 Macromolecular Crowding Effecting on Enzyme Activity ....................................................... 15
2.3.2 Macromolecular Crowding Affecting the Association Rate ...................................................... 16
2.4 Influential Factors on Enzyme Reaction ........................................................................................... 19
2.4.1. Temperature Effect on Enzyme Activity .................................................................................. 19
2.5 Enzymes used in the Studies ............................................................................................................. 21
2.5.1 Alkaline Phosphatase ................................................................................................................. 21
2.5.2 Protease ...................................................................................................................................... 22
Chapter 3: Cell Networks ............................................................................................................................ 23
3.1 Nanotube Communication between Cells ......................................................................................... 23
3.2 Junction Communication between Cells ........................................................................................... 26
Chapter 4: Cell Viability ............................................................................................................................. 29
4.1 Cell Viability Test Agents................................................................................................................. 30
4.1.1 Fluorescein Diacetate ................................................................................................................. 30
4.1.2 Trypan Blue ............................................................................................................................... 31
4.1.3 Propidium Iodide ....................................................................................................................... 31
Chapter 5: Techniques and Methods ........................................................................................................... 33
5.1 Superfusion Techniques .................................................................................................................... 33

viii
5.1.1 Physics of Microfluidics ............................................................................................................ 33
5.1.2 PDMS Microfluidics .................................................................................................................. 36
5.1.3 Dynaflow Chip ........................................................................................................................... 38
5.1.4 Multifunctional Pipette .............................................................................................................. 39
5.2 Fluorescence and Laser Scanning Confocal Microscopy ................................................................. 41
5.2.1 Fluorescence and Fluorophores ................................................................................................. 41
5.2.2 Confocal Microscopy ................................................................................................................. 42
5.2.2.1 Resolution Considerations ................................................................................................... 44
5.2.2.2 Cell Imaging Using Confocal Microscopy .......................................................................... 45
5.3 Infrared Laser Microheating System ................................................................................................. 47
Chapter 6: Cell Handling and Manipulation ............................................................................................... 51
6.1 Cell Preparation and Handling .......................................................................................................... 51
6.1.1 Defrosting and Freezing of Cells ............................................................................................... 51
6.1.2 Cultivation and Maintenance of Four Cell Lines ....................................................................... 52
6.1.3 Cell Dish Preparation ................................................................................................................. 54
6.1.4 Cell Staining ............................................................................................................................... 55
6.2 Cell Permeabilization ........................................................................................................................ 56
6.2.1 Chemical Poration ...................................................................................................................... 56
6.2.2 Electroporation ........................................................................................................................... 58
6.3 Fluorogenic Substrate for Enzymes .................................................................................................. 60
Chapter 7: Summary of the Papers ............................................................................................................. 63
Chapter 8: Conclusion and Future Outlook ................................................................................................ 71
Acknowledgements ..................................................................................................................................... 73
References ................................................................................................................................................... 75

Microtechnologies for Single-cell Studies 1. Introduction
1
Chapter 1: Introduction
The biological cell is the basic structural and functional unit of living organisms, considered as the "building block of life"1. Much biological research is directed towards deeper understanding of the cell – its structure2, components3, metabolism4, communication5, and development6. Progress in each of these areas of interest faces specific challenges, which are being addressed by modern research. One major contemporary challenge is to understand cell-to-cell heterogeneity7, i.e., the subtle differences between single-cells of the same species, and the importance of these differences in the development of diseases8-9. Heterogeneity arises from many origins, such as differences in size, cell cycle progression and gene expression10-13. Even cells which are identical in their properties can show differences in their individual behavior, such as molecular actions and signaling during differentiation and development, and possibly in response to various external stimuli, signals and environmental stress14-15. Such subtle variances among cells could be identifiable, e.g., in cell division, the cell cycle, and in case of stem cells, in the differentiation potential16-17.
Typical cell-based assays, which are common in biology laboratories today, are carried out on collectives of tens, to hundreds of thousands of cells, which generate an ensemble average response. In such experiments, the differences between the individual cells are obscured, and single-cell related information cannot be extracted18-19. For instance, in tumor studies, including collectives of different types of cells including immune cells, endothelial cells and other infiltrating cells, it is difficult to identify the origin of the disease20-21, its progression, or the role of the individual cells in disease development, and to assign efficient treatments with minimal damage to unaffected cells22-23.
Single-cell techniques are required for an analysis of individual cells in a sample, which interrogate the cell-to-cell heterogeneity, extracting detailed information relevant to the nature and history of the aberrant condition24. By profiling the individual cells, it may be possible to discover rare cells, transient cell states, and subtle influences of organization and environment on the cell states, which cannot be described by conventional ensemble measurements25-26.
There is currently a pronounced lack of innovative technologies to better define cell heterogeneity. The National Institutes of Health (USA) have in 2013 initiated a program to develop tools and instrumental techniques which can systematically measure, analyze and model

Shijun Xu, 2014
2
cell-to-cell variation, and identify crucial differences and rare biological states, with the long term goal of correlating these findings with important cellular functions and malfunctions, most importantly in the context of the origins of disease, disease progression and development.
A single cell entails a rather small sampling volume (~10-12 L) which is mainly composed of water, inorganic ions and small organic molecules including sugars, vitamins and fatty acids6. About one quarter of its content consists of protein and DNA/RNA. There are as many as 109 molecules of various kinds distributed within the cell. More than 108 protein molecules are among them, which include receptors, signaling enzymes and structural proteins27. These proteins are not equally abundant; some rare species are present in very low copy numbers. Thus, a single-cell analysis approach has to account for low concentration conditions, sometimes even down to the single molecule level28.
In order to meet those constraints, a single-cell-oriented experimental system requires the capability of a) manipulating the cell at its size scale, b) processing small volumes accurately without sample loss and contamination, and c) detecting ultra-low concentrations with high sensitivity29-30. Beside these fundamental figures of merit, modern analytical single-cell techniques must aim for rapid analysis (automation), high selectivity and easy integration with existing biological equipment. Gentle cell handling for prolonged cell viability and determination of cell viability are additional requirements, which also need to be addressed31-32.
The work presented in this thesis focuses on the development and application of microtechnology-based devices and methods for adherent single-cell studies, including intracellular enzymatic activity, the influence of temperature on enzymatic activity in single cells, instant assessment of single-cell viability, and direct chemical cell-to-cell communication between nanotube-interconnected cells.
Herein, we use the benefits of various microtechnologies, in particular surface micropatterning, microoptics, micromanipulation and microfluidic “Lab on a Chip” devices. The project began with a novel strategy to determine the enzymatic activity and inhibition within a single suspended cell and established a deterministic model of intracellular enzyme activity (Paper I). For probing intracellular enzyme kinetics, a permeated cell, formed by exposure to a pore-forming agent, allows the substrate to enter a cell, and the reaction product to diffuse out through the pores formed in the plasma membrane. Similar behavior is observed if the enzyme substrate is delivered through tunneling nanotubes, which were fabricated between single mammalian cells by micromanipulation (Paper II). The challenges experienced in the single-cell studies performed in Paper I, using the commercial Dynaflow device, inspired application of a new superfusion concept - the Multifunctional Pipette. This novel device features a localized,

Microtechnologies for Single-cell Studies 1. Introduction
3
hydrodynamically confined virtual flow chamber at the size scale of a single biological cell. This device can be readily positioned in an open volume, enabling creation of an isolated chemical environment around any chosen adherent cell. The first application example is a single-cell viability assay for different cell lines (Paper III). The pipette was also used in combination with an IR laser microheating probe for determining the temperature influence on enzymes within single adherent cells (Paper IV). We further investigated the transport of molecules in cell-to-cell tube interconnections, where the new device was utilized to deliver chemical compounds to one of the interconnected cells (Paper V), and performed simultaneous single-cell superfusion and electroporation by means of pipette-integrated electrodes (Paper VI).
In chapter 2, the basic concept of enzyme reactions and inhibition is introduced.
In chapter 3, the concept of cell-to-cell communication including nanotube or junction communication between cells is described. Current approaches in cell-to-cell communication research are addressed focusing on the aspects connected to the thesis work.
In chapter 4, background on cell viability assays is provided.
In chapter 5, the methods and techniques used in the experimental work that led to this thesis are introduced. This includes microfluidic techniques, confocal microscopy imaging, and the IR laser heating setup.
In chapter 6, background information on cell culturing, handling and manipulation is provided.
Hopefully, further development of the techniques described in this thesis will lead to more sophisticated single-cell methods. The use of microfluidic devices, in particular the Multifunctional Pipette, has so far been a very promising road to better access the single-cell world. It is clearly foreseeable that better, more localized techniques to investigate connectivity and communication between such cells, potentially using extensions of strategies mentioned in this thesis, can have a significant beneficial impact on the progress in this field.

Shijun Xu, 2014
4

Microtechnologies for Single-cell Studies 2. Enzymes
5
Chapter 2: Enzymes
The cell is the basic unit of life, which can be viewed as a system of interconnected nanoreactors in which millions of chemical reactions occur simultaneously in order to maintain biological homeostasis33. These reactions are regulated by biochemical catalysts - enzymes, which are responsible for supporting and controlling most of the chemical transformations in the cell34, such as removing of hydrogen atoms by oxidoreductases35, adding large ribosomal subunit onto proteins by peptidyltransferase36, removing phosphate groups form proteins by phosphatase,37 and many more (Figure 2.1).
Figure 2.1 Schematic drawing of a single eukaryotic cell. Major organelles and components of the cytoskeleton are named, along with essential enzymes that are present in them.

Shijun Xu, 2014
6
If the enzymes dysfunction on a large scale, various pathological conditions result. For example, Gaucher’s disease is caused by an inherited deficiency of glucocerebrosidase38, and the absence of, or deficiency in, acid alpha-glucosidase leads to Pompe disease39; Dysfunction in alkaline phosphatase (AP) results in Paget’s disease of bone, liver disease and bile duct obstruction40-41. Thus, assays on enzyme regulation have become crucial for clinical diagnosis and therapeutics42. Because of limitations in the currently available assay methods, it is very hard to examine enzymes within an intact single cell. Consequently, the enzymatic experiments are based on bulk experiments, lysed cells or enzyme extracted from them (typically 103-106 cells). Such experiments in vitro provide only information of an ensemble average of the cell response, where it is hard to reveal the behavior of individual cells. Therefore, investigating the enzyme kinetics in single cells has become a new important direction in enzyme studies18-19,43-45.
2.1 Enzymatic Reaction Kinetics
In order to elucidate the mechanisms of enzyme catalysis and regulation, it is crucial to study the kinetic behavior of enzyme-catalyzed reactions. Kinetic information on enzymes, including metabolism regulation and the influence of different external conditions, is fundamental for understanding various pathological states34 37. In particular for effective treatment of diseases, deep understanding how enzymes perform their work is critical. This is closely related to the understanding the mechanism of drugs actions, because many drugs work by interacting with a certain enzyme. Knowledge about the reaction kinetics, the binding site and inhibition conditions offers useful information for designing new drugs and treatments18,24,46.
2.1.1 Enzymatic Reaction Order
Chemical reaction kinetics is the study of the rates of chemical processes under different conditions. Any chemical reaction occurs following a specific reaction mechanism, which describe in a stepwise manner the exact collisions and events that are required for the conversion of reactants into products. To classify chemical reactions in this respect, one approach is according to its reaction order. The overall reaction order is proportional to the sum of the exponents of the reactant concentrations, i.e., it describes how many concentration terms must be multiplied in order to get an expression for the rate of the reaction47. In enzymatic reactions, the

Microtechnologies for Single-cell Studies 2. Enzymes
7
order can also be classified in this manner, where the reactions are defined as zero (concentration independent), first (one concentration term), and second order (two concentration terms), and so on 34,48.
2.1.1.1 Zero Order Reaction
Enzymatic reactions are a somewhat special case with respect to reaction order. They are independent of the reactant concentration, and are consequently defined as zero order. In this case, the reaction rate is constant, irrespective of the concentration of the participating compounds. The rate equation of this reaction is:
𝑣 = −𝑑[𝐴]
𝑑𝑡=
𝑑[𝑃]𝑑𝑡
= 𝑘 (1)
where 𝑣 is the rate (velocity), [𝐴] and [𝑃] are substrate and product concentrations, respectively, 𝑡 is the time coordinate, and 𝑘 is the zero order rate constant. This equation states that the velocity is equal to the change in concentration of substrate or product over the time interval in which the reaction was followed. Since the rate is independent of the concentrations of [𝐴] and [𝑃], the velocity is constant for the reaction.
2.1.1.2 First Order Reaction
The simplest chemical reaction is the irreversible spontaneous conversion of substrate 𝐴 into a product 𝑃, in which the rate 𝑣 can be determined by the decrease in the number of molecules 𝐴 or from the increase in 𝑃. The rate 𝑣 is proportional to the concentration of reactant 𝐴. For this reaction, the velocity of the reaction can be expressed as:
𝑣 = −𝑑[𝐴]
𝑑𝑡=
𝑑[𝑃]𝑑𝑡
= 𝑘1[𝐴] (2)

Shijun Xu, 2014
8
Since we assume the reaction is irreversible, the velocity is 𝑘1 times the substrate concentration at any given time. Thus, 𝑘1 represents how rapidly the reaction will occur at any concentration of 𝐴 in certain units of time. In a first-order reaction, the rate depends on the concentration of only a single species (substrate). This means that the velocity increases linearly with increasing the reactant concentration.
2.1.1.3 Second Order Reaction
If two reactants join to form a product, it can be expressed by:
𝐴 + 𝐵 𝑘1 �⎯� 𝑃
The turnover rate of this reaction depends on the consumption of substrates 𝐴 and 𝐵 for the formation of product 𝑃 . This reaction is described as second order because the rate is proportional to the concentrations of both reactants. The velocity of this reaction can be expressed as
𝑣 = −𝑑[𝐴]
𝑑𝑡= −
𝑑[𝐵]𝑑𝑡
=𝑑[𝑃]
𝑑𝑡= 𝑘1[𝐴][𝐵] (3)
In case of equal amounts of reactants, [𝐴]=[𝐵], equation (3) can be simplified to:
𝑣 = −𝑑[𝐴]
𝑑𝑡= 𝑘1[𝐴]2 (4)
As introduced above, in higher-order reactions, the rate depends on the number of reactants, and is defined by the sum of the exponents of the concentration terms. Thus, the reaction rates increase exponentially.
In my thesis work, two enzymes, alkaline phosphatase and protease were investigated. Reactions of alkaline phosphatase and its substrate fluorescein diphosphate, as well as protease and the substrate BODIPY FL casein are both first-order reactions. Details of these two specific cases will be discussed in Chapter 6.

Microtechnologies for Single-cell Studies 2. Enzymes
9
2.1.2 Michaelis-Menten Kinetics
The enzymatic reaction is in many cases a more complicated chemical reaction, which cannot be categorized to any single of the reaction types mentioned above. These reactions are not only based on simple collisions between molecules. A complex is formed between the enzyme and substrate, which greatly influences the kinetics. The general reaction scheme of an enzyme-catalyzed reaction is as follow:
𝑆 + 𝐸 𝑘−1 �⎯⎯� 𝑘1 �⎯⎯� 𝐸𝑆
𝑘2→ 𝐸 + 𝑃
The substrate reacts with the enzyme by binding to the enzymatic active site, forming an enzyme-substrate complex 𝐸𝑆, which then decomposes to regenerate the free enzyme 𝐸 and the new product 𝑃. In most enzymatic reactions, the time progression can be divided into three phases: 1) pre-steady-state phase, 2) steady-state phase, 3) substrate depletion. In the initial phase, where free enzyme 𝐸 is consumed, the 𝐸𝑆 complex formed and product 𝑃 rapidly increased as second-order reaction. The turnover rate is low and the rate of product accumulation increases over time in this region. In the second phase, the concentration of the 𝐸𝑆 complex remains nearly constant and the product linearly increases with time, and the turnover rate reaches its highest value. In the depletion phase, the substrate is exhausted, the complex 𝐸𝑆 decays, and the concentration of product reaches a plateau. The turnover rate starts to drop, finally reaching zero.
The turnover rate is defined as the product formation, expressed as
𝑣 =𝑑[𝑃]
𝑑𝑡= 𝑘2[𝐸𝑆] (5)
The concentration of 𝐸𝑆 is not a linear function of 𝑆. In fact, the change in concentration of complex 𝐸𝑆 over time is somewhat more complicated and can be calculated by
𝑑[𝐸𝑆]𝑑𝑡
= 𝑘1[𝐸][𝑆] − 𝑘−1[𝐸𝑆] − 𝑘2[𝐸𝑆] (6)
When the enzyme reaction progression is in the steady-state phase, the change of the complex 𝐸𝑆 remains constantly and 𝑑[𝐸𝑆]/𝑑𝑡=0. The equation (6) can be rearranged as

Shijun Xu, 2014
10
𝑘1[𝐸][𝑆]𝑘−1 + 𝑘2
= [𝐸𝑆] (7)
The three rate constants 𝑘1 , 𝑘−1 and 𝑘2 are combined as a new term. 𝐾𝑚 , known as the Michealis-Menten constant, can be expressed as
𝐾𝑚 =𝑘−1 + 𝑘2
𝑘1 (8)
This equation can be rewritten as
[𝐸][𝑆]
𝐾𝑚= [𝐸𝑆] (9)
In equation (9), the enzyme [𝐸] is the concentration of unbound enzyme, which varies over the progress of the reaction, since some share of free enzyme reacts with substrate 𝑆 to form the 𝐸𝑆 complex. However, the total amount of enzyme (𝐸𝑡𝑜𝑡𝑎𝑙) is constant as
[𝐸𝑡𝑜𝑡𝑎𝑙] = [𝐸] + [𝐸𝑆] (10)
Introducing this into Equation (9) gives
[𝐸𝑡𝑜𝑡𝑎𝑙][𝑆]𝐾𝑚 + [𝑆]
= [𝐸𝑆] (11)
According to turnover rate definition, the equation can be rewritten to

Microtechnologies for Single-cell Studies 2. Enzymes
11
𝑣 =𝑘2[𝐸𝑡𝑜𝑡𝑎𝑙][𝑆]
𝐾𝑚 + [𝑆] (12)
If the entire available enzyme is bound to substrate, the maximum possible reaction rate can be determined: 𝑘2[𝐸𝑡𝑜𝑡𝑎𝑙] is equal to the maximum velocity 𝑉𝑚𝑎𝑥. Equation (12) can be simplified as
𝑣 =𝑉𝑚𝑎𝑥[𝑆]
𝐾𝑚 + [𝑆] (13)
This equation is known as Michaelis-Menten equation. It is based on the following steady-state theory assumptions: 1) the enzymes are catalysts, which do not change during measurement of the reaction. 2) When 𝑘1 ≈ 𝑘−1>𝑘2, the 𝐸𝑆 complex rapidly proceeds to equilibrium. 3) The concentration of enzyme is much smaller than the concentration of the substrate. Thus, the amount of enzyme could be considered as constant. 4) At initial time point, 𝑡 = 0, the product concentration is zero, and is normally omitted34,48-49.
In Paper I, an analytical modeling is established to acquire the characteristic 𝐾𝑚 for enzymatic reactions, based on single cell experiments. We show with this model how to utilize the Michaelis-Menten theory to analyze reactions involving enzymes in a single cell.
2.2 Enzyme Inhibition
The catalytic activity of enzymes in a cell can be regulated at many levels of biological organization. Normally, the regulation is realized by enzyme inhibitors, which can reduce or completely halt the enzyme activity through binding to a certain site on an enzyme in a reversible or irreversible way. Enzyme inhibition is a key factor for understanding the reaction properties of enzymes. It is very attractive for the development of therapeutic drugs. It has been reported that the therapeutic efficacy of more than 50% of all drugs is derived through enzyme inhibition. In the following, the three basic mechanisms of inhibition are outlined; competitive, noncompetitive and uncompetitive inhibition34,49-51.

Shijun Xu, 2014
12
2.2.1 Competitive Inhibition
Competitive inhibition occurs when the inhibitor is a close analogue of the substrate, which causes competition between inhibitors and substrates. These inhibitors bind to active sites which should be occupied by substrate, decreasing the ability of an enzyme to bind its substrate. The competitive inhibition reaction scheme follows the following mechanism34.
At steady state, the dissociation constant can be expressed as
𝐾𝑖 =[𝐸][𝐼][𝐸𝐼]
(14)
A new term is added to equation (10) in order to express the total amount of enzyme, as some enzyme is consumed by the binding inhibitor:
𝐸𝑡𝑜𝑡𝑎𝑙 = 𝐸 + 𝐸𝑆 + 𝐸𝐼 (15)
The rate equation can be rearranged to
𝑣 =𝑉𝑚𝑎𝑥[𝑆]
𝐾𝑚 �1 + [𝐼]𝐾𝑖
� + [𝑆] (16)
This equation can be modified according to the Lineweaver-Burk equation, to take the form y = mx+b:

Microtechnologies for Single-cell Studies 2. Enzymes
13
𝑣 = �1 +[𝐼]𝐾𝑖
�𝐾𝑚
𝑉𝑚𝑎𝑥
1[𝑆] +
1𝑉𝑚𝑎𝑥
(17)
In competitive inhibition, 𝑉𝑚𝑎𝑥 is unaffected by the inhibitor, as it binds to only a certain amount of enzyme molecules, while the others continue to react normally, i.e., 𝑉𝑚𝑎𝑥 is only determined by the maximum possible concentration of the 𝐸𝑆 complex, which only depends on the amount of enzyme involved in the reaction.
2.2.1 Noncompetitive Inhibition
Noncompetitive inhibition occurs when the inhibitor does not only bind to the free enzyme but also to the enzyme-substrate complex. The following reaction scheme describes the mechanism for a noncompetitive inhibition reaction. In this simple case, the association and disassociation rates 𝑘1 and 𝑘−1 are equal to 𝑘4 and 𝑘−4, and 𝑘3 and 𝑘−3 are identical to 𝑘5 and 𝑘−5.
The resulting rate equation can be written as
𝑣 =𝑉𝑚𝑎𝑥[𝑆]
(𝐾𝑚 + [𝑆]) �1 + [𝐼]𝐾𝑖
� (18)
which can be rearranged to take the form y=mx+n:
1𝑣
= �1 +[𝐼]𝐾𝑖
�𝐾𝑚
𝑉𝑚𝑎𝑥
1[𝑆] +
(1 + [𝐼]𝐾𝑖
)
𝑉𝑚𝑎𝑥 (19)

Shijun Xu, 2014
14
In noncompetitive inhibition, the linear slope is �1 + [𝐼]𝐾𝑖
� 𝐾𝑚𝑉𝑚𝑎𝑥
, the intercept with the y-axis is
(1+[𝐼]𝐾𝑖
)
𝑉𝑚𝑎𝑥 and with the x-axis 1
𝐾𝑚. If the concentration of inhibitor increases, it will only lower 𝑉𝑚𝑎𝑥
without affecting 𝐾𝑚.
2.2.1 Uncompetitive Inhibition
In this type of inhibition reaction, an uncompetitive inhibitor exclusively binds to the enzyme-substrate complex. The scheme below describes the process. Thus, only when substrate reacts with the enzyme to form the enzyme-substrate complex, a binding site will be generated for the uncompetitive inhibitor.
The resulting rate equation is
𝑣 =𝑉𝑚𝑎𝑥[𝑆]
𝐾𝑚 + [𝑆](1 + [𝐼]𝐾𝑖
) (20)
which can be rearranged to the form y=mx+n:
1𝑣
=𝐾𝑚
𝑉𝑚𝑎𝑥
1[𝑆]
+1 + [𝐼]
𝐾𝑖𝑉𝑚𝑎𝑥
(21)
Where the y-intercept is at (1 + [𝐼]𝐾𝑖
)/𝑉𝑚𝑎𝑥 and the x-intercept at−(1 + [𝐼]𝐾𝑖
)/𝐾𝑚, with slope 𝐾𝑚𝑉𝑚𝑎𝑥
.
This gives a number of lines in the Lineweaver-Burk plot that are parallel to the normal line with
decreased 1/𝑉𝑚𝑎𝑥 , and −(1 + [𝐼]𝐾𝑖
)/𝐾𝑚 proportional to the concentration of the uncompetitive

Microtechnologies for Single-cell Studies 2. Enzymes
15
inhibitor. In uncompetitive inhibition, some of 𝐸𝑆 complex is sequestrated by forming 𝐸𝑆𝐼 , which decreases the dissociation rate (𝑘2) of the enzyme-substrate complex.
In Paper I, the investigation of the uncompetitive inhibitor levamisole for alkaline phosphatase was used to establish that quantitative measurement of inhibition for intracellular enzyme can be realized using a steady-state microfluidic solution delivery device. The dose-inhibition curves could be acquired and the inhibition constant 𝐾𝑖 was estimated at the single-cell level.
2.3 Macromolecular Crowding
The cell as a highly compartmentalized system of biochemical reactions comprises a heterogeneous mixture of biomacromolecules6. Evidence shows those macromolecules occupy approximately 40% of the cell’s volume52, creating an environment which reaches much higher concentrations than found in artificial conditions for in vitro studies43,45. Macromolecules with similar physical properties, such as hydrophobicity and charge, often associate and exclude other molecules from occupying the same space (excluded volume) 53. This macromolecular crowding effect will affect protein folding and aggregation54-55, enzyme kinetics56, cell signaling57 and the rates of diffusion of substrates to enzymes58. In the following section, I will briefly introduce how macromolecular crowing affects enzyme activity and the association of molecules which are crucial for enzyme kinetics.
2.3.1 Macromolecular Crowding Effecting on Enzyme Activity
The kinetics of some chemical reactions shows a large difference between in vitro and in vivo environments59. Because intracellular proteins and other biological macromolecules are present in high concentrations in a comparatively small volume, a complex macromolecular crowding environment is generated. Macromolecular crowding affects enzyme kinetics, protein folding and aggregation, diffusion, cell signaling, protein stability and a range of other conditions within the cell40,44. Since most of the enzymes are proteins, their function depends strongly on their three dimensional structures60-61, which are dependent on hydrogen bonds, van der Waals-, and ionic interactions. These binding interactions are to a large extent determined by the composition of the environment62-63. Conventional in vitro experiments are carried out under conditions where only dilute aqueous solutions are used, which is quite different from the crowded

Shijun Xu, 2014
16
environment present within the cell. As schematically depicted in Figure 2.26, the 3D structures of large enzyme macromolecules are greatly influenced by a crowding environment, which leads, in comparison with a non-crowded environment, to differences in activity64.
In Paper I, the determined constants Km and Ki from single cell and bulk experiments show quite different values. Single-cell experiments were performed on mildly permeated cells with a presumably well-preserved intracellular environment, whereas the cells in bulk experiments were more heavily permeabilized, so that the enzymes experienced a more diluted chemical environment. One possible explanation is that the activity of an enzyme changes due to a change in structure when it experiences different concentration environments65.
Figure 2.2. Macromolecular crowding contributes to compaction of protein molecules. A) A protein molecule (red band) in an environment of low concentration of macromolecules (green dots) B) Compacted protein conformation in an environment with high concentration of macromolecules.
2.3.2 Macromolecular Crowding Affecting the Association Rate
In vitro, the chemical reaction is affected by molecular dynamics, such as diffusion, which could be thought to be simple diffusion as described by the Stokes-Einstein relations66. This equation is applied to diffusion through a continuous, hydrodynamic fluid with a constant viscosity. Conversely, the crowded environment is complex and heterogeneous. Diffusion in such conditions is more complicated and depends on the concentration of macromolecules in the cells.

Microtechnologies for Single-cell Studies 2. Enzymes
17
Thus, the kinetics of chemical reactions including enzymatic reaction is different, owing to hindered diffusion under macromolecular crowding conditions45,58.
The diffusion directly affects the association rates. The association constant is used to describe the bonding affinity between two molecules, which can generally be expressed as
𝑘𝑎 =𝑘𝐷𝑘𝑟𝑒𝑎𝑐𝑡
𝑘𝐷 + 𝑘𝑟𝑒𝑎𝑐𝑡 (22)
where 𝑘𝐷 is the rate constant under diffusion control and 𝑘𝑟𝑒𝑎𝑐𝑡 is the rate constant under reaction or transition-state control. There are two factors affecting the association constant differently. As depicted schematically in Figure 2.3, the increased crowding decreases the diffusion of the molecules, thus acts to decrease 𝑘𝐷. At the same time, the reactants experience more attractive interaction between each other due to crowing, which could partially compensate for the deceasing in 𝑘𝐷. However, the overall effect is generally 𝑘𝐷 deceasing with increased crowding. On the other hand, 𝑘𝑟𝑒𝑎𝑐𝑡 is relative to the energy barrier for transition state controlled reactions, which is dictated by the energy needed for formation changes before forming the product. In a crowded environment, it assists the reactant molecules to compact and effectively lower the association energy barrier, which results in an increase of the association rate. Because fast associations are typically under diffusion control and slow associations are under reaction control. Thus, macromolecular crowding generally increases the rate of slow association and decrease the rate of fast association45,58.
Figure 2.3 Macromolecular crowding contributes to diffusion of reagent molecules. A reagent molecule (depicted as red sphere in an environment of other molecules shown as green spheres) diffuses differently A) in dilute conditions, e.g. in vitro and B) in a crowded environment, e.g. in vivo.

Shijun Xu, 2014
18
As shown in Paper I, our results are consistent with theoretical predictions of differences in enzyme behavior for environments that deviate from the native crowding environments inside an intact cell. The activity of alkaline phosphatase and levamisole inhibition is different between the intracellular and extracellular environment. Alkaline phosphatase is a highly efficient enzyme with a fast association rate which is limited by the limited diffusion in crowding. Therefore, the higher concentrations of the AP substrate fluorescein diphosphate (FDP) are needed to reach the maximum product formation rate in our single-cell experiment compared to bulk experiments, yielding a higher 𝑘𝑚 in the single-cell experiment. For inhibition experiments, levamisole is an inhibitor that is hard to be consumed and associates slowly with the enzyme. Therefore, it is reasonable that the inhibition is more efficient in single-cell experiments compared to in bulk, resulting in a lower 𝑘𝑖.
In this thesis, we focus on the development of new methods to investigate the behavior of intracellular enzyme substrates, under preservation of the intracellular environment. With the conventional techniques, measurements are based on cell extracts, heavily permeabilized or partly disintegrated cells. Detailed information on native single cells, possessing all the complex properties and influential factors is still lacking19. Most importantly, results obtained in bulk measurements may have limited applicability to in vivo situations, as several key environmental parameters of cells are neglected in such experiments. Examples include macro-molecular crowding, the presence of inhomogeneities, modulated chemical potentials, fluctuating geometries, and effects of micro- and nano-scale confinement, all of which may affect transport and reaction dynamics within a biological cell19,43,45,56. Conformational reorganization could be required as enzymes may exist in an inactive form that demands post-translational processing for activation, or may be inactive due to binding to natural inhibitors46. In a crowded environment, interactions between enzymes, with other proteins and with structural elements of the cell can be facilitated45,53. Those interactions can regulate enzyme activity, and can create phenomena such as substrate channeling46,67-68. It has been shown that rate constants estimated from bulk measurements can be incorrect by more than an order of magnitude53. It has also been demonstrated that physiological effects such as crowding, confinement, and low copy numbers of species can lead to interesting properties, e.g., compartmentalization of enzyme reactions can give rise to self-organized synchronous behaviors69. Geometrical hindrance of diffusion within small volumes can result in wave-like product formation over time19. For single enzyme molecules, deviations from Michaelis-Menten kinetics, as well as molecular memory effects, have been observed70-72. To eradicate several of the necessary parameters in in vivo experiments, additional components can be added to simulate the natural environment. For example, macromolecular species have been added to mimic crowding conditions43, vesicles have been

Microtechnologies for Single-cell Studies 2. Enzymes
19
used as small, biomimetic reaction chambers73, and polymers have been added to imitate cytoskeletal elements. While these approaches consider some physiological effects, it is obviously more relevant to perform experiments within whole cells rather than adding complexity to a test tube sample. However, since the cell membrane is naturally impermeable to most substances of interest, several different techniques have been developed to allow entry by impermeable substrates74 and enzyme kinetics have been studied for chemically permeabilized75, electroporated cells76-77 and lipid-replaced systems78. Thus, the maintaining of physiological conditions is one of the biggest challenges for the study of intracellular components.
2.4 Influential Factors on Enzyme Reaction
Enzymatic reactions are most efficient under defined conditions, including an optimal chemical and physical environment. The velocity of an enzymatic reaction is influenced by a number of solution conditions, such as ionic strength, pH, the presence of specific cations, and temperature34,48. When the conditions deviate even only slightly from the optimum, the enzyme activity will decrease to a certain degree, which leads to significant error and lack of reproducibility in measurements. Enzyme activity is typically measured in vitro based on suspensions of lysed cells or using recombinant proteins, an approach which neglects several environmental parameters in vivo, such as effects of micro- and nano-scale confinement, the presence of particular salts, and others. Some conditions, such as optimum pH, temperature, and ionic strength are convenient to control and simulate by modern chemical and biophysical technologies. In many cases, artificial conditions can be created to mimic in vivo conditions to the fullest extent possible. Therefore, better and more comprehensive understanding of the parameters affecting the activity of enzyme in the single cell will aid in extrapolating the enzymatic functions occurring in vivo48-49.
2.4.1. Temperature Effect on Enzyme Activity
For most chemical reactions, the reaction rate approximately doubles in response to a rise of temperature of 10ºC. This rule of thumb is displayed by almost all chemical reactions including enzyme-catalyzed reactions. Enzymes, however, are also proteins with characteristic properties, which change their conformation with temperature and undergo thermal denaturation after

Shijun Xu, 2014
20
reaching a certain critical temperature. Therefore, the efficiency of enzymatic catalysis can be influenced by temperature change only in a finite range, outside of which it rapidly diminishes. When the temperature reaches this optimal point, the enzyme conformation is very sensitive to any alteration in thermal environment. This enzyme conformation change leads to the changes in the enzyme surface and to disruption of the active site, such that the substrate may not fit properly, and the reaction rate decreases. For most enzymes from bacteria and higher organisms, the optimum temperature is around 37°C34 48-49.
An analysis of the changes in enzyme activity that accompany changes in temperature can be mechanistically informative. According to the Arrhenius equation, the rate of a reaction can be expressed by the activation energy as follows:
𝑘𝑐𝑎𝑡 = 𝐴𝑒(−𝐸𝑎
𝑅𝑇) (23)
where 𝑅 is the ideal gas constant (1.98 × 10⁻³ Kcal/mole·degree), 𝑇 is the temperature in Kelvin, and 𝐴 a pre-exponential constant of proportionality. Taking the common logarithm of both sides we obtain:
log(𝑘𝑐𝑎𝑡) = −𝐸𝑎1
2.3𝑅𝑇+ log (𝐴) (24)
Thus, a linear relationship is obtained between log (𝑘𝑐𝑎𝑡) of an enzymatic reaction and 1/2.3𝑅𝑇 with a slope of −𝐸𝑎. Since the temperature of a reaction has such a dramatic effect on the kinetic parameter of an enzyme-catalyzed reaction, it is interesting to study how enzymes respond to changes in temperature. In essence, when observing the change in enzyme activity with temperature, 𝑘𝑐𝑎𝑡 will decrease accompanied with increase in temperature above the optimum. Denaturation of enzymes at those temperatures occurs as irreversible thermal inactivation or reversible unfolding of the proteins79-80.
In Paper IV we present a new microfluidics- and local heating-assisted method for directly probing the influence of temperature on alkaline phosphatase (AP) and protease activity in single cells. The results show that the optimum temperature for both AP and protease is 37ºC.

Microtechnologies for Single-cell Studies 2. Enzymes
21
2.5 Enzymes used in the Studies
In this project, alkaline phosphatase (AP) and protease have been used to gain information on enzyme kinetics in single cells. AP and protease are both common and crucial enzymes for all major cellular processes including transcription and translation of genes, ATP conversion and protein synthesis, and others. In this section, these two enzymes are briefly introduced.
2.5.1 Alkaline Phosphatase
Alkaline phosphatases (AP) are found in a wide variety of organisms from eukaryotes to prokaryotes and in different locations, from tissues to organelles, serving various purposes81. AP is responsible for hydrolyzing phosphate groups from many species, e.g. nucleotides, proteins, and alkaloids, which is essential in many dephosphorylation processes. In mammals, AP is basically found in all organ tissues. The activity is higher in bone, the liver and the associated bile duct, the kidney, and in the placenta. AP is thought to be involved in bone ossification and transport of nutrients across epithelial membranes, but the exact function is not completely known. Its analysis is carried out in the medical context for diagnosing bone disease.
AP is a dimeric structure with three active sites consisting of the amino acids asparagines, serine and alanine, where serine is deprotonated and conducts a nucleophilic attack on the phosphate of the substrate. In addition, each active site also coordinates two Zn2+ ions and Mg2+ ions, in which the presence of Zn2+ is an essential requirement for catalysis. Studies have also shown that both Zn2+ and Mg2+ ions must be present in the incubation medium to reach maximum activity82. Similarly, other ions, such as Co2+ and Mn2+ have been shown to act as agonists, prompting the activity of AP when present83. Conversely, there are several known inhibitors, the most well known of which is phosphate (Pi), causing competitive inhibition with high affinity for AP. Several amino acids cause uncompetitive or mixed inhibition on AP. L-phenylalanine and levamisole are well known uncompetitive inhibitors. Levamisole, the L-stereoisomer of tetramisole, is a potent uncompetitive and reversible inhibitor of tissue non-specific alkaline phosphatase (TNAP). The inhibition by levamisole is not due to steric hindrance, but rather depends on the particular presence of the amino acids in certain positions84-85.

Shijun Xu, 2014
22
2.5.2 Protease
Protease is almost universally present in various organisms from plants, animals and microorganisms. It is one of earliest discovered enzymes. Protease is a collective term, which consists of a group of enzymes cleaving peptide bonds, thereby hydrolyzing proteins. Specifically, those enzymes catalyze the conversion of protein or large polypeptides to smaller units, such as peptone, polypeptides, dipeptides and amino acids, which can be absorbed and utilized by the cells for nutrition. Thus, owing to their hydrolytic ability, proteases are involved in protein degradation, providing nutrition for synthesizing proteins, post translation reactions, modulating gene expression, as well as secreting and modifying enzymes. In addition, intracellular proteases play a crucial role in many biological processes such as in zymogen activation, autolysis, spore germination and other physiological phenomena86-88.
In industrial applications, many microbial proteases have been purified, characterized and commercialized for the food industry, detergents, and medical and biotechnology. Due to the use and biological importance of proteases, the study of their properties remains a common task, and the development of new methods and techniques is in demand, both in research and in the industrial context. For example, commercial utilization is depending on a number of practical factors, such as large scale availability, and feasible process temperatures. The activity of the enzyme in large scale production is mostly controlled and adjusted by temperature change. Accurate determination of cellular kinetics at different temperatures is therefore also of interest for industrial biotechnology.

Microtechnologies for Single-cell Studies 3. Cell Networks
23
Chapter 3: Cell Networks
In higher living organisms, cells do not exist in isolation, but they communicate in many different ways with their neighbors89-90. The communication between cells is realized through the secretion of signaling molecules, the formation of proteinaceous pores and gap junctions between adjacent cells. Even membranous nanotubes have been found to form in vitro over long distances between cells91-92. Through these communication pathways, the cells can communicate with each other in order to coordinate their activities, which is crucial for maintenance of function and reproduction93-96. Disruption in cell-to-cell communication may lead to severe pathological conditions in organisms, for example the development and growth of cancer. Thus, cell-to-cell communication studies are important to develop better fundamental understanding of biological organisms, and of various diseases afflicting them. Normally, there are four basic mechanisms for cell-to-cell communication: 1) the paracrine, endocrine and autocrine signaling97 2) synaptic signaling98 3) direct contact99, and 4) protrusions100. In this chapter, the direct contact, in particular nanotube and protrusion formation, which I have studied in my thesis work, will be briefly introduced.
3.1 Nanotube Communication between Cells
Tunneling nanotubes (TNTs) are nanoscale cytoplasmic tunnels between two cells, representing direct cell-to-cell connections for physical transport of materials, such as ions, small molecules, vesicles, and others, between adjacent cells. Tunneling nanotubes (TNTs) were fist discovered by Rustom et al. in 2004101, who reported the formation of thin continuous membranous structures of 25-200 nm in diameter and a length up to 10 mm between rat adrenal pheochromocytoma (PC 12) cells 95-96,102. Those TNTs are not surface-adhered like filopodia, but exist suspended between the connected cells.

Shijun Xu, 2014
24
Figure 3.1. Confocal fluorescence micrographs of naturally occurring (TNT-like) intercellular nanotubes, connecting human embryonic kidney (HEK 293) cells (A), and Chinese hamster ovary (CHO) cells (B) in a tissue culture environment. Visualization of the nanotubes was aided by staining the cell membranes with FM 1-43, a membrane-soluble fluorescent dye. The white arrows point to the TNT-like nanotubes. The scale bars represent 10 µm.
TNTs formed between cultured human embryonic kidney (HEK 293), as investigated in my experimental work, are displayed in Figure 3.1. The growing interest in TNTs mainly concerns the function that they presumably play in cell-to-cell communication. TNTs have been shown to enable in vitro selective long-distance transfer of various cellular components, even bigger organelles like mitochondria, membrane constituents and signaling molecules, but also pathogens between cells103-104. The latest studies report that bacterial communication could be mediated through intercellular nanotubes, and HIV transmission was also shown to occur through nanoconduits105-106.
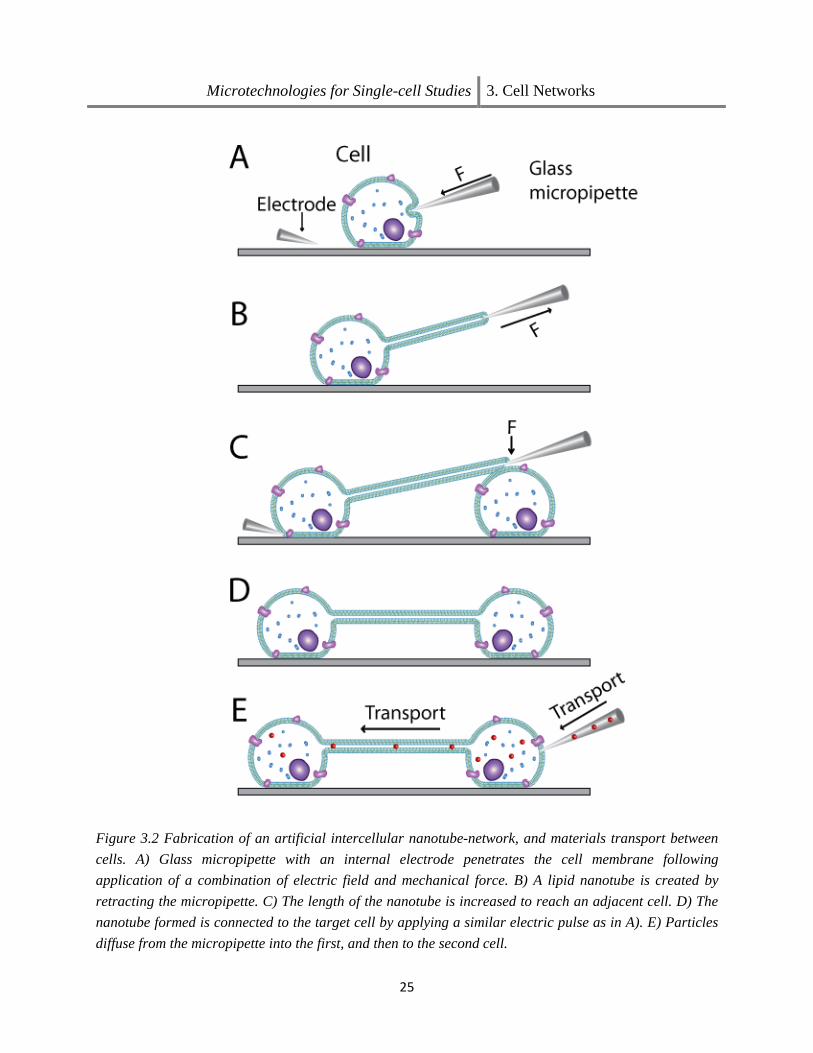
The understanding of TNT properties and functions in different cells species and tissue is the aim of many recent studies, and various techniques and strategies for analyzing, imaging and lately also artificial generation of such tubes have come into focus. In Paper II, a cellular network with interconnecting nanotubes could be established using microinjection techniques. Figure 3.2 shows schematically the experimental procedure used for the generation of artificial cell-to-cell connections. This man-made network between cultured cells also proved useful for the study cell-to-cell communication.
Microtechnologies for Single-cell Studies 3. Cell Networks
25
Figure 3.2 Fabrication of an artificial intercellular nanotube-network, and materials transport between cells. A) Glass micropipette with an internal electrode penetrates the cell membrane following application of a combination of electric field and mechanical force. B) A lipid nanotube is created by retracting the micropipette. C) The length of the nanotube is increased to reach an adjacent cell. D) The nanotube formed is connected to the target cell by applying a similar electric pulse as in A). E) Particles diffuse from the micropipette into the first, and then to the second cell.

Shijun Xu, 2014
26
We demonstrated how TNTs created between living HEK cells could be used to initiate and follow the delivery and transport of ions and molecules such as calcium and the AP substrate FDP without compromising cell viability. The generation of these networks can offer new possibilities to initiate exchange of cell constituents and components in a controlled and efficient manner, and to influence the dynamics of biochemical reactions in living cells to a greater degree than currently possible with naturally formed interconnections.
The rate of chemical transport between cells varies, depending on the nature and purpose of the molecular cargo. For example, excretion processes, such as paracrine signaling, occur between cells in close vicinity to each other. Its communication occurs by unrestricted diffusion, which leads to a rapid response to the signal by the target cell. In synaptic signaling, the response between nerve cells is even faster than in excretion, since the membranes of the two cells involved come extremely close, or may actually fuse. The diffusive transfer of signal molecules is limited to small confined zones, and the rate of transfer is consequently very fast.
For cell-to-cell communication through nanotubes, the transfer of substrate and signal molecules is much slower. The diffusion through the nanotube, as a passive mode of transport, is typically associated with a far longer transfer time, owed to the very small cross-section of the tubes of ~100 nm. The size of the transported molecule is also very important. For example, the diffusional transport of small ion through a nanotube is much more efficient than that of enzyme substrates and organelles.
3.2 Junction Communication between Cells
The gap junction is one of the most common modes of intercellular communication. They are formed when cellular protrusions, such as filopodia, make connections with adjacent cells or other protrusions, for example during cell migration107-108. They are used by cells to sense external chemical or mechanical signals109-110. Normally, filopodia consist of actin-rich plasma-membrane, and form slender protrusive structures of micrometer dimensions in length and diameter, which originate from the leading edge of motile cells111-112. The filopodia play an important role in cellular immigration and connection, intercellular information and components exchange, gene delivery and others112-114. Most studies in this context focus on identifying crucial sets of proteins, which are of importance for filopodia formation in different cell lines. The proteins effecting filopodia formation are different among various organisms and their cell

Microtechnologies for Single-cell Studies 3. Cell Networks
27
species. There are several problems unsolved in this area, such as key factors effecting filopodia formation, dynamics of filopodia formation115-120, and others.
In Paper VI, experiments revealed that the formation of cell-to-cell networks is related to the distance over which cells can overcome obstacles and establish a connection amongst them. To investigate the growth of cell protrusions on patterned structures, HEK 293 cells were placed and grown on surface-supported Teflon AF enclosed glass patterns with micro gaps ranging from 2 to 16 µm. The gaps of different widths were designed to determine the distance across, which cells can span for making contact to neighboring cells. For selected cases, where such a connection was observed, diffusion of calcium ions was also investigated and transport through this connection was visualized. The experimental process is illustrated in Figure 3.3.

Shijun Xu, 2014
28
Figure 3.3. Schematic drawings depicting the growth of tubular cell membranes on glass surface microchannels along a Teflon AF enclosed glass microlane, and assessment of transport through the connection. The dimensions are not to scale. A) A glass surface with Telfon AF microstructures. B) The cells are placed on the micropatterned glass surfaces. C) Protrusions from cells grow along the glass microchannels. D) After reaching a microgap, a connection forms between protrusions that cross the microgap. E) One of the interconnected cells is locally superfused for studies of molecular transport between them.

Microtechnologies for Single-cell Studies 4. Cell Viability
29
Chapter 4: Cell Viability
Cell-based assays are often used for screening to determine if the test molecules have detrimental effects on cell proliferation or show direct cytotoxic effects that eventually lead to cell death121-
122. Cell-based assays also are widely used in conjunction with measuring receptor binding, and a variety of signal transduction events, for example the expression of genetic reporters, trafficking of cellular components, or monitoring organelle function123-126. It is well known that there is a big difference between a viable cell and a dead cell with respect to homeostasis, organization, metabolism, growth, adaptation, response to stimuli and reproduction, and others, which can strongly influence the outcome of experimental studies127-130. As reported at 2009, Gregory et al. found that there is an inverse correlation between the proportion of apoptotic cells at the beginning of culture and subsequent antibody production in a hybridoma line131. Careful estimates of cell viability in cell experiments are one of the most crucial fundamental measurements in biological studies, including tissue culture, drug discovery, toxicology, and cell metabolism studies132-135. An assessment of viability is almost universally required for the generation of reliable data.
A non-viable cell is defined as a cell that has an inhibitory effect on the reproductivity of the remaining cell population. In modern experimental protocols, the term ‘viability’ is often mentioned, but requires clarification. For most basic cell assays, viability could simply mean that the cells are not dead. For advanced cell studies, a viable cell is defined by its ability to divide twice (two generations), or the ability to maintain cellular respiration136-137. However, the time required to follow the cellular development process for two generations amounts to several hours, and involves incubation and careful growth monitoring. It is in most cases unpractical and inconvenient. Therefore, rapid determination of cell viability is based upon the examination of particular cellular functions. A number of assays that correlate with either reproductive or functional capabilities of cells have been developed. The major criteria employed in viability assays include the assessment of survival and growth in tissue culture, functional assays, metabolite incorporation, structural alteration, and membrane integrity. Cell viability may be evaluated by morphological changes or by changes in plasma membrane permeability and/physiological state inferred from the exclusion of some dyes and/or the uptake of others. Typically, cell viability assays fall in one of three distinct categories: 1) assessment of cell membrane integrity 2) directly measurement of metabolic marker 3) testing metabolic activity135,138-140.

Shijun Xu, 2014
30
4.1 Cell Viability Test Agents
Three of the more common tests among the membrane integrity assessment methods for quantifying mammalian cell viability survival and death are fluorescein diacetate (FDA), trypan blue (TB) and propidium iodide (PI) uptake. These three agents all work under the basic assumption that viability is related to the integrity of the cell plasma membrane and sustained enzyme location and activity, which can be established by probing the uptake or exclusion of certain dyes135.
4.1.1 Fluorescein Diacetate
Fluorescein diacetate (FDA) is normally a nonfluorescent, nonpolar acetoxymethyl ester derivative of fluorescein, which is a cell-permeant esterase substrate. FDA serves as a viability probe via measuring the activity and location of nonspecific esterase enzymes. When the nonpolar FDA molecules permeate the cell membrane, intracellular esterases hydrolyze the FDA, yielding the fluorescent product fluorescein, which cannot leave the cell through the intact membrane. The viable cell with its active metabolism and cell membrane integrity104,141-143can generate and accumulate sufficient fluorescein to permit observation by fluorescence microscopy. Figure 4.1 shows an example of a single cell with internalized FDA, visualized under the microscope.
Figure 4.1 A) Differential interference contrast and B) fluorescence images of a viable cell, stained with fluorescein diacetate (FDA)

Microtechnologies for Single-cell Studies 4. Cell Viability
31
4.1.2 Trypan Blue
Trypan blue (TB), a toluidine derivative, is commonly used to examine the change in cell membrane permeabilization, which is associated with cell injury and death. TB, one of earliest cell viability test compounds, is a hydrophilic molecule that cannot be taken up by the healthy cell. When the cell plasma membrane is injured, TB will cross a compromised cell membrane and accumulate in the cytoplasm, giving the characteristic blue color. Dead cells readily take up the dye, but not all cells that do not take up dye can necessarily be judged healthy. Figure 4.2 shows an example of a single cell with internalized TB, visualized under the microscope. An additional direct confirmation of viability is therefore required, e.g. by a double staining experiment with FDA, as mentioned above. TB is also to some extent cytotoxic, which causes other cells in the culture to die upon exposure. Thus, TB is applied to test the cell viability at particular time points during an experiment135,144.
Figure 4.2 DIC images for A) alive and B) dead cell staining with Trypan blue (Adapted from ref.145 Copyright 2013, The Plant Journal)
4.1.3 Propidium Iodide
The internalization of propidium iodide (PI) follows same basic principle as trypan blue. Generally, PI molecules are membrane impermeant and thus excluded from viable cells, but readily enter the dead cell through the compromised plasma membrane, and accumulate in the cytoplasm. However, while TB accumulates in the cytoplasm such that an absorption change can
Shijun Xu, 2014
32
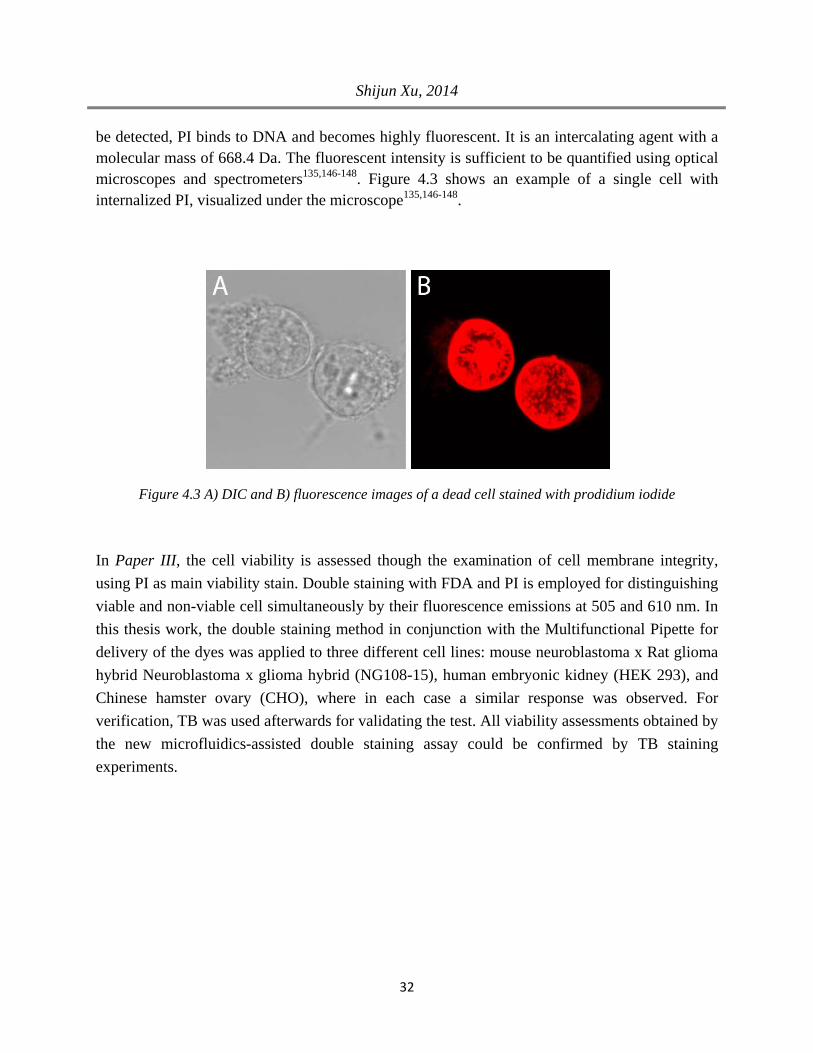
be detected, PI binds to DNA and becomes highly fluorescent. It is an intercalating agent with a molecular mass of 668.4 Da. The fluorescent intensity is sufficient to be quantified using optical microscopes and spectrometers135,146-148. Figure 4.3 shows an example of a single cell with internalized PI, visualized under the microscope135,146-148.
Figure 4.3 A) DIC and B) fluorescence images of a dead cell stained with prodidium iodide
In Paper III, the cell viability is assessed though the examination of cell membrane integrity, using PI as main viability stain. Double staining with FDA and PI is employed for distinguishing viable and non-viable cell simultaneously by their fluorescence emissions at 505 and 610 nm. In this thesis work, the double staining method in conjunction with the Multifunctional Pipette for delivery of the dyes was applied to three different cell lines: mouse neuroblastoma x Rat glioma hybrid Neuroblastoma x glioma hybrid (NG108-15), human embryonic kidney (HEK 293), and Chinese hamster ovary (CHO), where in each case a similar response was observed. For verification, TB was used afterwards for validating the test. All viability assessments obtained by the new microfluidics-assisted double staining assay could be confirmed by TB staining experiments.

Microtechnologies for Single-cell Studies 5. Techniques and Methods
33
Chapter 5: Techniques and Methods
5.1 Superfusion Techniques
The term microfluidics describes devices, platforms and methods that control and manipulate liquid flow with characteristic length scale in the range of 0.5-500 µm, resulting in femtoliter to microliter volumes of transported fluid149-152. As a research field, the use of microfluidics emerged in the 1990s when DARPA (the central research and development organization of the department of defense in the Unites States of America), introduced and applied microfluidic systems as a revolutionary tool and concept for addressing chemical and biological threats. The general advantages are: low consumption of reagents and samples, low production of waste, and a shorter time requirement for monitoring chemical reactions153-155. Having dimensions similar to that of a cell, microfluidics has opened a new area and offers significant possibilities for biological analysis at single-cell level. It has explosively developed within academic research fields, especially single-cell studies. In this thesis, the requirement for performing the single-cell experiments stems from the ability to control and rapidly alter the chemical environment around cells and cell constituents. To achieve this, two microfluidic systems: the Dynaflow chip and the Multifunctional Pipette were applied to solve different biological issues in single cells29,156.
5.1.1 Physics of Microfluidics
When we start to drive fluids into small length scales, microfluidics even to nanofluidics, the continuum approximation starts to break down and new approaches are developed for analyzing liquid in these small length scales. The dynamic behavior of an incompressible homogeneous fluid can be described by a differential equation, the Navier-Stokes equation as follow157:
𝜌𝜕𝑣𝜕𝑡
+ 𝜌𝑣 · 𝛻𝑣 = −𝛻𝑝 + 𝜂𝛻2𝑣 + 𝐹 (25)
where ρ is the density of fluid, 𝑣 is the flow velocity, 𝑝 is the pressure, 𝜂 is the viscosity of fluid and F is external body forces such as gravity. This equation is obtained by Newton’s second law

Shijun Xu, 2014
34
of motion to a differential volume of a continuous fluid. The left hand side shows the acceleration of fluid in both time and space expressed in mass per unit volume times and the right hand side contains the sum of force experienced by the liquid including pressure gradient, viscosity and gravity.
Figure 5.1. A) Laminar and B) turbulent flow
In microfluidic systems, the flow shows distinct behavioral properties from macroscopic systems. Effects such as diffusion and surface tension, which are generally not considered at larger length scales, are essential as length scales become smaller or the surface to volume ratio increases. The Reynolds number (Re) of a fluid flow is often mentioned to characterize its flow regime in two different types; laminar or turbulent flow as presented in Figure 5.1. Laminar flow occurs when layers of fluid move parallel to each other, without disturbance between the different layers. Conversely, the position of any particles in turbulent flow is impossible to predict as the flow becomes chaotic and stochastic in nature. The Reynold number for flow in channel is calculated by;
𝑅𝑒 =𝜌𝑣𝐷ℎ
𝜇 (26)
where 𝜌 is the fluidic density, 𝑣 is the characteristic velocity of the fluid, 𝜇 is the viscosity and 𝐷ℎ is the hydraulic diameter, which is determined on the channel’s cross-sectional geometry. The

Microtechnologies for Single-cell Studies 5. Techniques and Methods
35
balance between velocity and viscosity shows the balance the viscous and inertial forces for each fluid element. If the Reynolds number is small (< 2300), this means the viscous force are much larger than inertial force, forming a strong coupling between the fluid elements, which is laminar flow. In contrast, for high Reynolds numbers (> 2300), the viscous forces are much lower than inertial forces, where the fluid elements move randomly and independently from the surrounding elements, and hence become turbulent flow158-160.
The mixing of fluid on the microscale is comprised of two parts, advection of the fluid and diffusion. When liquid meets, the Peclet number is a useful parameter to represent the ratio between the system length and the diffusion length. Peclet number is defined as
𝑃𝑒 =𝐿𝑣𝐷
(27)
where 𝐿 is the width of the channel, 𝑣 is the velocity of fluid and D is mass diffusion coefficient. If the Peclet number is large, it indicates higher advection mixing, which leads o a diffusion length much short than the characteristic length155. For low Peclet number, however, higher diffusion causes the mixing of fluid, where a longer diffusion distance can be obtained as Figure 5.2 shown.
Figure 5.2. The diffusion distance between of laminar flow with A) high and B) low Peclet number

Shijun Xu, 2014
36
Reynolds number and Peclet number are basic parameters for microfluidic design. As the characteristic dimension of the fluid is designed at a small scale, low Reynolds and Peclet number become the intrinsic property of microfluidic fluid. Thus, laminar flow is the dominant flow, and mixing between the adjacent streams takes place by primarily by diffusion. This characteristics offer the possibility to realize single-cell exposure to different chemical environments, within a confined area, coupled with the capability of fast switching between those environments, and hydrodynamic confined flow inside another liquid. In Paper I, a microfluidic chip with 16 channels was used, each exiting into the open volume, creating a pattern of 16 different environments which do not mix. Close to channel outlets, the boundary between the different solutions is very sharp, enabling fast switching by translating between the different streams. In Paper III, IV, V and VI, the multifunctional pipette was used, forming a hydrodynamic confined flow region of one liquid inside another. This localized phenomenon is used to superfuse single cells without disturbing other cells in the sample dish.
5.1.2 PDMS Microfluidics
Microfluidic devices have been fabricated from a variety of materials, such as glass, hard plastics, metals, silicon, ceramics and elastomers. Silicon is a common substrate due to the wealth of existing fabrication techniques from microelectronic production, where the precise dimensions of channels are constructed using photolithography and etching processes. For simpler detection and better visualization, these processes were translated from silicon to glass, which is transparent and ease to integrate161-164.
For more sophisticated applications, glass and silicon gave the way to polymers-polydimethylsiloxane, namely PDMS. Polymers are inferior in chemical resistance, aging, thermal and optical properties to silicon and glass, but are vastly simpler to process. The first use of PDMS as a material for constructing microfluidic devices was presented by George M. Whitesides in the mid 1990’s152. Since the empirical formula of PDMS is a number of repetitions of the monomer combining with siloxane bonds, it allows the form of PDMS to be liquid or half solid. Due to the functionality of the cross-linking, it allows PDMS to have a high degree of viscoelasticity. This characteristic leads to the standard fabrication protocol of replica molding; the liquid PDMS is poured over a master mold structure, typically a silicon wafer with structures defining the channel geometry. After the polymer is cured on structure, the PDMS can be easily peeled from master and bonded to glass to close the micro-channels156,160. The whole procedure

Microtechnologies for Single-cell Studies 5. Techniques and Methods
37
from idea to device is presented in Figure 5.3. With the advantages of low cost, flexibility, and rapid prototyping in fabrication, PDMS has become widespread, and a standard material in this research field. In my thesis, two microfluidic technologies, the dynaflow chip and the multifunctional pipette, both fabricated in PDMS, are used to solve different biological problems using their characteristic functions. In Paper I, the dynaflow chip is made of PDMS, bonded to a thinner glass, where the dynaflow chip with 16 channels generates parallel flow streams to create distinct chemical environments to probe AP activity and inhibition for Km and Ki determination. In Paper III, IV, V and VI, the multifunctional pipette is completely fabricated from PDMS, where exit three channels at the tip, create a recirculation area to form a local chemical environment for introduction of different solution to single cell. This property was used to measure intracellular enzymes, assess single cell viability, and to probe cell-to-cell communication.
Figure 5.3. Microfluidic device fabrication from idea to device: rapid prototyping by replica molding.

Shijun Xu, 2014
38
5.1.3 Dynaflow Chip
In Paper I of this thesis work, a commercial microfluidic device was used, the Dynaflow chip by Cellectricon. This PDMS microfluidic device was plasma-bonded to a glass coverslip of thickness of approximately 150 µm, to allow for high magnification and high aperture optics to be used. The device contains 16 channels which are each connected to a sample reservoir, where the outlet of the channels exit into an open volume as a closely packed array with channel dimensions of 50 µm in width and 57 µm in height, illustrated in Figure 5.4.
As the channels exit into the open volume, they are separated by walls of 22 µm in thickness. Prior to the experiment, the sample reservoirs are loaded with different solutions or concentrations according to the experimental requirement. In order to create a closed system, the sample reservoirs are sealed by a polycarbonate lid which is connected to a single pneumatic pump through PE tubing. When the pump supplies positive pressure, a flow from the reservoirs is generated at the exit into the open volume. If the pressure applied allows the flow to be operated in the low Reynolds number regime, a patterned laminar stream system is established in the open volume near the channel exits165-166.
Figure 5.4. Schematic drawing of the Dynaflow chip. A) The 16 sample reservoirs are individually connected to the open volume. B) A magnified view of the channels exiting into the open volume, from where the different solutions are accessible to a suspended cell. By translating the device, the cell will be pass the parallel flows in front of the channels, and hence experience different solution environments.

Microtechnologies for Single-cell Studies 5. Techniques and Methods
39
In Paper I, an application of the Dynaflow platform is described, designed to control and vary the chemical environment around a cell for characterizing enzyme activity within single cells. As shown in Figure 5.4 B, a target cell is held by a pulled glass pipette and positioned in the patterned stream. By placing this microfluidic device on a computer-controlled stage, the targeted cell could be translated and exposed to a sequence of solutions with high positional precision. The device was used for the titration of enzymatic activity, delivering sequentially the permeabilization test agent and different concentrations of substrate in solution. The time required to exchange the solution around the cell is on order of tens of milliseconds. With this approach, it was possible to generate quantitative estimates for intracellular alkaline phosphatase activity with and without levamisole inhibition.
5.1.4 Multifunctional Pipette
In this project, a hydrodynamically confined microflow device was used, termed the Multifunctional Pipette (MFP), which was also fabricated by replica molding from PDMS. To improve the efficiency and convenience of single-cell experiments, there was a need to create a freely positionable device, capable of generating an isolated local chemical environment about an adherent cell. This need was met by the development of the MFP, shown in Figure 5.5. Briefly, the sharp-tipped MFP, mounted into its holder, can be readily positioned to a desired region within a cell dish, using a conventional micromanipulator. By adjusting the positive and negative pressures in the three adjacent channels, which exit into the open volume channels, a hydrodynamically confined flow volume can be established, generating an isolated chemical environment, i.e., a virtual flow cell, at the tip. A pneumatic control unit connected to the holder provides each well with an individual pressure, enabling computerized modulation of the solution flow and switching the content of the flow within 100 ms. The typical perfusion area is 90x80 µm, with flow rates of 4-8 nL/s. Up to 4 solutions can be stored on-chip. Owing to the small flow rates employed, a cell located within the superfusion zone experiences very little shear force ( ~8 pN), which does not affect the cell viability167.

Shijun Xu, 2014
40
Figure 5.5. The Multifunctional Pipette, which was used in some of the superfusion experiments. A) Schematic drawing of the device B) Magnification of the fluidic switching junction and the virtual flow cell at the pipette tip.
This microfluidic device was used for the study of alkaline phosphatase and protease (Paper IV), as well as for a new viability test assay (Paper III) specifically for individual cells without affecting the other cells in the same culture dish. In Paper V, parts of a cell-to-cell communication network were exposed to a substrate, and diffusive transport along the network could be examined. A major benefit in comparison to the Dynaflow chip is the easy handling along with the possibility to apply the MFP in conjunction with other probes, such as an optical fiber for localized heating (Paper IV) and electrodes for single-cell electroporation (Paper VI).

Microtechnologies for Single-cell Studies 5. Techniques and Methods
41
5.2 Fluorescence and Laser Scanning Confocal Microscopy
Fluorescence microscopy is a beneficial technique for visualizing small objects with high resolution, able to separate signals from only the targeted objects. Careful choice of fluorescent target needs to be considered when performing live cell imaging, to achieve both specificity of target and stability. Direct detection of enzymatic reactions is not possible. Instead, the behavior of an enzyme can be followed by monitoring the consumption of a fluorogenic substrate, to yield fluorescent product which could be detected using fluorescence microscopy. Thus, fluorescence microscopy techniques were utilized on multiple occasions throughout my thesis work168.
5.2.1 Fluorescence and Fluorophores
Figure 5.6. Jablonski diagram showing an electronic transition for a fluorescent molecule, where S0 is the electronic ground state, and S1 is the first excited state. The absorption and fluorescence transitions are represented by straight lines of blue and re color, respectively, whereas vibrational relaxation is represented by a wavy dotted line.
Fluorescence is a type of luminescence, whereby light of slightly lower energy is generated in response to the absorption of light by a fluorophore. The response of a fluorophore to absorption light is schematically illustrated in the simplified Jablonski diagram in Figure 5.6. When a fluorophore absorbs a photon, the molecule at its ground state can be excited to higher electronic states. The excited molecule can return to the ground state by both radiative and non-radiative pathways. Vibrational relaxation is one of the non-radioactive processes, in which the molecule

Shijun Xu, 2014
42
relaxes from the higher vibrational level of excited singlet state to its lowest without the emission of light, losing energy instead as heat. Conversely, fluorescence is the process that the molecule relaxes from an excited singlet state to the ground state with concomitant emission of light. Because of the energy loss from vibrational relaxation, fluorophores absorb light with a certain wavelength and emit it at a longer wavelength (lower energy). The difference between the excitation wavelength and emission wavelength is known as the Stokes shift for the fluorophore.
The choice of fluorophore is critical to efficiently address the architecture and dynamics of living cells. To excite fluorophores in and around cells, the cell will be exposed for prolonged periods with intense light. This light, depending on the wavelength, can potentially have detrimental effects on the health of the cell, as in addition to fluorescence, certain undesirable effects caused by absorption of the light can occur, namely phototoxic and photobleaching effects169. Phototoxicity is a process in which cells undergo a detrimental morphological change during the image acquisition process, due to the prolonged exposure to intense light. This is predominately caused by a local rise in temperature and the generation of highly reactive free radicals when the fluorophore molecules are excited170. In addition, photobleaching is the process in which fluorescent signals are diminished or lost during imaging. It is largely dependent on the molecular stability of the fluorescent dye selected. While it does not directly harm the cell, it can greatly reduce data quality. To minimize these effects, the laser intensity and frequency of image acquisition are minimized171.
5.2.2 Confocal Microscopy
Although the fluorescence microscopy technique is a powerful technique for visualizing a biological specimen, capable of resolving sub-micron components, the images can be quite often are blurred, especially when compartments from multiple regions are labeled equally.
Typical wide area or scanning fluorescence microscopy excites and collects light from the entire sample addressable by the objective, typically microns in probe depth. The simultaneous collection of light from all objects within the light path makes identification of a target location quite challenging, and can often camouflage the desired target, e.g., if the outer membrane of a cell fluoresces while trying to interrogate the interior of a cell.
To resolve this issue of out of focus fluorescence collection, an optical sectioning technique, confocal microscopy, was developed by Minsky in 1957. This technique was developed as a

Microtechnologies for Single-cell Studies 5. Techniques and Methods
43
point detection method, placing a pinhole in light path in front of detector. As presented in Figure 5.7, when the laser is reflected by a dichroic mirror and excites a volume within the specimen, the fluorescent signal emitted from the same, is collected by the objective and passes back through the dichroic mirror, towards the pinhole and subsequently the detector.
Figure 5.7. Schematic of the laser confocal microscope.
The fluorescent responses from within the same spatial volume are focused at the detector pinhole aperture, significantly blocking fluorescence emission from above and below the objective focal plane. This characteristic offers confocal microscopy the ability to control depth of field, while improving the resolution. Serializing the method, though implementation of either beam or sample scanning, enables micrographs to be generated, forming either 2D or 3D image

Shijun Xu, 2014
44
stacks. This optical sectioning technique delivers a means to accurately determine and measure the location of fluorescent objects within a labeled 3D structure, a greatly beneficial ability when studying cellular mechanics171-174.
5.2.2.1 Resolution Considerations
Figure 5.8. Numerical aperture of an objective. The numerical aperture is a function of the refractive index of the media between the objective and the sample (n) and the half angle of the maximum cone of light that can enter or exit the lens (θ). Oil immersion objectives are used to collect more light than air objectives, because less light is lost due to refraction at the air-glass interface.
Resolution can be defined as the ability of a microscope to allow one to distinguish between small objects. The objective, a fundamental part of microscope, is responsible for the delivery and collection of light. One key element of the objective is the extent to which this light can be focused or collected, which in turn governs the optical resolution. This ability is known as the numerical aperture (NA) which can be expressed as
𝑁𝐴 = 𝑛 𝑠𝑖𝑛𝜃 (28)
where 𝑛 is refractive index of the medium between the specimen and the lens and 𝜃 is the half-angle of the maximum cone of light that can enter the front lens of the objective, as shown in

Microtechnologies for Single-cell Studies 5. Techniques and Methods
45
figure 5.8. For confocal microcopy, the resolution can then be calculated with the following equation:
𝑅 =0.61 𝜆
𝑁𝐴 (29)
where 𝜆 is wavelength of the excitation light. As the resolution of a confocal microscope is limited both by the illumination wavelength and the objective numerical aperture, low wavelength and high numerical aperture are needed for greatest resolution. Figure 5.8 presents the difference in light collection and focusing ability between a low NA (Air) and a high NA (oil immersion) objective175-177.
5.2.2.2 Cell Imaging Using Confocal Microscopy
Fluorescent indicators are not only used for imaging structural aspects, but also for interrogating cell physiology. In this thesis work, physiological fluorescence monitoring is crucial; for titration of enzymatic activity and inhibition, assessment of cell viability and examination of species migration within nanotube networks. Although the combination of fluorescent imaging technology with the availability of a multitude of fluorescent probes has many advantages for imaging live cells at high resolution, it is sometimes advantageous to combine fluorescence imaging with DIC (differential interference contrast) imaging, to obtain additional membrane and location information. DIC imaging can provide information about physiological parameters of different cell types, such as membrane and subcellular compartment appearance and shape, especially when the cell structure is morphologically related to a biological process. An example of such a combination can be seen in Figure 5.9170.
Figure 5.9. A) DIC and B) fluorescent image of a NG108-15 cell after perfusion with FDP.

Shijun Xu, 2014
46
In much of the experimental work collected this thesis, cell morphology changes were visualized by creating series of laser scanning confocal microscopy (LSCM) micrographs. These series were either created as time series, generating stacks of the same micrograph focal plane at differing time points, or in space, generating 3D images by taking 2D cross sections through an object, each one at a different focal plane.
Figure 5.10 A-E) Fluorescence images of a single cell recorded at five different time points F) DIC image of a target cell. The fluorescence images are overlaid with ROIs for measuring both cellular response and background fluorescence intensity. A-C) The cell is exposed to 300 μM FDP and exhibits its maximum intracellular product concentration during the experiment. D-E) The cell is exposed to a fluorescein solution after analysis, indicating the viability of the membrane. The typical experimental curve is shown in G). The blue curve extracted from the blue ROI in (A) represents the changes within the cell; the red line from the red ROI in (A) indicates the fluorescence intensity from outside of the cell. The scale bar in the DIC image represents 5 μm (applied to all images).

Microtechnologies for Single-cell Studies 5. Techniques and Methods
47
As shown in Figure 5.10, a quantitative response curve can be extracted from the micrographs using a region of interest (ROI) technique, utilizing data from both inside and outside the cell. Through observation of the dynamic distribution of the fluorescent product within a living cell, the quantitative and qualitative analysis of enzymatic activity, inhibition, thermal effect and cell viability, can be extracted.
5.3 Infrared Laser Microheating System
Localized temperature control in biological microscopy experiments can be conveniently achieved with IR light. This is due to the increased absorption of long wavelength light by both water and biological material. The IR absorption above 750 nm increases over 6 orders of magnitude with a maximum at 2940 nm. A rather convenient approach to heating is therefore the use of long wavelength IR (IR-B) light, generated in a fiber coupled laser. Diode laser sources and optical fibers are nowadays commercially readily available, since the IR-B range is used for long range telecommunication. The dramatic development of optical fiber and laser technology in the past two decades, in particular the reduction of data communication loss over long distances, is a remarkable achievement of optics research and engineering178, which made components for the construction of IR optical fiber systems very affordable. For the purpose of heating single cells in a microscopy environment, we have constructed a portable microheating setup, which generates 1470 nm laser light and conducts it into the vicinity of the cell via an optical fiber with a planar terminal. Figure 5.11 shows briefly the principle of light conduction through an optical fiber by total internal reflection, and a schematic drawing of the optical fiber with a planar outlet, as used in the experiments.

Shijun Xu, 2014
48
Figure 5.11. Transport of IR light through an optical fiber. A) The total internal reflectance (TIR) principle. θc is the critical angle of propagating light (red light path) θ1 > θc is the incident angle of light that cannot pass through the interface between two media with reflective indices n2<n1, but is being reflected with angle θ2. B) Light path through and out of an optical fiber. The acceptance cone describes the conically shaped volume from which light can enter into or exit from the fiber.
The light path through such a fiber, with the typical conical geometry (“cone of acceptance”) of the illuminated field at the fiber outlet, is also shown in the Figure 5.11 A. θ1 (>θc, the critical angle for propagating light) is the incident angle of the light that cannot pass through the interface between two optical media, but is instead being reflected with angle θ2. Light that fulfils this condition can be reflected perpetually inside the fiber, and thus conducted from one end to another. The reflective index n1 must be greater than n2, which is achieved in optical fibers through a multilayered structure (core and cladding), where the layers differ appropriately in refractive index 179-180.
1470 nm infrared light leaving the optical fiber will, due to the strong absorption by water, form a narrow conical heating zone181-182, with the temperature inside the cone decreasing with distance from the fiber. The setup used in our experiment (Paper IV) is depicted in Figure 5.12 A, consisting of the fiber assembly, micromanipulator, and diode laser source. The flat-ended fiber with a core diameter of 50 µm was micromanipulated into the close vicinity of the cell of interest. This constitutes a portable setup, which is easy to operate and to integrate into a multitude of experimental environments, including the microscopy setup.

Microtechnologies for Single-cell Studies 5. Techniques and Methods
49
Figure 5.12. A) Arrangement of the components of the infrared laser microheating system. The inset shows a magnified view of the laser heating fiber outlet positioned at a short distance from the target cell. B) A DIC image shows the position between the optical fiber and a thermocouple at a defined distance from the fiber (150 µm). The thermocouple is used to calibrate the temperature vs. laser power. The scale bar is 60 µm.
The setup is capable of controlling the thermal environment around a single adherent cell in a culture dish. In combination with a conventional micromanipulation apparatus, a small isothermal region of a few nanoliters in volume can be generated, and freely positioned within the dish. Rapid heat dissipation outside the volume, which is due to the small size of the heating zone and the limited power introduced into it, leaves neighboring cells unaffected. The temperature was calibrated against the laser power for a defined positioning angle of the fiber, and distance to the cell, using a micro-thermocouple for temperature calibration, presented in Figure 5.12 B. This allowed for setting the temperature around the cell with ± 0.5°C accuracy.

Shijun Xu, 2014
50

Microtechnologies for Single-cell Studies 6. Cell Handling and Manipulation
51
Chapter 6: Cell Handling and Manipulation
6.1 Cell Preparation and Handling
In the work leading to this thesis, all studies and experiments were carried out at the single-cell level, where the cell was the central subject. It was therefore crucial to prepare and handle these cells in a vigilant manner for investigation. It is the goal of this chapter to provide some brief protocols for the preparation of cell cultures from mammalian species, including; basic cell staining, culture techniques, freezing, defrosting and propagation of cells for long-term studies183-185.
6.1.1 Defrosting and Freezing of Cells
For initiation of a cell culture, the cells need to be defrosted in a water bath at 37℃ for about two minutes. Within the first 5 min, 5 mL of the cell culture medium is added drop-wise to suspend the cells while avoiding any osmotic lysis. Following this, the cells are centrifuged at 900 rpm for 5 min, and suspended in fresh cell culture medium with 10% FBS, transferred to a culture flask and placed in an incubator. After 24 hours, the medium is exchanged to remove any remaining traces of DMSO.
For storage of cell lines for long-term studies, the cells are first cultured in 75 cm3 flat-bottomed culture flasks to approximately 80-90% confluency. To gently detach and harvest the cells, an accutase solution or cell scrapers are used. Commonly, 8 ml of fresh media is added to the cell suspension in the flask. This accutase/cells/media mix is transferred into a 15ml tube and centrifuged at 1000 rpm for 5 min. The supernatant is aspirated and the cell pellet is resuspended in 1.5 ml of 10% DMSO/ 90% serum mix. This mixture can then be aliquoted into cryovials, placed in a special freezing box filled with acetone, and transferred to a -80°C freezer. These aliquots should be moved to a liquid nitrogen tank within a week, taking care to stabilize their temperature in the gas phase above the liquid nitrogen before submersion. The basic process for cell freezing is shown in Figure 6.1.

Shijun Xu, 2014
52
Figure 6.1. The basic process for long-term cell storage
6.1.2 Cultivation and Maintenance of Four Cell Lines
For successful cell culture, there are four basic requirements: 1) Properly set-up equipment in a dedicated facility. 2) Sterile techniques are necessary to be practiced and mastered. 3) Reagents and supplies for cell culture are carefully stored and quality controlled. 4) The knowledge and practice of fundamental techniques for different cell types of interest is crucial to be practiced

Microtechnologies for Single-cell Studies 6. Cell Handling and Manipulation
53
and well documented. The protocol and basic principles of cell culture and maintenance are distinct for non-adherent and adherent cell lines. In our project, we used four different adherent cell lines. Thus, only the protocol and basic principles of adherent cell line is introduced herein.
For adherent cell cultures, a procedure that enables the further propagation of the cell line follows some basic requirements: the cells need to be subcultured (split) at an optimal density with a health status, in the log phase. If the cells in adherent cultures occupy all the available substrate and have no room for expansion, or the nutrients in the cell culture medium become depleted and the pH of medium becomes acidic (the indicator in the medium turns yellow instead of the standard red/pink), cell proliferation will be reduced or halted entirely.
Mouse neuroblastoma x Rat glioma hybrid Neuroblastoma x glioma hybrid (NG108-15), human embryonic kidney (HEK 293), Chinese hamster ovary (CHO) and rat adrenal pheochromocytoma (PC 12) are cultivated in their respective medium with 10% fetal bovine serum at 37°C in a humidified 5% CO2 atmosphere. Once cells are approximately 80% confluent, all of the adherent cells should be detached in a gentle manner, of which there are two common options. For NG108-15 and PC 12, the old culture mediium is aspirated off and 2 mL of fresh culture medium is added back into the flask. A cell scraper is used to gently lift the cells from the plate. For CHO and HEK 293, the cells need to be washed with fresh media which is then aspirated off. Accutase is added for detaching cells from surface, and afterwards 2mL of fresh culture medium is added to dilute the cell suspension to between 1×10⁷ cells/mL to 2×10⁷
cells/mL. After the cells are re-suspended in the fresh cell culture medium, up to a 1mL aliquot is transferred into a new 75 cm3 flask, and diluted with fresh cell culture medium. After 2-3 days, the cells should attach and grow to reach confluence at which point they are ready to be divided again. All cell culture work was carried out with sterile solutions and devices in a laminar flow hood. The basic procedure of cell culture is shown in Figure 6.
NG108-15 medium: DMEM 10% Calf serum
HEK 293 medium: DMEM High glucose 10% Calf serum
CHO medium: Ham’s F12 10% Calf serum
PC 12 medium: DMEM High glucose 5% Calf serum 10% Horse serum

Shijun Xu, 2014
54
Figure 6.2. The basic cell culture process
6.1.3 Cell Dish Preparation
Since the all single-cell experiments are visualized on a microscope, the cells need to be cultured on a transparent petri-dish, which can be suitably mounted on a microscope table. A petri-dish kit (WilcoWells), consisting of a circular polystyrene frame, a tape ring and a circular glass cover slide. The frame (50 mm diameter) is bonded to the glass bottom plate (40 mm diameter, thickness 0.17 mm) by means of the tape ring. The separate glass bottom allows it to be modified, e.g., patterned with various structures, such as Telfon AF microstructures (Paper V). For experimentation, the adherent cells needed to be plated at a density of approximately 10,000 cells/cm2 onto the dishes, using 2 mL cell culture medium. The plated samples are incubated at 37°C under standard cell culture conditions. Before each experiment, the culture medium was replaced by Extra Cellular Buffer (ECB) and the cells were washed three times by repeated buffer exchange.
ECB buffer: 140 mM NaCl 1mM CaCl2 10 mM D-glucose 10 mM HEPES Adjusted to pH 7.4 (NaOH)

Microtechnologies for Single-cell Studies 6. Cell Handling and Manipulation
55
6.1.4 Cell Staining
Cell staining techniques are used to aid in the visualization of cells and cell components under a microscope. The cells are labeled with fluorophores, which provides a wide variety of information for the analysis of cell activity and structures, such as to highlight metabolic processes or differentiate between live and dead cells within a sample. The protocols for the different labeling strategies can differ slightly, especially when considering fluorescent compounds. Herein the conventional and novel protocols for various dyes used in this work will be introduced186.
The standard protocol could be applied to most of the fluorescent labels used, such as Fluo-3 AM ester and the Cell Mask-Deep Red Plasma Membrane Stain. Firstly, as in all preparations, the cells are plated and grown to the desired confluency. The culture medium is removed and a dye staining solution is added into the dish, which is then placed in an incubator (30 min for Fluo-3 AM ester; 24 hours for Cell Mask-Deep Red Plasma Membrane Stain). It should also be noted that some similar dyes, such as Calcium Green, are best applied at room temperature. After the waiting period, the staining solution is removed and the desired buffer is added to the sample, followed by 2-3 washing cycles. Fluo-3 AM ester belongs to a family of calcium sensor dyes. The AM ester group allows it to be transported easily across the cell membrane. Once inside the cell the ester group is cleaved by an esterase, enabling it to react with Ca2+, which upon binding results in a strong fluorescent response. In Paper II, Fluo-3 AM ester was used to label the cells for determining the transport of nanotubes, which were artificially generated between cells. When the calcium solution is injected into one cell of the network, the Fluo-3 binds to Ca2+ to yield a fluorescent signal. If any cell in the network other than the injected one presents a fluorescent response, the Ca2+ or Fluo-3 calcium complex, must therefore be transported through the connecting tube. In Paper V, Cell Mask-Deep Red Plasma Membrane Stain is used to label the cell membrane, enabling easy visualization of the cell arrangements on the Teflon AF structures.
A novel staining protocol for staining individual cells in an on-demand manner was established to investigate single cell viability using the MFP. Different cell viability testing agents, such as fluorescein diacetate, propidium iodide and Trypan blue, were loaded into the multifunctional pipette to superfuse only the targeted cells. Due to this local, rapid assay technique, outlined in Paper III, the cell viability could be instantly assessed without the need to perform a separate global protocol.

Shijun Xu, 2014
56
6.2 Cell Permeabilization
All living cells, whether prokaryotic or eukaryotic, feature a plasma membrane to define, protect and organize its contents. Foremost, the plasma membrane separates the cellular contents from the outside environment. This membrane is a lipid bilayer, embedding many different components, most importantly proteins which act as receptors, receiving and responding to signals from the external and internal environment. Upon receiving a chemical or physical stimulus, those receptors trigger a chain of biochemical events, for example by opening ion channels to allow a certain molecular or ionic species to pass the membrane, or by activating enzymes. Thus, the cell membranes serve as a selective barrier, i.e., a gatekeeper. Effective cell poration techniques break down the barrier temporarily, while leaving the intracellular constituents and components intact, and allow a simultaneously supplied substrate of interest to enter the cell. In practice it is a balancing act to find the optimal conditions for non-damaging and short-term poration. In our project, in order to introduce substrates of interest into single cells, we used a variety of different chemical and physical techniques to achieve cell permeabilization, including treatment with mild nonionic detergents, pore-forming toxins, and electroporation187-188.
6.2.1 Chemical Poration
Chemical permeabilization of the target cells was accomplished in the work for this thesis by treatment with α-hemolysin, a membrane-interactive protein toxin, and digitonin, a mild nonionic detergent. Stable transmembrane pores can be formed by interaction of these agents with the plasma membrane, where certain components associate with the lipophilic agent, which induces the formation of nanoscale openings in the membrane.
Pore formation in the cell plasma membrane can be achieved by treatment with detergents, such as the glycosides digitonin or saponin. These compounds permeabilize the membrane by interacting with membrane cholesterol, which is abundant in the cell membrane, or other unconjugated β-hydroxysterols, as schematically shown in Figure 6.3. Thus, the extent of pore fomation depends on the amount of cholesterol in the cell membrane. It is also determined by the concentration of digitonin and the exposure time of the target cells. A study by Schulz et al. reports that digitonin-forming holes exhibit hexagonal spherical tubular structures with a diameter of 8~10 nm (electron micrographs). These micellular pores allow permeation of

Microtechnologies for Single-cell Studies 6. Cell Handling and Manipulation
57
molecules ranging up to a molecular weight of at least 200 kDa188-190. We utilized chemical poration with digitonin in Paper I and III. In these experiments on single cells, intracellular organelles and most of protein remained inside the porated cells, but allowed entry and release of small molecules, such as enzyme substrates and products.
Figure 6.3 A) Schematic drawing of a cell membrane section (A) before and (B) after treatment with
digitonin. C) A similar membrane section after treatment with α-Hemolysin

Shijun Xu, 2014
58
α-Hemolysin (α-toxin) from Staphylococcus aureus is a pore-forming protein exotoxin, which permeabilizes cells for low molecular weight substances. In the native environment, α-toxin can assemble into a characteristic heptameric ring structure, spanning the cellular membrane and forming stable transmembrane pores with a diameter of 2-5 nm (Figure 6.3C), which allows passage of chemical entities up to 1000 Da188,191. In Paper IV, α-toxin was used to permeabilize target cells instead of digitonin with the goal of creating both narrower and more permanent openings in the cell membrane.
6.2.2 Electroporation
Electroporation, often also termed electropermeabilization or ‘high voltage electric discharge’, is a technique that has been used for nearly half a century. The origin of this technique is related to the study of fusion of biological membranes a few decades ago. In the 1970, groups from Japan and Germany reported that cell fusion can be induced by an external electric field192. Following that, the first application of high voltage direct current pulses, which cause dielectric breakdown of the cell membrane, was used to kill bacteria and yeasts, leading to lysis of the cells and release of the intracellular contents, such as ions, catercholamines, and chromaffin granules. Later it was found that membrane pores can be formed reversibly by high voltage pulses, which was then used to introduce foreign genes into living cells, achieving subsequent expression of new genes within the treated cells. This discovery led to an almost explosive development, numerous studies on the mechanisms of interactions of membranes with high voltage pluses appeared. It is presently generally accepted that the extent of pores forming in response to the pulse is related to the strength of the electric field acting on the cell membrane when the pulse is applied, and the ionic conditions in the fluid environment193-194.
In order to quantify electroporation, we consider the target cell to be of spherical shape, and that the cell is exposed to a homogenous external electric field as shown in Figure 6.4 A. The membrane potential V at different points on the cell membrane can be described by 193:
𝑉 = 1.5𝐸𝑟𝑐𝑐𝑜𝑠𝛼[1 − 𝑒𝑥𝑝 (−𝜏/𝑡𝑝)] (1)

Microtechnologies for Single-cell Studies 6. Cell Handling and Manipulation
59
where E is the applied electric field strength, rc the cell radius, α the polar angle with respect to the external field, 𝝉 is the duration time of pulse, and 𝑡𝑝 is the charging time constant according to:
𝑡𝑝 = 𝑟𝑐𝐶𝑚(𝜌𝑖 + 0.5𝜌𝑒) (2)
where 𝐶𝑚 is the cell membrane capacitance, 𝜌𝑖 and 𝜌𝑒 are the resistivity of the cytosol, and the extracellular medium, respectively. Equation (30) shows that the membrane potential is larger in the parts of the cell which are at the poles, normal to the external field (α=0° or 180°), rather than in the parts perpendicular to the field (α=90° or 270°, cf. Figure 6.4)195. When the cell is exposed to the external electric field, it will cause currents of ions, which assemble on both sides of the membrane and increase the membrane potential. If the membrane potential exceeds a critical value, the cell membrane breaks down and transient pores open. As mentioned above, the degree of cell permeabilization can be controlled by the strength and duration of the pulse.
Conventional electroporation equipment is designed to achieve permeabilization of millions of cells simultaneously, using high-voltage pulse generators and specially shaped electrodes mounted on a container which contains a large number of cells in suspension. With the development of single-cell studies, single-cell electroporation was also introduced, using carbon fiber microelectrodes and low voltage generators, thus avoiding the expensive and hazardous high-voltage equipment. The electric field strength can reach locally very high values when microelectrodes are applied, which causes the formation of pores only in the region where the electrode is closest to the cell (Figure. 6.4 B), In Paper VI, we report on microfluidic chip-integrated microelectrodes, inserted by a post-production protocol into the channels of the Multifunctional Pipette, using a molten metal filling approach. This electrode/chip assembly is suitable for the electroporation and simultaneous superfusion of single cells, when internalization of material is required.

Shijun Xu, 2014
60
Figure 6.4. A) Conventional electroporation using large bath electrodes, and B) Single cell electroporation using a microelectrode for local poration
6.3 Fluorogenic Substrate for Enzymes
In enzymology, fluorogenic substrates are routinely used for enzyme assays, with the goal to visualize and quantify the enzyme activity. For example, in drug discovery they have become commonplace in the determination of the effects of potential drugs on enzymatic reactions. Fluorescein diphosphatase is a widely used, non-fluorescent and colorless substrate for alkaline

Microtechnologies for Single-cell Studies 6. Cell Handling and Manipulation
61
phosphatase (AP), which when hydrolyzed by this enzyme forms fluorescein, a highly fluorescent product (Figure. 6.5). The process in which AP reacts with FDP is not a simple one step reaction, fluorescein monoposphate FMP forms within 2 ms, and then the final product fluorescein is generated. However, due to the short time in which FMP is produced, the FDP-AP reaction can be simplified and described with first-order kinetics196-197. Through monitoring the intensity of the emission from fluorescein (excitation wavelength: 488 nm, emission: broad band around 515 nm), the activity of AP can be followed spectroscopically or by imaging. A drawback of FDP is auto-hydrolysis, which affects a small fraction of the FDP molecules, leading to elevated background fluorescence. In our experiments, the substrate FDP is introduced by the Multifunctional Pipette, which uses a continuous hydrodynamically confined flow to replenish substrate constantly, decreasing the effect of photobleaching efficiently.
Figure 6.5. Scheme of the alkaline phosphatase catalyzed conversion of FDP, involving dephosphorylation of fluorescein diphosphate and generation of fluorescein
BODIPY FL casein, the other fluorogenic substrate used in the thesis work, which we employed for protease activity measurement, is a conjugate of casein and a fluorescent dye, the pH insensitive green fluorescent BODIPY FL198-199. The dye is efficiently quenched in the protein, yielding substrate molecules that are virtually non-fluorescent. Protease-catalyzed hydrolysis releases the highly fluorescent BODIPY FL (Figure 6.6). The benefit of this method is that the protein-dye conjugate is rather non-reactive except towards the enzyme of interest, which provides low background fluorescence and a high signal to noise ratio. The cells require no pre-incubation with dye and are chemically stable until the experiment is conducted.

Shijun Xu, 2014
62
Figure 6.6. Scheme of reaction catalyzed by protease, leading to cleaving of BODIPY FL casein and release of BODIPY
Photobleaching, or the unwanted destruction of fluorescent molecules under the influence of the incident light (cf. section 5.2.1), which leads to a decrease in fluorescence intensity, is a common practical problem with fluorophores. This phenomenon occurs rapidly for FDP and fluorescein, and to a lesser extent to the BODIPY conjugate upon irradiation.

Microtechnologies for Single-cell Studies 7. Summary of the Papers
63
Chapter 7: Summary of the Papers
The papers in this thesis document the development of microtechnologies for biological studies at the size scale of a single cell, applied in experiments to investigate the behavior of intracellular enzymes, cell viability, cell manipulation, and cell-to-cell communication. The project started with a novel strategy to determine the enzymatic activity and inhibition within a single suspended cell and establish an analytic model of intracellular enzyme activity (Paper I). For determining intracellular enzyme kinetics, a permeated cell, produced by exposure to a pore-forming agent, allows the substrate to enter a cell and the product to diffuse out through the pores created in the plasma membrane. Similar behavior is observed if an enzyme substrate is delivered through cell interconnections. A cell-to-cell transport model was generated from single mammalian cells by micromanipulation/injection techniques, and the transport properties were investigated (Paper II). Single-cell analysis by means of the commercial “Dynaflow” device, as used in Paper I, has a number of problematic issues, as the channel outlets are stationary and the cell must be held and positioned by a glass pipette. This inspired the development of the new concept, which uses a novel free-standing microfluidic device, “the multifunctional pipette”. This device can be flexibly positioned and creates an isolated chemical environment around a selected adherent cell. The multifunctional pipette was shown to be a powerful technological advancement with high utility in cell viability assessment of different cell lines (Paper III). When the multifunctional pipette was used in combination with a temperature calibrated laser heating microprobe, the influence of temperature on enzymes within single living adherent cells could be evaluated (Paper IV). The device was also employed to investigate the transport of molecules in cell-to-cell tube interconnections (Paper V). Giving a preview on future extensions of the pipette technology, we integrated micro electrodes and demonstrated its practical advantages in single-cell electroporation (Paper VI).
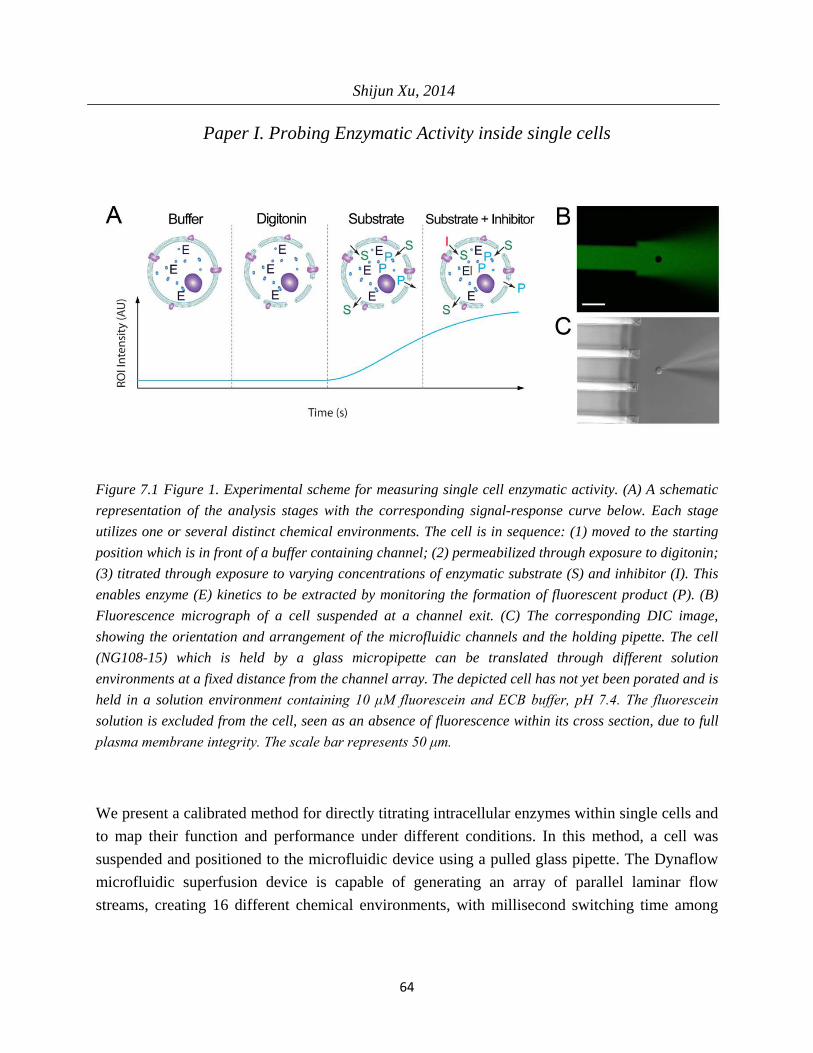
Shijun Xu, 2014
64
Paper I. Probing Enzymatic Activity inside single cells
Figure 7.1 Figure 1. Experimental scheme for measuring single cell enzymatic activity. (A) A schematic representation of the analysis stages with the corresponding signal-response curve below. Each stage utilizes one or several distinct chemical environments. The cell is in sequence: (1) moved to the starting position which is in front of a buffer containing channel; (2) permeabilized through exposure to digitonin; (3) titrated through exposure to varying concentrations of enzymatic substrate (S) and inhibitor (I). This enables enzyme (E) kinetics to be extracted by monitoring the formation of fluorescent product (P). (B) Fluorescence micrograph of a cell suspended at a channel exit. (C) The corresponding DIC image, showing the orientation and arrangement of the microfluidic channels and the holding pipette. The cell (NG108-15) which is held by a glass micropipette can be translated through different solution environments at a fixed distance from the channel array. The depicted cell has not yet been porated and is held in a solution environment containing 10 μM fluorescein and ECB buffer, pH 7.4. The fluorescein solution is excluded from the cell, seen as an absence of fluorescence within its cross section, due to full plasma membrane integrity. The scale bar represents 50 μm.
We present a calibrated method for directly titrating intracellular enzymes within single cells and to map their function and performance under different conditions. In this method, a cell was suspended and positioned to the microfluidic device using a pulled glass pipette. The Dynaflow microfluidic superfusion device is capable of generating an array of parallel laminar flow streams, creating 16 different chemical environments, with millisecond switching time among

Microtechnologies for Single-cell Studies 7. Summary of the Papers
65
different environments. Thus, the time of exposure to chemical stimuli is exactly controlled to achieve mild plasma membrane permeation of individual NG108-15 cells.
Subsequently, the cell was exposed to a sequence of varying concentration of enzyme substrate (fluorescein diphosphate) and inhibitors. To demonstrate this method, the endogenous enzyme alkaline phosphatase could be quantitatively estimated to construct dose-response and dose-inhibition curves. Those dose-response and dose-inhibition curves could be analyzed using the analytical enzyme modeling that is established in this paper. As a result, the Michaelis-Menten constant Km for alkaline phosphatase was determined as 15.3μM ± 1.02 (n=16), and an inhibition constant Ki of levamisole as 0.59 mM ± 0.07 (n=14). Enzymatic activity could be monitored just 40 s after permeabilization, and five-point dose or inhibition curves could be measured within 150 s.

Shijun Xu, 2014
66
Paper II. Artificial nanotube connections and transport of molecular cargo between mammalian cells
In this paper, we investigated the transport of chemical compounds through cell-interconnecting nanotubes, delivering enzyme substrate into the intracellular space of one cell, and following its propagation through the tube.
Fig. 7.2. DIC images depicting the generation of an intercellular nanotube (white arrow) between two individual HEK 293 cells. (A) A glass micropipette was used to penetrate the upper cell, from which a nanotube was drawn. (B)–(C) The micropipette was translated from the upper cell towards the target cell, elongating the attached nanotube. (D) By bringing the tip of the micropipette (red arrow) in contact with the cell and applying a second electric pulse, the tube was connected permanently to the cell membrane. (E) The glass micropipette tip was retracted and disconnected from the cell, leaving behind an intercellular tube. The scale bar in (E) is applicable to all images and represents 10 µm.
Microneedle injection in conjunction with micromanipulation was applied to form nanotube connections with a length up to several micrometers between mammalian cells, enabling chemical cell-to-cell communication. Intercellular transport of ion and molecules (Ca2+ and prefluorescent enzyme substrate) via the nanotube was demonstrated. Transport kinetics similar to the one observed in Paper I was determined. We extended a previously developed model based on nanotube-interconnected liposomes to biological cells, creating a biologically highly relevant model of considerable value for studying chemical reaction kinetics in confined and reconfigurable geometries.

Microtechnologies for Single-cell Studies 7. Summary of the Papers
67
Paper III. A Rapid Microfluidic Technique for Viability Determination of Adherent Single Cells
We developed a novel protocol for determining the viability of single cells in an adherent cell culture, utilizing a free-standing microfluidic perfusion device.
Figure 7.3. Micrographs after 60 µg/ml FDA supplemented 30 µg/ml PI into viable and nonviable NG108-15, CHO and HEK 293 cells for viability studies. Fluorescence and DIC images from three different cell lines (NG108-15, CHO PC 12 and HEK 293 cells). The size of a cell is approximately 10 µm.
We exposed selected individual cells of the three lines NG108-15, HEK 293 and CHO to the pore-forming agent digitonin for 5 seconds, followed by a 30 s recovery period. Afterwards, the cell viability was assessed through simultaneous perfusion with fluorescein diacetate (FDA) and propidium iodide (PI), using the multifunctional pipette. In a fluorescence assay, viable and dead cells were distinguished by their green and red emission, respectively, within 10 seconds. In a second set of experiments, the intracellular enzyme activity was first monitored within a single adherent cell after chemically porating and introducing a fluorogenic substrate. Subsequently, the cell viability was determined using the new protocol. We demonstrate that this microfluidic technology-assisted approach is a facile, rapid and reliable means to determine viability at the single-cell level.

Shijun Xu, 2014
68
Paper IV. A Heating-Superfusion Platform Technology for Single Cell Investigations
Figure 7.4. Illustration of an adherent cell positioned in an isolated chemical and thermal environment. (A) Schematic perspective view of the setup system, which consists of two crucial parts: the multifunctional pipette, which generates an isolated perfusion zone; an optical fiber with IR radiation, which creates a localized heating area. An illustration of an adherent cell exposing in an isolated (green) environment is illustrated in (A) whereby the cell is in the heating area (red) and heated through an optical fiber positioned at a certain distance from the cell. (B) Bright field micrograph of adherent cells (NG 108-15), with the multifunctional pipette tip nearby the target cell, and the corresponding fluorescence micrograph shown in (C). The cell has not been porated yet, thus fluorescein is excluded from the cell. The scale bar in (c) represents 15 μm. After application of multifunctional pipette for cell viability assessment at the single cell level, we developed a novel approach to the study of single-cell enzymes activity at elevated temperatures. In this method, we utilize the Multifunctional Pipette and an optical fiber to expose the cell of interest to 1470 nm IR radiation, simultaneously controlling both the thermal and chemical environment. The multifunctional pipette provides three different chemical environments for different purposes, the pore-forming agent α-hemolysin, enzyme substrate (Fluorescein diphosphate or casein BODIPY FL) and the permeabilization testing agent fluorescein. When the measurement of intracellular enzyme is initiated by exposure of chemicals from MFP, IR radiation is provided through the optical fiber, directed towards the targeted cell, enabling control of the thermal environment in a localized area around the cell. This combination of MFP and a microheating system was used to generate five-point thermal activity curves within 200s for both AP and protease in single intact NG 108-15 cells. This strategy offers the possibility for quantitative estimation for intracellular enzyme activity at elevated temperatures.

Microtechnologies for Single-cell Studies 7. Summary of the Papers
69
Paper V. Microgap Closing by Cellular Processes-Critical Length-Scales and Membrane Morphology
In addition to employing the Multifunctional Pipette for the measurement of intracellular activity (Paper IV) and cell viability (Paper III), this device could be used support the investigation of cell-to-cell communication. Chemical cell-to-cell communication was enabled by the directed growth of filopodia-like cell protrusions in cytophobic Teflon®AF framed channels, featuring microgaps with different distances. For small gap distances, the protrusions grown from the adherent cells along the channel could overcome the barrier and form a connection between adjacent cells. To examine molecular transport in such cell-to-cell tubular interconnections, the MFP (Paper III and IV) was used to superfuse the cell at one side of this interconnection, activating ion channels in cell membrane. When the ion channels were activated, Ca2+ ion could pass the cell membrane, followed by diffusion via the interconnections to the adjacent cell. The transport could be directly monitored by following the reacting of the ions with Calcium-Green by recording an increase in florescence signal upon calcium binding.
Figure 7.5. The superfusion of a selected cell for studies of molecular transport through cell-to-cell tubular interconnections.

Shijun Xu, 2014
70
Paper VI. Single-cell electroporation using a multifunctional pipette
Fig 7.6. Pipette configurations. (A) A combination of the multifunctional pipette with an external carbon fiber electrode for single cell electroporation and simultaneous localized solution delivery. The red dotted lines represent the electric field (simplified). (B) The multifunctional pipette with integrated electroporation electrode in the same experimental environment. The counter electrode for both configurations is located in the open bath, represented by a red ground symbol.
We extended the capabilities of the multifunctional pipette to enable electroporation by integrating electrodes into the device. Since it is difficult to use conventional metal patterning techniques on PDMS, owed to the poor adhesion between the materials, our approach was to fill one of the channels with the low-melting Field's metal. This method is favorable, as high conductivity electrodes can be post processed by means of a simple hot-plate and a vacuum pump. The modified pipettes were used to combine localized solution delivery and electroporation of single adherent cells. When pores formed in the cell membrane upon electroporation, Ca2+ ions could flow into the cell, which was pre-incubated with the calcium sensitive dye Calcium-Green. Calcium inflow was monitored via fluorescence imaging. Afterward, the cell viability was be assessed by switching to assay solutions stored in the pipette.

Microtechnologies for Single-cell Studies 8. Conclusion and Future Outlook
71
Chapter 8: Conclusion and Future Outlook
This thesis reports on development and application of new microtechnology-based devices and methods for single cell studies, including intracellular enzymatic activity, the influence of temperature on enzymatic activity in single cells, and instant assessment of single-cell viability. We also provided a new experimental approach for the study of direct cell-to-cell communication, the exchange of cell constituents and contents, and the dynamics of biochemical reactions in native cell environments, such as intracellular enzyme reactions.
Using the “Dynaflow” microflow superfusion device, intracellular enzymes in single cells could be directly titrated to map their function and performance under different external conditions. An estimation of intracellular enzyme activity was achieved using a newly established analytical model which was applied to the titration data. Subsequently, a novel microfluidic superfusion device, the multifunctional pipette, was applied to selected single cells. This technology generates a virtual flow cell at the size scale of a mammalian cell in an open volume, able to create an isolated chemical environment around it. We demonstrated instant assessment of single cell viability in different cell lines with high efficiency, and measured the influence of temperature, which was locally adjusted with an IR fiber laser microheating probe, on the enzyme activity in single cells. Furthermore, a single-cell electroporation protocol was established using microelectrodes integrated into the multifunctional pipette, and the uptake of calcium ions by the cell was quantified.
The studies of intracellular enzymes alkaline phosphatase and protease in single cells investigated herein, revealed kinetics, inhibition activity and other influential factors. Our finding provided new insights into intracellular enzymatic dynamics and their regulation in single cells, helping to map cell population heterogeneity.
Another exciting area covered in this thesis is the investigation of cell-to-cell communication. Using micromanipulation, injection and superfusion techniques, lipid nanotubes were artificially generated between two biological cells, and ions as well as an enzyme substrate were shown to migrate between them. Moreover, the formation of interconnecting protrusions between adherent cells was initiated and directed by appropriately micropatterned Teflon AF surfaces. Tunneling nanotube-like interconnections were formed in a controlled manner, and their transport capabilities were examined by means of the Multifunctional Pipette. The newly created model systems facilitate fundamental studies of cell-to-cell communication, the exchange of cell

Shijun Xu, 2014
72
constituents and components, and the dynamics of biochemical reactions in native cell environments.
A set of microtechnology-enabled methods and techniques was established in this work, providing exciting experimental opportunities for single adherent cell studies. The versatility and simplicity of the presented techniques strongly support the investigation of biological problems on the single cell level. The microfluidic devices utilized in the work and presented in this thesis are easy to integrate with various other instrumental techniques, and provide additional benefits such as low reagent consumption and functional flexibility. Their use offers new possibilities in studying receptor characterization, investigating the role of modulating agents in cell signaling, and can allow for online monitoring of signal pathway regulation at the single cell level. Future work can include studies on other types of intracellular enzymes such as oxidoreductases, lyases and transferases. In the context of enzyme activity at the single-cell level, enzyme kinetics, ligand-regulation of enzymatic activity as well as the influence of temperature on enzyme behavior can be studied using the methods described in this thesis. The technologies are certainly also applicable to investigate other biological problems. For example only temperatures above room temperature were investigated with the newly introduced microheating system. Lower temperatures are possible to be achieved by placing the cell dish on a cooling-stage. This will enable experiments targeting intracellular enzyme activity below room temperature, so that the behaviors of cold-activated ion channels such as TRPM8 become accessible. The strategies presented in this thesis could positively impact various biological assays, enabling rapid analysis of individual cells, which can lead to new insights in areas such as the origin of disease, and can benefit biomedical diagnosis and drug discovery studies.

Microtechnologies for Single-cell Studies Acknowledgements
73
Acknowledgements
I thank the following people who in various ways have supported and contributed to my work.
• Professor Owe Orwar for giving me this wonderful opportunity to work on this project, believing in me and provide a nice research environment. I truly feel that I have learned a lot during these years.
• Professor Aldo Jesorka. Thank you for answering all my questions about chemistry in general and for inventing the instrumental components for me. You always took the time to help me, no matter what the problem was.
• Asst. Professor, Gavin D. M. Jeffries, for outstanding laboratory supervision, professional discussion and encouragement. You have been a vast source for inspiration. Without your inspiration, supervision and support, this work would not have been possible to accomplish. You always took the time to help me for everything.
• Professor Kent Jardemark, my co-supervisor, Thank you for answering all my questions
about chemistry and biology in general. Thank you for your help during my work. I greatly appreciate your support and encouragement.
• Haijiang Zhang, Alar Ainla, Anna Kim, Jessica Olofsson, Ida Isaksson. Thank you for
your invaluable contributions to the projects. Thank you for your discussions about microfluidics and biology.
• All members of Biophysical Technology Laboratory research group. Special thanks to Maria Millingen, Akram, Natasha, and Anna for being fantastic office mates.
• Previous and present group members: Irep, Ilona, Celine, Erik, Carolina, Mehrnaz, Tanya,
Bella, Kiryl. Thanks go also to all members of the division of Physical Chemistry.
• All my friend and relatives for being around: in Sweden and China for your encouragement and support. Thank you for being there. I love all of you.
• To my auntie, thank you for your suggestions and encouragement to study aboard, and a lot of discussions about science. It led to such a nice opportunity to study in Sweden. A wonderful experience!

Shijun Xu, 2014
74
• My parents for their love and never-ending support during this long time of study and work aboard. You have always been there for me and I could never express enough what you mean to me. I love you. 谢谢爸爸妈妈一直以来的默默支持和信任。你们的宽容、
你们的无私、你们的恩情、你们的爱都让我无以为报。我爱你们!

Microtechnologies for Single-cell Studies References
75
References
1. Alberts, B. Molecular biology of the cell. 5th ed. New York ; Abingdon: Garland Science, 2008.
2. Nelson, J. Structure and function in cell signalling. Chichester: John Wiley & Sons, 2008.
3. Bruggeman, F. J., Westerhoff, H. V. Trends Microbiol. 2007, 15, 45-50.
4. Coleman, M. D. Human drug metabolism : an introduction. 2nd ed. Oxford: Wiley-Blackwell, 2010.
5. Torday, J. S., Rehan, V. K. Evolutionary biology, cell-cell communication, and complex disease. Hoboken, N.J.: Wiley-Blackwell, 2012.
6. Alberts, B.; Wilson, J. H., Hunt, T. Molecular biology of the cell. 5th ed., Reference ed. ed. New York, N.Y. ; Abingdon: Garland Science, 2008.
7. Milsom, J. P., Wynn, C. H. Biochem J. 1973, 132, 493-500.
8. Soto, C. Nat Rev Neurosci. 2003, 4, 49-60.
9. Cardinale, A.; Chiesa, R., Sierks, M. Int J Cell Biol. 2014, 2014, 217371.
10. Chambers, I.; Silva, J.; Colby, D.; Nichols, J.; Nijmeijer, B.; Robertson, M.; Vrana, J.; Jones, K.; Grotewold, L., Smith, A. Nature. 2007, 450, 1230-1234.
11. Chambers, S. M.; Fasano, C. A.; Papapetrou, E. P.; Tomishima, M.; Sadelain, M., Studer, L. Nat Biotechnol. 2009, 27, 275-280.
12. Pilbrough, W.; Munro, T. P., Gray, P. Plos One. 2009, 4, e8432.
13. Alberts, B. Molecular biology of the cell. 5th ed. ed. New York: Garland Science ; London : Taylor & Francis, 2008.
14. Thivierge, J. P., Cisek, P. J Neurosci. 2008, 28, 7968-7978.
15. Lawrence, T., Natoli, G. Nat Rev Immunol. 2011, 11, 750-761.
16. Bellomo, M. The stem cell divide : the facts, the fiction, and the fear driving the greatest scientific, political, and religious debate of our time. New York: AMACOM; London : McGraw-Hill, 2006.
17. Surani, A., Tischler, J. Nature. 2012, 487, 43-45.
18. Conrado, R. J.; Varner, J. D., DeLisa, M. P. Curr Opin Biotech. 2008, 19, 492-499.

Shijun Xu, 2014
76
19. Lizana, L.; Bauer, B., Orwar, O. P Natl Acad Sci USA. 2008, 105, 4099-4104.
20. Nguyen, D. X.; Bos, P. D., Massague, J. Nat Rev Cancer. 2009, 9, 274-284.
21. Dudley, A. C. Cold Spring Harb Perspect Med. 2012, 2, a006536.
22. Powell, A. A.; Talasaz, A. H.; Zhang, H.; Coram, M. A.; Reddy, A.; Deng, G.; Telli, M. L.; Advani, R. H.; Carlson, R. W.; Mollick, J. A.; Sheth, S.; Kurian, A. W.; Ford, J. M.; Stockdale, F. E.; Quake, S. R.; Pease, R. F.; Mindrinos, M. N.; Bhanot, G.; Dairkee, S. H.; Davis, R. W., Jeffrey, S. S. Plos One. 2012, 7, e33788.
23. Navin, N., Hicks, J. Genome Med. 2011, 3, 31.
24. Kovarik, M. L., Allbritton, N. L. Trends Biotechnol. 2011, 29, 222-230.
25. Faley, S. L.; Copland, M.; Wlodkowic, D.; Kolch, W.; Seale, K. T.; Wikswo, J. P., Cooper, J. M. Lab Chip. 2009, 9, 2659-2664.
26. Marinov, G. K.; Williams, B. A.; McCue, K.; Schroth, G. P.; Gertz, J.; Myers, R. M., Wold, B. J. Genome Res. 2014, 24, 496-510.
27. Lodish, H. F. Molecular cell biology. 6th ed. / Harvey Lodish et al. ed. Basingstoke: W. H. Freeman, 2008.
28. Evans, D. H. Osmotic and ionic regulation : cells and animals. Boca Raton, Fla.: CRC ; London : Taylor & Francis, 2009.
29. Anselmetti, D. Single cell analysis : technologies and applications. Weinheim: Wiley-VCH, 2009.
30. Gutstein, H. B.; Morris, J. S.; Annangudi, S. P., Sweedler, J. V. Mass Spectrom Rev. 2008, 27, 316-330.
31. Durack, G., Robinson, J. P. Emerging tools for single-cell analysis : advances in optical measurement technologies. New York ; Chichester: Wiley-Liss, 2000.
32. Burgess, J., Taniguchi, I. Challenges to single-cell engineering and imaging technology. Pennington, N.J.: Electrochemical Society, 2008.
33. Solomon, E. P.; Berg, L. R., Martin, D. W. Biology. 9th ed. Australia ; United Kingdom: Brooks/Cole, 2011.
34. Bisswanger, H. Enzyme kinetics : principles and methods. 2nd, Rev. and Upd. ed. ed. Weinheim: Wiley-VCH ; Chichester : John Wiley, 2008.
35. Lesk, A. M. Introduction to protein science : architecture, function, and genomics. 2nd ed. Oxford: Oxford University Press, 2010.
36. Brown, T. Introduction to genetics : a molecular approach. New York: Garland Science, 2012.

Microtechnologies for Single-cell Studies References
77
37. Millán, J. L. Mammalian alkaline phosphatases : from biology to applications in medicine and biotechnology. Weinheim ; Chichester: Wiley-VCH, 2006.
38. Hruska, K. S.; LaMarca, M. E.; Scott, C. R., Sidransky, E. Hum Mutat. 2008, 29, 567-583.
39. Fukuda, T.; Roberts, A.; Plotz, P. H., Raben, N. Curr Neurol Neurosci Rep. 2007, 7, 71-77.
40. Zhao, Z.; Zhu, W.; Li, Z.; Jiang, J.; Shen, G., Yu, R. Anal Sci. 2012, 28, 881-886.
41. Hoylaerts, M. F.; Manes, T., Millan, J. L. J Biol Chem. 1997, 272, 22781-22787.
42. Torchilin, V. P.; Maksimenko, A. V., Mazaev, A. V. Ann N Y Acad Sci. 1987, 501, 481-486.
43. Minton, A. P. Journal of Cell Science. 2006, 119, 2863-2869.
44. Schnell, S., Turner, T. E. Prog Biophys Mol Biol. 2004, 85, 235-260.
45. Zhou, H. X.; Rivas, G. N., Minton, A. P. Annu Rev Biophys. 2008, 37, 375-397.
46. Boonacker, E.; Stap, J.; Koehler, A., Van Noorden, C. J. F. Acta Histochem. 2004, 106, 89-96.
47. Hiromi, K. Kinetics of fast enzyme reactions : theory and practice. Tokyo
New York: Kodansha Ltd. ;Wiley, 1979.
48. Cornish-Bowden, A. Fundamentals of enzyme kinetics. 4th comp. rev. and greatly enl. ed. Weinheim: Wiley-Blackwell-VCH, 2012.
49. Cook, P. F., Cleland, W. W. Enzyme kinetics and mechanism. London ; Abingdon: Garland Science, 2007.
50. Cornish-Bowden, A. Fundamentals of enzyme kinetics. 3rd ed. London: Portland, 2004.
51. Leskovac, V. Comprehensive enzyme kinetics. New York ; London: Kluwer Academic/Plenum, 2003.
52. Cayley, D. S.; Guttman, H. J., Record, M. T., Jr. Biophys J. 2000, 78, 1748-1764.
53. Minton, A. P. J Biol Chem. 2001, 276, 10577-10580.
54. van den Berg, B.; Ellis, R. J., Dobson, C. M. EMBO J. 1999, 18, 6927-6933.
55. Munishkina, L. A.; Ahmad, A.; Fink, A. L., Uversky, V. N. Biochemistry. 2008, 47, 8993-9006.
56. Mourao, M.; Kreitman, D., Schnell, S. Phys Chem Chem Phys. 2014, 16, 4492-4503.
57. Cino, E. A.; Karttunen, M., Choy, W. Y. Plos One. 2012, 7, e49876.

Shijun Xu, 2014
78
58. Hall, D., Hoshino, M. Biophys Rev. 2010, 2, 39-53.
59. Aden, J., Wittung-Stafshede, P. Biochemistry. 2014, 53, 2271-2277.
60. Rangwala, H., Karypis, G. Introduction to protein structure prediction : methods and algorithms. Hoboken, N.J.: Wiley, 2010.
61. Sensen, C. W. Essentials of genomics and bioinformatics. Weinheim: Wiley-VCH, 2002.
62. Gomes, C. u. M., Wittung-Stafshede, P. Protein folding and metal ions : mechanisms, biology and disease. Boca Raton, Fla. ; London: CRC, 2011.
63. Dill, K. A., Shortle, D. Annu Rev Biochem. 1991, 60, 795-825.
64. Devkota, K. P.; Choudhary, M. I.; Ranjit, R.; Samreen, Sewald, N. Nat Prod Res. 2007, 21, 292-297.
65. Fersht, A. Structure and mechanism in protein science : a guide to enzyme catalysis and protein folding. New York ; Basingstoke: W.H. Freeman, 1999.
66. Jackson, K. A. Kinetic processes : crystal growth, diffusion, and phase transitions in materials. 2nd, completely rev. and enl. ed. ed. Weinheim: Wiley-VCH ; Chichester : John Wiley, 2010.
67. Huang, X.; Holden, H. M., Raushel, F. M. Annu Rev Biochem. 2001, 70, 149-180.
68. Winkel, B. S. Annu Rev Plant Biol. 2004, 55, 85-107.
69. Stange, P.; Zanette, D.; Mikhailov, A., Hess, B. Biophys Chem. 1999, 79, 233-247.
70. Chen, Q.; Groote, R.; Schonherr, H., Vancso, G. J. Chem Soc Rev. 2009, 38, 2671-2683.
71. English, B. P.; Min, W.; van Oijen, A. M.; Lee, K. T.; Luo, G.; Sun, H.; Cherayil, B. J.; Kou, S. C., Xie, X. S. Nat Chem Biol. 2006, 2, 87-94.
72. Kou, S. C.; Cherayil, B. J.; Min, W.; English, B. P., Xie, X. S. J Phys Chem B. 2005, 109, 19068-19081.
73. Karlsson, M.; Davidson, M.; Karlsson, R.; Karlsson, A.; Bergenholtz, J.; Konkoli, Z.; Jesorka, A.; Lobovkina, T.; Hurtig, J.; Voinova, M., Orwar, O. Annu Rev Phys Chem. 2004, 55, 613-649.
74. Muller-Hartmann, H.; Faust, N.; Kazinski, M., Kretzschmar, T. Expert Opin Drug Discov. 2007, 2, 1453-1465.
75. Geelen, M. J. Anal Biochem. 2005, 347, 1-9.
76. Nolkrantz, K.; Farre, C.; Hurtig, K. J.; Rylander, P., Orwar, O. Anal Chem. 2002, 74, 4300-4305.

Microtechnologies for Single-cell Studies References
79
77. Ryttsen, F.; Farre, C.; Brennan, C.; Weber, S. G.; Nolkrantz, K.; Jardemark, K.; Chiu, D. T., Orwar, O. Biophys J. 2000, 79, 1993-2001.
78. Chanturiya, A.; Yang, J.; Scaria, P.; Stanek, J.; Frei, J.; Mett, H., Woodle, M. Biophys J. 2003, 84, 1750-1755.
79. Adams, M. W. W., Kelly, R. M. Hyperthermophilic enzymes. Part C. San Diego, Calif. ; London: Academic Press, 2001.
80. Scopes, R. K. Protein purification : principles and practice. 2nd ed. ed. New York, N.Y.: Springer, 1987.
81. Westheimer, F. H. Science. 1987, 235, 1173-1178.
82. Kim, E. E., Wyckoff, H. W. J Mol Biol. 1991, 218, 449-464.
83. Millan, J. L. Purinergic Signal. 2006, 2, 335-341.
84. Van Belle, H. Clin Chem. 1976, 22, 972-976.
85. Ohkubo, S.; Kimura, J., Matsuoka, I. Br J Pharmacol. 2000, 131, 1667-1672.
86. Freije, J. M.; Balbin, M.; Pendas, A. M.; Sanchez, L. M.; Puente, X. S., Lopez-Otin, C. Adv Exp Med Biol. 2003, 532, 91-107.
87. Murphy, G., Nagase, H. Nat Clin Pract Rheumatol. 2008, 4, 128-135.
88. Nalivaeva, N. N.; Fisk, L. R.; Belyaev, N. D., Turner, A. J. Curr Alzheimer Res. 2008, 5, 212-224.
89. Lou, E.; Fujisawa, S.; Morozov, A.; Barlas, A.; Romin, Y.; Dogan, Y.; Gholami, S.; Moreira, A. L.; Manova-Todorova, K., Moore, M. A. Plos One. 2012, 7, e33093.
90. Onfelt, B.; Nedvetzki, S.; Benninger, R. K. P.; Purbhoo, M. A.; Sowinski, S.; Hume, A. N.; Seabra, M. C.; Neil, M. A. A.; French, P. M. W., Davis, D. M. J Immunol. 2006, 177, 8476-8483.
91. Kumar, N. M., Gilula, N. B. Cell. 1996, 84, 381-388.
92. Fevrier, B., Raposo, G. Curr Opin Cell Biol. 2004, 16, 415-421.
93. Hurtig, J.; Chiu, D. T., Onfelt, B. Wires Nanomed Nanobi. 2010, 2, 260-276.
94. Rustom, A.; Saffrich, R.; Markovic, I.; Walther, P., Gerdes, H. H. Science. 2004, 303, 1007-1010.
95. Gerdes, H. H.; Bukoreshtliev, N. V., Barroso, J. F. V. Febs Letters. 2007, 581, 2194-2201.
96. Gerdes, H. H., Carvalho, R. N. Curr Opin Cell Biol. 2008, 20, 470-475.

Shijun Xu, 2014
80
97. Krauss, G. Biochemistry of signal transduction and regulation. 4th ed. ed. Weinheim ; Chichester: Wiley-VCH, 2007.
98. Atakan, B. Molecular communications and nanonetworks : from nature to practical systems. New York ; London: Springer, 2014
99. Russell, P. J.; Herz, P. E., McMillan, B. Biology : the dynamic science. 2nd ed. / Russell, Hertz, Mcmillan. ed. [Pacific Grove, Calif.]: Brooks/Cole, Cengage Learning, 2011.
100. Goryanin, I., Goryachev, A. B. Advances in systems biology. New York ; London: Springer, 2012.
101. Rustom, A.; Saffrich, R.; Markovic, I.; Walther, P., Gerdes, H. H. Science. 2004, 303, 1007-1010.
102. Pontes, B.; Viana, N. B.; Campanati, L.; Farina, M.; Neto, V. M., Nussenzveig, H. M. Eur Biophys J. 2008, 37, 121-129.
103. Presley, J. F.; Cole, N. B.; Schroer, T. A.; Hirschberg, K.; Zaal, K. J. M., LippincottSchwartz, J. Nature. 1997, 389, 81-85.
104. Upadhyaya, A., Sheetz, M. P. Biophys J. 2004, 86, 2923-2928.
105. Sowinski, S.; Jolly, C.; Berninghausen, O.; Purbhoo, M. A.; Chauveau, A.; Kohler, K.; Oddos, S.; Eissmann, P.; Brodsky, F. M.; Hopkins, C.; Onfelt, B.; Sattentau, Q., Davis, D. M. Nat Cell Biol. 2008, 10, 211-219.
106. Eugenin, E. A.; Gaskill, P. J., Berman, J. W. Cell Immunol. 2009, 254, 142-148.
107. Karp, G. C., Solursh, M. Dev Biol. 1985, 112, 276-283.
108. Miller, J.; Fraser, S. E., McClay, D. Development. 1995, 121, 2501-2511.
109. Ramirez-Weber, F. A., Kornberg, T. B. Cell. 1999, 97, 599-607.
110. Malinda, K. M.; Fisher, G. W., Ettensohn, C. A. Developmental Biology. 1995, 172, 552-566.
111. Heasman, S. J., Ridley, A. J. Nat Rev Mol Cell Bio. 2008, 9, 690-701.
112. Cress, A. E., Nagle, R. B. Cell adhesion and cytoskeletal molecules in metastasis. Dordrecht ; Great Britain: Springer, 2006.
113. Malenka, R. C. Intercellular communication in the nervous system. London: Academic, 2009.
114. De Mello, W. C. Cell-to-cell communication. New York: Plenum Press, 1987.
115. Mattila, P. K., Lappalainen, P. Nat Rev Mol Cell Biol. 2008, 9, 446-454.

Microtechnologies for Single-cell Studies References
81
116. Lebrand, C.; Dent, E. W.; Strasser, G. A.; Lanier, L. M.; Krause, M.; Svitkina, T. M.; Borisy, G. G., Gertler, F. B. Neuron. 2004, 42, 37-49.
117. Laakkonen, P.; Auvinen, P.; Kujala, P., Kaariainen, L. J Virol. 1998, 72, 10265-10269.
118. Yang, S.; Huang, F. K.; Huang, J.; Chen, S.; Jakoncic, J.; Leo-Macias, A.; Diaz-Avalos, R.; Chen, L.; Zhang, J. J., Huang, X. Y. J Biol Chem. 2013, 288, 274-284.
119. Ma, L. P.; Greenwood, J. A., Schachner, M. Journal of Neuroscience. 2011, 31, 16781-16791.
120. Xue, F.; Janzen, D. M., Knecht, D. A. Int J Cell Biol. 2010, 2010, 507821.
121. Hoelder, S.; Clarke, P. A., Workman, P. Mol Oncol. 2012, 6, 155-176.
122. Fulda, S.; Gorman, A. M.; Hori, O., Samali, A. Int J Cell Biol. 2010, 2010, 214074.
123. Giepmans, B. N.; Adams, S. R.; Ellisman, M. H., Tsien, R. Y. Science. 2006, 312, 217-224.
124. Zorov, D. B.; Kobrinsky, E.; Juhaszova, M., Sollott, S. J. Circulation Research. 2004, 95, 239-252.
125. Pucadyil, T. J.; Kalipatnapu, S., Chattopadhyay, A. J Fluoresc. 2005, 15, 785-796.
126. Gonzalez, J. E.; Oades, K.; Leychkis, Y.; Harootunian, A., Negulescu, P. A. Drug Discov Today. 1999, 4, 431-439.
127. McConnell, T. H. a. The nature of disease : pathology for the health professions. 2nd edition. New York: Wiley,2007
128. Kumar, V., Robbins, S. L. Robbins basic pathology. 8th ed. ed. Philadelphia, Pa. ; Edinburgh: Elsevier Saunders, 2007.
129. Riss, T. L.; Moravec, R. A., Niles, A. L. Methods Mol Biol. 2011, 740, 103-114.
130. Hughes, D., Mehmet, H. Cell proliferation & apoptosis. Oxford: BIOS Scientific Publishers, 2003.
131. Gregory, C. D.; Pound, J. D.; Devitt, A.; Wilson-Jones, M.; Ray, P., Murray, R. J. MAbs. 2009, 1, 370-376.
132. Bourdeau, P., International Council of Scientific Unions. Scientific Committee on Problems of the Environment. Short-term toxicity tests for non-genotoxic effects. Chichester ; New York: Wiley, 1990.
133. Lan, S. F.; Safiejko-Mroczka, B., Starly, B. Toxicol In Vitro. 2010, 24, 1314-1323.
134. Balls, M.; Combes, R. D., Bhogal, N. New technologies for toxicity testing. New York: Springer Science+Business Media, 2012.

Shijun Xu, 2014
82
135. Stoddart, M. J. Mammalian cell viability : methods and protocols. New York: Springer, 2011.
136. Brand, M. D., Nicholls, D. G. Biochemical Journal. 2011, 437, 575-575.
137. Winding, A.; Binnerup, S. J., Sorensen, J. Appl Environ Microbiol. 1994, 60, 2869-2875.
138. Minor, L. Handbook of assay development in drug discovery. Boca Raton: CRC/Taylor & Francis, 2006.
139. Pirker, H.; Pausz, C.; Stoderegger, K. E., Herndl, G. J. Aquat Microb Ecol. 2005, 39, 225-233.
140. Weissig, V., D'Souza, G. G. M. Organelle-specific pharmaceutical nanotechnology. Oxford: Wiley, 2010.
141. Sengbusch, G. V.; Couwenbergs, C.; Kuhner, J., Muller, U. Histochem J. 1976, 8, 341-350.
142. Chrzanowski, T. H.; Crotty, R. D.; Hubbard, J. G., Welch, R. P. Microb Ecol. 1984, 10, 179-185.
143. Thomas, J. A.; Buchsbaum, R. N.; Zimniak, A., Racker, E. Biochemistry. 1979, 18, 2210-2218.
144. Hannun, Y. A., Boustany, R.-M. Apoptosis in neurobiology. Boca Raton, Fla. ; London: CRC Press, 1999.
145. Kopischke, M.; Westphal, L.; Schneeberger, K.; Clark, R.; Ossowski, S.; Wewer, V.; Fuchs, R.; Landtag, J.; Hause, G.; Dormann, P.; Lipka, V.; Weigel, D.; Schulze-Lefert, P.; Scheel, D., Rosahl, S. Plant J. 2013, 73, 456-468.
146. Wallen, C. A.; Higashikubo, R., Dethlefsen, L. A. Cytometry. 1982, 3, 155-160.
147. Pollack, A., Ciancio, G. Methods Cell Biol. 1990, 33, 19-24.
148. Ormerod, M. G.; Collins, M. K.; Rodriguez-Tarduchy, G., Robertson, D. J Immunol Methods. 1992, 153, 57-65.
149. Csontos, J.; K Lm N, M., Tasi, G. J Mol Struc-Theochem. 2003, 666, 515-520.
150. Krishnan, M.; Burke, D. T., Burns, M. A. Anal Chem. 2004, 76, 6588-6593.
151. Khan, S. A., Jensen, K. F. Adv Mater. 2007, 19, 2556-+.
152. Whitesides, G. M. Nature. 2006, 442, 368-373.
153. Kumar, C. S. S. R. Microfluidic devices in nanotechnology. Applications. Oxford: Wiley-Blackwell, 2010.

Microtechnologies for Single-cell Studies References
83
154. Blanco, F. J.; Berganzo, J.; Garcia, J.; Mayora, K.; Calle, A., Lechuga, L. M. P Soc Photo-Opt Ins. 2005, 5839, 127-137.
155. Hardt, S., Scho\nfeld, F. Microfluidic technologies for miniaturized analysis systems. New York: Springer, 2007.
156. Herold, K. E., Rasooly, A. Lab on a chip technology. Wymondham: Caister Academic, 2009.
157. Landau, L. D., Lifshit\Fe20s\Fe, E. M. Fluid mechanics. 2nd ed. ed. Oxford: Pergamon, 1987.
158. Zhang, J. B.; He, G. W., Liu, F. Phys Rev E Stat Nonlin Soft Matter Phys. 2006, 73, 056305.
159. Kutter, J. P., Fintschenko, Y. Separation methods in microanalytical systems. Boca Raton: Taylor & Francis, 2006.
160. Lee, S.-J. J., Sundararajan, N. Microfabrication for microfluidics. Boston: Artech House, 2010.
161. Maini, A. K. a. Lasers and optoelectronics : fundamentals, devices and applications. Hoboken, N.J.: Wiley, 2013.
162. Psaltis, D.; Quake, S. R., Yang, C. Nature. 2006, 442, 381-386.
163. Kakac, S. Microfluidics based microsystems : fundamentals and applications. Dordrecht ; London: Springer, 2010.
164. Ho, C.-M. P. D. Micro/nano technology systems for biomedical applications : microfluidics, optics, and surface chemistry. Oxford: Oxford University Press, 2010.
165. Olofsson, J.; Pihl, J.; Sinclair, J.; Sahlin, E.; Karisson, M., Orwar, O. Anal Chem. 2004, 76, 4968-4976.
166. Olofsson, J.; Bridle, H.; Sinclair, J.; Granfeldt, D.; Sahlin, E., Orwar, O. P Natl Acad Sci USA. 2005, 102, 8097-8102.
167. Ainla, A.; Jeffries, G. D.; Brune, R.; Orwar, O., Jesorka, A. Lab Chip. 2012, 12, 1255-1261.
168. Muller, M. Introduction to confocal fluorescence microscopy. 2nd ed. ed: Bellingham, 2006
169. Lakowicz, J. R. Principles of fluorescence spectroscopy. 3rd ed. ed. New York: Springer, 2006.
170. Pawley, J. B. Handbook of biological confocal microscopy. 3rd ed. ed. New York, NY: Springer, 2006.

Shijun Xu, 2014
84
171. Slavík, J. Fluorescence Microscopy and Fluorescent Probes, New York: Springer, 1996
172. Kubitscheck, U., Peters, R. Fluorescence microscopy: From Principles to Biological Applications. Wiley-Blackwell, 2013
173. Hof, M.; Hutterer, R., Fidler, V. Fluorescence spectroscopy in biology : advanced methods and their applications to membranes, proteins, DNA, and cells. Berlin ; New York: Springer, 2005.
174. Muller, M. Introduction to confocal fluorescence microscopy. 2nd ed. Bellingham, Wash.: SPIE Press, 2006.
175. Price, R. L., Jerome, W. G. Basic confocal microscopy. New York: Springer, 2011.
176. Murphy, D. B., Davidson, M. W. Fundamentals of light microscopy and electronic imaging. 2nd ed. Hoboken, N.J.: Wiley-Blackwell, 2013.
177. Axelrod, D. Biophys J. 1979, 26, 557-573.
178. Inami, W., Kawata, Y. Appl Opt. 2000, 39, 6369-6373.
179. Grattan, K. T. V., Meggitt, B. T. Optical fiber sensor technology : advanced applications : Bragg gratings and distributed sensors. Boston, MA ; London: Kluwer Academic, 2000.
180. Srinivasan, A. V., McFarland, D. M. Smart structures : analysis and design. Cambridge: Cambridge University Press, 2001.
181. Senior, J. M., Jamro, M. Y. Optical fiber communications : principles and practice. 3rd ed. Harlow, England ; New York: Financial Times/Prentice Hall, 2009.
182. Halloran, M. C.; Sato-Maeda, M.; Warren, J. T.; Su, F. Y.; Lele, Z.; Krone, P. H.; Kuwada, J. Y., Shoji, W. Development. 2000, 127, 1953-1960.
183. Fang, Z. Fundamentals of optical fiber sensors. Hoboken, N.J.: Wiley, 2012.
184. Harrison, M. A., Rae, I. F. General techniques of cell culture. Cambridge: Cambridge University Press, 1997.
185. David, J. M. Basic cell culture : a practical approach. Oxford: IRL Press, 1994.
186. Mitry, R. R., Hughes, R. D. Human cell culture protocols. 3rd ed. ed. Totowa, N.J.: Humana, 2012.
187. Pappas, D. Practical cell analysis. Oxford: Wiley, 2010.
188. Jamur, M. C., Oliver, C. Methods Mol Biol. 2010, 588, 63-66.
189. Schulz, I. Methods Enzymol. 1990, 192, 280-300.
190. Miyamoto, K.; Yamashita, T.; Tsukiyama, T.; Kitamura, N.; Minami, N.; Yamada, M., Imai, H. Cloning Stem Cells. 2008, 10, 535-542.

Microtechnologies for Single-cell Studies References
85
191. Dourmashkin, R. R.; Dougherty, R. M., Harris, R. J. Nature. 1962, 194, 1116-1119.
192. Kearse, K. P. T cell protocols : development and activation. Totowa, N.J.: Humana, 2000.
193. Dupuy-Coin, A. M.; Ege, T.; Bouteille, M., Ringertz, N. R. Exp Cell Res. 1976, 101, 355-369.
194. Neumann, E.; Sowers, A. E., Jordan, C. A. Electroporation and electrofusion in cell biology: Plenum, 1989.
195. Hoff, A. J. Handbook of biological physics. Amsterdam: Elsevier, 1995.
196. Sugar, I. P.; Forster, W., Neumann, E. Biophys Chem. 1987, 26, 321-335.
197. Huang, Z.; Olson, N. A.; You, W., Haugland, R. P. J Immunol Methods. 1992, 149, 261-266.
198. Gonzalez-Gil, S.; Keafer, B. A.; Jovine, R. V. M.; Aguilera, A.; Lu, S. H., Anderson, D. M. Mar Ecol Prog Ser. 1998, 164, 21-35.
199. Thompson, V. F.; Saldana, S.; Cong, J. Y., Goll, D. E. Analytical Biochemistry. 2000, 279, 170-178.
200. Jones, L. J.; Upson, R. H.; Haugland, R. P.; PanchukVoloshina, N.; Zhou, M. J., Haugland, R. P. Analytical Biochemistry. 1997, 251, 144-152.


![NeuroMEMS: Neural Probe Microtechnologies · metal electrode arrays have been used that are made of wire bundles [40], gluing individual metal wire electrodes together [41, 42] or](https://img.pdfslide.us/doc/110x75/5e6f60bff69adb6c0e59b7a9/neuromems-neural-probe-microtechnologies-metal-electrode-arrays-have-been-used.jpg)