Embed Size (px)
Citation preview
MICROSTRUCTURE AND MECHANICAL PROPERTIES OF WE43 ALLOY
PRODUCED VIA ADDITIVE FRICTION STIR TECHNOLOGY
Jacob Rollie Calvert
Thesis submitted to the faculty of the Virginia Polytechnic Institute and State University
in partial fulfillment of the requirements for the degree of
Master of Science
In
Material Science and Engineering
William T. Reynolds Jr
Christopher B. Williams
Kumar Kandasamy
6/29/2015
Blacksburg, VA
Keywords:
Additive Friction Stir Manufacturing Magnesium WE43
MICROSTRUCTURE AND MECHANICAL PROPERTIES OF WE43 ALLOY
PRODUCED VIA ADDITIVE FRICTION STIR TECHNOLOGY
Jacob Rollie Calvert
ABSTRACT
In an effort to save weight, transportation and aerospace industries have increasing investigated
magnesium alloys because of their high strength-to-weight ratio. Further efforts to save on
material use and machining time have focused on the use of additive manufacturing. However,
anisotropic properties can be caused by both the HCP structure of magnesium alloys as well as
by layered effects left by typical additive manufacturing processes. Additive Friction Stir (AFS)
is a relatively new additive manufacturing technology that yields wrought microstructure with
isotropic properties. In this study, Additive Friction Stir (AFS) fabrication was used to fabricate
WE43 magnesium alloy, with both atomized powder and rolled plate as filler material, into
multilayered structures. It was found that the WE43 alloy made by AFS exhibited nearly
isotropic tensile properties. With aging these properties exceeded the base material in the T5
condition. The toughness measured by Charpy impact testing also showed an increase over the
base material. The relationships among tensile properties, Vickers microhardness, impact
toughness, microstructure and thermal history are developed and discussed.

iii
Acknowledgements
I would like to gratefully acknowledge the contributions and support of Kevin Doherty and the
U.S. Army Research Lab.
This work would not have been possible without the support of Aeroprobe Corporation and
specifically the hard work and guidance of the Additive Friction Stir team.
I am also very appreciative of the staff at Virginia Tech, and especially grateful to the staff and
students in the Material Science Department and the CRC.
Thanks to my wife, my friends, and my family for their love and encouragement.
iv
Table of Contents
Acknowledgements .................................................................................................................................. iii
Table of Contents ..................................................................................................................................... iv
List of Figures ............................................................................................................................................ v
List of Tables ............................................................................................................................................ vi
Chapter 1 ....................................................................................................................................................... 1
Introduction .............................................................................................................................................. 1
Experimental Details ................................................................................................................................. 2
Results ....................................................................................................................................................... 4
Deposition ............................................................................................................................................. 4
Microstructure ...................................................................................................................................... 4
Tensile Results ....................................................................................................................................... 6
Vickers Microhardness Results ............................................................................................................. 8
Charpy Impact Test Results ................................................................................................................... 9
Thermal Profile .................................................................................................................................... 12
DISCUSSION ............................................................................................................................................. 13
CONCLUSIONS ......................................................................................................................................... 15
References .................................................................................................................................................. 16
v
List of Figures
Figure 1: Additive Friction Stir process and sample Aluminum deposition.................................. 2
Figure 2: XZ Cross section and sample locations.......................................................................... 3
Figure 3: Micrographs of (a) WE43 -100/+325 atomized powder partially consolidated inside
the tool, (b) consolidated powder exiting the tool and microstructures from Part 1 (c)
and Part 2 (d). ................................................................................................................... 4
Figure 4: Micrographs of WE43-T5 rolled plate used for feed (a), ............................................... 5
Figure 5: Tensile results by sample orientation for (a) Ultimate Strength, (b) Yield, and (c)
Elongation. ....................................................................................................................... 6
Figure 6: Typical stress-strain curves for (a) different sample orientations of Part 2, and (b) the
ZY orientation in the base and Parts 1, 2, and 3 as deposited...........................................7
Figure 7: XY tensile results by layer for (a) Part 2 and (b) Part 3 ................................................. 8
Figure 8: Vickers microhardness profiles of as deposited (a) Part 1, (b) Part 2, and (c) Part 3. ... 9
Figure 9: Representative fracture surface topography for (a) WE43-T5 plate, (b) Part 1, (c) Part
2 and (d) Part 3. ...............................................................................................................10
Figure 10: WE43-T5 fractograph (a) and representative microstructure (b) of fracture surface.
........................................................................................................................................ 11
Figure 11: Part 1 fractograph (a) and representative microstructure (b) of fracture surface. ..... 11
Figure 12: Part 3 Charpy impact sample fractograph (a), macrograph (b), and microstructure (c).
........................................................................................................................................ 12
Figure 13: Thermal profile of Part 1 substrate during deposition. ............................................... 12
Figure 14: Hall-Petch relationship of deposit and substrate interface. ........................................ 14

vi
List of Tables
Table 1: Vickers Microhardness Results 8
Table 2: Charpy Impact Results 9
1
Chapter 1
Introduction
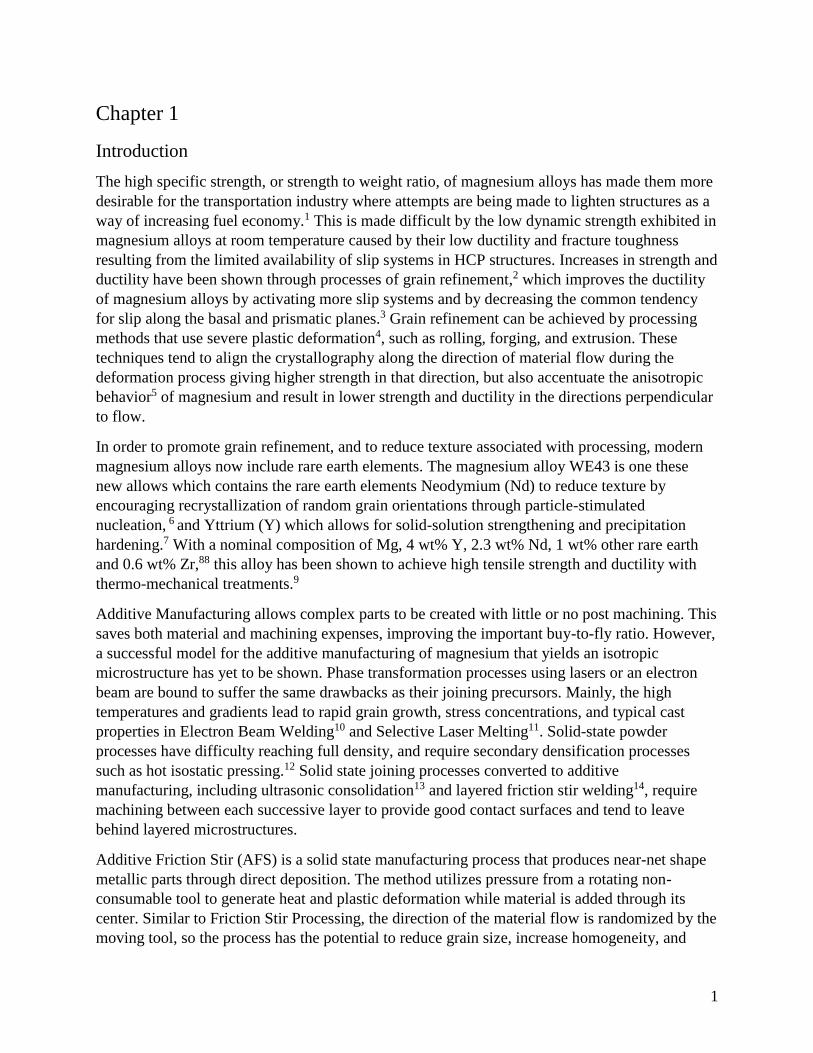
The high specific strength, or strength to weight ratio, of magnesium alloys has made them more
desirable for the transportation industry where attempts are being made to lighten structures as a
way of increasing fuel economy.1 This is made difficult by the low dynamic strength exhibited in
magnesium alloys at room temperature caused by their low ductility and fracture toughness
resulting from the limited availability of slip systems in HCP structures. Increases in strength and
ductility have been shown through processes of grain refinement,2 which improves the ductility
of magnesium alloys by activating more slip systems and by decreasing the common tendency
for slip along the basal and prismatic planes.3 Grain refinement can be achieved by processing
methods that use severe plastic deformation4, such as rolling, forging, and extrusion. These
techniques tend to align the crystallography along the direction of material flow during the
deformation process giving higher strength in that direction, but also accentuate the anisotropic
behavior5 of magnesium and result in lower strength and ductility in the directions perpendicular
to flow.
In order to promote grain refinement, and to reduce texture associated with processing, modern
magnesium alloys now include rare earth elements. The magnesium alloy WE43 is one these
new allows which contains the rare earth elements Neodymium (Nd) to reduce texture by
encouraging recrystallization of random grain orientations through particle-stimulated
nucleation, 6 and Yttrium (Y) which allows for solid-solution strengthening and precipitation
hardening.7 With a nominal composition of Mg, 4 wt% Y, 2.3 wt% Nd, 1 wt% other rare earth
and 0.6 wt% Zr,88 this alloy has been shown to achieve high tensile strength and ductility with
thermo-mechanical treatments.9
Additive Manufacturing allows complex parts to be created with little or no post machining. This
saves both material and machining expenses, improving the important buy-to-fly ratio. However,
a successful model for the additive manufacturing of magnesium that yields an isotropic
microstructure has yet to be shown. Phase transformation processes using lasers or an electron
beam are bound to suffer the same drawbacks as their joining precursors. Mainly, the high
temperatures and gradients lead to rapid grain growth, stress concentrations, and typical cast
properties in Electron Beam Welding10 and Selective Laser Melting11. Solid-state powder
processes have difficulty reaching full density, and require secondary densification processes
such as hot isostatic pressing.12 Solid state joining processes converted to additive
manufacturing, including ultrasonic consolidation13 and layered friction stir welding14, require
machining between each successive layer to provide good contact surfaces and tend to leave
behind layered microstructures.
Additive Friction Stir (AFS) is a solid state manufacturing process that produces near-net shape
metallic parts through direct deposition. The method utilizes pressure from a rotating non-
consumable tool to generate heat and plastic deformation while material is added through its
center. Similar to Friction Stir Processing, the direction of the material flow is randomized by the
moving tool, so the process has the potential to reduce grain size, increase homogeneity, and
2
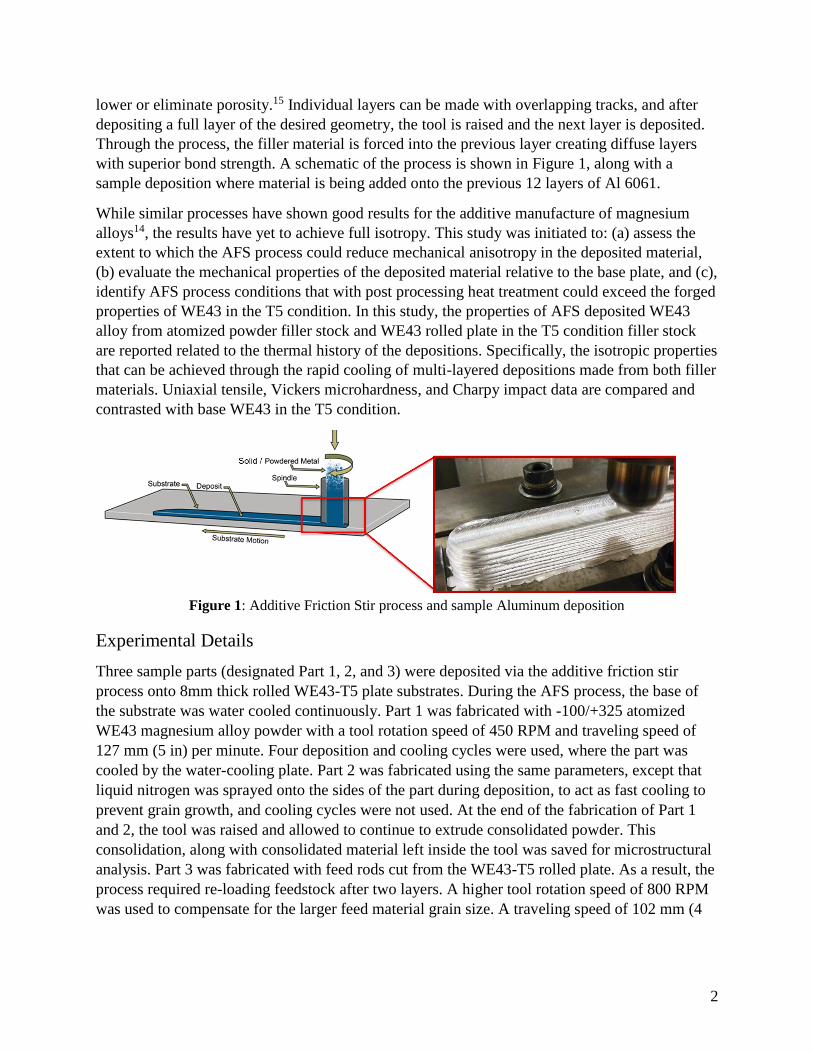
lower or eliminate porosity.15 Individual layers can be made with overlapping tracks, and after
depositing a full layer of the desired geometry, the tool is raised and the next layer is deposited.
Through the process, the filler material is forced into the previous layer creating diffuse layers
with superior bond strength. A schematic of the process is shown in Figure 1, along with a
sample deposition where material is being added onto the previous 12 layers of Al 6061.
While similar processes have shown good results for the additive manufacture of magnesium
alloys14, the results have yet to achieve full isotropy. This study was initiated to: (a) assess the
extent to which the AFS process could reduce mechanical anisotropy in the deposited material,
(b) evaluate the mechanical properties of the deposited material relative to the base plate, and (c),
identify AFS process conditions that with post processing heat treatment could exceed the forged
properties of WE43 in the T5 condition. In this study, the properties of AFS deposited WE43
alloy from atomized powder filler stock and WE43 rolled plate in the T5 condition filler stock
are reported related to the thermal history of the depositions. Specifically, the isotropic properties
that can be achieved through the rapid cooling of multi-layered depositions made from both filler
materials. Uniaxial tensile, Vickers microhardness, and Charpy impact data are compared and
contrasted with base WE43 in the T5 condition.
Figure 1: Additive Friction Stir process and sample Aluminum deposition
Experimental Details
Three sample parts (designated Part 1, 2, and 3) were deposited via the additive friction stir
process onto 8mm thick rolled WE43-T5 plate substrates. During the AFS process, the base of
the substrate was water cooled continuously. Part 1 was fabricated with -100/+325 atomized
WE43 magnesium alloy powder with a tool rotation speed of 450 RPM and traveling speed of
127 mm (5 in) per minute. Four deposition and cooling cycles were used, where the part was
cooled by the water-cooling plate. Part 2 was fabricated using the same parameters, except that
liquid nitrogen was sprayed onto the sides of the part during deposition, to act as fast cooling to
prevent grain growth, and cooling cycles were not used. At the end of the fabrication of Part 1
and 2, the tool was raised and allowed to continue to extrude consolidated powder. This
consolidation, along with consolidated material left inside the tool was saved for microstructural
analysis. Part 3 was fabricated with feed rods cut from the WE43-T5 rolled plate. As a result, the
process required re-loading feedstock after two layers. A higher tool rotation speed of 800 RPM
was used to compensate for the larger feed material grain size. A traveling speed of 102 mm (4
3
in) per minute was used to deposit 0.76 mm (0.03 in) thick layers. Liquid nitrogen was again
used to cool the part during deposition.
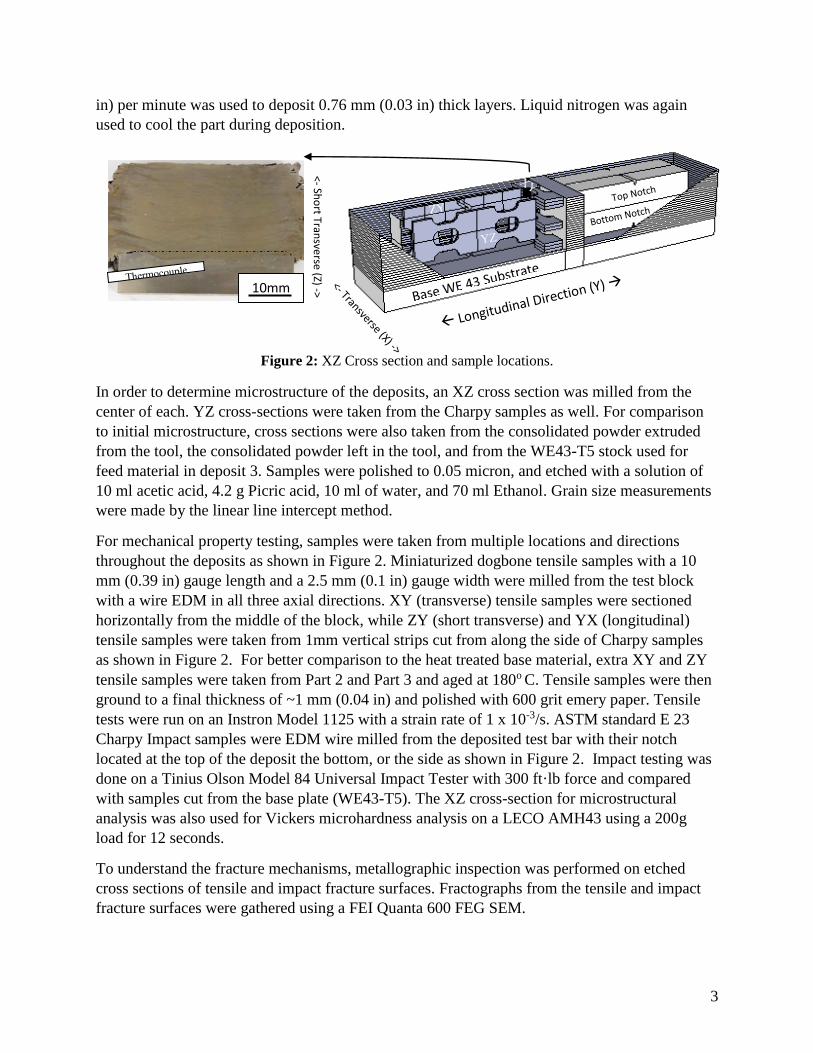
Figure 2: XZ Cross section and sample locations.
In order to determine microstructure of the deposits, an XZ cross section was milled from the
center of each. YZ cross-sections were taken from the Charpy samples as well. For comparison
to initial microstructure, cross sections were also taken from the consolidated powder extruded
from the tool, the consolidated powder left in the tool, and from the WE43-T5 stock used for
feed material in deposit 3. Samples were polished to 0.05 micron, and etched with a solution of
10 ml acetic acid, 4.2 g Picric acid, 10 ml of water, and 70 ml Ethanol. Grain size measurements
were made by the linear line intercept method.
For mechanical property testing, samples were taken from multiple locations and directions
throughout the deposits as shown in Figure 2. Miniaturized dogbone tensile samples with a 10
mm (0.39 in) gauge length and a 2.5 mm (0.1 in) gauge width were milled from the test block
with a wire EDM in all three axial directions. XY (transverse) tensile samples were sectioned
horizontally from the middle of the block, while ZY (short transverse) and YX (longitudinal)
tensile samples were taken from 1mm vertical strips cut from along the side of Charpy samples
as shown in Figure 2. For better comparison to the heat treated base material, extra XY and ZY
tensile samples were taken from Part 2 and Part 3 and aged at 180o C. Tensile samples were then
ground to a final thickness of ~1 mm (0.04 in) and polished with 600 grit emery paper. Tensile
tests were run on an Instron Model 1125 with a strain rate of 1 x 10⁻³/s. ASTM standard E 23
Charpy Impact samples were EDM wire milled from the deposited test bar with their notch
located at the top of the deposit the bottom, or the side as shown in Figure 2. Impact testing was
done on a Tinius Olson Model 84 Universal Impact Tester with 300 ft·lb force and compared
with samples cut from the base plate (WE43-T5). The XZ cross-section for microstructural
analysis was also used for Vickers microhardness analysis on a LECO AMH43 using a 200g
load for 12 seconds.
To understand the fracture mechanisms, metallographic inspection was performed on etched
cross sections of tensile and impact fracture surfaces. Fractographs from the tensile and impact
fracture surfaces were gathered using a FEI Quanta 600 FEG SEM.
<- Sho
rt Transve
rse (Z) -> 10mm
4
Thermocouples were embedded in the substrate of Part 1 before deposition in order to capture
the thermal history of the part during processing. The transverse cross section in Figure 2 shows
the relative position of the thermocouples.
Results
Deposition
Each layer of the deposition was observed, and no major voids were noticed. Further, no voids
were noticed during the milling or preparation of test samples. The deposited layers had uniform
thickness, with fairly consistent flashing (excess material left on the edges of the stir by the
rotating tool). The bottom edges of the initially flat substrates had little to no curvature to them,
indicating little deformation due to residual stresses in the samples. Macrographs of the part
cross-sections, similar to Part 1 seen in Figure 2, also revealed no major voids or defects. The
layer overlap can also be seen by the depth that the material plunged into the substrate. This is
illustrated in Figure 2 by the dark material that is mixed below the dashed substrate line and lies
just above the thermocouple.
Microstructure
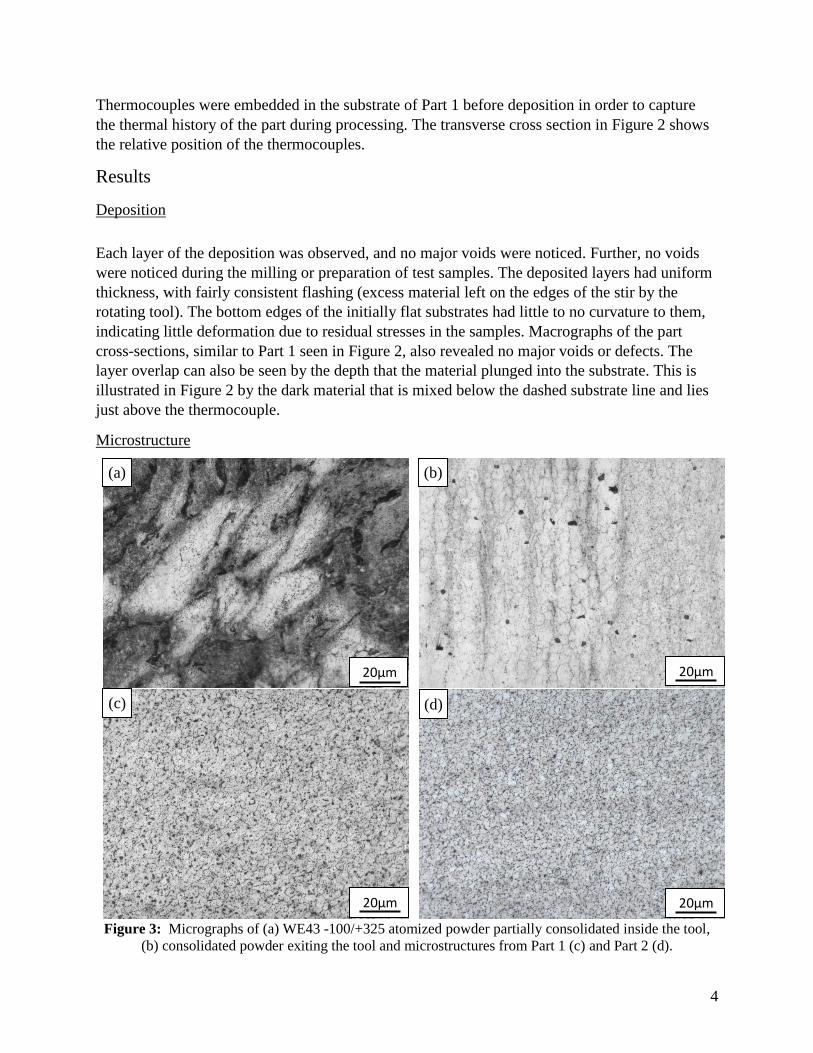
Figure 3: Micrographs of (a) WE43 -100/+325 atomized powder partially consolidated inside the tool,
(b) consolidated powder exiting the tool and microstructures from Part 1 (c) and Part 2 (d).
20µm 20µm
20µm 20µm
(a) (b)
(c) (d)
5
Figure 3 displays the microstructural evolution of Part 1 and Part 2. The -100/+325 atomized
powder is consolidated inside the tool (a), and consolidated, though not fully dense, material (b)
is added to the deposition. Average grain size of the consolidated powder was not determined,
but grains could reach up to 10 μm in diameter. Parts 1 and 2 showed obvious grain refinement
and homogenization with common grain sizes between 2 and 4 μm. Few voids could be seen in
the un-etched micrographs.
Parts 1 and 2, seen in Figure 3c and d, displayed a homogeneous equiaxed fine grain
microstructure. There was no obvious aspect ratio or layer interface to indicate the build
direction of the part. However, both parts showed slight changes in average grain size with
height. For Part 1 the average grain size was 2.5 μm at the top and bottom of the deposition and
3.2 μm in the middle. The average grain size and range for Part 2 were both smaller, with an
average grain size of 2.0 μm near the top of the sample and 2.4 μm near the bottom.
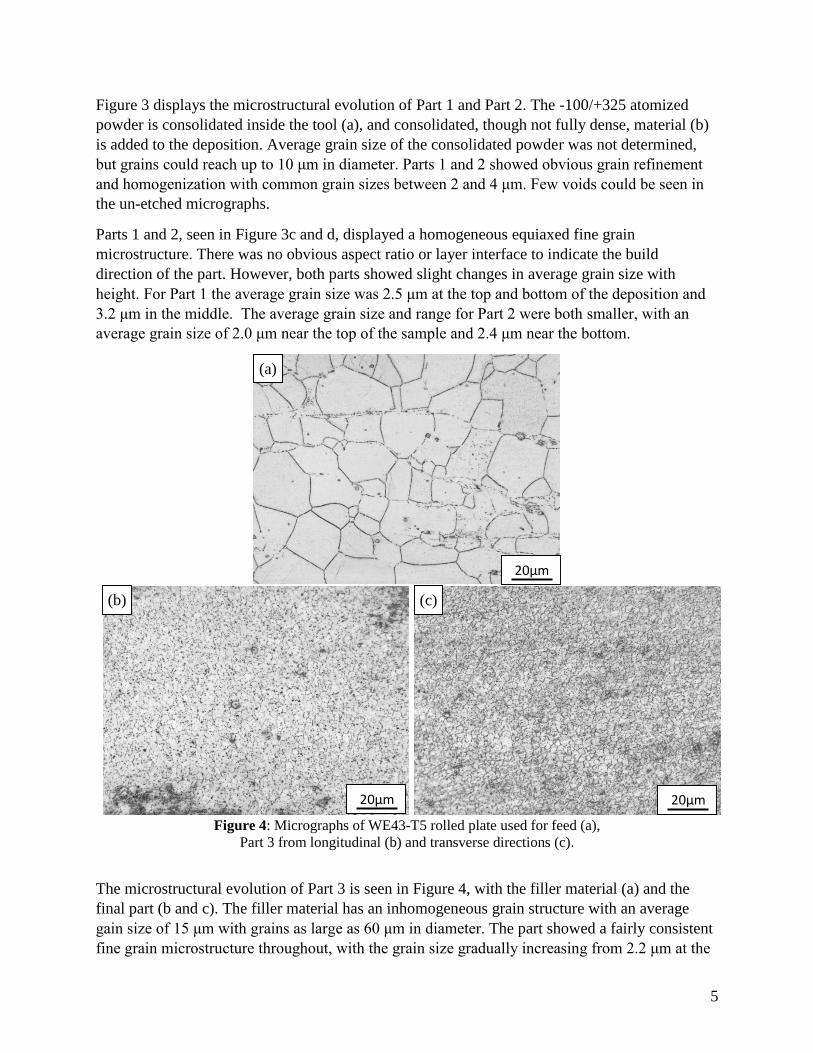
Figure 4: Micrographs of WE43-T5 rolled plate used for feed (a),
Part 3 from longitudinal (b) and transverse directions (c).
The microstructural evolution of Part 3 is seen in Figure 4, with the filler material (a) and the
final part (b and c). The filler material has an inhomogeneous grain structure with an average
gain size of 15 μm with grains as large as 60 μm in diameter. The part showed a fairly consistent
fine grain microstructure throughout, with the grain size gradually increasing from 2.2 μm at the
20µm 20µm
(b)
(a)
(c)
20µm
6
top of the sample to 2.4 μm at the bottom. However, there were several locations within the cross
section where small bands of grains were not as refined as the others, as seen in the lower left
corner of Figure 4c.
Tensile Results
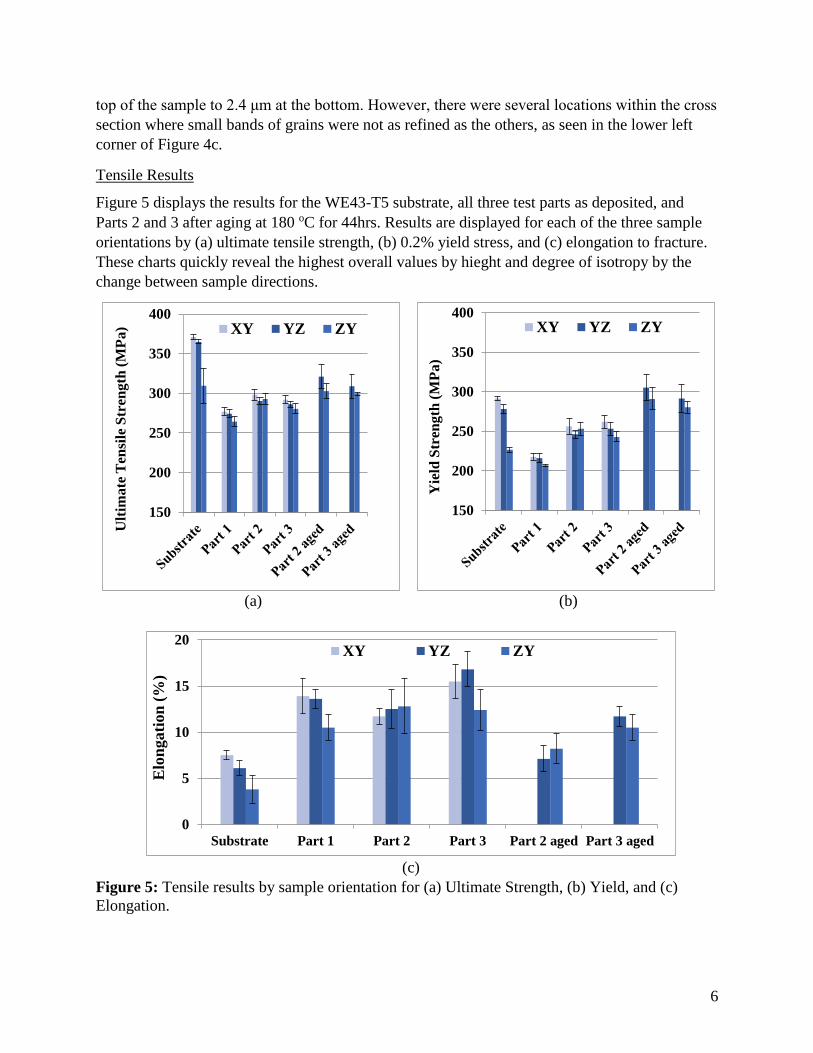
Figure 5 displays the results for the WE43-T5 substrate, all three test parts as deposited, and
Parts 2 and 3 after aging at 180 oC for 44hrs. Results are displayed for each of the three sample
orientations by (a) ultimate tensile strength, (b) 0.2% yield stress, and (c) elongation to fracture.
These charts quickly reveal the highest overall values by hieght and degree of isotropy by the
change between sample directions.
(a)
(b)
(c)
Figure 5: Tensile results by sample orientation for (a) Ultimate Strength, (b) Yield, and (c)
Elongation.
150
200
250
300
350
400
Ult
imate
Ten
sile
Str
ength
(M
Pa
) XY YZ ZY
150
200
250
300
350
400
Yie
ld S
tren
gth
(M
Pa
)
XY YZ ZY
0
5
10
15
20
Substrate Part 1 Part 2 Part 3 Part 2 aged Part 3 aged
Elo
ngati
on
(%
)
XY YZ ZY
7
The WE43-T5 substrate and filler material had high tensile and yield strength in the XY (rolling)
and YX directions, but much less strength and consistency in the ZY (through thickness)
direction. It had the lowest ductility, which was heavy affected by orientation, decreasing
dramatically in the ZY direction.
Part 1 increased in isotropy and ductility over the base material, but the yield and ulitimate
tensile strengths dropped significantly in the XY and YZ orientations. Part 2 had similar
ductility, and an increase in tensile and yield strength over Part 1, but still had lower ultimate
tensile and yield than the base material. Part 3 had an increase in ductility over Part 1 and 2, with
yield and tensile strengths similar to Part 2. Part 2 and 3 in the aged condition had a marginally
higher ultimate tensile strength which was still significantly lower than the base material.
However, aging increased the yield strength by ~50 MPa while lowering the ductility by ~6%,
producing results equivalent to or higher than the base material in the transverse and short
transverse direction. For Part 2 and 3 in the aged condition the yield strength in the short
transverse orientantation was improved over the base material by 14% and 10% respectively,
while ductility showed an improvement of 115% and 137% in the same orientation. Because of a
lack of material, the XY direction was not tested in the aged condition
(a)
(b)
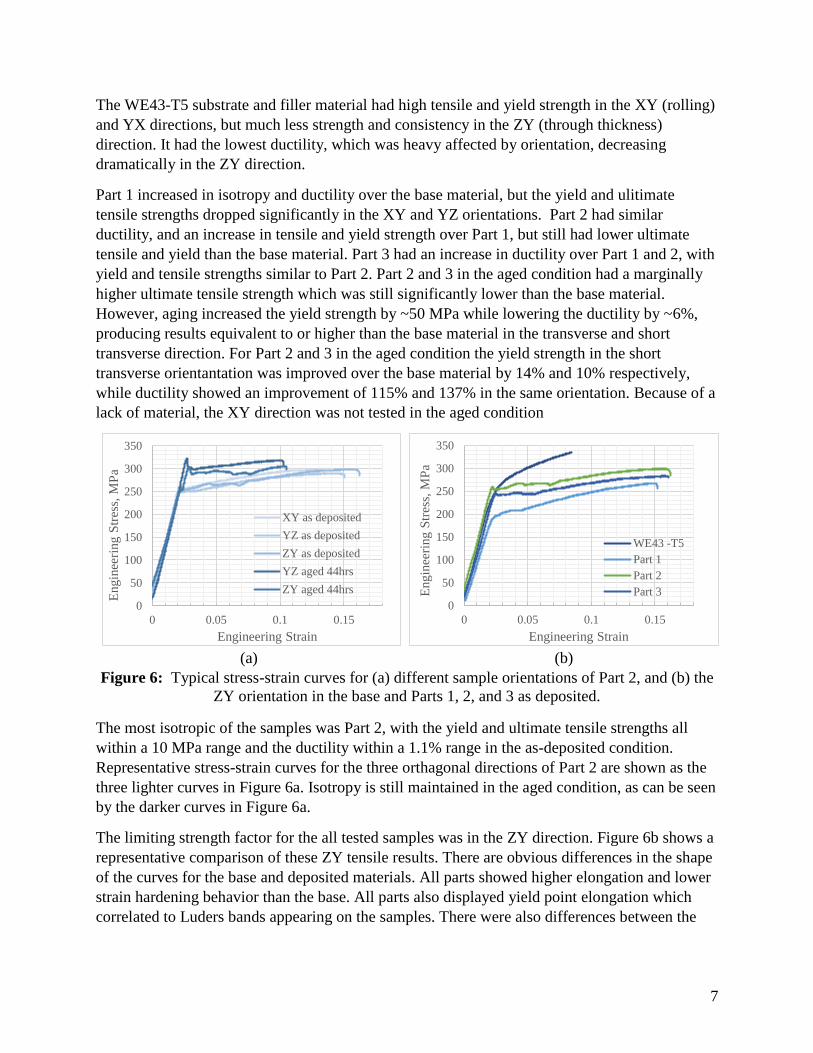
Figure 6: Typical stress-strain curves for (a) different sample orientations of Part 2, and (b) the
ZY orientation in the base and Parts 1, 2, and 3 as deposited.
The most isotropic of the samples was Part 2, with the yield and ultimate tensile strengths all
within a 10 MPa range and the ductility within a 1.1% range in the as-deposited condition.
Representative stress-strain curves for the three orthagonal directions of Part 2 are shown as the
three lighter curves in Figure 6a. Isotropy is still maintained in the aged condition, as can be seen
by the darker curves in Figure 6a.
The limiting strength factor for the all tested samples was in the ZY direction. Figure 6b shows a
representative comparison of these ZY tensile results. There are obvious differences in the shape
of the curves for the base and deposited materials. All parts showed higher elongation and lower
strain hardening behavior than the base. All parts also displayed yield point elongation which
correlated to Luders bands appearing on the samples. There were also differences between the
0
50
100
150
200
250
300
350
0 0.05 0.1 0.15
Engin
eeri
ng S
tres
s, M
Pa
Engineering Strain
XY as deposited
YZ as deposited
ZY as deposited
YZ aged 44hrs
ZY aged 44hrs
0
50
100
150
200
250
300
350
0 0.05 0.1 0.15
Engin
eeri
ng S
tres
s, M
Pa
Engineering Strain
WE43 -T5
Part 1
Part 2
Part 3
8
non-cooled Part 1 and the cooled Part 2 and 3. A more obvious yield point phenomenon
appeared on the Parts 2 and 3 while Part 1 had a higher strain hardening rate.
(a)
(b)
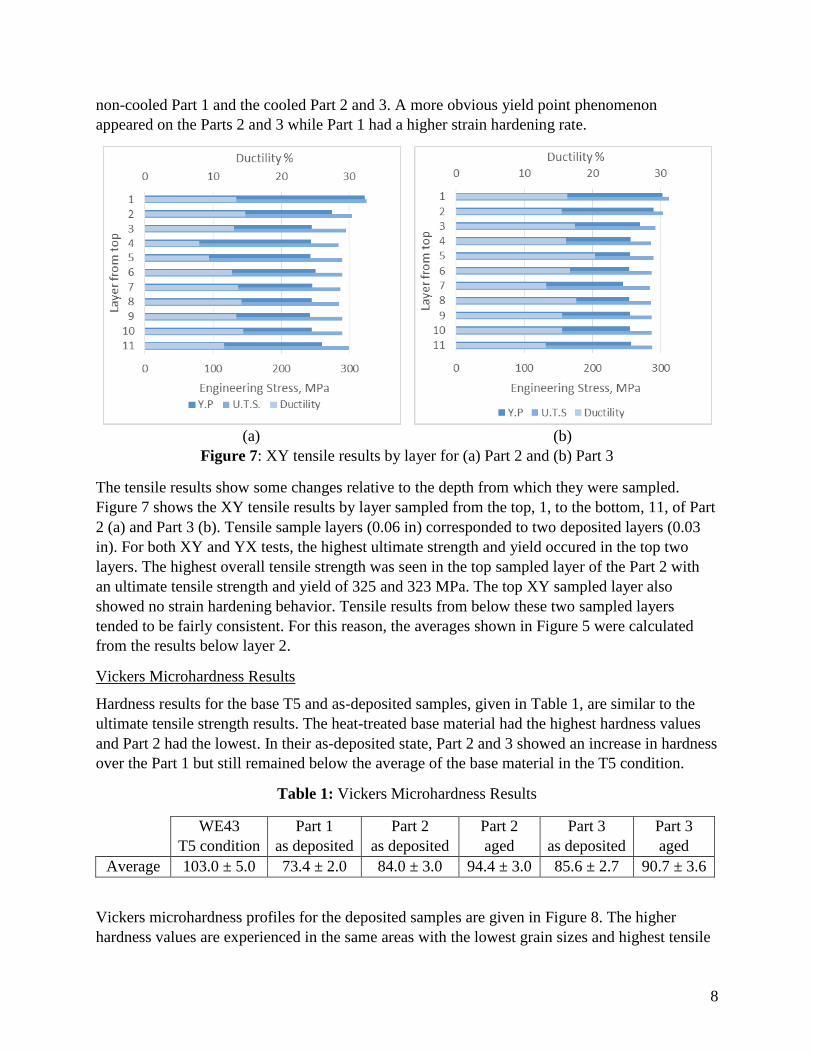
Figure 7: XY tensile results by layer for (a) Part 2 and (b) Part 3
The tensile results show some changes relative to the depth from which they were sampled.
Figure 7 shows the XY tensile results by layer sampled from the top, 1, to the bottom, 11, of Part
2 (a) and Part 3 (b). Tensile sample layers (0.06 in) corresponded to two deposited layers (0.03
in). For both XY and YX tests, the highest ultimate strength and yield occured in the top two
layers. The highest overall tensile strength was seen in the top sampled layer of the Part 2 with
an ultimate tensile strength and yield of 325 and 323 MPa. The top XY sampled layer also
showed no strain hardening behavior. Tensile results from below these two sampled layers
tended to be fairly consistent. For this reason, the averages shown in Figure 5 were calculated
from the results below layer 2.
Vickers Microhardness Results
Hardness results for the base T5 and as-deposited samples, given in Table 1, are similar to the
ultimate tensile strength results. The heat-treated base material had the highest hardness values
and Part 2 had the lowest. In their as-deposited state, Part 2 and 3 showed an increase in hardness
over the Part 1 but still remained below the average of the base material in the T5 condition.
Table 1: Vickers Microhardness Results
WE43
T5 condition
Part 1
as deposited
Part 2
as deposited
Part 2
aged
Part 3
as deposited
Part 3
aged
Average 103.0 ± 5.0 73.4 ± 2.0 84.0 ± 3.0 94.4 ± 3.0 85.6 ± 2.7 90.7 ± 3.6
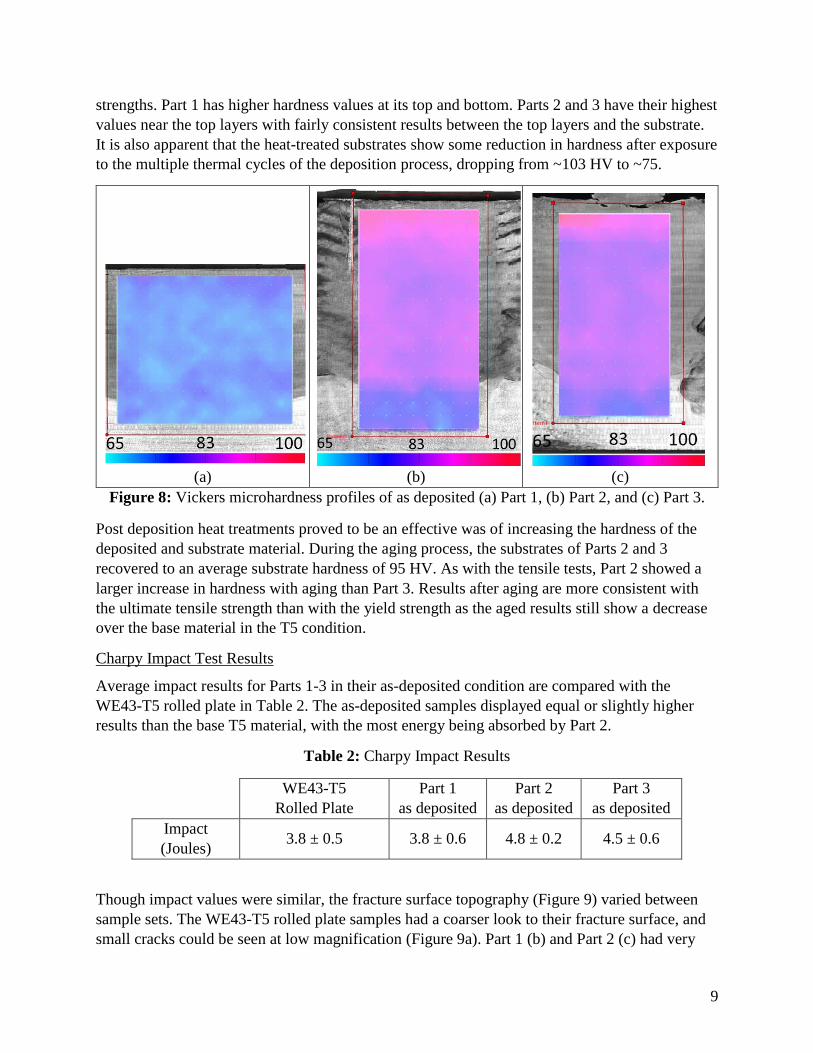
Vickers microhardness profiles for the deposited samples are given in Figure 8. The higher
hardness values are experienced in the same areas with the lowest grain sizes and highest tensile
9
strengths. Part 1 has higher hardness values at its top and bottom. Parts 2 and 3 have their highest
values near the top layers with fairly consistent results between the top layers and the substrate.
It is also apparent that the heat-treated substrates show some reduction in hardness after exposure
to the multiple thermal cycles of the deposition process, dropping from ~103 HV to ~75.
(a)
(b)
(c)
Figure 8: Vickers microhardness profiles of as deposited (a) Part 1, (b) Part 2, and (c) Part 3.
Post deposition heat treatments proved to be an effective was of increasing the hardness of the
deposited and substrate material. During the aging process, the substrates of Parts 2 and 3
recovered to an average substrate hardness of 95 HV. As with the tensile tests, Part 2 showed a
larger increase in hardness with aging than Part 3. Results after aging are more consistent with
the ultimate tensile strength than with the yield strength as the aged results still show a decrease
over the base material in the T5 condition.
Charpy Impact Test Results
Average impact results for Parts 1-3 in their as-deposited condition are compared with the
WE43-T5 rolled plate in Table 2. The as-deposited samples displayed equal or slightly higher
results than the base T5 material, with the most energy being absorbed by Part 2.
Table 2: Charpy Impact Results
WE43-T5
Rolled Plate
Part 1
as deposited
Part 2
as deposited
Part 3
as deposited
Impact
(Joules) 3.8 ± 0.5 3.8 ± 0.6 4.8 ± 0.2 4.5 ± 0.6
Though impact values were similar, the fracture surface topography (Figure 9) varied between
sample sets. The WE43-T5 rolled plate samples had a coarser look to their fracture surface, and
small cracks could be seen at low magnification (Figure 9a). Part 1 (b) and Part 2 (c) had very
10
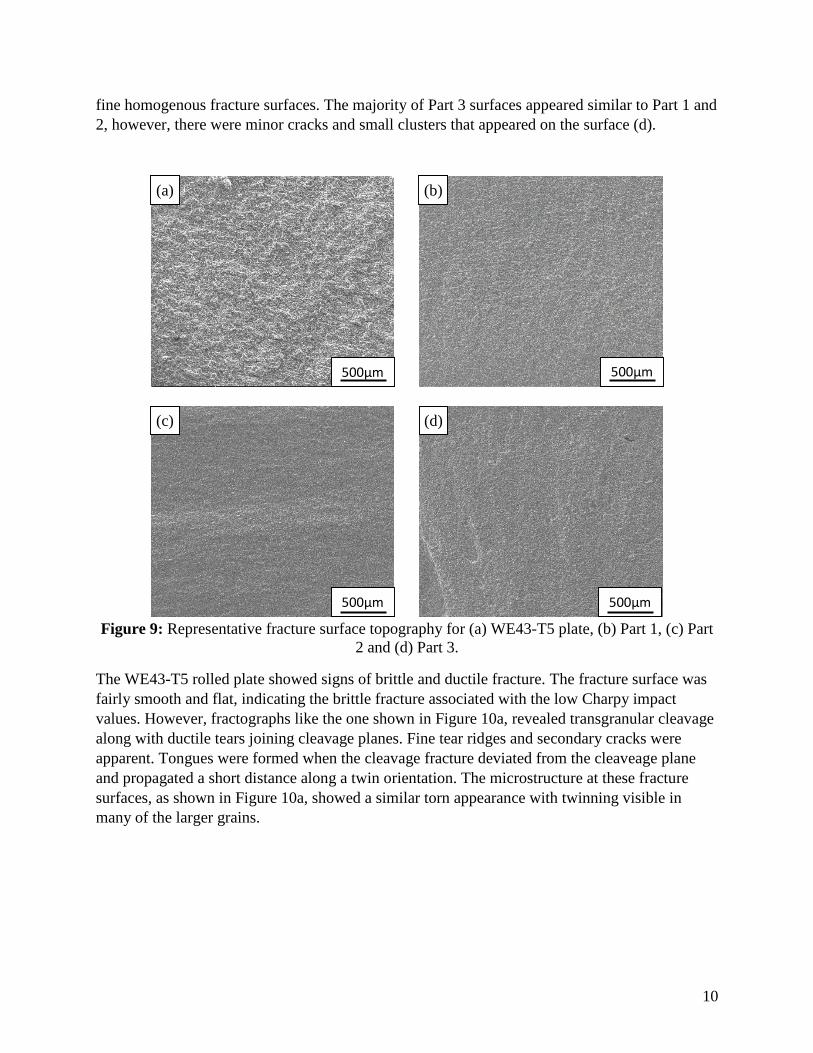
fine homogenous fracture surfaces. The majority of Part 3 surfaces appeared similar to Part 1 and
2, however, there were minor cracks and small clusters that appeared on the surface (d).
Figure 9: Representative fracture surface topography for (a) WE43-T5 plate, (b) Part 1, (c) Part
2 and (d) Part 3.
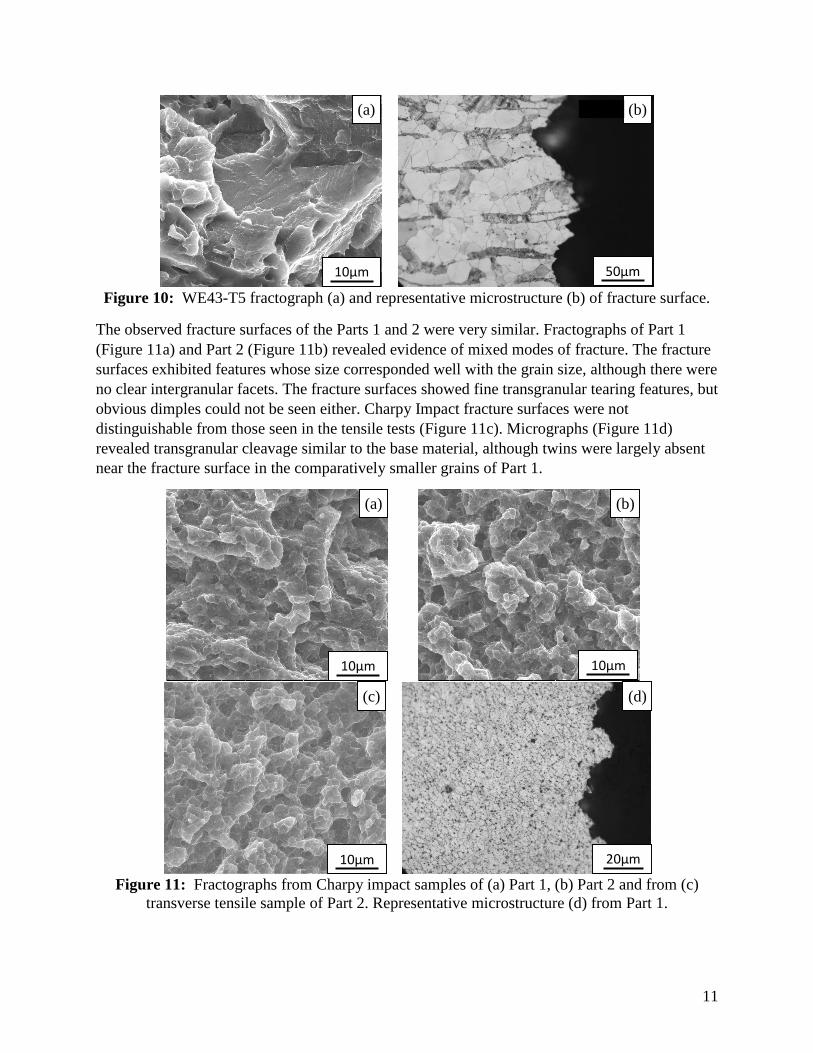
The WE43-T5 rolled plate showed signs of brittle and ductile fracture. The fracture surface was
fairly smooth and flat, indicating the brittle fracture associated with the low Charpy impact
values. However, fractographs like the one shown in Figure 10a, revealed transgranular cleavage
along with ductile tears joining cleavage planes. Fine tear ridges and secondary cracks were
apparent. Tongues were formed when the cleavage fracture deviated from the cleaveage plane
and propagated a short distance along a twin orientation. The microstructure at these fracture
surfaces, as shown in Figure 10a, showed a similar torn appearance with twinning visible in
many of the larger grains.
500µm 500µm
500µm 500µm
(b) (a)
(c) (d)
11
Figure 10: WE43-T5 fractograph (a) and representative microstructure (b) of fracture surface.
The observed fracture surfaces of the Parts 1 and 2 were very similar. Fractographs of Part 1
(Figure 11a) and Part 2 (Figure 11b) revealed evidence of mixed modes of fracture. The fracture
surfaces exhibited features whose size corresponded well with the grain size, although there were
no clear intergranular facets. The fracture surfaces showed fine transgranular tearing features, but
obvious dimples could not be seen either. Charpy Impact fracture surfaces were not
distinguishable from those seen in the tensile tests (Figure 11c). Micrographs (Figure 11d)
revealed transgranular cleavage similar to the base material, although twins were largely absent
near the fracture surface in the comparatively smaller grains of Part 1.
Figure 11: Fractographs from Charpy impact samples of (a) Part 1, (b) Part 2 and from (c)
transverse tensile sample of Part 2. Representative microstructure (d) from Part 1.
10µm 50µm
(a) (b)
20µm
(a) (b)
10µm
10µm
10µm
(c) (d)
12
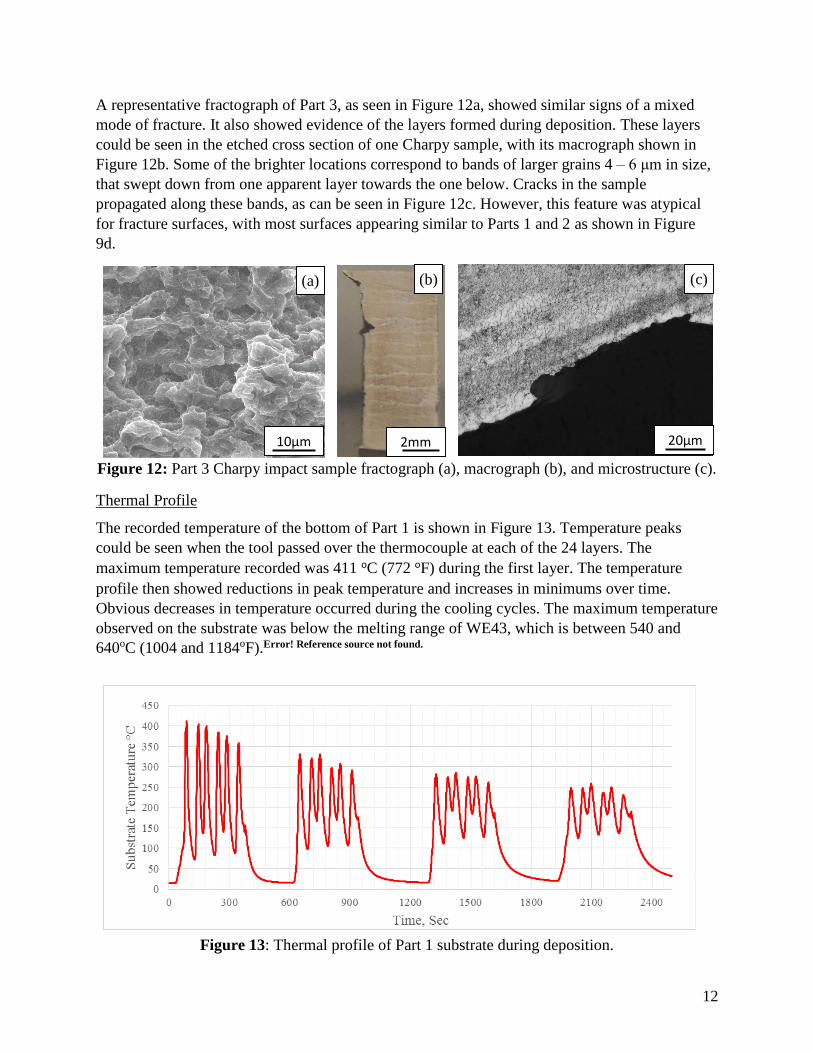
A representative fractograph of Part 3, as seen in Figure 12a, showed similar signs of a mixed
mode of fracture. It also showed evidence of the layers formed during deposition. These layers
could be seen in the etched cross section of one Charpy sample, with its macrograph shown in
Figure 12b. Some of the brighter locations correspond to bands of larger grains 4 – 6 μm in size,
that swept down from one apparent layer towards the one below. Cracks in the sample
propagated along these bands, as can be seen in Figure 12c. However, this feature was atypical
for fracture surfaces, with most surfaces appearing similar to Parts 1 and 2 as shown in Figure
9d.
Figure 12: Part 3 Charpy impact sample fractograph (a), macrograph (b), and microstructure (c).
Thermal Profile
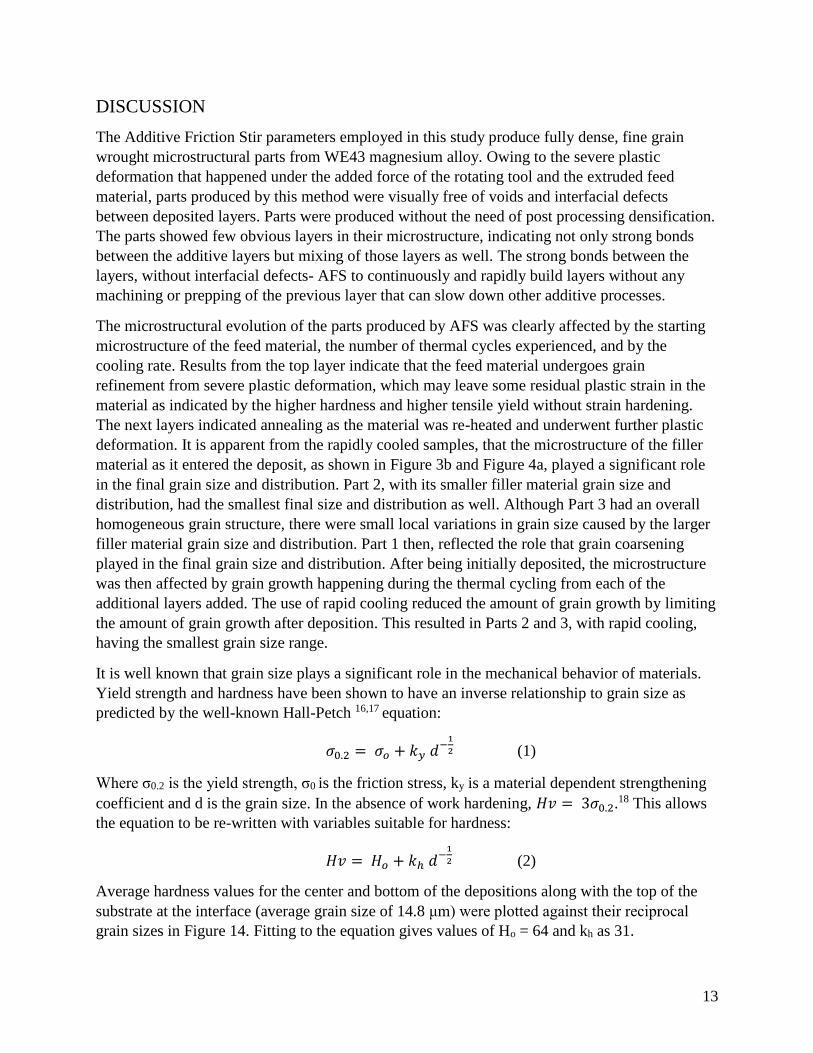
The recorded temperature of the bottom of Part 1 is shown in Figure 13. Temperature peaks
could be seen when the tool passed over the thermocouple at each of the 24 layers. The
maximum temperature recorded was 411 oC (772 oF) during the first layer. The temperature
profile then showed reductions in peak temperature and increases in minimums over time.
Obvious decreases in temperature occurred during the cooling cycles. The maximum temperature
observed on the substrate was below the melting range of WE43, which is between 540 and
640oC (1004 and 1184oF).Error! Reference source not found.
Figure 13: Thermal profile of Part 1 substrate during deposition.
2mm 20µm 10µm
(a) (b) (c)
13
DISCUSSION
The Additive Friction Stir parameters employed in this study produce fully dense, fine grain
wrought microstructural parts from WE43 magnesium alloy. Owing to the severe plastic
deformation that happened under the added force of the rotating tool and the extruded feed
material, parts produced by this method were visually free of voids and interfacial defects
between deposited layers. Parts were produced without the need of post processing densification.
The parts showed few obvious layers in their microstructure, indicating not only strong bonds
between the additive layers but mixing of those layers as well. The strong bonds between the
layers, without interfacial defects- AFS to continuously and rapidly build layers without any
machining or prepping of the previous layer that can slow down other additive processes.
The microstructural evolution of the parts produced by AFS was clearly affected by the starting
microstructure of the feed material, the number of thermal cycles experienced, and by the
cooling rate. Results from the top layer indicate that the feed material undergoes grain
refinement from severe plastic deformation, which may leave some residual plastic strain in the
material as indicated by the higher hardness and higher tensile yield without strain hardening.
The next layers indicated annealing as the material was re-heated and underwent further plastic
deformation. It is apparent from the rapidly cooled samples, that the microstructure of the filler
material as it entered the deposit, as shown in Figure 3b and Figure 4a, played a significant role
in the final grain size and distribution. Part 2, with its smaller filler material grain size and
distribution, had the smallest final size and distribution as well. Although Part 3 had an overall
homogeneous grain structure, there were small local variations in grain size caused by the larger
filler material grain size and distribution. Part 1 then, reflected the role that grain coarsening
played in the final grain size and distribution. After being initially deposited, the microstructure
was then affected by grain growth happening during the thermal cycling from each of the
additional layers added. The use of rapid cooling reduced the amount of grain growth by limiting
the amount of grain growth after deposition. This resulted in Parts 2 and 3, with rapid cooling,
having the smallest grain size range.
It is well known that grain size plays a significant role in the mechanical behavior of materials.
Yield strength and hardness have been shown to have an inverse relationship to grain size as
predicted by the well-known Hall-Petch 16,17 equation:
𝜎0.2 = 𝜎𝑜 + 𝑘𝑦 𝑑−1
2 (1)
Where σ0.2 is the yield strength, σ0 is the friction stress, ky is a material dependent strengthening
coefficient and d is the grain size. In the absence of work hardening, 𝐻𝑣 = 3𝜎0.2.18 This allows
the equation to be re-written with variables suitable for hardness:
𝐻𝑣 = 𝐻𝑜 + 𝑘ℎ 𝑑−1
2 (2)
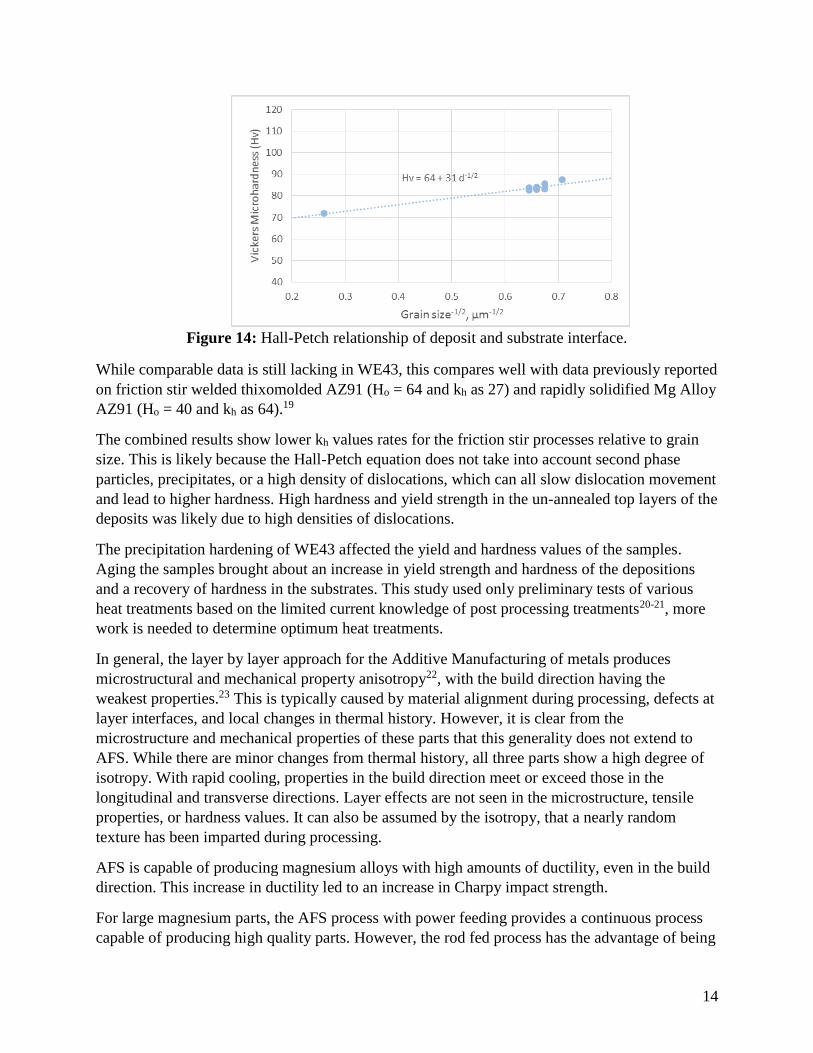
Average hardness values for the center and bottom of the depositions along with the top of the
substrate at the interface (average grain size of 14.8 μm) were plotted against their reciprocal
grain sizes in Figure 14. Fitting to the equation gives values of Ho = 64 and kh as 31.
14
Figure 14: Hall-Petch relationship of deposit and substrate interface.
While comparable data is still lacking in WE43, this compares well with data previously reported
on friction stir welded thixomolded AZ91 (Ho = 64 and kh as 27) and rapidly solidified Mg Alloy
AZ91 (Ho = 40 and kh as 64).19
The combined results show lower kh values rates for the friction stir processes relative to grain
size. This is likely because the Hall-Petch equation does not take into account second phase
particles, precipitates, or a high density of dislocations, which can all slow dislocation movement
and lead to higher hardness. High hardness and yield strength in the un-annealed top layers of the
deposits was likely due to high densities of dislocations.
The precipitation hardening of WE43 affected the yield and hardness values of the samples.
Aging the samples brought about an increase in yield strength and hardness of the depositions
and a recovery of hardness in the substrates. This study used only preliminary tests of various
heat treatments based on the limited current knowledge of post processing treatments20-21, more
work is needed to determine optimum heat treatments.
In general, the layer by layer approach for the Additive Manufacturing of metals produces
microstructural and mechanical property anisotropy22, with the build direction having the
weakest properties.23 This is typically caused by material alignment during processing, defects at
layer interfaces, and local changes in thermal history. However, it is clear from the
microstructure and mechanical properties of these parts that this generality does not extend to
AFS. While there are minor changes from thermal history, all three parts show a high degree of
isotropy. With rapid cooling, properties in the build direction meet or exceed those in the
longitudinal and transverse directions. Layer effects are not seen in the microstructure, tensile
properties, or hardness values. It can also be assumed by the isotropy, that a nearly random
texture has been imparted during processing.
AFS is capable of producing magnesium alloys with high amounts of ductility, even in the build
direction. This increase in ductility led to an increase in Charpy impact strength.
For large magnesium parts, the AFS process with power feeding provides a continuous process
capable of producing high quality parts. However, the rod fed process has the advantage of being
15
easier to start and stop with only minor decreases in strength, making it ideal for adding small
features or doing minor repairs.
CONCLUSIONS
In this study, AFS is shown to be a viable solid-state additive manufacturing method for multi-
layered magnesium parts. WE43 atomized powder, and WE43-T5 plate was successfully
deposited into a fully dense part with a homogeneous fine grain wrought microstructure without
the aid of any secondary densification process. Rapid cooling with liquid nitrogen was able to
slow grain growth and reduce the average final grain size to between 2.0 and 2.4 µm.
Mechanical testing of the AFS deposits showed nearly isotropic tensile properties, with impact
energy values that were comparable to wrought WE43-T5. Tensile and microhardness results
reflected local grain size variation in the deposits due to thermal history
- Atomized powder filler achieved a yield strength of over 207 MPa along with
elongation exceeding 10%.
- Atomized powder filler, with rapid cooling, achieved a yield strength over 246 MPa
with elongation exceeding 11%.
- With heat treatments, the rapidly cooled powder yield strength was raised to over 302
MPa, with elongation exceeding 7%.
- WE43-T5 rod filler, with rapid cooling, achieved a yield strength over 243 MPa with
elongation exceeding 12%.
- With heat treatments, the rapidly cooled rod yield strength was raised to over 281
MPa, with elongation exceeding 10%.
16
References
1. A.Wrigley, "Magnesium use rising," Automotive Manufacturing & Production, 1997, vol. 109, no. 6, pp.
26-27.
2. A. Yamashita, Z. Horita and L. T.G, "Improving the mechanical properties of magnesium and a magnesium
alloy through severe plastic deformation," Materials Science and Engineering, 2001, vol. A300, pp. 142-
147.
3. X. Wang, L. Jin, Y. Li and X. Guo, "Effect of equal channel angular extrusion process on deformation
behaviors of mg-3Al-zn alloy," Material Letters, 2008, vol. 62, no. 12, pp. 1856-8.
4. J. Bohlen, M. Nürnberg, J. Senn, D. Letzig and S. Agnew, "The texture and anisotropy of magnesium–
zinc–rare earth alloy sheets," Acta Materialia, 2007 vol. 55, no. 6, p. 2101–2112.
5. F. Czerwinski, Magnesium Injection Molding, New York: Springer, 2008.
6. G. Lorimer, L. Mackenzie, F. Humphreys and T. Wilks, "The Recrystallization Behavior of AZ31 and
WE43," Materials Science Forum, 2005, Vols. 488-489, pp. 99-102.
7. E. Aghion, Y. Gueta, N. Moscovitch and B. Bronfin, "Effect of yttrium additions on the properties of grain-
refined Mg-3% Nd alloy," Journal of Materials Science, 2008, vol. 43, pp. 4870-4875.
8. Y. Kang, D. Wu and R. H. E. Chen, "Microstructures and mechanical properties of the age hardened Mg-
4.2Y-2.5Nd-1Gd-0.6Zr (WE43) microalloyed with Zn," Journal of Magnesium and Alloys, 2014, vol. 2,
pp. 109-115.
9. T. Mohri, M. Mabuchi, N. Saito and M Nakamura, "Microstructure and mechanical properties of a Mg-4Y-
3RE alloy processed by thermo-mechanical treatment," Materials Science and Engineering, 1998, vol.
A257, pp. 287-294.
10. S. Yang and B Zhang, “Experimental study of electron beam welding of magnesium alloys”, Rare Metals,
2011, vol. 30, pp. 364-369
11. C.C. Ng, M.M. Savalani, M.L. Lau and H.C. Man, “Microstructure and mechanical properties of selective
laser melted magnesium,” Applied Surface Science, 2011, vol. 257, pp. 7447-7454
12. C. Bettles, “Magnesium Powder Metallurgy: Process and Materials Opportunities,” Journal of Materials
Engineering and Performance, 2008, vol 17, no. 3, pp 297-301
13. H. T. Fujii, M.R. Spiraman and S.S. Babu, “Quantitative Evaluation of Bulk and Interface Microstructures
in Al-3003 Alloy Builds Made by Very High Power Ultrasonic Additive Manufacturing” Metallurgical and
Materials Transactions, 2011, vol 42A, pp 4045-4055.
14. S. Palanivel, P. Nelaturu, B. Glass and R. Mishra, "Friction stir additive manufacturing for high structural
performance through microstructural control in an Mg based WE43 alloy," Materials and Design, 2015,
vol. 65, pp. 934-952.
15. R. Mishra and Z. Ma, "Friction stir welding and processing," Material Science and Engineering, 2005, vol.
R, no. 50, pp. 1-78.
16. E.O. Hall, “The Deformation and Ageing of Mild Steel: III Discussion of Results,” Proceedings of the
Physical Society, 1951, Vol 64, pp 747 – 753.
17. N.J. Petch, “The cleavage strength of polycrystals”, J. Iron Steel Inst., 1953, vol 173, pp. 25-28.
18. M.F. Ashby, D.R.H. Jones, Engineering Materials 1: an introduction to properties, applications, and design
(4th), Elsevier, Oxford, 2012, p. 160-161.
19. S.H.C. Park, Y.S. Sato and H. Kokawa, “Microstructural evolution and its effect on Hall-Petch relationship
in friction stir welding of thixomolded Mg alloy AZ91D,” Journal of Materials Science, 2003, vol 38, pp.
4379 - 4383
20. P. Mengucci, G, Barucca, G. Riontino, D. Lussana, M. Massazza, R. Ferragut and E. Hassan Aly,
“Structure evolution of a WE43 Mg alloy submitted to different thermal treatments” Material Science and
Engineering, 2008, vol. 479, pp 37-44.
21. S K. Panigrahi, R S. Mishra, K. Kumar, R. Delorme, B. Davies, R A. Howell and K Cho, K “A Study on
Combined Effect of Forging and Ageing in Mg-Y-RE Magnesium Alloy,” Minerals, Metals and Materials
Society/AIME, Feb. 2001
22. O. Ivanova, C. Williams and T. Cambell, “Additive manufacturing (AM) and nanotechnology: promises
and challenges” Rapid Prototyping Journal, 2013, vol. 19.5, pp 353-364.

17
23. W. Frazier, “Metal Additive Manufacturing,” Journal of Materials Engineering and Performance, 2014,
vol. 23, pp. 1917-1927.