Embed Size (px)
Citation preview

Warwick Manufacturing Group
MICROSOFT PROJECT 2010EXERCISE
Copyright © 2011 University of Warwick

Warwick Manufacturing Group
Warwick Manufacturing Group
MICROSOFT PROJECT 2010 EXERCISE
IntroductionIn MS Project there are typically several possible ways to do each desired action.
This exercise will usually show you only one way to do each action, to avoid
confusion. You may find the Project Help useful (called by using the '?' button), or the
Tooltips. (If you let the cursor arrow rest for a short while on a tool icon a brief
explanation of the tool will appear.)
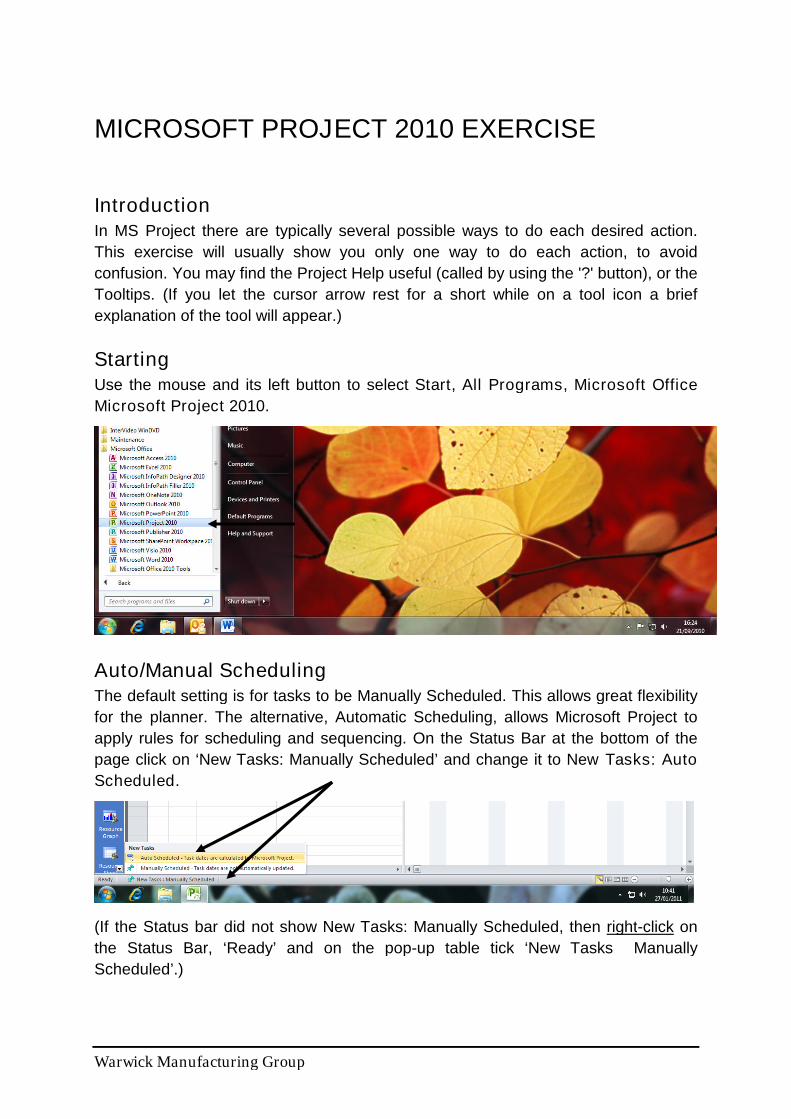
StartingUse the mouse and its left button to select Start, All Programs, Microsoft Office
Microsoft Project 2010.
Auto/Manual SchedulingThe default setting is for tasks to be Manually Scheduled. This allows great flexibility
for the planner. The alternative, Automatic Scheduling, allows Microsoft Project to
apply rules for scheduling and sequencing. On the Status Bar at the bottom of the
page click on ‘New Tasks: Manually Scheduled’ and change it to New Tasks: Auto
Scheduled.
(If the Status bar did not show New Tasks: Manually Scheduled, then right-click on
the Status Bar, ‘Ready’ and on the pop-up table tick ‘New Tasks Manually
Scheduled’.)

Warwick Manufacturing Group Page 2
To Enter Tasks and DurationsYou are now in the Gantt chart view. Click on the first box in the 'Task Name' column.
Enter the task name for the first task.
Enter the task names for the rest of the project in this column.
The Task Name column is wider than we need. Point to the feint vertical dividing line
to the right of the Task Name heading. (A two-headed arrow appears.) Hold down
the mouse button and move left to reduce the column width.
To the right of 'Task Names' is the 'Duration' column. Click on the duration box for
the first task and enter the number of days.
Similarly enter all the other durations.
To Enter Task LinksWe now enter the task links by dragging from task to task. Referring to the network
which you have will help. Point to the middle of the first task bar. (A 4-direction arrow
appears.) Press the mouse button and hold it down. (A task information label
appears.) With the button held down move the pointer down to point at the next task
bar. (The label becomes a link information label, and the cursor becomes 3 chain
links.) Release the button.
Use this method to create all the logic links required.
To move right or left along the chart if necessary, click on the arrows at the bottom of
the screen.

Warwick Manufacturing Group Page 3
One way to keep all of the tasks on screen at the same time is to reduce the scale.
Choose View, Entire Project
If you accidentally create unrequired links, these can be deleted by selecting the two
misconnected tasks on the list of tasks, then in the Task tab click the 'unlink' icon (a
picture of a broken chain link). Alternatively, you can double click the left mouse
button on the link and select “delete” in the dialogue box that appears.
Make a note of the planned project duration for future reference. You can find this by
choosing Project, Project Information, Statistics. Note the current duration, then
choose Close
To See the Precedence DiagramTo see that the logic is correct we can examine the network diagram. On the left of
the screen is a ‘View Bar’ illustrating the choice of views. (If there is no View Bar,
then right-click on the grey vertical bar labelled Gantt Chart and choose View Bar.)
From the View Bar choose the Network Diagram.
Use the + or – in the bottom right of the screen to zoom in or out as necessary.
Check that the network is correct. To remove any incorrect links in the Network view,
double click the link line and on the dialogue box which appears choose Delete.
To create new links use the same method as in the Gantt chart by 'dragging' the link
from earlier task to later task.
Warwick Manufacturing Group Page 4
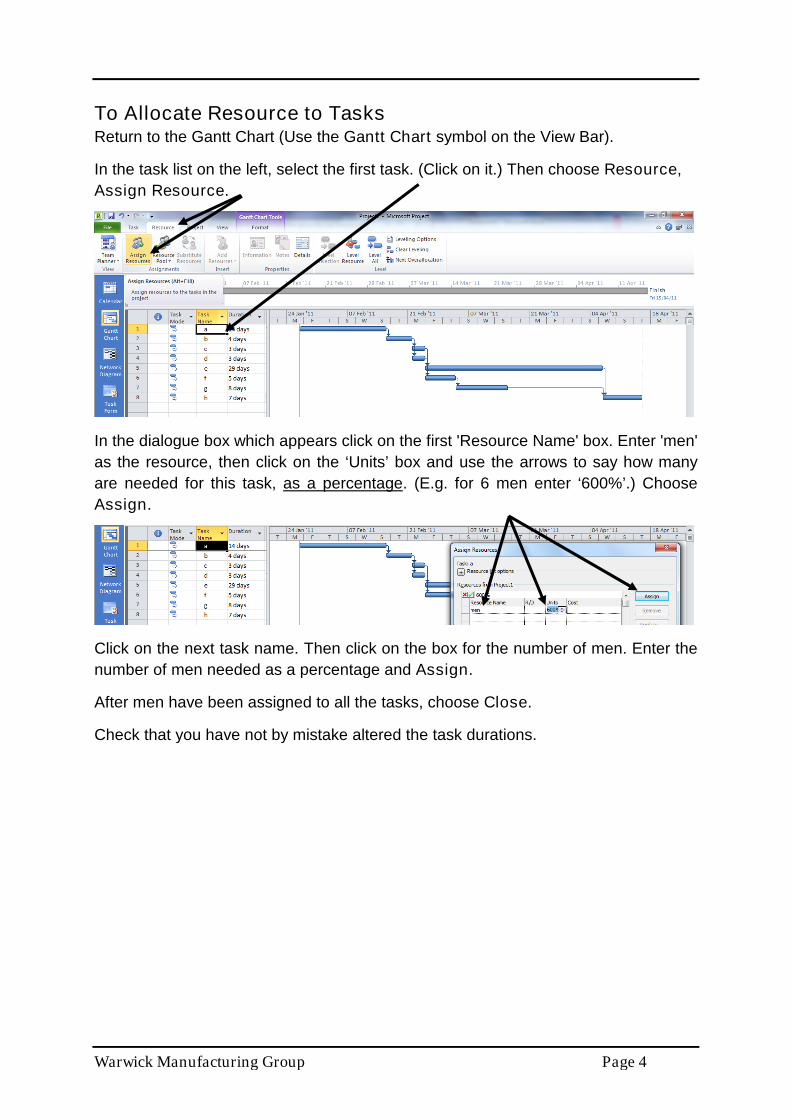
To Allocate Resource to TasksReturn to the Gantt Chart (Use the Gantt Chart symbol on the View Bar).
In the task list on the left, select the first task. (Click on it.) Then choose Resource,
Assign Resource.
In the dialogue box which appears click on the first 'Resource Name' box. Enter 'men'
as the resource, then click on the ‘Units’ box and use the arrows to say how many
are needed for this task, as a percentage. (E.g. for 6 men enter ‘600%’.) Choose
Assign.
Click on the next task name. Then click on the box for the number of men. Enter the
number of men needed as a percentage and Assign.
After men have been assigned to all the tasks, choose Close.
Check that you have not by mistake altered the task durations.

Warwick Manufacturing Group Page 5
To Show the Resource Histogram
It is useful to show the resource histogram below the Gantt Chart on a split screen.
To do this, choose the View tab and in the Split View area check the Details box,
then change Task Form to Resource Graph. Choose Entire Project in the Zoom
area to see the whole picture.
Notice that the Resource Graph does not show a resolution of individual days. The
histogram may be distorted by the number of days which are blocked together as
shown in the Timescale
The maximum number of men available has defaulted to 100%, and red indicates
over allocation (shown striped here). To reset the maximum, in the Split View area
change Resource Graph to Resource Sheet. In the Resource Sheet set the max.
units to 600%.
While in this screen we will enter some cost information. Enter 40/d as the Standard
Rate (Std. Rate) and notice how MSP interprets this as £40 per day. If you need to
change the currency symbol choose File, Options, Display and alter the currency.

Warwick Manufacturing Group Page 6
Restore the screen to a Gantt Chart above a Resource Graph.
To do Resource Levelling by HandAn over-allocation of men now exists. If it is not visible on the resource histogram,
use the arrow to scroll to the right.
Try to meet the resource limitation by delaying individual tasks manually. Decide
which task to move. Click and hold on the middle of the Gantt Chart task bar and
drag to left or right.
If the Planning Wizard interrupts your adjustments then choose to ‘Move the task
and keep the link’ and then ‘OK’.
You will need to zoom in to ensure that you do the moves accurately to the nearest
day.
What is the shortest project duration achievable within the resource limitation? (Look
at Project, Project Information, Statistics.)

Warwick Manufacturing Group Page 7
Notice that any task that has been moved has an ‘indicator’ in the left column of the
Gantt chart. Point at the indicator to get more information about it.
To reset tasks after you have tried moving them point to the task bar and press the
right mouse button to open a context sensitive menu. Choose Information,
Advanced and reset the ‘Constraint type’ to ‘As soon as possible’. ‘OK’
To Get MS Project to do Resource LevellingGet MS Project to try to solve this problem. First, reset any tasks that have been
moved manually. Reset them to start as soon as possible in the way just described in
the previous section. Then choose Resource, Level All.
Is the project finish date better than you achieved by hand?
If you want to undo this, choose Resource, Clear Levelling, Entire Project, OK.

Warwick Manufacturing Group Page 8
To Record the Current Plan as the BaselineTo save the current plan and costs as the basis against which to compare actual
performance we define the current plan and budget as the 'baseline plan'. Choose
Project, Schedule, Set Baseline, Set Baseline, For Entire Project, OK.
To Record ProgressWe want to record progress four weeks after the start (= 28 calendar days = 20
working days).
To forcibly change the current date to 4 weeks forward use Project, Project
Information. Click the downward arrow to the right of the “Current Date” box.
Move the date 4 weeks forward, then choose OK

Warwick Manufacturing Group Page 9
To record progress on the first task, task a, select it on the task list, then in the Task
tab, go to the Schedule area and on the right of Mark on Track use the down arrow
to select Update Tasks
Record that the task started as planned but took two days longer than planned.
This shows on the Gantt chart, but does not emphasise the variation from plan.
To achieve this we can modify the appearance of the Gantt chart.
Double click on the left mouse button in the Gantt chart area, but not on any
individual bar, to bring up the Bar Styles dialogue box.
‘Task’ bars are shown going From ‘Task Start’ and To ‘Task Finish’. Click on this
‘Task Start’ which will then show an arrow at the box end. Click on it to get a list of
the acceptable alternative delimiters. Choose ‘Baseline Start’.
Similarly change To ‘Task Finish’ into To – ‘Baseline Finish’. Click ‘OK’

Warwick Manufacturing Group Page 10
It is now clearer that task a took two extra days.
Next record that task b started with this two day delay, but recovered one of the lost
days, and that tasks c and d followed on and are proceeding, with progress
proportional to the time spent to date.
How clearly does the Gantt chart show this? How could this be improved?
Cost PerformanceIn tracking costs MS Project will have assumed that costs are proportional to the
actual durations. This can be seen by selecting View, Tables, Cost.
To see the cost data may require you to move the vertical divider between the task
data and the Gantt chart, or to scroll to the right in this section of the screen.
Warwick Manufacturing Group Page 11
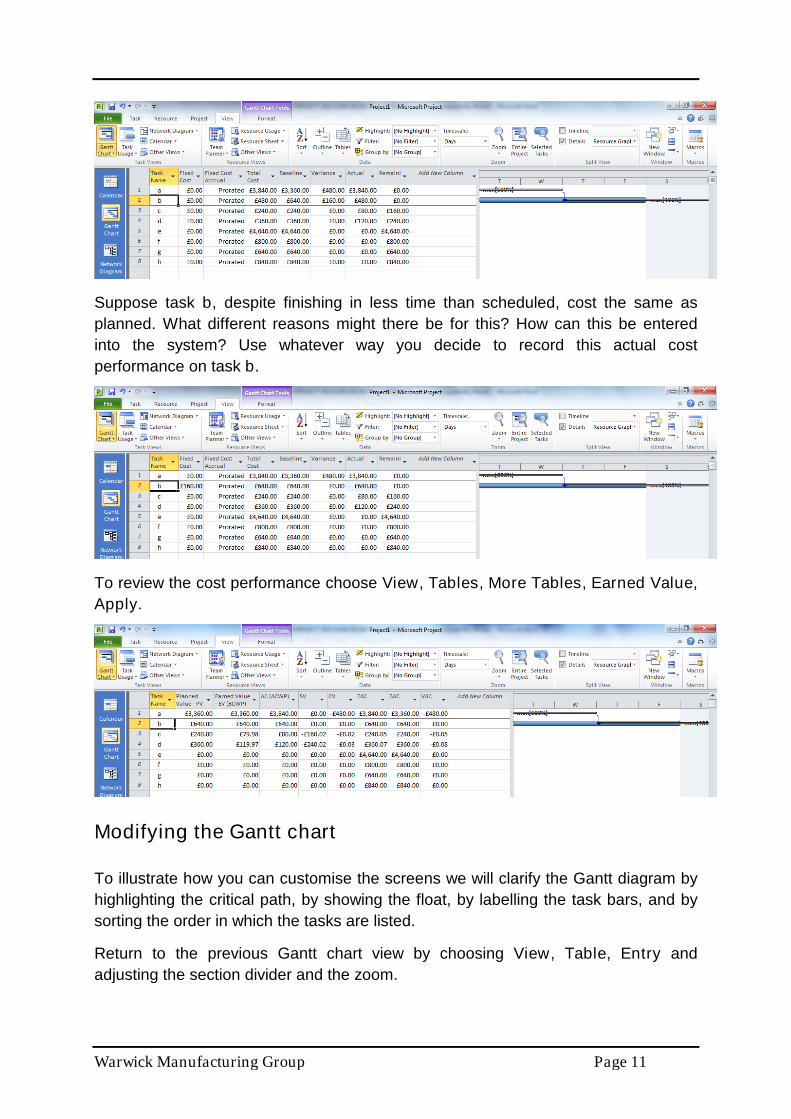
Suppose task b, despite finishing in less time than scheduled, cost the same as
planned. What different reasons might there be for this? How can this be entered
into the system? Use whatever way you decide to record this actual cost
performance on task b.
To review the cost performance choose View, Tables, More Tables, Earned Value,
Apply.
Modifying the Gantt chart
To illustrate how you can customise the screens we will clarify the Gantt diagram by
highlighting the critical path, by showing the float, by labelling the task bars, and by
sorting the order in which the tasks are listed.
Return to the previous Gantt chart view by choosing View, Table, Entry and
adjusting the section divider and the zoom.
Warwick Manufacturing Group Page 12
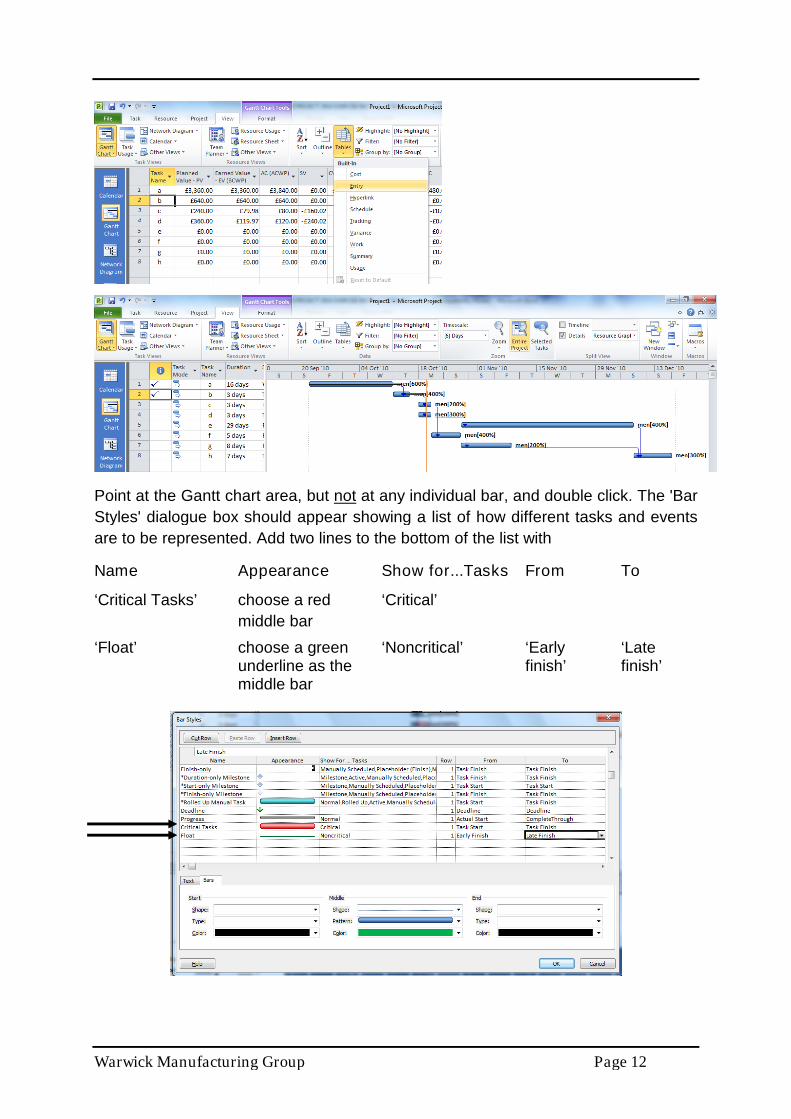
Point at the Gantt chart area, but not at any individual bar, and double click. The 'Bar
Styles' dialogue box should appear showing a list of how different tasks and events
are to be represented. Add two lines to the bottom of the list with
Name Appearance Show for...Tasks From To
‘Critical Tasks’ choose a red ‘Critical’
middle bar
‘Float’ choose a green ‘Noncritical’ ‘Early ‘Lateunderline as the finish’ finish’middle bar
Warwick Manufacturing Group Page 13
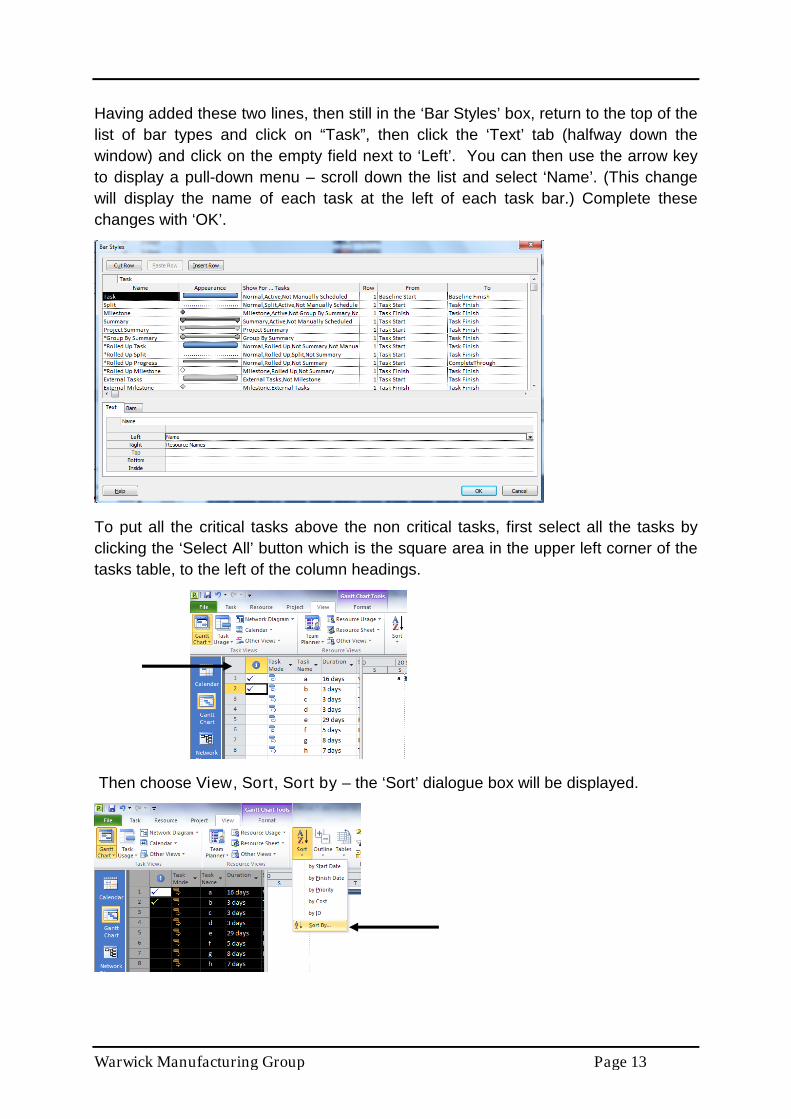
Having added these two lines, then still in the ‘Bar Styles’ box, return to the top of the
list of bar types and click on “Task”, then click the ‘Text’ tab (halfway down the
window) and click on the empty field next to ‘Left’. You can then use the arrow key
to display a pull-down menu – scroll down the list and select ‘Name’. (This change
will display the name of each task at the left of each task bar.) Complete these
changes with ‘OK’.
To put all the critical tasks above the non critical tasks, first select all the tasks by
clicking the ‘Select All’ button which is the square area in the upper left corner of the
tasks table, to the left of the column headings.
Then choose View, Sort, Sort by – the ‘Sort’ dialogue box will be displayed.

Warwick Manufacturing Group Page 14
In the ‘Sort by’ field (at the top), click the arrow key to display a pull-down menu –
scroll down the list and select (1) Total Slack (2) Early Start, Sort.
If Total Slack or Early Start are not available as Sort by options, then go to the task
list. At the right side choose Add New Column for the missing variable(s). It will then
become available as a Sort by option
What modifications do you think would enhance the clarity and communication
power of the Gantt chart?
At the end of the exercise close down Microsoft Project 2010 by clicking the X in the
top right corner of the screen. Choose not to save the project.