Embed Size (px)
DESCRIPTION
Michael K. Farr November 3, 2008 0 600 800 1,600 1,800 1,000 1,200 1,400 1 0 Source: Bloomberg 20% 30% 40% 0% -50% -40% -30% -20% -10% 2 Source: Bloomberg
Citation preview

0
Overview of US Economy and Stock MarketNovember 3, 2008
Michael K. Farr

1
Where We’ve Been
Source: Bloomberg
S&P 500
0
200
400
600
800
1,000
1,200
1,400
1,600
1,800
Jan-96
Jan-97
Jan-98
Jan-99
Jan-00
Jan-01
Jan-02
Jan-03
Jan-04
Jan-05
Jan-06
Jan-07
Jan-08

2
Where We’ve Been
Volatility Rules! Nevertheless, investors in the S&P 500 have realized an average annualized total return of about 5% since the end of 1995.
Source: Bloomberg
Returns on the S&P 500 Index, Including Dividends
-50%
-40%
-30%
-20%
-10%
0%
10%
20%
30%
40%
1996 1997 1998 1999 2000 2001 2002 2003 2004 2005 2006 2007 2008YTD

3
Economic Backdrop
1) Oversold from the 2000-2002 market correction
2) Increased investor appetite for risk, which was a function of global liquidity
3) Collapse in bank lending standards, which led to bubbles in housing and consumer credit
4) Consumer spending binge driven in part by housing boom
5) Outsized earnings growth resulting from margin expansion
6) Strong rally in commodity-related stocks due to 5%+ global economic growth
What Drove the Stock Market Higher From 2003-2007?
Low Interest Rates Were the Key!!!

4
Economic Backdrop
Higher Home Prices Benefited the Economy in Numerous Ways…
“Wealth Effect”
Cash-Out Refinancings
Home Appreciation
Replaced Retirement
Savings
Job Creation in
Construction, Finance, and
Other
+ + +
=
Robust Consumer Spending$ $

5
Economic Backdrop
But the Bursting of the Housing Bubble Has Left Us with A Severe Hangover…
1) Housing Price Declines• Foreclosures• Inventories of homes for sale• Sales of new & existing homes • New home construction
2) Diminished Access to ALL TYPES of Consumer Credit• Tighter bank lending standards in response to higher credit losses• Discontinuation of exotic mortgage products such as pay-option ARMs• Banks conserving capital due to mortgage-related write-offs• Dislocation in securitization market• Increased regulatory oversight
3) Rising Unemployment in Response to Lower Consumer Demand• Consumer spending accounts for 70% of GDP• Reduced consumer demand causing companies to rationalize expenses through layoffs
4) Federal Government Intervention Opportunities Limited• Higher deficits• Running out of room to cut rates (Fed funds currently stands at 1.5%)• Entitlement spending increases loom• Higher interest rates in the future?
5) Credit/Liquidity Crisis

6
Economic Backdrop
What Were the Causes of the Credit/Liquidity Crisis?
1. Lack of Effective Bank Regulatory Oversight• Banks extended loans borrowers could not afford (ARM’s, option ARM’s, interest-only, no doc, etc)
• Leverage at investment banks and other finance companies (AIG)
• Proliferation of derivatives such as Credit Default Swaps (CDS)
2. Developments in the Securitization Markets• Banks no longer retained credit risk for loans they made
• Lending standards broke down
3. Federal Reserve Flooded the System with Liquidity For Too Long• Fed held interest rates below 2% for 3 full years (2002-2004) after the technology bubble burst
• Borrowers of all stripes increased debt loads
• Investors seeking higher yields embraced complex mortgage-backed bonds and failed to perform due diligence
4. Greed and Malfeasance by Executives and Financial Services Firms• Despite clear warning signs, banks and investment banks continued to underwrite and securitize bad loans, and
continued to sponsor leveraged buyouts doomed to failure
7
Economic Backdrop
Corporate Malfeasance
“When the music stops, in terms of liquidity, things will be complicated. But as long as the music is playing, you’ve got to
get up and dance. We’re still dancing.”
- Chuck Prince, former CEO of Citigroup on July 9, 2007
8
Economic Backdrop
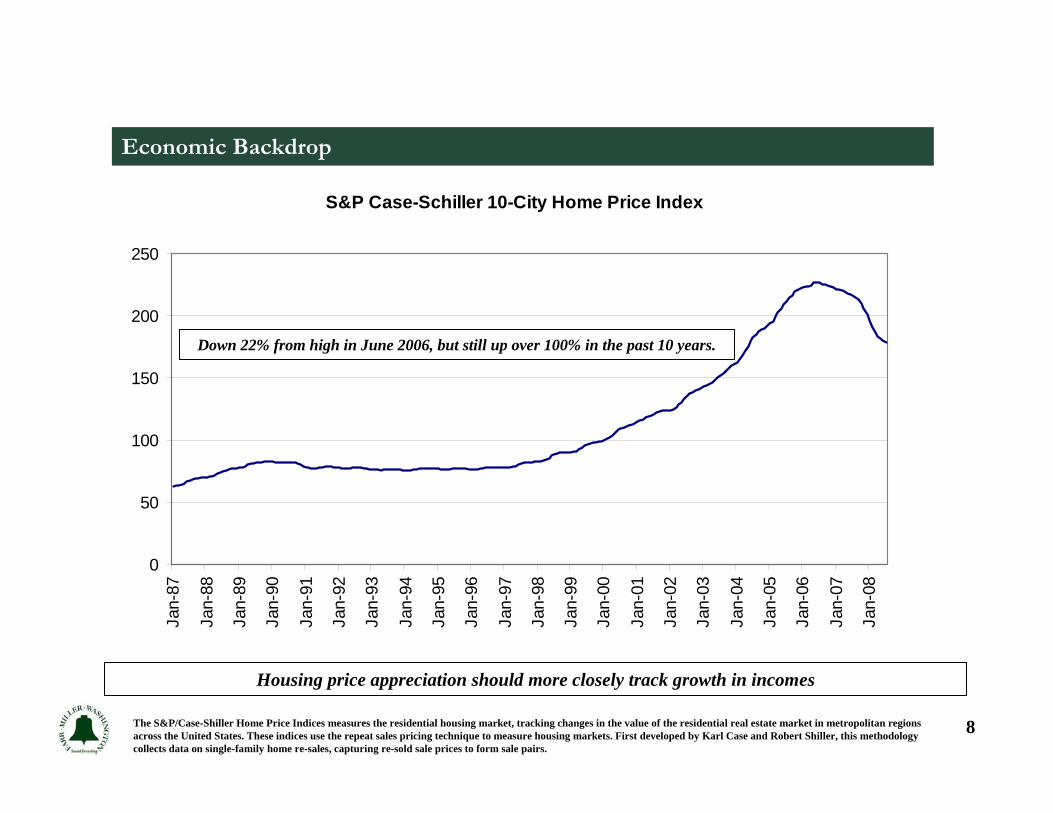
S&P Case-Schiller 10-City Home Price Index
0
50
100
150
200
250
Jan-
87
Jan-
88
Jan-
89
Jan-
90
Jan-
91
Jan-
92
Jan-
93
Jan-
94
Jan-
95
Jan-
96
Jan-
97
Jan-
98
Jan-
99
Jan-
00
Jan-
01
Jan-
02
Jan-
03
Jan-
04
Jan-
05
Jan-
06
Jan-
07
Jan-
08
The S&P/Case-Shiller Home Price Indices measures the residential housing market, tracking changes in the value of the residential real estate market in metropolitan regions across the United States. These indices use the repeat sales pricing technique to measure housing markets. First developed by Karl Case and Robert Shiller, this methodology collects data on single-family home re-sales, capturing re-sold sale prices to form sale pairs.
Down 22% from high in June 2006, but still up over 100% in the past 10 years.
Housing price appreciation should more closely track growth in incomes

9
Economic Backdrop
Home Sales Have Dropped Sharply
Source: Bloomberg
Existing Home Sales
4
5
6
7
8
Jun-
01
Dec
-01
Jun-
02
Dec
-02
Jun-
03
Dec
-03
Jun-
04
Dec
-04
Jun-
05
Dec
-05
Jun-
06
Dec
-06
Jun-
07
Dec
-07
Jun-
08
New Home Sales
250
500
750
1000
1250
1500
Jun-
01
Dec
-01
Jun-
02
Dec
-02
Jun-
03
Dec
-03
Jun-
04
Dec
-04
Jun-
05
Dec
-05
Jun-
06
Dec
-06
Jun-
07
Dec
-07
Jun-
08

10
Economic Backdrop
Foreclosures are Surging as Loans Reset and Prices Fall
Source: Bloomberg
Loans in Foreclosure As a % of Total Residential Loans Outstanding
0.0%
0.5%
1.0%
1.5%
2.0%
2.5%
3.0%
Mar
-93
Mar
-94
Mar
-95
Mar
-96
Mar
-97
Mar
-98
Mar
-99
Mar
-00
Mar
-01
Mar
-02
Mar
-03
Mar
-04
Mar
-05
Mar
-06
Mar
-07
Mar
-08

11
Economic Backdrop
And the Growing Supply of Houses for Sale Foretells Further Price Declines Ahead…
Source: Bloomberg
Existing Home Sales Months Supply
0
2
4
6
8
10
12
Jan-0
0Ju
l-00
Jan-0
1Ju
l-01
Jan-0
2Ju
l-02
Jan-0
3Ju
l-03
Jan-0
4Ju
l-04
Jan-0
5Ju
l-05
Jan-0
6Ju
l-06
Jan-0
7Ju
l-07
Jan-0
8Ju
l-08

12
Economic Backdrop
Housing Prices are Now Adjusting for the several years in which they grew faster than incomes.
Source: Bureau of Economic Analysis and S&P Case-Shiller.
Growth in Personal Income & Housing Prices
-20%
-15%
-10%
-5%
0%
5%
10%
15%
20%
1988
1991
1994
1997
2000
2003
2006
Personal Income
Housing Prices

13
Economic Backdrop
In Anticipation of Weaker Growth, the Fed Has Been Easing…But Longer Term Treasurys have Decoupled
Source: Bloomberg
Yield on 10-Year Treasury and Fed Funds Target Rate
1.0%
2.0%
3.0%
4.0%
5.0%
6.0%
1/6/
2006
3/6/
2006
5/6/
2006
7/6/
2006
9/6/
2006
11/6
/200
6
1/6/
2007
3/6/
2007
5/6/
2007
7/6/
2007
9/6/
2007
11/6
/200
7
1/6/
2008
3/6/
2008
5/6/
2008
7/6/
2008
9/6/
2008

14
Economic Backdrop
Mortgage Rates are Not Going Down (Despite Aggressive Action by the Federal Reserve and US Treasury), Reflecting Banks’ Reluctance to Lend
Source: Bloomberg
30-Year Mortgage Spreads
0.0%
1.0%
2.0%
3.0%
4.0%
5.0%
1/6/
2006
3/6/
2006
5/6/
2006
7/6/
2006
9/6/
2006
11/6
/200
6
1/6/
2007
3/6/
2007
5/6/
2007
7/6/
2007
9/6/
2007
11/6
/200
7
1/6/
2008
3/6/
2008
5/6/
2008
7/6/
2008
9/6/
2008
Spread to 10-Year TreasurySpread to Fed Funds

15
Economic Backdrop
Source: Bureau of Economic Analysis.
In the Absence of Home Price Appreciation, the Consumer Must Start Saving Again
Personal Savings as a Percentage of Disposable Personal Income
-2%
0%
2%
4%
6%
8%
10%
12%
14%
197
0-I
197
1-III
197
3-I
197
4-III
197
6-I
197
7-III
197
9-I
198
0-III
198
2-I
198
3-III
198
5-I
198
6-III
198
8-I
198
9-III
199
1-I
199
2-III
199
4-I
199
5-III
199
7-I
199
8-III
200
0-I
200
1-III
200
3-I
200
4-III
200
6-I
2007
-III

16
Economic Backdrop
Source: Bloomberg
Partially in Response to the Drop in Home Prices, Consumer Confidence Has Been Falling and Now Stands at Close to Multi-Year Lows
Consumer Confidence
40
50
60
70
80
90
100
110
120
Dec-01
Apr-02
Aug-02
Dec-02
Apr-03
Aug-03
Dec-03
Apr-04
Aug-04
Dec-04
Apr-05
Aug-05
Dec-05
Apr-06
Aug-06
Dec-06
Apr-07
Aug-07
Dec-07
Apr-08
Aug-08

17
Economic Backdrop
Source: Federal Reserve and Bloomberg.
Debt Has Been Growing Much Faster Than Incomes
Growth Rates in Personal Income and Total Consumer Debt
0%
2%
4%
6%
8%
10%
12%
14%
16%
18%
Mar
-81
Mar
-83
Mar
-85
Mar
-87
Mar
-89
Mar
-91
Mar
-93
Mar
-95
Mar
-97
Mar
-99
Mar
-01
Mar
-03
Mar
-05
Mar
-07
Total consumer debt includes mortgage debt, revolving debt, and non-revolving installment debt.

18
Economic Backdrop
Source: Federal Reserve.
And Debt Servicing Has Become a Much Bigger Burden on Household Budgets
Household Debt Service Ratio
10%
11%
12%
13%
14%
15%
1980
1981
1982
1983
1984
1985
1986
1987
1988
1989
1990
1991
1992
1993
1994
1995
1996
1997
1998
1999
2000
2001
2002
2003
2004
2005
2006
2007
2008
The Household Debt Service Ratio is an estimate of the ratio of debt payments to disposable personal income. Debt payments consist of the estimated requirements on outstanding mortgage and consumer debt.

19
Economic Backdrop
Source: Bloomberg
Also Partially as a Result of Housing, the Economy’s Ability to Generate New Jobs Has Deteriorated
Change in Non-Farm Payrolls and Unemployment Rate
-300
-200
-100
0
100
200
300
400
Dec-01
Dec-02
Dec-03
Dec-04
Dec-05
Dec-06
Dec-07
(000
's)
0.0%
1.0%
2.0%
3.0%
4.0%
5.0%
6.0%
7.0%
Change in Non-farm Payrolls (left)Unemployment Rate (right)

20
Economic Backdrop
1. Credit Crunch Ongoing2. Consumer Confidence & Spending Weakening3. Housing Price Deflation Continues4. Unemployment Rising5. Access to Capital Markets Shut Off6. Consumer Lending Standards Tightening7. Endless Government Intervention
• TAF• Bailouts of individual firms• Increase in FDIC insurance• Money market and CP support• Tax cuts• TARP ($700 billion)• Direct investments in US banks• Guarantee interbank loans???
The Result: Stocks Have Fallen 39% from their Highs in October 2007
= Recession
So Where Are We Now?

21
Economic Backdrop
Recessions:
• Recessions are defined by the National Bureau of Economic Research (NBER) as “a significant decline in economic activity spread across the economy, lasting more than a few months, normally visible in real GDP, real income, employment, industrial production, and wholesale-retail sales .”
• Recessions are usually officially declared well after the fact (a few months) by the NBER
• We believe we already are in a recession

22
Economic Backdrop
Source: National Bureau of Economic Research.

23
Economic Backdrop
Source: Graphs taken from SeekingAlpha.com using National Bureau of Economic Research data.
Recessions have been getting shorter, and expansions have been getting longer…
Federal Government and Federal Reserve have more tools and have learned how to address problems earlier.

24
Stock Market Outlook
Source: Van Kampen Investments using data from Ned Davis Research, 2008.
The average US recession since the late 1940s has lasted 10 months, and stocks typically hit their low point about three months before the recession ends.

25
Stock Market Outlook
Source: Dividend Growth Investor.
A “Bear Market” is typically defined as the period of time beginning with a 20% decline in the market and ending when the market bottoms out and begins heading up again.
Investors appear to have gotten ahead of the recession this time.
Intra-day low on Oct 10

26
Stock Market Outlook
Source: Fidelity Investments.
Is now one of these times???
Three Best Periods to Enter the US Stock Market Since 1926

27
Stock Market Outlook
Are Stocks Attractive Now?
Low Interest Rates and Reasonable Valuations Provide a Favorable Backdrop for When Credit Conditions Improve
Earnings estimates are still way too high, but we still see a lot of value at these levels…
Compare to yield on 10-year Treasury
Bond of about 3.7%

28
Stock Market Outlook
1. Stocks were not in bubble territory before this decline began – the bubbles were in the housing and credit markets
2. The 40% decline in stocks so far since October 2007 already exceeds the average bear market decline over the past 80+ years
3. Stocks generally bottom out before a recession ends (3 months, on average) and historical returns from this bottoms have been outstanding
4. Warren Buffett is buying right now
5. A decade of suffering like the Great Depression is unlikely because the federal government has learned from its mistakes and has too many tools at its disposal (deposit insurance, aggressive fiscal and monetary policy)
Reasons for Optimism:

29
Stock Market Outlook
1. Nobody can effectively time the markets
2. Stocks have outperformed every major asset class over any 20 year period
3. Long-term investors are very likely to be rewarded, but only if they stay invested
Bottom Line:

30
Stock Market Outlook
“We simply attempt to be fearful when others are greedy and to be greedy only when others are fearful.”
- Warren Buffett, widely considered the greatest investor of our time

31
Stock Market Outlook
Source: Active Value Investing: Making Money in Range-Bound Markets, by Vitality Katsenelson.
But a Reversion to the Mean for Profit Margins Could Take Time….
32
Stock Market Outlook
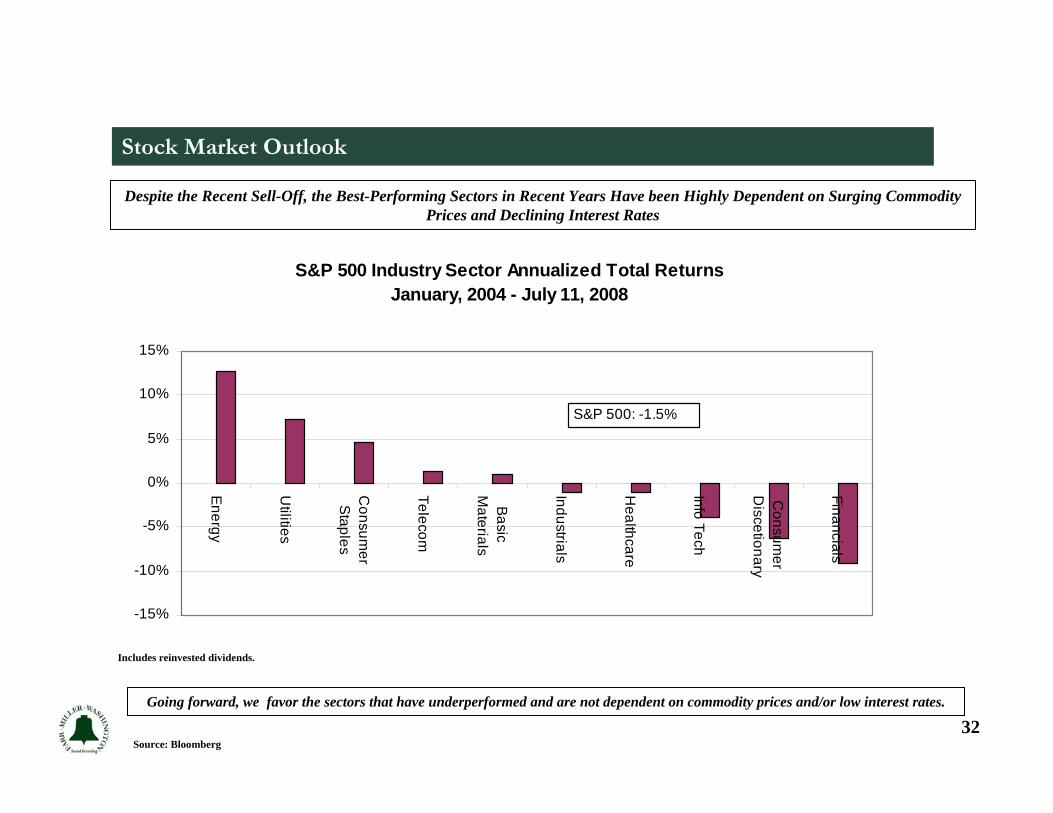
Despite the Recent Sell-Off, the Best-Performing Sectors in Recent Years Have been Highly Dependent on Surging Commodity Prices and Declining Interest Rates
Going forward, we favor the sectors that have underperformed and are not dependent on commodity prices and/or low interest rates.
Source: Bloomberg
Includes reinvested dividends.
S&P 500 Industry Sector Annualized Total ReturnsJanuary, 2004 - July 11, 2008
-15%
-10%
-5%
0%
5%
10%
15%
Energy
Utilities
Consum
erStaples
Telecom
Basic
Materials
Industrials
Healthcare
Info Tech
Consum
erD
iscetionary
Financials
S&P 500: -1.5%

33
Stock Market Outlook
In This Environment, We Continue to Favor Companies with…
• Outstanding Track Records and Defensible Market Positions
• Highly Visible Earnings and Cash Flow
• Exposure to International Markets
• Seasoned Management Teams
• No Dependence on Commodity Price Increases or Falling Interest Rates
• Rock-Solid Balance Sheets (Low debt, no dependence on capital markets financing)
Surprisingly, These Types of Quality Companies Have Been Underperforming the Market for Years!!!