Embed Size (px)
Citation preview

M&G Dynamic Allocation FundInterim Long Report and unaudited Financial Statements for the six months ended 30 September 2017

Contents
M&G Dynamic Allocation Fund
Authorised Corporate Director’s Report Page 1
Financial highlights Page 8
Financial statements and notes Page 14
Directors’ statement Page 14
Other regulatory disclosures Page 15
Glossary Page 16

The Authorised Corporate Director (ACD) of M&G Dynamic AllocationFund presents its Interim Long Report and unaudited FinancialStatements for the six months ended 30 September 2017.
Please note that we have included an explanation of key investmentterminology in the ‘Glossary’ (at the back of this report).
Company information
This Open-Ended Investment Company (OEIC) is an InvestmentCompany with Variable Capital (ICVC) incorporated under the Open-Ended Investment Companies Regulations 2001. It is authorised andregulated by the Financial Conduct Authority (FCA) under theFinancial Services and Markets Act 2000. The Company is a UCITS(Undertakings for Collective Investment in Transferable Securities)scheme as defined in the Collective Investment Schemessourcebook, as issued (and amended) by the FCA.
The Company was authorised on 22 October 2009 and the fund waslaunched on 3 December 2009.
The Company’s principal activity is to carry on business as an OEIC.
A shareholder is not liable for the debts of the Company and will neverbe liable to make any further payment to the Company after payingthe purchase price of the shares.
Co-fund managers
Juan Nevado & Tony Finding are employed by M&G Limited whichis an associate of M&G Securities Limited.
ACDM&G Securities Limited, Laurence Pountney Hill, London EC4R 0HH, UKTelephone: 0800 390 390 (UK only)
(Authorised and regulated by the Financial Conduct Authority. M&GSecurities Limited is a member of the Investment Association andof the Tax Incentivised Savings Association.)
Directors of the ACDW J Nott (Chief Executive),G N Cotton, N M Donnelly*, P R Jelfs, G W MacDowall, L J Mumford
* Appointed 9 June 2017.
Investment manager M&G Investment Management Limited, Laurence Pountney Hill, London EC4R 0HH, UKTelephone: +44 (0)20 7626 4588
(Authorised and regulated by the Financial Conduct Authority)
RegistrarDST Financial Services Europe Ltd*, DST House, St. Nicholas Lane, Basildon, Essex SS15 5FS, UK
(Authorised and regulated by the Financial Conduct Authority)
* International Financial Data Services (UK) Ltd changed its name to DST Financial
Services Europe Ltd on 14 August 2017.
DepositaryNational Westminster Bank Plc, Trustee & Depositary Services,Younger Building, 3 Redheughs Avenue, Edinburgh EH12 9RH, UK
(Authorised by the Prudential Regulation Authority and regulated bythe Financial Conduct Authority and the Prudential RegulationAuthority)
Independent auditorErnst & Young LLPTen George Street, Edinburgh EH2 2DZ, UK
Investor information
The Prospectus, Instrument of Incorporation, Key Investor InformationDocuments, the latest Annual or Interim Investment Report andFinancial Statements as well as a list of purchases and sales areavailable free of charge on request from the following addresses. TheInstrument of Incorporation can also be inspected at our offices or atthe office of the Depositary.
Customer services and administration for UK clients:M&G Securities Limited,PO Box 9039, Chelmsford CM99 2XG, UK
Please remember to quote your name and M&G client reference andsign any written communication to M&G. Failure to provide this willaffect your ability to transact with us.
Telephone: 0800 390 390 (UK only)
For security purposes and to improve the quality of our service, wemay record and monitor telephone calls. You will require your M&Gclient reference. Failure to provide this will affect your ability to transactwith us.
Customer services and administration for non-UK clients:M&G Securities Limited,c/o RBC I&TS, 14, Porte de France, L-4360 Esch-sur-Alzette, Grand Duchy of Luxembourg
Please remember to quote your name and M&G client reference andsign any written communication to M&G. Failure to provide this willaffect your ability to transact with us.
Telephone: +352 2605 9944Email: [email protected]
For security purposes and to improve the quality of our service, wemay record and monitor telephone calls. You will require your M&Gclient reference. Failure to provide this will affect your ability to transactwith us.
Austrian paying and information agent:Société Générale, Vienna Branch, Prinz Eugen-Strasse 8-10/5/Top 11, 1040 Wien, Austria
Belgian financial agent:Société Générale Private Banking NV, Kortrijksesteenweg 302, 9000 Gent, Belgium
Danish representative agent:Nordea Bank Danmark A/S, Client Relations DK, Investor Services & Solutions,Postbox 850, Reg.no.6428. HH. 6.1., 0900 København C, Denmark
1
M&G Dynamic Allocation Fund Authorised Corporate Director’s Report
INTERIM LONG REPORT AND UNAUDITED FINANCIAL STATEMENTS • September 2017

French centralising agent:RBC Investor Services, Bank France S.A.,105 rue Réaumur, 75002 Paris, France
German information agent:M&G International Investments Limited,mainBuilding, Taunusanlage 19, 60325 Frankfurt am Main, Germany
Greek paying agent and distributor:Eurobank Ergasias S.A.,8, Othonos Street, 10557 Athens, Greece
Irish facilities agent:Société Générale S.A., Dublin Branch,3rd Floor IFSC House – The IFSC, Dublin 1, Ireland
Italian paying agents:Allfunds Bank, S.A., Via Santa Margherita 7, 20121 Milano, Italy
Banca Monte dei Paschi di Siena S.p.A., Piazza Salimbeni 3, 53100 Siena, Italy
Banca Sella Holding S.p.A.,Piazza Gaudenzio Sella 1, 13900 Biella, Italy
BNP PARIBAS Securities Services,Via Ansperto 5, 20123 Milano, Italy
RBC Investor Services Bank S.A., Milan BranchVia Vittor Pisani 26, 20124 Milano, Italy
State Street Bank S.p.A., Via Ferrante Aporti 10, 20125 Milano, Italy
Société Générale Securities Services S.A., Via Benigno Crespi 19A - MAC 2, 20159 Milano, Italy
Luxembourg paying and information agent:Société Générale Bank & Trust S.A., Centre operationel, 28-32, place de la Gare, 1616 Luxembourg,Grand Duchy of Luxembourg
Portuguese distributor:Best - Banco Electrónico de Serviço Total, S.A., Praça Marquês de Pombal, no. 3 - 3º, 1250-161 Lisboa, Portugal
Spanish representative:Allfunds Bank, S.A., Calle Estafeta, No 6 Complejo Plaza de la Fuente, La Moraleja 28109, Alcobendas, Madrid, Spain
Swedish paying agent:Nordea Bank AB (publ), Smålandsgatan 17, 105 71 Stockholm, Sweden
Swiss paying agent and representative:Société Générale, Paris, Zurich Branch, Talacker 50, P.O. Box 5070, 8021 Zurich, Switzerland
Authorised Corporate Director’sResponsibilities
The Authorised Corporate Director (ACD) is required to prepare annualand interim long reports for the Company. The ACD must ensure thatthe financial statements, contained in the Long Report, for the fundare prepared in accordance with the Investment Association Statementof Recommended Practice for Financial Statements of UK AuthorisedFunds (SORP) and UK Financial Reporting Standards, and give a trueand fair view of the net revenue or expenses and net capital gains orlosses for the accounting period, and the financial position at the endof that period.
The ACD is required to keep proper accounting records, and to managethe Company in accordance with the Collective Investment Schemessourcebook, as issued (and amended) by the FCA, the Instrument ofIncorporation and the Prospectus, and to take reasonable steps for theprevention and detection of fraud or other irregularities.
2
M&G Dynamic Allocation Fund Authorised Corporate Director’s Report
INTERIM LONG REPORT AND UNAUDITED FINANCIAL STATEMENTS • September 2017
Investor information

Investment objective
The fund aims to deliver positive total returns in any three year periodfrom a flexibly managed portfolio of global assets. There is noguarantee that the Fund will achieve a positive return over this, or anyother, period and investors may not recoup the original amount theyinvested.
Investment policy
The fund invests in multiple asset classes and is managed through theallocation of capital based on the fund manager’s macroeconomicoutlook, asset class valuations and active risk management in portfolioconstruction. The Fund is not managed against any market index.
Depending on the fund manager’s view of market conditions andrelative asset valuations, at any one time the portfolio may bediversified across asset classes, sectors, currencies and countries, ormay have a high concentration in one or more of these.
The fund seeks to participate in a variety of rising asset values; intimes of severe market uncertainty, however, capital preservation willbe central to the Fund’s strategy. The fund manager may usederivatives strategies to create value through additional assetexposure and/or where these may help to manage portfolio risk.
Whilst the fund aims to deliver positive total returns in any three yearperiod there is no guarantee that this will be achieved.
The fund may invest in a range of equities, fixed income assets andother assets, including collective investment schemes, othertransferable securities, cash and near cash, deposits, warrants andmoney market instruments. Derivatives may also be used, for bothhedging and investment purposes.
Investment approach
The fund managers believe that the fund’s highly flexible investmentapproach has the potential to deliver returns of 5-10% per annum onaverage over the medium term (over three to five years), withannualised volatility in those returns of between 5% and 12%.(Volatility measures the degree to which a given security, fund, or indexrapidly changes. It is calculated as the degree of deviation from thenorm for that type of investment over a given time period. The higherthe volatility, the riskier the security tends to be.)
The fund will normally invest within the following net allocation ranges:20-60% in equities, 0-80% in fixed income securities (excluding cashand cash equivalents) and up to 20% in other assets, which caninclude indirect exposure to property and convertibles (fixed incomeinvestments that have the right to be converted into a predeterminednumber of company shares). The fund managers will actively managethe fund’s foreign currency exposure to seek to enhance returns. Atleast 30% of the fund will be held in euro assets and at least 60% willbe held in a combination of US dollar, sterling and euro assets. Thefund’s investment strategy may involve the use of financial instrumentsto take short positions, that is, positions that profit from a fall in theprice of an asset, or to generate leverage (gain exposure to greaterinvestment than the net asset value of the fund).
Risk profile
The fund invests globally in a broad range of assets, includingcompany shares (equities), fixed income securities (bonds), currenciesand other assets such as property shares and convertible bonds. Thefund is, therefore, subject to the price volatility of global financial andcurrency markets. Exposure to the different asset classes is typicallygained through the use of derivatives.
In association with the use of derivatives, including those instrumentsnot traded through an exchange, collateral is deposited in order tomitigate the risk that a counterparty may default on its obligations orbecome insolvent.
The fund adopts a flexible approach to the allocation of capitalbetween asset classes in response to changes in economic conditionsand the valuation of assets, and the managers will seek to maximiseportfolio diversity wherever possible. However, in cases where themanagers believe that the opportunities are limited to a few areas,there may be a higher-than-usual concentration of asset or marketexposure. Such strategies may result in higher volatility of the fund’sshort-term performance.
The blend of assets held in the fund is regularly adjusted dependingon where the managers see the most value and to manage risks,including liquidity, credit, currency and market risks. The fund’s risksare measured and managed as an integral part of the investmentprocess.
The following table shows the risk number associated with the fundand is based on Euro Class ‘A’ shares.
The above number:
• is based on the rate at which the value of the fund has moved up and down in the
past and is based on historical data so may not be a reliable indicator of the future
risk profile of the fund.
• is not guaranteed and may change over time and the lowest risk number does not
mean risk free.
• has not changed during this period.
Investment review
As at 2 October 2017, for the six months ended 30 September 2017
Performance against objective
Between 3 April 2017 (the start of the review period) and 2 October2017, the M&G Dynamic Allocation Fund delivered a positive totalreturn (the combination of income and growth of capital) across all ofits share classes.*
* For the performance of each share class, please refer to the ‘Long-term
performance by share class’ table in the ‘Fund performance’ section of this report.
Over a three-year period, the fund has achieved its aim of delivering apositive total return.
Low risk High risk
Typically lower rewards Typically higher rewards
1 2 3 4 5 6 7
INTERIM LONG REPORT AND UNAUDITED FINANCIAL STATEMENTS • September 2017 3
M&G Dynamic Allocation Fund Authorised Corporate Director’s Report

Investment performance
Global equities advanced over the six-month period under review,supported by an upswing in global economic data and companyearnings. This is providing a positive backdrop for assets such ascompany shares, which tend to do well when the global economy isgrowing, but can experience a degree of turbulence amid marketuncertainty. However, global bond markets experienced mixedperformance as growing investor confidence saw bonds issued bysome developed market governments at times fall out of favour. Thesebonds are often considered ‘safe’ given the high creditworthiness oftheir issuers, and therefore tend to underperform when investorsentiment over the health of the global economy improves, as theirlower-risk attributes are less in demand. This environment largelyproved beneficial for the fund which was positioned in favour of equitiesover bonds, based on observations of relative valuation signals andsigns of global economic growth.
Most of the gains came from equity positions, where notable value wasadded through positions in Asia Pacific ex Japan, in particular SouthKorea, which held up well despite political turbulence in the regiontowards the end of the period. Our exposure to Europe also addedsignificantly to gains as the region saw concerted economic growth.Holdings of banking stocks generated good returns as well, whileJapanese equities rallied as corporate confidence improved. Shortexposure (a position designed to benefit from a fall in the value of thestocks) to the S&P 500 Index detracted as the index reached new highs.
The fund’s exposure to bonds detracted from performance as investorsbecame more confident about taking on risk. The fund’s positioningdesigned to gain from a fall in the value of bonds issued by theWestern governments detracted from performance, as these marketsbenefited from several periods of strength throughout the period.Holdings of emerging market government bonds also detracted, withthe exception of Mexico. However, exposure to peripheral Europeancountries Poland and Portugal helped returns.
Currency positioning gave a further boost to fund returns, in relationto phases of both euro and dollar weakness during the period.Meanwhile, the exposure to convertibles detracted.
Investment activities
By the end of the review period, we had increased the extent to whichthe fund is positioned in favour of equities versus bonds. This wasimplemented by increasing positions designed to benefit from lossesin bond markets as well as those designed to benefit from gains inequity markets. In the latter stages of the quarter, changes focusedon realising profits on positions that had worked well, while retainingthe focus of the fund on exploiting the still-elevated difference invaluation between equities and bonds. In our view, many stockmarketsappear cheaply valued while developed government bond marketsseem expensive and vulnerable to price falls.
Specifically, European and US equity positions were increased, whilethe portfolio was increasingly positioned away from US governmentbonds. We reduced positions in Latin American bonds after strongperformance left them offering somewhat less value than previously.Some proceeds were reinvested in the new M&G (Lux) EmergingMarkets Hard Currency Bond Fund, giving us access to emerging
bond markets, and making use of M&G’s fixed interest team’s creditexpertise. Meanwhile the fund’s holdings of corporate bonds in themining sector were sold in favour of a basket of shares in large miningcompanies. This was to take advantage of what we believed wasunwarranted weakness in the share prices of miners and to diversifyexposure to the natural resources sector. We also reduced stakes inthe shares of businesses in the oil and gas industry.
Outlook
Despite potentially unsettling newsflow about politics and policy actiondominating headlines over the review period, global economic indicatorshave broadly improved. Economic data in the US remains robust,although investors are generally finding this less surprising than in thepast. This means there is perhaps less potential for substantial gains inparts of the US market where share prices are already reflecting thispositive economic backdrop. Importantly though, for the first time inmany years, we are witnessing a synchronised upswing in global growth,with much of the good news coming from outside the US.
In Europe, positive data on factors such as employment seems to beoutweighing political risks for now, and the European Central Bank hasso far maintained a very supportive policy stance. The UK has seensome slightly weaker figures lately, but these are small changes and not,in our view, signs of a material deterioration in current economicconditions – we are certainly wary of commentary attributing it to theJune 2017 general election or ongoing Brexit issues. Meanwhile, in Asia,markets such as South Korea and China are showing sustained growth.
Improving global economic activity and the potential for this to triggerhigher inflation means we have observed a shift in tone from developedmarket central bankers, suggesting increased aversion to the low ornegative interest rates they have used in recent years to tackle theaftermath of the 2008 financial crisis. There are also signs of a pick-up in consumer and business sentiment. We believe this is veryimportant as, despite evidence of robust global economic recovery,persistent pessimism has weighed on the sustainability of the growthoutlook since 2008. In other words, consumers and businesses needto believe that economic conditions are genuinely improving in orderto be encouraged to spend and invest more, in order to stimulatefurther growth.
For now, we remain positive on company shares overall as we believe,despite the recent rise in prices, these assets continue to offer the bestcompensation for genuine risk in terms of the compelling prices atwhich they can be bought, in the context of an improving economicenvironment. Meanwhile, the unattractiveness of developed marketgovernment bonds also remains a key area of opportunity, in our view,enabling us to establish positions designed to benefit from lower prices.
Juan Nevado & Tony FindingCo-fund managers
Employees of M&G Limited which is an associate of M&G Securities Limited.
Please note that the views expressed in this Report should not be taken as a
recommendation or advice on how the fund or any holding mentioned in the Report
is likely to perform. If you wish to obtain financial advice as to whether an investment
is suitable for your needs, you should consult a Financial Adviser.
INTERIM LONG REPORT AND UNAUDITED FINANCIAL STATEMENTS • September 20174
M&G Dynamic Allocation Fund Authorised Corporate Director’s Report
Investment review

Investments
Classification of investments
Source: M&G
30 September 2017
31 March 2017
% of the fund value(net assets attributable to shareholders)
2.02%
0.08%
2.54%
0.06%
1.60%
0.09%
0.25%
3.57%
12.55%
4.40%
15.01%
14.44%
2.25%
16.24%
0.99%
1.32%
9.74%
0.41%
-0.19%
0.27%
0.97%
0.01%
1.74%
0.09%
0.87%
0.08%
1.10%
0.10%
0.22%
1.24%
9.91%
4.87%
16.79%
4.59%
2.22%
14.05%
9.79%
2.67%
20.01%
0.61%
0.30%
-0.13%
1.42%
0.00%
Equity portfolios
Equities
Finland
Japan
Norway
Russia
Switzerland
Turkey
United Kingdom
United States
Bond portfolios
Debt securities
‘AAA’ credit rated bonds
‘AA’ credit rated bonds
‘A’ credit rated bonds
‘BBB’ Credit rated Bonds
‘BB’ credit rated bonds
‘B’ credit rated bonds
Cash deposits
Equity index futures
Forward currency contracts
Interest rate futures
Interest rate swaps
Forward currency contracts for share class hedging
Portfolio statement
as at 30.09.17 30.09.17 31.03.17Holding €’000 % %
Equity portfolios 119,666 2.02 1.74 180,369,233 M&G Japan Fund Sterling Class ‘A’ (Accumulation) 119,666 2.02
Equities 1,225,684 20.74 13.61 Finland 4,739 0.08 0.09 945,853 Nokia 4,739 0.08
Japan 150,351 2.54 0.87 7,014,500 Mitsubishi UFJ Financial 38,571 0.65
24,760,000 Mizuho Financial Group 36,702 0.62
1,147,700 Sumitomo Mitsui Financial 37,309 0.63
1,236,300 Sumitomo Mitsui Trust Holdings 37,769 0.64
Norway 3,540 0.06 0.08 215,583 Aker BP 3,540 0.06
Russia 94,690 1.60 1.10 658,509 Lukoil ADR 29,499 0.50
224,024 Magnit GDR 7,659 0.13
2,901,862 Sberbank of Russia ADR 34,856 0.59
1,789,459 Severstal GDR 22,676 0.38
Switzerland 5,040 0.09 0.10 82,347 ams 5,040 0.09
Turkey 14,587 0.25 0.22 6,070,322 Haci Omer Sabanci (formerly Sabanci Holdings) 14,587 0.25
United Kingdom 210,842 3.57 1.24 2,042,543 Anglo American 30,835 0.52
1,939,608 BHP Billiton 29,083 0.49
7,491,250 Glencore 29,132 0.49
945,497 John Wood Group 7,311 0.13
92,157,722 Lloyds Banking Group 70,466 1.19
750,215 Rio Tinto 29,553 0.50
556,090 Royal Dutch Shell 14,462 0.25
United States 741,895 12.55 9.91 265,600 AbbVie 19,996 0.34
6,100 Alphabet 4,980 0.08
902,865 American Express 68,883 1.17
112,600 Amgen 17,676 0.30
169,800 Anadarko Petroleum 7,024 0.12
3,317,917 Bank of America 71,450 1.21
1,515,727 Bank of New York Mellon 68,001 1.15
66,900 Biogen 17,555 0.30
19,900 Bioverativ 956 0.02
147,600 Celgene 17,837 0.30
143,900 Chevron 14,321 0.24
1,153,711 Citigroup 70,931 1.20
60,928 Concho Resources 6,800 0.12
120,800 Criteo ADR 4,242 0.07
33,200 Facebook 4,742 0.08
261,200 Gilead Sciences 17,887 0.30
174,100 Halliburton 6,754 0.11
35,100 IPG Photonics 5,459 0.09
860,824 JPMorgan Chase 69,479 1.18
825,793 Kosmos Energy 5,585 0.10
121,700 Luxoft 4,770 0.08
147,400 MACOM Technology Solutions 5,540 0.09
558,234 MasterCard 66,222 1.12
385,000 Methanex 16,702 0.28
170,200 Microsoft 10,640 0.18
67,700 NXP Semiconductors 6,467 0.11
40,300 Regeneron Pharmaceuticals 14,840 0.25
114,900 Schlumberger 6,726 0.11
129,400 Shire ADR 16,606 0.28
2,964,400 Veon ADR 10,263 0.17
1,534,116 Wells Fargo 70,424 1.19
442,800 Yandex N.V. 12,137 0.21
INTERIM LONG REPORT AND UNAUDITED FINANCIAL STATEMENTS • September 2017 5
M&G Dynamic Allocation Fund Authorised Corporate Director’s Report

Bond portfolios 260,112 4.40 4.87 2,909,000 M&G (Lux) Emerging Markets Hard Currency Bond Fund Euro Class ‘CI’ (Accumulation) 25,503 0.43
50,924,648 M&G Global Convertibles Fund Class Sterling ‘A’ (Accumulation) 117,322 1.98
926,979 M&G Global Corporate Bond Fund Class Euro ‘C-H’ (Accumulation) 11,060 0.19
861,627 M&G Total Return Credit Investment Fund Euro Class ‘A’ (Accumulation) 98,682 1.67
275,000 SPDR® Barclays 10+ Year US Corporate Bond ETF 7,545 0.13
Debt securities 2,970,309 50.25 50.11 ‘AAA’ credit rated bonds 887,083 15.01 16.79 €83,902,000 Germany (Federal Republic of) 0% 2017 (15 Nov) 83,975 1.42
€83,794,000 Germany (Federal Republic of) 0% 2017 (13 Dec) 83,904 1.42
€167,304,000 Germany (Federal Republic of) 0% 2017 (15 Dec) 167,513 2.84
€41,345,000 Germany (Federal Republic of) 0% 2018 (10 Jan) 41,433 0.70
€166,923,000 Germany (Federal Republic of) 0% 2018 (16 Mar) 167,459 2.83
€166,641,000 Germany (Federal Republic of) 0% 2018 (15 Jun) 167,488 2.84
€87,000,000 Germany (Federal Republic of) 0% 2018 (14 Sep) 87,631 1.48
€86,900,000 Germany (Federal Republic of) 0% 2018 (14 Dec) 87,680 1.48
‘AA’ credit rated bonds 853,828 14.44 4.59 €149,044,959 France (Govt. of) 0% 2017 (25 Oct) 149,108 2.52
€148,791,775 France (Govt. of) 0% 2018 (31 Jan) 149,109 2.52
€87,400,000 France (Govt. of) 0% 2018 (14 Feb) 87,609 1.48
€148,537,278 France (Govt. of) 0% 2018 (24 May) 149,112 2.52
€87,200,000 France (Govt. of) 0% 2018 (15 Aug) 87,648 1.49
$260,067,600 US Treasury 1% 2046 231,242 3.91
‘A’ credit rated bonds 132,792 2.25 2.22 $13,512,000 Amgen 4.663% 2051 12,359 0.21
$10,311,000 Intel 4.9% 2045 10,266 0.17
PLN504,399,000 Poland (Republic of) 2.5% 2026 110,167 1.87
‘BBB’ credit rated bonds 959,892 16.24 14.05 $11,431,000 AT&T 4.5% 2048 8,855 0.15
$13,331,000 AT&T 6.375% 2041 13,157 0.22
$5,966,000 Bank of America 4.25% 2026 5,280 0.09
COP94,961,300,000 Colombia (Republic of) 7.50% 2026 28,880 0.49
$9,408,000 Enel Finance International 6.8% 2037 10,465 0.18
$7,630,000 Energy Transfer Partners 4.05% 2025 6,558 0.11
$10,260,000 Energy Transfer Partners 6.125% 2045 9,453 0.16
$13,429,000 Exelon Generation 5.6% 2042 11,548 0.20
$14,211,000 Express Scripts 4.8% 2046 12,576 0.21
$10,951,000 Ford Motor Company 6.625% 2028 11,124 0.19
$15,203,000 Goldman Sachs Group 6.75% 2037 16,755 0.28
IDR843,320,000,000 Indonesia (Republic of) 8.375% 2024 58,195 0.99
$11,035,000 Kraft Foods Group 6.875% 2039 11,955 0.20
MXN3,804,626,300 Mexico (United Mexican States) 5.75% 2026 164,985 2.79
MXN3,656,563,700 Mexico (United Mexican States) 7.75% 2042 179,819 3.04
$11,389,000 Morgan Stanley 5% 2025 10,525 0.18
$20,660,000 Mylan 5.4% 2043 18,938 0.32
$11,035,000 Perrigo Finance Unlimited 4.9% 2044 9,419 0.16
€97,951,000 Portugal (Republic of) 4.75% 2019 105,710 1.79
€213,709,000 Portugal (Republic of) 4.8% 2020 240,260 4.06
$14,179,000 Time Warner Cable 7.3% 2038 14,940 0.25
$8,920,000 Weyerhaeuser 7.375% 2032 10,495 0.18
‘BB’ credit rated bonds 58,870 0.99 9.79 BRL218,244,000 Brazil (Federal Republic of) 10% 2027 58,870 0.99
‘B’ credit rated bonds 77,844 1.32 2.67 $37,843,000 Argentina (Republic of) 6.875% 2021 34,767 0.59
$35,768,000 Argentina (Republic of) 7.5% 2026 33,888 0.57
$9,980,000 Yum! Brands 6.875% 2037 9,189 0.16
Cash deposits 575,727 9.74 20.01 €140,061,779 HSBC 0.6 % 2017 140,062 2.37
€342,738,565 Rabobank 0.55% 2017 342,738 5.80
€92,927,101 Standard Chartered Bank 0.6% 2017 92,927 1.57
Equity index futures 24,159 0.41 0.61 24,134 BIST 30 Oct 2017 (5,217) (0.09)
2,795 CAC 40 Euro Oct 2017 3,990 0.07
913 DAX Index Dec 2017 7,113 0.12
3,183 EURO STOXX 50 Index Dec 2017 2,807 0.05
2,820 FTSE 100 Index Dec 2017 (1,014) (0.02)
1,559 FTSE MIB Index Dec 2017 3,914 0.07
1,677 IBEX 35 Index Oct 2017 (482) (0.01)
5,434 KOSPI 200 Index Dec 2017 7,386 0.13
5,174 MSCI Taiwan Index Oct 2017 (1,041) (0.02)
(1,171) S&P 500 Index Dec 2017 (10,143) (0.17)
2,536 TOPIX Index Dec 2017 16,846 0.28
Forward currency contracts (11,394) (0.19) 0.30 AUD(163,767,680) Sold for €109,758,343 (expires 29.11.17) 1,457 0.02
INR4,160,908,047 Bought for $64,258,647 (expires 30.11.17) (830) (0.01)
¥19,077,413,466 Bought for €146,961,864 (expires 29.11.17) (3,401) (0.06)
¥(22,891,640,034) Sold for €175,276,507 (expires 29.11.17) 3,013 0.05
MXN(3,148,765,380) Sold for €147,988,653 (expires 29.11.17) 3,298 0.06
£71,099,353 Bought for €77,828,822 (expires 29.11.17) 2,617 0.04
£(15,570,656) Sold for €17,116,348 (expires 29.11.17) (501) (0.01)
TRY268,644,286 Bought for €63,070,922 (expires 29.11.17) (404) (0.01)
$81,594,863 Bought for TWD2,477,464,835 (expires 23.10.17) (158) 0.00
$8,644,259 Bought for CNY61,166,780 (expires 17.11.17) (463) (0.01)
$96,851,198 Bought for €82,032,794 (expires 29.11.17) (294) 0.00
$128,353,908 Bought for PHP6,667,985,531 (expires 29.11.17) (2,112) (0.03)
$103,059,814 Bought for KRW117,341,843,463 (expires 30.11.17) 446 0.01
$103,567,429 Bought for TWD3,129,289,878 (expires 30.11.17) 72 0.00
INTERIM LONG REPORT AND UNAUDITED FINANCIAL STATEMENTS • September 20176
M&G Dynamic Allocation Fund Authorised Corporate Director’s Report
Investments
Portfolio statement (continued)
as at 30.09.17 30.09.17 31.03.17Holding €’000 % %
Portfolio statement (continued)
as at 30.09.17 30.09.17 31.03.17Holding €’000 % %
‘BBB’ credit rated bonds (continued)

$87,730,946 Bought for TWD2,631,928,389 (expires 15.12.17) 527 0.01
$20,919,173 Bought for CNY151,392,052 (expires 22.12.17) (1,517) (0.03)
$31,521,532 Bought for CNY223,724,073 (expires 23.02.18) (1,643) (0.03)
$117,065,823 Bought for CNY828,611,343 (expires 04.04.18) (5,630) (0.10)
$113,872,074 Bought for CNY811,053,848 (expires 08.05.18) (5,963) (0.10)
$29,826,449 Bought for CNY208,993,926 (expires 22.06.18) (1,084) (0.02)
$35,461,941 Bought for CNY244,421,430 (expires 25.07.18) (747) (0.01)
$42,431,040 Bought for CNY286,249,579 (expires 21.09.18) (50) 0.00
$(2,607,521,621) Sold for €2,202,871,149 (expires 29.11.17) 2,228 0.04
$(281,529,736) Sold for €174,900,987 (expires 29.11.17) (255) 0.00
Interest rate futures 16,207 0.27 (0.13) (5,764) 5 Year US Treasury Note Dec 2017 3,939 0.06
(5,443) 10 Year US Treasury Note Dec 2017 7,561 0.13
(1,125) Euro Bund Dec 2017 758 0.01
(1,848) Euro Buxl Dec 2017 2,829 0.05
(1,832) Euro OAT Dec 2017 858 0.01
(1,616) UK Long Gilt Bond Dec 2017 5,134 0.09
1,566 US Ultra Long Treasury Bond Dec 2017 (4,872) (0.08)
Interest rate swaps 57,148 0.97 1.42 ¥3,156,500,000 Pay 0.467% Receive VAR Sep 2046 2,356 0.04
¥3,164,000,000 Pay 0.4975% Receive VAR Sep 2046 2,168 0.04
¥2,463,081,000 Pay 0.80875% Receive VAR Dec 2046 138 0.01
¥2,200,000,000 Pay 0.835% Receive VAR Sep 2047 87 0.00
¥1,500,000,000 Pay 0.865% Receive VAR May 2047 (58) 0.00
¥2,000,000,000 Pay 0.935% Receive VAR Jul 2047 (346) 0.00
¥1,850,000,000 Pay 0.9425% Receive VAR Feb 2047 (354) (0.01)
£23,000,000 Pay 1.0925% Receive VAR Jul 2046 3,371 0.06
£55,500,000 Pay 1.289% Receive VAR Oct 2046 5,110 0.09
£33,800,000 Pay 1.3115% Receive VAR Apr 2047 2,822 0.05
£15,000,000 Pay 1.445% Receive VAR Mar 2047 781 0.01
£15,000,000 Pay 1.471% Receive VAR Aug 2047 648 0.01
£20,000,000 Pay 1.5245% Receive VAR May 2047 522 0.01
£22,500,000 Pay 1.605% Receive VAR Jun 2047 134 0.00
£15,000,000 Pay 1.648% Receive VAR Sep 2047 25 0.00
$76,000,000 Pay 1.793% Receive VAR Jul 2046 9,648 0.16
$30,000,000 Pay 1.8% Receive VAR Jul 2046 3,764 0.06
$90,000,000 Pay 1.837% Receive VAR Jul 2046 10,449 0.18
$50,000,000 Pay 1.964% Receive VAR Oct 2046 4,454 0.07
$150,500,000 Pay 2.1325% Receive VAR Apr 2046 10,014 0.16
$33,000,000 Pay 2.379% Receive VAR Sep 2047 934 0.02
$70,000,000 Pay 2.463% Receive VAR Sep 2047 922 0.02
$12,262,000 Pay 2.697% Receive VAR Dec 2046 (441) (0.01)
Portfolio of investments 5,237,618 88.61 92.54
Forward currency contracts for share class hedging 809 0.01 0.00 £5,627,544 Bought for €6,231,671 (expires 18.10.17) 142 0.00
£(9,122) Sold for €10,339 (expires 18.10.17) 0 0.00
CHF2,426,866 Bought for €2,109,407 (expires 18.10.17) 12 0.00
CHF(19,308) Sold for €16,800 (expires 18.10.17) 0 0.00
$53,442,586 Bought for €44,531,741 (expires 18.10.17) 671 0.01
$(1,204,553) Sold for €1,003,314 (expires 18.10.17) (16) 0.00
Total portfolio 5,238,427 88.62 92.54Net other assets / (liabilities) 672,742 11.38 7.46
Net assets attributable to shareholders 5,911,169 100.00 100.00
All securities are on an official stock exchange listing except where referenced.
Portfolio transactions
for the six months to 30 September 2017 2016Portfolio transactions €’000 €’000
Total purchases 2,214,059 965,993
Total sales 586,370 977,387
INTERIM LONG REPORT AND UNAUDITED FINANCIAL STATEMENTS • September 2017 7
M&G Dynamic Allocation Fund Authorised Corporate Director’s Report
Portfolio statement (continued)
as at 30.09.17 30.09.17 31.03.17Holding €’000 % %
Investments
Portfolio statement (continued)
as at 30.09.17 30.09.17 31.03.17Holding €’000 % %
Forward currency contracts (continued)

Fund performance
Please note past performance is not a guide to future performanceand the value of investments, and the income from them, will fluctuate.This will cause the fund price to fall as well as rise and you may notget back the original amount you invested.
The fund is available for investment in different share classes, each withvarying levels of charges and minimum investments; please refer to theProspectus for M&G Dynamic Allocation Fund, which is available freeof charge either from our website at:www.mandg.lu/private-investors/fund-literature/or by calling M&G Customer Relations.
Fund level performance
Fund net asset value
30.09.17 31.03.17 31.03.16as at €’000 €’000 €’000
Fund net asset value (NAV) 5,911,169 4,253,594 2,694,144
Performance since launch
To give an indication of how the fund has performed since launch, thechart below shows total return of Euro Class ‘A’ (Accumulation) shares.
100
110
120
140
130
150
170
160
20172010 2011 2012 2013 2014 20162015
December 2009 = 100, plotted monthly Chart date 2 October 2017
Euro Class ‘A’ (Accumulation) shares*
Morningstar EUR Flexible Allocation - Global Sector
* Net income reinvested Source: Morningstar, Inc. and M&G
To give an indication of the performance of the fund, the following tableshows the compound rate of return, per annum, over the period.Calculated on a price to price basis with income reinvested.
Long-term performance by share class
Six Three Five Since months years years launch 03.04.17 02.10.14 02.10.12 % [a] % p.a. % p.a. % p.a.
Euro [b]
Class ‘A’ +4.2 +7.3 +7.2 +6.6 [c]
Class ‘B’ +4.0 +6.8 n/a +6.7 [d]
Class ‘C’ +4.7 +8.2 +8.1 +7.6 [c]
Sterling [e]
Class ‘I-H’ +5.1 n/a n/a +11.5 [f]
Swiss franc [b]
Class ‘A-H’ +4.0 n/a n/a +3.8 [g]
Class ‘C-H’ +4.6 n/a n/a +4.6 [g]
US dollar [b]
Class ‘A-H’ +5.3 n/a n/a +5.5 [g]
Class ‘C-H’ +5.8 n/a n/a +6.3 [g]
[a] Absolute basis.
[b] Price to price with net income reinvested.
[c] 3 December 2009, the launch date of the fund.
[d] 26 July 2013, the launch date of the share class.
[e] Price to price with income reinvested.
[f] 14 December 2015, the launch date of the share class.
[g] 5 June 2015, the launch date of the share class.
INTERIM LONG REPORT AND UNAUDITED FINANCIAL STATEMENTS • September 20178
M&G Dynamic Allocation Fund Financial highlights
Operating charges and portfoliotransaction costs
We explain below the payments made to meet the ongoing costs ofinvesting and managing the fund, comprised of operating charges andportfolio transaction costs.
Operating charges
Operating charges include payments made to M&G and to providersindependent of M&G:
• Investment management: Charge paid to M&G for investmentmanagement of the fund (also known as Annual ManagementCharge).
• Administration: Charge paid to M&G for administration servicesin addition to investment management – any surplus from thischarge will be retained by M&G.
• Share class hedging: Charge paid to M&G for currency hedgingservices to minimise exchange rate risk for the share class.
• Oversight and other independent services: Charges paid toproviders independent of M&G for services which includedepositary, custody and audit.
• Ongoing charges from underlying funds: Ongoing charges onholdings in underlying funds that are not rebated.
The operating charges paid by each share class of the fund are shownin the following performance tables. Operating charges do not includeportfolio transaction costs or any entry and exit charges (also known asinitial and redemption charges). The charging structures of shareclasses may differ, and therefore the operating charges may differ.
Operating charges are the same as the ongoing charges shown in theKey Investor Information Document, other than where an estimate hasbeen used for the ongoing charge because a material change has madethe operating charges unreliable as an estimate of future charges.
For this fund there is no difference between operating charges andongoing charges figures, unless disclosed under the specific shareclass performance table.
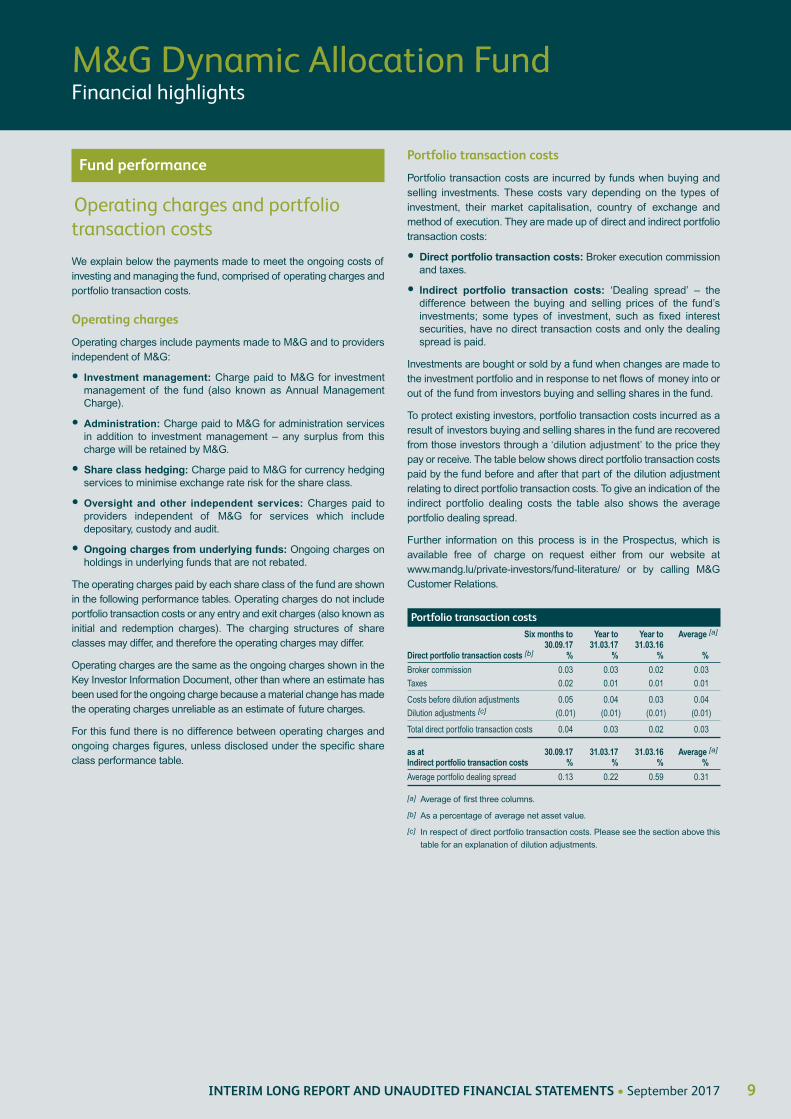
Portfolio transaction costs
Portfolio transaction costs are incurred by funds when buying andselling investments. These costs vary depending on the types ofinvestment, their market capitalisation, country of exchange andmethod of execution. They are made up of direct and indirect portfoliotransaction costs:
• Direct portfolio transaction costs: Broker execution commissionand taxes.
• Indirect portfolio transaction costs: ‘Dealing spread’ – thedifference between the buying and selling prices of the fund’sinvestments; some types of investment, such as fixed interestsecurities, have no direct transaction costs and only the dealingspread is paid.
Investments are bought or sold by a fund when changes are made tothe investment portfolio and in response to net flows of money into orout of the fund from investors buying and selling shares in the fund.
To protect existing investors, portfolio transaction costs incurred as aresult of investors buying and selling shares in the fund are recoveredfrom those investors through a ‘dilution adjustment’ to the price theypay or receive. The table below shows direct portfolio transaction costspaid by the fund before and after that part of the dilution adjustmentrelating to direct portfolio transaction costs. To give an indication of theindirect portfolio dealing costs the table also shows the averageportfolio dealing spread.
Further information on this process is in the Prospectus, which isavailable free of charge on request either from our website atwww.mandg.lu/private-investors/fund-literature/ or by calling M&GCustomer Relations.
Portfolio transaction costs
Six months to Year to Year to Average [a]
30.09.17 31.03.17 31.03.16 Direct portfolio transaction costs [b] % % % %
Broker commission 0.03 0.03 0.02 0.03
Taxes 0.02 0.01 0.01 0.01
Costs before dilution adjustments 0.05 0.04 0.03 0.04
Dilution adjustments [c] (0.01) (0.01) (0.01) (0.01)
Total direct portfolio transaction costs 0.04 0.03 0.02 0.03
as at 30.09.17 31.03.17 31.03.16 Average [a]
Indirect portfolio transaction costs % % % %
Average portfolio dealing spread 0.13 0.22 0.59 0.31
[a] Average of first three columns.
[b] As a percentage of average net asset value.
[c] In respect of direct portfolio transaction costs. Please see the section above this
table for an explanation of dilution adjustments.
INTERIM LONG REPORT AND UNAUDITED FINANCIAL STATEMENTS • September 2017 9
M&G Dynamic Allocation Fund Financial highlights
Fund performance

Specific share class performance
The following tables show the performance of each share class. All‘Performance and charges’ percentages represent an annual rateexcept for the ‘Return after operating charges’ which is calculated asa percentage of the opening net asset value per share (NAV). ‘Dilutionadjustments’ are only in respect of direct portfolio transaction costs.
Euro Class ‘A’ Income share performanceThe share class was launched on 12 July 2013.
Six months to Year to Year to 30.09.17 31.03.17 31.03.16Change in NAV per share Euro ¢ Euro ¢ Euro ¢
Opening NAV 1,550.48 1,389.98 1,501.19
Return before operating charges and after directportfolio transaction costs 80.28 210.98 (78.33)
Operating charges (15.25) (26.92) (27.22)
Return after operating charges 65.03 184.06 (105.55)
Distributions (11.08) (23.56) (5.66)
Closing NAV 1,604.43 1,550.48 1,389.98
Direct portfolio transaction costs Euro ¢ Euro ¢ Euro ¢
Costs before dilution adjustments 0.42 0.62 0.41
Dilution adjustments [a] (0.10) (0.14) (0.21)
Total direct portfolio transaction costs 0.32 0.48 0.20
Performance and charges % % %
Direct portfolio transaction costs [b] 0.04 0.03 0.02
Operating charges 1.91 1.84 1.91
Return after operating charges +4.19 +13.24 -7.03
Historic yield [c] 1.59 1.97 0.43
Effect on yield of charges offset against capital 1.90 1.90 0.00
Other information
Closing NAV (€’000) 383,903 268,558 178,399
Closing NAV percentage of total fund NAV (%) 6.50 6.31 6.63
Number of shares 23,927,742 17,320,957 12,834,689
Highest share price (Euro ¢) 1,613.14 1,565.31 1,538.79
Lowest share price (Euro ¢) 1,533.94 1,365.01 1,268.18
Euro Class ‘A’ Accumulation share performanceThe share class was launched on 3 December 2009.
Six months to Year to Year to 30.09.17 31.03.17 31.03.16Change in NAV per share Euro ¢ Euro ¢ Euro ¢
Opening NAV 1,582.87 1,396.82 1,502.19
Return before operating charges and after directportfolio transaction costs 82.09 213.24 (77.97)
Operating charges (15.61) (27.19) (27.40)
Return after operating charges 66.48 186.05 (105.37)
Distributions 0.00 (2.93) (5.87)
Retained distributions 0.00 2.93 5.87
Closing NAV 1,649.35 1,582.87 1,396.82
Direct portfolio transaction costs Euro ¢ Euro ¢ Euro ¢
Costs before dilution adjustments 0.43 0.63 0.41
Dilution adjustments [a] (0.10) (0.14) (0.21)
Total direct portfolio transaction costs 0.33 0.49 0.20
Performance and charges % % %
Direct portfolio transaction costs [b] 0.04 0.03 0.02
Operating charges 1.91 1.84 1.92
Return after operating charges +4.20 +13.32 -7.01
Historic yield 0.03 0.19 0.40
Effect on yield of charges offset against capital 0.00 0.00 0.00
Other information
Closing NAV (€’000) 3,076,481 2,339,278 1,623,886
Closing NAV percentage of total fund NAV (%) 52.05 55.00 60.27
Number of shares 186,526,946 147,787,554 116,255,819
Highest share price (Euro ¢) 1,652.52 1,590.61 1,539.84
Lowest share price (Euro ¢) 1,565.98 1,371.83 1,272.28
Euro Class ‘B’ Accumulation share performanceThe share class was launched on 26 July 2013.
Six months to Year to Year to 30.09.17 31.03.17 31.03.16Change in NAV per share Euro ¢ Euro ¢ Euro ¢
Opening NAV 1,259.08 1,115.52 1,204.63
Return before operating charges and after directportfolio transaction costs 65.21 171.05 (61.53)
Operating charges (15.57) (27.49) (27.58)
Return after operating charges 49.64 143.56 (89.11)
Distributions 0.00 0.00 (0.42)
Retained distributions 0.00 0.00 0.42
Closing NAV 1,308.72 1,259.08 1,115.52
Direct portfolio transaction costs Euro ¢ Euro ¢ Euro ¢
Costs before dilution adjustments 0.34 0.50 0.33
Dilution adjustments [a] (0.08) (0.11) (0.16)
Total direct portfolio transaction costs 0.26 0.39 0.17
Performance and charges % % %
Direct portfolio transaction costs [b] 0.04 0.03 0.02
Operating charges 2.41 2.34 2.42
Return after operating charges +3.94 +12.87 -7.40
Historic yield 0.00 0.00 0.04
Effect on yield of charges offset against capital 0.00 0.00 0.00
Other information
Closing NAV (€’000) 240,283 157,601 128,187
Closing NAV percentage of total fund NAV (%) 4.06 3.71 4.76
Number of shares 18,360,065 12,517,149 11,491,273
Highest share price (Euro ¢) 1,311.23 1,265.39 1,234.59
Lowest share price (Euro ¢) 1,245.35 1,094.29 1,016.59
INTERIM LONG REPORT AND UNAUDITED FINANCIAL STATEMENTS • September 201710
M&G Dynamic Allocation Fund Financial highlights

Euro Class ‘C’ Income share performanceThe share class was launched on 8 August 2014.
Six months to Year to Year to 30.09.17 31.03.17 31.03.16Change in NAV per share Euro ¢ Euro ¢ Euro ¢
Opening NAV 1,631.48 1,452.16 1,568.33Return before operating charges and after directportfolio transaction costs 84.70 218.02 (84.92)
Operating charges (7.84) (12.95) (13.60)
Return after operating charges 76.86 205.07 (98.52)
Distributions (11.67) (25.75) (17.65)
Closing NAV 1,696.67 1,631.48 1,452.16
Direct portfolio transaction costs Euro ¢ Euro ¢ Euro ¢
Costs before dilution adjustments 0.44 0.65 0.42Dilution adjustments [a] (0.11) (0.14) (0.21)
Total direct portfolio transaction costs 0.33 0.51 0.21
Performance and charges % % %
Direct portfolio transaction costs [b] 0.04 0.03 0.02Operating charges 0.92 0.85 0.91Return after operating charges +4.71 +14.12 -6.28Historic yield [c] 1.51 1.80 1.21Effect on yield of charges offset against capital 0.90 0.90 0.00
Other information
Closing NAV (€’000) 70,954 60,793 20,853Closing NAV percentage of total fund NAV (%) 1.20 1.43 0.77Number of shares 4,181,966 3,726,259 1,435,988Highest share price (Euro ¢) 1,706.01 1,646.13 1,608.11Lowest share price (Euro ¢) 1,614.75 1,428.92 1,326.10
Euro Class ‘C’ Accumulation share performanceThe share class was launched on 3 December 2009.
Six months to Year to Year to 30.09.17 31.03.17 31.03.16Change in NAV per share Euro ¢ Euro ¢ Euro ¢
Opening NAV 1,686.39 1,476.33 1,575.38Return before operating charges and after directportfolio transaction costs 87.68 223.33 (85.28)
Operating charges (8.10) (13.27) (13.77)
Return after operating charges 79.58 210.06 (99.05)
Distributions (4.45) (15.62) (17.80)
Retained distributions 4.45 15.62 17.80
Closing NAV 1,765.97 1,686.39 1,476.33
Direct portfolio transaction costs Euro ¢ Euro ¢ Euro ¢
Costs before dilution adjustments 0.46 0.67 0.43Dilution adjustments [a] (0.11) (0.15) (0.22)
Total direct portfolio transaction costs 0.35 0.52 0.21
Performance and charges % % %
Direct portfolio transaction costs [b] 0.04 0.03 0.02Operating charges 0.92 0.85 0.92Return after operating charges +4.72 +14.23 -6.29Historic yield 0.65 0.94 1.20Effect on yield of charges offset against capital 0.00 0.00 0.00
Other information
Closing NAV (€’000) 2,086,294 1,401,141 724,817Closing NAV percentage of total fund NAV (%) 35.29 32.94 26.90Number of shares 118,138,893 83,085,054 49,095,909Highest share price (Euro ¢) 1,769.38 1,694.28 1,615.30Lowest share price (Euro ¢) 1,669.14 1,452.73 1,343.18
Sterling Class ‘I-H’ Income share performanceThe share class was launched on 14 December 2015.
Six months to Year to Year to 30.09.17 31.03.17 31.03.16Change in NAV per share UK p UK p UK p
Opening NAV 112.68 99.53 100.00
Return before operating charges and after directportfolio transaction costs 6.24 15.83 0.61
Operating charges (0.52) (0.90) (0.32)
Return after operating charges 5.72 14.93 0.29
Distributions (0.81) (1.78) (0.76)
Closing NAV 117.59 112.68 99.53
Direct portfolio transaction costs UK p UK p UK p
Costs before dilution adjustments 0.03 0.05 0.01
Dilution adjustments [a] (0.01) (0.01) (0.01)
Total direct portfolio transaction costs 0.02 0.04 0.00
Performance and charges % % %
Direct portfolio transaction costs [b] 0.04 0.03 0.02
Operating charges 0.91 0.85 0.91
Return after operating charges +5.08 +15.00 +0.29
Historic yield [c] 1.51 1.79 0.43
Effect on yield of charges offset against capital 0.92 0.92 0.00
Other information
Closing NAV (€’000) 748 26 25
Closing NAV percentage of total fund NAV (%) 0.01 0.00 0.00
Number of shares 561,548 20,000 20,000
Highest share price (UK p) 118.22 113.68 101.46
Lowest share price (UK p) 111.59 97.90 90.61
Sterling Class ‘I-H’ Accumulation share performanceThe share class was launched on 14 December 2015.
Six months to Year to Year to 30.09.17 31.03.17 31.03.16Change in NAV per share UK p UK p UK p
Opening NAV 115.37 100.25 100.00
Return before operating charges and after directportfolio transaction costs 6.46 16.03 0.57
Operating charges (0.56) (0.91) (0.32)
Return after operating charges 5.90 15.12 0.25
Distributions (0.30) (1.06) (0.76)
Retained distributions 0.30 1.06 0.76
Closing NAV 121.27 115.37 100.25
Direct portfolio transaction costs UK p UK p UK p
Costs before dilution adjustments 0.03 0.05 0.01
Dilution adjustments [a] (0.01) (0.01) (0.01)
Total direct portfolio transaction costs 0.02 0.04 0.00
Performance and charges % % %
Direct portfolio transaction costs [b] 0.04 0.03 0.02
Operating charges 0.94 0.86 0.91
Return after operating charges +5.11 +15.08 +0.25
Historic yield 0.64 0.92 0.39
Effect on yield of charges offset against capital 0.00 0.00 0.00
Other information
Closing NAV (€’000) 5,720 904 25
Closing NAV percentage of total fund NAV (%) 0.10 0.02 0.00
Number of shares 4,163,100 671,602 20,010
Highest share price (UK p) 121.51 115.89 101.46
Lowest share price (UK p) 114.25 98.49 90.88
INTERIM LONG REPORT AND UNAUDITED FINANCIAL STATEMENTS • September 2017 11
M&G Dynamic Allocation Fund Financial highlights
Specific share class performance

Swiss franc Class ‘A-H’ Accumulation share performanceThe share class was launched on 5 June 2015.
Six months to Year to Year to 30.09.17 31.03.17 31.03.16Change in NAV per share Swiss ¢ Swiss ¢ Swiss ¢
Opening NAV 1,044.28 925.99 1,000.00Return before operating charges and after directportfolio transaction costs 52.32 136.87 (58.05)Operating charges (10.34) (18.58) (15.96)
Return after operating charges 41.98 118.29 (74.01)
Distributions 0.00 (1.78) (3.92)
Retained distributions 0.00 1.78 3.92
Closing NAV 1,086.26 1,044.28 925.99
Direct portfolio transaction costs Swiss ¢ Swiss ¢ Swiss ¢
Costs before dilution adjustments 0.28 0.42 0.24Dilution adjustments [a] (0.07) (0.09) (0.12)
Total direct portfolio transaction costs 0.21 0.33 0.12
Performance and charges % % %
Direct portfolio transaction costs [b] 0.04 0.03 0.02Operating charges 1.93 1.90 1.91Return after operating charges +4.02 +12.77 -7.40Historic yield 0.03 0.17 0.41Effect on yield of charges offset against capital 0.00 0.00 0.00
Other information
Closing NAV (€’000) 1,413 771 53Closing NAV percentage of total fund NAV (%) 0.02 0.02 0.00Number of shares 148,907 78,918 6,218Highest share price (Swiss ¢) 1,088.30 1,049.64 1,011.62Lowest share price (Swiss ¢) 1,032.88 909.95 845.00
Swiss franc Class ‘C-H’ Accumulation share performanceThe share class was launched on 5 June 2015.
Six months to Year to Year to 30.09.17 31.03.17 31.03.16Change in NAV per share Swiss ¢ Swiss ¢ Swiss ¢
Opening NAV 1,058.92 931.90 1,000.00Return before operating charges and after directportfolio transaction costs 53.34 135.58 (60.49)Operating charges (5.18) (8.56) (7.61)
Return after operating charges 48.16 127.02 (68.10)
Distributions (2.73) (9.66) (11.30)
Retained distributions 2.73 9.66 11.30
Closing NAV 1,107.08 1,058.92 931.90
Direct portfolio transaction costs Swiss ¢ Swiss ¢ Swiss ¢
Costs before dilution adjustments 0.29 0.42 0.24Dilution adjustments [a] (0.07) (0.09) (0.12)
Total direct portfolio transaction costs 0.22 0.33 0.12
Performance and charges % % %
Direct portfolio transaction costs [b] 0.04 0.03 0.02Operating charges 0.94 0.87 0.91Return after operating charges +4.55 +13.63 -6.81Historic yield 0.64 0.92 1.21Effect on yield of charges offset against capital 0.00 0.00 0.00
Other information
Closing NAV (€’000) 749 577 255Closing NAV percentage of total fund NAV (%) 0.01 0.01 0.01Number of shares 77,457 58,206 29,950Highest share price (Swiss ¢) 1,109.22 1,064.14 1,012.55Lowest share price (Swiss ¢) 1,047.86 917.34 850.00
US dollar Class ‘A-H’ Income share performanceThe share class was launched on 5 June 2015.
Six months to Year to Year to 30.09.17 31.03.17 31.03.16Change in NAV per share US ¢ US ¢ US ¢
Opening NAV 1,051.89 930.43 1,000.00
Return before operating charges and after directportfolio transaction costs 65.44 156.16 (49.09)
Operating charges (10.31) (18.85) (16.35)
Return after operating charges 55.13 137.31 (65.44)
Distributions (7.62) (15.85) (4.13)
Closing NAV 1,099.40 1,051.89 930.43
Direct portfolio transaction costs US ¢ US ¢ US ¢
Costs before dilution adjustments 0.28 0.43 0.25
Dilution adjustments [a] (0.07) (0.09) (0.12)
Total direct portfolio transaction costs 0.21 0.34 0.13
Performance and charges % % %
Direct portfolio transaction costs [b] 0.04 0.03 0.02
Operating charges 1.93 1.88 1.92
Return after operating charges +5.24 +14.76 -6.54
Historic yield [c] 1.59 1.95 1.20
Effect on yield of charges offset against capital 1.92 1.92 0.00
Other information
Closing NAV (€’000) 7,694 2,642 431
Closing NAV percentage of total fund NAV (%) 0.13 0.06 0.02
Number of shares 826,752 268,307 52,700
Highest share price (US ¢) 1,105.41 1,061.45 1,013.35
Lowest share price (US ¢) 1,041.46 915.83 847.00
US dollar Class ‘A-H’ Accumulation share performanceThe share class was launched on 5 June 2015.
Six months to Year to Year to 30.09.17 31.03.17 31.03.16Change in NAV per share US ¢ US ¢ US ¢
Opening NAV 1,071.96 933.61 1,000.00
Return before operating charges and after directportfolio transaction costs 67.43 157.06 (50.16)
Operating charges (10.67) (18.71) (16.23)
Return after operating charges 56.76 138.35 (66.39)
Distributions 0.00 (1.75) (4.13)
Retained distributions 0.00 1.75 4.13
Closing NAV 1,128.72 1,071.96 933.61
Direct portfolio transaction costs US ¢ US ¢ US ¢
Costs before dilution adjustments 0.29 0.43 0.25
Dilution adjustments [a] (0.07) (0.09) (0.12)
Total direct portfolio transaction costs 0.22 0.34 0.13
Performance and charges % % %
Direct portfolio transaction costs [b] 0.04 0.03 0.02
Operating charges 1.93 1.88 1.91
Return after operating charges +5.29 +14.82 -6.64
Historic yield 0.02 0.16 0.43
Effect on yield of charges offset against capital 0.00 0.00 0.00
Other information
Closing NAV (€’000) 21,772 13,611 2,759
Closing NAV percentage of total fund NAV (%) 0.37 0.32 0.10
Number of shares 2,278,766 1,356,119 336,175
Highest share price (US ¢) 1,130.89 1,076.67 1,013.44
Lowest share price (US ¢) 1,061.35 919.02 849.00
INTERIM LONG REPORT AND UNAUDITED FINANCIAL STATEMENTS • September 201712
M&G Dynamic Allocation Fund Financial highlights
Specific share class performance

US dollar Class ‘C-H’ Income share performanceThe share class was launched on 5 June 2015.
Six months to Year to Year to 30.09.17 31.03.17 31.03.16Change in NAV per share US ¢ US ¢ US ¢
Opening NAV 1,056.85 928.57 1,000.00
Return before operating charges and after directportfolio transaction costs 66.53 154.02 (52.01)
Operating charges (5.23) (9.26) (8.13)
Return after operating charges 61.30 144.76 (60.14)
Distributions (7.69) (16.48) (11.29)
Closing NAV 1,110.46 1,056.85 928.57
Direct portfolio transaction costs US ¢ US ¢ US ¢
Costs before dilution adjustments 0.29 0.43 0.23
Dilution adjustments [a] (0.07) (0.10) (0.12)
Total direct portfolio transaction costs 0.22 0.33 0.11
Performance and charges % % %
Direct portfolio transaction costs [b] 0.04 0.03 0.02
Operating charges 0.94 0.96 0.95
Return after operating charges +5.80 +15.59 -6.01
Historic yield [c] 1.51 1.77 1.21
Effect on yield of charges offset against capital 0.92 0.92 0.00
Other information
Closing NAV (€’000) 469 494 8
Closing NAV percentage of total fund NAV (%) 0.01 0.01 0.00
Number of shares 49,946 49,946 1,000
Highest share price (US ¢) 1,116.54 1,065.66 1,012.78
Lowest share price (US ¢) 1,046.81 913.97 846.00
US dollar Class ‘C-H’ Accumulation share performanceThe share class was launched on 5 June 2015.
Six months to Year to Year to 30.09.17 31.03.17 31.03.16Change in NAV per share US ¢ US ¢ US ¢
Opening NAV 1,087.01 938.93 1,000.00
Return before operating charges and after directportfolio transaction costs 68.18 156.43 (53.56)
Operating charges (5.30) (8.35) (7.51)
Return after operating charges 62.88 148.08 (61.07)
Distributions (2.83) (9.81) (11.31)
Retained distributions 2.83 9.81 11.31
Closing NAV 1,149.89 1,087.01 938.93
Direct portfolio transaction costs US ¢ US ¢ US ¢
Costs before dilution adjustments 0.29 0.42 0.25
Dilution adjustments [a] (0.07) (0.09) (0.13)
Total direct portfolio transaction costs 0.22 0.33 0.12
Performance and charges % % %
Direct portfolio transaction costs [b] 0.04 0.03 0.02
Operating charges 0.94 0.85 0.87
Return after operating charges +5.78 +15.77 -6.11
Historic yield 0.63 0.91 0.43
Effect on yield of charges offset against capital 0.00 0.00 0.00
Other information
Closing NAV (€’000) 14,689 7,198 14,446
Closing NAV percentage of total fund NAV (%) 0.25 0.17 0.54
Number of shares 1,509,094 707,210 1,750,365
Highest share price (US ¢) 1,152.09 1,091.63 1,014.42
Lowest share price (US ¢) 1,076.80 924.40 853.00
[a] In respect of direct portfolio transaction costs.
[b] As a percentage of average net asset value.
[c] Following the change in charging structure, you may see variances between the
comparative and current year figures.
INTERIM LONG REPORT AND UNAUDITED FINANCIAL STATEMENTS • September 2017 13
M&G Dynamic Allocation Fund Financial highlights
Specific share class performance

Financial statements
Statement of total return
2017 2016for the six months to 30 September €’000 €’000 €’000 €’000
Income
Net capital gains / (losses) 216,247 69,176
Revenue 39,453 32,297
Expenses (39,802) (22,530)
Interest payable (314) (139) ______ ______Net revenue / (expense) before taxation (663) 9,628
Taxation (2,502) (1,813) ______ ______Net revenue / (expense) after taxation (3,165) 7,815
Total return before distributions 213,082 76,991Distributions (8,288) (8,614)
Change in net assets attributable toshareholders from investment activities 204,794 68,377
Statement of change in net assets attributable to shareholders
2017 2016for the six months to 30 September €’000 €’000 €’000 €’000
Opening net assets attributable toshareholders 4,253,594 2,694,144Amounts received on issue of shares 1,518,834 302,290
Amounts paid on cancellation of shares (72,322) (281,373) ______ ______ 1,446,512 20,917
Dilution adjustments 1,343 729
Change in net assets attributable toshareholders from investment activities(see above) 204,794 68,377
Retained distributions on Accumulationshares 4,926 7,286
Closing net assets attributable toshareholders 5,911,169 2,791,453
The opening net assets attributable to shareholders for 2017 differs to the closing
position in 2016 by the change in net assets attributable to shareholders for the
second half of the comparative financial year.
Balance sheet
30 September 2017 31 March 2017as at €’000 €’000
Assets
Fixed assets Investments 5,287,463 3,966,092
Current assets Debtors 65,215 91,822
Cash and bank balances 1,193,509 283,973
Total assets 6,546,187 4,341,887
Liabilities Investment liabilities (49,036) (29,915)
Creditors Bank overdrafts 0 (2)
Distribution payable (1,626) (1,529)
Other creditors (584,356) (56,847)
Total liabilities (635,018) (88,293)
Net assets attributable to shareholders 5,911,169 4,253,594
Notes to the financial statements
Accounting policies
The interim financial statements have been prepared on the same basisas the audited annual financial statements for the year ended 31 March2017. They are prepared in accordance with the historical costconvention, as modified by the revaluation of investments, and inaccordance with the Statement of Recommended Practice (SORP) forAuthorised Funds issued by the Investment Association in May 2014.
Distribution policy
In determining the amount available for distribution to Income shares,the annual management charge, administration charge and the shareclass hedging charge are offset against capital, increasing the amountavailable for distribution whilst restraining capital performance to anequivalent extent.
Directors’ statement
This report has been prepared in accordance with the requirementsof the Collective Investment Schemes sourcebook, as issued andamended by the Financial Conduct Authority.
G W MACDOWALL }DirectorsL J MUMFORD
14 November 2017
INTERIM LONG REPORT AND UNAUDITED FINANCIAL STATEMENTS • September 201714
M&G Dynamic Allocation Fund Financial statements and notes

INTERIM LONG REPORT AND UNAUDITED FINANCIAL STATEMENTS • September 2017 15
M&G Dynamic Allocation Fund Other regulatory disclosures
Swiss investor information
For funds registered in Switzerland we are required by FINMA todisclose the Total Expense Ratio (TER).
For this fund the TERs are the same as the operating chargesdisclosed in the fund’s financial highlights section under ‘Performanceand charges’.
Accumulation shares: A type of share where distributions areautomatically reinvested and reflected in the value of the shares.
Accumulation units: A type of unit where distributions areautomatically reinvested and reflected in the value of the units.
Asset: Anything having commercial or exchange value that isowned by a business, institution or individual.
Asset allocation: Apportioning a portfolio’s assets according torisk tolerance and investment goals.
Asset class: Category of assets, such as cash, company shares,fixed income securities and their sub-categories, as well as tangibleassets such as real estate.
Bond: A loan in the form of a security, usually issued by agovernment or company, which normally pays a fixed rate of interestover a given time period, at the end of which the initial amountborrowed is repaid.
Bond issue: A set of fixed income securities offered for sale to thepublic by a company or government. If the bonds are sold for thefirst time, it is called a ‘new issue’.
Bottom-up selection: Selecting stocks based on theattractiveness of a company.
Bunds: Fixed income securities issued by the German government.
Capital: Refers to the financial assets, or resources, that acompany has to fund its business operations.
Capital growth: Occurs when the current value of an investmentis greater than the initial amount invested.
Capital return: The term for the gain or loss derived from aninvestment over a particular period. Capital return includes capitalgain or loss only and excludes income (in the form of interest ordividend payments).
Cash equivalents: Deposits or investments with similarcharacteristics to cash.
Comparative sector: A group of funds with similar investmentobjectives and/or types of investment, as classified by bodies suchas the Investment Association (IA) or Morningstar™. Sectordefinitions are mostly based on the main assets a fund should investin, and may also have a geographic focus. Sectors can be the basisfor comparing the different characteristics of similar funds, such astheir performance or charging structure.
Consumer Prices Index (CPI): An index used to measureinflation, which is the rate of change in prices for a basket of goodsand services. The contents of the basket are meant to berepresentative of products and services we typically spend ourmoney on.
Convertible bonds: Fixed income securities that can beexchanged for predetermined amounts of company shares atcertain times during their life.
Corporate bonds: Fixed income securities issued by a company.They are also known as bonds and can offer higher interestpayments than bonds issued by governments as they are oftenconsidered more risky.
Coupon: The interest paid by the government or company that hasraised a loan by selling bonds.
Credit: The borrowing capacity of an individual, company orgovernment. More narrowly, the term is often used as a synonymfor fixed income securities issued by companies.
Credit default swaps (CDS): Are a type of derivative, namelyfinancial instruments whose value, and price, are dependent on oneor more underlying assets. CDS are insurance-like contracts thatallow investors to transfer the risk of a fixed income securitydefaulting to another investor.
Credit rating: An independent assessment of a borrower’s abilityto repay its debts. A high rating indicates that the credit ratingagency considers the issuer to be at low risk of default; likewise, alow rating indicates high risk of default. Standard & Poor’s, Fitchand Moody’s are the three most prominent credit rating agencies.Default means that a company or government is unable to meetinterest payments or repay the initial investment amount at the endof a security’s life.
Credit rating agency: A company that analyses the financialstrength of issuers of fixed income securities and attaches a ratingto their debt. Examples include Standard & Poor’s and Moody’s.
Credit risk: Risk that a financial obligation will not be paid and aloss will result for the lender.
Credit selection: The process of evaluating a fixed incomesecurity, also called a bond, in order to ascertain the ability of theborrower to meet its debt obligations. This research seeks to identifythe appropriate level of default risk associated with investing in thatparticular bond.
Credit spread: The difference between the yield of a corporatebond, a fixed income security issued by a company, and a governmentbond of the same life span. Yield refers to the income received froman investment and is expressed as a percentage of the investment’scurrent market value.
Default:When a borrower does not maintain interest payments orrepay the amount borrowed when due.
Default risk: Risk that a debtholder will not receive interest andfull repayment of the loan when due.
Derivatives: Financial instruments whose value, and price, aredependent on one or more underlying assets. Derivatives can beused to gain exposure to, or to help protect against, expectedchanges in the value of the underlying investments. Derivatives maybe traded on a regulated exchange or traded over the counter.
Developed economy/market:Well-established economies witha high degree of industrialisation, standard of living and security.
Dilution adjustments: The dilution adjustment is used to protectongoing investors against the transaction charges incurred ininvesting or divesting in respect of creations and cancellations. Thedilution adjustment is made up of the direct and indirect transactioncharges. In the financial statements the direct transaction chargesas a percentage of average NAV will be disclosed. This percentagewill take account of those direct transaction charges that have beenrecovered through the dilution adjustment leaving a percentage thatjust represents the costs incurred in portfolio management.
INTERIM LONG REPORT AND UNAUDITED FINANCIAL STATEMENTS • September 201716
Glossary

INTERIM LONG REPORT AND UNAUDITED FINANCIAL STATEMENTS • September 2017 17
M&G Example Fund Example Second LineGlossary
Distribution: Distributions represent a share in the net income ofthe fund and are paid out to Income Shareholders or reinvested forAccumulation Shareholders at set times of the year (monthly,quarterly, half-yearly or annually). They may either be in the form ofinterest distributions or dividend distributions.
Distribution yield: Expresses the amount that is expected to bedistributed by the fund over the next 12 months as a percentage ofthe share price as at a certain date. It is based on the expectedgross income less the ongoing charges.
Diversification: The practice of investing in a variety of assets. Thisis a risk management technique where, in a well-diversified portfolio,any loss from an individual holding should be offset by gains in otherholdings, thereby lessening the impact on the overall portfolio.
Dividend: Dividends represent a share in the profits of a companyand are paid out to the company’s shareholders at set times of the year.
Duration: A measure of the sensitivity of a fixed income security,also called a bond, or bond fund to changes in interest rates. Thelonger a bond or bond fund’s duration, the more sensitive it is tointerest rate movements.
Duration risk: The longer a fixed income security, also called abond, or bond fund’s duration, the more sensitive and therefore atrisk it is to changes in interest rates.
Emerging economy or market: Economies in the process ofrapid growth and increasing industrialisation. Investments inemerging markets are generally considered to be riskier than thosein developed markets.
Equities: Shares of ownership in a company.
Exchange traded: Usually refers to investments traded on anexchange, such as company shares on a stock exchange.
Ex-dividend date: The date on which declared distributionsofficially belong to underlying investors, rather than the fund, usuallythe first business day of the month.
Exposure: The proportion of a fund invested in a particularshare/fixed income security, sector/region, usually expressed as apercentage of the overall portfolio.
Fixed income security: A loan in the form of a security, usuallyissued by a government or company, which normally pays a fixedrate of interest over a given time period, at the end of which theinitial amount borrowed is repaid. Also referred to as a bond.
Floating rate notes (FRNs): Securities whose interest (income)payments are periodically adjusted depending on the change in areference interest rate.
Foreign exchange: The exchange of one currency for another, orthe conversion of one currency into another currency. Foreignexchange also refers to the global market where currencies aretraded virtually around the clock. The term foreign exchange isusually abbreviated as ‘forex’ and occasionally as ‘FX’.
Foreign exchange (FX) strategy: Currencies can be an assetclass in its own right, along with company shares, fixed incomesecurities, property and cash. Foreign exchange strategy cantherefore be a source of investment returns.
Forward contract: A contract between two parties to buy or sell aparticular commodity or financial instrument at a pre-determinedprice at a future date. Examples include foward currency contracts.
Fundamentals (company): A basic principle, rule, law, or the like,that serves as the groundwork of a system. A company’sfundamentals pertain specifically to that company, and are factorssuch as its business model, earnings, balance sheet and debt.
Fundamentals (economic): A basic principle, rule, law, or the like,that serves as the groundwork of a system. Economic fundamentalsare factors such as inflation, employment, economic growth.
Futures:A futures contract is a contract between two parties to buy orsell a particular commodity or financial instrument at a pre-determinedprice at a future date. Futures are traded on a regulated exchange.
Gilts: Fixed income securities issued by the UK government.
Government bonds:Fixed income securities issued by governments,that normally pay a fixed rate of interest over a given time period, atthe end of which the initial investment is repaid.
Hedging: A method of reducing unnecessary or unintended risk.
High water mark (HWM): The highest level that a fund’s NAV(net asset value) has reached at the end of any 12-monthaccounting period.
High yield bonds: Fixed income securities issued by companieswith a low credit rating from a recognised credit rating agency. Theyare considered to be at higher risk of default than better quality, iehigher-rated fixed income securities but have the potential for higherrewards. Default means that a company or government is unable tomeet interest payments or repay the initial investment amount at theend of a security’s life.
Historic yield: The historic yield reflects distributions declared overthe past 12 months as a percentage of the share price, as at thedate shown.
Income yield: Refers to the income received from an investmentand is usually expressed annually as a percentage based on theinvestment’s cost, its current market value or face value.
Index: An index represents a particular market or a portion of it,serving as a performance indicator for that market.
Income shares: A type of share where distributions are paid outas cash on the payment date.
Income units: A type of unit where distributions are paid out ascash on the payment date.
Index tracking: A fund management strategy that aims to matchthe returns from a particular index.
Index-linked bonds: Fixed income securities where both thevalue of the loan and the interest payments are adjusted in linewith inflation over the life of the security. Also referred to asinflation-linked bonds.
Inflation: The rate of increase in the cost of living. Inflation isusually quoted as an annual percentage, comparing the averageprice this month with the same month a year earlier.
Inflation risk: The risk that inflation will reduce the return of aninvestment in real terms.
Initial public offering (IPO): The first sale of shares by a privatecompany to the public.

Interest rate risk: The risk that a fixed income investment will losevalue if interest rates rise.
Interest rate swap: An agreement between two parties to swapa fixed interest payment with a variable interest payment over aspecified period of time.
Investment Association (IA): The UK trade body that representsfund managers. It works with investment managers, liaising withgovernment on matters of taxation and regulation, and also aims tohelp investors understand the industry and the investment optionsavailable to them.
Issuer: An entity that sells securities, such as fixed income securitiesand company shares.
Investment grade bonds: Fixed income securities issued by acompany with a medium or high credit rating from a recognisedcredit rating agency. They are considered to be at lower risk fromdefault than those issued by companies with lower credit ratings.Default means that a company or government is unable to meetinterest payments or repay the initial investment amount at the endof a security’s life.
Issuer: An entity that sells securities, such as fixed income securitiesand company shares.
Leverage: When referring to a company, leverage is the level of acompany’s debt in relation to its assets. A company with significantlymore debt than capital is considered to be leveraged. It can alsorefer to a fund that borrows money or uses derivatives to magnifyan investment position.
Liquidity: A company is considered highly liquid if it has plenty ofcash at its disposal. A company’s shares are considered highly liquidif they can be easily bought or sold since large amounts areregularly traded.
Long position: Refers to ownership of a security held in theexpectation that the security will rise in value.
Macroeconomic: Refers to the performance and behaviour of aneconomy at the regional or national level. Macroeconomic factorssuch as economic output, unemployment, inflation and investmentare key indicators of economic performance. Sometimes abbreviatedto ‘macro’.
Maturity: The length of time until the initial investment amount of afixed income security is due to be repaid to the holder of the security.
Modified duration: A measure of the sensitivity of a fixed incomesecurity, called a bond, or bond fund to changes in interest rates.The longer a bond or bond fund’s duration, the more sensitive it isto interest rate movements.
Monetary easing:When central banks lower interest rates or buysecurities on the open market to increase the money in circulation.
Monetary policy: A central bank’s regulation of money incirculation and interest rates.
Monetary tightening: When central banks raise interest rates orsell securities on the open market to decrease the money in circulation.
Morningstar™: A provider of independent investment research,including performance statistics and independent fund ratings.
Near cash: Deposits or investments with similar characteristicsto cash.
Net asset value (NAV): A fund’s net asset value is calculatedby taking the current value of the fund’s assets and subtractingits liabilities.
Open-ended investment company (OEIC): A type of managedfund, whose value is directly linked to the value of the fund’sunderlying investments.
Options: Financial contracts that offer the right, but not theobligation, to buy or sell an asset at a given price on or before agiven date in the future.
Over-the-counter (OTC): Whereby financial assets are tradeddirectly between two parties. This is in contrast to exchange trading,which is carried out through exchanges set up specifically for thepurpose of trading. OTC is also known as off-exchange trading.
Overweight: If a fund is ‘overweight’ a stock, it holds a largerproportion of that stock than the comparable index or sector.
Payment date: The date on which distributions will be paid by thefund to investors, usually the last business day of the month.
Physical assets: An item of value that has tangible existence, forexample, cash, equipment, inventory or real estate. Physical assetscan also refer to securities, such as company shares or fixedincome securities.
Portfolio transaction cost: The cost of trading, such asbrokerage, clearing, exchange fees and bid-offer spread as well astaxes such as stamp duty.
Principal: The face value of a fixed income security, which is theamount due back to the investor by the borrower when the securityreaches the end of its life.
Private placement:An offer of sale of securities to a relatively smallnumber of investors selected by the company, generally investmentbanks, mutual funds, insurance companies or pension funds.
Real yield: The return of an investment, adjusted for changes inprices in an economy.
Retail Prices Index (RPI): A UK inflation index that measures therate of change in prices for a basket of goods and services in theUK, including mortgage payments and council tax.
Risk: The chance that an investment’s return will be different to whatis expected. Risk includes the possibility of losing some or all of theoriginal investment.
Risk management: The term used to describe the activities thefund manager undertakes to limit the risk of a loss in a fund.
Risk premium: The difference between the return from a risk-freeasset, such as a high-quality government bond or cash, and thereturn from an investment in any other asset. The risk premium canbe considered the ‘price’ or ‘pay-off’ for taking on increased risk. Ahigher risk premium implies higher risk.
Risk-free asset: An asset that notionally carries no risk of non-payment by the borrower such as a high-quality fixed incomesecurity issued by a government or cash.
Risk/reward ratio: A ratio comparing the expected returns of aninvestment with the amount of risk undertaken.
Safe-haven assets: Refers to assets that investors perceive to berelatively safe from suffering a loss in times of market turmoil.
INTERIM LONG REPORT AND UNAUDITED FINANCIAL STATEMENTS • September 201718
Glossary

Security: Financial term for a paper asset – usually a share in acompany or a fixed income security also known as a bond.
Share class: Each M&G fund has different share classes, such asA, R and I. Each has a different level of charges and minimuminvestment. Details on charges and minimum investments can befound in the Key Investor Information Documents.
Share class hedging: Activities undertaken in respect of hedgedshares to mitigate the impact on performance of exchange ratemovements between the fund’s currency exposure and the investor’schosen currency.
Short position: A way for a fund manager to express his or herview that the market might fall in value.
Short selling: This often refers to the practice whereby an investorsells an asset they do not own. The investor borrows the asset fromsomeone who does own it and pays a fee. The investor musteventually return the borrowed asset by buying it in the open market.If the asset has fallen in price, the investor buys it for less than theysold it for, thus making a profit. The contrary may also occur.
Short-dated corporate bonds: Fixed income securities issuedby companies and repaid over relatively short periods.
Short-dated government bonds: Fixed income securitiesissued by governments and repaid over relatively short periods.
Sovereign debt: Debt of a government. Also referred to asgovernment bonds.
Sub-investment grade bonds: Fixed income securities issuedby a company with a low rating from a recognised credit ratingagency. They are considered to be at higher risk from default thanthose issued by companies with higher credit ratings. Default meansthat a company or government is unable to meet interest paymentsor repay the initial investment amount at the end of a security’s life.
Top-down investing: An investment approach that analyseseconomic factors, ie surveys the ‘big picture’, before selecting whichcompanies to invest in. The top-down investor will look at whichindustries are likely to generate the best returns in certain economicconditions and limit the search to that area.
Total return: The term for the gain or loss derived from aninvestment over a particular period. Total return includes income (inthe form of interest or dividend payments) and capital gains.
Treasuries: Fixed income securities issued by the US government.
Triple A or AAA rated: The highest possible rating a fixed incomesecurity, also called a bond, can be assigned by credit ratingagencies. Bonds that are rated AAA are perceived to have thelowest risk of default. Default means that a company or governmentis unable to meet interest payments or repay the initial investmentamount at the end of a security’s life.
UCITS: Stands for Undertakings for Collective Investment inTransferable Securities. This is the European regulatory frameworkfor an investment vehicle that can be marketed across the EuropeanUnion and is designed to enhance the single market in financialassets while maintaining high levels of investor protection.
Unconstrained: The term used to describe the mandate of a fundwhereby the manager has the freedom to invest according to his orher own strategy, not being obliged to allocate capital according tothe weightings of any index, for example.
Underlying value: The fundamental value of a company,reflecting both tangible and intangible assets, rather than the currentmarket value.
Underlying yield: Refers to the income received by a managedfund, and is usually expressed annually as a percentage based onthe fund’s current value.
Underweight: If a portfolio is ‘underweight’ a stock, it holds asmaller proportion of that stock than the comparable index or sector.
Unit trust: A type of managed fund, whose value is directly linkedto the value of the fund’s underlying investments.
Unit/share type: Type of units/shares held by investors in a trustor fund (unit/share types differ by features such as whether incomeis to be paid out as cash or reinvested on the payment date).
Valuation: The worth of an asset or company based on its currentprice.
Volatile: When the value of a particular share, market or sectorswings up and down fairly frequently and/or significantly, it isconsidered volatile.
Volatility: The degree to which a given security, fund, or indexrapidly changes. It is calculated as the degree of deviation from thenorm for that type of investment over a given time period. The higherthe volatility, the riskier the security tends to be.
Warrant: A security issued by a company that gives the holder theright to buy shares in that company at a specified price and within acertain timeframe.
Yield: This refers to either the interest received from a fixed incomesecurity or to the dividends received from a share. It is usuallyexpressed as a percentage based on the investment’s costs, itscurrent market value or its face value. Dividends represent a sharein the profits of the company and are paid out to a company’sshareholders at set times of the year.
Yield (equity): Refers to the dividends received by a holder ofcompany shares and is usually expressed annually as a percentagebased on the investment’s cost, its current market value or facevalue. Dividends represent a share in the profits of the companyand are paid out to a company’s shareholders at set times of theyear.
Yield (bonds): This refers to the interest received from a fixedincome security and is usually expressed annually as a percentagebased on the investment’s cost, its current market value or its facevalue.
Yield (income): Refers to the income received from an investmentand is usually expressed annually as a percentage based on theinvestment’s cost, its current market value or face value.
INTERIM LONG REPORT AND UNAUDITED FINANCIAL STATEMENTS • September 2017 19
Glossary
M&G Securities Limited is authorised and regulated by the Financial Conduct
Authority and provides investment products. The Company’s registered office is
Laurence Pountney Hill, London EC4R 0HH. Registered in England number 90776.

53309_LR_310518