Embed Size (px)
Citation preview

Putnam Dynamic Asset Allocation Growth Fund
FUND SYMBOL CLASS A
PAEAX
Annual report 9 | 30 | 17
Asset allocation funds invest in a mix of many different types of investments to help weather changing market environments.

Putnam Dynamic Asset Allocation Growth FundAnnual report 9 | 30 | 17
Message from the Trustees 1
About the fund 2
Interview with your fund’s portfolio manager 5
Your fund’s performance 10
Your fund’s expenses 12
Terms and definitions 14
Other information for shareholders 16
Important notice regarding Putnam’s privacy policy 17
Trustee approval of management contract 18
Financial statements 23
Federal tax information 121
About the Trustees 122
Officers 124
Consider these risks before investing: Allocation of assets among asset classes may hurt performance. Stock and bond prices may fall or fail to rise over time for several reasons, including general financial market conditions, changing market perceptions (including, in the case of bonds, perceptions about the risk of default and expectations about changes in monetary policy or interest rates), changes in govern-ment intervention in the financial markets, and factors related to a specific issuer or industry. These and other factors may lead to increased volatility and reduced liquidity in the fund’s portfolio holdings. International investing involves currency, economic, and political risks. Emerging-market securities carry illiquidity and volatility risks. Investments in small and/or midsize companies increase the risk of greater price fluctuations. Growth stocks may be more susceptible to earnings disappointments, and value stocks may fail to rebound. Funds that invest in government securities are not guaranteed. Mortgage-backed investments, unlike traditional debt investments, are also subject to prepayment risk, which means that they may increase in value less than other bonds when interest rates decline and decline in value more than other bonds when interest rates rise. Bond investments are subject to interest-rate risk (the risk of bond prices falling if interest rates rise) and credit risk (the risk of an issuer defaulting on interest or prin-cipal payments). Default risk is generally higher for non-qualified mortgages. Interest-rate risk is generally greater for longer-term bonds, and credit risk is generally greater for below-investment-grade bonds. Unlike bonds, funds that invest in bonds have fees and expenses. The use of derivatives may increase these risks by increasing investment exposure (which may be considered leverage) or, in the case of over-the-counter instruments, because of the potential inability to terminate or sell derivatives positions and the potential failure of the other party to the instrument to meet its obligations. You can lose money by investing in the fund.

November 7, 2017
Dear Fellow Shareholder:
A fair amount of investor optimism has helped keep financial markets on a steady course throughout 2017. Global stock markets have generally made solid advances with low volatility, while bond market performance has been a bit more uneven. As we approach the closing weeks of the year, it is important to note that a number of macroeconomic and geopolitical risks around the world could disrupt market momentum.
In all market environments, we believe investors should remain focused on time-tested strategies: maintain a well-diversified portfolio, think about long-term goals, and speak regularly with your financial advisor. In the following pages, you will find an overview of your fund’s performance for the reporting period as well as an outlook for the coming months.
We would like to take this opportunity to recognize and thank Robert J. Darretta, John A. Hill, and W. Thomas Stephens, who recently retired from your fund’s Board of Trustees. We are grateful for their years of work on behalf of you and your fellow shareholders, and we wish them well in their future endeavors.
Thank you for investing with Putnam.
Respectfully yours,
Robert L. ReynoldsPresident and Chief Executive OfficerPutnam Investments
Jameson A. BaxterChair, Board of Trustees
Message from the Trustees

About the fund
A diversified portfolio pursuing growth worldwidePutnam Dynamic Asset Allocation Growth Fund is designed for investors seeking capital appreciation. The fund’s target mix of 80% stocks and 20% bonds has been developed to pursue this goal while moderating investment volatility.
The managers believe that spreading fund holdings across a variety of asset classes can help to smooth performance compared with the more extreme market ups and downs that can happen when investing in only one type of asset.
Active global research guides our portfolio decisions
Today, trends can spread quickly from one part of the world to affect markets everywhere. The four portfolio managers of Putnam’s Global Asset Allocation group have extensive experience analyzing how opportunities and risks are connected across borders. They follow a disciplined process to adjust the portfolio as market conditions change.
Robert J. Schoen
Chief Investment Officer, Global Asset Allocation Industry since 1990At Putnam since 1997
James A. Fetch
Co-Head of Global Asset AllocationIndustry since 1994At Putnam since 1994
Robert J. Kea, CFA
Co-Head of Global Asset AllocationIndustry since 1988At Putnam since 1989
Jason R. Vaillancourt, CFA
Co-Head of Global Asset AllocationIndustry since 1993At Putnam since 2000
Diversification can help to reduce volatility over time
With today’s market volatility, investors should consider evaluating the effectiveness of a portfolio over a full market cycle. Recent history has demonstrated that a more diversified portfolio can outperform in the long run.
CUMULATIVE RETURNS: 12/31/99–9/30/17
25/75 Portfolio 60/40 Portfolio S&P 500 Index total return
-50%
-25%
0%
25%
50%
75%
100%
125%
150%
175%
S&P500
40/60 Portfolio
25/75 Portfolio
9/1712/1512/1312/1112/0912/0712/0512/0312/0112/99
Note: 25/75 ➟ 25% S&P 500 Index, 75% Bloomberg Barclays U.S. Aggregate Bond Index; 60/40 ➟ 60% S&P 500 Index, 40% Bloomberg Barclays U.S. Aggregate Bond Index. Past performance is not indicative of future results. Other asset allocations may have had different returns during those time periods.
Dynamic Asset Allocation Growth Fund 3 2 Dynamic Asset Allocation Growth Fund
Performance history as of 9/30/17
Annualized total return (%) comparison
LIFE OF FUND†
(since 2/8/94)10 YEARS 5 YEARS 3 YEARS 1 YEAR
7.909.50
7.385.78
7.576.13
4.88
11.14
14.23
10.708.62 8.18
10.74
8.286.17
16.8418.71
15.63
12.35
The fund — class A sharesbefore sales chargePutnam Dynamic AssetAllocation Growth Fund(PAEAX)
Fund’s primary benchmarkRussell 3000 Index
Fund’s secondarybenchmarkPutnam GrowthBlended Benchmark*
Fund’s Lipper peer group averageMixed-Asset TargetAllocation GrowthFunds
Current performance may be lower or higher than the quoted past performance, which cannot guarantee future results. Share price, principal value, and return will fluctuate, and you may have a gain or a loss when you sell your shares. Performance of class A shares assumes reinvestment of distributions and does not account for taxes. Fund returns in the bar chart do not reflect a sales charge of 5.75%; had they, returns would have been lower. See below and pages 10–12 for additional performance information. For a portion of the periods, the fund had expense limitations, without which returns would have been lower. To obtain the most recent month-end performance, visit putnam.com.
* Putnam Growth Blended Benchmark is a blended benchmark administered by Putnam Management and comprises 60% the Russell 3000 Index, 15% the MSCI EAFE Index (ND), 15% the Bloomberg Barclays U.S. Aggregate Bond Index, 5% the JPMorgan Developed High Yield Index, and 5% the MSCI Emerging Markets Index (GD).
† The fund’s secondary benchmark, the Putnam Growth Blended Benchmark, was introduced on 12/31/94, which post-dates the inception of the fund’s class A shares.
Recent broad market index and fund performance
18.71%
18.61%
16.84%
15.63%
0.66%
0.07%
Fund’s primary benchmark
(Russell 3000 Index)
U.S. stocks
(S&P 500 Index)
Putnam Dynamic Asset Allocation Growth Fund
(class A shares before sales charge)
Fund’s secondary benchmark
(Putnam Growth Blended Benchmark)
Cash
(BofA Merrill Lynch U.S. 3-Month Treasury Bill Index)
U.S. bonds
(Bloomberg Barclays U.S. Aggregate Bond Index)
This comparison shows your fund’s performance in the context of broad market indexes for the 12 months ended 9/30/17. See above and pages 10–12 for additional fund performance information. Index descriptions can be found on pages 14–16.
4 Dynamic Asset Allocation Growth Fund

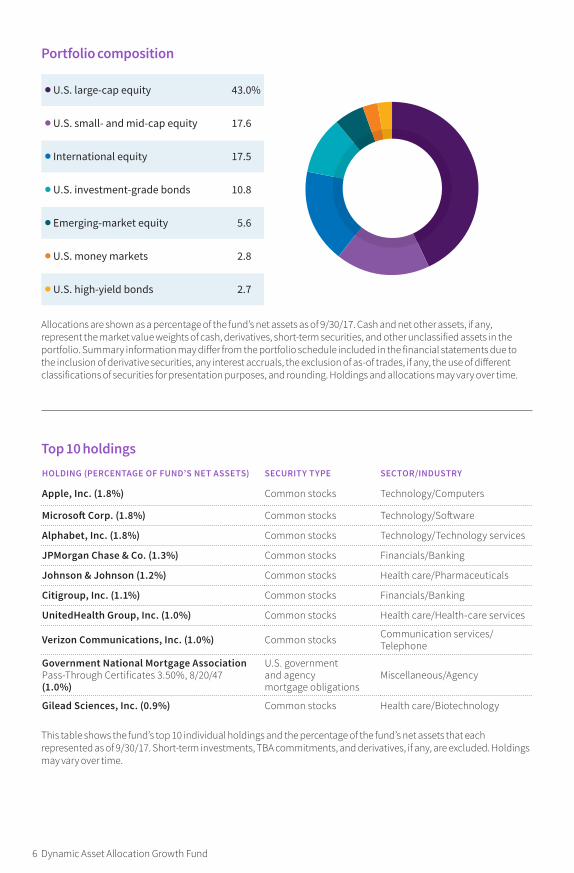
Interview with your fund’s portfolio manager
Robert J. Kea, CFAPortfolio Manager
Bob is Co-Head of Global Asset Allocation. He holds an M.B.A. from Bentley University and a B.A. from the University of Massachusetts, Amherst. He joined Putnam in 1989 and has been in the investment industry since 1988.
In addition to Bob, your fund’s portfolio managers are James A. Fetch; Robert J. Schoen; and Jason R. Vaillancourt, CFA.
How would you describe the global investment environment during the 12‑month reporting period ended September 30, 2017?Although uncertainty caused volatility in global stock markets near the end of the U.S. presidential campaign, the November 2016 win by Donald Trump was followed by a strong rally in the United States, fueled at least in part by investors’ expectations of tax reform, infrastructure spending, and business dereg-ulation. As the U.S. dollar rallied, international stocks lagged initially as investors considered potential negative effects on international trade suggested by Trump’s campaign rhetoric and rising populist sentiment in other countries.
International investors gradually turned their focus to solid economic fundamentals in developed and emerging markets, and global stocks began to gain momentum. Geopolitical concerns subsided during the first half of calendar year 2017 as moderate candidates won elections in France and the Netherlands, and trade policies in the United States remained largely unchanged several months into the Trump presidency. Strong corporate earnings reported in the United States for the first two
Bob Kea discusses fund performance and the investing environment for the 12-month period ended September 30, 2017, as well as his outlook for the global financial markets in the months ahead.
Interview with your fund’s portfolio managerPerformance history as of 9/30/17
Annualized total return (%) comparison
LIFE OF FUND†
(since 2/8/94)10 YEARS 5 YEARS 3 YEARS 1 YEAR
7.909.50
7.385.78
7.576.13
4.88
11.14
14.23
10.708.62 8.18
10.74
8.286.17
16.8418.71
15.63
12.35
The fund — class A sharesbefore sales chargePutnam Dynamic AssetAllocation Growth Fund(PAEAX)
Fund’s primary benchmarkRussell 3000 Index
Fund’s secondarybenchmarkPutnam GrowthBlended Benchmark*
Fund’s Lipper peer group averageMixed-Asset TargetAllocation GrowthFunds
Current performance may be lower or higher than the quoted past performance, which cannot guarantee future results. Share price, principal value, and return will fluctuate, and you may have a gain or a loss when you sell your shares. Performance of class A shares assumes reinvestment of distributions and does not account for taxes. Fund returns in the bar chart do not reflect a sales charge of 5.75%; had they, returns would have been lower. See below and pages 10–12 for additional performance information. For a portion of the periods, the fund had expense limitations, without which returns would have been lower. To obtain the most recent month-end performance, visit putnam.com.
* Putnam Growth Blended Benchmark is a blended benchmark administered by Putnam Management and comprises 60% the Russell 3000 Index, 15% the MSCI EAFE Index (ND), 15% the Bloomberg Barclays U.S. Aggregate Bond Index, 5% the JPMorgan Developed High Yield Index, and 5% the MSCI Emerging Markets Index (GD).
† The fund’s secondary benchmark, the Putnam Growth Blended Benchmark, was introduced on 12/31/94, which post-dates the inception of the fund’s class A shares.
Recent broad market index and fund performance
18.71%
18.61%
16.84%
15.63%
0.66%
0.07%
Fund’s primary benchmark
(Russell 3000 Index)
U.S. stocks
(S&P 500 Index)
Putnam Dynamic Asset Allocation Growth Fund
(class A shares before sales charge)
Fund’s secondary benchmark
(Putnam Growth Blended Benchmark)
Cash
(BofA Merrill Lynch U.S. 3-Month Treasury Bill Index)
U.S. bonds
(Bloomberg Barclays U.S. Aggregate Bond Index)
This comparison shows your fund’s performance in the context of broad market indexes for the 12 months ended 9/30/17. See above and pages 10–12 for additional fund performance information. Index descriptions can be found on pages 14–16.
Dynamic Asset Allocation Growth Fund 5
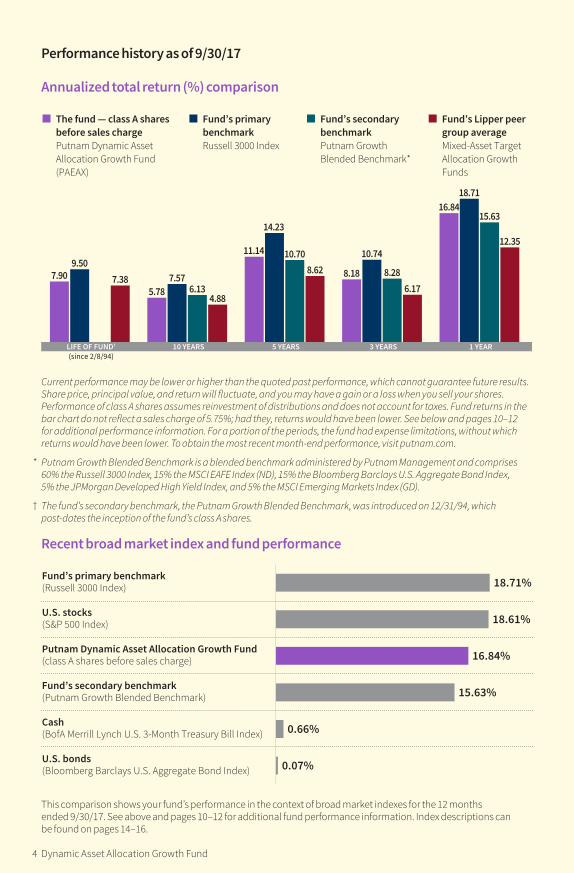
Top 10 holdingsHOLDING (PERCENTAGE OF FUND’S NET ASSETS) SECURITY TYPE SECTOR/INDUSTRY
Apple, Inc. (1.8%) Common stocks Technology/Computers
Microsoft Corp. (1.8%) Common stocks Technology/Software
Alphabet, Inc. (1.8%) Common stocks Technology/Technology services
JPMorgan Chase & Co. (1.3%) Common stocks Financials/Banking
Johnson & Johnson (1.2%) Common stocks Health care/Pharmaceuticals
Citigroup, Inc. (1.1%) Common stocks Financials/Banking
UnitedHealth Group, Inc. (1.0%) Common stocks Health care/Health-care services
Verizon Communications, Inc. (1.0%) Common stocks Communication services/Telephone
Government National Mortgage Association Pass-Through Certificates 3.50%, 8/20/47 (1.0%)
U.S. government and agency mortgage obligations
Miscellaneous/Agency
Gilead Sciences, Inc. (0.9%) Common stocks Health care/Biotechnology
This table shows the fund’s top 10 individual holdings and the percentage of the fund’s net assets that each represented as of 9/30/17. Short-term investments, TBA commitments, and derivatives, if any, are excluded. Holdings may vary over time.
Portfolio composition
U.S. large-cap equity 43.0%
U.S. small- and mid-cap equity 17.6
International equity 17.5
U.S. investment-grade bonds 10.8
Emerging-market equity 5.6
U.S. money markets 2.8
U.S. high-yield bonds 2.7
Allocations are shown as a percentage of the fund’s net assets as of 9/30/17. Cash and net other assets, if any, represent the market value weights of cash, derivatives, short-term securities, and other unclassified assets in the portfolio. Summary information may differ from the portfolio schedule included in the financial statements due to the inclusion of derivative securities, any interest accruals, the exclusion of as-of trades, if any, the use of different classifications of securities for presentation purposes, and rounding. Holdings and allocations may vary over time.
6 Dynamic Asset Allocation Growth Fund
quarters also supported equity prices. As the U.S. dollar cooled, bond markets stabilized, and investors expanded their appetites for riskier assets. Emerging-market stocks also provided positive performance.
Through the remainder of the period, equity markets experienced low volatility and positive momentum in the United States and globally, even against a backdrop of increasing tensions with North Korea and a destructive hurricane season. Lack of legislative progress on health care gave way to other administration priorities, with tax reform next on the agenda.
Citing stable economic growth, solid employ-ment, and a proactive stance regarding inflation, the Federal Open Market Committee [FOMC] raised rates a quarter point in December 2016, and again in March and June 2017, arriving at a target rate of 1.25%. For the 12-month period, the yield curve flattened as short-end rates consistently rose, and longer-term rates fell from highs established late in 2016. The Federal Reserve also formally announced its intention of beginning balance sheet reduction in October 2017.
How did Putnam Dynamic Asset Allocation Growth Fund perform during the 12‑month period ended September 30, 2017?Putnam Dynamic Asset Allocation Growth Fund performed in line with our expecta-tions, finishing the period strongly, though it underperformed the all-equity Russell 3000 benchmark [a broad index of U.S. stocks]. It outperformed its secondary benchmark, the Putnam Growth Blended Benchmark, which contains both stocks and bonds. Both dynamic asset allocation decisions, where asset class exposures are adjusted based on the group’s outlook, and active implementation decisions, including security selection, added value over the 12-month period.
What was the fund’s asset allocation strategy during the period, and how did it affect performance?Our tactical asset allocation approach during the 12-month period, in particular our pref-erence for equities over rate-sensitive fixed income, aided performance. During the period, both U.S. and global equities performed well, and our exposure to smaller-cap U.S. stocks was also rewarded as these slightly outperformed during the period. These returns came largely in response to ongoing expectations that the new U.S. administration would promote a tax agenda that favors small companies.
Regarding active implementation or security selection, results were initially mixed during the period, but improved steadily. We typically employ a selection strategy that uses quan-titative research and analysis to assemble a sector-neutral portfolio of stocks that we believe will outperform the broad U.S. equity market. Throughout the first half of the period, U.S. stock selection was rewarded, adding value above and beyond the general rally in stocks. International developed market equity selection, which uses a similar process, also added value. Fixed-income security selection, which focused on securitized debt, primarily mortgages, was also a notable positive contrib-utor. We also added value through security selection within emerging-market equities.
How did fixed‑income markets perform during the period ended September 30, 2017?Investment-grade bonds declined in price during the last few months of 2016, driving rates higher. The bond selloff was due to a number of factors, including anticipation of
As the U.S. dollar cooled, bond markets stabilized, and investors expanded their appetites for riskier assets. Bob Kea
Dynamic Asset Allocation Growth Fund 7

ongoing rate hikes by the Fed and expectations for rising inflation based on potential policy and spending under the new Trump admin-istration. Longer-term bond prices stabilized during the second half of the reporting period, however, as markets had mostly priced in Fed rate hikes in December 2016 and in March and June of 2017. Ultimately, the Bloomberg Barclays U.S. Aggregate Bond Index, a proxy for investment-grade bonds, was up just 0.07% for the period. High-yield bonds, in contrast, performed well during the period as measured by the JPMorgan Developed High Yield Index, which gained 9.65% as investors showed greater comfort with risk and the spread of high-yield bonds above U.S. Treasuries narrowed.
What is your outlook for the coming months?We expect to add value from active implemen-tation and security selection, given that asset allocations were generally close to benchmark at the end of the period. This view is based on what we perceive as a complicated global economic picture. Within dynamic allocation,
we expect to remain tactical in our approach across various markets.
Within the U.S. equity market, we believe it will likely take some time for the crosscurrents of domestic political and economic forces to sort themselves out, making flexibility important. We see strong but competing forces within both equity and credit markets, where stretched valuations and tighter spreads are balanced by continued momentum within each asset class. In rate-sensitive fixed income, we believe the long-term trend is for rates to increase, though global demand for U.S. rates dampens the near-term impact. We expect to see some improvement in commodities performance. Our quantitative model is bullish, and in our view, macroeconomic data suggest the global economy is firing on all cylinders, which is supportive of commodity prices.
Within security selection, we continue to pursue opportunities in both equities and fixed income. Within fixed income, we continue to focus on less-rate-sensitive sectors such as mortgages. The Fed is signaling a rate increase in December 2017, which would be the fourth
Portfolio composition comparison
40.8%43.0%
U.S. large-cap equityas of 3/31/17
as of 9/30/17
5.1%5.6%
Emerging-market equity
11.0%10.8%
U.S. investment-grade bonds
15.9%17.5%
International equity
18.8%17.6%
U.S. small- and mid-cap equity
This chart shows how the fund’s top weightings have changed over the past six months. Allocations are shown as a percentage of the fund’s net assets. Current period summary information may differ from the portfolio schedule included in the financial statements due to the inclusion of derivative securities, any interest accruals, the exclusion of as-of trades, if any, the use of different classifications of securities for presentation purposes, and rounding. Holdings and allocations may vary over time.
8 Dynamic Asset Allocation Growth Fund

in 13 months if it occurs. With the Fed also appearing, in our view, to be committed to a measured unwinding of its $4 trillion balance sheet, and other central banks hinting at eventual hikes, we believe that rates could move gradually higher.
Thank you, Bob, for your time and insights today.
The views expressed in this report are exclusively those of Putnam Management and are subject to change. They are not meant as investment advice.
Please note that the holdings discussed in this report may not have been held by the fund for the entire period. Portfolio composition is subject to review in accordance with the fund’s investment strategy and may vary in the future. Current and future portfolio holdings are subject to risk.
ABOUT DERIVATIVES
Derivatives are an increasingly common type of investment instrument, the perfor-mance of which is derived from an underlying security, index, currency, or other area of the capital markets. Derivatives employed by the fund’s managers generally serve one of two main purposes: to implement a strategy that may be difficult or more expensive to invest in through traditional securities, or to hedge unwanted risk associated with a particular position.
For example, the fund’s managers might use currency forward contracts to capitalize on an anticipated change in exchange rates between two currencies. This approach would require a significantly smaller outlay of capital than purchasing traditional bonds denomi-nated in the underlying currencies. In another example, the managers may identify a bond that they believe is undervalued relative to its risk of default, but may seek to reduce the interest-rate risk of that bond by using interest-rate swaps, a derivative through which two parties “swap” payments based on the movement of certain rates. In other examples, the managers may use options and futures contracts to hedge against a variety of risks by establishing a combination of long and short exposures to specific equity markets or sectors.
Like any other investment, derivatives may not appreciate in value and may lose money. Derivatives may amplify traditional investment risks through the creation of leverage and may be less liquid than traditional securities. And because derivatives typically represent contractual agreements between two financial institutions, derivatives entail “counterparty risk,” which is the risk that the other party is unable or unwilling to pay. Putnam monitors the counterparty risks we assume. For example, Putnam often enters into collateral agreements that require the counterparties to post collateral on a regular basis to cover their obligations to the fund. Counterparty risk for exchange-traded futures and centrally cleared swaps is mitigated by the daily exchange of margin and other safeguards against default through their respective clearinghouses.
Dynamic Asset Allocation Growth Fund 9
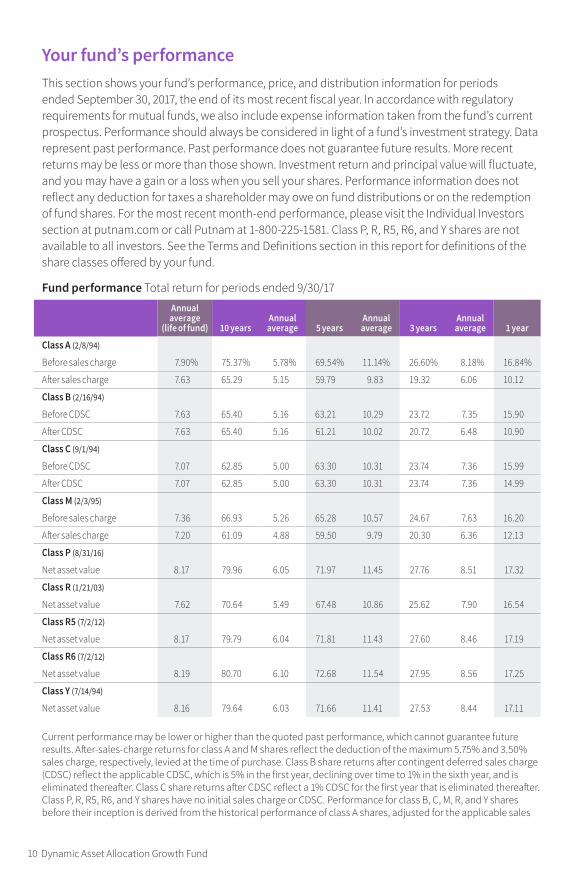
Your fund’s performanceThis section shows your fund’s performance, price, and distribution information for periods ended September 30, 2017, the end of its most recent fiscal year. In accordance with regulatory requirements for mutual funds, we also include expense information taken from the fund’s current prospectus. Performance should always be considered in light of a fund’s investment strategy. Data represent past performance. Past performance does not guarantee future results. More recent returns may be less or more than those shown. Investment return and principal value will fluctuate, and you may have a gain or a loss when you sell your shares. Performance information does not reflect any deduction for taxes a shareholder may owe on fund distributions or on the redemption of fund shares. For the most recent month-end performance, please visit the Individual Investors section at putnam.com or call Putnam at 1-800-225-1581. Class P, R, R5, R6, and Y shares are not available to all investors. See the Terms and Definitions section in this report for definitions of the share classes offered by your fund.
Fund performance Total return for periods ended 9/30/17
Annual average
(life of fund) 10 yearsAnnual average 5 years
Annual average 3 years
Annual average 1 year
Class A (2/8/94)
Before sales charge 7.90% 75.37% 5.78% 69.54% 11.14% 26.60% 8.18% 16.84%
After sales charge 7.63 65.29 5.15 59.79 9.83 19.32 6.06 10.12
Class B (2/16/94)
Before CDSC 7.63 65.40 5.16 63.21 10.29 23.72 7.35 15.90
After CDSC 7.63 65.40 5.16 61.21 10.02 20.72 6.48 10.90
Class C (9/1/94)
Before CDSC 7.07 62.85 5.00 63.30 10.31 23.74 7.36 15.99
After CDSC 7.07 62.85 5.00 63.30 10.31 23.74 7.36 14.99
Class M (2/3/95)
Before sales charge 7.36 66.93 5.26 65.28 10.57 24.67 7.63 16.20
After sales charge 7.20 61.09 4.88 59.50 9.79 20.30 6.36 12.13
Class P (8/31/16)
Net asset value 8.17 79.96 6.05 71.97 11.45 27.76 8.51 17.32
Class R (1/21/03)
Net asset value 7.62 70.64 5.49 67.48 10.86 25.62 7.90 16.54
Class R5 (7/2/12)
Net asset value 8.17 79.79 6.04 71.81 11.43 27.60 8.46 17.19
Class R6 (7/2/12)
Net asset value 8.19 80.70 6.10 72.68 11.54 27.95 8.56 17.25
Class Y (7/14/94)
Net asset value 8.16 79.64 6.03 71.66 11.41 27.53 8.44 17.11
Current performance may be lower or higher than the quoted past performance, which cannot guarantee future results. After-sales-charge returns for class A and M shares reflect the deduction of the maximum 5.75% and 3.50% sales charge, respectively, levied at the time of purchase. Class B share returns after contingent deferred sales charge (CDSC) reflect the applicable CDSC, which is 5% in the first year, declining over time to 1% in the sixth year, and is eliminated thereafter. Class C share returns after CDSC reflect a 1% CDSC for the first year that is eliminated thereafter. Class P, R, R5, R6, and Y shares have no initial sales charge or CDSC. Performance for class B, C, M, R, and Y shares before their inception is derived from the historical performance of class A shares, adjusted for the applicable sales
10 Dynamic Asset Allocation Growth Fund

charge (or CDSC) and the higher operating expenses for such shares, except for class Y shares, for which 12b-1 fees are not applicable. Performance for class P, R5, and R6 shares prior to their inception is derived from the historical performance of class Y shares and has not been adjusted for the lower investor servicing fees applicable to class P, R5, and R6 shares; had it, returns would have been higher.
For a portion of the periods, the fund had expense limitations, without which returns would have been lower.
Class B share performance reflects conversion to class A shares after eight years.
Comparative index returns For periods ended 9/30/17
Annual average
(life of fund) 10 yearsAnnual average 5 years
Annual average 3 years
Annual average 1 year
Russell 3000 Index 9.50% 107.46% 7.57% 94.45% 14.23% 35.79% 10.74% 18.71%
Putnam Growth Blended Benchmark* —† 81.37 6.13 66.26 10.70 26.95 8.28 15.63
Lipper Mixed-Asset Target Allocation Growth Funds category average‡
7.38 62.19 4.88 51.50 8.62 19.78 6.17 12.35
Index and Lipper results should be compared with fund performance before sales charge, before CDSC, or at net asset value.
* Putnam Growth Blended Benchmark is a blended benchmark administered by Putnam Management and comprises 60% the Russell 3000 Index, 15% the MSCI EAFE Index (ND), 15% the Bloomberg Barclays U.S. Aggregate Bond Index, 5% the JPMorgan Developed High Yield Index, and 5% the MSCI Emerging Markets Index (GD).
† The fund’s secondary benchmark, the Putnam Growth Blended Benchmark, was introduced on 12/31/94, which post-dates the inception of the fund’s class A shares.
‡ Over the 1-year, 3-year, 5-year, 10-year, and life-of-fund periods ended 9/30/17, there were 503, 450, 420, 313, and 48 funds, respectively, in this Lipper category.
Change in the value of a $10,000 investment ($9,425 after sales charge)Cumulative total return from 9/30/07 to 9/30/17
$5,000
$10,000
$15,000
’07 ’08 ’09 ’10 ’11 ’12 ’13 ’14 ’15 ’16 ’17
$20,746
$18,137
Putnam Dynamic Asset Allocation Growth Fund class A shares a�er sales charge
Russell 3000 Index
Putnam Growth Blended Benchmark
$9,425$16,529
Past performance does not indicate future results. At the end of the same time period, a $10,000 investment in the fund’s class B and C shares would have been valued at $16,540 and $16,285, respectively, and no contingent deferred sales charges would apply. A $10,000 investment in the fund’s class M shares ($9,650 after sales charge) would have been valued at $16,109. A $10,000 investment in the fund’s class P, R, R5, R6, and Y shares would have been valued at $17,996,$17,064, $17,979, $18,070, and $17,964, respectively.
Dynamic Asset Allocation Growth Fund 11

Fund price and distribution information For the 12-month period ended 9/30/17
Distributions Class A Class B Class C Class M Class P Class R Class R 5 Class R 6 Class Y
Number 1 1 1 1 1 1 1 1 1
Income $0.059 — — — $0.077 $0.035 $0.097 $0.119 $0.084
Capital gains
Long-term gains 0.188 $0.188 $0.188 $0.188 0.188 0.188 0.188 0.188 0.188
Short-term gains — — — — — — — — —
Total $0.247 $0.188 $0.188 $0.188 $0.265 $0.223 $0.285 $0.307 $0.272
Share value
Before sales
charge
After sales
charge
Net asset value
Net asset value
Before sales
charge
After sales
charge
Net asset value
Net asset value
Net asset value
Net asset value
Net asset value
9/30/16 $15.50 $16.45 $15.17 $14.65 $15.14 $15.69 $15.66 $15.19 $15.67 $15.71 $15.66
9/30/17 17.83 18.92 17.37 16.78 17.38 18.01 18.07 17.45 18.04 18.07 18.03
The classification of distributions, if any, is an estimate. Before-sales-charge share value and current dividend rate for class A and M shares, if applicable, do not take into account any sales charge levied at the time of purchase. After-sales-charge share value, current dividend rate, and current 30-day SEC yield, if applicable, are calculated assuming that the maximum sales charge (5.75% for class A shares and 3.50% for class M shares) was levied at the time of purchase. Final distribution information will appear on your year-end tax forms.
Your fund’s expensesAs a mutual fund investor, you pay ongoing expenses, such as management fees, distribution fees (12b-1 fees), and other expenses. Using the following information, you can estimate how these expenses affect your investment and compare them with the expenses of other funds. You may also pay one-time transaction expenses, including sales charges (loads) and redemption fees, which are not shown in this section and would have resulted in higher total expenses. For more information, see your fund’s prospectus or talk to your financial representative.
Expense ratiosClass A Class B Class C Class M Class P Class R Class R5 Class R6 Class Y
Total annual operating expenses for the fiscal year ended 9/30/16* 1.11%* 1.86%* 1.86%* 1.61%* 0.68%† 1.36%* 0.82% 0.72% 0.86%*
Annualized expense ratio for the six-month period ended 9/30/17†‡ 1.06% 1.81% 1.81% 1.56% 0.66% 1.31% 0.80% 0.70% 0.81%
Fiscal-year expense information in this table is taken from the most recent prospectus, is subject to change, and may differ from that shown for the annualized expense ratio and in the financial highlights of this report.
Prospectus expense information also includes the impact of acquired fund fees and expenses of 0.01%, which is not included in the financial highlights or annualized expense ratios. Expenses are shown as a percentage of average net assets.
* Restated to reflect current fees resulting from a change to the fund’s investor servicing arrangements effective 9/1/16.
† Other expenses are based on experiences of class A shares for the fund’s last fiscal year, adjusted to reflect the lower investor servicing fees applicable to class P shares.
‡ Expense ratios for each class are for the fund’s most recent fiscal half year. As a result of this, ratios may differ from expense ratios based on one-year data in the financial highlights.
12 Dynamic Asset Allocation Growth Fund

Expenses per $1,000The following table shows the expenses you would have paid on a $1,000 investment in each class of the fund from 4/1/17 to 9/30/17. It also shows how much a $1,000 investment would be worth at the close of the period, assuming actual returns and expenses.
Class A Class B Class C Class M Class P Class R Class R5 Class R6 Class Y
Expenses paid per $1,000*† $5.54 $9.43 $9.43 $8.14 $3.45 $6.84 $4.18 $3.66 $4.23
Ending value (after expenses) $1,083.20 $1,078.90 $1,079.10 $1,080.20 $1,085.30 $1,081.80 $1,084.80 $1,085.30 $1,084.20
* Expenses for each share class are calculated using the fund’s annualized expense ratio for each class, which represents the ongoing expenses as a percentage of average net assets for the six months ended 9/30/17. The expense ratio may differ for each share class.
† Expenses are calculated by multiplying the expense ratio by the average account value for the period; then multiplying the result by the number of days in the period; and then dividing that result by the number of days in the year.
Estimate the expenses you paidTo estimate the ongoing expenses you paid for the six months ended 9/30/17, use the following calculation method. To find the value of your investment on 4/1/17, call Putnam at 1-800-225-1581.
How to calculate the expenses you paid
Value of your investment on 4/1/17 ÷ $1,000 x Expenses paid per $1,000 = Total expenses paid
Example Based on a $10,000 investment in class A shares of your fund.
$10,000 ÷ $1,000 x $5.54 (see preceding table) = $55.40
Compare expenses using the SEC’s methodThe Securities and Exchange Commission (SEC) has established guidelines to help investors assess fund expenses. Per these guidelines, the following table shows your fund’s expenses based on a $1,000 investment, assuming a hypothetical 5% annualized return. You can use this information to compare the ongoing expenses (but not transaction expenses or total costs) of investing in the fund with those of other funds. All mutual fund shareholder reports will provide this information to help you make this comparison. Please note that you cannot use this information to estimate your actual ending account balance and expenses paid during the period.
Class A Class B Class C Class M Class P Class R Class R5 Class R6 Class Y
Expenses paid per $1,000*† $5.37 $9.15 $9.15 $7.89 $3.35 $6.63 $4.05 $3.55 $4.10
Ending value (after expenses) $1,019.75 $1,015.99 $1,015.99 $1,017.25 $1,021.76 $1,018.50 $1,021.06 $1,021.56 $1,021.01
* Expenses for each share class are calculated using the fund’s annualized expense ratio for each class, which represents the ongoing expenses as a percentage of average net assets for the six months ended 9/30/17. The expense ratio may differ for each share class.
† Expenses are calculated by multiplying the expense ratio by the average account value for the six-month period; then multiplying the result by the number of days in the six-month period; and then dividing that result by the number of days in the year.
Dynamic Asset Allocation Growth Fund 13
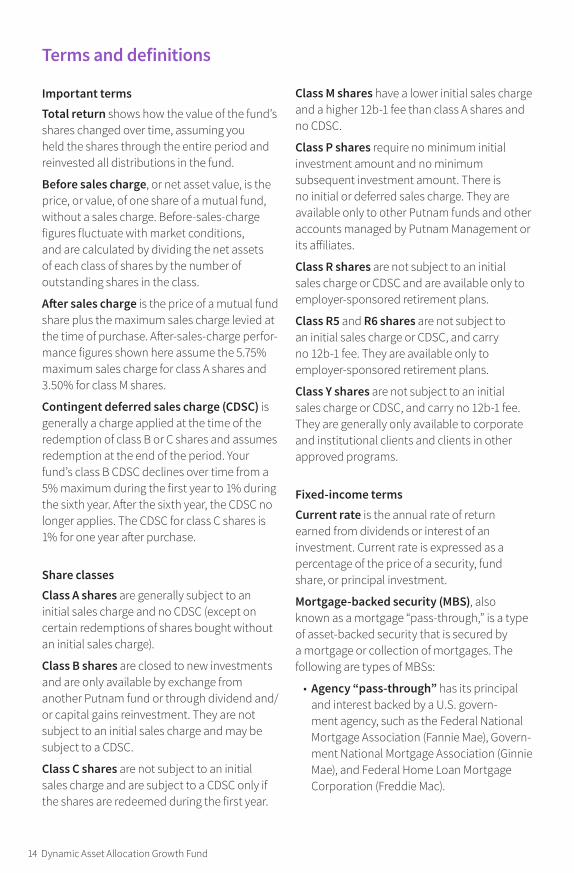
Terms and definitions
Important termsTotal return shows how the value of the fund’s shares changed over time, assuming you held the shares through the entire period and reinvested all distributions in the fund.
Before sales charge, or net asset value, is the price, or value, of one share of a mutual fund, without a sales charge. Before-sales-charge figures fluctuate with market conditions, and are calculated by dividing the net assets of each class of shares by the number of outstanding shares in the class.
After sales charge is the price of a mutual fund share plus the maximum sales charge levied at the time of purchase. After-sales-charge perfor-mance figures shown here assume the 5.75% maximum sales charge for class A shares and 3.50% for class M shares.
Contingent deferred sales charge (CDSC) is generally a charge applied at the time of the redemption of class B or C shares and assumes redemption at the end of the period. Your fund’s class B CDSC declines over time from a 5% maximum during the first year to 1% during the sixth year. After the sixth year, the CDSC no longer applies. The CDSC for class C shares is 1% for one year after purchase.
Share classesClass A shares are generally subject to an initial sales charge and no CDSC (except on certain redemptions of shares bought without an initial sales charge).
Class B shares are closed to new investments and are only available by exchange from another Putnam fund or through dividend and/or capital gains reinvestment. They are not subject to an initial sales charge and may be subject to a CDSC.
Class C shares are not subject to an initial sales charge and are subject to a CDSC only if the shares are redeemed during the first year.
Class M shares have a lower initial sales charge and a higher 12b-1 fee than class A shares and no CDSC.
Class P shares require no minimum initial investment amount and no minimum subsequent investment amount. There is no initial or deferred sales charge. They are available only to other Putnam funds and other accounts managed by Putnam Management or its affiliates.
Class R shares are not subject to an initial sales charge or CDSC and are available only to employer-sponsored retirement plans.
Class R5 and R6 shares are not subject to an initial sales charge or CDSC, and carry no 12b-1 fee. They are available only to employer-sponsored retirement plans.
Class Y shares are not subject to an initial sales charge or CDSC, and carry no 12b-1 fee. They are generally only available to corporate and institutional clients and clients in other approved programs.
Fixed-income termsCurrent rate is the annual rate of return earned from dividends or interest of an investment. Current rate is expressed as a percentage of the price of a security, fund share, or principal investment.
Mortgage-backed security (MBS), also known as a mortgage “pass-through,” is a type of asset-backed security that is secured by a mortgage or collection of mortgages. The following are types of MBSs:
• Agency “pass-through” has its principal and interest backed by a U.S. govern-ment agency, such as the Federal National Mortgage Association (Fannie Mae), Govern-ment National Mortgage Association (Ginnie Mae), and Federal Home Loan Mortgage Corporation (Freddie Mac).
14 Dynamic Asset Allocation Growth Fund

• Collateralized mortgage obligation (CMO) represents claims to specific cash flows from pools of home mortgages. The streams of principal and interest payments on the mortgages are distributed to the different classes of CMO interests in “tranches.” Each tranche may have different principal balances, coupon rates, prepay-ment risks, and maturity dates. A CMO is highly sensitive to changes in interest rates and any resulting change in the rate at which homeowners sell their properties, refinance, or otherwise prepay loans. CMOs are subject to prepayment, market, and liquidity risks.
• Interest-only (IO) security is a type of CMO in which the underlying asset is the interest portion of mortgage, Treasury, or bond payments.
• Non-agency residential mortgage-backed security (RMBS) is an MBS not backed by Fannie Mae, Ginnie Mae, or Freddie Mac. One type of RMBS is an Alt-A mortgage-backed security.
• Commercial mortgage-backed security (CMBS) is secured by the loan on a commercial property.
Yield curve is a graph that plots the yields of bonds with equal credit quality against their differing maturity dates, ranging from shortest to longest. It is used as a benchmark for other debt, such as mortgage or bank lending rates.
Comparative indexesBloomberg Barclays U.S. Aggregate Bond Index is an unmanaged index of U.S. investment-grade fixed-income securities.
BofA Merrill Lynch U.S. 3-Month Treasury Bill Index is an unmanaged index that seeks to measure the performance of U.S. Treasury bills available in the marketplace.
JPMorgan Developed High Yield Index is an unmanaged index of high-yield fixed-income securities issued in developed countries.
MSCI EAFE Index (ND) is a free float-adjusted market capitalization index that is designed to measure the equity performance of large and mid-cap markets in developed countries, excluding the U.S. and Canada. Calculated with net dividends (ND), this total return index reflects the reinvestment of dividends after the deduction of withholding taxes, using a tax rate applicable to non-resident institutional investors who do not benefit from double taxation treaties.
MSCI Emerging Markets Index (GD) is a free float-adjusted market capitalization index that is designed to measure equity market perfor-mance in the global emerging markets. Gross dividend (GD) total return indexes reinvest as much as possible of a company’s dividend distributions. The reinvested amount is equal to the total dividend amount distributed to persons residing in the country of the dividend-paying company. Gross total return indexes do not, however, include any tax credits.
Putnam Growth Blended Benchmark is a benchmark administered by Putnam Manage-ment, comprising 60% the Russell 3000 Index, 15% the MSCI EAFE Index (ND), 15% the Bloomberg Barclays U.S. Aggregate Bond Index, 5% the JPMorgan Developed High Yield Index, and 5% the MSCI Emerging Markets Index (GD).
Russell 3000 Index is an unmanaged index of the 3,000 largest U.S. companies.
S&P 500 Index is an unmanaged index of common stock performance.Indexes assume reinvestment of all distributions and do not account for fees. Securities and performance of a fund and an index will differ. You cannot invest directly in an index.
Frank Russell Company is the source and owner of the trademarks, service marks, and copyrights related to the Russell Indexes. Russell® is a trademark of Frank Russell Company.
Merrill Lynch, Pierce, Fenner & Smith Incorporated (“BofAML”), used with permission. BofAML permits use of the BofAML indices and related data on an “as is” basis, makes no warranties regarding same, does not guarantee the suitability, quality, accuracy, timeliness, and/or completeness of the BofAML indices or any data
Dynamic Asset Allocation Growth Fund 15

included in, related to, or derived therefrom, assumes no liability in connection with the use of the foregoing, and does not sponsor, endorse, or recommend Putnam Investments, or any of its products or services.
Lipper is a third-party industry-ranking entity that ranks mutual funds. Its rankings do not reflect sales charges. Lipper rankings are based
on total return at net asset value relative to other funds that have similar current invest-ment styles or objectives as determined by Lipper. Lipper may change a fund’s category assignment at its discretion. Lipper category averages reflect performance trends for funds within a category.
Other information for shareholders
Proxy votingPutnam is committed to managing our mutual funds in the best interests of our shareholders. The Putnam funds’ proxy voting guidelines and procedures, as well as information regarding how your fund voted proxies relating to portfolio securities during the 12-month period ended June 30, 2017, are available in the Individual Investors section of putnam.com, and on the Securities and Exchange Commis-sion (SEC) website, www.sec.gov. If you have questions about finding forms on the SEC’s website, you may call the SEC at 1-800-SEC-0330. You may also obtain the Putnam funds’ proxy voting guidelines and procedures at no charge by calling Putnam’s Shareholder Services at 1-800-225-1581.
Fund portfolio holdingsThe fund will file a complete schedule of its portfolio holdings with the SEC for the first and
third quarters of each fiscal year on Form N-Q. Shareholders may obtain the fund’s Form N-Q on the SEC’s website at www.sec.gov. In addition, the fund’s Form N-Q may be reviewed and copied at the SEC’s Public Reference Room in Washington, D.C. You may call the SEC at 1-800-SEC-0330 for information about the SEC’s website or the operation of the Public Reference Room.
Trustee and employee fund ownershipPutnam employees and members of the Board of Trustees place their faith, confidence, and, most importantly, investment dollars in Putnam mutual funds. As of September 30, 2017, Putnam employees had approximately $509,000,000 and the Trustees had approxi-mately $90,000,000 invested in Putnam mutual funds. These amounts include investments by the Trustees’ and employees’ immediate family members as well as investments through retirement and deferred compensation plans.
16 Dynamic Asset Allocation Growth Fund

Important notice regarding Putnam’s privacy policy
In order to conduct business with our shareholders, we must obtain certain personal information such as account holders’ names, addresses, Social Security numbers, and dates of birth. Using this information, we are able to maintain accurate records of accounts and transactions.
It is our policy to protect the confidentiality of our shareholder information, whether or not a shareholder currently owns shares of our funds. In particular, it is our policy not to sell information about you or your accounts to outside marketing firms. We have safeguards in place designed to prevent unauthor-ized access to our computer systems and procedures to protect personal information from unauthorized use.
Under certain circumstances, we must share account information with outside vendors who provide services to us, such as mailings and proxy solicitations. In these cases, the service providers enter into confidentiality agreements with us, and we provide only the information necessary to process transactions and perform other services related to your account. Finally, it is our policy to share account information with your financial representative, if you’ve listed one on your Putnam account.
Dynamic Asset Allocation Growth Fund 17

Trustee approval of management contract
Trustee approval of management contract
General conclusionsThe Board of Trustees of The Putnam Funds oversees the management of each fund and, as required by law, determines annually whether to approve the continuance of your fund’s management contract with Putnam Investment Management, LLC (“Putnam Management”), the sub-management contract with respect to your fund between Putnam Management and its affiliate, Putnam Investments Limited (“PIL”), and the sub-advisory contract among Putnam Management, PIL, and another affiliate, The Putnam Advisory Company (“PAC”). The Board, with the assistance of its Contract Committee, requests and evaluates all information it deems reasonably necessary under the circumstances in connection with its annual contract review. The Contract Committee consists solely of Trustees who are not “interested persons” (as this term is defined in the Investment Company Act of 1940, as amended (the “1940 Act”)) of The Putnam Funds (“Independent Trustees”).
At the outset of the review process, members of the Board’s independent staff and independent legal counsel discussed with representatives of Putnam Management the annual contract review materials furnished to the Contract Committee during the course of the previous year’s review, identifying possible changes in these materi-als that might be necessary or desirable for the coming year. Following these discussions and in consultation with the Contract Committee, the Independent Trustees’ independent legal counsel requested that Putnam Management and its affiliates furnish specified information, together with any additional information that Putnam Management considered relevant, to the Contract Committee. Over the course of several months ending in June 2017, the Contract Committee met on a number of occasions with representatives of Putnam Management, and separately in executive session, to consider the information that Putnam Management provided. Throughout this process, the Contract Committee was assisted by the members of the Board’s independent staff and by independent legal counsel for The Putnam Funds and the Independent Trustees.
In May 2017, the Contract Committee met in executive session to discuss and consider its recommendations with respect to the continuance of the contracts. At the Trustees’
June 2017 meeting, the Contract Committee met in executive session with the other Independent Trustees to review a summary of the key financial, performance and other data that the Contract Committee considered in the course of its review. The Contract Committee then presented its written report, which summarized the key factors that the Committee had considered and set forth its recommendations. The Contract Committee recommended, and the Independent Trust-ees approved, the continuance of your fund’s management, sub-management and sub-advisory contracts, effective July 1, 2017. (Because PIL and PAC are affiliates of Putnam Management and Putnam Management remains fully responsible for all services provided by PIL and PAC, the Trust-ees have not attempted to evaluate PIL or PAC as separate entities, and all subsequent references to Putnam Management below should be deemed to include reference to PIL and PAC as necessary or appropriate in the context.)
The Independent Trustees’ approval was based on the following conclusions:
• That the fee schedule in effect for your fund repre-sented reasonable compensation in light of the nature and quality of the services being provided to the fund, the fees paid by competitive funds, the costs incurred by Putnam Management in providing services to the fund, and the continued application of certain reductions and waivers noted below; and
• That the fee schedule in effect for your fund represented an appropriate sharing between fund shareholders and Putnam Management of such economies of scale as may exist in the management of the fund at current asset levels.
These conclusions were based on a comprehen-sive consideration of all information provided to the Trustees and were not the result of any single factor. Some of the factors that figured particu-larly in the Trustees’ deliberations and how the Trustees considered these factors are described below, although individual Trustees may have evaluated the information presented differently, giving different weights to various factors. It is also important to recognize that the management arrangements for your fund and the other Putnam funds are the result of many years of review and discussion between the Independent Trustees and Putnam Management, that some aspects of
18 Dynamic Asset Allocation Growth Fund
the arrangements may receive greater scrutiny in some years than others, and that the Trust-ees’ conclusions may be based, in part, on their consideration of fee arrangements in previous years. For example, with some minor exceptions, the funds’ current fee arrangements under the management contracts were first implemented at the beginning of 2010 following extensive review by the Contract Committee and discussions with representatives of Putnam Management, as well as approval by shareholders.
Management fee schedules and total expensesThe Trustees reviewed the management fee schedules in effect for all Putnam funds, includ-ing fee levels and breakpoints. The Trustees also reviewed the total expenses of each Putnam fund, recognizing that in most cases management fees represented the major, but not the sole, deter-minant of total costs to fund shareholders. (In a few instances, funds have implemented so-called “all-in” management fees covering substantially all routine fund operating costs.)
In reviewing fees and expenses, the Trustees generally focus their attention on material changes in circumstances — for example, changes in assets under management, changes in a fund’s investment strategy, changes in Putnam Management’s operating costs or profitability, or changes in competitive practices in the mutual fund industry — that suggest that consideration of fee changes might be warranted. The Trustees concluded that the circumstances did not indicate that changes to the management fee structure for your fund would be appropriate at this time.
Under its management contract, your fund has the benefit of breakpoints in its management fee schedule that provide shareholders with econo-mies of scale in the form of reduced fee rates as assets under management in the Putnam family of funds increase. The Trustees concluded that the fee schedule in effect for your fund represented an appropriate sharing of econo-mies of scale between fund shareholders and Putnam Management.
As in the past, the Trustees also focused on the competitiveness of each fund’s total expense ratio. In order to support the effort to have fund expenses meet competitive standards, the Trust-ees and Putnam Management have implemented certain expense limitations that were in effect during your fund’s fiscal year ending in 2016.
These expense limitations were: (i) a contractual expense limitation applicable to specified retail open-end funds, including your fund, of 25 basis points (until September 1, 2016, this limitation was 32 basis points) on investor servicing fees and expenses and (ii) a contractual expense limitation applicable to specified open-end funds, including your fund, of 20 basis points on so-called “other expenses” (i.e., all expenses exclusive of manage-ment fees, distribution fees, investor servicing fees, investment-related expenses, interest, taxes, brokerage commissions, acquired fund fees and expenses and extraordinary expenses). These expense limitations attempt to maintain compet-itive expense levels for the funds. Most funds, including your fund, had sufficiently low expenses that these expense limitations were not operative during their fiscal years ending in 2016. Putnam Management has agreed to maintain the 25 basis points expense limitation until at least August 31, 2018 and to maintain the 20 basis points expense limitation until at least January 30, 2019. Putnam Management’s support for these expense limita-tion arrangements was an important factor in the Trustees’ decision to approve the continuance of your fund’s management, sub-management and sub-advisory contracts.
The Trustees reviewed comparative fee and expense information for a custom group of competitive funds selected by Broadridge Financial Solutions, Inc. (“Broadridge”). This comparative information included your fund’s percentile ranking for effective management fees and total expenses (excluding any applicable 12b-1 fee), which provides a general indication of your fund’s relative standing. In the custom peer group, your fund ranked in the third quintile in effective management fees (determined for your fund and the other funds in the custom peer group based on fund asset size and the applicable contractual management fee schedule) and in the third quintile in total expenses (excluding any applicable 12b-1 fees) as of December 31, 2016. The first quintile represents the least expensive funds and the fifth quintile the most expensive funds. The fee and expense data reported by Broadridge as of December 31, 2016 reflected the most recent fiscal year-end data available in Broadridge’s database at that time.
In connection with their review of fund manage-ment fees and total expenses, the Trustees also reviewed the costs of the services provided and the profits realized by Putnam Management and its affiliates from their contractual relationships
Dynamic Asset Allocation Growth Fund 19

with the funds. This information included trends in revenues, expenses and profitability of Putnam Management and its affiliates relating to the investment management, investor servicing and distribution services provided to the funds. In this regard, the Trustees also reviewed an analysis of Putnam Management’s revenues, expenses and profitability, allocated on a fund-by-fund basis, with respect to the funds’ management, distribu-tion, and investor servicing contracts. For each fund, the analysis presented information about revenues, expenses and profitability for each of the agreements separately and for the agree-ments taken together on a combined basis. The Trustees concluded that, at current asset levels, the fee schedules in place represented reasonable compensation for the services being provided and represented an appropriate sharing between fund shareholders and Putnam Management of such economies of scale as may exist in the management of the Putnam funds at that time.
The information examined by the Trustees in connection with their annual contract review for the Putnam funds included information regard-ing fees charged by Putnam Management and its affiliates to institutional clients, including defined benefit pension and profit-sharing plans, charities, college endowments, foundations, sub-advised third-party mutual funds, state, local and non-U.S. government entities, and corpora-tions. This information included, in cases where an institutional product’s investment strategy corresponds with a fund’s strategy, comparisons of those fees with fees charged to the Putnam funds, as well as an assessment of the differences in the services provided to these different types of clients as compared to the services provided to the Putnam Funds. The Trustees observed that the differences in fee rates between these clients and the Putnam funds are by no means uniform when examined by individual asset sectors, suggesting that differences in the pricing of invest-ment management services to these types of clients may reflect, among other things, historical competitive forces operating in separate markets. The Trustees considered the fact that in many cases fee rates across different asset classes are higher on average for mutual funds than for insti-tutional clients, as well as the differences between the services that Putnam Management provides to the Putnam funds and those that it provides to its other clients. The Trustees did not rely on these comparisons to any significant extent in
concluding that the management fees paid by your fund are reasonable.
Investment performanceThe quality of the investment process provided by Putnam Management represented a major factor in the Trustees’ evaluation of the quality of services provided by Putnam Management under your fund’s management contract. The Trust-ees were assisted in their review of the Putnam funds’ investment process and performance by the work of the investment oversight committees of the Trustees, which meet on a regular basis with the funds’ portfolio teams and with the Chief Investment Officers and other senior members of Putnam Management’s Investment Division throughout the year. In addition, in response to a request from the Independent Trustees, Putnam Management provided the Trustees with in-depth presentations regarding each of the equity and fixed income investment teams, including the operation of the teams and their investment approaches. The Trustees concluded that Putnam Management generally provides a high-quality investment process — based on the experience and skills of the individuals assigned to the management of fund portfolios, the resources made available to them, and in general Putnam Management’s ability to attract and retain high-quality personnel — but also recognized that this does not guarantee favorable investment results for every fund in every time period.
The Trustees considered that 2016 was a challeng-ing year for the performance of the Putnam funds, with generally disappointing results for the inter-national and global equity funds and taxable fixed income funds, mixed results for small-cap equity, Spectrum, global asset allocation, equity research and tax exempt fixed income funds, but generally strong results for U.S. equity funds. The Trustees noted, however, that they were encouraged by the positive performance trend since mid-year 2016 across most Putnam Funds. In particular, from May 1, 2016 through April 30, 2017, 51% of Putnam Fund assets were in the top quartile and 87% were above the median of the Putnam Funds’ competitive industry rankings. They noted that the longer-term performance of the Putnam funds generally continued to be strong, exemplified by the fact that the Putnam funds were ranked by the Barron’s/Lipper Fund Families survey as the 5th-best performing mutual fund complex out of 54 complexes for the five-year period ended December 31, 2016. In addition, while the survey
20 Dynamic Asset Allocation Growth Fund

ranked the Putnam Funds 52nd out of 61 mutual fund complexes for the one-year period ended 2016, the Putnam Funds have ranked 1st or 2nd in the survey for the one-year period three times since 2009 (most recently in 2013). They also noted, however, the disappointing investment performance of some funds for periods ended December 31, 2016 and considered information provided by Putnam Management regarding the factors contributing to the underperformance and actions being taken to improve the performance of these particular funds. The Trustees indicated their intention to continue to monitor closely the performance of those funds, including the effec-tiveness of any efforts Putnam Management has undertaken to address underperformance and whether additional actions to address areas of underperformance are warranted.
For purposes of the Trustees’ evaluation of the Putnam Funds’ investment performance, the Trustees generally focus on a competitive indus-try ranking of each fund’s total net return over a one-year, three-year and five-year period. For a number of Putnam funds with relatively unique investment mandates for which Putnam Manage-ment informed the Trustees that meaningful competitive performance rankings are not considered to be available, the Trustees evalu-ated performance based on their total gross and net returns and, in most cases, comparisons of those returns with the returns of selected invest-ment benchmarks. In the case of your fund, the Trustees considered that its class A share cumulative total return performance at net asset value was in the following quartiles of its Lipper Inc. (“Lipper”) peer group (Lipper Mixed-Asset Target Allocation Growth Funds) for the one-year, three-year and five-year periods ended December 31, 2016 (the first quartile representing the best-performing funds and the fourth quartile the worst-performing funds):
One-year period 2ndThree-year period 1stFive-year period 1st
For the five-year period ended December 31, 2016, your fund’s performance was in the top decile of its Lipper peer group. Over the one-year, three-year and five-year periods ended December 31, 2016, there were 506, 455 and 409 funds, respec-tively, in your fund’s Lipper peer group. (When considering performance information, sharehold-ers should be mindful that past performance is not a guarantee of future results.)
The Trustees also considered Putnam Manage-ment’s continued efforts to support fund performance through initiatives including struc-turing compensation for portfolio managers and research analysts to enhance accountability for fund performance, emphasizing accountability in the portfolio management process, and affirm-ing its commitment to a fundamental-driven approach to investing. The Trustees noted further that Putnam Management continued to strengthen its fundamental research capabilities by adding new investment personnel.
Brokerage and soft-dollar allocations; investor servicingThe Trustees considered various potential benefits that Putnam Management may receive in connection with the services it provides under the management contract with your fund. These include benefits related to brokerage allocation and the use of soft dollars, whereby a portion of the commissions paid by a fund for brokerage may be used to acquire research services that are expected to be useful to Putnam Management in managing the assets of the fund and of other clients. Subject to policies established by the Trustees, soft dollars generated by these means are used predominantly to acquire brokerage and research services (including third-party research and market data) that enhance Putnam Manage-ment’s investment capabilities and supplement Putnam Management’s internal research efforts. However, the Trustees noted that a portion of available soft dollars continues to be used to pay fund expenses. The Trustees indicated their continued intent to monitor regulatory and industry developments in this area with the assis-tance of their Brokerage Committee, including any developments with respect to the European Union’s updated Markets in Financial Instruments Directive and its potential impact on PIL’s use of client commissions to obtain investment research. The Trustees also indicated their continued intent to monitor the allocation of the Putnam funds’ brokerage in order to ensure that the principle of seeking best price and execution remains paramount in the portfolio trading process.
Putnam Management may also receive benefits from payments that the funds make to Putnam Management’s affiliates for investor or distribution services. In conjunction with the annual review of your fund’s management, sub-management and sub-advisory contracts, the Trustees reviewed your fund’s investor servicing agreement with
Dynamic Asset Allocation Growth Fund 21

Putnam Investor Services, Inc. (“PSERV”) and its distributor’s contracts and distribution plans with Putnam Retail Management Limited Partnership (“PRM”), both of which are affiliates of Putnam Management. The Trustees concluded that the fees payable by the funds to PSERV and PRM, as applicable, for such services are fair and reasonable in relation to the nature and quality
of such services, the fees paid by competitive funds, and the costs incurred by PSERV and PRM, as applicable, in providing such services. Further-more, the Trustees were of the view that the services provided were required for the operation of the funds, and that they were of a quality at least equal to those provided by other providers.
22 Dynamic Asset Allocation Growth Fund

Financial statements
Dynamic Asset Allocation Growth Fund 23
Financial statements
These sections of the report, as well as the accompanying Notes, preceded by the Report of Independent Registered Public Accounting Firm, constitute the fund’s financial statements.
The fund’s portfolio lists all the fund’s invest-ments and their values as of the last day of the reporting period. Holdings are organized by asset type and industry sector, country, or state to show areas of concentration and diversification.
Statement of assets and liabilities shows how the fund’s net assets and share price are determined. All investment and non-investment assets are added together. Any unpaid expenses and other liabilities are subtracted from this total. The result is divided by the number of shares to determine the net asset value per share, which is calculated separately for each class of shares. (For funds with preferred shares, the amount subtracted from total assets includes the liquidation preference of preferred shares.)
Statement of operations shows the fund’s net investment gain or loss. This is done by first adding up all the fund’s earnings — from dividends and interest income — and subtracting its operating expenses to determine net investment income (or
loss). Then, any net gain or loss the fund realized on the sales of its holdings — as well as any unreal-ized gains or losses over the period — is added to or subtracted from the net investment result to determine the fund’s net gain or loss for the fiscal year.
Statement of changes in net assets shows how the fund’s net assets were affected by the fund’s net investment gain or loss, by distributions to shareholders, and by changes in the number of the fund’s shares. It lists distributions and their sources (net investment income or realized capital gains) over the current reporting period and the most recent fiscal year-end. The distributions listed here may not match the sources listed in the Statement of operations because the distributions are deter-mined on a tax basis and may be paid in a different period from the one in which they were earned.
Financial highlights provide an overview of the fund’s investment results, per-share distributions, expense ratios, net investment income ratios, and portfolio turnover in one summary table, reflecting the five most recent reporting periods. In a semiannual report, the highlights table also includes the current reporting period.

Report of Independent Registered Public Accounting Firm
To the Trustees of Putnam Asset Allocation Funds and Shareholders of Putnam Dynamic Asset Allocation Growth Fund:
In our opinion, the accompanying statement of assets and liabilities, including the portfolio, and the related statements of operations and of changes in net assets and the financial highlights present fairly, in all material respects, the financial position of Putnam Dynamic Asset Allocation Growth Fund (the “Fund”) as of September 30, 2017, the results of its operations for the year then ended, the changes in its net assets for each of the two years in the period then ended and the financial highlights for each of the periods indicated therein, in conformity with accounting principles generally accepted in the United States of America. These financial statements and financial highlights (hereafter referred to as “financial statements”) are the responsibility of the Fund’s management. Our responsibility is to express an opinion on these financial statements based on our audits. We conducted our audits of these financial statements in accordance with the standards of the Public Company Accounting Oversight Board (United States). Those standards require that we plan and perform the audit to obtain reasonable assurance about whether the financial statements are free of material misstatement. An audit includes examining, on a test basis, evidence supporting the amounts and disclosures in the financial statements, assessing the accounting principles used and significant estimates made by management, and evaluating the overall financial statement presentation. We believe that our audits, which included confirmation of securities as of September 30, 2017 by correspondence with the custodian, brokers, and transfer agent of the underlying funds, and when replies were not received from brokers, we performed other auditing procedures, provide a reasonable basis for our opinion.
PricewaterhouseCoopers LLP Boston, Massachusetts November 7, 2017
24 Dynamic Asset Allocation Growth Fund
Dynamic Asset Allocation Growth Fund 25
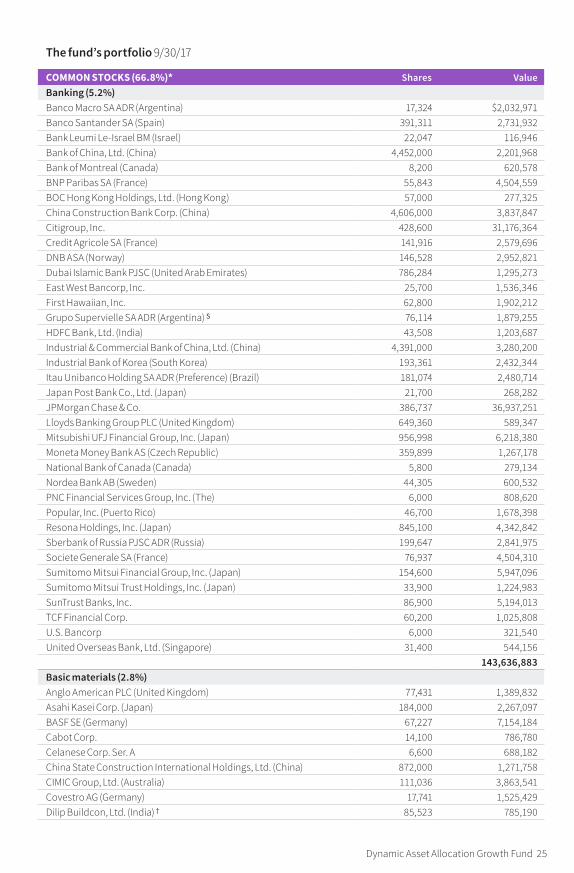
COMMON STOCKS (66.8%)* Shares ValueBanking (5.2%)Banco Macro SA ADR (Argentina) 17,324 $2,032,971Banco Santander SA (Spain) 391,311 2,731,932Bank Leumi Le-Israel BM (Israel) 22,047 116,946Bank of China, Ltd. (China) 4,452,000 2,201,968Bank of Montreal (Canada) 8,200 620,578BNP Paribas SA (France) 55,843 4,504,559BOC Hong Kong Holdings, Ltd. (Hong Kong) 57,000 277,325China Construction Bank Corp. (China) 4,606,000 3,837,847Citigroup, Inc. 428,600 31,176,364Credit Agricole SA (France) 141,916 2,579,696DNB ASA (Norway) 146,528 2,952,821Dubai Islamic Bank PJSC (United Arab Emirates) 786,284 1,295,273East West Bancorp, Inc. 25,700 1,536,346First Hawaiian, Inc. 62,800 1,902,212Grupo Supervielle SA ADR (Argentina) S 76,114 1,879,255HDFC Bank, Ltd. (India) 43,508 1,203,687Industrial & Commercial Bank of China, Ltd. (China) 4,391,000 3,280,200Industrial Bank of Korea (South Korea) 193,361 2,432,344Itau Unibanco Holding SA ADR (Preference) (Brazil) 181,074 2,480,714Japan Post Bank Co., Ltd. (Japan) 21,700 268,282JPMorgan Chase & Co. 386,737 36,937,251Lloyds Banking Group PLC (United Kingdom) 649,360 589,347Mitsubishi UFJ Financial Group, Inc. (Japan) 956,998 6,218,380Moneta Money Bank AS (Czech Republic) 359,899 1,267,178National Bank of Canada (Canada) 5,800 279,134Nordea Bank AB (Sweden) 44,305 600,532PNC Financial Services Group, Inc. (The) 6,000 808,620Popular, Inc. (Puerto Rico) 46,700 1,678,398Resona Holdings, Inc. (Japan) 845,100 4,342,842Sberbank of Russia PJSC ADR (Russia) 199,647 2,841,975Societe Generale SA (France) 76,937 4,504,310Sumitomo Mitsui Financial Group, Inc. (Japan) 154,600 5,947,096Sumitomo Mitsui Trust Holdings, Inc. (Japan) 33,900 1,224,983SunTrust Banks, Inc. 86,900 5,194,013TCF Financial Corp. 60,200 1,025,808U.S. Bancorp 6,000 321,540United Overseas Bank, Ltd. (Singapore) 31,400 544,156
143,636,883Basic materials (2.8%)Anglo American PLC (United Kingdom) 77,431 1,389,832Asahi Kasei Corp. (Japan) 184,000 2,267,097BASF SE (Germany) 67,227 7,154,184Cabot Corp. 14,100 786,780Celanese Corp. Ser. A 6,600 688,182China State Construction International Holdings, Ltd. (China) 872,000 1,271,758CIMIC Group, Ltd. (Australia) 111,036 3,863,541Covestro AG (Germany) 17,741 1,525,429Dilip Buildcon, Ltd. (India) † 85,523 785,190
The fund’s portfolio 9/30/17

26 Dynamic Asset Allocation Growth Fund
COMMON STOCKS (66.8%)* cont. Shares ValueBasic materials cont.Evonik Industries AG (Germany) 135,629 $4,844,265Formosa Plastics Corp. (Taiwan) 453,000 1,372,793Fortescue Metals Group, Ltd. (Australia) 305,834 1,238,279Grand Pacific Petrochemical (Taiwan) 1,405,000 1,054,442Hindalco Industries, Ltd. (India) 322,900 1,193,301Hitachi Chemical Co., Ltd. (Japan) 59,700 1,637,661Hitachi Metals, Ltd. (Japan) 30,600 426,066HOCHTIEF AG (Germany) 25,052 4,226,680Kajima Corp. (Japan) 105,000 1,043,912Korea Zinc Co., Ltd. (South Korea) 2,973 1,285,339Kuraray Co., Ltd. (Japan) 80,400 1,504,721Mitsubishi Chemical Holdings Corp. (Japan) 242,800 2,315,971Mitsubishi Gas Chemical Co., Inc. (Japan) 44,400 1,041,542Mitsubishi Materials Corp. (Japan) 10,600 366,577Mondi PLC (South Africa) 19,291 518,291Mota-Engil SGPS SA (Portugal) 223,869 839,282NCC, Ltd./India (India) 689,594 878,771Newmont Mining Corp. 83,700 3,139,587Packaging Corp. of America 37,500 4,300,500Reliance Steel & Aluminum Co. 19,300 1,470,081Rio Tinto PLC (United Kingdom) 36,014 1,676,026Sherwin-Williams Co. (The) 22,700 8,127,508Shin-Etsu Chemical Co., Ltd. (Japan) 12,000 1,073,933Sonoco Products Co. 1,600 80,720Steel Dynamics, Inc. 132,600 4,570,722Taisei Corp. (Japan) 39,800 2,088,380Timken Co. (The) 34,300 1,665,265United Co. RUSAL PLC (RUSAL) (Russia) 1,215,000 918,472UPM-Kymmene OYJ (Finland) 98,798 2,677,522voestalpine AG (Austria) 20,634 1,052,191Waskita Beton Precast Tbk PT (Indonesia) 23,878,200 639,163
78,999,956Capital goods (4.1%)ACS Actividades de Construccion y Servicios SA (Spain) 99,533 3,688,542Allison Transmission Holdings, Inc. S 155,500 5,835,915Avery Dennison Corp. 33,700 3,314,058BAE Systems PLC (United Kingdom) 61,480 520,250Berry Plastics Group, Inc. † 1,800 101,970BWX Technologies, Inc. 34,200 1,915,884CAE, Inc. (Canada) 10,400 181,953Canon, Inc. (Japan) 900 30,762Carlisle Cos., Inc. 19,100 1,915,539China Communications Construction Co., Ltd. (China) 650,000 812,717Crane Co. 8,100 647,919Crown Holdings, Inc. † 123,100 7,351,532CTCI Corp. (Taiwan) 680,000 1,092,700Cummins, Inc. 52,000 8,737,560Dassault Aviation SA (France) 334 540,202General Dynamics Corp. 2,300 472,834
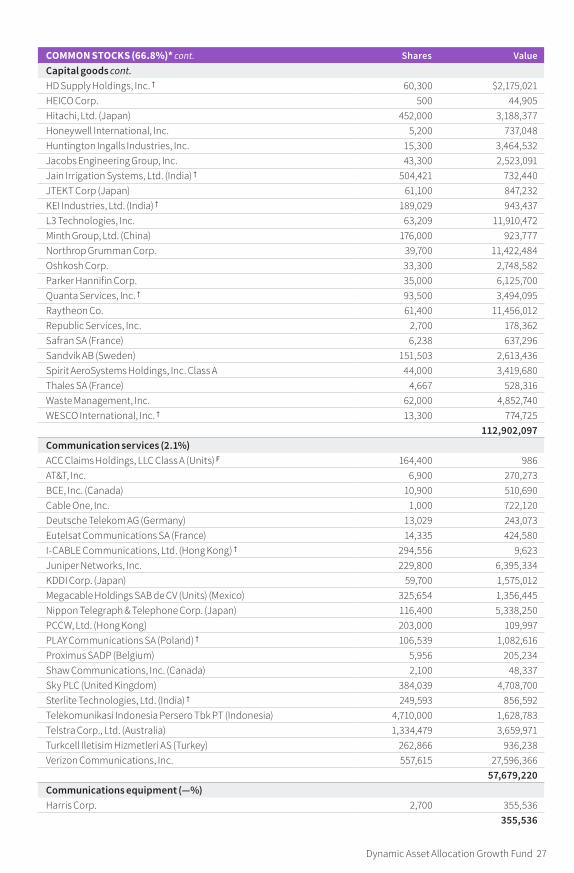
Dynamic Asset Allocation Growth Fund 27
COMMON STOCKS (66.8%)* cont. Shares ValueCapital goods cont.HD Supply Holdings, Inc. † 60,300 $2,175,021HEICO Corp. 500 44,905Hitachi, Ltd. (Japan) 452,000 3,188,377Honeywell International, Inc. 5,200 737,048Huntington Ingalls Industries, Inc. 15,300 3,464,532Jacobs Engineering Group, Inc. 43,300 2,523,091Jain Irrigation Systems, Ltd. (India) † 504,421 732,440JTEKT Corp (Japan) 61,100 847,232KEI Industries, Ltd. (India) † 189,029 943,437L3 Technologies, Inc. 63,209 11,910,472Minth Group, Ltd. (China) 176,000 923,777Northrop Grumman Corp. 39,700 11,422,484Oshkosh Corp. 33,300 2,748,582Parker Hannifin Corp. 35,000 6,125,700Quanta Services, Inc. † 93,500 3,494,095Raytheon Co. 61,400 11,456,012Republic Services, Inc. 2,700 178,362Safran SA (France) 6,238 637,296Sandvik AB (Sweden) 151,503 2,613,436Spirit AeroSystems Holdings, Inc. Class A 44,000 3,419,680Thales SA (France) 4,667 528,316Waste Management, Inc. 62,000 4,852,740WESCO International, Inc. † 13,300 774,725
112,902,097Communication services (2.1%)ACC Claims Holdings, LLC Class A (Units) F 164,400 986AT&T, Inc. 6,900 270,273BCE, Inc. (Canada) 10,900 510,690Cable One, Inc. 1,000 722,120Deutsche Telekom AG (Germany) 13,029 243,073Eutelsat Communications SA (France) 14,335 424,580I-CABLE Communications, Ltd. (Hong Kong) † 294,556 9,623Juniper Networks, Inc. 229,800 6,395,334KDDI Corp. (Japan) 59,700 1,575,012Megacable Holdings SAB de CV (Units) (Mexico) 325,654 1,356,445Nippon Telegraph & Telephone Corp. (Japan) 116,400 5,338,250PCCW, Ltd. (Hong Kong) 203,000 109,997PLAY Communications SA (Poland) † 106,539 1,082,616Proximus SADP (Belgium) 5,956 205,234Shaw Communications, Inc. (Canada) 2,100 48,337Sky PLC (United Kingdom) 384,039 4,708,700Sterlite Technologies, Ltd. (India) † 249,593 856,592Telekomunikasi Indonesia Persero Tbk PT (Indonesia) 4,710,000 1,628,783Telstra Corp., Ltd. (Australia) 1,334,479 3,659,971Turkcell Iletisim Hizmetleri AS (Turkey) 262,866 936,238Verizon Communications, Inc. 557,615 27,596,366
57,679,220Communications equipment (—%)Harris Corp. 2,700 355,536
355,536

28 Dynamic Asset Allocation Growth Fund
COMMON STOCKS (66.8%)* cont. Shares ValueComputers (3.0%)Amadeus IT Holding SA Class A (Spain) 88,275 $5,737,231Apple, Inc. 334,028 51,480,395CDK Global, Inc. 3,100 195,579Check Point Software Technologies, Ltd. (Israel) † 500 57,010Citrix Systems, Inc. † 64,900 4,985,618CommerceHub, Inc. Ser. C † 2,600 55,510Fortinet, Inc. † 95,600 3,426,304Fujitsu, Ltd. (Japan) 90,000 670,574HP, Inc. 513,600 10,251,456NCR Corp. † 43,400 1,628,368NetApp, Inc. 6,900 301,944Otsuka Corp. (Japan) 17,600 1,130,963Synopsys, Inc. † 38,800 3,124,564Xerox Corp. 24,075 801,457
83,846,973Conglomerates (0.5%)Bouygues SA (France) 95,629 4,537,912Danaher Corp. 69,500 5,961,710Marubeni Corp. (Japan) 646,100 4,415,963
14,915,585Consumer cyclicals (9.0%)Adecco Group AG (Switzerland) 57,764 4,497,760Amazon.com, Inc. † 40 38,454Aramark 73,000 2,964,530Aristocrat Leisure, Ltd. (Australia) 125,432 2,074,685Atacadao Distribuicao Comercio e Industria, Ltda. (Brazil) † 212,456 1,040,428Automatic Data Processing, Inc. 5,900 644,988Basso Industry Corp. (Taiwan) 516,000 1,442,750Berkeley Group Holdings PLC (The) (United Kingdom) 3,833 190,913Bloomberry Resorts Corp. (Philippines) † 3,701,800 778,149Booz Allen Hamilton Holding Corp. 51,700 1,933,063Bridgestone Corp. (Japan) 12,400 563,107Canadian Tire Corp., Ltd. (Canada) 4,100 510,434Carnival PLC (United Kingdom) 66,946 4,254,831Carter’s, Inc. 11,900 1,175,125CBS Corp. Class B (non-voting shares) 10,600 614,800Christian Dior SE (France) 1,842 589,875Clorox Co. (The) 42,600 5,619,366Dai Nippon Printing Co., Ltd. (Japan) 67,500 1,617,402Daimler AG (Registered Shares) (Germany) 2,687 214,269Discovery Communications, Inc. Class A † S 357,500 7,611,175Dolby Laboratories, Inc. Class A 13,900 799,528Ecolab, Inc. 1,200 154,332Electrolux AB Ser. B (Sweden) 119,083 4,044,047Euronet Worldwide, Inc. † 8,000 758,320FabFurnish GmbH (acquired 8/2/13, cost $1) (Private) (Germany) † ∆∆ F 2 2Ferrari NV (Italy) 727 80,339Fiat Chrysler Automobiles NV (Italy) † 223,086 3,997,168Ford Motor Co. 46,200 553,014

Dynamic Asset Allocation Growth Fund 29
COMMON STOCKS (66.8%)* cont. Shares ValueConsumer cyclicals cont.Fu Shou Yuan International Group, Ltd. (China) 1,932,000 $1,272,082GEDI Gruppo Editoriale SpA (Italy) † 7,504 6,652Genting Bhd (Malaysia) 399,000 902,502Harvey Norman Holdings, Ltd. (Australia) S 544,317 1,662,174Hasbro, Inc. 48,100 4,697,927Home Depot, Inc. (The) 45,081 7,373,448Hyatt Hotels Corp. Class A † 13,400 827,986Industrivarden AB Class A (Sweden) 165,133 4,407,656International Game Technology PLC 21,700 532,735Interpublic Group of Cos., Inc. (The) 23,900 496,881ISS A/S (Denmark) 36,524 1,468,791Itausa — Investimentos Itau SA (Preference) (Brazil) 270,164 940,880John Wiley & Sons, Inc. Class A 12,100 647,350KAR Auction Services, Inc. 33,700 1,608,838Kimberly-Clark Corp. 85,600 10,073,408Kingfisher PLC (United Kingdom) 862,819 3,451,188Lagardere SCA (France) 18,686 625,557Lear Corp. 24,000 4,153,920Liberty SiriusXM Group Class A † 44,700 1,872,930Lowe’s Cos., Inc. 233,227 18,644,166LSC Communications, Inc. 21,500 354,965LVMH Moet Hennessy Louis Vuitton SA (France) 937 258,532Marks & Spencer Group PLC (United Kingdom) 883,168 4,182,293Marriott International, Inc./MD Class A 300 33,078Masco Corp. 95,500 3,725,455Mazda Motor Corp. (Japan) 37,400 573,628METRO AG (Germany) 6,906 81,320Michaels Cos., Inc. (The) † 63,100 1,354,757MSC Industrial Direct Co., Inc. Class A 15,900 1,201,563Namco Bandai Holdings, Inc. (Japan) 29,200 1,001,982Naspers, Ltd. Class N (South Africa) 22,214 4,791,054New Bigfoot Other Assets GmbH (acquired 8/2/13, cost $1) (Private) (Germany) † ∆∆ F 1 1New Middle East Other Assets GmbH (acquired 8/12/13, cost $1) (Private) (Germany) † ∆∆ F 1 1News Corp. Class A 82,000 1,087,320News Corp. Class B 2,400 32,760Nien Made Enterprise Co., Ltd. (Taiwan) 122,000 1,255,090Novus Holdings, Ltd. (South Africa) 7,683 3,706NVR, Inc. † 1,050 2,997,750Owens Corning 43,100 3,333,785Padini Holdings Bhd (Malaysia) 725,400 782,057PC Jeweller, Ltd. (India) 121,107 614,984Peugeot SA (France) 178,505 4,251,149Poya International Co., Ltd. (Taiwan) 93,820 1,122,418Priceline Group, Inc. (The) † 89 162,943PVH Corp. 47,100 5,937,426Qualicorp SA (Brazil) 133,463 1,597,098Ralph Lauren Corp. 110,200 9,729,558Randstad Holding NV (Netherlands) 19,701 1,218,717

30 Dynamic Asset Allocation Growth Fund
COMMON STOCKS (66.8%)* cont. Shares ValueConsumer cyclicals cont.Renault SA (France) 19,283 $1,894,126Robinsons Retail Holdings, Inc. (Philippines) 505,440 985,028Ross Stores, Inc. 105,100 6,786,307RR Donnelley & Sons Co. 32,933 339,210RTL Group SA (Belgium) 16,416 1,242,509Scotts Miracle-Gro Co. (The) Class A 23,900 2,326,426ServiceMaster Global Holdings, Inc. † 30,200 1,411,246Sporton International, Inc. (Taiwan) 206,000 1,032,994Square, Inc. Class A † 303,100 8,732,311Suzuki Motor Corp. (Japan) 17,300 908,263TABCORP Holdings, Ltd. (Australia) 703,824 2,363,310Taylor Wimpey PLC (United Kingdom) 1,784,522 4,674,910TJX Cos., Inc. (The) 191,300 14,104,549Toppan Printing Co., Ltd. (Japan) 222,000 2,203,563Toro Co. (The) 19,400 1,203,964TransUnion † 52,600 2,485,876TUI AG (Germany) 48,856 828,812Twenty-First Century Fox, Inc. 4,000 105,520Valeo SA (France) 33,413 2,479,235Vantiv, Inc. Class A † S 23,800 1,677,186Visteon Corp. † 18,400 2,277,368Wal-Mart Stores, Inc. 124,100 9,697,174Walt Disney Co. (The) 151,400 14,923,498World Fuel Services Corp. 1,300 44,083Yamada Denki Co., Ltd. (Japan) 20,000 109,310Yue Yuen Industrial Holdings, Ltd. (Hong Kong) 203,000 773,945
251,726,038Consumer finance (0.3%)Chailease Holding Co., Ltd. (Taiwan) 554,000 1,339,276Dewan Housing Finance Corp., Ltd. (India) † 139,707 1,178,301Discover Financial Services 77,400 4,990,752
7,508,329Consumer staples (6.4%)Altria Group, Inc. 63,476 4,025,648Associated British Foods PLC (United Kingdom) 39,213 1,677,774Beauty Community PCL (Foreign depositary shares) (Thailand) 1,533,000 735,472Beiersdorf AG (Germany) 4,727 508,570BIM Birlesik Magazalar AS (Turkey) 42,138 878,134Bunge, Ltd. 49,200 3,417,432Campbell Soup Co. 76,300 3,572,366Carlsberg A/S Class B (Denmark) 4,881 534,129Coca-Cola Amatil, Ltd. (Australia) 523,403 3,179,643Coca-Cola HBC AG (Switzerland) 17,374 587,849ConAgra Foods, Inc. 117,800 3,974,572CVS Health Corp. 6,300 512,316Darden Restaurants, Inc. 49,600 3,907,488Delivery Hero Holding GmbH (Germany) † 19,533 773,383Delivery Hero Holding GmbH (acquired 6/12/15, cost $154,040) (Private) (Germany) † ∆∆ F 6,000 213,806

Dynamic Asset Allocation Growth Fund 31
COMMON STOCKS (66.8%)* cont. Shares ValueConsumer staples cont.Diageo PLC (United Kingdom) 6,062 $199,259Dino Polska SA 144A (Poland) † 62,950 1,144,624Distribuidora Internacional de Alimentacion SA (Spain) 108,436 632,472Dr. Pepper Snapple Group, Inc. 21,100 1,866,717Energizer Holdings, Inc. S 25,300 1,165,065Global Fashion Holding SA (acquired 8/2/13, cost $43,833) (Private) (Luxembourg) † ∆∆ F 1,036 11,086Gourmet Master Co., Ltd. (Taiwan) 31,000 330,655Graham Holdings Co. Class B 62 36,276Grape King Bio, Ltd. (Taiwan) 34,000 205,222Gruma SAB de CV Class B (Mexico) 89,317 1,311,699Heineken Holding NV (Netherlands) 51,210 4,811,747Henkel AG & Co. KGaA (Preference) (Germany) 4,043 550,235Hershey Co. (The) 51,200 5,589,504Ingredion, Inc. 23,200 2,798,848ITOCHU Corp. (Japan) 303,700 4,976,220J Sainsbury PLC (United Kingdom) 1,301,716 4,149,686J.M. Smucker Co. (The) 2,700 283,311Kao Corp. (Japan) 87,100 5,135,675Lamb Weston Holdings, Inc. 43,700 2,049,093Liberty Interactive Corp. † 13,300 765,415Loblaw Cos., Ltd. (Canada) 8,800 480,289ManpowerGroup, Inc. 23,900 2,815,898McDonald’s Corp. 133,800 20,963,784McDonald’s Holdings Co. (Japan), Ltd. (Japan) 11,700 518,043Metro Wholesale & Food Specialist AG (Germany) † 6,906 145,981Nestle SA (Switzerland) 40,677 3,406,728NH Foods, Ltd. (Japan) 9,000 247,620PepsiCo, Inc. 156,700 17,461,081Pinnacle Foods, Inc. 41,700 2,383,989Pool Corp. 5,600 605,752Procter & Gamble Co. (The) 38,295 3,484,079Ser Educacional SA 144A (Brazil) 114,272 1,125,708Spectrum Brands Holdings, Inc. S 11,100 1,175,712Swedish Match AB (Sweden) 38,161 1,338,580Sysco Corp. 142,400 7,682,480Tate & Lyle PLC (United Kingdom) 515,785 4,482,118Toyota Tsusho Corp. (Japan) 86,700 2,850,798Tyson Foods, Inc. Class A 139,100 9,799,595Ulta Beauty, Inc. † 18,400 4,159,504Unilever NV ADR (Netherlands) 22,146 1,309,765US Foods Holding Corp. † 800 21,360Walgreens Boots Alliance, Inc. 132,000 10,193,040Watsco, Inc. 18,000 2,899,260WH Group, Ltd. (Hong Kong) 3,956,500 4,212,798WM Morrison Supermarkets PLC (United Kingdom) 1,329,595 4,170,858X5 Retail Group NV GDR (Russia) † 36,114 1,621,157Yum! Brands, Inc. 52,000 3,827,720
179,895,088

32 Dynamic Asset Allocation Growth Fund
COMMON STOCKS (66.8%)* cont. Shares ValueElectronics (1.6%)Agilent Technologies, Inc. 82,000 $5,264,400Casetek Holdings, Ltd. (Taiwan) 294,000 959,044Corning, Inc. 5,100 152,592Elite Material Co., Ltd. (Taiwan) 305,000 1,452,145FLIR Systems, Inc. 35,100 1,365,741Hoya Corp. (Japan) 40,000 2,169,543Koninklijke Philips NV (Netherlands) 11,004 454,287MediaTek, Inc. (Taiwan) 167,000 1,573,120Samsung Electronics Co., Ltd. (South Korea) 5,244 11,786,981Samsung Electronics Co., Ltd. (Preference) (South Korea) 666 1,202,986SK Hynix, Inc. (South Korea) 20,741 1,506,201Texas Instruments, Inc. 191,200 17,139,168
45,026,208Energy (3.3%)Baker Hughes a GE Co. 121,900 4,463,978Caltex Australia, Ltd. (Australia) 56,623 1,429,992Cimarex Energy Co. 53,400 6,069,978Exxon Mobil Corp. 194,735 15,964,375Halcon Resources Corp. † 8,621 58,623Lukoil PJSC ADR (Russia) 27,435 1,452,135Marathon Petroleum Corp. 7,100 398,168Milagro Oil & Gas, Inc. (Units) F 89 7,209Nabors Industries, Ltd. 56,100 452,727Nine Point Energy 1,344 18,493OMV AG (Austria) 4,859 283,065ONEOK, Inc. 139,900 7,751,859Parsley Energy, Inc. Class A † 303,500 7,994,190Petroleo Brasileiro SA — Petrobras ADR (Brazil) † S 63,355 636,084Petroleo Brasileiro SA — Petrobras ADR (Preference) (Brazil) † S 37,400 361,284Petronet LNG, Ltd. (India) 301,004 1,067,591Phillips 66 2,100 192,381PTT PCL (Foreign depositary shares) (Thailand) 117,700 1,439,928QEP Resources, Inc. † 41,700 357,369Repsol SA (Spain) 313,555 5,777,510Rowan Cos. PLC Class A † S 45,200 580,820Royal Dutch Shell PLC Class B (United Kingdom) 93,715 2,881,389SandRidge Energy, Inc. † 3,783 76,000Superior Energy Services, Inc. † S 35,500 379,140Tervita Corp. Class A (Canada) 179 1,363Total SA (France) 143,825 7,725,051Valero Energy Corp. 162,100 12,470,353Vestas Wind Systems A/S (Denmark) 20,640 1,852,150Williams Cos., Inc. (The) 294,200 8,828,942Woodside Petroleum, Ltd. (Australia) 20,289 465,012
91,437,159Financial (1.0%)3i Group PLC (United Kingdom) 527,222 6,450,136Ally Financial, Inc. 140,400 3,406,104Broadridge Financial Solutions, Inc. 900 72,738

Dynamic Asset Allocation Growth Fund 33
COMMON STOCKS (66.8%)* cont. Shares ValueFinancial cont.CME Group, Inc. 3,400 $461,312CoreLogic, Inc. † 16,800 776,496CTBC Financial Holding Co., Ltd. (Taiwan) 2,621,000 1,642,516DGB Financial Group, Inc. (South Korea) 109,061 1,001,400Edelweiss Financial Services, Ltd. (India) 284,700 1,173,643HSBC Holdings PLC (United Kingdom) 113,159 1,117,687Intercontinental Exchange, Inc. 850 58,395Mizuho Financial Group, Inc. (Japan) 3,215,500 5,638,612ORIX Corp. (Japan) 313,100 5,054,291UNIFIN Financiera, SAB de CV SOFOM, E.N.R. (Mexico) 394,851 1,323,759
28,177,089Health care (8.0%)Alfresa Holdings Corp. (Japan) 13,000 238,371AmerisourceBergen Corp. 81,500 6,744,125AstraZeneca PLC (United Kingdom) 10,356 687,607Baxter International, Inc. 100,400 6,300,100Bayer AG (Germany) 53,041 7,228,063Bio-Rad Laboratories, Inc. Class A † 600 133,332Bruker Corp. 24,000 714,000C.R. Bard, Inc. 18,000 5,769,000Celgene Corp. † 143,600 20,939,752Charles River Laboratories International, Inc. † 17,900 1,933,558China Traditional Chinese Medicine Holdings Co., Ltd. (China) 2,438,000 1,359,891Eli Lilly & Co. 127,000 10,863,580Fleury SA (Brazil) 85,106 791,902Fresenius SE & Co. KGaA (Germany) 523 42,188Gilead Sciences, Inc. 313,700 25,415,974GlaxoSmithKline PLC (United Kingdom) 355,898 7,098,703Hologic, Inc. † 22,800 836,532Humana, Inc. 3,000 730,890Johnson & Johnson 263,659 34,278,307McKesson Corp. 70,200 10,783,422Medipal Holdings Corp. (Japan) 73,700 1,280,829Merck & Co., Inc. 202,500 12,966,075Mitsubishi Tanabe Pharma Corp. (Japan) 99,700 2,291,775Novartis AG (Switzerland) 82,581 7,069,722Pfizer, Inc. 29,700 1,060,290Premier, Inc. Class A † 22,400 729,568Richter Gedeon Nyrt (Hungary) 60,076 1,492,060Roche Holding AG (Switzerland) 37,108 9,472,916Sanofi (France) 82,792 8,220,538Shanghai Fosun Pharmaceutical (Group) Co., Ltd. (China) 176,500 734,900Shionogi & Co., Ltd. (Japan) 67,200 3,676,221Taro Pharmaceutical Industries, Ltd. (Israel) † S 2,909 327,815Thermo Fisher Scientific, Inc. 300 56,760UnitedHealth Group, Inc. 141,300 27,673,605Vieworks Co., Ltd. (South Korea) 1,332 45,530WellCare Health Plans, Inc. † 21,500 3,692,410Zoetis, Inc. 9,800 624,848
224,305,159

34 Dynamic Asset Allocation Growth Fund
COMMON STOCKS (66.8%)* cont. Shares ValueInsurance (3.0%)Aflac, Inc. 88,900 $7,235,571AIA Group, Ltd. (Hong Kong) 146,600 1,087,229Allianz SE (Germany) 33,236 7,461,548Allstate Corp. (The) 84,400 7,757,204American Financial Group, Inc. 8,700 900,015Aspen Insurance Holdings, Ltd. 11,300 456,520Assured Guaranty, Ltd. 38,500 1,453,375AXA SA (France) 175,656 5,312,686Baloise Holding AG (Switzerland) 3,359 531,418Berkshire Hathaway, Inc. Class B † 2,500 458,300Dongbu Insurance Co., Ltd. (South Korea) 16,032 1,022,967Hartford Financial Services Group, Inc. (The) 100,200 5,554,086Hyundai Marine & Fire Insurance Co., Ltd. (South Korea) 22,530 892,519ING Life Insurance Korea, Ltd. (South Korea) 30,507 1,265,452IRB Brasil Resseguros S/A (Brazil) † 156,307 1,492,915Legal & General Group PLC (United Kingdom) 158,689 552,660Lincoln National Corp. 49,700 3,651,956Mapfre SA (Spain) 320,390 1,042,855Muenchener Rueckversicherungs-Gesellschaft AG in Muenchen (Germany) 21,507 4,598,321NN Group NV (Netherlands) 101,945 4,266,510Ping An Insurance Group Co. of China, Ltd. (China) 369,500 2,850,998Prudential Financial, Inc. 79,600 8,463,072Reinsurance Group of America, Inc. 12,450 1,737,149Swiss Life Holding AG (Switzerland) 1,278 450,174Swiss Re AG (Switzerland) 57,781 5,233,019Travelers Cos., Inc. (The) 23,100 2,830,212Unum Group 52,900 2,704,777Validus Holdings, Ltd. 20,300 998,963Voya Financial, Inc. 52,600 2,098,214
84,360,685Investment banking/Brokerage (1.6%)Ameriprise Financial, Inc. 46,200 6,861,162Daiwa Securities Group, Inc. (Japan) 95,000 538,658E*Trade Financial Corp. † 173,800 7,579,418Goldman Sachs Group, Inc. (The) 88,600 21,015,034Investor AB Class B (Sweden) 2,758 136,226Morgan Stanley 73,300 3,530,861Nomura Holdings, Inc. (Japan) 506,700 2,839,091Partners Group Holding AG (Switzerland) 691 468,825Raymond James Financial, Inc. 10,300 868,599
43,837,874Photography/Imaging (—%)FUJIFILM Holdings Corp. (Japan) 12,800 499,042
499,042Real estate (2.6%)AGNC Investment Corp. R 129,200 2,801,056American Homes 4 Rent R 4,700 102,037Annaly Capital Management, Inc. R 257,200 3,135,268

Dynamic Asset Allocation Growth Fund 35
COMMON STOCKS (66.8%)* cont. Shares ValueReal estate cont.Apartment Investment & Management Co. Class A R 36,000 $1,578,960Apple Hospitality REIT, Inc. R 56,400 1,066,524Barratt Developments PLC (United Kingdom) 332,842 2,740,720Brandywine Realty Trust R 51,900 907,731Brixmor Property Group, Inc. R 88,300 1,660,040Camden Property Trust R 27,300 2,496,585Cheung Kong Property Holdings, Ltd. (Hong Kong) 582,000 4,840,641Chimera Investment Corp. R 62,900 1,190,068Colony NorthStar, Inc. Class A R 136,300 1,711,928Corporate Office Properties Trust R 2,500 82,075Duke Realty Corp. R 76,500 2,204,730Empire State Realty Trust, Inc. Class A R 1,800 36,972EPR Properties R 2,300 160,402Equity Commonwealth † R 24,700 750,880Equity Lifestyle Properties, Inc. R 11,700 995,436Equity Residential Trust R 76,100 5,017,273Forest City Realty Trust, Inc. Class A R 65,700 1,676,007Gaming and Leisure Properties, Inc. R 26,500 977,585HCP, Inc. R 120,300 3,347,949Highwoods Properties, Inc. R 30,500 1,588,745Kerry Properties, Ltd. (Hong Kong) 404,000 1,677,292Lamar Advertising Co. Class A R 1,900 130,207Liberty Property Trust R 31,100 1,276,966MFA Financial, Inc. R 82,600 723,576Mid-America Apartment Communities, Inc. R 5,800 619,904MRV Engenharia e Participacoes SA (Brazil) 337,997 1,468,462New World Development Co., Ltd. (Hong Kong) 1,687,000 2,428,807Nomura Real Estate Holdings, Inc. (Japan) 38,000 812,295Outfront Media, Inc. R 31,000 780,580Park Hotels & Resorts, Inc. R 71,300 1,965,028Persimmon PLC (United Kingdom) 132,052 4,568,839Quality Care Properties, Inc. † R 38,800 601,400Retail Properties of America, Inc. Class A R 6,300 82,719Senior Housing Properties Trust R 28,900 564,995Spirit Realty Capital, Inc. R 228,600 1,959,102Starwood Property Trust, Inc. R 73,200 1,589,904Sun Hung Kai Properties, Ltd. (Hong Kong) 132,000 2,154,393Two Harbors Investment Corp. R 98,500 992,880VEREIT, Inc. R 263,900 2,187,731Wharf Holdings, Ltd. (The) (Hong Kong) 106,000 944,738Wheelock and Co., Ltd. (Hong Kong) 372,000 2,616,392WP Carey, Inc. R 9,300 626,727
71,842,549Semiconductor (1.2%)Applied Materials, Inc. 399,400 20,804,746Maxim Integrated Products, Inc. 87,400 4,169,854Taiwan Semiconductor Manufacturing Co., Ltd. (Taiwan) 575,350 4,137,991Teradyne, Inc. 77,400 2,886,246Tokyo Electron, Ltd. (Japan) 1,100 169,575
32,168,412

36 Dynamic Asset Allocation Growth Fund
COMMON STOCKS (66.8%)* cont. Shares ValueSoftware (3.0%)Adobe Systems, Inc. † 23,900 $3,565,402Amdocs, Ltd. 66,000 4,245,120Chinasoft International, Ltd. (China) 1,664,000 923,764F5 Networks, Inc. † 29,900 3,604,744Intuit, Inc. 62,600 8,897,964Microsoft Corp. 663,109 49,394,989Open Text Corp. (Canada) 10,300 332,341Tencent Holdings, Ltd. (China) 217,000 9,381,376VMware, Inc. Class A † S 41,700 4,553,223
84,898,923Technology services (3.6%)Alibaba Group Holding, Ltd. ADR (China) † S 53,023 9,157,602Alphabet, Inc. Class A † 50,660 49,328,655AtoS SE (France) 34,397 5,335,815Dell Technologies, Inc. Class V † 45,700 3,528,497DST Systems, Inc. 13,800 757,344Dun & Bradstreet Corp. (The) 22,000 2,561,020DXC Technology Co. 75,200 6,458,176eBay, Inc. † 169,401 6,515,162Facebook, Inc. Class A † 64,200 10,969,854Fidelity National Information Services, Inc. 4,900 457,611Fiserv, Inc. † 2,500 322,400Genpact, Ltd. 2,900 83,375Mixi, Inc. (Japan) 6,500 314,341NCSOFT Corp. (South Korea) 3,634 1,478,245Paychex, Inc. 4,800 287,808Yandex NV Class A (Russia) † 36,848 1,214,142YY, Inc. ADR (China) † 12,637 1,096,639
99,866,686Transportation (2.1%)ANA Holdings, Inc. (Japan) 69,400 2,631,658Beijing Capital International Airport Co., Ltd. (China) 508,000 757,945Central Japan Railway Co. (Japan) 24,400 4,280,470Delta Air Lines, Inc. 189,777 9,151,047Deutsche Lufthansa AG (Germany) 14,554 404,404Deutsche Post AG (Germany) 136,134 6,060,179easyJet PLC (United Kingdom) 29,195 476,106Fraport AG Frankfurt Airport Services Worldwide (Germany) 3,505 332,813International Consolidated Airlines Group SA (Spain) 99,981 796,450Japan Airlines Co., Ltd. (Japan) 13,200 446,814Landstar System, Inc. 13,000 1,295,450Norfolk Southern Corp. 62,500 8,265,000Qantas Airways, Ltd. (Australia) 763,401 3,502,469Royal Mail PLC (United Kingdom) 453,232 2,333,364Union Pacific Corp. 135,300 15,690,741Yangzijiang Shipbuilding Holdings, Ltd. (China) 691,000 729,392
57,154,302

Dynamic Asset Allocation Growth Fund 37
COMMON STOCKS (66.8%)* cont. Shares ValueUtilities and power (2.4%)American Electric Power Co., Inc. 92,100 $6,469,104AusNet Services (Units) (Australia) 314,367 418,348CenterPoint Energy, Inc. 101,100 2,953,131Centrica PLC (United Kingdom) 1,575,071 3,946,811China Water Affairs Group, Ltd. (China) 2,648,000 1,883,100Edison International 12,000 926,040Endesa SA (Spain) 101,352 2,284,955Enel SpA (Italy) 1,130,706 6,808,866ENGIE SA (France) 25,313 429,914ENI SpA (Italy) 26,205 433,604Entergy Corp. 133,224 10,172,985Exelon Corp. 134,900 5,081,683FirstEnergy Corp. 166,400 5,130,112Gas Natural SDG SA (Spain) 10,992 243,330Great Plains Energy, Inc. 11,600 351,480Iberdrola SA (Spain) 89,978 698,900Innogy SE (Germany) 21,037 936,240Inter RAO UES PJSC (Russia) 9,596,878 618,922KEC International, Ltd. (India) 230,107 1,084,267Kinder Morgan, Inc. 23,800 456,484NiSource, Inc. 126,400 3,234,576Pampa Energia SA ADR (Argentina) † S 10,727 698,328PG&E Corp. 6,500 442,585Power Grid Corp. of India, Ltd. (India) 434,588 1,406,023PPL Corp. 38,100 1,445,895RusHydro PJSC ADR (Russia) 879,616 1,262,249Southern Co. (The) 2,700 132,678Texas Competitive Electric Holdings Co., LLC/TCEH Finance, Inc. (Rights) 11,872 12,466Tohoku Electric Power Co., Inc. (Japan) 83,700 1,065,135UGI Corp. 130,350 6,108,201Vectren Corp. 14,400 947,088
68,083,500Total common stocks (cost $1,579,844,950) $1,863,123,293
CORPORATE BONDS AND NOTES (11.4%)*Principal
amount ValueBasic materials (0.9%)A Schulman, Inc. company guaranty sr. unsec. unsub. notes 6.875%, 6/1/23 $195,000 $202,313Agrium, Inc. sr. unsec. unsub. notes 5.25%, 1/15/45 (Canada) 70,000 80,216AK Steel Corp. company guaranty sr. unsec. notes 6.375%, 10/15/25 135,000 133,313Allegheny Technologies, Inc. sr. unsec. unsub. notes 9.375%, 6/1/19 275,000 300,438Allegheny Technologies, Inc. sr. unsec. unsub. notes 7.875%, 8/15/23 40,000 43,350Allegheny Technologies, Inc. sr. unsec. unsub. notes 5.95%, 1/15/21 115,000 117,300Alpha 3 BV/Alpha US Bidco, Inc. 144A company guaranty sr. unsec. notes 6.25%, 2/1/25 (Netherlands) 200,000 203,500

38 Dynamic Asset Allocation Growth Fund
CORPORATE BONDS AND NOTES (11.4%)* cont.Principal
amount ValueBasic materials cont.ArcelorMittal SA sr. unsec. unsub. bonds 6.125%, 6/1/25 (France) $95,000 $109,250ArcelorMittal SA sr. unsec. unsub. notes 7.50%, 10/15/39 (France) 145,000 174,000Axalta Coating Systems, LLC 144A company guaranty sr. unsec. unsub. notes 4.875%, 8/15/24 195,000 203,288Beacon Roofing Supply, Inc. company guaranty sr. unsec. unsub. notes 6.375%, 10/1/23 295,000 314,175Big River Steel, LLC/BRS Finance Corp. 144A company guaranty sr. notes 7.25%, 9/1/25 360,000 381,960Blue Cube Spinco, Inc. company guaranty sr. unsec. unsub. notes 9.75%, 10/15/23 275,000 334,125BMC East, LLC 144A company guaranty sr. notes 5.50%, 10/1/24 315,000 328,388Boise Cascade Co. 144A company guaranty sr. unsec. notes 5.625%, 9/1/24 495,000 520,369Builders FirstSource, Inc. 144A company guaranty sr. unsec. notes 10.75%, 8/15/23 357,000 407,873Builders FirstSource, Inc. 144A company guaranty sr. unsub. notes 5.625%, 9/1/24 195,000 206,213BWAY Holding Co. 144A sr. notes 5.50%, 4/15/24 275,000 287,375BWAY Holding Co. 144A sr. unsec. notes 7.25%, 4/15/25 700,000 721,000Celanese US Holdings, LLC company guaranty sr. unsec. unsub. notes 4.625%, 11/15/22 (Germany) 587,000 633,455Cemex Finance, LLC 144A company guaranty sr. notes 6.00%, 4/1/24 (Mexico) 550,000 584,381CF Industries, Inc. company guaranty sr. unsec. bonds 4.95%, 6/1/43 240,000 222,600Chemours Co. (The) company guaranty sr. unsec. notes 5.375%, 5/15/27 165,000 171,188Chemours Co. (The) company guaranty sr. unsec. unsub. notes 7.00%, 5/15/25 250,000 276,875Chemours Co. (The) company guaranty sr. unsec. unsub. notes 6.625%, 5/15/23 175,000 186,156Compass Minerals International, Inc. 144A company guaranty sr. unsec. notes 4.875%, 7/15/24 430,000 422,475Coveris Holdings SA 144A company guaranty sr. unsec. notes 7.875%, 11/1/19 (Luxembourg) 210,000 206,850CPG Merger Sub, LLC 144A company guaranty sr. unsec. notes 8.00%, 10/1/21 88,000 90,860CSTN Merger Sub, Inc. 144A company guaranty sr. notes 6.75%, 8/15/24 240,000 239,400Dow Chemical Co. (The) sr. unsec. unsub. bonds 3.50%, 10/1/24 495,000 510,508E. I. du Pont de Nemours & Co. sr. unsec. notes 3.625%, 1/15/21 265,000 277,634E. I. du Pont de Nemours & Co. sr. unsec. unsub. FRN BBA LIBOR USD 3 Month + 0.53%, 1.841%, 5/1/20 195,000 196,645Eastman Chemical Co. sr. unsec. notes 3.80%, 3/15/25 252,000 259,143First Quantum Minerals, Ltd. 144A company guaranty sr. unsec. notes 7.50%, 4/1/25 (Canada) 220,000 225,225First Quantum Minerals, Ltd. 144A company guaranty sr. unsec. notes 7.00%, 2/15/21 (Canada) 280,000 287,700Flex Acquisition Co., Inc. 144A sr. unsec. notes 6.875%, 1/15/25 290,000 301,056Freeport-McMoRan, Inc. company guaranty sr. unsec. notes 6.875%, 2/15/23 (Indonesia) 245,000 267,050

Dynamic Asset Allocation Growth Fund 39
CORPORATE BONDS AND NOTES (11.4%)* cont.Principal
amount ValueBasic materials cont.Freeport-McMoRan, Inc. company guaranty sr. unsec. notes 3.55%, 3/1/22 (Indonesia) $25,000 $24,617Freeport-McMoRan, Inc. company guaranty sr. unsec. sub. notes 6.75%, 2/1/22 (Indonesia) 130,000 135,525GCP Applied Technologies, Inc. 144A company guaranty sr. unsec. notes 9.50%, 2/1/23 440,000 497,200Glencore Funding, LLC 144A company guaranty sr. unsec. unsub. notes 4.625%, 4/29/24 719,000 761,601Glencore Funding, LLC 144A company guaranty sr. unsec. unsub. notes 4.00%, 4/16/25 486,000 493,460Grinding Media, Inc./Moly-Cop Altasteel, Ltd. 144A sr. sub. notes 7.375%, 12/15/23 80,000 86,800Huntsman International, LLC company guaranty sr. unsec. unsub. notes 4.875%, 11/15/20 249,000 263,629INVISTA Finance, LLC 144A company guaranty sr. notes 4.25%, 10/15/19 208,000 214,240Joseph T Ryerson & Son, Inc. 144A sr. notes 11.00%, 5/15/22 130,000 145,600Kraton Polymers, LLC/Kraton Polymers Capital Corp. 144A company guaranty sr. unsec. notes 10.50%, 4/15/23 260,000 297,050Kraton Polymers, LLC/Kraton Polymers Capital Corp. 144A company guaranty sr. unsec. notes 7.00%, 4/15/25 145,000 155,513Louisiana-Pacific Corp. company guaranty sr. unsec. unsub. notes 4.875%, 9/15/24 205,000 211,224Mercer International, Inc. company guaranty sr. unsec. notes 7.75%, 12/1/22 (Canada) 175,000 185,719Mercer International, Inc. sr. unsec. notes 6.50%, 2/1/24 (Canada) 295,000 306,800Methanex Corp. sr. unsec. unsub. notes 5.65%, 12/1/44 (Canada) 180,000 177,417Methanex Corp. sr. unsec. unsub. notes 3.25%, 12/15/19 (Canada) 19,000 19,136Monsanto Company sr. unsec. sub. notes 5.50%, 8/15/25 405,000 461,450New Gold, Inc. 144A company guaranty sr. unsec. unsub. notes 6.25%, 11/15/22 (Canada) 145,000 150,438New Gold, Inc. 144A sr. unsec. notes 6.375%, 5/15/25 (Canada) 85,000 89,038Norbord, Inc. 144A company guaranty sr. notes 6.25%, 4/15/23 (Canada) 380,000 408,804NOVA Chemicals Corp. 144A sr. unsec. bonds 5.25%, 6/1/27 (Canada) 284,000 286,840NOVA Chemicals Corp. 144A sr. unsec. notes 4.875%, 6/1/24 (Canada) 161,000 163,013Novelis Corp. 144A company guaranty sr. unsec. bonds 5.875%, 9/30/26 230,000 233,450Novelis Corp. 144A company guaranty sr. unsec. notes 6.25%, 8/15/24 185,000 191,938Packaging Corp. of America sr. unsec. unsub. notes 4.50%, 11/1/23 145,000 156,099Pactiv, LLC sr. unsec. unsub. bonds 8.375%, 4/15/27 30,000 34,200Park-Ohio Industries, Inc. company guaranty sr. unsec. notes 6.625%, 4/15/27 285,000 307,088Platform Specialty Products Corp. 144A sr. unsec. notes 10.375%, 5/1/21 40,000 43,600Sealed Air Corp. 144A company guaranty sr. unsec. notes 6.875%, 7/15/33 150,000 175,875

40 Dynamic Asset Allocation Growth Fund
CORPORATE BONDS AND NOTES (11.4%)* cont.Principal
amount ValueBasic materials cont.Sealed Air Corp. 144A company guaranty sr. unsec. notes 5.125%, 12/1/24 $55,000 $59,194Sealed Air Corp. 144A sr. unsec. bonds 5.50%, 9/15/25 50,000 55,000Sherwin-Williams Co. (The) sr. unsec. unsub. bonds 3.45%, 6/1/27 255,000 256,773Sherwin-Williams Co. (The) sr. unsec. unsub. notes 2.75%, 6/1/22 130,000 130,875Smurfit Kappa Treasury Funding, Ltd. company guaranty sr. unsec. unsub. notes 7.50%, 11/20/25 (Ireland) 225,000 275,344Steel Dynamics, Inc. company guaranty sr. unsec. notes 5.00%, 12/15/26 90,000 96,075Steel Dynamics, Inc. company guaranty sr. unsec. unsub. notes 5.50%, 10/1/24 190,000 203,300Steel Dynamics, Inc. company guaranty sr. unsec. unsub. notes 5.25%, 4/15/23 17,000 17,680Steel Dynamics, Inc. 144A company guaranty sr. unsec. notes 4.125%, 9/15/25 745,000 745,932Teck Resources, Ltd. company guaranty sr. unsec. unsub. notes 4.75%, 1/15/22 (Canada) 105,000 111,005Teck Resources, Ltd. company guaranty sr. unsec. unsub. notes 3.75%, 2/1/23 (Canada) 95,000 96,207Teck Resources, Ltd. 144A company guaranty sr. unsec. notes 8.50%, 6/1/24 (Canada) 35,000 40,163TMS International Corp. 144A sr. unsec. notes 7.25%, 8/15/25 305,000 311,863Trinseo Materials Operating SCA/Trinseo Materials Finance, Inc. 144A sr. unsec. notes 5.375%, 9/1/25 (Luxembourg) 180,000 185,175Tronox Finance PLC 144A company guaranty sr. unsec. notes 5.75%, 10/1/25 (United Kingdom) 100,000 102,500U.S. Concrete, Inc. company guaranty sr. unsec. unsub. notes 6.375%, 6/1/24 375,000 404,063United States Steel Corp. sr. unsec. notes 6.875%, 8/15/25 100,000 102,250Univar USA, Inc. 144A company guaranty sr. unsec. notes 6.75%, 7/15/23 235,000 246,163USG Corp. 144A company guaranty sr. unsec. bonds 4.875%, 6/1/27 295,000 307,906USG Corp. 144A company guaranty sr. unsec. notes 5.50%, 3/1/25 195,000 208,650Venator Finance SARL/Venator Materials Corp. 144A sr. unsec. notes 5.75%, 7/15/25 (Luxembourg) 175,000 182,000Weekley Homes, LLC/Weekley Finance Corp. sr. unsec. notes 6.00%, 2/1/23 238,000 233,240Westlake Chemical Corp. company guaranty sr. unsec. unsub. notes 3.60%, 8/15/26 1,300,000 1,298,263WestRock MWV, LLC company guaranty sr. unsec. unsub. notes 8.20%, 1/15/30 395,000 553,438WestRock MWV, LLC company guaranty sr. unsec. unsub. notes 7.95%, 2/15/31 198,000 275,149Weyerhaeuser Co. sr. unsec. unsub. notes 7.375%, 3/15/32 R 355,000 492,472WR Grace & Co.- Conn. 144A company guaranty sr. unsec. notes 5.625%, 10/1/24 415,000 455,981Zekelman Industries, Inc. 144A company guaranty sr. notes 9.875%, 6/15/23 200,000 225,500
24,777,172
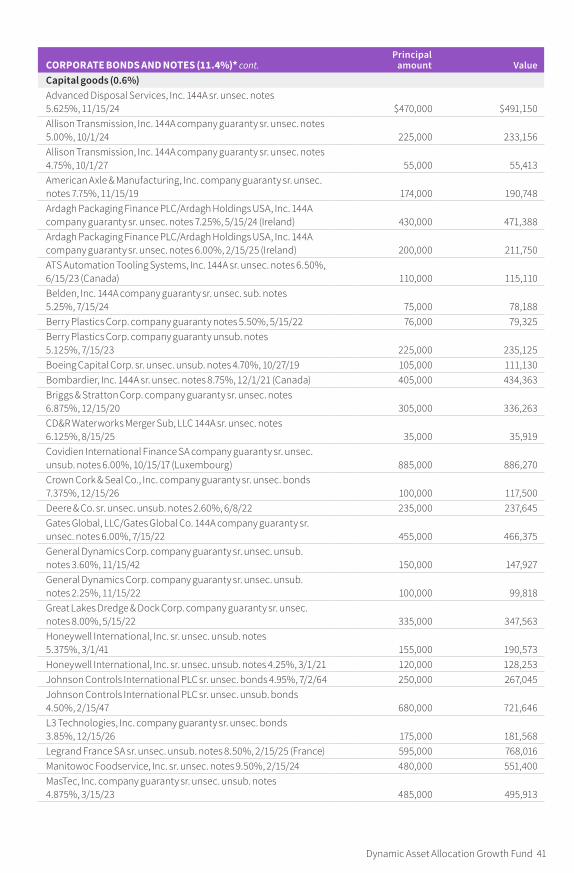
Dynamic Asset Allocation Growth Fund 41
CORPORATE BONDS AND NOTES (11.4%)* cont.Principal
amount ValueCapital goods (0.6%)Advanced Disposal Services, Inc. 144A sr. unsec. notes 5.625%, 11/15/24 $470,000 $491,150Allison Transmission, Inc. 144A company guaranty sr. unsec. notes 5.00%, 10/1/24 225,000 233,156Allison Transmission, Inc. 144A company guaranty sr. unsec. notes 4.75%, 10/1/27 55,000 55,413American Axle & Manufacturing, Inc. company guaranty sr. unsec. notes 7.75%, 11/15/19 174,000 190,748Ardagh Packaging Finance PLC/Ardagh Holdings USA, Inc. 144A company guaranty sr. unsec. notes 7.25%, 5/15/24 (Ireland) 430,000 471,388Ardagh Packaging Finance PLC/Ardagh Holdings USA, Inc. 144A company guaranty sr. unsec. notes 6.00%, 2/15/25 (Ireland) 200,000 211,750ATS Automation Tooling Systems, Inc. 144A sr. unsec. notes 6.50%, 6/15/23 (Canada) 110,000 115,110Belden, Inc. 144A company guaranty sr. unsec. sub. notes 5.25%, 7/15/24 75,000 78,188Berry Plastics Corp. company guaranty notes 5.50%, 5/15/22 76,000 79,325Berry Plastics Corp. company guaranty unsub. notes 5.125%, 7/15/23 225,000 235,125Boeing Capital Corp. sr. unsec. unsub. notes 4.70%, 10/27/19 105,000 111,130Bombardier, Inc. 144A sr. unsec. notes 8.75%, 12/1/21 (Canada) 405,000 434,363Briggs & Stratton Corp. company guaranty sr. unsec. notes 6.875%, 12/15/20 305,000 336,263CD&R Waterworks Merger Sub, LLC 144A sr. unsec. notes 6.125%, 8/15/25 35,000 35,919Covidien International Finance SA company guaranty sr. unsec. unsub. notes 6.00%, 10/15/17 (Luxembourg) 885,000 886,270Crown Cork & Seal Co., Inc. company guaranty sr. unsec. bonds 7.375%, 12/15/26 100,000 117,500Deere & Co. sr. unsec. unsub. notes 2.60%, 6/8/22 235,000 237,645Gates Global, LLC/Gates Global Co. 144A company guaranty sr. unsec. notes 6.00%, 7/15/22 455,000 466,375General Dynamics Corp. company guaranty sr. unsec. unsub. notes 3.60%, 11/15/42 150,000 147,927General Dynamics Corp. company guaranty sr. unsec. unsub. notes 2.25%, 11/15/22 100,000 99,818Great Lakes Dredge & Dock Corp. company guaranty sr. unsec. notes 8.00%, 5/15/22 335,000 347,563Honeywell International, Inc. sr. unsec. unsub. notes 5.375%, 3/1/41 155,000 190,573Honeywell International, Inc. sr. unsec. unsub. notes 4.25%, 3/1/21 120,000 128,253Johnson Controls International PLC sr. unsec. bonds 4.95%, 7/2/64 250,000 267,045Johnson Controls International PLC sr. unsec. unsub. bonds 4.50%, 2/15/47 680,000 721,646L3 Technologies, Inc. company guaranty sr. unsec. bonds 3.85%, 12/15/26 175,000 181,568Legrand France SA sr. unsec. unsub. notes 8.50%, 2/15/25 (France) 595,000 768,016Manitowoc Foodservice, Inc. sr. unsec. notes 9.50%, 2/15/24 480,000 551,400MasTec, Inc. company guaranty sr. unsec. unsub. notes 4.875%, 3/15/23 485,000 495,913

42 Dynamic Asset Allocation Growth Fund
CORPORATE BONDS AND NOTES (11.4%)* cont.Principal
amount ValueCapital goods cont.Medtronic, Inc. company guaranty sr. unsec. sub. notes 4.375%, 3/15/35 $106,000 $116,684Medtronic, Inc. company guaranty sr. unsec. sub. notes 3.50%, 3/15/25 112,000 116,806Moog, Inc. 144A company guaranty sr. unsec. notes 5.25%, 12/1/22 280,000 291,900Oshkosh Corp. company guaranty sr. unsec. sub. notes 5.375%, 3/1/25 415,000 439,900Oshkosh Corp. company guaranty sr. unsec. sub. notes 5.375%, 3/1/22 90,000 93,600Raytheon Co. sr. unsec. notes 4.875%, 10/15/40 65,000 76,050Reynolds Group Issuer, Inc./Reynolds Group Issuer, LLC/Reynolds Group Issuer Lu 144A company guaranty sr. FRN BBA LIBOR USD 3 Month + 3.50%, 4.804%, 7/15/21 445,000 453,900Reynolds Group Issuer, Inc./Reynolds Group Issuer, LLC/Reynolds Group Issuer Lu 144A company guaranty sr. unsec. unsub. notes 7.00%, 7/15/24 230,000 244,950Rockwell Collins, Inc. sr. unsec. bonds 4.35%, 4/15/47 425,000 440,218Tennant Co. 144A company guaranty sr. unsec. notes 5.625%, 5/1/25 55,000 56,925Tenneco, Inc. company guaranty sr. unsec. unsub. notes 5.375%, 12/15/24 534,000 560,700Tenneco, Inc. company guaranty sr. unsec. unsub. notes 5.00%, 7/15/26 120,000 123,000TI Group Automotive Systems, LLC 144A sr. unsec. notes 8.75%, 7/15/23 (United Kingdom) 680,000 720,800TransDigm, Inc. company guaranty sr. unsec. sub. notes 6.50%, 5/15/25 90,000 92,700TransDigm, Inc. company guaranty sr. unsec. sub. notes 6.375%, 6/15/26 375,000 384,143TransDigm, Inc. company guaranty sr. unsec. unsub. notes 6.50%, 7/15/24 129,000 133,193United Technologies Corp. sr. unsec. unsub. notes 4.50%, 6/1/42 130,000 139,708United Technologies Corp. sr. unsec. unsub. notes 1.90%, 5/4/20 1,920,000 1,913,798Wabash National Corp. 144A company guaranty sr. unsec. notes 5.50%, 10/1/25 90,000 91,688Wrangler Buyer Corp. 144A sr. unsec. notes 6.00%, 10/1/25 265,000 269,638ZF North America Capital, Inc. 144A company guaranty sr. unsec. unsub. notes 4.75%, 4/29/25 250,000 263,750ZF North America Capital, Inc. 144A company guaranty sr. unsec. unsub. notes 4.50%, 4/29/22 265,000 278,581
15,989,172Communication services (1.0%)America Movil SAB de CV company guaranty sr. unsec. unsub. notes 6.125%, 3/30/40 (Mexico) 140,000 170,719American Tower Corp. sr. unsec. bonds 3.125%, 1/15/27 R 1,340,000 1,285,482American Tower Corp. sr. unsec. notes 4.00%, 6/1/25 R 505,000 522,171AT&T, Inc. sr. unsec. unsub. bonds 5.15%, 2/14/50 705,000 708,434AT&T, Inc. sr. unsec. unsub. notes 5.80%, 2/15/19 475,000 499,707AT&T, Inc. sr. unsec. unsub. notes 4.75%, 5/15/46 392,000 376,983AT&T, Inc. sr. unsec. unsub. notes 4.25%, 3/1/27 1,065,000 1,096,182AT&T, Inc. sr. unsec. unsub. notes 3.40%, 5/15/25 393,000 387,656

Dynamic Asset Allocation Growth Fund 43
CORPORATE BONDS AND NOTES (11.4%)* cont.Principal
amount ValueCommunication services cont.Cablevision Systems Corp. sr. unsec. unsub. notes 8.00%, 4/15/20 $56,000 $62,090CCO Holdings, LLC/CCO Holdings Capital Corp. company guaranty sr. unsec. notes 5.25%, 9/30/22 161,000 165,830CCO Holdings, LLC/CCO Holdings Capital Corp. 144A company guaranty sr. unsec. bonds 5.50%, 5/1/26 135,000 139,894CCO Holdings, LLC/CCO Holdings Capital Corp. 144A company guaranty sr. unsec. notes 5.875%, 4/1/24 350,000 370,563CCO Holdings, LLC/CCO Holdings Capital Corp. 144A sr. unsec. notes 5.75%, 2/15/26 65,000 68,153CCO Holdings, LLC/CCO Holdings Capital Corp. 144A sr. unsec. unsub. notes 5.125%, 5/1/23 155,000 161,394CenturyLink, Inc. sr. unsec. unsub. notes 6.75%, 12/1/23 154,000 155,785CenturyLink, Inc. sr. unsec. unsub. notes 5.625%, 4/1/20 34,000 35,477Cequel Communications Holdings I, LLC/Cequel Capital Corp. 144A sr. unsec. unsub. notes 5.125%, 12/15/21 255,000 259,463Cequel Communications Holdings I, LLC/Cequel Capital Corp. 144A sr. unsec. unsub. notes 5.125%, 12/15/21 199,000 202,483Charter Communications Operating, LLC/Charter Communications Operating Capital Corp. company guaranty sr. sub. bonds 6.484%, 10/23/45 942,000 1,105,604Charter Communications Operating, LLC/Charter Communications Operating Capital Corp. company guaranty sr. sub. notes 4.908%, 7/23/25 283,000 302,531Charter Communications Operating, LLC/Charter Communications Operating Capital 144A company guaranty sr. bonds 5.375%, 5/1/47 105,000 109,081Comcast Corp. company guaranty sr. unsec. unsub. bonds 2.35%, 1/15/27 120,000 112,005Comcast Corp. company guaranty sr. unsec. unsub. notes 6.95%, 8/15/37 393,000 547,946Comcast Corp. company guaranty sr. unsec. unsub. notes 6.50%, 11/15/35 35,000 46,390Comcast Corp. company guaranty sr. unsec. unsub. notes 6.45%, 3/15/37 185,000 247,343Comcast Corp. company guaranty sr. unsec. unsub. notes 3.375%, 2/15/25 420,000 432,000Comcast Corp. company guaranty sr. unsec. unsub. notes 3.15%, 3/1/26 175,000 174,903CommScope Technologies Finance, LLC 144A sr. unsec. notes 6.00%, 6/15/25 130,000 138,938Cox Communications, Inc. 144A sr. unsec. bonds 3.50%, 8/15/27 200,000 196,833Crown Castle International Corp. sr. unsec. bonds 3.65%, 9/1/27 R 319,000 318,825Crown Castle International Corp. sr. unsec. notes 5.25%, 1/15/23 R 875,000 968,628Crown Castle International Corp. sr. unsec. notes 4.875%, 4/15/22 R 166,000 180,510Crown Castle International Corp. sr. unsec. unsub. bonds 4.45%, 2/15/26 R 20,000 21,175Crown Castle International Corp. sr. unsec. unsub. bonds 3.70%, 6/15/26 R 340,000 342,091CSC Holdings, LLC sr. unsec. unsub. bonds 5.25%, 6/1/24 513,000 518,771CSC Holdings, LLC sr. unsec. unsub. notes 6.75%, 11/15/21 326,000 359,823CSC Holdings, LLC 144A sr. unsec. unsub. notes 10.125%, 1/15/23 460,000 530,725

44 Dynamic Asset Allocation Growth Fund
CORPORATE BONDS AND NOTES (11.4%)* cont.Principal
amount ValueCommunication services cont.Deutsche Telekom International Finance BV company guaranty sr. unsec. unsub. bonds 8.75%, 6/15/30 (Netherlands) $195,000 $286,388Digicel, Ltd. 144A company guaranty sr. unsec. notes 6.75%, 3/1/23 (Jamaica) 200,000 196,000DISH DBS Corp. company guaranty sr. unsec. unsub. notes 5.875%, 11/15/24 220,000 230,588Frontier Communications Corp. sr. unsec. notes 11.00%, 9/15/25 80,000 67,800Frontier Communications Corp. sr. unsec. notes 10.50%, 9/15/22 280,000 242,900Frontier Communications Corp. sr. unsec. unsub. notes 7.625%, 4/15/24 42,000 32,025Intelsat Jackson Holdings SA company guaranty sr. unsec. notes 7.50%, 4/1/21 (Bermuda) 46,000 43,585Intelsat Jackson Holdings SA 144A company guaranty sr. notes 8.00%, 2/15/24 (Bermuda) 12,000 12,900Intelsat Jackson Holdings SA 144A sr. unsec. notes 9.75%, 7/15/25 (Bermuda) 615,000 624,225Intelsat Luxembourg SA company guaranty sr. unsec. bonds 7.75%, 6/1/21 (Luxembourg) 86,000 55,470Koninklijke KPN NV sr. unsec. unsub. bonds 8.375%, 10/1/30 (Netherlands) 90,000 125,150NBCUniversal Media, LLC company guaranty sr. unsec. unsub. notes 5.15%, 4/30/20 685,000 740,428NBCUniversal Media, LLC company guaranty sr. unsec. unsub. notes 4.375%, 4/1/21 1,155,000 1,242,969Orange SA sr. unsec. unsub. notes 4.125%, 9/14/21 (France) 132,000 140,917Quebecor Media, Inc. sr. unsec. unsub. notes 5.75%, 1/15/23 (Canada) 52,000 56,290Rogers Communications, Inc. company guaranty sr. unsec. bonds 8.75%, 5/1/32 (Canada) 166,000 240,222SFR Group SA 144A company guaranty sr. notes 7.375%, 5/1/26 (France) 250,000 270,000SFR Group SA 144A company guaranty sr. notes 6.00%, 5/15/22 (France) 400,000 417,500Sprint Capital Corp. company guaranty sr. unsec. unsub. notes 6.875%, 11/15/28 675,000 756,000Sprint Communications, Inc. sr. unsec. notes 7.00%, 8/15/20 87,000 95,048Sprint Communications, Inc. 144A company guaranty sr. unsec. notes 9.00%, 11/15/18 87,000 93,453Sprint Corp. company guaranty sr. unsec. sub. notes 7.875%, 9/15/23 418,000 484,880Sprint Corp. company guaranty sr. unsec. sub. notes 7.25%, 9/15/21 589,000 654,526Sprint Spectrum Co., LLC/Sprint Spectrum Co. II, LLC/Sprint Spectrum Co. III, LL 144A company guaranty sr. notes 3.36%, 9/20/21 910,000 923,650T-Mobile USA, Inc. company guaranty sr. unsec. notes 6.625%, 4/1/23 557,000 586,243T-Mobile USA, Inc. company guaranty sr. unsec. notes 6.375%, 3/1/25 90,000 96,903T-Mobile USA, Inc. company guaranty sr. unsec. notes 6.00%, 3/1/23 60,000 63,225

Dynamic Asset Allocation Growth Fund 45
CORPORATE BONDS AND NOTES (11.4%)* cont.Principal
amount ValueCommunication services cont.T-Mobile USA, Inc. company guaranty sr. unsec. notes 5.375%, 4/15/27 $140,000 $150,892T-Mobile USA, Inc. company guaranty sr. unsec. notes 4.00%, 4/15/22 75,000 77,664T-Mobile USA, Inc. company guaranty sr. unsec. unsub. notes 6.836%, 4/28/23 10,000 10,550T-Mobile USA, Inc. company guaranty sr. unsec. unsub. notes 6.125%, 1/15/22 280,000 291,200TCI Communications, Inc. sr. unsec. unsub. notes 7.125%, 2/15/28 205,000 268,602Telecom Italia SpA 144A sr. unsec. notes 5.303%, 5/30/24 (Italy) 500,000 543,750Telefonica Emisiones SAU company guaranty sr. unsec. unsub. notes 7.045%, 6/20/36 (Spain) 120,000 159,483Verizon Communications, Inc. sr. unsec. unsub. notes 4.522%, 9/15/48 554,000 536,367Verizon Communications, Inc. sr. unsec. unsub. notes 4.40%, 11/1/34 335,000 335,214Verizon Communications, Inc. sr. unsec. unsub. notes 4.125%, 3/16/27 790,000 824,297Videotron, Ltd. company guaranty sr. unsec. unsub. notes 5.00%, 7/15/22 (Canada) 367,000 396,360Videotron, Ltd./Videotron Ltee. 144A sr. unsec. notes 5.125%, 4/15/27 (Canada) 655,000 681,004West Corp. 144A company guaranty sr. unsec. sub. notes 5.375%, 7/15/22 335,000 338,350Windstream Services, LLC company guaranty sr. unsec. notes 6.375%, 8/1/23 266,000 188,195
26,903,801Conglomerates (0.1%)General Electric Co. jr. unsec. sub. FRB Ser. D, 5.00%, perpetual maturity 320,000 335,466General Electric Co. sr. unsec. bonds 4.50%, 3/11/44 170,000 190,300Siemens Financieringsmaatschappij NV 144A company guaranty sr. unsec. notes 2.20%, 3/16/20 (Netherlands) 2,780,000 2,786,978
3,312,744Consumer cyclicals (1.5%)21st Century Fox America, Inc. company guaranty sr. unsec. unsub. notes 7.75%, 12/1/45 1,225,000 1,855,338Alimentation Couche-Tard, Inc. 144A company guaranty sr. unsec. notes 3.55%, 7/26/27 (Canada) 175,000 176,783Amazon.com, Inc. sr. unsec. notes 1.20%, 11/29/17 871,000 870,847Amazon.com, Inc. 144A sr. unsec. notes 3.15%, 8/22/27 710,000 715,070AMC Entertainment Holdings, Inc. company guaranty sr. unsec. notes 6.125%, 5/15/27 200,000 197,500AMC Entertainment Holdings, Inc. company guaranty sr. unsec. sub. notes 5.875%, 11/15/26 220,000 216,975AMC Entertainment Holdings, Inc. company guaranty sr. unsec. sub. notes 5.875%, 2/15/22 61,000 61,458AMC Entertainment Holdings, Inc. company guaranty sr. unsec. sub. notes 5.75%, 6/15/25 110,000 108,075American Builders & Contractors Supply Co., Inc. 144A sr. unsec. notes 5.75%, 12/15/23 235,000 250,275
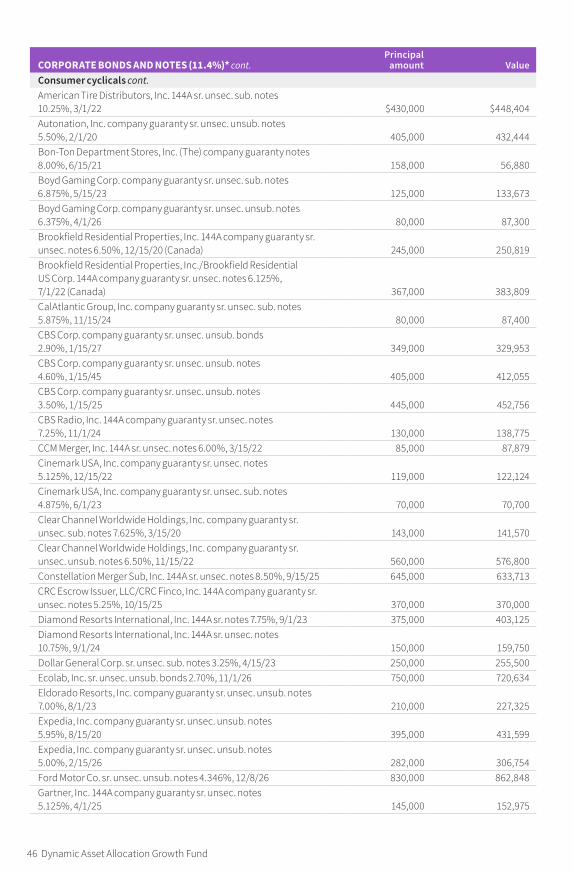
46 Dynamic Asset Allocation Growth Fund
CORPORATE BONDS AND NOTES (11.4%)* cont.Principal
amount ValueConsumer cyclicals cont.American Tire Distributors, Inc. 144A sr. unsec. sub. notes 10.25%, 3/1/22 $430,000 $448,404Autonation, Inc. company guaranty sr. unsec. unsub. notes 5.50%, 2/1/20 405,000 432,444Bon-Ton Department Stores, Inc. (The) company guaranty notes 8.00%, 6/15/21 158,000 56,880Boyd Gaming Corp. company guaranty sr. unsec. sub. notes 6.875%, 5/15/23 125,000 133,673Boyd Gaming Corp. company guaranty sr. unsec. unsub. notes 6.375%, 4/1/26 80,000 87,300Brookfield Residential Properties, Inc. 144A company guaranty sr. unsec. notes 6.50%, 12/15/20 (Canada) 245,000 250,819Brookfield Residential Properties, Inc./Brookfield Residential US Corp. 144A company guaranty sr. unsec. notes 6.125%, 7/1/22 (Canada) 367,000 383,809CalAtlantic Group, Inc. company guaranty sr. unsec. sub. notes 5.875%, 11/15/24 80,000 87,400CBS Corp. company guaranty sr. unsec. unsub. bonds 2.90%, 1/15/27 349,000 329,953CBS Corp. company guaranty sr. unsec. unsub. notes 4.60%, 1/15/45 405,000 412,055CBS Corp. company guaranty sr. unsec. unsub. notes 3.50%, 1/15/25 445,000 452,756CBS Radio, Inc. 144A company guaranty sr. unsec. notes 7.25%, 11/1/24 130,000 138,775CCM Merger, Inc. 144A sr. unsec. notes 6.00%, 3/15/22 85,000 87,879Cinemark USA, Inc. company guaranty sr. unsec. notes 5.125%, 12/15/22 119,000 122,124Cinemark USA, Inc. company guaranty sr. unsec. sub. notes 4.875%, 6/1/23 70,000 70,700Clear Channel Worldwide Holdings, Inc. company guaranty sr. unsec. sub. notes 7.625%, 3/15/20 143,000 141,570Clear Channel Worldwide Holdings, Inc. company guaranty sr. unsec. unsub. notes 6.50%, 11/15/22 560,000 576,800Constellation Merger Sub, Inc. 144A sr. unsec. notes 8.50%, 9/15/25 645,000 633,713CRC Escrow Issuer, LLC/CRC Finco, Inc. 144A company guaranty sr. unsec. notes 5.25%, 10/15/25 370,000 370,000Diamond Resorts International, Inc. 144A sr. notes 7.75%, 9/1/23 375,000 403,125Diamond Resorts International, Inc. 144A sr. unsec. notes 10.75%, 9/1/24 150,000 159,750Dollar General Corp. sr. unsec. sub. notes 3.25%, 4/15/23 250,000 255,500Ecolab, Inc. sr. unsec. unsub. bonds 2.70%, 11/1/26 750,000 720,634Eldorado Resorts, Inc. company guaranty sr. unsec. unsub. notes 7.00%, 8/1/23 210,000 227,325Expedia, Inc. company guaranty sr. unsec. unsub. notes 5.95%, 8/15/20 395,000 431,599Expedia, Inc. company guaranty sr. unsec. unsub. notes 5.00%, 2/15/26 282,000 306,754Ford Motor Co. sr. unsec. unsub. notes 4.346%, 12/8/26 830,000 862,848Gartner, Inc. 144A company guaranty sr. unsec. notes 5.125%, 4/1/25 145,000 152,975

Dynamic Asset Allocation Growth Fund 47
CORPORATE BONDS AND NOTES (11.4%)* cont.Principal
amount ValueConsumer cyclicals cont.General Motors Financial Co., Inc. company guaranty sr. unsec. notes 4.00%, 10/6/26 $802,000 $803,451General Motors Financial Co., Inc. company guaranty sr. unsec. notes 3.25%, 5/15/18 241,000 243,158General Motors Financial Co., Inc. company guaranty sr. unsec. unsub. notes 4.30%, 7/13/25 137,000 141,451General Motors Financial Co., Inc. company guaranty sr. unsec. unsub. notes 4.00%, 1/15/25 55,000 56,093GLP Capital LP/GLP Financing II, Inc. company guaranty sr. unsec. sub. notes 4.875%, 11/1/20 179,000 189,069GLP Capital LP/GLP Financing II, Inc. company guaranty sr. unsec. unsub. notes 5.375%, 4/15/26 110,000 120,038Gray Television, Inc. 144A company guaranty sr. unsec. notes 5.875%, 7/15/26 255,000 262,650Great Canadian Gaming Corp. 144A company guaranty sr. unsec. notes 6.625%, 7/25/22 (Canada) CAD 227,000 188,481Grupo Televisa SAB sr. unsec. unsub. bonds 6.625%, 1/15/40 (Mexico) $460,000 559,401GW Honos Security Corp. 144A company guaranty sr. unsec. notes 8.75%, 5/15/25 (Canada) 310,000 330,925Hanesbrands, Inc. 144A company guaranty sr. unsec. unsub. notes 4.625%, 5/15/24 155,000 161,394Hilton Worldwide Finance, LLC/Hilton Worldwide Finance Corp. company guaranty sr. unsec. notes 4.875%, 4/1/27 1,330,000 1,396,500Home Depot, Inc. (The) sr. unsec. unsub. notes 2.625%, 6/1/22 410,000 416,516Host Hotels & Resorts LP sr. unsec. unsub. notes 6.00%, 10/1/21 R 89,000 99,063Host Hotels & Resorts LP sr. unsec. unsub. notes 5.25%, 3/15/22 R 421,000 458,138Howard Hughes Corp. (The) 144A sr. unsec. notes 5.375%, 3/15/25 390,000 397,800Hyatt Hotels Corp. sr. unsec. unsub. notes 4.85%, 3/15/26 395,000 430,983Hyatt Hotels Corp. sr. unsec. unsub. notes 3.375%, 7/15/23 50,000 50,701iHeartCommunications, Inc. company guaranty sr. notes 9.00%, 12/15/19 169,000 127,595IHO Verwaltungs GmbH 144A sr. notes 4.75%, 9/15/26 (Germany) ‡‡ 270,000 275,063IHS Markit, Ltd. 144A company guaranty notes 4.75%, 2/15/25 (United Kingdom) 1,260,000 1,351,351Jack Ohio Finance, LLC/Jack Ohio Finance 1 Corp. 144A company guaranty notes 10.25%, 11/15/22 465,000 508,013Jack Ohio Finance, LLC/Jack Ohio Finance 1 Corp. 144A company guaranty sr. notes 6.75%, 11/15/21 425,000 445,719Jacobs Entertainment, Inc. 144A notes 7.875%, 2/1/24 90,000 96,975Jo-Ann Stores Holdings, Inc. 144A sr. unsec. notes 9.75%, 10/15/19 ‡‡ 120,000 116,700Lamar Media Corp. company guaranty sr. unsec. sub. notes 5.875%, 2/1/22 115,000 118,450Lamar Media Corp. company guaranty sr. unsec. sub. notes 5.375%, 1/15/24 85,000 89,463Lear Corp. sr. unsec. unsub. bonds 3.80%, 9/15/27 740,000 737,191Lennar Corp. company guaranty sr. unsec. unsub. notes 4.75%, 11/15/22 141,000 149,108Lions Gate Entertainment Corp. 144A sr. unsec. unsub. notes 5.875%, 11/1/24 255,000 267,113

48 Dynamic Asset Allocation Growth Fund
CORPORATE BONDS AND NOTES (11.4%)* cont.Principal
amount ValueConsumer cyclicals cont.Live Nation Entertainment, Inc. 144A company guaranty sr. unsec. notes 4.875%, 11/1/24 $120,000 $124,200Masonite International Corp. 144A company guaranty sr. unsec. notes 5.625%, 3/15/23 355,000 371,525Mattamy Group Corp. 144A sr. unsec. notes 6.875%, 12/15/23 (Canada) 65,000 67,884Mattamy Group Corp. 144A sr. unsec. notes 6.50%, 10/1/25 (Canada) 180,000 184,500MGM Resorts International company guaranty sr. unsec. notes 6.75%, 10/1/20 225,000 248,063MGM Resorts International company guaranty sr. unsec. unsub. notes 8.625%, 2/1/19 140,000 150,850MGM Resorts International company guaranty sr. unsec. unsub. notes 6.625%, 12/15/21 165,000 185,625Moody’s Corp. 144A sr. unsec. bonds 3.25%, 1/15/28 180,000 178,785Navistar International Corp. company guaranty sr. unsec. notes 8.25%, 11/1/21 267,000 268,001Neiman Marcus Group, LLC (The) company guaranty sr. notes 7.125%, 6/1/28 180,000 109,800Neiman Marcus Group, Ltd. 144A company guaranty sr. unsec. sub. notes 8.75%, 10/15/21 ‡‡ 145,000 68,150Neiman Marcus Group, Ltd. 144A company guaranty sr. unsec. sub. notes 8.00%, 10/15/21 120,000 62,400Nexstar Broadcasting, Inc. 144A company guaranty sr. unsec. notes 5.625%, 8/1/24 310,000 320,850Nielsen Co. Luxembourg Sarl (The) 144A company guaranty sr. unsec. notes 5.00%, 2/1/25 (Luxembourg) 140,000 145,775Nielsen Co. Luxembourg Sarl (The) 144A company guaranty sr. unsec. sub. notes 5.50%, 10/1/21 (Luxembourg) 95,000 97,613Nielsen Finance, LLC/Nielsen Finance Co. 144A company guaranty sr. unsec. sub. notes 5.00%, 4/15/22 180,000 186,525O’Reilly Automotive, Inc. company guaranty sr. unsec. notes 3.85%, 6/15/23 55,000 57,408O’Reilly Automotive, Inc. company guaranty sr. unsec. sub. notes 3.55%, 3/15/26 185,000 185,430Omnicom Group, Inc. company guaranty sr. unsec. unsub. notes 3.60%, 4/15/26 690,000 695,589Outfront Media Capital, LLC/Outfront Media Capital Corp. company guaranty sr. unsec. sub. notes 5.875%, 3/15/25 120,000 125,700Outfront Media Capital, LLC/Outfront Media Capital Corp. company guaranty sr. unsec. sub. notes 5.625%, 2/15/24 155,000 161,588Penn National Gaming, Inc. 144A sr. unsec. notes 5.625%, 1/15/27 175,000 181,563Penske Automotive Group, Inc. company guaranty sr. unsec. sub. notes 5.75%, 10/1/22 172,000 177,607Penske Automotive Group, Inc. company guaranty sr. unsec. sub. notes 5.50%, 5/15/26 140,000 144,725Penske Automotive Group, Inc. company guaranty sr. unsec. sub. notes 5.375%, 12/1/24 135,000 139,050PetSmart, Inc. 144A sr. unsec. notes 7.125%, 3/15/23 100,000 77,980Priceline Group, Inc. (The) sr. unsec. notes 3.65%, 3/15/25 390,000 401,654PulteGroup, Inc. company guaranty sr. unsec. unsub. notes 7.875%, 6/15/32 313,000 383,519

Dynamic Asset Allocation Growth Fund 49
CORPORATE BONDS AND NOTES (11.4%)* cont.Principal
amount ValueConsumer cyclicals cont.PulteGroup, Inc. company guaranty sr. unsec. unsub. notes 5.50%, 3/1/26 $380,000 $414,352QVC, Inc. company guaranty sr. notes 4.85%, 4/1/24 200,000 207,124QVC, Inc. company guaranty sr. sub. notes 4.45%, 2/15/25 110,000 111,747Regal Entertainment Group sr. unsec. sub. notes 5.75%, 6/15/23 440,000 453,200Rivers Pittsburgh Borrower LP/Rivers Pittsburgh Finance Corp. 144A sr. notes 6.125%, 8/15/21 320,000 322,800S&P Global, Inc. company guaranty sr. unsec. unsub. notes 4.40%, 2/15/26 240,000 258,596S&P Global, Inc. company guaranty sr. unsec. unsub. notes 2.95%, 1/22/27 332,000 319,332Sabre GLBL, Inc. 144A company guaranty sr. notes 5.375%, 4/15/23 165,000 170,990Scientific Games International, Inc. company guaranty sr. unsec. notes 10.00%, 12/1/22 820,000 908,150Scientific Games International, Inc. 144A company guaranty sr. notes 7.00%, 1/1/22 275,000 291,844Sinclair Television Group, Inc. 144A company guaranty sr. unsec. sub. notes 5.625%, 8/1/24 530,000 543,913Sirius XM Radio, Inc. 144A company guaranty sr. unsec. sub. notes 6.00%, 7/15/24 157,000 168,971Sirius XM Radio, Inc. 144A sr. unsec. bonds 5.00%, 8/1/27 1,090,000 1,113,163Six Flags Entertainment Corp. 144A company guaranty sr. unsec. bonds 5.50%, 4/15/27 330,000 338,250Six Flags Entertainment Corp. 144A company guaranty sr. unsec. unsub. notes 4.875%, 7/31/24 415,000 422,263Spectrum Brands, Inc. company guaranty sr. unsec. notes 5.75%, 7/15/25 110,000 117,150Spectrum Brands, Inc. company guaranty sr. unsec. sub. notes 6.625%, 11/15/22 6,000 6,240Spectrum Brands, Inc. company guaranty sr. unsec. unsub. notes 6.125%, 12/15/24 85,000 91,056Standard Industries, Inc. 144A sr. unsec. notes 5.375%, 11/15/24 340,000 361,352Standard Industries, Inc. 144A sr. unsec. notes 5.00%, 2/15/27 1,045,000 1,089,413SugarHouse HSP Gaming Prop. Mezz LP/SugarHouse HSP Gaming Finance Corp. 144A company guaranty sr. unsub. notes 5.875%, 5/15/25 215,000 211,238Taylor Morrison Communities, Inc./Monarch Communities, Inc. 144A company guaranty sr. unsec. notes 5.25%, 4/15/21 101,000 103,651Taylor Morrison Communities, Inc./Monarch Communities, Inc. 144A company guaranty sr. unsec. sub. notes 5.625%, 3/1/24 107,000 111,414Time Warner, Inc. company guaranty sr. unsec. unsub. bonds 3.80%, 2/15/27 800,000 800,186Time Warner, Inc. company guaranty sr. unsec. unsub. bonds 2.95%, 7/15/26 270,000 255,007Townsquare Media, Inc. 144A company guaranty sr. unsec. notes 6.50%, 4/1/23 45,000 45,675Toyota Motor Credit Corp. sr. unsec. unsub. bonds Ser. GMTN, 1.55%, 7/13/18 885,000 885,499TRI Pointe Group, Inc./TRI Pointe Homes, Inc. company guaranty sr. unsec. unsub. notes 5.875%, 6/15/24 240,000 256,800Tribune Media Co. company guaranty sr. unsec. notes 5.875%, 7/15/22 115,000 119,600

50 Dynamic Asset Allocation Growth Fund
CORPORATE BONDS AND NOTES (11.4%)* cont.Principal
amount ValueConsumer cyclicals cont.Univision Communications, Inc. 144A company guaranty sr. sub. notes 5.125%, 2/15/25 $270,000 $272,363Viacom, Inc. sr. unsec. unsub. notes 4.50%, 3/1/21 210,000 220,779Vulcan Materials Co. sr. unsec. unsub. notes 4.50%, 4/1/25 105,000 111,610Walt Disney Co. (The) sr. unsec. notes 2.75%, 8/16/21 80,000 81,569Walt Disney Co. (The) sr. unsec. unsub. notes 4.375%, 8/16/41 30,000 32,274Werner FinCo LP/Werner FinCo, Inc. 144A company guaranty sr. unsec. notes 8.75%, 7/15/25 355,000 358,550WMG Acquisition Corp. 144A company guaranty sr. notes 5.00%, 8/1/23 195,000 201,338Wolverine World Wide, Inc. 144A company guaranty sr. unsec. bonds 5.00%, 9/1/26 165,000 165,050Wyndham Worldwide Corp. sr. unsec. unsub. bonds 4.50%, 4/1/27 525,000 526,853Wyndham Worldwide Corp. sr. unsec. unsub. notes 5.625%, 3/1/21 210,000 223,193Wynn Las Vegas, LLC/Wynn Las Vegas Capital Corp. 144A company guaranty sr. unsec. sub. notes 5.25%, 5/15/27 215,000 219,029
42,192,381Consumer staples (0.9%)1011778 BC ULC/New Red Finance, Inc. 144A company guaranty notes 6.00%, 4/1/22 (Canada) 53,000 54,6701011778 BC ULC/New Red Finance, Inc. 144A company guaranty notes 5.00%, 10/15/25 (Canada) 180,000 182,7001011778 BC ULC/New Red Finance, Inc. 144A company guaranty notes 5.00%, 10/15/25 (Canada) ## 130,000 131,9501011778 BC ULC/New Red Finance, Inc. 144A company guaranty sr. notes 4.625%, 1/15/22 (Canada) 80,000 81,8001011778 BC ULC/New Red Finance, Inc. 144A company guaranty sr. sub. notes 4.25%, 5/15/24 (Canada) 215,000 215,753Altria Group, Inc. company guaranty sr. unsec. notes 9.25%, 8/6/19 5,000 5,663Altria Group, Inc. company guaranty sr. unsec. unsub. notes 4.00%, 1/31/24 138,000 146,728Altria Group, Inc. company guaranty sr. unsec. unsub. notes 2.85%, 8/9/22 545,000 555,460Altria Group, Inc. company guaranty sr. unsec. unsub. notes 2.625%, 1/14/20 1,525,000 1,548,557Anheuser-Busch InBev Finance, Inc. company guaranty sr. unsec. unsub. bonds 4.90%, 2/1/46 2,028,000 2,290,763Anheuser-Busch InBev Finance, Inc. company guaranty sr. unsec. unsub. bonds 3.65%, 2/1/26 1,158,000 1,197,965Anheuser-Busch InBev Finance, Inc. company guaranty sr. unsec. unsub. notes 2.65%, 2/1/21 1,125,000 1,143,271Anheuser-Busch InBev Finance, Inc. company guaranty sr. unsec. unsub. notes 1.25%, 1/17/18 321,000 320,810Anheuser-Busch InBev Worldwide, Inc. company guaranty sr. unsec. unsub. notes 2.50%, 7/15/22 350,000 352,908Ascend Learning, LLC 144A sr. unsec. notes 6.875%, 8/1/25 95,000 100,225Ashtead Capital, Inc. 144A company guaranty notes 5.625%, 10/1/24 260,000 278,200Ashtead Capital, Inc. 144A notes 4.375%, 8/15/27 1,380,000 1,421,400Ashtead Capital, Inc. 144A notes 4.125%, 8/15/25 280,000 288,400

Dynamic Asset Allocation Growth Fund 51
CORPORATE BONDS AND NOTES (11.4%)* cont.Principal
amount ValueConsumer staples cont.BlueLine Rental Finance Corp./BlueLine Rental, LLC 144A company guaranty sub. notes 9.25%, 3/15/24 $455,000 $489,694Brand Energy & Infrastructure Services, Inc. 144A sr. unsec. notes 8.50%, 7/15/25 255,000 276,038CEC Entertainment, Inc. company guaranty sr. unsec. sub. notes 8.00%, 2/15/22 230,000 238,625Ceridian HCM Holding, Inc. 144A sr. unsec. notes 11.00%, 3/15/21 409,000 434,051Coca-Cola Co. (The) sr. unsec. unsub. bonds 2.25%, 9/1/26 205,000 194,331Constellation Brands, Inc. company guaranty sr. unsec. unsub. bonds 3.70%, 12/6/26 135,000 138,079CVS Health Corp. sr. unsec. notes 4.75%, 12/1/22 438,000 479,041CVS Health Corp. sr. unsec. unsub. notes 2.25%, 12/5/18 885,000 888,955CVS Pass-Through Trust sr. notes 6.036%, 12/10/28 10,009 11,293CVS Pass-Through Trust 144A sr. mtge. notes 4.704%, 1/10/36 156,829 166,742Dean Foods Co. 144A company guaranty sr. unsec. notes 6.50%, 3/15/23 145,000 147,175Diamond (BC) BV 144A sr. unsec. notes 5.625%, 8/15/25 EUR 235,000 281,896ERAC USA Finance, LLC 144A company guaranty sr. unsec. bonds 4.50%, 2/15/45 $470,000 467,466ERAC USA Finance, LLC 144A company guaranty sr. unsec. notes 7.00%, 10/15/37 308,000 405,126ERAC USA Finance, LLC 144A company guaranty sr. unsec. notes 5.625%, 3/15/42 226,000 261,349Fresh Market, Inc. (The) 144A company guaranty sr. notes 9.75%, 5/1/23 190,000 115,900Golden Nugget, Inc. 144A company guaranty sr. unsec. sub. notes 8.75%, 10/1/25 415,000 422,263Golden Nugget, Inc. 144A sr. unsec. notes 6.75%, 10/15/24 670,000 677,538Grupo Bimbo SAB de CV 144A company guaranty sr. unsec. notes 3.875%, 6/27/24 (Mexico) 235,000 242,137High Ridge Brands Co. 144A company guaranty sr. unsec. notes 8.875%, 3/15/25 230,000 219,075Kellogg Co. sr. unsec. unsub. notes 3.25%, 4/1/26 505,000 504,690KFC Holding Co./Pizza Hut Holdings, LLC/Taco Bell of America, LLC 144A company guaranty sr. unsec. notes 5.25%, 6/1/26 200,000 211,750KFC Holding Co./Pizza Hut Holdings, LLC/Taco Bell of America, LLC 144A company guaranty sr. unsec. notes 5.00%, 6/1/24 200,000 210,750KFC Holding Co./Pizza Hut Holdings, LLC/Taco Bell of America, LLC 144A company guaranty sr. unsec. notes 4.75%, 6/1/27 145,000 149,350Kraft Heinz Co. (The) company guaranty sr. unsec. FRN BBA LIBOR USD 3 Month + 0.82%, 2.129%, 8/10/22 295,000 294,989Kraft Heinz Co. (The) company guaranty sr. unsec. notes Ser. 144A, 6.875%, 1/26/39 340,000 436,804Kraft Heinz Co. (The) company guaranty sr. unsec. unsub. notes 6.50%, 2/9/40 180,000 223,517Lamb Weston Holdings, Inc. 144A company guaranty sr. unsec. unsub. notes 4.875%, 11/1/26 1,097,000 1,151,850Lamb Weston Holdings, Inc. 144A company guaranty sr. unsec. unsub. notes 4.625%, 11/1/24 60,000 62,550McDonald’s Corp. sr. unsec. unsub. notes 6.30%, 10/15/37 56,000 72,318McDonald’s Corp. sr. unsec. unsub. notes 5.70%, 2/1/39 174,000 212,082
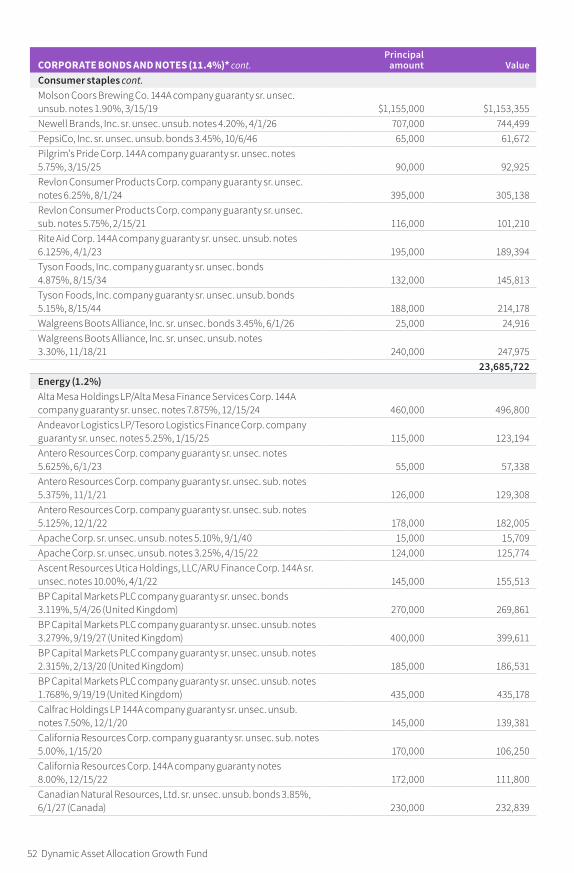
52 Dynamic Asset Allocation Growth Fund
CORPORATE BONDS AND NOTES (11.4%)* cont.Principal
amount ValueConsumer staples cont.Molson Coors Brewing Co. 144A company guaranty sr. unsec. unsub. notes 1.90%, 3/15/19 $1,155,000 $1,153,355Newell Brands, Inc. sr. unsec. unsub. notes 4.20%, 4/1/26 707,000 744,499PepsiCo, Inc. sr. unsec. unsub. bonds 3.45%, 10/6/46 65,000 61,672Pilgrim’s Pride Corp. 144A company guaranty sr. unsec. notes 5.75%, 3/15/25 90,000 92,925Revlon Consumer Products Corp. company guaranty sr. unsec. notes 6.25%, 8/1/24 395,000 305,138Revlon Consumer Products Corp. company guaranty sr. unsec. sub. notes 5.75%, 2/15/21 116,000 101,210Rite Aid Corp. 144A company guaranty sr. unsec. unsub. notes 6.125%, 4/1/23 195,000 189,394Tyson Foods, Inc. company guaranty sr. unsec. bonds 4.875%, 8/15/34 132,000 145,813Tyson Foods, Inc. company guaranty sr. unsec. unsub. bonds 5.15%, 8/15/44 188,000 214,178Walgreens Boots Alliance, Inc. sr. unsec. bonds 3.45%, 6/1/26 25,000 24,916Walgreens Boots Alliance, Inc. sr. unsec. unsub. notes 3.30%, 11/18/21 240,000 247,975
23,685,722Energy (1.2%)Alta Mesa Holdings LP/Alta Mesa Finance Services Corp. 144A company guaranty sr. unsec. notes 7.875%, 12/15/24 460,000 496,800Andeavor Logistics LP/Tesoro Logistics Finance Corp. company guaranty sr. unsec. notes 5.25%, 1/15/25 115,000 123,194Antero Resources Corp. company guaranty sr. unsec. notes 5.625%, 6/1/23 55,000 57,338Antero Resources Corp. company guaranty sr. unsec. sub. notes 5.375%, 11/1/21 126,000 129,308Antero Resources Corp. company guaranty sr. unsec. sub. notes 5.125%, 12/1/22 178,000 182,005Apache Corp. sr. unsec. unsub. notes 5.10%, 9/1/40 15,000 15,709Apache Corp. sr. unsec. unsub. notes 3.25%, 4/15/22 124,000 125,774Ascent Resources Utica Holdings, LLC/ARU Finance Corp. 144A sr. unsec. notes 10.00%, 4/1/22 145,000 155,513BP Capital Markets PLC company guaranty sr. unsec. bonds 3.119%, 5/4/26 (United Kingdom) 270,000 269,861BP Capital Markets PLC company guaranty sr. unsec. unsub. notes 3.279%, 9/19/27 (United Kingdom) 400,000 399,611BP Capital Markets PLC company guaranty sr. unsec. unsub. notes 2.315%, 2/13/20 (United Kingdom) 185,000 186,531BP Capital Markets PLC company guaranty sr. unsec. unsub. notes 1.768%, 9/19/19 (United Kingdom) 435,000 435,178Calfrac Holdings LP 144A company guaranty sr. unsec. unsub. notes 7.50%, 12/1/20 145,000 139,381California Resources Corp. company guaranty sr. unsec. sub. notes 5.00%, 1/15/20 170,000 106,250California Resources Corp. 144A company guaranty notes 8.00%, 12/15/22 172,000 111,800Canadian Natural Resources, Ltd. sr. unsec. unsub. bonds 3.85%, 6/1/27 (Canada) 230,000 232,839
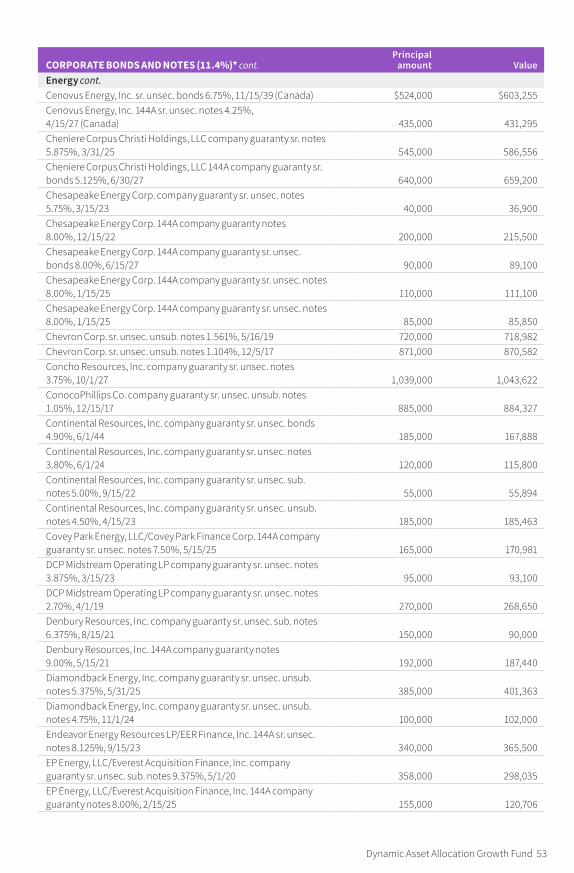
Dynamic Asset Allocation Growth Fund 53
CORPORATE BONDS AND NOTES (11.4%)* cont.Principal
amount ValueEnergy cont.Cenovus Energy, Inc. sr. unsec. bonds 6.75%, 11/15/39 (Canada) $524,000 $603,255Cenovus Energy, Inc. 144A sr. unsec. notes 4.25%, 4/15/27 (Canada) 435,000 431,295Cheniere Corpus Christi Holdings, LLC company guaranty sr. notes 5.875%, 3/31/25 545,000 586,556Cheniere Corpus Christi Holdings, LLC 144A company guaranty sr. bonds 5.125%, 6/30/27 640,000 659,200Chesapeake Energy Corp. company guaranty sr. unsec. notes 5.75%, 3/15/23 40,000 36,900Chesapeake Energy Corp. 144A company guaranty notes 8.00%, 12/15/22 200,000 215,500Chesapeake Energy Corp. 144A company guaranty sr. unsec. bonds 8.00%, 6/15/27 90,000 89,100Chesapeake Energy Corp. 144A company guaranty sr. unsec. notes 8.00%, 1/15/25 110,000 111,100Chesapeake Energy Corp. 144A company guaranty sr. unsec. notes 8.00%, 1/15/25 85,000 85,850Chevron Corp. sr. unsec. unsub. notes 1.561%, 5/16/19 720,000 718,982Chevron Corp. sr. unsec. unsub. notes 1.104%, 12/5/17 871,000 870,582Concho Resources, Inc. company guaranty sr. unsec. notes 3.75%, 10/1/27 1,039,000 1,043,622ConocoPhillips Co. company guaranty sr. unsec. unsub. notes 1.05%, 12/15/17 885,000 884,327Continental Resources, Inc. company guaranty sr. unsec. bonds 4.90%, 6/1/44 185,000 167,888Continental Resources, Inc. company guaranty sr. unsec. notes 3.80%, 6/1/24 120,000 115,800Continental Resources, Inc. company guaranty sr. unsec. sub. notes 5.00%, 9/15/22 55,000 55,894Continental Resources, Inc. company guaranty sr. unsec. unsub. notes 4.50%, 4/15/23 185,000 185,463Covey Park Energy, LLC/Covey Park Finance Corp. 144A company guaranty sr. unsec. notes 7.50%, 5/15/25 165,000 170,981DCP Midstream Operating LP company guaranty sr. unsec. notes 3.875%, 3/15/23 95,000 93,100DCP Midstream Operating LP company guaranty sr. unsec. notes 2.70%, 4/1/19 270,000 268,650Denbury Resources, Inc. company guaranty sr. unsec. sub. notes 6.375%, 8/15/21 150,000 90,000Denbury Resources, Inc. 144A company guaranty notes 9.00%, 5/15/21 192,000 187,440Diamondback Energy, Inc. company guaranty sr. unsec. unsub. notes 5.375%, 5/31/25 385,000 401,363Diamondback Energy, Inc. company guaranty sr. unsec. unsub. notes 4.75%, 11/1/24 100,000 102,000Endeavor Energy Resources LP/EER Finance, Inc. 144A sr. unsec. notes 8.125%, 9/15/23 340,000 365,500EP Energy, LLC/Everest Acquisition Finance, Inc. company guaranty sr. unsec. sub. notes 9.375%, 5/1/20 358,000 298,035EP Energy, LLC/Everest Acquisition Finance, Inc. 144A company guaranty notes 8.00%, 2/15/25 155,000 120,706
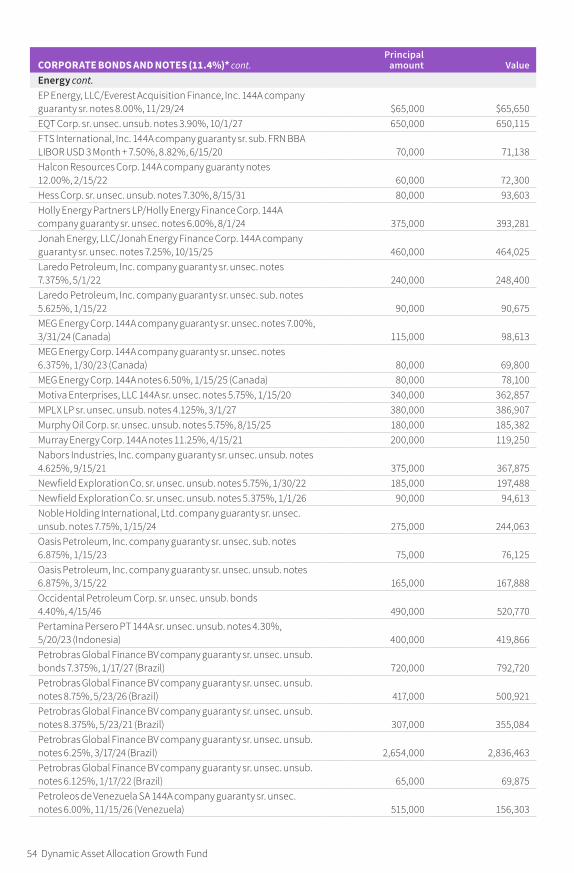
54 Dynamic Asset Allocation Growth Fund
CORPORATE BONDS AND NOTES (11.4%)* cont.Principal
amount ValueEnergy cont.EP Energy, LLC/Everest Acquisition Finance, Inc. 144A company guaranty sr. notes 8.00%, 11/29/24 $65,000 $65,650EQT Corp. sr. unsec. unsub. notes 3.90%, 10/1/27 650,000 650,115FTS International, Inc. 144A company guaranty sr. sub. FRN BBA LIBOR USD 3 Month + 7.50%, 8.82%, 6/15/20 70,000 71,138Halcon Resources Corp. 144A company guaranty notes 12.00%, 2/15/22 60,000 72,300Hess Corp. sr. unsec. unsub. notes 7.30%, 8/15/31 80,000 93,603Holly Energy Partners LP/Holly Energy Finance Corp. 144A company guaranty sr. unsec. notes 6.00%, 8/1/24 375,000 393,281Jonah Energy, LLC/Jonah Energy Finance Corp. 144A company guaranty sr. unsec. notes 7.25%, 10/15/25 460,000 464,025Laredo Petroleum, Inc. company guaranty sr. unsec. notes 7.375%, 5/1/22 240,000 248,400Laredo Petroleum, Inc. company guaranty sr. unsec. sub. notes 5.625%, 1/15/22 90,000 90,675MEG Energy Corp. 144A company guaranty sr. unsec. notes 7.00%, 3/31/24 (Canada) 115,000 98,613MEG Energy Corp. 144A company guaranty sr. unsec. notes 6.375%, 1/30/23 (Canada) 80,000 69,800MEG Energy Corp. 144A notes 6.50%, 1/15/25 (Canada) 80,000 78,100Motiva Enterprises, LLC 144A sr. unsec. notes 5.75%, 1/15/20 340,000 362,857MPLX LP sr. unsec. unsub. notes 4.125%, 3/1/27 380,000 386,907Murphy Oil Corp. sr. unsec. unsub. notes 5.75%, 8/15/25 180,000 185,382Murray Energy Corp. 144A notes 11.25%, 4/15/21 200,000 119,250Nabors Industries, Inc. company guaranty sr. unsec. unsub. notes 4.625%, 9/15/21 375,000 367,875Newfield Exploration Co. sr. unsec. unsub. notes 5.75%, 1/30/22 185,000 197,488Newfield Exploration Co. sr. unsec. unsub. notes 5.375%, 1/1/26 90,000 94,613Noble Holding International, Ltd. company guaranty sr. unsec. unsub. notes 7.75%, 1/15/24 275,000 244,063Oasis Petroleum, Inc. company guaranty sr. unsec. sub. notes 6.875%, 1/15/23 75,000 76,125Oasis Petroleum, Inc. company guaranty sr. unsec. unsub. notes 6.875%, 3/15/22 165,000 167,888Occidental Petroleum Corp. sr. unsec. unsub. bonds 4.40%, 4/15/46 490,000 520,770Pertamina Persero PT 144A sr. unsec. unsub. notes 4.30%, 5/20/23 (Indonesia) 400,000 419,866Petrobras Global Finance BV company guaranty sr. unsec. unsub. bonds 7.375%, 1/17/27 (Brazil) 720,000 792,720Petrobras Global Finance BV company guaranty sr. unsec. unsub. notes 8.75%, 5/23/26 (Brazil) 417,000 500,921Petrobras Global Finance BV company guaranty sr. unsec. unsub. notes 8.375%, 5/23/21 (Brazil) 307,000 355,084Petrobras Global Finance BV company guaranty sr. unsec. unsub. notes 6.25%, 3/17/24 (Brazil) 2,654,000 2,836,463Petrobras Global Finance BV company guaranty sr. unsec. unsub. notes 6.125%, 1/17/22 (Brazil) 65,000 69,875Petroleos de Venezuela SA 144A company guaranty sr. unsec. notes 6.00%, 11/15/26 (Venezuela) 515,000 156,303

Dynamic Asset Allocation Growth Fund 55
CORPORATE BONDS AND NOTES (11.4%)* cont.Principal
amount ValueEnergy cont.Petroleos Mexicanos company guaranty sr. unsec. unsub. bonds 5.625%, 1/23/46 (Mexico) $300,000 $279,000Petroleos Mexicanos company guaranty sr. unsec. unsub. notes 6.375%, 1/23/45 (Mexico) 250,000 254,375Petroleos Mexicanos company guaranty sr. unsec. unsub. notes 5.50%, 1/21/21 (Mexico) 1,125,000 1,201,445Petroleos Mexicanos company guaranty sr. unsec. unsub. notes 4.875%, 1/18/24 (Mexico) 250,000 259,250Petroleos Mexicanos company guaranty sr. unsec. unsub. notes 4.50%, 1/23/26 (Mexico) 1,141,000 1,139,060Precision Drilling Corp. company guaranty sr. unsec. notes 7.75%, 12/15/23 (Canada) 225,000 229,781Precision Drilling Corp. company guaranty sr. unsec. notes 5.25%, 11/15/24 (Canada) 10,000 9,200Range Resources Corp. 144A company guaranty sr. unsec. sub. notes 5.75%, 6/1/21 405,000 421,200Regency Energy Partners LP/Regency Energy Finance Corp. company guaranty sr. unsec. unsub. notes 4.50%, 11/1/23 72,000 75,451Rose Rock Midstream LP/Rose Rock Finance Corp. company guaranty sr. unsec. sub. notes 5.625%, 11/15/23 90,000 87,525Rose Rock Midstream LP/Rose Rock Finance Corp. company guaranty sr. unsec. sub. notes 5.625%, 7/15/22 50,000 48,875Sabine Pass Liquefaction, LLC sr. bonds 4.20%, 3/15/28 405,000 408,265Sabine Pass Liquefaction, LLC sr. notes 5.75%, 5/15/24 155,000 172,433Sabine Pass Liquefaction, LLC sr. notes 5.00%, 3/15/27 432,000 460,762SemGroup Corp. 144A company guaranty sr. unsec. notes 6.375%, 3/15/25 180,000 176,400SESI, LLC company guaranty sr. unsec. unsub. notes 7.125%, 12/15/21 100,000 102,000SESI, LLC 144A company guaranty sr. unsec. notes 7.75%, 9/15/24 100,000 103,500Seven Generations Energy, Ltd. 144A company guaranty sr. unsec. notes 5.375%, 9/30/25 (Canada) 180,000 181,350Seven Generations Energy, Ltd. 144A sr. unsec. bonds 6.75%, 5/1/23 (Canada) 105,000 110,775Seven Generations Energy, Ltd. 144A sr. unsec. sub. notes 8.25%, 5/15/20 (Canada) 180,000 188,100Seventy Seven Energy, Inc. escrow sr. unsec. notes 6.50%, 7/15/22 F 80,000 8Seventy Seven Operating, LLC escrow company guaranty sr. unsec. unsub. notes 6.625%, 11/15/19 F 179,000 18Shelf Drilling Holdings, Ltd. 144A company guaranty notes 9.50%, 11/2/20 200,000 202,250Shell International Finance BV company guaranty sr. unsec. unsub. notes 2.125%, 5/11/20 (Netherlands) 110,000 110,669SM Energy Co. sr. unsec. notes 6.50%, 11/15/21 188,000 189,880SM Energy Co. sr. unsec. sub. notes 5.00%, 1/15/24 105,000 98,963SM Energy Co. sr. unsec. unsub. notes 6.75%, 9/15/26 145,000 145,000SM Energy Co. sr. unsec. unsub. notes 6.50%, 1/1/23 48,000 48,360SM Energy Co. sr. unsec. unsub. notes 6.125%, 11/15/22 170,000 170,425Spectra Energy Partners LP sr. unsec. notes 3.375%, 10/15/26 455,000 451,446
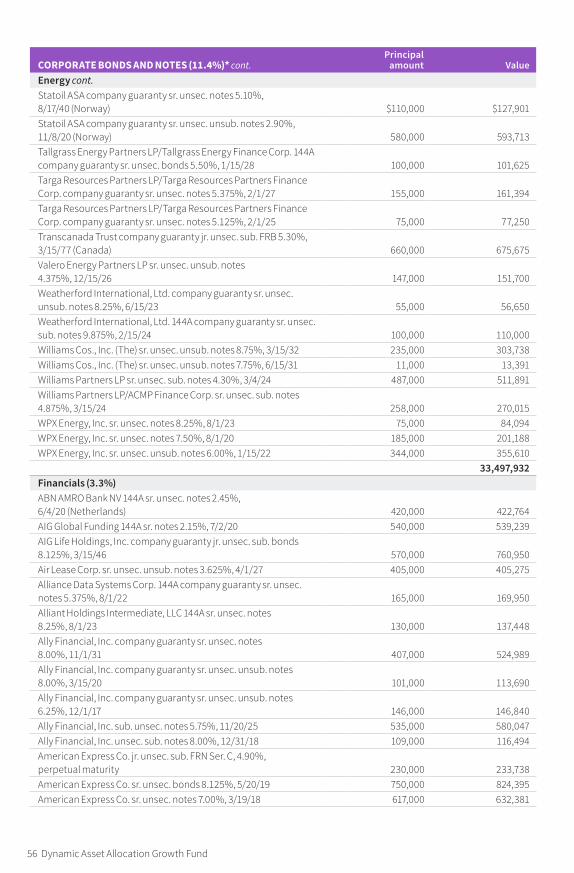
56 Dynamic Asset Allocation Growth Fund
CORPORATE BONDS AND NOTES (11.4%)* cont.Principal
amount ValueEnergy cont.Statoil ASA company guaranty sr. unsec. notes 5.10%, 8/17/40 (Norway) $110,000 $127,901Statoil ASA company guaranty sr. unsec. unsub. notes 2.90%, 11/8/20 (Norway) 580,000 593,713Tallgrass Energy Partners LP/Tallgrass Energy Finance Corp. 144A company guaranty sr. unsec. bonds 5.50%, 1/15/28 100,000 101,625Targa Resources Partners LP/Targa Resources Partners Finance Corp. company guaranty sr. unsec. notes 5.375%, 2/1/27 155,000 161,394Targa Resources Partners LP/Targa Resources Partners Finance Corp. company guaranty sr. unsec. notes 5.125%, 2/1/25 75,000 77,250Transcanada Trust company guaranty jr. unsec. sub. FRB 5.30%, 3/15/77 (Canada) 660,000 675,675Valero Energy Partners LP sr. unsec. unsub. notes 4.375%, 12/15/26 147,000 151,700Weatherford International, Ltd. company guaranty sr. unsec. unsub. notes 8.25%, 6/15/23 55,000 56,650Weatherford International, Ltd. 144A company guaranty sr. unsec. sub. notes 9.875%, 2/15/24 100,000 110,000Williams Cos., Inc. (The) sr. unsec. unsub. notes 8.75%, 3/15/32 235,000 303,738Williams Cos., Inc. (The) sr. unsec. unsub. notes 7.75%, 6/15/31 11,000 13,391Williams Partners LP sr. unsec. sub. notes 4.30%, 3/4/24 487,000 511,891Williams Partners LP/ACMP Finance Corp. sr. unsec. sub. notes 4.875%, 3/15/24 258,000 270,015WPX Energy, Inc. sr. unsec. notes 8.25%, 8/1/23 75,000 84,094WPX Energy, Inc. sr. unsec. notes 7.50%, 8/1/20 185,000 201,188WPX Energy, Inc. sr. unsec. unsub. notes 6.00%, 1/15/22 344,000 355,610
33,497,932Financials (3.3%)ABN AMRO Bank NV 144A sr. unsec. notes 2.45%, 6/4/20 (Netherlands) 420,000 422,764AIG Global Funding 144A sr. notes 2.15%, 7/2/20 540,000 539,239AIG Life Holdings, Inc. company guaranty jr. unsec. sub. bonds 8.125%, 3/15/46 570,000 760,950Air Lease Corp. sr. unsec. unsub. notes 3.625%, 4/1/27 405,000 405,275Alliance Data Systems Corp. 144A company guaranty sr. unsec. notes 5.375%, 8/1/22 165,000 169,950Alliant Holdings Intermediate, LLC 144A sr. unsec. notes 8.25%, 8/1/23 130,000 137,448Ally Financial, Inc. company guaranty sr. unsec. notes 8.00%, 11/1/31 407,000 524,989Ally Financial, Inc. company guaranty sr. unsec. unsub. notes 8.00%, 3/15/20 101,000 113,690Ally Financial, Inc. company guaranty sr. unsec. unsub. notes 6.25%, 12/1/17 146,000 146,840Ally Financial, Inc. sub. unsec. notes 5.75%, 11/20/25 535,000 580,047Ally Financial, Inc. unsec. sub. notes 8.00%, 12/31/18 109,000 116,494American Express Co. jr. unsec. sub. FRN Ser. C, 4.90%, perpetual maturity 230,000 233,738American Express Co. sr. unsec. bonds 8.125%, 5/20/19 750,000 824,395American Express Co. sr. unsec. notes 7.00%, 3/19/18 617,000 632,381

Dynamic Asset Allocation Growth Fund 57
CORPORATE BONDS AND NOTES (11.4%)* cont.Principal
amount ValueFinancials cont.American International Group, Inc. jr. unsec. sub. FRB 8.175%, 5/15/58 $387,000 $527,288ANZ New Zealand Int’l, Ltd./London 144A company guaranty sr. unsec. notes 2.875%, 1/25/22 (United Kingdom) 775,000 782,745Australia & New Zealand Banking Group, Ltd. sr. unsec. notes Ser. MTN, 2.125%, 8/19/20 (Australia) 900,000 894,529Australia & New Zealand Banking Group, Ltd./United Kingdom 144A jr. unsec. sub. FRB 6.75%, perpetual maturity (United Kingdom) 200,000 226,000AXA SA 144A jr. unsec. sub. FRN 6.463%, perpetual maturity (France) 425,000 435,094AXA SA 144A jr. unsec. sub. FRN 6.379%, perpetual maturity (France) 305,000 349,225Banco del Estado de Chile 144A sr. unsec. notes 2.00%, 11/9/17 (Chile) 185,000 184,539Bank of America Corp. jr. unsec. sub. FRN Ser. AA, 6.10%, perpetual maturity 465,000 508,594Bank of America Corp. jr. unsec. sub. FRN Ser. Z, 6.50%, perpetual maturity 75,000 84,797Bank of America Corp. sr. unsec. unsub. bonds Ser. MTN, 3.248%, 10/21/27 1,055,000 1,033,861Bank of America Corp. sr. unsec. unsub. notes 2.00%, 1/11/18 1,227,000 1,228,355Bank of America Corp. sr. unsec. unsub. notes Ser. MTN, 2.151%, 11/9/20 115,000 114,670Bank of America Corp. unsec. sub. notes 6.11%, 1/29/37 1,030,000 1,275,417Bank of Nova Scotia (The) sr. unsec. unsub. notes 2.70%, 3/7/22 (Canada) 685,000 692,643Bank of Nova Scotia (The) sr. unsec. unsub. notes 2.35%, 10/21/20 (Canada) 505,000 509,092Bank of Nova Scotia (The) sr. unsec. unsub. notes 1.375%, 12/18/17 (Canada) 885,000 884,903Banque Federative du Credit Mutuel SA 144A sr. unsec. unsub. notes 2.20%, 7/20/20 (France) 1,020,000 1,019,593Barclays PLC unsec. sub. bonds 4.836%, 5/9/28 (United Kingdom) 280,000 290,061Berkshire Hathaway Finance Corp. company guaranty sr. unsec. notes 4.30%, 5/15/43 90,000 98,184BGC Partners, Inc. sr. unsec. notes 5.125%, 5/27/21 215,000 225,514BPCE SA 144A unsec. sub. notes 5.15%, 7/21/24 (France) 325,000 350,321BPCE SA 144A unsec. sub. notes 4.50%, 3/15/25 (France) 970,000 1,002,393Camden Property Trust sr. unsec. unsub. notes 4.875%, 6/15/23 R 190,000 206,795Cantor Fitzgerald LP 144A unsec. bonds 7.875%, 10/15/19 170,000 186,358Cantor Fitzgerald LP 144A unsec. notes 6.50%, 6/17/22 610,000 686,820Capital One Financial Corp. unsec. sub. notes 4.20%, 10/29/25 190,000 195,245CBRE Services, Inc. company guaranty sr. unsec. notes 5.25%, 3/15/25 236,000 258,701CBRE Services, Inc. company guaranty sr. unsec. unsub. notes 5.00%, 3/15/23 137,000 141,952CBRE Services, Inc. company guaranty sr. unsec. unsub. notes 4.875%, 3/1/26 339,000 365,407CIT Group, Inc. sr. unsec. notes 3.875%, 2/19/19 62,000 63,163CIT Group, Inc. sr. unsec. sub. notes 5.00%, 8/1/23 87,000 93,851

58 Dynamic Asset Allocation Growth Fund
CORPORATE BONDS AND NOTES (11.4%)* cont.Principal
amount ValueFinancials cont.CIT Group, Inc. sr. unsec. unsub. notes 5.00%, 8/15/22 $342,000 $370,112CIT Group, Inc. 144A sr. unsec. notes 5.50%, 2/15/19 49,000 51,205Citigroup, Inc. jr. unsec. sub. FRB Ser. B, 5.90%, perpetual maturity 14,000 15,085Citigroup, Inc. jr. unsec. sub. FRB Ser. P, 5.95%, perpetual maturity 324,000 350,325Citigroup, Inc. jr. unsec. sub. FRN 5.875%, perpetual maturity 42,000 43,733Citigroup, Inc. jr. unsec. sub. FRN Ser. T, 6.25%, perpetual maturity 376,000 423,000Citigroup, Inc. sr. unsec. FRB 3.668%, 7/24/28 235,000 236,564Citigroup, Inc. sr. unsec. notes 2.65%, 10/26/20 835,000 843,582Citigroup, Inc. sr. unsec. unsub. FRB 3.887%, 1/10/28 1,510,000 1,550,152Citigroup, Inc. unsec. sub. bonds 4.75%, 5/18/46 240,000 261,260Citigroup, Inc. unsec. sub. notes 5.50%, 9/13/25 160,000 179,578Citizens Bank NA/Providence RI sr. unsec. notes 2.25%, 3/2/20 1,175,000 1,176,554CNO Financial Group, Inc. sr. unsec. unsub. notes 5.25%, 5/30/25 405,000 432,338Commerzbank AG 144A unsec. sub. notes 8.125%, 9/19/23 (Germany) 815,000 988,065Commonwealth Bank of Australia 144A sr. unsec. notes 3.15%, 9/19/27 (Australia) 580,000 574,712Commonwealth Bank of Australia 144A sr. unsec. notes 2.25%, 3/10/20 (Australia) 985,000 989,918Commonwealth Bank of Australia/New York, NY sr. unsec. bonds Ser. GMTN, 1.625%, 3/12/18 385,000 385,042Credit Acceptance Corp. company guaranty sr. unsec. notes 7.375%, 3/15/23 85,000 89,888Credit Acceptance Corp. company guaranty sr. unsec. notes 6.125%, 2/15/21 318,000 322,770Credit Suisse Group AG 144A jr. unsec. sub. FRN 6.25%, perpetual maturity (Switzerland) 490,000 522,463Credit Suisse Group AG 144A sr. unsec. bonds 4.282%, 1/9/28 (Switzerland) 795,000 828,085Danske Bank A/S 144A sr. unsec. notes 2.70%, 3/2/22 (Denmark) 730,000 733,997DFC Finance Corp. 144A company guaranty sr. notes 10.50%, 6/15/20 190,000 105,450Dresdner Funding Trust I 144A jr. unsec. sub. notes 8.151%, 6/30/31 100,000 128,262Duke Realty LP company guaranty sr. unsec. unsub. notes 4.375%, 6/15/22 R 16,000 17,096ESH Hospitality, Inc. 144A company guaranty sr. unsec. notes 5.25%, 5/1/25 R 235,000 242,931Fairfax US, Inc. 144A company guaranty sr. unsec. notes 4.875%, 8/13/24 385,000 397,403Fifth Third Bancorp jr. unsec. sub. FRB 5.10%, perpetual maturity 156,000 159,900Five Corners Funding Trust 144A sr. unsec. bonds 4.419%, 11/15/23 230,000 247,739GE Capital International Funding Co. Unlimited Co. company guaranty sr. unsec. bonds 4.418%, 11/15/35 (Ireland) 1,586,000 1,724,613GE Capital International Funding Co. Unlimited Co. company guaranty sr. unsec. notes 2.342%, 11/15/20 (Ireland) 1,235,000 1,241,939Goldman Sachs Group, Inc. (The) sr. unsec. notes 7.50%, 2/15/19 335,000 359,685Goldman Sachs Group, Inc. (The) sr. unsec. unsub. notes 3.85%, 1/26/27 1,285,000 1,312,839Goldman Sachs Group, Inc. (The) sr. unsec. unsub. notes 2.60%, 12/27/20 1,900,000 1,915,361
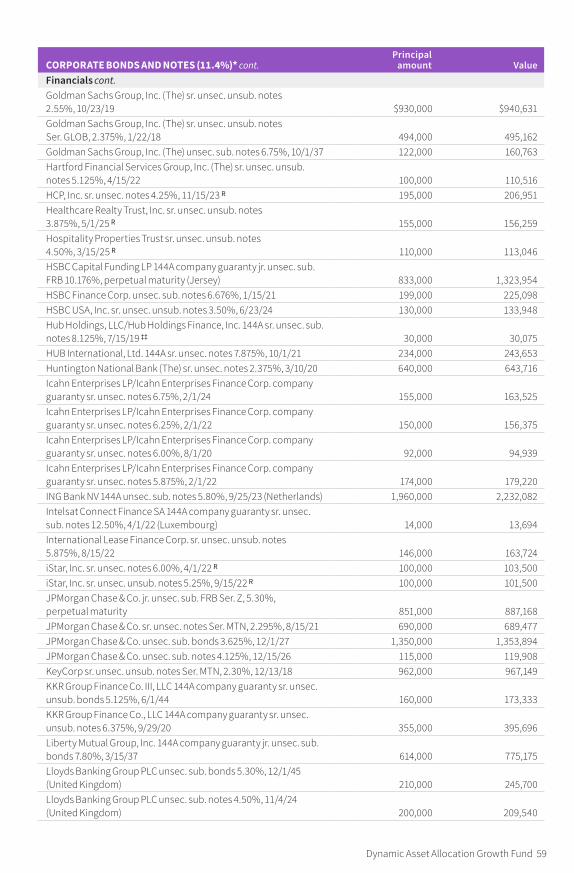
Dynamic Asset Allocation Growth Fund 59
CORPORATE BONDS AND NOTES (11.4%)* cont.Principal
amount ValueFinancials cont.Goldman Sachs Group, Inc. (The) sr. unsec. unsub. notes 2.55%, 10/23/19 $930,000 $940,631Goldman Sachs Group, Inc. (The) sr. unsec. unsub. notes Ser. GLOB, 2.375%, 1/22/18 494,000 495,162Goldman Sachs Group, Inc. (The) unsec. sub. notes 6.75%, 10/1/37 122,000 160,763Hartford Financial Services Group, Inc. (The) sr. unsec. unsub. notes 5.125%, 4/15/22 100,000 110,516HCP, Inc. sr. unsec. notes 4.25%, 11/15/23 R 195,000 206,951Healthcare Realty Trust, Inc. sr. unsec. unsub. notes 3.875%, 5/1/25 R 155,000 156,259Hospitality Properties Trust sr. unsec. unsub. notes 4.50%, 3/15/25 R 110,000 113,046HSBC Capital Funding LP 144A company guaranty jr. unsec. sub. FRB 10.176%, perpetual maturity (Jersey) 833,000 1,323,954HSBC Finance Corp. unsec. sub. notes 6.676%, 1/15/21 199,000 225,098HSBC USA, Inc. sr. unsec. unsub. notes 3.50%, 6/23/24 130,000 133,948Hub Holdings, LLC/Hub Holdings Finance, Inc. 144A sr. unsec. sub. notes 8.125%, 7/15/19 ‡‡ 30,000 30,075HUB International, Ltd. 144A sr. unsec. notes 7.875%, 10/1/21 234,000 243,653Huntington National Bank (The) sr. unsec. notes 2.375%, 3/10/20 640,000 643,716Icahn Enterprises LP/Icahn Enterprises Finance Corp. company guaranty sr. unsec. notes 6.75%, 2/1/24 155,000 163,525Icahn Enterprises LP/Icahn Enterprises Finance Corp. company guaranty sr. unsec. notes 6.25%, 2/1/22 150,000 156,375Icahn Enterprises LP/Icahn Enterprises Finance Corp. company guaranty sr. unsec. notes 6.00%, 8/1/20 92,000 94,939Icahn Enterprises LP/Icahn Enterprises Finance Corp. company guaranty sr. unsec. notes 5.875%, 2/1/22 174,000 179,220ING Bank NV 144A unsec. sub. notes 5.80%, 9/25/23 (Netherlands) 1,960,000 2,232,082Intelsat Connect Finance SA 144A company guaranty sr. unsec. sub. notes 12.50%, 4/1/22 (Luxembourg) 14,000 13,694International Lease Finance Corp. sr. unsec. unsub. notes 5.875%, 8/15/22 146,000 163,724iStar, Inc. sr. unsec. notes 6.00%, 4/1/22 R 100,000 103,500iStar, Inc. sr. unsec. unsub. notes 5.25%, 9/15/22 R 100,000 101,500JPMorgan Chase & Co. jr. unsec. sub. FRB Ser. Z, 5.30%, perpetual maturity 851,000 887,168JPMorgan Chase & Co. sr. unsec. notes Ser. MTN, 2.295%, 8/15/21 690,000 689,477JPMorgan Chase & Co. unsec. sub. bonds 3.625%, 12/1/27 1,350,000 1,353,894JPMorgan Chase & Co. unsec. sub. notes 4.125%, 12/15/26 115,000 119,908KeyCorp sr. unsec. unsub. notes Ser. MTN, 2.30%, 12/13/18 962,000 967,149KKR Group Finance Co. III, LLC 144A company guaranty sr. unsec. unsub. bonds 5.125%, 6/1/44 160,000 173,333KKR Group Finance Co., LLC 144A company guaranty sr. unsec. unsub. notes 6.375%, 9/29/20 355,000 395,696Liberty Mutual Group, Inc. 144A company guaranty jr. unsec. sub. bonds 7.80%, 3/15/37 614,000 775,175Lloyds Banking Group PLC unsec. sub. bonds 5.30%, 12/1/45 (United Kingdom) 210,000 245,700Lloyds Banking Group PLC unsec. sub. notes 4.50%, 11/4/24 (United Kingdom) 200,000 209,540

60 Dynamic Asset Allocation Growth Fund
CORPORATE BONDS AND NOTES (11.4%)* cont.Principal
amount ValueFinancials cont.Lloyds Banking Group PLC 144A jr. unsec. sub. FRN 6.657%, perpetual maturity (United Kingdom) $185,000 $211,825LPL Holdings, Inc. 144A company guaranty sr. unsec. notes 5.75%, 9/15/25 345,000 357,662Macquarie Bank, Ltd. 144A sr. unsec. notes 2.85%, 7/29/20 (Australia) 305,000 309,088Macquarie Group Ltd. 144A sr. unsec. notes 7.625%, 8/13/19 (Australia) 985,000 1,077,165Manufacturers & Traders Trust Co. sr. unsec. notes Ser. BKNT, 2.05%, 8/17/20 940,000 938,525MetLife, Inc. sr. unsec. unsub. notes 4.75%, 2/8/21 330,000 357,084Metropolitan Life Global Funding I 144A sr. notes 3.00%, 1/10/23 155,000 157,517Metropolitan Life Global Funding I 144A sr. notes 1.75%, 9/19/19 830,000 827,862MGM Growth Properties Operating Partnership LP/MGP Finance Co-Issuer, Inc. company guaranty sr. unsec. notes 5.625%, 5/1/24 R 100,000 108,358MGM Growth Properties Operating Partnership LP/MGP Finance Co-Issuer, Inc. 144A sr. unsec. bonds 4.50%, 1/15/28 R 90,000 90,792Mid-America Apartments LP sr. unsec. notes 4.30%, 10/15/23 R 385,000 408,114Mitsubishi UFJ Financial Group, Inc. sr. unsec. unsub. notes 3.85%, 3/1/26 (Japan) 255,000 265,287Morgan Stanley sr. unsec. unsub. notes 3.625%, 1/20/27 1,365,000 1,383,542Morgan Stanley sr. unsec. unsub. notes 2.65%, 1/27/20 860,000 869,857National Australia Bank, Ltd. 144A sr. unsec. FRN BBA LIBOR USD 3 Month + 0.69%, 2.007%, 12/9/19 (Australia) 725,000 730,693National Australia Bank, Ltd., NY sr. unsec. notes Ser. MTN, 2.125%, 5/22/20 (Australia) 1,180,000 1,178,806Nationstar Mortgage, LLC/Nationstar Capital Corp. company guaranty sr. unsec. unsub. notes 6.50%, 7/1/21 310,000 316,200Neuberger Berman Group, LLC/Neuberger Berman Finance Corp. 144A sr. unsec. notes 4.875%, 4/15/45 250,000 240,868Nordea Bank AB 144A sr. unsec. unsub. notes 2.25%, 5/27/21 (Sweden) 365,000 362,615OneMain Financial Holdings, LLC 144A company guaranty sr. unsec. sub. notes 6.75%, 12/15/19 125,000 129,688OneMain Financial Holdings, LLC 144A company guaranty sr. unsec. unsub. notes 7.25%, 12/15/21 120,000 125,250Peachtree Corners Funding Trust 144A company guaranty sr. unsec. unsub. bonds 3.976%, 2/15/25 515,000 524,510PNC Bank NA sr. unsec. notes Ser. BKNT, 2.00%, 5/19/20 570,000 568,918Primerica, Inc. sr. unsec. notes 4.75%, 7/15/22 234,000 253,656Protective Life Global Funding 144A notes 2.262%, 4/8/20 520,000 520,064Provident Funding Associates LP/PFG Finance Corp. 144A sr. unsec. notes 6.375%, 6/15/25 295,000 309,750Prudential Financial, Inc. jr. unsec. sub. FRN 8.875%, 6/15/38 160,000 167,680Prudential Financial, Inc. jr. unsec. sub. FRN 5.625%, 6/15/43 388,000 424,200Prudential Financial, Inc. jr. unsec. sub. FRN 5.20%, 3/15/44 144,000 152,942Realty Income Corp. sr. unsec. notes 4.65%, 8/1/23 R 75,000 81,536Regions Financial Corp. sr. unsec. unsub. notes 2.75%, 8/14/22 365,000 364,835Royal Bank of Canada sr. unsec. notes Ser. GMTN, 2.125%, 3/2/20 (Canada) 1,095,000 1,099,781

Dynamic Asset Allocation Growth Fund 61
CORPORATE BONDS AND NOTES (11.4%)* cont.Principal
amount ValueFinancials cont.Royal Bank of Canada sr. unsec. unsub. notes Ser. GMTN, 2.20%, 7/27/18 (Canada) $885,000 $889,561Royal Bank of Canada unsec. sub. notes Ser. GMTN, 4.65%, 1/27/26 (Canada) 285,000 305,147Royal Bank of Scotland Group PLC jr. unsec. sub. FRB 7.50%, perpetual maturity (United Kingdom) 205,000 214,686Royal Bank of Scotland Group PLC unsec. sub. notes 4.70%, 7/3/18 (United Kingdom) 515,000 524,079Santander Issuances SAU company guaranty unsec. sub. notes 5.179%, 11/19/25 (Spain) 400,000 429,374Santander UK Group Holdings PLC 144A unsec. sub. notes 4.75%, 9/15/25 (United Kingdom) 280,000 292,305Santander UK PLC 144A unsec. sub. notes 5.00%, 11/7/23 (United Kingdom) 355,000 382,618Sberbank of Russia Via SB Capital SA 144A sr. unsec. notes 6.125%, 2/7/22 (Russia) 220,000 240,350Select Income REIT sr. unsec. unsub. notes 3.60%, 2/1/20 R 35,000 35,509Select Income REIT sr. unsec. unsub. notes 2.85%, 2/1/18 R 35,000 35,080Skandinaviska Enskilda Banken AB sr. unsec. notes 2.30%, 3/11/20 (Sweden) 3,655,000 3,674,500Societe Generale SA company guaranty sr. unsec. notes 2.75%, 10/12/17 (France) 375,000 375,132Springleaf Finance Corp. company guaranty sr. unsec. unsub. notes 8.25%, 12/15/20 95,000 107,350Springleaf Finance Corp. sr. unsec. unsub. notes 5.25%, 12/15/19 90,000 93,690Svenska Handelsbanken AB company guaranty sr. unsec. notes 1.95%, 9/8/20 (Sweden) 1,060,000 1,056,268Swiss Re Treasury US Corp. 144A company guaranty sr. unsec. notes 4.25%, 12/6/42 255,000 260,786Tempo Acquisition, LLC/Tempo Acquisition Finance Corp. 144A sr. unsec. notes 6.75%, 6/1/25 330,000 333,300TMX Finance, LLC/TitleMax Finance Corp. 144A company guaranty sr. notes 8.50%, 9/15/18 56,000 51,800Toronto-Dominion Bank (The) unsec. sub. FRB 3.625%, 9/15/31 (Canada) 507,000 504,839UBS AG/London 144A sr. unsec. notes 2.20%, 6/8/20 (United Kingdom) 630,000 629,432UBS Group AG jr. unsec. sub. FRN 6.875%, perpetual maturity (Switzerland) 206,000 226,086UBS Group Funding Jersey, Ltd. 144A company guaranty sr. unsec. notes 4.125%, 4/15/26 (Switzerland) 508,000 532,908UBS Group Funding Jersey, Ltd. 144A company guaranty sr. unsec. notes 3.00%, 4/15/21 (Switzerland) 1,045,000 1,056,628USIS Merger Sub, Inc. 144A sr. unsec. notes 6.875%, 5/1/25 245,000 249,594VEREIT Operating Partnership LP company guaranty sr. unsec. notes 4.60%, 2/6/24 R 410,000 430,477VEREIT Operating Partnership LP company guaranty sr. unsec. unsub. bonds 4.875%, 6/1/26 R 85,000 91,269Vnesheconombank Via VEB Finance PLC 144A sr. unsec. unsub. notes 6.80%, 11/22/25 (Russia) 2,000,000 2,253,486Vnesheconombank Via VEB Finance PLC 144A sr. unsec. unsub. notes 5.942%, 11/21/23 (Russia) 300,000 322,005

62 Dynamic Asset Allocation Growth Fund
CORPORATE BONDS AND NOTES (11.4%)* cont.Principal
amount ValueFinancials cont.VTB Bank OJSC Via VTB Capital SA 144A sr. unsec. notes 6.875%, 5/29/18 (Russia) $1,816,000 $1,865,940VTB Bank OJSC Via VTB Capital SA 144A unsec. sub. bonds 6.95%, 10/17/22 (Russia) 400,000 433,000Wells Fargo & Co. jr. unsec. sub. FRB Ser. U, 5.875%, perpetual maturity 440,000 490,050Wells Fargo & Co. sr. unsec. notes Ser. GMTN, 2.60%, 7/22/20 1,225,000 1,242,195Westpac Banking Corp. sr. unsec. unsub. notes 4.875%, 11/19/19 (Australia) 220,000 232,829Westpac Banking Corp. sr. unsec. unsub. notes 2.15%, 3/6/20 (Australia) 2,530,000 2,538,653Westpac Banking Corp. sr. unsec. unsub. notes 2.00%, 8/19/21 (Australia) 245,000 241,320WP Carey, Inc. sr. unsec. unsub. notes 4.60%, 4/1/24 R 95,000 99,524
91,211,767Health care (0.7%)AbbVie, Inc. sr. unsec. notes 3.60%, 5/14/25 14,000 14,515AbbVie, Inc. sr. unsec. notes 2.90%, 11/6/22 240,000 243,092AbbVie, Inc. sr. unsec. notes 2.50%, 5/14/20 820,000 829,825Air Medical Merger Sub Corp. 144A sr. unsec. notes 6.375%, 5/15/23 480,000 463,800Allergan Funding SCS company guaranty sr. unsec. notes 4.75%, 3/15/45 (Luxembourg) 135,000 146,057Allergan Funding SCS company guaranty sr. unsec. notes 3.45%, 3/15/22 (Luxembourg) 121,000 125,467Allergan Funding SCS company guaranty sr. unsec. notes 2.35%, 3/12/18 (Luxembourg) 595,000 596,733AMAG Pharmaceuticals, Inc. 144A company guaranty sr. unsec. notes 7.875%, 9/1/23 190,000 192,375Amgen, Inc. sr. unsec. notes 3.45%, 10/1/20 345,000 357,794ASP AMC Merger Sub, Inc. 144A sr. unsec. notes 8.00%, 5/15/25 345,000 332,063AstraZeneca PLC sr. unsec. unsub. notes 6.45%, 9/15/37 (United Kingdom) 270,000 359,084Becton Dickinson and Co. sr. unsec. unsub. bonds 4.669%, 6/6/47 916,000 960,979Becton Dickinson and Co. sr. unsec. unsub. bonds 3.70%, 6/6/27 786,000 794,716Biogen, Inc. sr. unsec. sub. notes 3.625%, 9/15/22 465,000 488,751BioScrip, Inc. company guaranty sr. unsec. notes 8.875%, 2/15/21 140,000 128,100Centene Corp. sr. unsec. unsub. notes 6.125%, 2/15/24 245,000 264,906Centene Corp. sr. unsec. unsub. notes 4.75%, 1/15/25 65,000 67,438Centene Corp. sr. unsec. unsub. notes 4.75%, 5/15/22 180,000 187,875CHS/Community Health Systems, Inc. company guaranty sr. notes 6.25%, 3/31/23 125,000 122,813CHS/Community Health Systems, Inc. company guaranty sr. unsec. notes 6.875%, 2/1/22 594,000 466,290CHS/Community Health Systems, Inc. company guaranty sr. unsec. unsub. notes 8.00%, 11/15/19 65,000 63,294CHS/Community Health Systems, Inc. company guaranty sr. unsec. unsub. notes 7.125%, 7/15/20 145,000 130,863Cigna Corp. sr. unsec. unsub. notes 4.50%, 3/15/21 235,000 250,364Concordia International Corp. 144A company guaranty sr. unsec. notes 7.00%, 4/15/23 (Canada) 180,000 30,600

Dynamic Asset Allocation Growth Fund 63
CORPORATE BONDS AND NOTES (11.4%)* cont.Principal
amount ValueHealth care cont.Concordia International Corp. 144A sr. notes 9.00%, 4/1/22 (Canada) $45,000 $34,988Endo DAC/Endo Finance, LLC/Endo Finco, Inc. 144A company guaranty sr. unsec. notes 6.00%, 2/1/25 (Ireland) 310,000 251,100Endo DAC/Endo Finance, LLC/Endo Finco, Inc. 144A company guaranty sr. unsec. unsub. notes 6.00%, 7/15/23 (Ireland) 285,000 235,125Endo Finance, LLC/Endo Finco, Inc. 144A company guaranty sr. unsec. unsub. notes 5.375%, 1/15/23 120,000 97,800Halyard Health, Inc. company guaranty sr. unsec. unsub. notes 6.25%, 10/15/22 60,000 62,625HCA, Inc. company guaranty sr. bonds 5.25%, 6/15/26 370,000 398,675HCA, Inc. company guaranty sr. notes 6.50%, 2/15/20 502,000 546,553HCA, Inc. company guaranty sr. sub. bonds 5.50%, 6/15/47 690,000 715,013HCA, Inc. company guaranty sr. sub. notes 5.00%, 3/15/24 260,000 276,900HCA, Inc. company guaranty sr. sub. notes 3.75%, 3/15/19 244,000 248,880HCA, Inc. company guaranty sr. unsec. unsub. notes 7.50%, 2/15/22 48,000 55,080Jaguar Holding Co. II/Pharmaceutical Product Development, LLC 144A company guaranty sr. unsec. notes 6.375%, 8/1/23 180,000 188,325Johnson & Johnson sr. unsec. notes 5.15%, 7/15/18 554,000 569,622Kinetic Concepts, Inc./KCI USA, Inc. 144A company guaranty sub. notes 12.50%, 11/1/21 130,000 144,625Mallinckrodt International Finance SA/Mallinckrodt CB, LLC 144A company guaranty sr. unsec. unsub. notes 5.50%, 4/15/25 (Luxembourg) 125,000 112,813Merck & Co., Inc. sr. unsec. unsub. notes 1.30%, 5/18/18 763,000 762,568Molina Healthcare, Inc. company guaranty sr. unsec. notes 5.375%, 11/15/22 140,000 144,284Molina Healthcare, Inc. 144A company guaranty sr. unsec. notes 4.875%, 6/15/25 55,000 54,175Omega Healthcare Investors, Inc. company guaranty sr. unsec. notes 4.50%, 4/1/27 R 530,000 529,337Omega Healthcare Investors, Inc. company guaranty sr. unsec. unsub. notes 4.95%, 4/1/24 R 359,000 376,337Ortho-Clinical Diagnostics, Inc./Ortho-Clinical Diagnostics SA 144A sr. unsec. notes 6.625%, 5/15/22 227,000 222,460Pfizer, Inc. sr. unsec. unsub. notes 1.70%, 12/15/19 1,075,000 1,074,428Roche Holdings, Inc. 144A company guaranty sr. unsec. bonds 4.00%, 11/28/44 (Switzerland) 550,000 573,769Service Corp. International/US sr. unsec. notes 5.375%, 1/15/22 168,000 172,620Service Corp. International/US sr. unsec. unsub. notes 5.375%, 5/15/24 445,000 472,813Shire Acquisitions Investments Ireland DAC company guaranty sr. unsec. unsub. notes 3.20%, 9/23/26 (Ireland) 435,000 428,927Shire Acquisitions Investments Ireland DAC company guaranty sr. unsec. unsub. notes 2.875%, 9/23/23 (Ireland) 305,000 303,102Sterigenics-Nordion Holdings, LLC 144A sr. unsec. notes 6.50%, 5/15/23 105,000 109,200Tenet Healthcare Corp. company guaranty sr. notes 4.75%, 6/1/20 31,000 32,014Tenet Healthcare Corp. company guaranty sr. sub. notes 6.00%, 10/1/20 174,000 185,434

64 Dynamic Asset Allocation Growth Fund
CORPORATE BONDS AND NOTES (11.4%)* cont.Principal
amount ValueHealth care cont.Tenet Healthcare Corp. sr. unsec. notes 8.125%, 4/1/22 $145,000 $147,538Teva Pharmaceutical Finance Netherlands III BV company guaranty sr. unsec. unsub. bonds 3.15%, 10/1/26 (Netherlands) 259,000 238,719UnitedHealth Group, Inc. sr. unsec. notes 6.00%, 2/15/18 396,000 402,392UnitedHealth Group, Inc. sr. unsec. unsub. notes 4.70%, 2/15/21 310,000 332,632UnitedHealth Group, Inc. sr. unsec. unsub. notes 4.625%, 11/15/41 55,000 61,335UnitedHealth Group, Inc. sr. unsec. unsub. notes 3.95%, 10/15/42 245,000 252,229UnitedHealth Group, Inc. sr. unsec. unsub. notes 2.75%, 2/15/23 245,000 247,098Valeant Pharmaceuticals International, Inc. 144A company guaranty sr. unsec. notes 6.125%, 4/15/25 340,000 297,925Valeant Pharmaceuticals International, Inc. 144A company guaranty sr. unsec. notes 5.875%, 5/15/23 363,000 320,801Valeant Pharmaceuticals International, Inc. 144A company guaranty sr. unsec. notes 5.625%, 12/1/21 14,000 13,090Valeant Pharmaceuticals International, Inc. 144A company guaranty sr. unsec. notes 5.50%, 3/1/23 85,000 74,588Valeant Pharmaceuticals International, Inc. 144A company guaranty sr. unsec. notes 5.375%, 3/15/20 200,000 199,750Valeant Pharmaceuticals International, Inc. 144A company guaranty sr. unsub. notes 7.00%, 3/15/24 270,000 288,249Valeant Pharmaceuticals International, Inc. 144A company guaranty sr. unsub. notes 6.50%, 3/15/22 90,000 95,175WellCare Health Plans, Inc. sr. unsec. notes 5.25%, 4/1/25 130,000 136,825
20,105,732Technology (0.7%)Apple, Inc. sr. unsec. bonds 4.25%, 2/9/47 655,000 704,518Apple, Inc. sr. unsec. notes 3.45%, 5/6/24 150,000 157,244Apple, Inc. sr. unsec. notes 2.10%, 5/6/19 2,325,000 2,342,133Apple, Inc. sr. unsec. unsub. notes 4.375%, 5/13/45 262,000 284,699Apple, Inc. sr. unsec. unsub. notes 3.85%, 5/4/43 314,000 316,822Apple, Inc. sr. unsec. unsub. notes 2.00%, 5/6/20 652,000 655,348Avaya, Inc. 144A company guaranty sr. notes 7.00%, 4/1/19 (In default) † 305,000 257,725Broadcom Corp./Broadcom Cayman Finance, Ltd. 144A company guaranty sr. unsec. unsub. notes 3.875%, 1/15/27 785,000 808,527Diamond 1 Finance Corp./Diamond 2 Finance Corp. 144A company guaranty sr. unsec. notes 7.125%, 6/15/24 1,272,000 1,405,338Diamond 1 Finance Corp./Diamond 2 Finance Corp. 144A sr. bonds 8.35%, 7/15/46 187,000 240,170Diamond 1 Finance Corp./Diamond 2 Finance Corp. 144A sr. notes 5.45%, 6/15/23 1,151,000 1,259,654Diamond 1 Finance Corp./Diamond 2 Finance Corp. 144A sr. unsec. notes 5.875%, 6/15/21 45,000 47,044Fidelity National Information Services, Inc. sr. unsec. unsub. notes 5.00%, 10/15/25 48,000 53,469First Data Corp. 144A company guaranty sr. unsec. unsub. notes 7.00%, 12/1/23 385,000 411,103First Data Corp. 144A notes 5.75%, 1/15/24 225,000 235,406First Data Corp. 144A sr. notes 5.375%, 8/15/23 180,000 188,280IBM Corp. sr. unsec. unsub. notes 1.875%, 8/1/22 390,000 382,327

Dynamic Asset Allocation Growth Fund 65
CORPORATE BONDS AND NOTES (11.4%)* cont.Principal
amount ValueTechnology cont.Inception Merger Sub, Inc./Rackspace Hosting, Inc. 144A sr. unsec. notes 8.625%, 11/15/24 $580,000 $618,918Infor Software Parent, LLC/Infor Software Parent, Inc. 144A company guaranty sr. unsec. notes 7.125%, 5/1/21 ‡‡ 525,000 534,345Infor US, Inc. company guaranty sr. unsec. notes 6.50%, 5/15/22 365,000 378,458Infor US, Inc. 144A company guaranty sr. notes 5.75%, 8/15/20 65,000 66,869Intel Corp. sr. unsec. unsub. notes 1.35%, 12/15/17 890,000 890,125Iron Mountain, Inc. 144A company guaranty sr. unsec. notes 4.875%, 9/15/27 R 410,000 418,200Jabil Circuit, Inc. sr. unsec. sub. notes 8.25%, 3/15/18 84,000 86,054Micron Technology, Inc. 144A sr. unsec. unsub. notes 5.25%, 1/15/24 155,000 163,138Microsoft Corp. sr. unsec. unsub. bonds 3.30%, 2/6/27 575,000 595,357Microsoft Corp. sr. unsec. unsub. bonds 2.40%, 8/8/26 355,000 343,129Microsoft Corp. sr. unsec. unsub. notes 5.30%, 2/8/41 60,000 75,086Microsoft Corp. sr. unsec. unsub. notes 4.20%, 6/1/19 250,000 260,530Microsoft Corp. sr. unsec. unsub. notes 1.55%, 8/8/21 1,650,000 1,620,864Oracle Corp. sr. unsec. unsub. notes 2.65%, 7/15/26 550,000 540,248Oracle Corp. sr. unsec. unsub. notes 2.50%, 10/15/22 355,000 357,046Oracle Corp. sr. unsec. unsub. notes 2.25%, 10/8/19 1,875,000 1,898,249Plantronics, Inc. 144A company guaranty sr. unsec. notes 5.50%, 5/31/23 200,000 207,500Solera, LLC /Solera Finance, Inc. 144A sr. unsec. notes 10.50%, 3/1/24 130,000 147,999TTM Technologies, Inc. 144A company guaranty sr. unsec. notes 5.625%, 10/1/25 305,000 308,622VMware, Inc. sr. unsec. notes 3.90%, 8/21/27 125,000 126,361
19,386,905Transportation (—%)Burlington Northern Santa Fe, LLC sr. unsec. notes 5.40%, 6/1/41 105,000 127,080Burlington Northern Santa Fe, LLC sr. unsec. unsub. notes 5.75%, 5/1/40 95,000 120,642CSX Corp. sr. unsec. unsub. notes 4.10%, 3/15/44 240,000 239,998Delta Air Lines, Inc. sr. notes Ser. A, 7.75%, 12/17/19 76,960 84,463FedEx Corp. company guaranty sr. unsec. unsub. notes 2.625%, 8/1/22 45,000 45,422Penske Truck Leasing Co. LP/PTL Finance Corp. 144A sr. unsec. bonds 3.40%, 11/15/26 113,000 111,623United Airlines, Inc. Pass-Through Trust pass-through certificates Ser. 14-2, Class A, 3.75%, 9/3/26 146,074 151,389Watco Cos., LLC/Watco Finance Corp. 144A company guaranty sr. unsec. notes 6.375%, 4/1/23 386,000 400,475
1,281,092Utilities and power (0.5%)AES Corp./Virginia (The) sr. unsec. notes 5.50%, 4/15/25 435,000 457,294AES Corp./Virginia (The) sr. unsec. notes 4.875%, 5/15/23 59,000 60,623AES Corp./Virginia (The) sr. unsec. unsub. bonds 5.125%, 9/1/27 470,000 481,750AES Corp./Virginia (The) sr. unsec. unsub. notes 7.375%, 7/1/21 227,000 258,780American Transmission Systems, Inc. 144A sr. unsec. unsub. bonds 5.00%, 9/1/44 465,000 524,998

66 Dynamic Asset Allocation Growth Fund
CORPORATE BONDS AND NOTES (11.4%)* cont.Principal
amount ValueUtilities and power cont.Arizona Public Services Co. sr. unsec. notes 4.50%, 4/1/42 $35,000 $38,330Berkshire Hathaway Energy Co. sr. unsec. unsub. bonds 6.125%, 4/1/36 7,000 8,985Boardwalk Pipelines LP company guaranty sr. unsec. unsub. 4.45%, 7/15/27 185,000 188,365Calpine Corp. sr. unsec. sub. notes 5.75%, 1/15/25 240,000 226,500Calpine Corp. 144A company guaranty sr. notes 5.25%, 6/1/26 145,000 144,275Calpine Corp. 144A company guaranty sr. sub. notes 5.875%, 1/15/24 34,000 35,148Colorado Interstate Gas Co., LLC company guaranty sr. unsec. notes 6.85%, 6/15/37 30,000 33,127Consolidated Edison Co. of New York, Inc. sr. unsec. notes 7.125%, 12/1/18 624,000 661,419Consolidated Edison Co. of New York, Inc. sr. unsec. unsub. notes 4.20%, 3/15/42 130,000 137,944Consolidated Edison, Inc. sr. unsec. unsub. notes Ser. A, 2.00%, 3/15/20 390,000 390,406Dynegy, Inc. company guaranty sr. unsec. notes 7.375%, 11/1/22 180,000 187,425Dynegy, Inc. company guaranty sr. unsec. unsub. notes 7.625%, 11/1/24 65,000 67,356Dynegy, Inc. 144A company guaranty sr. unsec. notes 8.125%, 1/30/26 265,000 273,613Dynegy, Inc. 144A company guaranty sr. unsec. notes 8.00%, 1/15/25 75,000 77,625EDP Finance BV 144A sr. unsec. unsub. notes 5.25%, 1/14/21 (Netherlands) 515,000 556,053El Paso Natural Gas Co., LLC company guaranty sr. unsec. unsub. notes 8.375%, 6/15/32 5,000 6,426Electricite de France (EDF) 144A sr. unsec. notes 6.50%, 1/26/19 (France) 165,000 174,805Emera US Finance LP company guaranty sr. unsec. notes 3.55%, 6/15/26 303,000 305,040Enbridge, Inc. sr. unsec. unsub. bonds 4.25%, 12/1/26 (Canada) 505,000 531,116Energy Transfer Equity LP sr. sub. notes 5.875%, 1/15/24 1,143,000 1,227,296Energy Transfer Partners LP sr. unsec. unsub. bonds 6.125%, 12/15/45 155,000 170,228Energy Transfer Partners LP sr. unsec. unsub. bonds 4.20%, 4/15/27 795,000 804,937Energy Transfer Partners LP sr. unsec. unsub. notes 6.50%, 2/1/42 85,000 96,508Energy Transfer Partners LP sr. unsec. unsub. notes 5.20%, 2/1/22 75,000 81,116FirstEnergy Corp. sr. unsec. unsub. notes 4.25%, 3/15/23 531,000 561,778GenOn Americas Generation, LLC sr. unsec. notes 8.50%, 10/1/21 (In default) † 220,000 201,850GenOn Energy, Inc. sr. unsec. sub. notes 9.875%, 10/15/20 (In default) † 143,000 104,033IPALCO Enterprises, Inc. 144A sr. notes 3.70%, 9/1/24 240,000 240,588Kinder Morgan Energy Partners LP company guaranty sr. unsec. notes 5.40%, 9/1/44 255,000 265,103Kinder Morgan Energy Partners LP company guaranty sr. unsec. notes 3.50%, 3/1/21 270,000 276,373
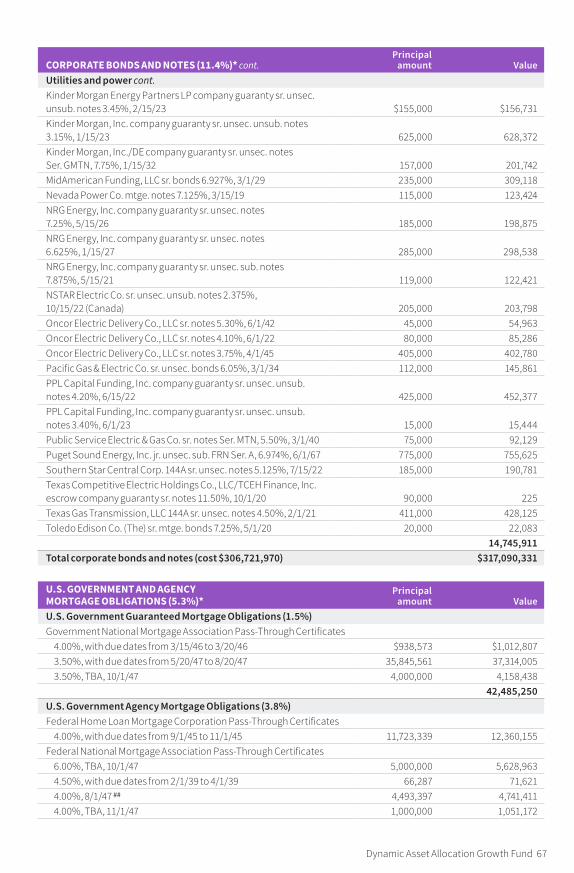
Dynamic Asset Allocation Growth Fund 67
CORPORATE BONDS AND NOTES (11.4%)* cont.Principal
amount ValueUtilities and power cont.Kinder Morgan Energy Partners LP company guaranty sr. unsec. unsub. notes 3.45%, 2/15/23 $155,000 $156,731Kinder Morgan, Inc. company guaranty sr. unsec. unsub. notes 3.15%, 1/15/23 625,000 628,372Kinder Morgan, Inc./DE company guaranty sr. unsec. notes Ser. GMTN, 7.75%, 1/15/32 157,000 201,742MidAmerican Funding, LLC sr. bonds 6.927%, 3/1/29 235,000 309,118Nevada Power Co. mtge. notes 7.125%, 3/15/19 115,000 123,424NRG Energy, Inc. company guaranty sr. unsec. notes 7.25%, 5/15/26 185,000 198,875NRG Energy, Inc. company guaranty sr. unsec. notes 6.625%, 1/15/27 285,000 298,538NRG Energy, Inc. company guaranty sr. unsec. sub. notes 7.875%, 5/15/21 119,000 122,421NSTAR Electric Co. sr. unsec. unsub. notes 2.375%, 10/15/22 (Canada) 205,000 203,798Oncor Electric Delivery Co., LLC sr. notes 5.30%, 6/1/42 45,000 54,963Oncor Electric Delivery Co., LLC sr. notes 4.10%, 6/1/22 80,000 85,286Oncor Electric Delivery Co., LLC sr. notes 3.75%, 4/1/45 405,000 402,780Pacific Gas & Electric Co. sr. unsec. bonds 6.05%, 3/1/34 112,000 145,861PPL Capital Funding, Inc. company guaranty sr. unsec. unsub. notes 4.20%, 6/15/22 425,000 452,377PPL Capital Funding, Inc. company guaranty sr. unsec. unsub. notes 3.40%, 6/1/23 15,000 15,444Public Service Electric & Gas Co. sr. notes Ser. MTN, 5.50%, 3/1/40 75,000 92,129Puget Sound Energy, Inc. jr. unsec. sub. FRN Ser. A, 6.974%, 6/1/67 775,000 755,625Southern Star Central Corp. 144A sr. unsec. notes 5.125%, 7/15/22 185,000 190,781Texas Competitive Electric Holdings Co., LLC/TCEH Finance, Inc. escrow company guaranty sr. notes 11.50%, 10/1/20 90,000 225Texas Gas Transmission, LLC 144A sr. unsec. notes 4.50%, 2/1/21 411,000 428,125Toledo Edison Co. (The) sr. mtge. bonds 7.25%, 5/1/20 20,000 22,083
14,745,911Total corporate bonds and notes (cost $306,721,970) $317,090,331
U.S. GOVERNMENT AND AGENCY MORTGAGE OBLIGATIONS (5.3%)*
Principal amount Value
U.S. Government Guaranteed Mortgage Obligations (1.5%)Government National Mortgage Association Pass-Through Certificates
4.00%, with due dates from 3/15/46 to 3/20/46 $938,573 $1,012,8073.50%, with due dates from 5/20/47 to 8/20/47 35,845,561 37,314,0053.50%, TBA, 10/1/47 4,000,000 4,158,438
42,485,250U.S. Government Agency Mortgage Obligations (3.8%)Federal Home Loan Mortgage Corporation Pass-Through Certificates
4.00%, with due dates from 9/1/45 to 11/1/45 11,723,339 12,360,155Federal National Mortgage Association Pass-Through Certificates
6.00%, TBA, 10/1/47 5,000,000 5,628,9634.50%, with due dates from 2/1/39 to 4/1/39 66,287 71,6214.00%, 8/1/47 ## 4,493,397 4,741,4114.00%, TBA, 11/1/47 1,000,000 1,051,172
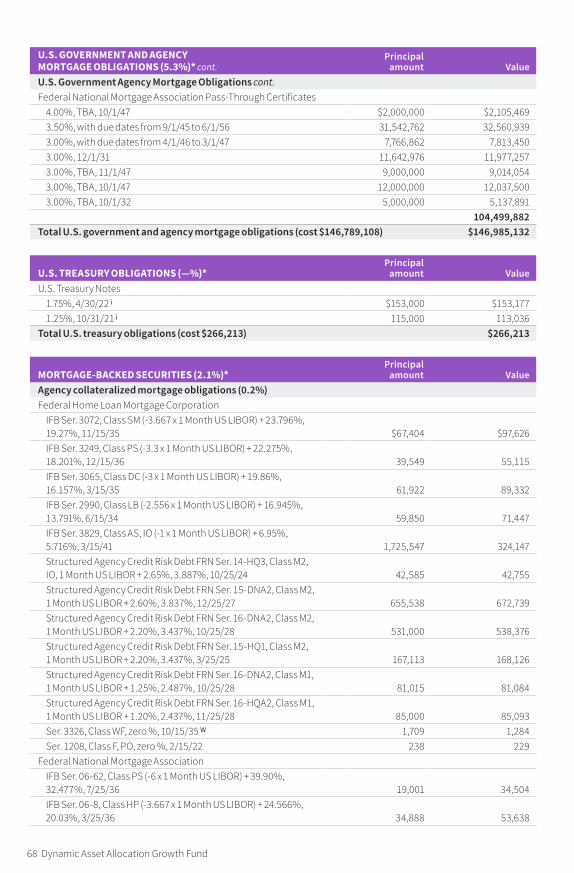
68 Dynamic Asset Allocation Growth Fund
U.S. GOVERNMENT AND AGENCY MORTGAGE OBLIGATIONS (5.3%)* cont.
Principal amount Value
U.S. Government Agency Mortgage Obligations cont.Federal National Mortgage Association Pass-Through Certificates
4.00%, TBA, 10/1/47 $2,000,000 $2,105,4693.50%, with due dates from 9/1/45 to 6/1/56 31,542,762 32,560,9393.00%, with due dates from 4/1/46 to 3/1/47 7,766,862 7,813,4503.00%, 12/1/31 11,642,976 11,977,2573.00%, TBA, 11/1/47 9,000,000 9,014,0543.00%, TBA, 10/1/47 12,000,000 12,037,5003.00%, TBA, 10/1/32 5,000,000 5,137,891
104,499,882Total U.S. government and agency mortgage obligations (cost $146,789,108) $146,985,132
U.S. TREASURY OBLIGATIONS (—%)*Principal
amount ValueU.S. Treasury Notes
1.75%, 4/30/22 i $153,000 $153,1771.25%, 10/31/21 i 115,000 113,036
Total U.S. treasury obligations (cost $266,213) $266,213
MORTGAGE‑BACKED SECURITIES (2.1%)*Principal
amount ValueAgency collateralized mortgage obligations (0.2%)Federal Home Loan Mortgage Corporation
IFB Ser. 3072, Class SM (-3.667 x 1 Month US LIBOR) + 23.796%, 19.27%, 11/15/35 $67,404 $97,626IFB Ser. 3249, Class PS (-3.3 x 1 Month US LIBOR) + 22.275%, 18.201%, 12/15/36 39,549 55,115IFB Ser. 3065, Class DC (-3 x 1 Month US LIBOR) + 19.86%, 16.157%, 3/15/35 61,922 89,332IFB Ser. 2990, Class LB (-2.556 x 1 Month US LIBOR) + 16.945%, 13.791%, 6/15/34 59,850 71,447IFB Ser. 3829, Class AS, IO (-1 x 1 Month US LIBOR) + 6.95%, 5.716%, 3/15/41 1,725,547 324,147Structured Agency Credit Risk Debt FRN Ser. 14-HQ3, Class M2, IO, 1 Month US LIBOR + 2.65%, 3.887%, 10/25/24 42,585 42,755Structured Agency Credit Risk Debt FRN Ser. 15-DNA2, Class M2, 1 Month US LIBOR + 2.60%, 3.837%, 12/25/27 655,538 672,739Structured Agency Credit Risk Debt FRN Ser. 16-DNA2, Class M2, 1 Month US LIBOR + 2.20%, 3.437%, 10/25/28 531,000 538,376Structured Agency Credit Risk Debt FRN Ser. 15-HQ1, Class M2, 1 Month US LIBOR + 2.20%, 3.437%, 3/25/25 167,113 168,126Structured Agency Credit Risk Debt FRN Ser. 16-DNA2, Class M1, 1 Month US LIBOR + 1.25%, 2.487%, 10/25/28 81,015 81,084Structured Agency Credit Risk Debt FRN Ser. 16-HQA2, Class M1, 1 Month US LIBOR + 1.20%, 2.437%, 11/25/28 85,000 85,093Ser. 3326, Class WF, zero %, 10/15/35 W 1,709 1,284Ser. 1208, Class F, PO, zero %, 2/15/22 238 229
Federal National Mortgage AssociationIFB Ser. 06-62, Class PS (-6 x 1 Month US LIBOR) + 39.90%, 32.477%, 7/25/36 19,001 34,504IFB Ser. 06-8, Class HP (-3.667 x 1 Month US LIBOR) + 24.566%, 20.03%, 3/25/36 34,888 53,638

Dynamic Asset Allocation Growth Fund 69
MORTGAGE‑BACKED SECURITIES (2.1%)* cont.Principal
amount ValueAgency collateralized mortgage obligations cont.Federal National Mortgage Association
IFB Ser. 07-53, Class SP (-3.667 x 1 Month US LIBOR) + 24.20%, 19.664%, 6/25/37 $58,512 $85,936IFB Ser. 05-75, Class GS (-3 x 1 Month US LIBOR) + 20.25%, 16.538%, 8/25/35 42,378 55,026IFB Ser. 12-58, Class SM, IO (-1 x 1 Month US LIBOR) + 6.50%, 5.263%, 6/25/42 2,098,116 353,460Connecticut Avenue Securities FRB Ser. 16-C05, Class 2M1, 1 Month US LIBOR + 1.35%, 2.587%, 1/25/29 175,700 176,614Connecticut Avenue Securities FRB Ser. 14-C03, Class 2M1, 1 Month US LIBOR + 1.20%, 2.437%, 7/25/24 4,564 4,566FRB Ser. 01-50, Class B1, IO, 0.403%, 10/25/41 W 581,745 6,908FRB Ser. 02-W8, Class 1, IO, 0.302%, 6/25/42 W 395,106 4,692Ser. 01-79, Class BI, IO, 0.293%, 3/25/45 W 256,292 2,313Ser. 03-34, Class P1, PO, zero %, 4/25/43 13,498 11,232
Government National Mortgage AssociationSer. 10-9, Class UI, IO, 5.00%, 1/20/40 624,603 137,614IFB Ser. 13-99, Class AS, IO (-1 x 1 Month US LIBOR) + 6.05%, 4.814%, 6/20/43 1,538,428 286,192Ser. 11-18, Class PI, IO, 4.50%, 8/20/40 22,255 2,831Ser. 10-9, Class QI, IO, 4.50%, 1/20/40 132,958 25,298Ser. 10-103, Class DI, IO, 4.50%, 12/20/38 97,334 4,090Ser. 16-123, Class LI, IO, 3.50%, 3/20/44 3,500,926 485,502Ser. 12-141, Class WI, IO, 3.50%, 11/20/41 1,962,757 214,058Ser. 15-124, Class NI, IO, 3.50%, 6/20/39 3,194,913 303,488Ser. 15-H25, Class BI, IO, 1.911%, 10/20/65 W 5,474,833 577,595Ser. 15-H26, Class EI, IO, 1.711%, 10/20/65 W 2,925,382 269,720Ser. 15-H24, Class BI, IO, 1.591%, 8/20/65 W 6,127,357 358,450
5,681,080Commercial mortgage-backed securities (1.2%)Banc of America Commercial Mortgage Trust FRB Ser. 07-1, Class XW, IO, 0.412%, 1/15/49 W 261,294 1,054Banc of America Commercial Mortgage Trust 144A FRB Ser. 07-5, Class XW, IO, 0.252%, 2/10/51 W 1,732,053 103Banc of America Merrill Lynch Commercial Mortgage, Inc. 144A
FRB Ser. 04-5, Class XC, IO, 0.568%, 11/10/41 W 100,171 828FRB Ser. 04-4, Class XC, IO, 0.054%, 7/10/42 W 47,842 18FRB Ser. 05-1, Class XW, IO, zero %, 11/10/42 W 895,018 1
Bear Stearns Commercial Mortgage Securities Trust FRB Ser. 04-PR3I, Class X1, IO, 0.208%, 2/11/41 W 5,859 9Bear Stearns Commercial Mortgage Securities Trust 144A
FRB Ser. 06-PW11, Class B, 5.286%, 3/11/39 W 313,501 245,048FRB Ser. 06-PW11, Class C, 5.286%, 3/11/39 (In default) † W 261,000 106,013FRB Ser. 06-PW14, Class X1, IO, 0.525%, 12/11/38 W 607,155 14,183
Capmark Mortgage Securities, Inc. FRB Ser. 97-C1, Class X, IO, 1.607%, 7/15/29 W 46,836 954CD Commercial Mortgage Trust 144A FRB Ser. 07-CD4, Class XW, IO, 0.742%, 12/11/49 W 72,254 7

70 Dynamic Asset Allocation Growth Fund
MORTGAGE‑BACKED SECURITIES (2.1%)* cont.Principal
amount ValueCommercial mortgage-backed securities cont.CFCRE Commercial Mortgage Trust 144A
FRB Ser. 11-C1, Class E, 6.281%, 4/15/44 W $231,776 $114,917FRB Ser. 11-C2, Class E, 5.945%, 12/15/47 W 562,000 567,244
Citigroup Commercial Mortgage TrustSer. 14-GC21, Class AS, 4.026%, 5/10/47 243,000 252,280FRB Ser. 14-GC21, Class XA, IO, 1.41%, 5/10/47 W 5,175,892 365,948FRB Ser. 14-GC19, Class XA, IO, 1.371%, 3/10/47 W 7,170,030 453,433
Citigroup Commercial Mortgage Trust 144AFRB Ser. 12-GC8, Class XA, IO, 1.979%, 9/10/45 W 5,040,769 383,855FRB Ser. 06-C5, Class XC, IO, 0.62%, 10/15/49 W 5,646,967 1,129
COBALT CMBS Commercial Mortgage Trust FRB Ser. 07-C3, Class AJ, 6.049%, 5/15/46 W 357,476 362,846COMM Mortgage Trust
FRB Ser. 14-CR18, Class C, 4.893%, 7/15/47 W 354,000 358,294FRB Ser. 14-UBS6, Class C, 4.614%, 12/10/47 W 1,437,000 1,407,452Ser. 13-CR13, Class AM, 4.449%, 11/12/46 W 325,000 349,095Ser. 12-CR2, Class AM, 3.791%, 8/15/45 341,000 357,708FRB Ser. 14-LC15, Class XA, IO, 1.498%, 4/10/47 W 16,647,272 875,080FRB Ser. 14-CR17, Class XA, IO, 1.297%, 5/10/47 W 8,088,153 392,243FRB Ser. 14-UBS6, Class XA, IO, 1.175%, 12/10/47 W 6,909,660 337,641FRB Ser. 13-CR11, Class XA, IO, 1.152%, 8/10/50 W 8,390,152 406,002
COMM Mortgage Trust 144AFRB Ser. 10-C1, Class D, 6.324%, 7/10/46 W 476,000 505,229Ser. 13-LC13, Class E, 3.719%, 8/10/46 W 458,000 308,008FRB Ser. 06-C8, Class XS, IO, 0.851%, 12/10/46 W 5,594,338 200
Credit Suisse Commercial Mortgage Trust 144AFRB Ser. 07-C1, Class AX, IO, 0.683%, 2/15/40 W 6,618,869 3,045FRB Ser. 07-C2, Class AX, IO, 0.103%, 1/15/49 W 1,601,188 64
Credit Suisse First Boston Mortgage Securities Corp. 144ASer. 98-C1, Class F, 6.00%, 5/17/40 27,179 27,353FRB Ser. 03-C3, Class AX, IO, 2.256%, 5/15/38 W 66,877 8
CSAIL Commercial Mortgage Trust 144A FRB Ser. 15-C1, Class D, 3.945%, 4/15/50 W 1,302,000 1,140,879CSMC Trust FRB Ser. 16-NXSR, Class C, 4.509%, 12/15/49 W 1,061,000 1,087,445DBUBS Mortgage Trust 144A FRB Ser. 11-LC3A, Class D, 5.345%, 8/10/44 W 1,844,000 1,909,361GE Capital Commercial Mortgage Corp. 144A FRB Ser. 05-C3, Class XC, IO, 0.113%, 7/10/45 W 1,089,512 4GE Commercial Mortgage Corp. Trust 144A FRB Ser. 07-C1, Class XC, IO, 0.438%, 12/10/49 W 10,603,316 23,215GMAC Commercial Mortgage Securities, Inc. Trust 144A FRB Ser. 05-C1, Class X1, IO, 0.794%, 5/10/43 W 188,503 583GS Mortgage Securities Corp. II FRB Ser. 13-GC10, Class XA, IO, 1.593%, 2/10/46 W 5,369,474 370,923GS Mortgage Securities Corp. II 144A FRB Ser. 13-GC10, Class D, 4.41%, 2/10/46 W 186,000 175,823GS Mortgage Securities Trust FRB Ser. 14-GC22, Class XA, IO, 1.183%, 6/10/47 W 9,347,892 457,318
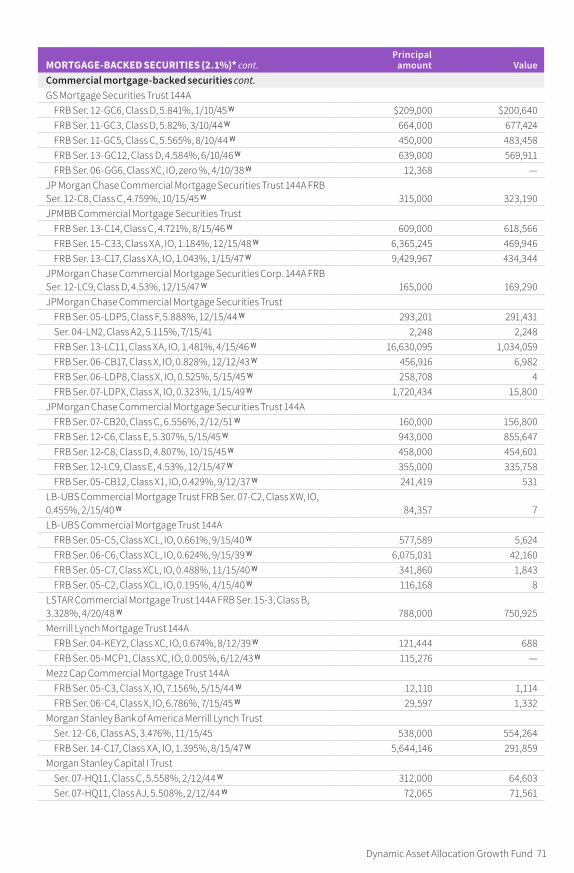
Dynamic Asset Allocation Growth Fund 71
MORTGAGE‑BACKED SECURITIES (2.1%)* cont.Principal
amount ValueCommercial mortgage-backed securities cont.GS Mortgage Securities Trust 144A
FRB Ser. 12-GC6, Class D, 5.841%, 1/10/45 W $209,000 $200,640FRB Ser. 11-GC3, Class D, 5.82%, 3/10/44 W 664,000 677,424FRB Ser. 11-GC5, Class C, 5.565%, 8/10/44 W 450,000 483,458FRB Ser. 13-GC12, Class D, 4.584%, 6/10/46 W 639,000 569,911FRB Ser. 06-GG6, Class XC, IO, zero %, 4/10/38 W 12,368 —
JP Morgan Chase Commercial Mortgage Securities Trust 144A FRB Ser. 12-C8, Class C, 4.759%, 10/15/45 W 315,000 323,190JPMBB Commercial Mortgage Securities Trust
FRB Ser. 13-C14, Class C, 4.721%, 8/15/46 W 609,000 618,566FRB Ser. 15-C33, Class XA, IO, 1.184%, 12/15/48 W 6,365,245 469,946FRB Ser. 13-C17, Class XA, IO, 1.043%, 1/15/47 W 9,429,967 434,344
JPMorgan Chase Commercial Mortgage Securities Corp. 144A FRB Ser. 12-LC9, Class D, 4.53%, 12/15/47 W 165,000 169,290JPMorgan Chase Commercial Mortgage Securities Trust
FRB Ser. 05-LDP5, Class F, 5.888%, 12/15/44 W 293,201 291,431Ser. 04-LN2, Class A2, 5.115%, 7/15/41 2,248 2,248FRB Ser. 13-LC11, Class XA, IO, 1.481%, 4/15/46 W 16,630,095 1,034,059FRB Ser. 06-CB17, Class X, IO, 0.828%, 12/12/43 W 456,916 6,982FRB Ser. 06-LDP8, Class X, IO, 0.525%, 5/15/45 W 258,708 4FRB Ser. 07-LDPX, Class X, IO, 0.323%, 1/15/49 W 1,720,434 15,800
JPMorgan Chase Commercial Mortgage Securities Trust 144AFRB Ser. 07-CB20, Class C, 6.556%, 2/12/51 W 160,000 156,800FRB Ser. 12-C6, Class E, 5.307%, 5/15/45 W 943,000 855,647FRB Ser. 12-C8, Class D, 4.807%, 10/15/45 W 458,000 454,601FRB Ser. 12-LC9, Class E, 4.53%, 12/15/47 W 355,000 335,758FRB Ser. 05-CB12, Class X1, IO, 0.429%, 9/12/37 W 241,419 531
LB-UBS Commercial Mortgage Trust FRB Ser. 07-C2, Class XW, IO, 0.455%, 2/15/40 W 84,357 7LB-UBS Commercial Mortgage Trust 144A
FRB Ser. 05-C5, Class XCL, IO, 0.661%, 9/15/40 W 577,589 5,624FRB Ser. 06-C6, Class XCL, IO, 0.624%, 9/15/39 W 6,075,031 42,160FRB Ser. 05-C7, Class XCL, IO, 0.488%, 11/15/40 W 341,860 1,843FRB Ser. 05-C2, Class XCL, IO, 0.195%, 4/15/40 W 116,168 8
LSTAR Commercial Mortgage Trust 144A FRB Ser. 15-3, Class B, 3.328%, 4/20/48 W 788,000 750,925Merrill Lynch Mortgage Trust 144A
FRB Ser. 04-KEY2, Class XC, IO, 0.674%, 8/12/39 W 121,444 688FRB Ser. 05-MCP1, Class XC, IO, 0.005%, 6/12/43 W 115,276 —
Mezz Cap Commercial Mortgage Trust 144AFRB Ser. 05-C3, Class X, IO, 7.156%, 5/15/44 W 12,110 1,114FRB Ser. 06-C4, Class X, IO, 6.786%, 7/15/45 W 29,597 1,332
Morgan Stanley Bank of America Merrill Lynch TrustSer. 12-C6, Class AS, 3.476%, 11/15/45 538,000 554,264FRB Ser. 14-C17, Class XA, IO, 1.395%, 8/15/47 W 5,644,146 291,859
Morgan Stanley Capital I TrustSer. 07-HQ11, Class C, 5.558%, 2/12/44 W 312,000 64,603Ser. 07-HQ11, Class AJ, 5.508%, 2/12/44 W 72,065 71,561

72 Dynamic Asset Allocation Growth Fund
MORTGAGE‑BACKED SECURITIES (2.1%)* cont.Principal
amount ValueCommercial mortgage-backed securities cont.Morgan Stanley Capital I Trust 144A
FRB Ser. 11-C3, Class D, 5.327%, 7/15/49 W $647,000 $669,193FRB Ser. 11-C3, Class E, 5.327%, 7/15/49 W 545,000 544,906
UBS-Barclays Commercial Mortgage Trust 144AFRB Ser. 12-C3, Class C, 5.21%, 8/10/49 W 284,000 300,152FRB Ser. 12-C4, Class XA, IO, 1.835%, 12/10/45 W 7,232,108 482,820
Wachovia Bank Commercial Mortgage TrustFRB Ser. 05-C21, Class D, 5.468%, 10/15/44 W 400,000 398,188FRB Ser. 06-C29, IO, 0.442%, 11/15/48 W 3,209,795 128FRB Ser. 07-C34, IO, 0.328%, 5/15/46 W 985,581 1,971
Wachovia Bank Commercial Mortgage Trust 144AFRB Ser. 06-C26, Class XC, IO, 0.053%, 6/15/45 W 1,218,248 244FRB Ser. 05-C18, Class XC, IO, zero %, 4/15/42 W 120,120 300
Wells Fargo Commercial Mortgage TrustFRB Ser. 13-LC12, Class AS, 4.43%, 7/15/46 W 280,000 298,576FRB Ser. 13-LC12, Class C, 4.43%, 7/15/46 W 408,000 393,072FRB Ser. 14-LC16, Class XA, IO, 1.538%, 8/15/50 W 6,959,144 442,184FRB Ser. 16-LC25, Class XA, IO, 1.237%, 12/15/59 W 5,592,752 365,457
Wells Fargo Commercial Mortgage Trust 144A FRB Ser. 13-LC12, Class D, 4.43%, 7/15/46 W 655,000 611,131WF-RBS Commercial Mortgage Trust
Ser. 14-C19, Class C, 4.646%, 3/15/47 W 338,000 353,553FRB Ser. 13-C15, Class C, 4.628%, 8/15/46 W 177,000 180,192Ser. 13-UBS1, Class AS, 4.306%, 3/15/46 W 287,000 305,233Ser. 13-C11, Class AS, 3.311%, 3/15/45 211,000 216,374FRB Ser. 14-C24, Class XA, IO, 1.103%, 11/15/47 W 10,492,031 513,126FRB Ser. 14-C22, Class XA, IO, 1.066%, 9/15/57 W 24,104,822 1,188,368
WF-RBS Commercial Mortgage Trust 144AFRB Ser. 11-C5, Class C, 5.861%, 11/15/44 W 273,000 295,960FRB Ser. 11-C5, Class E, 5.861%, 11/15/44 W 515,000 529,540FRB Ser. 11-C3, Class D, 5.813%, 3/15/44 W 819,000 788,482FRB Ser. 11-C2, Class D, 5.788%, 2/15/44 W 796,000 815,945FRB Ser. 13-C15, Class D, 4.628%, 8/15/46 W 437,000 377,151FRB Ser. 12-C9, Class XA, IO, 2.17%, 11/15/45 W 4,831,051 398,368FRB Ser. 12-C10, Class XA, IO, 1.753%, 12/15/45 W 3,383,926 230,005FRB Ser. 13-C12, Class XA, IO, 1.505%, 3/15/48 W 1,595,692 75,789FRB Ser. 12-C9, Class XB, IO, 0.859%, 11/15/45 W 10,038,000 321,879
33,347,748Residential mortgage-backed securities (non-agency) (0.7%)Citigroup Mortgage Loan Trust, Inc. FRB Ser. 05-2, Class 1A2A, 3.253%, 5/25/35 W 850,570 871,834Countrywide Alternative Loan Trust
FRB Ser. 06-OA7, Class 1A2, 1 Month US LIBOR + 0.94%, 1.829%, 6/25/46 1,398,269 1,202,511FRB Ser. 05-27, Class 1A1, 1.661%, 8/25/35 W 264,124 224,955FRB Ser. 05-59, Class 1A1, 1 Month US LIBOR + 0.33%, 1.566%, 11/20/35 734,681 691,393FRB Ser. 06-OA10, Class 4A1, 1 Month US LIBOR + 0.19%, 1.427%, 8/25/46 1,596,333 1,340,920

Dynamic Asset Allocation Growth Fund 73
MORTGAGE‑BACKED SECURITIES (2.1%)* cont.Principal
amount ValueResidential mortgage-backed securities (non-agency) cont.Federal Home Loan Mortgage Corporation
Structured Agency Credit Risk Debt FRN Ser. 16-HQA2, Class M3, 1 Month US LIBOR + 5.15%, 6.387%, 11/25/28 $429,400 $491,872Structured Agency Credit Risk Debt FRN Ser. 14-HQ3, Class M3, 1 Month US LIBOR + 4.75%, 5.987%, 10/25/24 870,000 952,650Structured Agency Credit Risk Debt FRN Ser. 16-DNA2, Class M3, 1 Month US LIBOR + 4.65%, 5.887%, 10/25/28 250,000 279,249
Federal National Mortgage AssociationConnecticut Avenue Securities FRB Ser. 16-C03, Class 2M2, 1 Month US LIBOR + 5.90%, 7.137%, 10/25/28 906,380 1,037,509Connecticut Avenue Securities FRB Ser. 15-C04, Class 1M2, 1 Month US LIBOR + 5.70%, 6.937%, 4/25/28 1,256,640 1,412,704Connecticut Avenue Securities FRB Ser. 15-C04, Class 2M2, 1 Month US LIBOR + 5.55%, 6.787%, 4/25/28 2,260,000 2,494,491Connecticut Avenue Securities FRB Ser. 15-C03, Class 2M2, 1 Month US LIBOR + 5.00%, 6.237%, 7/25/25 367,331 398,384Connecticut Avenue Securities FRB Ser. 15-C01, Class 1M2, 1 Month US LIBOR + 4.30%, 5.537%, 2/25/25 211,174 226,025Connecticut Avenue Securities FRB Ser. 16-C06, Class 1M2, 1 Month US LIBOR + 4.25%, 5.487%, 4/25/29 50,000 55,047Connecticut Avenue Securities FRB Ser. 15-C02, Class 1M2, 1 Month US LIBOR + 4.00%, 5.237%, 5/25/25 336,876 358,802Connecticut Avenue Securities FRB Ser. 14-C02, Class 1M2, 1 Month US LIBOR + 2.60%, 3.837%, 5/25/24 650,000 677,029
Long Beach Mortgage Loan Trust FRB Ser. 04-1, Class A2, 1 Month US LIBOR + 0.80%, 2.037%, 2/25/34 515,323 499,460Merrill Lynch Mortgage Investors Trust FRB Ser. 05-A2, Class A2, 2.973%, 2/25/35 W 332,662 335,054Morgan Stanley ABS Capital I, Inc. Trust FRB Ser. 04-HE6, Class M1, 1 Month US LIBOR + 0.825%, 2.062%, 8/25/34 241,002 238,592Morgan Stanley Resecuritization Trust 144A Ser. 15-R4, Class CB1, 0.598%, 8/26/47 160,000 132,000New Century Home Equity Loan Trust FRB Ser. 03-4, Class M1, 1 Month US LIBOR + 1.125%, 2.362%, 10/25/33 277,451 273,302Park Place Securities, Inc. Asset-Backed Pass-Through Certificates FRB Ser. 04-WCW2, Class M3, 1 Month US LIBOR + 1.05%, 2.287%, 10/25/34 410,000 402,815Structured Asset Mortgage Investments II Trust FRB Ser. 07-AR7, Class 1A1, 1 Month US LIBOR + 0.85%, 2.087%, 5/25/47 1,058,097 953,610Structured Asset Securities Corp. Mortgage Loan Trust FRB Ser. 06-AM1, Class A4, 1 Month US LIBOR + 0.16%, 1.397%, 4/25/36 237,105 234,303Vericrest Opportunity Loan Transfer LXI, LLC 144A Ser. 17-NPL8, Class A1, stepped-coupon 3.125% (6.125%, 6/25/20), 6/25/47 †† 490,558 492,628WaMu Mortgage Pass-Through Certificates Trust
FRB Ser. 05-AR12, Class 1A8, 3.162%, 10/25/35 W 1,064,801 1,070,785FRB Ser. 07-HY2, Class 1A1, 3.071%, 12/25/36 W 443,146 427,188FRB Ser. 05-AR9, Class A1C3, 1 Month US LIBOR + 0.96%, 2.197%, 7/25/45 401,881 397,862
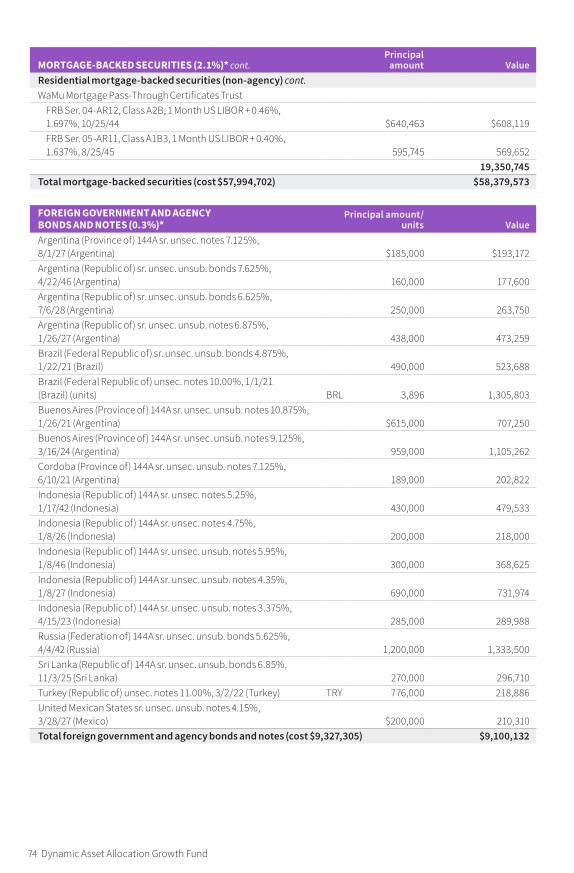
74 Dynamic Asset Allocation Growth Fund
MORTGAGE‑BACKED SECURITIES (2.1%)* cont.Principal
amount ValueResidential mortgage-backed securities (non-agency) cont.WaMu Mortgage Pass-Through Certificates Trust
FRB Ser. 04-AR12, Class A2B, 1 Month US LIBOR + 0.46%, 1.697%, 10/25/44 $640,463 $608,119FRB Ser. 05-AR11, Class A1B3, 1 Month US LIBOR + 0.40%, 1.637%, 8/25/45 595,745 569,652
19,350,745Total mortgage-backed securities (cost $57,994,702) $58,379,573
FOREIGN GOVERNMENT AND AGENCY BONDS AND NOTES (0.3%)*
Principal amount/units Value
Argentina (Province of) 144A sr. unsec. notes 7.125%, 8/1/27 (Argentina) $185,000 $193,172Argentina (Republic of) sr. unsec. unsub. bonds 7.625%, 4/22/46 (Argentina) 160,000 177,600Argentina (Republic of) sr. unsec. unsub. bonds 6.625%, 7/6/28 (Argentina) 250,000 263,750Argentina (Republic of) sr. unsec. unsub. notes 6.875%, 1/26/27 (Argentina) 438,000 473,259Brazil (Federal Republic of) sr. unsec. unsub. bonds 4.875%, 1/22/21 (Brazil) 490,000 523,688Brazil (Federal Republic of) unsec. notes 10.00%, 1/1/21 (Brazil) (units) BRL 3,896 1,305,803Buenos Aires (Province of) 144A sr. unsec. unsub. notes 10.875%, 1/26/21 (Argentina) $615,000 707,250Buenos Aires (Province of) 144A sr. unsec. unsub. notes 9.125%, 3/16/24 (Argentina) 959,000 1,105,262Cordoba (Province of) 144A sr. unsec. unsub. notes 7.125%, 6/10/21 (Argentina) 189,000 202,822Indonesia (Republic of) 144A sr. unsec. notes 5.25%, 1/17/42 (Indonesia) 430,000 479,533Indonesia (Republic of) 144A sr. unsec. notes 4.75%, 1/8/26 (Indonesia) 200,000 218,000Indonesia (Republic of) 144A sr. unsec. unsub. notes 5.95%, 1/8/46 (Indonesia) 300,000 368,625Indonesia (Republic of) 144A sr. unsec. unsub. notes 4.35%, 1/8/27 (Indonesia) 690,000 731,974Indonesia (Republic of) 144A sr. unsec. unsub. notes 3.375%, 4/15/23 (Indonesia) 285,000 289,988Russia (Federation of) 144A sr. unsec. unsub. bonds 5.625%, 4/4/42 (Russia) 1,200,000 1,333,500Sri Lanka (Republic of) 144A sr. unsec. unsub. bonds 6.85%, 11/3/25 (Sri Lanka) 270,000 296,710Turkey (Republic of) unsec. notes 11.00%, 3/2/22 (Turkey) TRY 776,000 218,886United Mexican States sr. unsec. unsub. notes 4.15%, 3/28/27 (Mexico) $200,000 210,310Total foreign government and agency bonds and notes (cost $9,327,305) $9,100,132

Dynamic Asset Allocation Growth Fund 75
WARRANTS (0.2%)* † Expiration date
Strike price Warrants Value
Bupa Arabia for Cooperative Insurance Co. 144A (Saudi Arabia) 3/22/18 $0.00 33,539 $1,056,406Halcon Resources Corp. 9/9/20 14.04 2,341 1,288Jiangsu NHWA Pharmaceutical Co., Ltd. 144A (China) 7/27/18 0.00 410,755 876,196Qingdao Haier Co., Ltd. 144A (China) 9/24/18 0.00 676,000 1,535,623Shanghai International Airport Co., Ltd. 144A (China) 5/7/18 0.00 153,700 879,238Wuliangye Yibin Co., Ltd. 144A (China) 4/12/18 0.00 72,900 628,607Total warrants (cost $4,605,208) $4,977,358
SENIOR LOANS (0.1%)*cPrincipal
amount ValueAvaya, Inc. bank term loan FRN Ser. B7, BBA LIBOR USD 3 Month + 5.25%, 6.564%, 5/29/20 (In default) † $386,811 $328,790Brand Energy & Infrastructure Services, Inc. bank term loan FRN BBA LIBOR USD 3 Month + 4.25%, 5.522%, 6/21/24 440,000 441,750Caesars Entertainment Operating Co., Inc. bank term loan FRN Ser. B6, BBA LIBOR USD 3 Month + 7.75%, 11.75%, 3/1/18 (In default) † 651,923 790,456CPG International, Inc. bank term loan FRN BBA LIBOR USD 3 Month + 3.75%, 5.083%, 5/3/24 90,469 90,610Forterra Finance, LLC bank term loan FRN BBA LIBOR USD 3 Month + 3.00%, 4.235%, 10/25/23 80,000 67,600Gates Global, LLC/Gates Global Co. bank term loan FRN Ser. B, BBA LIBOR USD 3 Month + 3.25%, 4.583%, 3/31/24 125,792 126,235Getty Images, Inc. bank term loan FRN Ser. B, BBA LIBOR USD 3 Month + 3.50%, 4.833%, 10/18/19 219,036 189,075Neiman Marcus Group, Ltd., Inc. bank term loan FRN BBA LIBOR USD 3 Month + 3.25%, 4.481%, 10/25/20 240,547 178,907PetSmart, Inc. bank term loan FRN Ser. B, BBA LIBOR USD 3 Month + 3.00%, 4.24%, 3/10/22 99,745 84,463Revlon Consumer Products Corp. bank term loan FRN Ser. B, BBA LIBOR USD 3 Month + 3.50%, 4.735%, 9/7/23 297,000 265,908Total senior loans (cost $2,575,035) $2,563,794
ASSET‑BACKED SECURITIES (—%)*Principal
amount ValueMortgage Repurchase Agreement Financing Trust 144A FRB Ser. 16-4, Class A1, 1 Month US LIBOR + 1.20%, 2.435%, 5/10/19 $221,000 $221,000Station Place Securitization Trust 144A FRB Ser. 17-1, Class A, 1 Month US LIBOR + 0.90%, 2.137%, 2/25/49 732,000 732,000Total asset-backed securities (cost $953,035) $953,000
PURCHASED OPTIONS OUTSTANDING (—%)* Counterparty
Expiration date/strike price
Notional amount
Contract amount Value
Bank of America N.A.USD/CNH (Put) Dec-17/CNH 6.50 $27,451,500 $27,451,500 $35,440UBS AGIShares MSCI Emerging Markets ETF (Put) Dec-17/$43.00 14,227,937 317,517 211,539

76 Dynamic Asset Allocation Growth Fund
PURCHASED OPTIONS OUTSTANDING (—%)* Counterparty cont.
Expiration date/strike price
Notional amount
Contract amount Value
Bank of America N.A.IShares MSCI Emerging Markets ETF (Put) Nov-17/$42.00 $9,122,330 $203,578 $55,986Total purchased options outstanding (cost $681,283) $302,965
CONVERTIBLE BONDS AND NOTES (—%)*Principal
amount ValueJazz US Holdings, Inc. cv. company guaranty sr. unsec. notes 8.00%, 12/31/18 $83,000 $257,559Total convertible bonds and notes (cost $79,638) $257,559
CONVERTIBLE PREFERRED STOCKS (—%)* Shares ValueEPR Properties Ser. C, $1.438 cv. pfd. R 7,578 $209,934Nine Point Energy 6.75% cv. pfd. 34 35,194Total convertible preferred stocks (cost $172,507) $245,128
INVESTMENT COMPANIES (—%)* Shares ValueAltaba, Inc. 3,100 $205,344Total investment companies (cost $153,311) $205,344
PREFERRED STOCKS (—%)* Shares ValueGMAC Capital Trust I Ser. 2, $0.00 cum. ARP 6,720 $177,408Total preferred stocks (cost $168,119) $177,408
SHORT‑TERM INVESTMENTS (16.7%)*Principal amount/
shares ValuePutnam Cash Collateral Pool, LLC 1.25% d Shares 31,273,602 $31,273,602Putnam Short Term Investment Fund 1.17% L Shares 234,437,630 234,437,630State Street Institutional U.S. Government Money Market Fund, Premier Class 0.92% P Shares 617,000 617,000Canada (Government of) commercial paper 1.200%, 10/3/17 $10,000,000 9,998,844Chariot Funding, LLC asset backed commercial paper 1.181%, 10/11/17 12,000,000 11,995,137CHARTA, LLC asset backed commercial paper 1.273%, 11/16/17 12,000,000 11,979,745Interest in $120,161,000 joint tri-party repurchase agreement dated 9/29/17 with BNP Paribas due 10/2/17 — maturity value of $60,645,306 for an effective yield of 1.050% (collateralized by various U.S. Treasury notes with coupon rates ranging from 0.875% to 3.625% and due dates ranging from 10/31/17 to 5/31/22, valued at $122,574,975) 60,640,000 60,640,000Interest in $275,000,000 joint tri-party repurchase agreement dated 9/29/17 with HSBC Bank USA, National Association due 10/2/17 — maturity value of $40,003,500 for an effective yield of 1.050% (collateralized by various U.S. Treasury bills and a U.S. Treasury note with coupon rates ranging from 0.000% to 2.000% and due dates ranging from 10/5/17 to 5/31/24, valued at $280,501,662) 40,000,000 40,000,000Liberty Street Funding, LLC asset backed commercial paper 1.252%, 11/6/17 6,600,000 6,591,166Nestle Finance International commercial paper 1.173%, 11/29/17 6,000,000 5,988,288
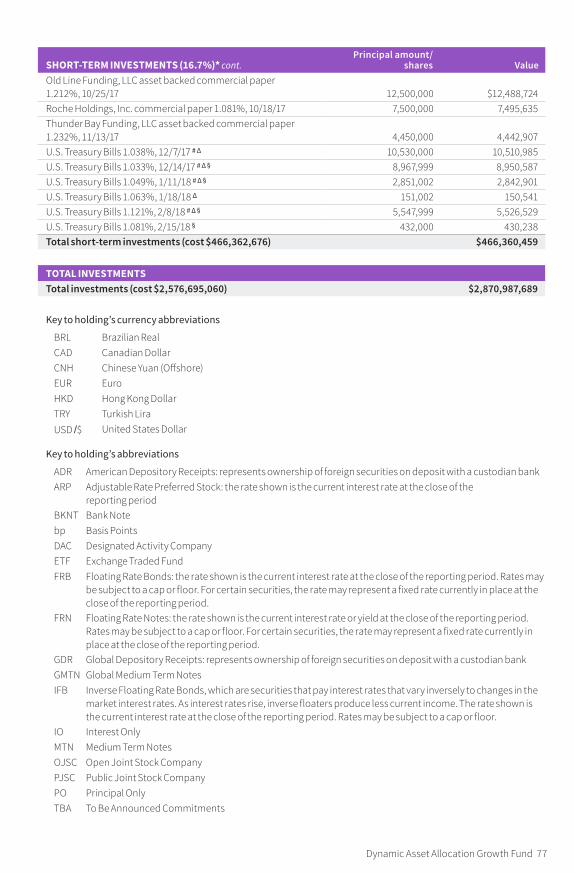
Dynamic Asset Allocation Growth Fund 77
SHORT‑TERM INVESTMENTS (16.7%)* cont.Principal amount/
shares ValueOld Line Funding, LLC asset backed commercial paper 1.212%, 10/25/17 12,500,000 $12,488,724Roche Holdings, Inc. commercial paper 1.081%, 10/18/17 7,500,000 7,495,635Thunder Bay Funding, LLC asset backed commercial paper 1.232%, 11/13/17 4,450,000 4,442,907U.S. Treasury Bills 1.038%, 12/7/17 # ∆ 10,530,000 10,510,985U.S. Treasury Bills 1.033%, 12/14/17 # ∆ § 8,967,999 8,950,587U.S. Treasury Bills 1.049%, 1/11/18 # ∆ § 2,851,002 2,842,901U.S. Treasury Bills 1.063%, 1/18/18 ∆ 151,002 150,541U.S. Treasury Bills 1.121%, 2/8/18 # ∆ § 5,547,999 5,526,529U.S. Treasury Bills 1.081%, 2/15/18 § 432,000 430,238Total short-term investments (cost $466,362,676) $466,360,459
TOTAL INVESTMENTSTotal investments (cost $2,576,695,060) $2,870,987,689
Key to holding’s currency abbreviations
BRL Brazilian RealCAD Canadian DollarCNH Chinese Yuan (Offshore)EUR EuroHKD Hong Kong DollarTRY Turkish LiraUSD /$ United States Dollar
Key to holding’s abbreviations
ADR American Depository Receipts: represents ownership of foreign securities on deposit with a custodian bankARP Adjustable Rate Preferred Stock: the rate shown is the current interest rate at the close of the
reporting periodBKNT Bank Notebp Basis PointsDAC Designated Activity CompanyETF Exchange Traded FundFRB Floating Rate Bonds: the rate shown is the current interest rate at the close of the reporting period. Rates may
be subject to a cap or floor. For certain securities, the rate may represent a fixed rate currently in place at the close of the reporting period.
FRN Floating Rate Notes: the rate shown is the current interest rate or yield at the close of the reporting period. Rates may be subject to a cap or floor. For certain securities, the rate may represent a fixed rate currently in place at the close of the reporting period.
GDR Global Depository Receipts: represents ownership of foreign securities on deposit with a custodian bankGMTN Global Medium Term NotesIFB Inverse Floating Rate Bonds, which are securities that pay interest rates that vary inversely to changes in the
market interest rates. As interest rates rise, inverse floaters produce less current income. The rate shown is the current interest rate at the close of the reporting period. Rates may be subject to a cap or floor.
IO Interest OnlyMTN Medium Term NotesOJSC Open Joint Stock CompanyPJSC Public Joint Stock CompanyPO Principal OnlyTBA To Be Announced Commitments

78 Dynamic Asset Allocation Growth Fund
Notes to the fund’s portfolio
Unless noted otherwise, the notes to the fund’s portfolio are for the close of the fund’s reporting period, which ran from October 1, 2016 through September 30, 2017 (the reporting period). Within the following notes to the portfolio, references to “ASC 820” represent Accounting Standards Codification 820 Fair Value Measurements and Disclosures, references to “Putnam Management” represent Putnam Investment Management, LLC, the fund’s manager, an indirect wholly-owned subsidiary of Putnam Investments, LLC and references to “OTC”, if any, represent over-the-counter.
* Percentages indicated are based on net assets of $2,790,678,914.
† This security is non-income-producing.
†† The interest rate and date shown parenthetically represent the new interest rate to be paid and the date the fund will begin accruing interest at this rate.
∆∆ This security is restricted with regard to public resale. The total fair value of this security and any other restricted securities (excluding 144A securities), if any, held at the close of the reporting period was $224,896, or less than 0.1% of net assets.
‡‡ Income may be received in cash or additional securities at the discretion of the issuer. The rate shown in parenthesis is the rate paid in kind, if applicable.
# This security, in part or in entirety, was pledged and segregated with the broker to cover margin requirements for futures contracts at the close of the reporting period. Collateral at period end totaled $18,332,220 and is included in Investments in securities on the Statement of assets and liabilities (Notes 1 and 5).
∆ This security, in part or in entirety, was pledged and segregated with the custodian for collateral on certain derivative contracts at the close of the reporting period. Collateral at period end totaled $4,504,430 and is included in Investments in securities on the Statement of assets and liabilities (Notes 1 and 5).
§ This security, in part or in entirety, was pledged and segregated with the custodian for collateral on the initial margin on certain centrally cleared derivative contracts at the close of the reporting period. Collateral at period end totaled $4,359,072 and is included in Investments in securities on the Statement of assets and liabilities (Notes 1 and 5).
## Forward commitment, in part or in entirety (Note 1).
c Senior loans are exempt from registration under the Securities Act of 1933, as amended, but contain certain restrictions on resale and cannot be sold publicly. These loans pay interest at rates which adjust periodically. The interest rates shown for senior loans are the current interest rates at the close of the reporting period. Senior loans are also subject to mandatory and/or optional prepayment which cannot be predicted. As a result, the remaining maturity may be substantially less than the stated maturity shown (Notes 1 and 8).
d Affiliated company. See Notes 1 and 6 to the financial statements regarding securities lending. The rate quoted in the security description is the annualized 7-day yield of the fund at the close of the reporting period.
F This security is valued by Putnam Management at fair value following procedures approved by the Trustees. Securities are classified as Level 3 for ASC 820 based on the securities’ valuation inputs. At the close of the reporting period, fair value pricing was also used for certain foreign securities in the portfolio (Note 1).
i This security was pledged, or purchased with cash that was pledged, to the fund for collateral on certain derivative contracts (Note 1).
L Affiliated company (Note 6). The rate quoted in the security description is the annualized 7-day yield of the fund at the close of the reporting period.
P This security was pledged, or purchased with cash that was pledged, to the fund for collateral on certain derivative contracts. The rate quoted in the security description is the annualized 7-day yield of the fund at the close of the reporting period (Note 1).
R Real Estate Investment Trust.
S Security on loan, in part or in entirety, at the close of the reporting period (Note 1).W The rate shown represents the weighted average coupon associated with the underlying mortgage pools. Rates may
be subject to a cap or floor.
At the close of the reporting period, the fund maintained liquid assets totaling $36,717,455 to cover certain derivative contracts, delayed delivery securities and the settlement of certain securities.

Dynamic Asset Allocation Growth Fund 79
Unless otherwise noted, the rates quoted in Short-term investments security descriptions represent the weighted average yield to maturity.
Debt obligations are considered secured unless otherwise indicated.
144A after the name of an issuer represents securities exempt from registration under Rule 144A of the Securities Act of 1933, as amended. These securities may be resold in transactions exempt from registration, normally to qualified institutional buyers.
See Note 1 to the financial statements regarding TBA commitments.
The dates shown on debt obligations are the original maturity dates.
DIVERSIFICATION BY COUNTRY
Distribution of investments by country of risk at the close of the reporting period, excluding collateral received, if any (as a percentage of Portfolio Value):
United States 74.8%Japan 3.7United Kingdom 2.9France 2.1Germany 1.8Switzerland 1.7China 1.6Canada 1.2Australia 1.1Spain 0.9
South Korea 0.8%Hong Kong 0.7Taiwan 0.7Netherlands 0.7Sweden 0.6Brazil 0.6Russia 0.6India 0.5Other 3.0Total 100.0%
FORWARD CURRENCY CONTRACTS at 9/30/17 (aggregate face value $381,619,524 )
Counterparty CurrencyContract
type*Delivery
date ValueAggregate face value
Unrealized appreciation/
(depreciation)Bank of America N.A.
Australian Dollar Buy 10/18/17 $1,215,309 $1,129,294 $86,015British Pound Buy 12/20/17 6,499,942 6,297,024 202,918
Canadian Dollar Sell 10/18/17 2,405,972 2,189,252 (216,720 )Euro Buy 12/20/17 4,054,940 4,077,244 (22,304 )
Hong Kong Dollar Sell 11/15/17 6,045,436 6,035,724 (9,712 )New Zealand Dollar Buy 10/18/17 5,280,596 5,299,433 (18,837 )New Zealand Dollar Sell 10/18/17 5,280,596 5,274,370 (6,226 )
Norwegian Krone Buy 12/20/17 6,988,879 7,083,584 (94,705 )Russian Ruble Buy 12/20/17 5,613,866 5,470,614 143,252
Barclays Bank PLCAustralian Dollar Buy 10/18/17 1,173,507 1,144,731 28,776
Euro Sell 12/20/17 4,010,545 4,055,997 45,452New Zealand Dollar Buy 10/18/17 2,770,706 2,840,107 (69,401 )New Zealand Dollar Sell 10/18/17 2,770,706 2,767,470 (3,236 )
Swiss Franc Buy 12/20/17 982,298 989,273 (6,975 )Citibank, N.A.
Australian Dollar Buy 10/18/17 2,710,916 2,658,564 52,352Australian Dollar Sell 10/18/17 2,710,916 2,742,542 31,626
Brazilian Real Buy 10/3/17 2,731,067 2,719,176 11,891Brazilian Real Sell 10/3/17 2,731,067 2,736,615 5,548Brazilian Real Buy 1/3/18 26,793 26,645 148

80 Dynamic Asset Allocation Growth Fund
FORWARD CURRENCY CONTRACTS at 9/30/17 (aggregate face value $381,619,524 ) cont.
Counterparty CurrencyContract
type*Delivery
date ValueAggregate face value
Unrealized appreciation/
(depreciation)Citibank, N.A. cont.
Canadian Dollar Buy 10/18/17 $5,557,854 $5,479,915 $77,939Canadian Dollar Sell 10/18/17 5,557,854 5,509,655 (48,199 )
Danish Krone Buy 12/20/17 1,222,007 1,229,757 (7,750 )Euro Buy 12/20/17 2,063,081 2,079,661 (16,580 )
Japanese Yen Sell 11/15/17 1,328,929 1,413,396 84,467New Zealand Dollar Sell 10/18/17 451,591 454,371 2,780
Norwegian Krone Buy 12/20/17 5,013,130 5,125,182 (112,052 )Russian Ruble Buy 12/20/17 5,535,420 5,462,521 72,899
Swedish Krona Sell 12/20/17 2,653,213 2,720,774 67,561Credit Suisse International
Australian Dollar Buy 10/18/17 5,296,663 5,200,397 96,266Euro Buy 12/20/17 3,030,403 3,073,401 (42,998 )
Japanese Yen Sell 11/15/17 2,871,692 2,899,492 27,800New Zealand Dollar Buy 10/18/17 1,085,075 1,083,855 1,220New Zealand Dollar Sell 10/18/17 1,085,075 1,093,199 8,124
Swedish Krona Sell 12/20/17 2,761,530 2,760,954 (576 )Swiss Franc Buy 12/20/17 6,928,825 6,977,505 (48,680 )
Goldman Sachs InternationalAustralian Dollar Buy 10/18/17 8,198,314 8,203,394 (5,080 )Australian Dollar Sell 10/18/17 8,198,314 7,948,983 (249,331 )Canadian Dollar Buy 10/18/17 2,775,721 2,800,763 (25,042 )Canadian Dollar Sell 10/18/17 2,775,721 2,732,312 (43,409 )
Euro Buy 12/20/17 2,482,819 2,507,560 (24,741 )Hungarian Forint Sell 12/20/17 2,732,429 2,767,005 34,576
Indonesian Rupiah Sell 11/15/17 16,854 19,718 2,864Japanese Yen Sell 11/15/17 4,314,683 4,408,385 93,702
New Zealand Dollar Buy 10/18/17 583,805 619,979 (36,174 )South African Rand Sell 10/18/17 2,580,393 2,660,865 80,472
Swedish Krona Sell 12/20/17 2,381,370 2,463,488 82,118Turkish Lira Buy 12/20/17 8,654,872 8,832,057 (177,185 )
HSBC Bank USA, National AssociationAustralian Dollar Buy 10/18/17 2,719,857 2,739,782 (19,925 )Australian Dollar Sell 10/18/17 2,719,857 2,726,046 6,189Canadian Dollar Buy 10/18/17 5,535,731 5,464,992 70,739Canadian Dollar Sell 10/18/17 5,535,731 5,500,836 (34,895 )
Euro Sell 12/20/17 7,804,454 7,890,670 86,216Japanese Yen Sell 11/15/17 2,656,604 2,741,873 85,269Mexican Peso Sell 10/18/17 2,633,061 2,659,081 26,020
New Zealand Dollar Buy 10/18/17 8,134,920 8,174,192 (39,272 )New Zealand Dollar Sell 10/18/17 8,134,920 8,234,429 99,509
JPMorgan Chase Bank N.A.Australian Dollar Buy 10/18/17 3,898,069 4,006,754 (108,685 )
British Pound Buy 12/20/17 552,866 536,377 16,489

Dynamic Asset Allocation Growth Fund 81
FORWARD CURRENCY CONTRACTS at 9/30/17 (aggregate face value $381,619,524 ) cont.
Counterparty CurrencyContract
type*Delivery
date ValueAggregate face value
Unrealized appreciation/
(depreciation)JPMorgan Chase Bank N.A. cont.
Canadian Dollar Buy 10/18/17 $5,568,354 $5,549,614 $18,740Canadian Dollar Sell 10/18/17 5,568,354 5,594,609 26,255
Euro Sell 12/20/17 535,713 559,298 23,585Indonesian Rupiah Sell 11/15/17 16,854 23,682 6,828
Japanese Yen Sell 11/15/17 2,709,560 2,758,334 48,774New Zealand Dollar Buy 10/18/17 8,559,072 8,672,541 (113,469 )New Zealand Dollar Sell 10/18/17 8,559,072 8,626,909 67,837
Norwegian Krone Buy 12/20/17 1,589,316 1,614,698 (25,382 )Singapore Dollar Buy 11/15/17 2,523,902 2,523,618 284
South African Rand Buy 10/18/17 2,659,211 2,684,207 (24,996 )South African Rand Sell 10/18/17 2,659,211 2,731,395 72,184
Swedish Krona Sell 12/20/17 5,014,293 5,065,860 51,567Royal Bank of Scotland PLC (The)
Australian Dollar Buy 10/18/17 6,167,911 6,017,994 149,917Canadian Dollar Buy 10/18/17 2,882,485 2,672,559 209,926
Euro Buy 12/20/17 1,559,182 1,585,700 (26,518 )New Zealand Dollar Buy 10/18/17 8,084,157 8,124,667 (40,510 )New Zealand Dollar Sell 10/18/17 8,084,157 8,139,572 55,415
Swedish Krona Sell 12/20/17 2,696,283 2,764,553 68,270Turkish Lira Buy 12/20/17 5,128,323 5,259,858 (131,535 )
State Street Bank and Trust Co.Australian Dollar Buy 10/18/17 4,051,003 4,015,900 35,103
British Pound Sell 12/20/17 2,771,048 2,805,703 34,655Canadian Dollar Buy 10/18/17 2,860,523 2,810,294 50,229Canadian Dollar Sell 10/18/17 2,860,523 2,895,048 34,525
Euro Buy 12/20/17 4,055,415 4,094,738 (39,323 )New Zealand Dollar Buy 10/18/17 4,208,014 4,319,234 (111,220 )
Norwegian Krone Buy 12/20/17 6,861,515 7,015,720 (154,205 )Swedish Krona Sell 12/20/17 2,323,462 2,378,487 55,025
UBS AGAustralian Dollar Buy 10/18/17 4,615,758 4,560,629 55,129
British Pound Sell 12/20/17 1,372,361 1,330,346 (42,015 )Canadian Dollar Buy 10/18/17 2,875,833 2,869,451 6,382
Euro Sell 12/20/17 2,767,473 2,806,215 38,742Japanese Yen Sell 11/15/17 5,540,294 5,617,285 76,991
New Zealand Dollar Buy 10/18/17 2,746,805 2,761,464 (14,659 )New Zealand Dollar Sell 10/18/17 2,746,805 2,764,126 17,321
Norwegian Krone Buy 12/20/17 2,734,931 2,765,440 (30,509 )Swedish Krona Sell 12/20/17 2,730,744 2,778,136 47,392
WestPac Banking Corp.Australian Dollar Buy 10/18/17 4,156,095 4,097,056 59,039Australian Dollar Sell 10/18/17 4,156,095 4,150,552 (5,543 )Canadian Dollar Buy 10/18/17 2,802,332 2,750,570 51,762

82 Dynamic Asset Allocation Growth Fund
FORWARD CURRENCY CONTRACTS at 9/30/17 (aggregate face value $381,619,524 ) cont.
Counterparty CurrencyContract
type*Delivery
date ValueAggregate face value
Unrealized appreciation/
(depreciation)WestPac Banking Corp. cont.
Canadian Dollar Sell 10/18/17 $2,802,332 $2,799,172 $(3,160 )Euro Buy 12/20/17 116,093 117,083 (990 )
Japanese Yen Sell 11/15/17 2,645,273 2,705,062 59,789New Zealand Dollar Buy 10/18/17 5,318,433 5,329,701 (11,268 )New Zealand Dollar Sell 10/18/17 5,318,433 5,371,209 52,776
Unrealized appreciation 3,205,639Unrealized depreciation (2,263,992 )Total $941,647
* The exchange currency for all contracts listed is the United States Dollar.
FUTURES CONTRACTS OUTSTANDING at 9/30/17
Number of contracts
Notional amount Value
Expiration date
Unrealized appreciation/
(depreciation)MSCI EAFE Index Mini (Short) 282 $27,830,665 $27,895,440 Dec-17 $(88,585 )Russell 2000 Index E-Mini (Long) 2,174 162,056,634 162,278,230 Dec-17 10,180,842S&P 500 Index E-Mini (Long) 1,797 226,364,496 226,071,585 Dec-17 2,492,111S&P Mid Cap 400 Index E-Mini (Long) 327 58,727,238 58,719,390 Dec-17 1,869,908Tokyo Price Index (Long) 186 27,683,048 27,687,181 Dec-17 1,740,655U.S. Treasury Bond 30 yr (Long) 68 10,391,250 10,391,251 Dec-17 (168,635 )U.S. Treasury Bond Ultra 30 yr (Long) 121 19,980,125 19,980,125 Dec-17 (358,725 )U.S. Treasury Bond Ultra 30 yr (Short) 6 990,750 990,750 Dec-17 17,801U.S. Treasury Note 2 yr (Long) 280 60,396,875 60,396,875 Dec-17 (150,682 )U.S. Treasury Note 2 yr (Short) 162 34,943,906 34,943,906 Dec-17 81,240U.S. Treasury Note 5 yr (Long) 481 56,517,500 56,517,500 Dec-17 (365,465 )U.S. Treasury Note 5 yr (Short) 411 48,292,500 48,292,500 Dec-17 333,377U.S. Treasury Note 10 yr (Long) 224 28,070,000 28,070,001 Dec-17 (294,422 )U.S. Treasury Note 10 yr (Short) 850 106,515,625 106,515,625 Dec-17 1,074,981U.S. Treasury Note Ultra 10 yr (Long) 6 805,969 805,969 Dec-17 (9,512 )Unrealized appreciation 17,790,915Unrealized depreciation (1,436,026 )Total $16,354,889
WRITTEN SWAP OPTIONS OUTSTANDING at 9/30/17 (premiums $553,651 )
Counterparty Fixed Obligation % to receive or (pay)/ Floating rate index/Maturity date
Expiration date/strike
Notional/ contract amount Value
JPMorgan Chase Bank N.A.(6.00 Floor)/3 month USD-LIBOR-BBA/Mar-18 Mar-18/6.00 $3,109,000 $71,911Total $71,911

Dynamic Asset Allocation Growth Fund 83
WRITTEN OPTIONS OUTSTANDING at 9/30/17 (premiums $385,461 )
CounterpartyExpiration date/strike price
Notional amount
Contract amount Value
Bank of America N.A.USD/CNH (Put) Dec-17/CNH 6.40 $27,451,500 $27,451,500 $9,773UBS AGIShares MSCI Emerging Markets ETF (Put) Dec-17/$41.00 14,227,937 317,517 118,218IShares MSCI Emerging Markets ETF (Put) Nov-17/40.00 9,122,330 203,578 35,998Tencent Holdings, Ltd. (Call) Nov-17/HKD 320.00 856,381 19,898 61,211Total $225,200
TBA SALE COMMITMENTS OUTSTANDING at 9/30/17 (proceeds receivable $16,265,430 )
AgencyPrincipal
amountSettlement date Value
Federal National Mortgage Association, 4.00%, 10/1/47 $2,000,000 10/12/17 $2,105,469Federal National Mortgage Association, 3.50%, 10/1/47 1,000,000 10/12/17 1,030,859Federal National Mortgage Association, 3.00%, 10/1/47 12,000,000 10/12/17 12,037,500Government National Mortgage Association, 4.00%, 10/1/47 1,000,000 10/23/17 1,052,969Total $16,226,797
CENTRALLY CLEARED INTEREST RATE SWAP CONTRACTS OUTSTANDING at 9/30/17
Notional amount Value
Upfront premium received
(paid)Termination
datePayments made by fund
Payments received by fund
Unrealized appreciation/ (depreciation)
$54,106,800 $10,443 E $(2,215 ) 12/20/19 1.80% — Semiannually
3 month USD-LIBOR-BBA — Quarterly
$8,228
42,961,500 8,292 E 1,618 12/20/19 3 month USD-LIBOR-BBA — Quarterly
1.80% — Semiannually
(6,674 )
8,210,900 838 E (4,305 ) 12/20/22 3 month USD-LIBOR-BBA — Quarterly
2.05% — Semiannually
(3,468 )
65,020,400 6,632 E 33,186 12/20/22 2.05% — Semiannually
3 month USD-LIBOR-BBA — Quarterly
32,163
45,948,500 260,758 E (223,207 ) 12/20/27 2.25% — Semiannually
3 month USD-LIBOR-BBA — Quarterly
37,551
10,756,000 61,040 E 51,977 12/20/27 3 month USD-LIBOR-BBA — Quarterly
2.25% — Semiannually
(9,063 )
4,553,900 41,108 E (47,264 ) 12/20/47 2.50% — Semiannually
3 month USD-LIBOR-BBA — Quarterly
(6,155 )

84 Dynamic Asset Allocation Growth Fund
CENTRALLY CLEARED INTEREST RATE SWAP CONTRACTS OUTSTANDING at 9/30/17 cont.
Notional amount Value
Upfront premium received
(paid)Termination
datePayments made by fund
Payments received by fund
Unrealized appreciation/ (depreciation)
$6,588,100 $59,471 E $68,250 12/20/47 3 month USD-LIBOR-BBA — Quarterly
2.50% — Semiannually
$8,778
267,000 286 (2 ) 10/2/27 2.2935% — Semiannually
3 month USD-LIBOR-BBA — Quarterly
(288 )
Total $(121,962 ) $61,072
E Extended effective date.
OTC TOTAL RETURN SWAP CONTRACTS OUTSTANDING at 9/30/17
Swap counterparty/ Notional amount Value
Upfront premium received
(paid)
Termina-tion
date
Payments received (paid) by fund
Total return received by or paid by fund
Unrealized appreciation/ (depreciation)
Barclays Bank PLC$9,315 $9,489 $— 1/12/42 4.00% (1 month
USD-LIBOR) — Monthly
Synthetic TRS Index 4.00% 30 year Fannie Mae pools — Monthly
$258
150,394 153,820 — 1/12/41 4.00% (1 month USD-LIBOR) — Monthly
Synthetic TRS Index 4.00% 30 year Fannie Mae pools — Monthly
4,871
441 438 — 1/12/38 6.50% (1 month USD-LIBOR) — Monthly
Synthetic TRS Index 6.50% 30 year Fannie Mae pools — Monthly
2
141,120 140,834 — 1/12/40 4.50% (1 month USD-LIBOR) — Monthly
Synthetic MBX Index 4.50% 30 year Fannie Mae pools — Monthly
(68 )
33,694 33,907 — 1/12/39 (6.00%) 1 month USD-LIBOR — Monthly
Synthetic MBX Index 6.00% 30 year Fannie Mae pools — Monthly
(285 )
41,528 41,905 — 1/12/41 (5.00%) 1 month USD-LIBOR — Monthly
Synthetic TRS Index 5.00% 30 year Fannie Mae pools — Monthly
(840 )
10,410 10,579 — 1/12/43 3.50% (1 month USD-LIBOR) — Monthly
Synthetic TRS Index 3.50% 30 year Fannie Mae pools — Monthly
257
274,964 274,535 — 1/12/40 5.00% (1 month USD-LIBOR) — Monthly
Synthetic MBX Index 5.00% 30 year Fannie Mae pools — Monthly
50

Dynamic Asset Allocation Growth Fund 85
OTC TOTAL RETURN SWAP CONTRACTS OUTSTANDING at 9/30/17 cont.
Swap counterparty/ Notional amount Value
Upfront premium received
(paid)
Termina-tion
date
Payments received (paid) by fund
Total return received by or paid by fund
Unrealized appreciation/ (depreciation)
Barclays Bank PLC cont.$931,566 $930,247 $— 1/12/41 5.00% (1 month
USD-LIBOR) — Monthly
Synthetic MBX Index 5.00% 30 year Fannie Mae pools — Monthly
$301
326,943 327,910 — 1/12/38 (6.50%) 1 month USD-LIBOR — Monthly
Synthetic MBX Index 6.50% 30 year Fannie Mae pools — Monthly
(1,719 )
Citibank, N.A.358,023 357,516 — 1/12/41 5.00% (1 month
USD-LIBOR) — Monthly
Synthetic MBX Index 5.00% 30 year Fannie Mae pools — Monthly
116
113,170,520 117,051,408 — 11/27/17 3 month USD-LIBOR-BBA plus 0.09% — Quarterly
Russell 1000 Total Return Index — Quarterly
(3,730,480 )
138,066,700 138,933,937 — 12/1/17 (3 month USD-LIBOR-BBA plus 0.37%) — Quarterly
A basket (CGPUTQL2 ) of common stocks * — Quarterly
937,513
Credit Suisse International1,254,533 1,256,896 — 1/12/41 4.50% (1 month
USD-LIBOR) — Monthly
Synthetic MBX Index 4.50% 30 year Ginnie Mae II pools — Monthly
4,307
26,394 27,202 — 1/12/45 3.50% (1 month USD-LIBOR) — Monthly
Synthetic TRS Index 3.50% 30 year Fannie Mae pools — Monthly
1,042
Goldman Sachs International15,110 14,994 — 1/12/39 6.00% (1 month
USD-LIBOR) — Monthly
Synthetic TRS Index 6.00% 30 year Fannie Mae pools — Monthly
71
2,921 2,900 — 1/12/38 6.50% (1 month USD-LIBOR) — Monthly
Synthetic TRS Index 6.50% 30 year Fannie Mae pools — Monthly
15
23,063 23,493 — 1/12/42 4.00% (1 month USD-LIBOR) — Monthly
Synthetic TRS Index 4.00% 30 year Fannie Mae pools — Monthly
638
23,063 23,493 — 1/12/42 4.00% (1 month USD-LIBOR) — Monthly
Synthetic TRS Index 4.00% 30 year Fannie Mae pools — Monthly
638

86 Dynamic Asset Allocation Growth Fund
OTC TOTAL RETURN SWAP CONTRACTS OUTSTANDING at 9/30/17 cont.
Swap counterparty/ Notional amount Value
Upfront premium received
(paid)
Termina-tion
date
Payments received (paid) by fund
Total return received by or paid by fund
Unrealized appreciation/ (depreciation)
Goldman Sachs International cont.$98,416 $100,654 $— 1/12/40 4.00% (1 month
USD-LIBOR) — Monthly
Synthetic TRS Index 4.00% 30 year Fannie Mae pools — Monthly
$3,182
18,760 18,815 — 1/12/38 (6.50%) 1 month USD-LIBOR — Monthly
Synthetic MBX Index 6.50% 30 year Fannie Mae pools — Monthly
(99 )
22,529 22,596 — 1/12/38 (6.50%) 1 month USD-LIBOR — Monthly
Synthetic MBX Index 6.50% 30 year Fannie Mae pools — Monthly
(118 )
425,265 426,523 — 1/12/38 (6.50%) 1 month USD-LIBOR — Monthly
Synthetic MBX Index 6.50% 30 year Fannie Mae pools — Monthly
(2,235 )
JPMorgan Securities LLC150,394 153,820 — 1/12/41 (4.00%) 1 month
USD-LIBOR — Monthly
Synthetic TRS Index 4.00% 30 year Fannie Mae pools — Monthly
(4,871 )
55,441 56,474 — 1/12/42 (4.00%) 1 month USD-LIBOR — Monthly
Synthetic TRS Index 4.00% 30 year Fannie Mae pools — Monthly
(1,532 )
Upfront premium received — Unrealized appreciation 953,261Upfront premium (paid) — Unrealized depreciation (3,742,247 )Total $— Total $(2,788,986 )
* The 50 largest components, and any individual component greater than 1% of basket value, are shown below.
* A BASKET — CGPUTQL2 OF COMMON STOCK
Common stocks Sector Shares ValuePercentage
Value
Johnson & Johnson Health care 32,272 $4,195,631 3.02%JPMorgan Chase & Co. Financials 38,335 3,661,343 2.64%Pfizer, Inc. Health care 94,649 3,378,977 2.43%McDonald’s Corp. Consumer discretionary 18,630 2,918,871 2.10%Applied Materials, Inc. Information technology 54,440 2,835,783 2.04%Texas Instruments, Inc. Information technology 30,971 2,776,260 2.00%Apple, Inc. Information technology 17,910 2,760,221 1.99%Raytheon Co. Industrials 14,251 2,658,950 1.91%UnitedHealth Group, Inc. Health care 13,421 2,628,597 1.89%PNC Financial Services Group, Inc. (The)
Financials 19,038 2,565,691 1.85%
eBay, Inc. Information technology 66,033 2,539,615 1.83%

Dynamic Asset Allocation Growth Fund 87
* A BASKET — CGPUTQL2 OF COMMON STOCK cont.
Common stocks Sector Shares ValuePercentage
Value
Altria Group, Inc. Consumer staples 39,695 $2,517,470 1.81%Intuit, Inc. Information technology 17,291 2,457,753 1.77%Exxon Mobil Corp. Energy 29,369 2,407,643 1.73%Norfolk Southern Corp. Industrials 18,043 2,386,048 1.72%Northrop Grumman Corp. Industrials 8,223 2,365,848 1.70%Danaher Corp. Health care 27,438 2,353,619 1.69%Humana, Inc. Health care 9,574 2,332,622 1.68%Honeywell International, Inc. Industrials 16,434 2,329,394 1.68%Kimberly-Clark Corp. Consumer staples 17,623 2,073,930 1.49%Walt Disney Co. (The) Consumer discretionary 20,416 2,012,400 1.45%Automatic Data Processing, Inc. Information technology 18,296 2,000,143 1.44%TJX Cos., Inc. (The) Consumer discretionary 26,775 1,974,097 1.42%CBS Corp. Class B (non-voting shares) Consumer discretionary 33,587 1,948,048 1.40%Zoetis, Inc. Health care 30,310 1,932,582 1.39%Lowe’s Cos., Inc. Consumer discretionary 24,130 1,928,973 1.39%Sherwin-Williams Co. (The) Materials 5,317 1,903,754 1.37%Allstate Corp. (The) Financials 17,890 1,644,224 1.18%CVS Health Corp. Consumer staples 19,860 1,614,978 1.16%Juniper Networks, Inc. Information technology 58,027 1,614,891 1.16%Aflac, Inc. Financials 19,328 1,573,135 1.13%Alphabet, Inc. Class A Information technology 1,610 1,567,327 1.13%General Dynamics Corp. Industrials 7,182 1,476,516 1.06%Verizon Communications, Inc. Telecommunication
services29,669 1,468,322 1.06%
CME Group, Inc. Financials 10,678 1,448,846 1.04%Berkshire Hathaway, Inc. Class B Financials 7,900 1,448,216 1.04%Fidelity National Information Services, Inc.
Information technology 15,164 1,416,136 1.02%
Kinder Morgan, Inc. Energy 73,280 1,405,505 1.01%PG&E Corp. Utilities 20,261 1,379,559 0.99%F5 Networks, Inc. Information technology 11,277 1,359,535 0.98%Ross Stores, Inc. Consumer discretionary 20,583 1,329,027 0.96%Baker Hughes a GE Co. Energy 36,279 1,328,550 0.96%Marathon Petroleum Corp. Energy 22,283 1,249,642 0.90%Merck & Co., Inc. Health care 18,704 1,197,606 0.86%Sysco Corp. Consumer staples 22,050 1,189,585 0.86%Equity Residential Trust Real estate 17,595 1,160,029 0.83%Microsoft Corp. Information technology 15,051 1,121,128 0.81%Adobe Systems, Inc. Information technology 7,482 1,116,187 0.80%Harris Corp. Information technology 8,376 1,102,908 0.79%Edison International Utilities 14,205 1,096,199 0.79%
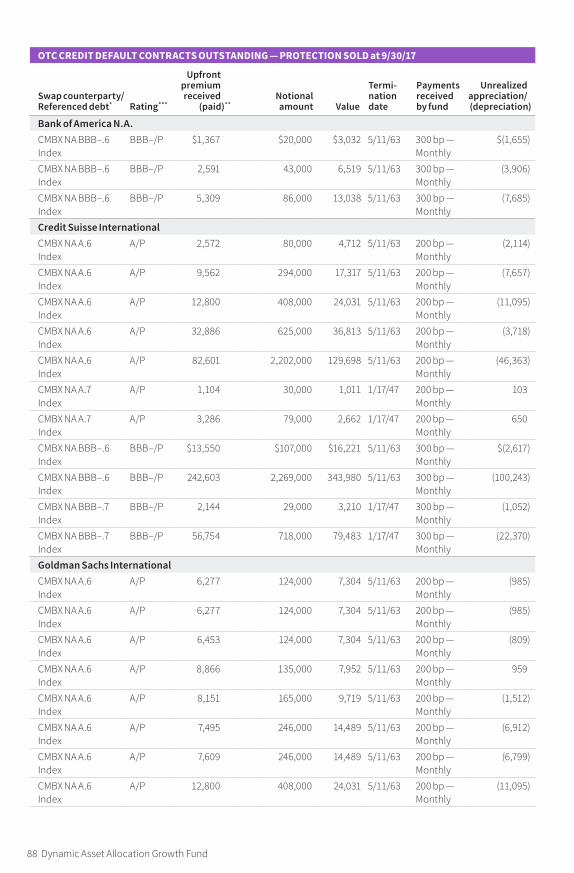
88 Dynamic Asset Allocation Growth Fund
OTC CREDIT DEFAULT CONTRACTS OUTSTANDING — PROTECTION SOLD at 9/30/17
Swap counterparty/ Referenced debt * Rating ***
Upfront premium received
(paid) ** Notional amount Value
Termi- nation date
Payments received by fund
Unrealized appreciation/ (depreciation)
Bank of America N.A.CMBX NA BBB–.6 Index
BBB–/P $1,367 $20,000 $3,032 5/11/63 300 bp — Monthly
$(1,655 )
CMBX NA BBB–.6 Index
BBB–/P 2,591 43,000 6,519 5/11/63 300 bp — Monthly
(3,906 )
CMBX NA BBB–.6 Index
BBB–/P 5,309 86,000 13,038 5/11/63 300 bp — Monthly
(7,685 )
Credit Suisse InternationalCMBX NA A.6 Index
A/P 2,572 80,000 4,712 5/11/63 200 bp — Monthly
(2,114 )
CMBX NA A.6 Index
A/P 9,562 294,000 17,317 5/11/63 200 bp — Monthly
(7,657 )
CMBX NA A.6 Index
A/P 12,800 408,000 24,031 5/11/63 200 bp — Monthly
(11,095 )
CMBX NA A.6 Index
A/P 32,886 625,000 36,813 5/11/63 200 bp — Monthly
(3,718 )
CMBX NA A.6 Index
A/P 82,601 2,202,000 129,698 5/11/63 200 bp — Monthly
(46,363 )
CMBX NA A.7 Index
A/P 1,104 30,000 1,011 1/17/47 200 bp — Monthly
103
CMBX NA A.7 Index
A/P 3,286 79,000 2,662 1/17/47 200 bp — Monthly
650
CMBX NA BBB–.6 Index
BBB–/P $13,550 $107,000 $16,221 5/11/63 300 bp — Monthly
$(2,617 )
CMBX NA BBB–.6 Index
BBB–/P 242,603 2,269,000 343,980 5/11/63 300 bp — Monthly
(100,243 )
CMBX NA BBB–.7 Index
BBB–/P 2,144 29,000 3,210 1/17/47 300 bp — Monthly
(1,052 )
CMBX NA BBB–.7 Index
BBB–/P 56,754 718,000 79,483 1/17/47 300 bp — Monthly
(22,370 )
Goldman Sachs InternationalCMBX NA A.6 Index
A/P 6,277 124,000 7,304 5/11/63 200 bp — Monthly
(985 )
CMBX NA A.6 Index
A/P 6,277 124,000 7,304 5/11/63 200 bp — Monthly
(985 )
CMBX NA A.6 Index
A/P 6,453 124,000 7,304 5/11/63 200 bp — Monthly
(809 )
CMBX NA A.6 Index
A/P 8,866 135,000 7,952 5/11/63 200 bp — Monthly
959
CMBX NA A.6 Index
A/P 8,151 165,000 9,719 5/11/63 200 bp — Monthly
(1,512 )
CMBX NA A.6 Index
A/P 7,495 246,000 14,489 5/11/63 200 bp — Monthly
(6,912 )
CMBX NA A.6 Index
A/P 7,609 246,000 14,489 5/11/63 200 bp — Monthly
(6,799 )
CMBX NA A.6 Index
A/P 12,800 408,000 24,031 5/11/63 200 bp — Monthly
(11,095 )

Dynamic Asset Allocation Growth Fund 89
OTC CREDIT DEFAULT CONTRACTS OUTSTANDING — PROTECTION SOLD at 9/30/17 cont.
Swap counterparty/ Referenced debt * Rating ***
Upfront premium received
(paid) ** Notional amount Value
Termi- nation date
Payments received by fund
Unrealized appreciation/ (depreciation)
Goldman Sachs International cont.CMBX NA A.6 Index
A/P $34,350 $570,000 $33,573 5/11/63 200 bp — Monthly
$967
CMBX NA A.6 Index
A/P 36,538 718,000 42,290 5/11/63 200 bp — Monthly
(5,513 )
CMBX NA A.7 Index
A/P 43,863 870,000 29,319 1/17/47 200 bp — Monthly
14,834
CMBX NA BBB–.6 Index
BBB–/P $2,769 35,000 5,306 5/11/63 300 bp — Monthly
(2,519 )
CMBX NA BBB–.6 Index
BBB–/P 4,006 37,000 5,609 5/11/63 300 bp — Monthly
(1,585 )
CMBX NA BBB–.6 Index
BBB–/P 4,769 70,000 10,612 5/11/63 300 bp — Monthly
(5,808 )
CMBX NA BBB–.6 Index
BBB–/P 3,651 70,000 10,612 5/11/63 300 bp — Monthly
(6,926 )
CMBX NA BBB–.6 Index
BBB–/P 8,158 74,000 11,218 5/11/63 300 bp — Monthly
(3,024 )
CMBX NA BBB–.6 Index
BBB–/P 7,764 92,000 13,947 5/11/63 300 bp — Monthly
(6,138 )
CMBX NA BBB–.6 Index
BBB–/P 11,477 136,000 20,618 5/11/63 300 bp — Monthly
(9,073 )
CMBX NA BBB–.6 Index
BBB–/P 12,435 144,000 21,830 5/11/63 300 bp — Monthly
(9,324 )
CMBX NA BBB–.6 Index
BBB–/P 11,950 247,000 37,445 5/11/63 300 bp — Monthly
(25,372 )
CMBX NA BBB–.6 Index
BBB–/P 31,899 262,000 39,719 5/11/63 300 bp — Monthly
(7,689 )
CMBX NA BBB–.6 Index
BBB–/P 67,247 717,000 108,697 5/11/63 300 bp — Monthly
(41,092 )
CMBX NA BBB–.6 Index
BBB–/P 65,023 865,000 131,134 5/11/63 300 bp — Monthly
(65,678 )
CMBX NA BBB–.7 Index
BBB–/P 42,688 542,000 59,999 1/17/47 300 bp — Monthly
(17,041 )
CMBX NA BBB–.7 Index
BBB–/P 1,603 23,000 2,546 1/17/47 300 bp — Monthly
(931 )
JPMorgan Securities LLCCMBX NA A.6 Index
A/P 15,040 243,000 14,313 5/11/63 200 bp — Monthly
808
CMBX NA A.6 Index
A/P 10,929 381,000 22,441 5/11/63 200 bp — Monthly
(11,385 )
CMBX NA A.6 Index
A/P 12,641 383,000 22,559 5/11/63 200 bp — Monthly
(9,790 )
CMBX NA A.6 Index
A/P 13,363 408,000 24,031 5/11/63 200 bp — Monthly
(10,532 )
CMBX NA A.6 Index
A/P 13,700 453,000 26,682 5/11/63 200 bp — Monthly
(12,830 )
CMBX NA A.6 Index
A/P 31,011 527,000 31,040 5/11/63 200 bp — Monthly
147

90 Dynamic Asset Allocation Growth Fund
OTC CREDIT DEFAULT CONTRACTS OUTSTANDING — PROTECTION SOLD at 9/30/17 cont.
Swap counterparty/ Referenced debt * Rating ***
Upfront premium received
(paid) ** Notional amount Value
Termi- nation date
Payments received by fund
Unrealized appreciation/ (depreciation)
JPMorgan Securities LLC cont.CMBX NA A.6 Index
A/P $16,858 $599,000 $35,281 5/11/63 200 bp — Monthly
$(18,223 )
CMBX NA A.6 Index
A/P 38,013 786,000 46,295 5/11/63 200 bp — Monthly
(8,020 )
CMBX NA A.6 Index
A/P 132,217 2,194,000 129,227 5/11/63 200 bp — Monthly
3,721
CMBX NA A.7 Index
A/P 13,857 316,000 10,649 1/17/47 200 bp — Monthly
3,314
CMBX NA BBB–.6 Index
BBB–/P 4,234 29,000 4,396 5/11/63 300 bp — Monthly
(148 )
CMBX NA BBB–.6 Index
BBB–/P 4,150 37,000 5,609 5/11/63 300 bp — Monthly
(1,441 )
CMBX NA BBB–.6 Index
BBB–/P 4,064 37,000 5,609 5/11/63 300 bp — Monthly
(1,527 )
CMBX NA BBB–.6 Index
BBB–/P 5,357 38,000 5,761 5/11/63 300 bp — Monthly
(385 )
CMBX NA BBB–.6 Index
BBB–/P 6,500 52,000 7,883 5/11/63 300 bp — Monthly
(1,357 )
CMBX NA BBB–.6 Index
BBB–/P 6,053 55,000 8,338 5/11/63 300 bp — Monthly
(2,257 )
CMBX NA BBB–.6 Index
BBB–/P 6,709 59,000 8,944 5/11/63 300 bp — Monthly
(2,206 )
CMBX NA BBB–.6 Index
BBB–/P 7,036 62,000 9,399 5/11/63 300 bp — Monthly
(2,332 )
CMBX NA BBB–.6 Index
BBB–/P 12,682 88,000 13,341 5/11/63 300 bp — Monthly
(615 )
CMBX NA BBB–.6 Index
BBB–/P 10,154 92,000 13,947 5/11/63 300 bp — Monthly
(3,747 )
CMBX NA BBB–.6 Index
BBB–/P 14,850 102,000 15,463 5/11/63 300 bp — Monthly
(562 )
CMBX NA BBB–.6 Index
BBB–/P 406,576 3,395,000 514,682 5/11/63 300 bp — Monthly
(106,409 )
Upfront premium received 1,709,241 Unrealized appreciation 25,503Upfront premium (paid) — Unrealized depreciation (641,051 )Total $1,709,241 Total $(615,548 )
* Payments related to the referenced debt are made upon a credit default event. ** Upfront premium is based on the difference between the original spread on issue and the market spread on day
of execution. *** Ratings for an underlying index represent the average of the ratings of all the securities included in that index. The
Moody’s, Standard & Poor’s or Fitch ratings are believed to be the most recent ratings available at September 30, 2017. Securities rated by Putnam are indicated by “/P.” The Putnam rating categories are comparable to the Standard & Poor’s classifications.

Dynamic Asset Allocation Growth Fund 91
OTC CREDIT DEFAULT CONTRACTS OUTSTANDING — PROTECTION PURCHASED at 9/30/17
Swap counterparty/ Referenced debt *
Upfront premium received
(paid) ** Notional amount Value
Termi- nation date
Payments (paid) by fund
Unrealized appreciation/ (depreciation)
Citigroup Global Markets, Inc.CMBX NA BB.7 Index $(8,638 ) $55,000 $10,736 1/17/47 (500 bp) —
Monthly$2,052
CMBX NA BB.7 Index (8,981 ) 55,000 10,736 1/17/47 (500 bp) — Monthly
1,709
Credit Suisse InternationalCMBX NA BB.7 Index (17,315 ) 981,000 238,285 5/11/63 (500 bp) —
Monthly220,152
CMBX NA BB.7 Index (84,053 ) 511,000 99,747 1/17/47 (500 bp) — Monthly
15,269
Goldman Sachs InternationalCMBX NA BB.6 Index (43,273 ) 423,000 $102,747 5/11/63 (500 bp) —
Monthly59,122
CMBX NA BB.7 Index (6,961 ) 46,000 8,979 1/17/47 (500 bp) — Monthly
1,980
CMBX NA BB.7 Index (86,296 ) 425,000 82,960 1/17/47 (500 bp) — Monthly
(3,690 )
CMBX NA BB.7 Index (16,548 ) 101,000 19,715 1/17/47 (500 bp) — Monthly
3,083
JPMorgan Securities LLCCMBX NA BB.6 Index (22,203 ) 167,000 40,564 5/11/63 (500 bp) —
Monthly18,222
CMBX NA BB.6 Index (12,657 ) 88,000 21,375 5/11/63 (500 bp) — Monthly
8,645
CMBX NA BB.6 Index (11,389 ) 81,000 19,675 5/11/63 (500 bp) — Monthly
8,219
CMBX NA BB.7 Index (91,245 ) 533,000 104,042 1/17/47 (500 bp) — Monthly
12,352
CMBX NA BB.7 Index (21,925 ) 135,000 26,352 1/17/47 (500 bp) — Monthly
4,315
CMBX NA BB.7 Index (16,593 ) 106,000 20,691 1/17/47 (500 bp) — Monthly
4,010
CMBX NA BB.7 Index (8,638 ) 55,000 10,736 1/17/47 (500 bp) — Monthly
2,050
CMBX NA BBB–.7 Index (3,236 ) 29,000 3,210 1/17/47 (300 bp) — Monthly
(40 )
CMBX NA BBB–.7 Index (1,004 ) 9,000 996 1/17/47 (300 bp) — Monthly
(13 )
Upfront premium received — Unrealized appreciation 361,180Upfront premium (paid) (460,955 ) Unrealized depreciation (3,743 )Total $(460,955 ) Total $357,437
* Payments related to the referenced debt are made upon a credit default event. ** Upfront premium is based on the difference between the original spread on issue and the market spread on day
of execution.

92 Dynamic Asset Allocation Growth Fund
CENTRALLY CLEARED CREDIT DEFAULT CONTRACTS OUTSTANDING — PROTECTION SOLD at 9/30/17
Referenced debt * Rating ***
Upfront premium received
(paid) ** Notional amount Value
Termi- nation date
Payments received by fund
Unrealized appreciation
NA HY Series 29 Index
B+/P $(1,852,271 ) $25,071,000 $1,963,511 12/20/22 500 bp — Quarterly
$121,686
NA IG Series 28 Index
BBB+/P (890,131 ) 54,500,000 1,154,528 6/20/22 100 bp — Quarterly
281,051
Total $(2,742,402 ) $402,737
* Payments related to the referenced debt are made upon a credit default event. ** Upfront premium is based on the difference between the original spread on issue and the market spread on day
of execution. *** Ratings are presented for credit default contracts in which the fund has sold protection on the underlying referenced
debt. Ratings for an underlying index represent the average of the ratings of all the securities included in that index. The Moody’s, Standard & Poor’s or Fitch ratings are believed to be the most recent ratings available at September 30, 2017. Securities rated by Putnam are indicated by “/P.” The Putnam rating categories are comparable to the Standard & Poor’s classifications.
CENTRALLY CLEARED CREDIT DEFAULT CONTRACTS OUTSTANDING — PROTECTION PURCHASED at 9/30/17
Referenced debt *
Upfront premium received
(paid) ** Notional amount Value
Termi- nation date
Payments (paid) by fund
Unrealized depreciation
NA HY Series 29 Index
$4,174,184 $56,028,000 $4,388,001 12/20/22 (500 bp) — Quarterly
$(229,381 )
Total $4,174,184 $(229,381 )
* Payments related to the referenced debt are made upon a credit default event. ** Upfront premium is based on the difference between the original spread on issue and the market spread on day
of execution.

Dynamic Asset Allocation Growth Fund 93
ASC 820 establishes a three-level hierarchy for disclosure of fair value measurements. The valuation hierarchy is based upon the transparency of inputs to the valuation of the fund’s investments. The three levels are defined as follows:
Level 1: Valuations based on quoted prices for identical securities in active markets.Level 2: Valuations based on quoted prices in markets that are not active or for which all significant inputs are observable, either directly or indirectly.Level 3: Valuations based on inputs that are unobservable and significant to the fair value measurement.
The following is a summary of the inputs used to value the fund’s net assets as of the close of the reporting period:
Valuation inputsInvestments in securities: Level 1 Level 2 Level 3
Common stocks * :Basic materials $50,733,047 $28,266,909 $— Capital goods 104,330,655 8,571,442 — Communication services 44,500,006 13,178,228 986Conglomerates 10,499,622 4,415,963 — Consumer cyclicals 227,686,611 24,039,423 4Consumer staples 158,013,522 21,656,674 224,892Energy 88,447,499 2,982,451 7,209Financials 304,584,788 74,778,621 — Health care 214,677,642 9,627,517 — Technology 307,305,889 39,355,891 — Transportation 44,805,554 12,348,748 — Utilities and power 62,214,161 5,869,339 —
Total common stocks 1,617,798,996 245,091,206 233,091
Asset-backed securities — 953,000 —
Convertible bonds and notes — 257,559 —
Convertible preferred stocks — 245,128 —
Corporate bonds and notes — 317,090,305 26
Foreign government and agency bonds and notes — 9,100,132 —
Investment companies 205,344 — —
Mortgage-backed securities — 58,379,573 —
Preferred stocks 177,408 — —
Purchased options outstanding — 302,965 —
Senior loans — 2,563,794 —
U.S. government and agency mortgage obligations — 146,985,132 —
U.S. treasury obligations — 266,213 —
Warrants 1,288 4,976,070 —
Short-term investments 235,054,630 231,305,829 — Totals by level $1,853,237,666 $1,017,516,906 $233,117
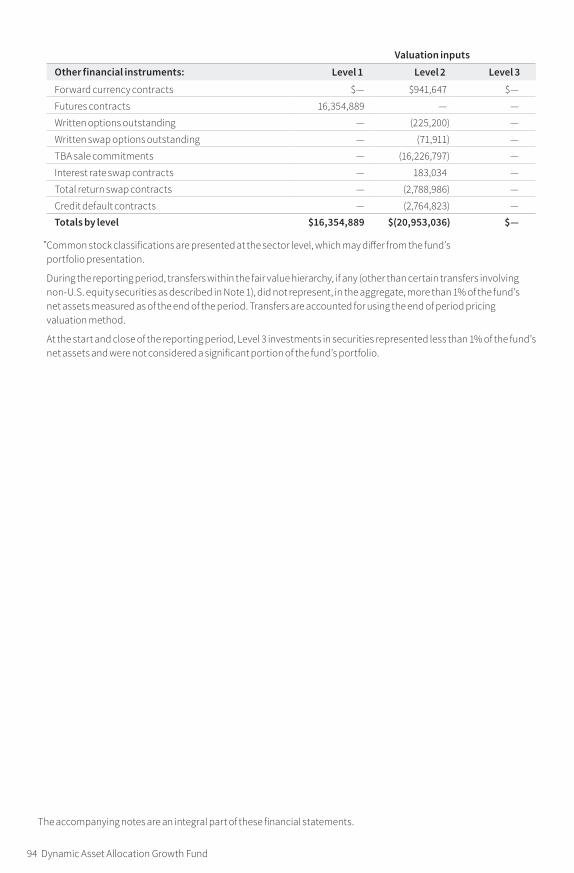
94 Dynamic Asset Allocation Growth Fund
The accompanying notes are an integral part of these financial statements.
Valuation inputsOther financial instruments: Level 1 Level 2 Level 3
Forward currency contracts $— $941,647 $—
Futures contracts 16,354,889 — —
Written options outstanding — (225,200 ) —
Written swap options outstanding — (71,911 ) —
TBA sale commitments — (16,226,797 ) —
Interest rate swap contracts — 183,034 —
Total return swap contracts — (2,788,986 ) —
Credit default contracts — (2,764,823 ) — Totals by level $16,354,889 $(20,953,036 ) $—
* Common stock classifications are presented at the sector level, which may differ from the fund’s portfolio presentation .
During the reporting period, transfers within the fair value hierarchy, if any (other than certain transfers involving non-U.S. equity securities as described in Note 1 ), did not represent, in the aggregate, more than 1% of the fund’s net assets measured as of the end of the period. Transfers are accounted for using the end of period pricing valuation method.
At the start and close of the reporting period, Level 3 investments in securities represented less than 1% of the fund’s net assets and were not considered a significant portion of the fund’s portfolio.

Statement of assets and liabilities 9/30/17
ASSETSInvestment in securities, at value, including $30,658,786 of securities on loan (Notes 1 and 5):
Unaffiliated issuers (identified cost $2,310,983,828) $2,605,276,457 Affiliated issuers (identified cost $265,711,232) (Notes 1 and 6) 265,711,232
Foreign currency (cost $1,476,329) (Note 1) 1,467,104 Dividends, interest and other receivables 8,006,755 Receivable for shares of the fund sold 7,561,999 Receivable for investments sold 11,483,438 Receivable for sales of delayed delivery securities (Note 1) 13,772,750 Receivable for variation margin on futures contracts (Note 1) 950,461 Receivable for variation margin on centrally cleared swap contracts (Note 1) 994,321 Unrealized appreciation on forward currency contracts (Note 1) 3,205,639 Unrealized appreciation on OTC swap contracts (Note 1) 1,339,944 Premium paid on OTC swap contracts (Note 1) 460,955 Prepaid assets 44,434 Total assets 2,920,275,489
LIABILITIESPayable to custodian 107,634 Payable for investments purchased 6,094,189 Payable for purchases of delayed delivery securities (Note 1) 36,924,305 Payable for shares of the fund repurchased 23,826,754 Payable for compensation of Manager (Note 2) 1,355,311 Payable for custodian fees (Note 2) 112,292 Payable for investor servicing fees (Note 2) 603,291 Payable for Trustee compensation and expenses (Note 2) 524,731 Payable for administrative services (Note 2) 11,404 Payable for distribution fees (Note 2) 1,335,484 Payable for variation margin on futures contracts (Note 1) 154,283 Payable for variation margin on centrally cleared swap contracts (Note 1) 1,067,402 Unrealized depreciation on OTC swap contracts (Note 1) 4,387,041 Premium received on OTC swap contracts (Note 1) 1,709,241 Unrealized depreciation on forward currency contracts (Note 1) 2,263,992 Written options outstanding, at value (premiums $939,112) (Note 1) 297,111 TBA sale commitments, at value (proceeds receivable $16,265,430) (Note 1) 16,226,797 Collateral on securities loaned, at value (Note 1) 31,273,602 Collateral on certain derivative contracts, at value (Notes 1 and 5) 883,213 Other accrued expenses 438,498 Total liabilities 129,596,575
Net assets $2,790,678,914
(Continued on next page)
Dynamic Asset Allocation Growth Fund 95

The accompanying notes are an integral part of these financial statements.
Statement of assets and liabilities cont.
REPRESENTED BYPaid-in capital (Unlimited shares authorized) (Notes 1 and 4) $2,261,571,468 Undistributed net investment income (Note 1) 45,280,330 Accumulated net realized gain on investments and foreign currency transactions (Note 1) 174,378,111 Net unrealized appreciation of investments and assets and liabilities in foreign currencies 309,449,005 Total — Representing net assets applicable to capital shares outstanding $2,790,678,914
COMPUTATION OF NET ASSET VALUE AND OFFERING PRICENet asset value and redemption price per class A share ($1,586,679,456 divided by 88,993,314 shares) $17.83 Offering price per class A share (100/94.25 of $17.83)* $18.92 Net asset value and offering price per class B share ($71,515,433 divided by 4,116,008 shares)** $17.37 Net asset value and offering price per class C share ($288,335,444 divided by 17,184,652 shares)** $16.78 Net asset value and redemption price per class M share ($33,775,208 divided by 1,942,853 shares) $17.38 Offering price per class M share (100/96.50 of $17.38)* $18.01 Net asset value, offering price and redemption price per class P share ($247,816,897 divided by 13,713,157 shares) $18.07 Net asset value, offering price and redemption price per class R share ($31,962,712 divided by 1,831,745 shares) $17.45 Net asset value, offering price and redemption price per class R5 share ($2,228,250 divided by 123,540 shares) $18.04 Net asset value, offering price and redemption price per class R6 share ($232,495,202 divided by 12,866,738 shares) $18.07 Net asset value, offering price and redemption price per class Y share ($295,870,312 divided by 16,407,890 shares) $18.03
*On single retail sales of less than $50,000. On sales of $50,000 or more the offering price is reduced.**Redemption price per share is equal to net asset value less any applicable contingent deferred sales charge.
96 Dynamic Asset Allocation Growth Fund

The accompanying notes are an integral part of these financial statements.
Statement of operations Year ended 9/30/17
INVESTMENT INCOMEDividends (net of foreign tax of $1,417,925) $40,611,523 Interest (net of foreign tax of $1,653 ) (including interest income of $2,032,391 from investments in affiliated issuers) (Note 6) 23,716,354 Securities lending (net of expenses) (Notes 1 and 6) 144,718 Total investment income 64,472,595
EXPENSESCompensation of Manager (Note 2) 15,384,214 Investor servicing fees (Note 2) 3,869,403 Custodian fees (Note 2) 365,318 Trustee compensation and expenses (Note 2) 153,059 Distribution fees (Note 2) 7,589,447 Administrative services (Note 2) 78,182 Other 983,777 Total expenses 28,423,400
Expense reduction (Note 2) (91,478)Net expenses 28,331,922
Net investment income 36,140,673
Net realized gain on securities from unaffiliated issuers (net of foreign tax of $310,279) (Notes 1 and 3) 113,020,803 Net realized gain on forward currency contracts (Note 1) 4,218,251 Net realized loss on foreign currency transactions (Note 1) (237,218)Net realized gain on swap contracts (Note 1) 11,055,178 Net realized gain on futures contracts (Note 1) 83,004,054 Net realized loss on written options (Note 1) (651,023)Net unrealized appreciation of securities in unaffiliated issuers, when-issued securities, and TBA sale commitments during the year 156,646,977Net unrealized depreciation of forward currency contracts during the year (908,363)Net unrealized appreciation of assets and liabilities in foreign currencies during the year 41,856 Net unrealized depreciation of swap contracts during the year (4,989,255)Net unrealized appreciation of futures contracts during the year 6,265,718 Net unrealized appreciation of written options during the year 325,194 Net gain on investments 367,792,172
Net increase in net assets resulting from operations $403,932,845
Dynamic Asset Allocation Growth Fund 97
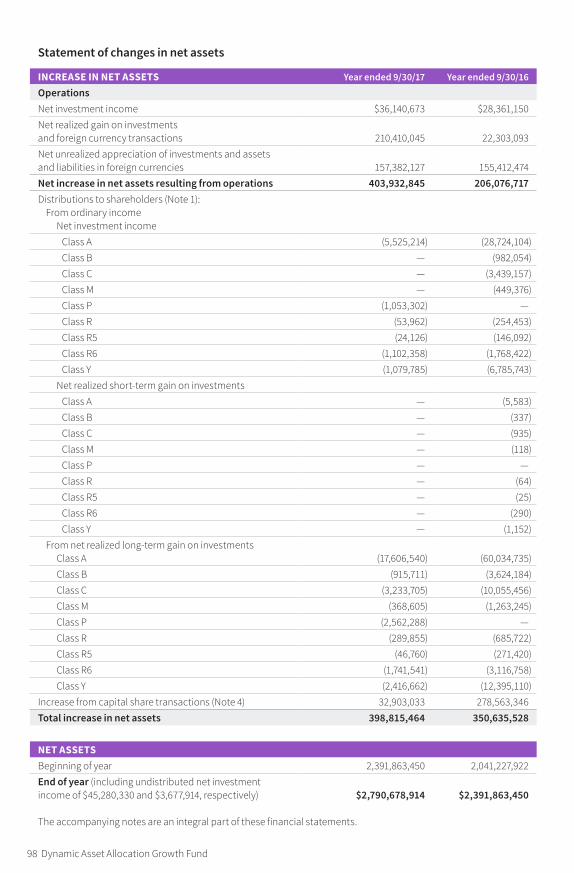
The accompanying notes are an integral part of these financial statements.
Statement of changes in net assets
INCREASE IN NET ASSETS Year ended 9/30/17 Year ended 9/30/16OperationsNet investment income $36,140,673 $28,361,150 Net realized gain on investments and foreign currency transactions 210,410,045 22,303,093 Net unrealized appreciation of investments and assets and liabilities in foreign currencies 157,382,127 155,412,474 Net increase in net assets resulting from operations 403,932,845 206,076,717 Distributions to shareholders (Note 1):
From ordinary incomeNet investment income
Class A (5,525,214) (28,724,104)Class B — (982,054)Class C — (3,439,157)Class M — (449,376)Class P (1,053,302) — Class R (53,962) (254,453)Class R5 (24,126) (146,092)Class R6 (1,102,358) (1,768,422)Class Y (1,079,785) (6,785,743)
Net realized short-term gain on investmentsClass A — (5,583)Class B — (337)Class C — (935)Class M — (118)Class P — — Class R — (64)Class R5 — (25)Class R6 — (290)Class Y — (1,152)
From net realized long-term gain on investmentsClass A (17,606,540) (60,034,735)Class B (915,711) (3,624,184)Class C (3,233,705) (10,055,456)Class M (368,605) (1,263,245)Class P (2,562,288) — Class R (289,855) (685,722)Class R5 (46,760) (271,420)Class R6 (1,741,541) (3,116,758)Class Y (2,416,662) (12,395,110)
Increase from capital share transactions (Note 4) 32,903,033 278,563,346 Total increase in net assets 398,815,464 350,635,528
NET ASSETSBeginning of year 2,391,863,450 2,041,227,922End of year (including undistributed net investment income of $45,280,330 and $3,677,914, respectively) $2,790,678,914 $2,391,863,450
98 Dynamic Asset Allocation Growth Fund

Dynamic Asset Allocation Growth Fund 99
This page left blank intentionally.

Fund _FundCode, — NumbCols Columns — This section modified: 10/20/17 12:22:56 PM Fund _FundCode, — NumbCols Columns — This section modified: 10/20/17 12:22:56 PM
Dynamic Asset Allocation Growth Fund 101 100 Dynamic Asset Allocation Growth Fund
The accompanying notes are an integral part of these financial statements.
See notes to financial highlights at the end of this section.
Financial highlights (For a common share outstanding throughout the period)
INVESTMENT OPERATIONS LESS DISTRIBUTIONS RATIOS AND SUPPLEMENTAL DATA
Period ended
Net asset value,
beginning of period
Net investment income (loss ) a
Net realized and unrealized
gain (loss) on investments
Total from investment operations
From net investment income
From net realized gain on investments
Total dis tri bu tions
Net asset value, end of period
Total return at net asset value (% ) b
Net assets, end of period
(in thousands )
Ratio of expenses to average
net assets (% ) c
Ratio of net investment
income (loss) to average
net assets (% )
Portfolio turnover
(% )
Class A September 30, 2017 $15.50 .23 2.35 2.58 (.06 ) (.19 ) (.25 ) $17.83 16.84 $1,586,679 1.08 1.41 124 e
September 30, 2016 15.05 .20 1.21 1.41 (.31 ) (.65 ) (.96 ) 15.50 9.73 1,482,617 1.08 d 1.32 d 216 e
September 30, 2015 17.58 .17 (.29 ) (.12 ) (.34 ) (2.07 ) (2.41 ) 15.05 (1.26 ) 1,385,646 1.05 1.05 196 e
September 30, 2014 15.60 .21 2.00 2.21 (.23 ) — (.23 ) 17.58 14.29 1,362,485 1.06 1.21 188 e
September 30, 2013 13.47 .20 2.09 2.29 (.16 ) — (.16 ) 15.60 17.17 1,215,701 1.09 1.38 111 f
Class B September 30, 2017 $15.17 .10 2.29 2.39 — (.19 ) (.19 ) $17.37 15.90 $71,515 1.83 .63 124 e
September 30, 2016 14.72 .08 1.20 1.28 (.18 ) (.65 ) (.83 ) 15.17 8.95 77,832 1.83 d .56 d 216 e
September 30, 2015 17.22 .05 (.29 ) (.24 ) (.19 ) (2.07 ) (2.26 ) 14.72 (2.02 ) 84,801 1.80 .28 196 e
September 30, 2014 15.28 .08 1.97 2.05 (.11 ) — (.11 ) 17.22 13.45 107,877 1.81 .45 188 e
September 30, 2013 13.19 .09 2.05 2.14 (.05 ) — (.05 ) 15.28 16.28 118,464 1.84 .63 111 f
Class C September 30, 2017 $14.65 .10 2.22 2.32 — (.19 ) (.19 ) $16.78 15.99 $288,335 1.83 .66 124 e
September 30, 2016 14.30 .08 1.14 1.22 (.22 ) (.65 ) (.87 ) 14.65 8.85 253,401 1.83 d .58 d 216 e
September 30, 2015 16.82 .05 (.27 ) (.22 ) (.23 ) (2.07 ) (2.30 ) 14.30 (1.99 ) 209,239 1.80 .30 196 e
September 30, 2014 14.94 .07 1.94 2.01 (.13 ) — (.13 ) 16.82 13.49 168,304 1.81 .46 188 e
September 30, 2013 12.91 .09 2.00 2.09 (.06 ) — (.06 ) 14.94 16.28 144,081 1.84 .62 111 f
Class M September 30, 2017 $15.14 .15 2.28 2.43 — (.19 ) (.19 ) $17.38 16.20 $33,775 1.58 .91 124 e
September 30, 2016 14.72 .12 1.18 1.30 (.23 ) (.65 ) (.88 ) 15.14 9.15 29,745 1.58 d .82 d 216 e
September 30, 2015 17.23 .09 (.28 ) (.19 ) (.25 ) (2.07 ) (2.32 ) 14.72 (1.71 ) 28,800 1.55 .54 196 e
September 30, 2014 15.30 .12 1.97 2.09 (.16 ) — (.16 ) 17.23 13.71 30,005 1.56 .71 188 e
September 30, 2013 13.21 .12 2.06 2.18 (.09 ) — (.09 ) 15.30 16.59 27,200 1.59 .88 111 f
Class P September 30, 2017 $15.66 .31 2.37 2.68 (.08 ) (.19 ) (.27 ) $18.07 17.32 $247,817 .67 1.85 124 e
September 30, 2016 † 15.60 .02 .04 .06 — — — 15.66 .38 * 198,605 .06 * .14 * 216 d
Class R September 30, 2017 $15.19 .19 2.30 2.49 (.04 ) (.19 ) (.23 ) $17.45 16.54 $31,963 1.33 1.18 124 e
September 30, 2016 14.74 .16 1.18 1.34 (.24 ) (.65 ) (.89 ) 15.19 9.42 23,273 1.33 d 1.09 d 216 e
September 30, 2015 17.28 .13 (.28 ) (.15 ) (.32 ) (2.07 ) (2.39 ) 14.74 (1.50 ) 12,375 1.30 .80 196 e
September 30, 2014 15.33 .16 1.98 2.14 (.19 ) — (.19 ) 17.28 14.06 19,617 1.31 .96 188 e
September 30, 2013 13.24 .16 2.06 2.22 (.13 ) — (.13 ) 15.33 16.89 16,026 1.34 1.13 111 f
Class R5 September 30, 2017 $15.67 .24 2.42 2.66 (.10 ) (.19 ) (.29 ) $18.04 17.19 $2,228 .81 1.46 124 e
September 30, 2016 15.21 .23 1.23 1.46 (.35 ) (.65 ) (1.00 ) 15.67 9.98 4,112 .81 d 1.53 d 216 e
September 30, 2015 17.74 .22 (.29 ) (.07 ) (.39 ) (2.07 ) (2.46 ) 15.21 (1.00 ) 7,051 .80 1.31 196 e
September 30, 2014 15.76 .26 2.02 2.28 (.30 ) — (.30 ) 17.74 14.59 6,434 .81 1.51 188 e
September 30, 2013 13.58 .23 2.12 2.35 (.17 ) — (.17 ) 15.76 17.50 64 .82 1.52 111 f

Fund _FundCode, — NumbCols Columns — This section modified: 10/20/17 12:22:56 PM Fund _FundCode, — NumbCols Columns — This section modified: 10/20/17 12:22:56 PM
Dynamic Asset Allocation Growth Fund 103 102 Dynamic Asset Allocation Growth Fund
Financial highlights cont.
The accompanying notes are an integral part of these financial statements.
* Not annualized.
† For the period August 31, 2016 (commencement of operations) to September 30, 2016. a Per share net investment income (loss) has been determined on the basis of the weighted average number of shares
outstanding during the period. b Total return assumes dividend reinvestment and does not reflect the effect of sales charges. c Includes amounts paid through expense offset and brokerage/service arrangements, if any (Note 2). Also excludes
acquired fund fees, if any. d Reflects a voluntary waiver of certain fund expenses in effect during the period. As a result of such waiver, the
expenses of each class reflect a reduction of less than 0.01% as a percentage of average net assets. e Portfolio turnover includes TBA purchase and sale commitments. f Portfolio turnover excludes TBA purchase and sale commitments. Including TBA purchase and sale commitments to
conform with current year presentation, the portfolio turnover would have been the following:
Portfolio turnover %September 30, 2013 208%
INVESTMENT OPERATIONS LESS DISTRIBUTIONS RATIOS AND SUPPLEMENTAL DATA
Period ended
Net asset value,
beginning of period
Net investment income (loss ) a
Net realized and unrealized
gain (loss) on investments
Total from investment operations
From net investment income
From net realized gain on investments
Total dis tri bu tions
Net asset value, end of period
Total return at net asset value (% ) b
Net assets, end of period
(in thousands )
Ratio of expenses to average
net assets (% ) c
Ratio of net investment
income (loss) to average
net assets (% )
Portfolio turnover
(% )
Class R6 September 30, 2017 $15.71 .31 2.36 2.67 (.12 ) (.19 ) (.31 ) $18.07 17.25 $232,495 .71 1.85 124 e
September 30, 2016 15.24 .26 1.23 1.49 (.37 ) (.65 ) (1.02 ) 15.71 10.16 135,367 .71 d 1.72 d 216 e
September 30, 2015 17.78 .23 (.30 ) (.07 ) (.40 ) (2.07 ) (2.47 ) 15.24 (.94 ) 59,064 .70 1.42 196 e
September 30, 2014 15.77 .27 2.03 2.30 (.29 ) — (.29 ) 17.78 14.74 31,438 .71 1.56 188 e
September 30, 2013 13.58 .25 2.12 2.37 (.18 ) — (.18 ) 15.77 17.62 24,534 .72 1.62 111 f
Class Y September 30, 2017 $15.66 .28 2.36 2.64 (.08 ) (.19 ) (.27 ) $18.03 17.11 $295,870 .83 1.70 124 e
September 30, 2016 15.21 .24 1.22 1.46 (.36 ) (.65 ) (1.01 ) 15.66 9.95 186,911 .83 d 1.59 d 216 e
September 30, 2015 17.74 .22 (.29 ) (.07 ) (.39 ) (2.07 ) (2.46 ) 15.21 (.96 ) 254,253 .80 1.31 196 e
September 30, 2014 15.73 .25 2.02 2.27 (.26 ) — (.26 ) 17.74 14.59 146,825 .81 1.46 188 e
September 30, 2013 13.58 .24 2.10 2.34 (.19 ) — (.19 ) 15.73 17.47 125,570 .84 1.65 111 f
104 Dynamic Asset Allocation Growth Fund
Notes to financial statements 9/30/17
Within the following Notes to financial statements, references to “State Street” represent State Street Bank and Trust Company, references to “the SEC” represent the Securities and Exchange Commission, references to “Putnam Management” represent Putnam Investment Management, LLC, the fund’s manager, an indirect wholly-owned subsidiary of Putnam Investments, LLC and references to “OTC”, if any, represent over-the-counter. Unless otherwise noted, the “reporting period” represents the period from October 1, 2016 through September 30, 2017.
Putnam Dynamic Asset Allocation Growth Fund (the fund) is a diversified series of Putnam Asset Allocation Funds (the Trust), a Massachusetts business trust registered under the Investment Company Act of 1940, as amended, as an open-end management investment company. The goal of the fund is to seek capital appreciation. The fund is one of three Putnam Dynamic Asset Allocation Funds, each of which has a unique strategic, or typical, allocation between equity and fixed-income investments. Using qualitative analysis and quantitative techniques, Putnam Management adjusts portfolio allocations from time to time within a certain range to try to optimize the fund’s performance consistent with its goal. The fund invests mainly in equity securities (growth or value stocks or both) of both U.S. and foreign companies of any size. Putnam Management may consider, among other factors, a company’s valuation, financial strength, growth potential, competitive position in its industry, projected future earnings, cash flows and dividends when deciding whether to buy or sell equity investments. The fund also invests, to a lesser extent, in fixed-income investments, including U.S. and foreign government obligations, corpo-rate obligations and securitized debt instruments (such as mortgage-backed investments). Putnam Manage-ment may consider, among other factors, credit, interest rate and prepayment risks, as well as general market conditions, when deciding whether to buy or sell fixed-income investments. Putnam Management may also select other investments that do not fall within these asset classes. The fund typically uses to a significant extent derivatives, such as futures, options, certain foreign currency transactions, warrants and swap contracts, for both hedging and non-hedging purposes.
The fund offers class A, class B, class C, class M, class P, class R, class R5, class R6 and class Y shares. The fund registered class T shares in February 2017, however, as of the date of this report, class T shares had not commenced operations and are not available for purchase. Effective April 1, 2017, purchases of class B shares are closed to new and existing investors except by exchange from class B shares of another Putnam fund or through dividend and/or capital gains reinvestment. Class A and class M shares are sold with a maximum front-end sales charge of 5.75% and 3.50%, respectively. Class A shares generally are not subject to a contingent deferred sales charge, and class M, class P, class R, class R5, class R6 and class Y shares are not subject to a contingent deferred sales charge. Class B shares, which convert to class A shares after approximately eight years, are not subject to a front-end sales charge and are subject to a contingent deferred sales charge if those shares are redeemed within six years of purchase. Class C shares are subject to a one-year 1.00% contingent deferred sales charge and do not convert to class A shares. Class R shares, which are not available to all investors, are sold at net asset value. The expenses for class A, class B, class C, class M and class R shares may differ based on the distribution fee of each class, which is identified in Note 2. Class P, class R5, class R6 and class Y shares, which are sold at net asset value, are generally subject to the same expenses as class A, class B, class C, class M and class R shares, but do not bear a distribution fee and in the case of class P, class R5 and class R6 shares, bear a lower investor servicing fee, which is identified in Note 2. Class P shares are only available to other Putnam funds and other accounts managed by Putnam Management or its affiliates. Class R5, class R6 and class Y shares are not available to all investors.
In the normal course of business, the fund enters into contracts that may include agreements to indemnify another party under given circumstances. The fund’s maximum exposure under these arrangements is unknown as this would involve future claims that may be, but have not yet been, made against the fund. However, the fund’s management team expects the risk of material loss to be remote.
The fund has entered into contractual arrangements with an investment adviser, administrator, distributor, share-holder servicing agent and custodian, who each provide services to the fund. Unless expressly stated otherwise, shareholders are not parties to, or intended beneficiaries of these contractual arrangements, and these contrac-tual arrangements are not intended to create any shareholder right to enforce them against the service providers or to seek any remedy under them against the service providers, either directly or on behalf of the fund.
Under the fund’s Declaration of Trust, any claims asserted against or on behalf of the Putnam Funds, including claims against Trustees and Officers, must be brought in state and federal courts located within the Commonwealth of Massachusetts.

Dynamic Asset Allocation Growth Fund 105
Note 1: Significant accounting policiesThe following is a summary of significant accounting policies consistently followed by the fund in the preparation of its financial statements. The preparation of financial statements is in conformity with accounting principles generally accepted in the United States of America and requires management to make estimates and assump-tions that affect the reported amounts of assets and liabilities in the financial statements and the reported amounts of increases and decreases in net assets from operations. Actual results could differ from those esti-mates. Subsequent events after the Statement of assets and liabilities date through the date that the financial statements were issued have been evaluated in the preparation of the financial statements.
Investment income, realized and unrealized gains and losses and expenses of the fund are borne pro-rata based on the relative net assets of each class to the total net assets of the fund, except that each class bears expenses unique to that class (including the distribution fees applicable to such classes). Each class votes as a class only with respect to its own distribution plan or other matters on which a class vote is required by law or determined by the Trustees. If the fund were liquidated, shares of each class would receive their pro-rata share of the net assets of the fund. In addition, the Trustees declare separate dividends on each class of shares.
Security valuation Portfolio securities and other investments are valued using policies and procedures adopted by the Board of Trustees. The Trustees have formed a Pricing Committee to oversee the implementation of these procedures and have delegated responsibility for valuing the fund’s assets in accordance with these procedures to Putnam Management. Putnam Management has established an internal Valuation Committee that is respon-sible for making fair value determinations, evaluating the effectiveness of the pricing policies of the fund and reporting to the Pricing Committee.
Investments for which market quotations are readily available are valued at the last reported sales price on their principal exchange, or official closing price for certain markets, and are classified as Level 1 securities under Accounting Standards Codification 820 Fair Value Measurements and Disclosures (ASC 820). If no sales are reported, as in the case of some securities that are traded OTC, a security is valued at its last reported bid price and is generally categorized as a Level 2 security.
Investments in open-end investment companies (excluding exchange-traded funds), if any, which can be classi-fied as Level 1 or Level 2 securities, are valued based on their net asset value. The net asset value of such invest-ment companies equals the total value of their assets less their liabilities and divided by the number of their outstanding shares.
Market quotations are not considered to be readily available for certain debt obligations (including short-term investments with remaining maturities of 60 days or less) and other investments; such investments are valued on the basis of valuations furnished by an independent pricing service approved by the Trustees or dealers selected by Putnam Management. Such services or dealers determine valuations for normal institutional-size trading units of such securities using methods based on market transactions for comparable securities and various relation-ships, generally recognized by institutional traders, between securities (which consider such factors as security prices, yields, maturities and ratings). These securities will generally be categorized as Level 2.
Many securities markets and exchanges outside the U.S. close prior to the scheduled close of the New York Stock Exchange and therefore the closing prices for securities in such markets or on such exchanges may not fully reflect events that occur after such close but before the scheduled close of the New York Stock Exchange. Accord-ingly, on certain days, the fund will fair value certain foreign equity securities taking into account multiple factors including movements in the U.S. securities markets, currency valuations and comparisons to the valuation of American Depository Receipts, exchange-traded funds and futures contracts. The foreign equity securities, which would generally be classified as Level 1 securities, will be transferred to Level 2 of the fair value hierarchy when they are valued at fair value. The number of days on which fair value prices will be used will depend on market activity and it is possible that fair value prices will be used by the fund to a significant extent. At the close of the reporting period, fair value pricing was used for certain foreign securities in the portfolio. Securities quoted in foreign currencies, if any, are translated into U.S. dollars at the current exchange rate.
To the extent a pricing service or dealer is unable to value a security or provides a valuation that Putnam Manage-ment does not believe accurately reflects the security’s fair value, the security will be valued at fair value by Putnam Management in accordance with policies and procedures approved by the Trustees. Certain investments, including certain restricted and illiquid securities and derivatives, are also valued at fair value following procedures approved by the Trustees. These valuations consider such factors as significant market or specific security events such as interest rate or credit quality changes, various relationships with other securities, discount rates, U.S. Treasury, U.S. swap and credit yields, index levels, convexity exposures, recovery rates, sales and other multiples and resale restrictions. These securities are classified as Level 2 or as Level 3 depending on the priority of the significant inputs.

106 Dynamic Asset Allocation Growth Fund
To assess the continuing appropriateness of fair valuations, the Valuation Committee reviews and affirms the reasonableness of such valuations on a regular basis after considering all relevant information that is reasonably available. Such valuations and procedures are reviewed periodically by the Trustees. Certain securities may be valued on the basis of a price provided by a single source. The fair value of securities is generally determined as the amount that the fund could reasonably expect to realize from an orderly disposition of such securities over a reasonable period of time. By its nature, a fair value price is a good faith estimate of the value of a security in a current sale and does not reflect an actual market price, which may be different by a material amount.
Joint trading account Pursuant to an exemptive order from the SEC, the fund may transfer uninvested cash balances into a joint trading account along with the cash of other registered investment companies and certain other accounts managed by Putnam Management. These balances may be invested in issues of short-term investments having maturities of up to 90 days.
Repurchase agreements The fund, or any joint trading account, through its custodian, receives delivery of the underlying securities, the fair value of which at the time of purchase is required to be in an amount at least equal to the resale price, including accrued interest. Collateral for certain tri-party repurchase agreements, which totaled $102,658,470 is held at the counterparty’s custodian in a segregated account for the benefit of the fund and the counterparty. Putnam Management is responsible for determining that the value of these underlying securities is at all times at least equal to the resale price, including accrued interest. In the event of default or bankruptcy by the other party to the agreement, retention of the collateral may be subject to legal proceedings.
Security transactions and related investment income Security transactions are recorded on the trade date (the date the order to buy or sell is executed). Gains or losses on securities sold are determined on the identified cost basis.
Interest income, net of any applicable withholding taxes, is recorded on the accrual basis. Dividend income, net of any applicable withholding taxes, is recognized on the ex-dividend date except that certain dividends from foreign securities, if any, are recognized as soon as the fund is informed of the ex-dividend date. Non-cash divi-dends, if any, are recorded at the fair value of the securities received. Dividends representing a return of capital or capital gains, if any, are reflected as a reduction of cost and/or as a realized gain.
All premiums/discounts are amortized/accreted on a yield-to-maturity basis.
The fund earned certain fees in connection with its senior loan purchasing activities. These fees are treated as market discount and are amortized into income in the Statement of operations.
Securities purchased or sold on a when-issued or forward commitment or delayed delivery basis may be settled at a future date beyond customary settlement time; interest income is accrued based on the terms of the securi-ties. Losses may arise due to changes in the fair value of the underlying securities or if the counterparty does not perform under the contract.
Stripped securities The fund may invest in stripped securities which represent a participation in securities that may be structured in classes with rights to receive different portions of the interest and principal. Interest-only securities receive all of the interest and principal-only securities receive all of the principal. If the interest-only securities experience greater than anticipated prepayments of principal, the fund may fail to recoup fully its initial investment in these securities. Conversely, principal-only securities increase in value if prepayments are greater than anticipated and decline if prepayments are slower than anticipated. The fair value of these securities is highly sensitive to changes in interest rates.
Foreign currency translation The accounting records of the fund are maintained in U.S. dollars. The fair value of foreign securities, currency holdings, and other assets and liabilities is recorded in the books and records of the fund after translation to U.S. dollars based on the exchange rates on that day. The cost of each security is deter-mined using historical exchange rates. Income and withholding taxes are translated at prevailing exchange rates when earned or incurred. The fund does not isolate that portion of realized or unrealized gains or losses resulting from changes in the foreign exchange rate on investments from fluctuations arising from changes in the market prices of the securities. Such gains and losses are included with the net realized and unrealized gain or loss on investments. Net realized gains and losses on foreign currency transactions represent net realized exchange gains or losses on disposition of foreign currencies, currency gains and losses realized between the trade and settlement dates on securities transactions and the difference between the amount of investment income and foreign withholding taxes recorded on the fund’s books and the U.S. dollar equivalent amounts actually received or paid. Net unrealized appreciation and depreciation of assets and liabilities in foreign currencies arise from changes in the value of assets and liabilities other than investments at the period end, resulting from changes in the exchange rate.

Dynamic Asset Allocation Growth Fund 107
Options contracts The fund uses options contracts to hedge duration and convexity, to isolate prepayment risk, to gain exposure to interest rates, to hedge against changes in values of securities it owns, owned or expects to own, to hedge prepayment risk, to generate additional income for the portfolio, to enhance returns on securities owned, to enhance the return on a security owned, to gain exposure to securities and to manage downside risks.
The potential risk to the fund is that the change in value of options contracts may not correspond to the change in value of the hedged instruments. In addition, losses may arise from changes in the value of the underlying instru-ments if there is an illiquid secondary market for the contracts, if interest or exchange rates move unexpectedly or if the counterparty to the contract is unable to perform. Realized gains and losses on purchased options are included in realized gains and losses on investment securities. If a written call option is exercised, the premium originally received is recorded as an addition to sales proceeds. If a written put option is exercised, the premium originally received is recorded as a reduction to the cost of investments.
Exchange-traded options are valued at the last sale price or, if no sales are reported, the last bid price for purchased options and the last ask price for written options. OTC traded options are valued using prices supplied by dealers.
Options on swaps are similar to options on securities except that the premium paid or received is to buy or grant the right to enter into a previously agreed upon interest rate or credit default contract. Forward premium swap option contracts include premiums that have extended settlement dates. The delayed settlement of the premiums is factored into the daily valuation of the option contracts. In the case of interest rate cap and floor contracts, in return for a premium, ongoing payments between two parties are based on interest rates exceeding a specified rate, in the case of a cap contract, or falling below a specified rate in the case of a floor contract.
Written option contracts outstanding at period end, if any, are listed after the fund’s portfolio.
Futures contracts The fund uses futures contracts to manage exposure to market risk, to hedge prepayment risk, to hedge interest rate risk, to gain exposure to interest rates, and to equitize cash.
The potential risk to the fund is that the change in value of futures contracts may not correspond to the change in value of the hedged instruments. In addition, losses may arise from changes in the value of the underlying instru-ments, if there is an illiquid secondary market for the contracts, if interest or exchange rates move unexpectedly or if the counterparty to the contract is unable to perform. With futures, there is minimal counterparty credit risk to the fund since futures are exchange traded and the exchange’s clearinghouse, as counterparty to all exchange traded futures, guarantees the futures against default. Risks may exceed amounts recognized on the State-ment of assets and liabilities. When the contract is closed, the fund records a realized gain or loss equal to the difference between the value of the contract at the time it was opened and the value at the time it was closed.
Futures contracts are valued at the quoted daily settlement prices established by the exchange on which they trade. The fund and the broker agree to exchange an amount of cash equal to the daily fluctuation in the value of the futures contract. Such receipts or payments are known as “variation margin.”
Futures contracts outstanding at period end, if any, are listed after the fund’s portfolio.
Forward currency contracts The fund buys and sells forward currency contracts, which are agreements between two parties to buy and sell currencies at a set price on a future date. These contracts are used to hedge foreign exchange risk, and to gain exposure to currencies.
The U.S. dollar value of forward currency contracts is determined using current forward currency exchange rates supplied by a quotation service. The fair value of the contract will fluctuate with changes in currency exchange rates. The contract is marked to market daily and the change in fair value is recorded as an unrealized gain or loss. The fund records a realized gain or loss equal to the difference between the value of the contract at the time it was opened and the value at the time it was closed when the contract matures or by delivery of the currency. The fund could be exposed to risk if the value of the currency changes unfavorably, if the counterparties to the contracts are unable to meet the terms of their contracts or if the fund is unable to enter into a closing position. Risks may exceed amounts recognized on the Statement of assets and liabilities.
Forward currency contracts outstanding at period end, if any, are listed after the fund’s portfolio.
Interest rate swap contracts The fund entered into OTC and/or centrally cleared interest rate swap contracts, which are arrangements between two parties to exchange cash flows based on a notional principal amount, to hedge interest rate risk, to gain exposure on interest rates, and to hedge prepayment risk.
An OTC and centrally cleared interest rate swap can be purchased or sold with an upfront premium. For OTC interest rate swap contracts, an upfront payment received by the fund is recorded as a liability on the fund’s

108 Dynamic Asset Allocation Growth Fund
books. An upfront payment made by the fund is recorded as an asset on the fund’s books. OTC and centrally cleared interest rate swap contracts are marked to market daily based upon quotations from an independent pricing service or market makers. Any change is recorded as an unrealized gain or loss on OTC interest rate swaps. Daily fluctuations in the value of centrally cleared interest rate swaps are settled through a central clearing agent and are recorded in variation margin on the Statement of assets and liabilities and recorded as unrealized gain or loss. Payments, including upfront premiums, received or made are recorded as realized gains or losses at the reset date or the closing of the contract. Certain OTC and centrally cleared interest rate swap contracts may include extended effective dates. Payments related to these swap contracts are accrued based on the terms of the contract.
The fund could be exposed to credit or market risk due to unfavorable changes in the fluctuation of interest rates or if the counterparty defaults, in the case of OTC interest rate contracts, or the central clearing agency or a clearing member defaults, in the case of centrally cleared interest rate swap contracts, on its respective obliga-tion to perform under the contract. The fund’s maximum risk of loss from counterparty risk or central clearing risk is the fair value of the contract. This risk may be mitigated for OTC interest rate swap contracts by having a master netting arrangement between the fund and the counterparty and for centrally cleared interest rate swap contracts through the daily exchange of variation margin. There is minimal counterparty risk with respect to centrally cleared interest rate swap contracts due to the clearinghouse guarantee fund and other resources that are available in the event of a clearing member default. Risk of loss may exceed amounts recognized on the Statement of assets and liabilities.
OTC and centrally cleared interest rate swap contracts outstanding, including their respective notional amounts at period end, if any, are listed after the fund’s portfolio.
Total return swap contracts The fund entered into OTC and/or centrally cleared total return swap contracts, which are arrangements to exchange a market-linked return for a periodic payment, both based on a notional principal amount, to hedge sector exposure, to manage exposure to specific sectors or industries, to manage exposure to specific securities, to gain exposure to a basket of securities, to gain exposure to specific markets or countries, and to gain exposure to specific sectors or industries.
To the extent that the total return of the security, index or other financial measure underlying the transaction exceeds or falls short of the offsetting interest rate obligation, the fund will receive a payment from or make a payment to the counterparty. OTC and/or centrally cleared total return swap contracts are marked to market daily based upon quotations from an independent pricing service or market maker. Any change is recorded as an unrealized gain or loss on OTC total return swaps. Daily fluctuations in the value of centrally cleared total return swaps are settled through a central clearing agent and are recorded in variation margin on the Statement of assets and liabilities and recorded as unrealized gain or loss. Payments received or made are recorded as realized gains or losses. Certain OTC and/or centrally cleared total return swap contracts may include extended effec-tive dates. Payments related to these swap contracts are accrued based on the terms of the contract. The fund could be exposed to credit or market risk due to unfavorable changes in the fluctuation of interest rates or in the price of the underlying security or index, the possibility that there is no liquid market for these agreements or that the counterparty may default on its obligation to perform. The fund’s maximum risk of loss from counterparty risk or central clearing risk is the fair value of the contract. This risk may be mitigated for OTC total return swap contracts by having a master netting arrangement between the fund and the counterparty and for centrally cleared total return swap contracts through the daily exchange of variation margin. There is minimal counterparty risk with respect to centrally cleared total return swap contracts due to the clearinghouse guarantee fund and other resources that are available in the event of a clearing member default. Risk of loss may exceed amounts recognized on the Statement of assets and liabilities.
OTC and/or centrally cleared total return swap contracts outstanding, including their respective notional amounts at period end, if any, are listed after the fund’s portfolio.
Credit default contracts The fund entered into OTC and/or centrally cleared credit default contracts to hedge credit risk, to hedge market risk, and to gain exposure on individual names and/or baskets of securities.
In OTC and centrally cleared credit default contracts, the protection buyer typically makes a periodic stream of payments to a counterparty, the protection seller, in exchange for the right to receive a contingent payment upon the occurrence of a credit event on the reference obligation or all other equally ranked obligations of the reference entity. Credit events are contract specific but may include bankruptcy, failure to pay, restructuring and obligation acceleration. For OTC credit default contracts, an upfront payment received by the fund is recorded as a liability on the fund’s books. An upfront payment made by the fund is recorded as an asset on the fund’s books. Centrally cleared credit default contracts provide the same rights to the protection buyer and seller except the
Dynamic Asset Allocation Growth Fund 109
payments between parties, including upfront premiums, are settled through a central clearing agent through variation margin payments. Upfront and periodic payments received or paid by the fund for OTC and centrally cleared credit default contracts are recorded as realized gains or losses at the reset date or close of the contract. The OTC and centrally cleared credit default contracts are marked to market daily based upon quotations from an independent pricing service or market makers. Any change in value of OTC credit default contracts is recorded as an unrealized gain or loss. Daily fluctuations in the value of centrally cleared credit default contracts are recorded in variation margin on the Statement of assets and liabilities and recorded as unrealized gain or loss. Upon the occurrence of a credit event, the difference between the par value and fair value of the reference obligation, net of any proportional amount of the upfront payment, is recorded as a realized gain or loss.
In addition to bearing the risk that the credit event will occur, the fund could be exposed to market risk due to unfavorable changes in interest rates or in the price of the underlying security or index or the possibility that the fund may be unable to close out its position at the same time or at the same price as if it had purchased the underlying reference obligations. In certain circumstances, the fund may enter into offsetting OTC and centrally cleared credit default contracts which would mitigate its risk of loss. Risks of loss may exceed amounts recog-nized on the Statement of assets and liabilities. The fund’s maximum risk of loss from counterparty risk, either as the protection seller or as the protection buyer, is the fair value of the contract. This risk may be mitigated for OTC credit default contracts by having a master netting arrangement between the fund and the counterparty and for centrally cleared credit default contracts through the daily exchange of variation margin. Counterparty risk is further mitigated with respect to centrally cleared credit default swap contracts due to the clearinghouse guarantee fund and other resources that are available in the event of a clearing member default. Where the fund is a seller of protection, the maximum potential amount of future payments the fund may be required to make is equal to the notional amount.
OTC and centrally cleared credit default contracts outstanding, including their respective notional amounts at period end, if any, are listed after the fund’s portfolio.
TBA commitments The fund may enter into TBA (to be announced) commitments to purchase securities for a fixed unit price at a future date beyond customary settlement time. Although the unit price and par amount have been established, the actual securities have not been specified. However, it is anticipated that the amount of the commitments will not significantly differ from the principal amount. The fund holds, and maintains until settle-ment date, cash or high-grade debt obligations in an amount sufficient to meet the purchase price, or the fund may enter into offsetting contracts for the forward sale of other securities it owns. Income on the securities will not be earned until settlement date.
The fund may also enter into TBA sale commitments to hedge its portfolio positions, to sell mortgage-backed securities it owns under delayed delivery arrangements or to take a short position in mortgage-backed securi-ties. Proceeds of TBA sale commitments are not received until the contractual settlement date. During the time a TBA sale commitment is outstanding, either equivalent deliverable securities or an offsetting TBA purchase commitment deliverable on or before the sale commitment date are held as “cover” for the transaction, or other liquid assets in an amount equal to the notional value of the TBA sale commitment are segregated. If the TBA sale commitment is closed through the acquisition of an offsetting TBA purchase commitment, the fund realizes a gain or loss. If the fund delivers securities under the commitment, the fund realizes a gain or a loss from the sale of the securities based upon the unit price established at the date the commitment was entered into.
TBA commitments, which are accounted for as purchase and sale transactions, may be considered securities themselves, and involve a risk of loss due to changes in the value of the security prior to the settlement date as well as the risk that the counterparty to the transaction will not perform its obligations. Counterparty risk is mitigated by having a master agreement between the fund and the counterparty.
Unsettled TBA commitments are valued at their fair value according to the procedures described under “Security valuation” above. The contract is marked to market daily and the change in fair value is recorded by the fund as an unrealized gain or loss. Based on market circumstances, Putnam Management will determine whether to take delivery of the underlying securities or to dispose of the TBA commitments prior to settlement.
TBA purchase commitments outstanding at period end, if any, are listed within the fund’s portfolio and TBA sale commitments outstanding at period end, if any, are listed after the fund’s portfolio.
Master agreements The fund is a party to ISDA (International Swaps and Derivatives Association, Inc.) Master Agreements that govern OTC derivative and foreign exchange contracts and Master Securities Forward Transac-tion Agreements that govern transactions involving mortgage-backed and other asset-backed securities that may result in delayed delivery (Master Agreements) with certain counterparties entered into from time to time.

110 Dynamic Asset Allocation Growth Fund
The Master Agreements may contain provisions regarding, among other things, the parties’ general obligations, representations, agreements, collateral requirements, events of default and early termination. With respect to certain counterparties, in accordance with the terms of the Master Agreements, collateral posted to the fund is held in a segregated account by the fund’s custodian and, with respect to those amounts which can be sold or repledged, are presented in the fund’s portfolio. Collateral posted to the fund which cannot be sold or repledged totaled $238,096 at the close of the reporting period.
Collateral pledged by the fund is segregated by the fund’s custodian and identified in the fund’s portfolio. Collat-eral can be in the form of cash or debt securities issued by the U.S. Government or related agencies or other secu-rities as agreed to by the fund and the applicable counterparty. Collateral requirements are determined based on the fund’s net position with each counterparty.
With respect to ISDA Master Agreements, termination events applicable to the fund may occur upon a decline in the fund’s net assets below a specified threshold over a certain period of time. Termination events applicable to counterparties may occur upon a decline in the counterparty’s long-term or short-term credit ratings below a specified level. In each case, upon occurrence, the other party may elect to terminate early and cause settle-ment of all derivative and foreign exchange contracts outstanding, including the payment of any losses and costs resulting from such early termination, as reasonably determined by the terminating party. Any decision by one or more of the fund’s counterparties to elect early termination could impact the fund’s future derivative activity.
At the close of the reporting period, the fund had a net liability position of $4,410,189 on open derivative contracts subject to the Master Agreements. Collateral posted by the fund at period end for these agreements totaled $4,504,430 and may include amounts related to unsettled agreements.
Securities lending The fund may lend securities, through its agent, to qualified borrowers in order to earn addi-tional income. The loans are collateralized by cash in an amount at least equal to the fair value of the securities loaned. The fair value of securities loaned is determined daily and any additional required collateral is allocated to the fund on the next business day. The remaining maturities of the securities lending transactions are consid-ered overnight and continuous. The risk of borrower default will be borne by the fund’s agent; the fund will bear the risk of loss with respect to the investment of the cash collateral. Income from securities lending, net of expenses, is included in investment income on the Statement of operations. Cash collateral is invested in Putnam Cash Collateral Pool, LLC, a limited liability company managed by an affiliate of Putnam Management. Invest-ments in Putnam Cash Collateral Pool, LLC are valued at its closing net asset value each business day. There are no management fees charged to Putnam Cash Collateral Pool, LLC. At the close of the reporting period, the fund received cash collateral of $31,273,602 and the value of securities loaned amounted to $30,658,786.
Interfund lending The fund, along with other Putnam funds, may participate in an interfund lending program pursuant to an exemptive order issued by the SEC. This program allows the fund to borrow from or lend to other Putnam funds that permit such transactions. Interfund lending transactions are subject to each fund’s investment policies and borrowing and lending limits. Interest earned or paid on the interfund lending transac-tion will be based on the average of certain current market rates. During the reporting period, the fund did not utilize the program.
Lines of credit The fund participates, along with other Putnam funds, in a $317.5 million unsecured committed line of credit and a $235.5 million unsecured uncommitted line of credit, both provided by State Street. Borrow-ings may be made for temporary or emergency purposes, including the funding of shareholder redemption requests and trade settlements. Interest is charged to the fund based on the fund’s borrowing at a rate equal to 1.25% plus the higher of (1) the Federal Funds rate and (2) the overnight LIBOR for the committed line of credit and the Federal Funds rate plus 1.30% for the uncommitted line of credit. A closing fee equal to 0.04% of the committed line of credit plus a $25,000 flat fee and 0.04% of the uncommitted line of credit has been paid by the participating funds. In addition, a commitment fee of 0.21% per annum on any unutilized portion of the committed line of credit is allocated to the participating funds based on their relative net assets and paid quarterly. During the reporting period, the fund had no borrowings against these arrangements.
Federal taxes It is the policy of the fund to distribute all of its taxable income within the prescribed time period and otherwise comply with the provisions of the Internal Revenue Code of 1986, as amended (the Code), appli-cable to regulated investment companies. It is also the intention of the fund to distribute an amount sufficient to avoid imposition of any excise tax under Section 4982 of the Code.
The fund is subject to the provisions of Accounting Standards Codification 740 Income Taxes (ASC 740). ASC 740 sets forth a minimum threshold for financial statement recognition of the benefit of a tax position taken or expected to be taken in a tax return. The fund did not have a liability to record for any unrecognized tax benefits

Dynamic Asset Allocation Growth Fund 111
in the accompanying financial statements. No provision has been made for federal taxes on income, capital gains or unrealized appreciation on securities held nor for excise tax on income and capital gains. Each of the fund’s federal tax returns for the prior three fiscal years remains subject to examination by the Internal Revenue Service.
The fund may also be subject to taxes imposed by governments of countries in which it invests. Such taxes are generally based on either income or gains earned or repatriated. The fund accrues and applies such taxes to net investment income, net realized gains and net unrealized gains as income and/or capital gains are earned. In some cases, the fund may be entitled to reclaim all or a portion of such taxes, and such reclaim amounts, if any, are reflected as an asset on the fund’s books. In many cases, however, the fund may not receive such amounts for an extended period of time, depending on the country of investment.
Distributions to shareholders Distributions to shareholders from net investment income are recorded by the fund on the ex-dividend date. Distributions from capital gains, if any, are recorded on the ex-dividend date and paid at least annually. The amount and character of income and gains to be distributed are determined in accordance with income tax regulations, which may differ from generally accepted accounting principles. These differences include temporary and/or permanent differences from losses on wash sale transactions, from foreign currency gains and losses, from unrealized gains and losses on certain futures contracts, from realized gains and losses on certain futures contracts, from unrealized gains and losses on passive foreign investment compa-nies, from income on swap contracts, and from interest-only securities. Reclassifications are made to the fund’s capital accounts to reflect income and gains available for distribution (or available capital loss carryovers) under income tax regulations. At the close of the reporting period, the fund reclassified $14,300,490 to increase undis-tributed net investment income, $941 to decrease paid-in capital and $14,299,549 to decrease accumulated net realized gain.
Tax cost of investments includes adjustments to net unrealized appreciation (depreciation) which may not neces-sarily be final tax cost basis adjustments, but closely approximate the tax basis unrealized gains and losses that may be realized and distributed to shareholders. The tax basis components of distributable earnings and the federal tax cost as of the close of the reporting period were as follows:
Unrealized appreciation $344,839,332
Unrealized depreciation (57,377,531 )
Net unrealized appreciation 287,461,801
Undistributed ordinary income 43,945,262
Undistributed long-term gain 118,002,434
Undistributed short-term gain 79,770,276
Cost for federal income tax purposes $2,578,898,640
Expenses of the Trust Expenses directly charged or attributable to any fund will be paid from the assets of that fund. Generally, expenses of the Trust will be allocated among and charged to the assets of each fund on a basis that the Trustees deem fair and equitable, which may be based on the relative assets of each fund or the nature of the services performed and relative applicability to each fund.
Note 2: Management fee, administrative services and other transactionsThe fund pays Putnam Management a management fee (based on the fund’s average net assets and computed and paid monthly) at annual rates that may vary based on the average of the aggregate net assets of all open-end mutual funds sponsored by Putnam Management (excluding net assets of funds that are invested in, or that are invested in by, other Putnam funds to the extent necessary to avoid “double counting” of those assets). Such annual rates may vary as follows:
0.750 % of the first $5 billion,
0.700 % of the next $5 billion,
0.650 % of the next $10 billion,
0.600 % of the next $10 billion,
0.550 % of the next $50 billion,
0.530 % of the next $50 billion,
0.520 % of the next $100 billion and
0.515 % of any excess thereafter.

112 Dynamic Asset Allocation Growth Fund
For the reporting period, the management fee represented an effective rate (excluding the impact from any expense waivers in effect) of 0.595% of the fund’s average net assets.
Putnam Management has contractually agreed, through January 30, 2019, to waive fees or reimburse the fund’s expenses to the extent necessary to limit the cumulative expenses of the fund, exclusive of brokerage, interest, taxes, investment-related expenses, extraordinary expenses, acquired fund fees and expenses and payments under the fund’s investor servicing contract, investment management contract and distribution plans, on a fiscal year-to-date basis to an annual rate of 0.20% of the fund’s average net assets over such fiscal year-to-date period. During the reporting period, the fund’s expenses were not reduced as a result of this limit.
Putnam Investments Limited (PIL), an affiliate of Putnam Management, is authorized by the Trustees to manage a separate portion of the assets of the fund as determined by Putnam Management from time to time. PIL did not manage any portion of the assets of the fund during the reporting period. If Putnam Management were to engage the services of PIL, Putnam Management would pay a quarterly sub-management fee to PIL for its services at an annual rate of 0.35% of the average net assets of the portion of the fund managed by PIL.
The Putnam Advisory Company, LLC (PAC), an affiliate of Putnam Management, is authorized by the Trustees to manage a separate portion of the assets of the fund, as designated from time to time by Putnam Management or PIL. PAC did not manage any portion of the assets of the fund during the reporting period. If Putnam Management or PIL were to engage the services of PAC, Putnam Management or PIL, as applicable, would pay a quarterly sub-advisory fee to PAC for its services at the annual rate of 0.35% of the average net assets of the portion of the fund’s assets for which PAC is engaged as sub-adviser.
The fund reimburses Putnam Management an allocated amount for the compensation and related expenses of certain officers of the fund and their staff who provide administrative services to the fund. The aggregate amount of all such reimbursements is determined annually by the Trustees.
Custodial functions for the fund’s assets are provided by State Street. Custody fees are based on the fund’s asset level, the number of its security holdings and transaction volumes.
Putnam Investor Services, Inc., an affiliate of Putnam Management, provides investor servicing agent functions to the fund. Putnam Investor Services, Inc. received fees for investor servicing for class A, class B, class C, class M, class R, and class Y shares that included (1) a per account fee for each direct and underlying non-defined contribu-tion account (“retail account”) of the fund; (2) a specified rate of the fund’s assets attributable to defined contribu-tion plan accounts; and (3) a specified rate based on the average net assets in retail accounts. Putnam Investor Services, Inc. has agreed that the aggregate investor servicing fees for each fund’s retail and defined contribution accounts for these share classes will not exceed an annual rate of 0.25% of the fund’s average assets attributable to such accounts.
Class P shares paid a monthly fee based on the average net assets of class P shares at an annual rate of 0.01%.
Class R5 shares paid a monthly fee based on the average net assets of class R5 shares at an annual rate of 0.15%.
Class R6 shares paid a monthly fee based on the average net assets of class R6 shares at an annual rate of 0.05%.
During the reporting period, the expenses for each class of shares related to investor servicing fees were as follows:
Class A $2,636,540
Class B 128,935
Class C 464,602
Class M 54,583
Class P 23,696
Class R 45,560
Class R5 4,456
Class R6 89,628
Class Y 421,403
Total $3,869,403
The fund has entered into expense offset arrangements with Putnam Investor Services, Inc. and State Street whereby Putnam Investor Services, Inc.’s and State Street’s fees are reduced by credits allowed on cash balances. The fund also reduced expenses through brokerage/service arrangements. For the reporting period, the fund’s expenses were reduced by $4,348 under the expense offset arrangements and by $87,130 under the brokerage/service arrangements.
Each Independent Trustee of the fund receives an annual Trustee fee, of which $1,994, as a quarterly retainer, has been allocated to the fund, and an additional fee for each Trustees meeting attended. Trustees also are reimbursed for expenses they incur relating to their services as Trustees.

Dynamic Asset Allocation Growth Fund 113
The fund has adopted a Trustee Fee Deferral Plan (the Deferral Plan) which allows the Trustees to defer the receipt of all or a portion of Trustees fees payable on or after July 1, 1995. The deferred fees remain invested in certain Putnam funds until distribution in accordance with the Deferral Plan.
The fund has adopted an unfunded noncontributory defined benefit pension plan (the Pension Plan) covering all Trustees of the fund who have served as a Trustee for at least five years and were first elected prior to 2004. Benefits under the Pension Plan are equal to 50% of the Trustee’s average annual attendance and retainer fees for the three years ended December 31, 2005. The retirement benefit is payable during a Trustee’s lifetime, beginning the year following retirement, for the number of years of service through December 31, 2006. Pension expense for the fund is included in Trustee compensation and expenses in the Statement of operations. Accrued pension liability is included in Payable for Trustee compensation and expenses in the Statement of assets and liabilities. The Trustees have terminated the Pension Plan with respect to any Trustee first elected after 2003.
The fund has adopted distribution plans (the Plans) with respect to the following share classes pursuant to Rule 12b–1 under the Investment Company Act of 1940. The purpose of the Plans is to compensate Putnam Retail Management Limited Partnership, an indirect wholly-owned subsidiary of Putnam Investments, LLC, for services provided and expenses incurred in distributing shares of the fund. The Plans provide payments by the fund to Putnam Retail Management Limited Partnership at an annual rate of up to the following amounts (“Maximum %”) of the average net assets attributable to each class. The Trustees have approved payment by the fund at the following annual rate (“Approved %”) of the average net assets attributable to each class. During the reporting period, the class-specific expenses related to distribution fees were as follows:
Maximum % Approved % Amount
Class A 0.35 % 0.25 % $3,799,808
Class B 1.00 % 1.00 % 741,900
Class C 1.00 % 1.00 % 2,680,017
Class M 1.00 % 0.75 % 236,114
Class R 1.00 % 0.50 % 131,608
Total $7,589,447
For the reporting period, Putnam Retail Management Limited Partnership, acting as underwriter, received net commissions of $335,944 and $6,650 from the sale of class A and class M shares, respectively, and received $32,933 and $11,017 in contingent deferred sales charges from redemptions of class B and class C shares, respectively.
A deferred sales charge of up to 1.00% is assessed on certain redemptions of class A shares. For the reporting period, Putnam Retail Management Limited Partnership, acting as underwriter, received $797 on class A redemptions.
Note 3: Purchases and sales of securitiesDuring the reporting period, the cost of purchases and the proceeds from sales, excluding short-term investments, were as follows:
Cost of purchases Proceeds from sales
Investments in securities, including TBA commitments (Long-term ) $2,834,319,163 $2,602,957,905
U.S. government securities (Long-term ) — —
Total $2,834,319,163 $2,602,957,905
The fund may purchase or sell investments from or to other Putnam funds in the ordinary course of business, which can reduce the fund’s transaction costs, at prices determined in accordance with SEC requirements and policies approved by the Trustees. During the reporting period, purchases or sales of long-term securities from or to other Putnam funds, if any, did not represent more than 5% of the fund’s total cost of purchases and/or total proceeds from sales.
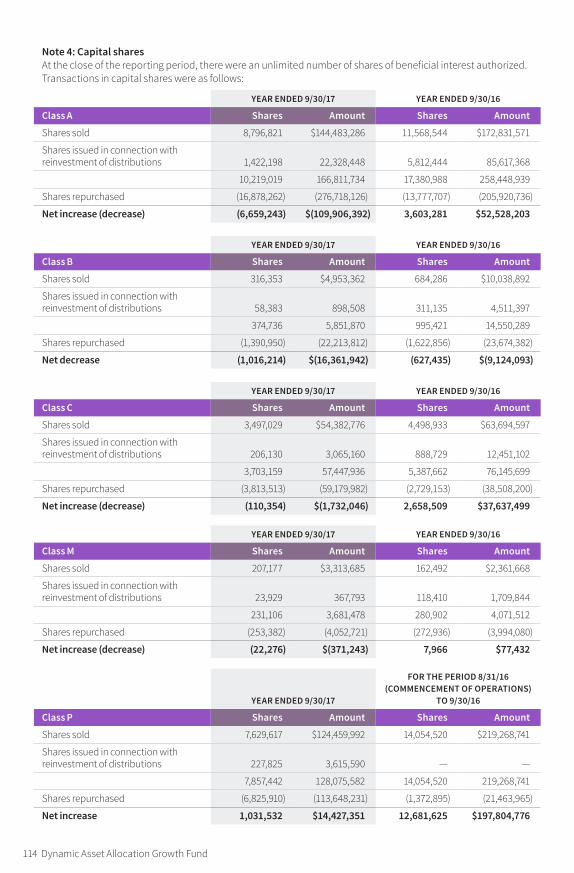
114 Dynamic Asset Allocation Growth Fund
Note 4: Capital sharesAt the close of the reporting period, there were an unlimited number of shares of beneficial interest authorized. Transactions in capital shares were as follows:
YEAR ENDED 9/30/17 YEAR ENDED 9/30/16
Class A Shares Amount Shares Amount
Shares sold 8,796,821 $144,483,286 11,568,544 $172,831,571
Shares issued in connection with reinvestment of distributions 1,422,198 22,328,448 5,812,444 85,617,368
10,219,019 166,811,734 17,380,988 258,448,939
Shares repurchased (16,878,262 ) (276,718,126 ) (13,777,707 ) (205,920,736 )
Net increase (decrease ) (6,659,243 ) $(109,906,392 ) 3,603,281 $52,528,203
YEAR ENDED 9/30/17 YEAR ENDED 9/30/16
Class B Shares Amount Shares Amount
Shares sold 316,353 $4,953,362 684,286 $10,038,892
Shares issued in connection with reinvestment of distributions 58,383 898,508 311,135 4,511,397
374,736 5,851,870 995,421 14,550,289
Shares repurchased (1,390,950 ) (22,213,812 ) (1,622,856 ) (23,674,382 )
Net decrease (1,016,214 ) $(16,361,942 ) (627,435 ) $(9,124,093 )
YEAR ENDED 9/30/17 YEAR ENDED 9/30/16
Class C Shares Amount Shares Amount
Shares sold 3,497,029 $54,382,776 4,498,933 $63,694,597
Shares issued in connection with reinvestment of distributions 206,130 3,065,160 888,729 12,451,102
3,703,159 57,447,936 5,387,662 76,145,699
Shares repurchased (3,813,513 ) (59,179,982 ) (2,729,153 ) (38,508,200 )
Net increase (decrease ) (110,354 ) $(1,732,046 ) 2,658,509 $37,637,499
YEAR ENDED 9/30/17 YEAR ENDED 9/30/16
Class M Shares Amount Shares Amount
Shares sold 207,177 $3,313,685 162,492 $2,361,668
Shares issued in connection with reinvestment of distributions 23,929 367,793 118,410 1,709,844
231,106 3,681,478 280,902 4,071,512
Shares repurchased (253,382 ) (4,052,721 ) (272,936 ) (3,994,080 )
Net increase (decrease ) (22,276 ) $(371,243 ) 7,966 $77,432
YEAR ENDED 9/30/17
FOR THE PERIOD 8/31/16 (COMMENCEMENT OF OPERATIONS)
TO 9/30/16
Class P Shares Amount Shares Amount
Shares sold 7,629,617 $124,459,992 14,054,520 $219,268,741
Shares issued in connection with reinvestment of distributions 227,825 3,615,590 — —
7,857,442 128,075,582 14,054,520 219,268,741
Shares repurchased (6,825,910 ) (113,648,231 ) (1,372,895 ) (21,463,965 )
Net increase 1,031,532 $14,427,351 12,681,625 $197,804,776
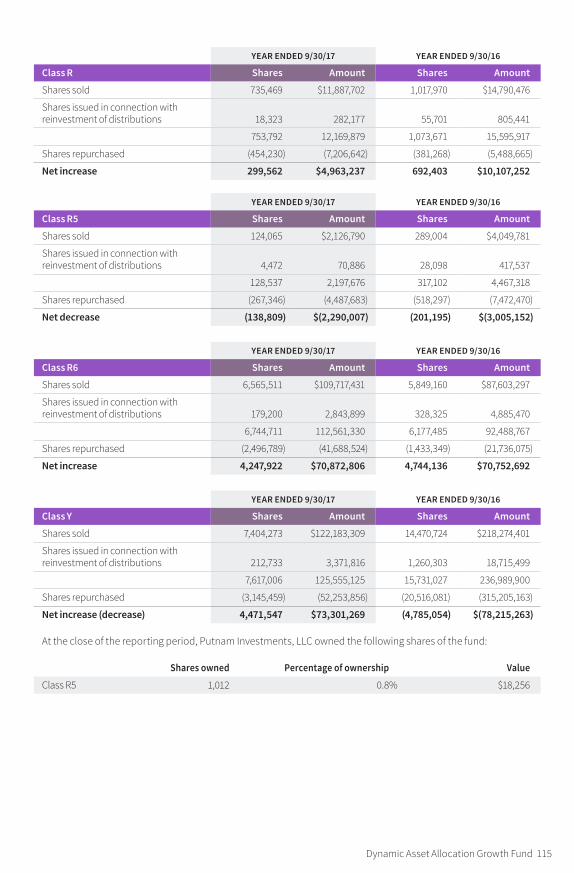
Dynamic Asset Allocation Growth Fund 115
YEAR ENDED 9/30/17 YEAR ENDED 9/30/16
Class R Shares Amount Shares Amount
Shares sold 735,469 $11,887,702 1,017,970 $14,790,476
Shares issued in connection with reinvestment of distributions 18,323 282,177 55,701 805,441
753,792 12,169,879 1,073,671 15,595,917
Shares repurchased (454,230 ) (7,206,642 ) (381,268 ) (5,488,665 )
Net increase 299,562 $4,963,237 692,403 $10,107,252
YEAR ENDED 9/30/17 YEAR ENDED 9/30/16
Class R5 Shares Amount Shares Amount
Shares sold 124,065 $2,126,790 289,004 $4,049,781
Shares issued in connection with reinvestment of distributions 4,472 70,886 28,098 417,537
128,537 2,197,676 317,102 4,467,318
Shares repurchased (267,346 ) (4,487,683 ) (518,297 ) (7,472,470 )
Net decrease (138,809 ) $(2,290,007 ) (201,195 ) $(3,005,152 )
YEAR ENDED 9/30/17 YEAR ENDED 9/30/16
Class R6 Shares Amount Shares Amount
Shares sold 6,565,511 $109,717,431 5,849,160 $87,603,297
Shares issued in connection with reinvestment of distributions 179,200 2,843,899 328,325 4,885,470
6,744,711 112,561,330 6,177,485 92,488,767
Shares repurchased (2,496,789 ) (41,688,524 ) (1,433,349 ) (21,736,075 )
Net increase 4,247,922 $70,872,806 4,744,136 $70,752,692
YEAR ENDED 9/30/17 YEAR ENDED 9/30/16
Class Y Shares Amount Shares Amount
Shares sold 7,404,273 $122,183,309 14,470,724 $218,274,401
Shares issued in connection with reinvestment of distributions 212,733 3,371,816 1,260,303 18,715,499
7,617,006 125,555,125 15,731,027 236,989,900
Shares repurchased (3,145,459 ) (52,253,856 ) (20,516,081 ) (315,205,163 )
Net increase (decrease ) 4,471,547 $73,301,269 (4,785,054 ) $(78,215,263 )
At the close of the reporting period, Putnam Investments, LLC owned the following shares of the fund:
Shares owned Percentage of ownership Value
Class R5 1,012 0.8 % $18,256
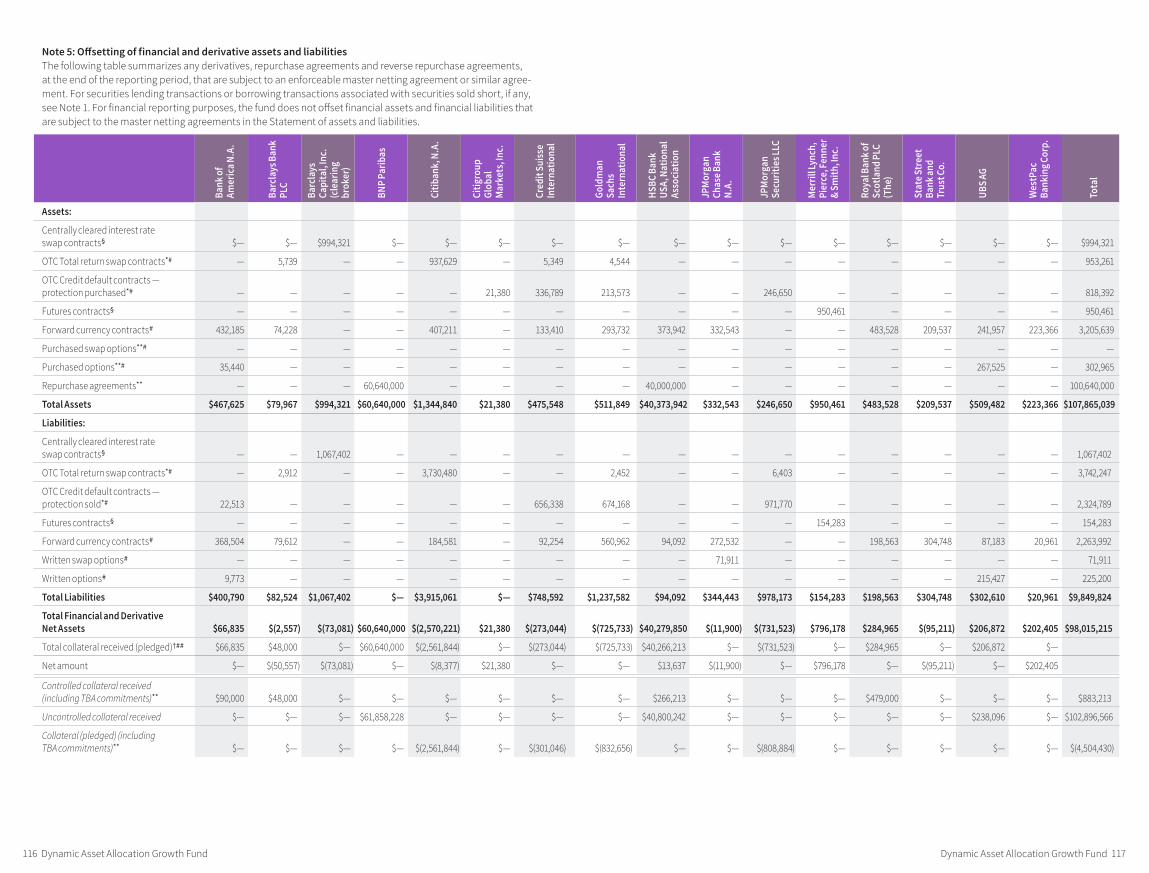
Dynamic Asset Allocation Growth Fund 117 116 Dynamic Asset Allocation Growth Fund
Note 5: Offsetting of financial and derivative assets and liabilitiesThe following table summarizes any derivatives, repurchase agreements and reverse repurchase agreements, at the end of the reporting period, that are subject to an enforceable master netting agreement or similar agree-ment. For securities lending transactions or borrowing transactions associated with securities sold short, if any, see Note 1. For financial reporting purposes, the fund does not offset financial assets and financial liabilities that are subject to the master netting agreements in the Statement of assets and liabilities.
Bank
of
Amer
ica N
.A.
Barc
lays
Ban
k PL
C
Barc
lays
Ca
pita
l, Inc
. (c
lear
ing
brok
er)
BNP P
arib
as
Citib
ank,
N.A
.
Citig
roup
Gl
obal
M
arke
ts, In
c.
Cred
it Su
isse
Inte
rnat
iona
l
Gold
man
Sa
chs
Inte
rnat
iona
l
HSBC
Ban
k US
A, N
atio
nal
Asso
ciat
ion
JPM
orga
n Ch
ase B
ank
N.A.
JPM
orga
n Se
curit
ies L
LC
Mer
rill L
ynch
, Pi
erce
, Fen
ner
& Sm
ith, In
c.
Roya
l Ban
k of
Scot
land
PLC
(T
he)
Stat
e Str
eet
Bank
and
Trus
t Co.
UBS A
G
Wes
tPac
Ba
nkin
g Cor
p.
Tota
l
Assets:
Centrally cleared interest rate swap contracts§ $— $— $994,321 $— $— $— $— $— $— $— $— $— $— $— $— $— $994,321
OTC Total return swap contracts*# — 5,739 — — 937,629 — 5,349 4,544 — — — — — — — — 953,261
OTC Credit default contracts — protection purchased*# — — — — — 21,380 336,789 213,573 — — 246,650 — — — — — 818,392
Futures contracts§ — — — — — — — — — — — 950,461 — — — — 950,461
Forward currency contracts# 432,185 74,228 — — 407,211 — 133,410 293,732 373,942 332,543 — — 483,528 209,537 241,957 223,366 3,205,639
Purchased swap options**# — — — — — — — — — — — — — — — — —
Purchased options**# 35,440 — — — — — — — — — — — — — 267,525 — 302,965
Repurchase agreements** — — — 60,640,000 — — — — 40,000,000 — — — — — — — 100,640,000
Total Assets $467,625 $79,967 $994,321 $60,640,000 $1,344,840 $21,380 $475,548 $511,849 $40,373,942 $332,543 $246,650 $950,461 $483,528 $209,537 $509,482 $223,366 $107,865,039
Liabilities:
Centrally cleared interest rate swap contracts§ — — 1,067,402 — — — — — — — — — — — — — 1,067,402
OTC Total return swap contracts*# — 2,912 — — 3,730,480 — — 2,452 — — 6,403 — — — — — 3,742,247
OTC Credit default contracts — protection sold*# 22,513 — — — — — 656,338 674,168 — — 971,770 — — — — — 2,324,789
Futures contracts§ — — — — — — — — — — — 154,283 — — — — 154,283
Forward currency contracts# 368,504 79,612 — — 184,581 — 92,254 560,962 94,092 272,532 — — 198,563 304,748 87,183 20,961 2,263,992
Written swap options# — — — — — — — — — 71,911 — — — — — — 71,911
Written options# 9,773 — — — — — — — — — — — — — 215,427 — 225,200
Total Liabilities $400,790 $82,524 $1,067,402 $— $3,915,061 $— $748,592 $1,237,582 $94,092 $344,443 $978,173 $154,283 $198,563 $304,748 $302,610 $20,961 $9,849,824
Total Financial and Derivative Net Assets $66,835 $(2,557) $(73,081) $60,640,000 $(2,570,221) $21,380 $(273,044) $(725,733) $40,279,850 $(11,900) $(731,523) $796,178 $284,965 $(95,211) $206,872 $202,405 $98,015,215
Total collateral received (pledged)†## $66,835 $48,000 $— $60,640,000 $(2,561,844) $— $(273,044) $(725,733) $40,266,213 $— $(731,523) $— $284,965 $— $206,872 $—
Net amount $— $(50,557) $(73,081) $— $(8,377) $21,380 $— $— $13,637 $(11,900) $— $796,178 $— $(95,211) $— $202,405
Controlled collateral received (including TBA commitments)** $90,000 $48,000 $— $— $— $— $— $— $266,213 $— $— $— $479,000 $— $— $— $883,213
Uncontrolled collateral received $— $— $— $61,858,228 $— $— $— $— $40,800,242 $— $— $— $— $— $238,096 $— $102,896,566
Collateral (pledged) (including TBA commitments)** $— $— $— $— $(2,561,844) $— $(301,046) $(832,656) $— $— $(808,884) $— $— $— $— $— $(4,504,430)

118 Dynamic Asset Allocation Growth Fund
* Excludes premiums, if any. Included in unrealized appreciation and depreciation on OTC swap contracts on the Statement of assets and liabilities.
** Included with Investments in securities on the Statement of assets and liabilities.
† Additional collateral may be required from certain brokers based on individual agreements.
# Covered by master netting agreement (Note 1).
## Any over-collateralization of total financial and derivative net assets is not shown. Collateral may include amounts related to unsettled agreements.
§ Includes current day’s variation margin only as reported on the Statement of assets and liabilities, which is not collateralized. Cumulative appreciation/(depreciation) for futures contracts and centrally cleared swap contracts is represented in the tables listed after the fund’s portfolio. Collateral pledged for the initial margin on futures contracts and centrally cleared swap contracts, which is not included in the table above, amounted to $18,332,220 and $4,359,072, respectively.
Note 6: Affiliated transactionsTransactions during the reporting period with any company which is under common ownership or control were as follows:
Name of affiliateFair value as
of 9/30/16Purchase
costSale
proceedsInvestment
income
Shares outstanding
and fair value as
of 9/30/17
Short-term investments
Putnam Cash Collateral Pool, LLC * $35,643,138 $193,847,573 $198,217,109 $281,020 $31,273,602
Putnam Short Term Investment Fund * * 265,801,591 361,000,000 392,363,961 2,032,391 234,437,630
Total Short-term investments $301,444,729 $554,847,573 $590,581,070 $2,313,411 $265,711,232
* No management fees are charged to Putnam Cash Collateral Pool, LLC (Note 1). Investment income shown is included in securities lending income on the Statement of operations. There were no realized or unrealized gains or losses during the period.
** Management fees charged to Putnam Short Term Investment Fund have been waived by Putnam Management. There were no realized or unrealized gains or losses during the period.
Note 7: Market, credit and other risksIn the normal course of business, the fund trades financial instruments and enters into financial transactions where risk of potential loss exists due to changes in the market (market risk) or failure of the contracting party to the transaction to perform (credit risk). The fund may be exposed to additional credit risk that an institution or other entity with which the fund has unsettled or open transactions will default. Investments in foreign securi-ties involve certain risks, including those related to economic instability, unfavorable political developments, and currency fluctuations. The fund may invest in higher-yielding, lower-rated bonds that may have a higher rate of default. The fund may invest a significant portion of its assets in securitized debt instruments, including mortgage-backed and asset-backed investments. The yields and values of these investments are sensitive to changes in interest rates, the rate of principal payments on the underlying assets and the market’s perception of the issuers. The market for these investments may be volatile and limited, which may make them difficult to buy or sell.
Note 8: Senior loan commitmentsSenior loans are purchased or sold on a when-issued or delayed delivery basis and may be settled a month or more after the trade date, which from time to time can delay the actual investment of available cash balances; interest income is accrued based on the terms of the securities. Senior loans can be acquired through an agent, by assignment from another holder of the loan, or as a participation interest in another holder’s portion of the loan. When the fund invests in a loan or participation, the fund is subject to the risk that an intermediate partici-pant between the fund and the borrower will fail to meet its obligations to the fund, in addition to the risk that the borrower under the loan may default on its obligations.
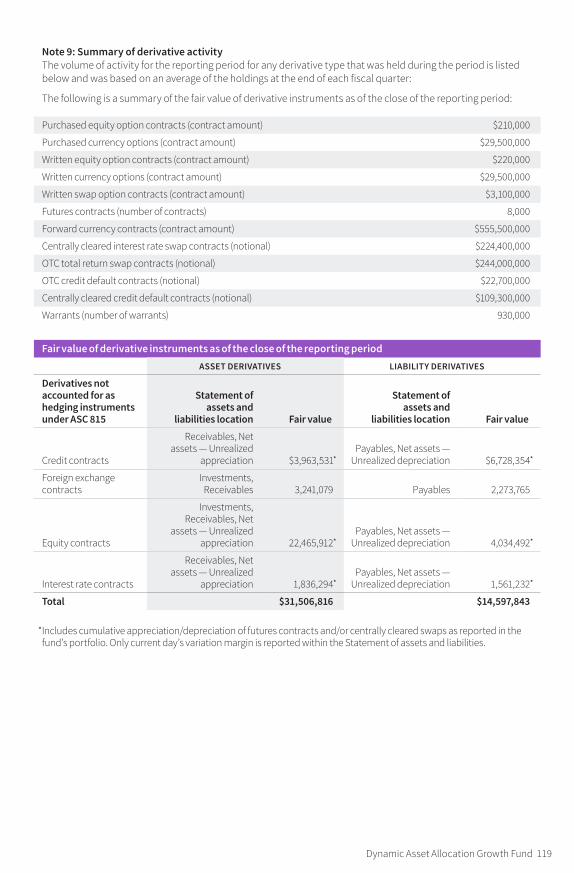
Dynamic Asset Allocation Growth Fund 119
Note 9: Summary of derivative activityThe volume of activity for the reporting period for any derivative type that was held during the period is listed below and was based on an average of the holdings at the end of each fiscal quarter:
The following is a summary of the fair value of derivative instruments as of the close of the reporting period:
Purchased equity option contracts (contract amount ) $210,000
Purchased currency options (contract amount ) $29,500,000
Written equity option contracts (contract amount ) $220,000
Written currency options (contract amount ) $29,500,000
Written swap option contracts (contract amount ) $3,100,000
Futures contracts (number of contracts ) 8,000
Forward currency contracts (contract amount ) $555,500,000
Centrally cleared interest rate swap contracts (notional ) $224,400,000
OTC total return swap contracts (notional ) $244,000,000
OTC credit default contracts (notional ) $22,700,000
Centrally cleared credit default contracts (notional ) $109,300,000
Warrants (number of warrants ) 930,000
Fair value of derivative instruments as of the close of the reporting periodASSET DERIVATIVES LIABILITY DERIVATIVES
Derivatives not accounted for as hedging instruments under ASC 815
Statement of assets and
liabilities location Fair value
Statement of assets and
liabilities location Fair value
Credit contracts
Receivables, Net assets — Unrealized
appreciation $3,963,531 *Payables, Net assets —
Unrealized depreciation $6,728,354 *
Foreign exchange contracts
Investments, Receivables 3,241,079 Payables 2,273,765
Equity contracts
Investments, Receivables, Net
assets — Unrealized appreciation 22,465,912 *
Payables, Net assets — Unrealized depreciation 4,034,492 *
Interest rate contracts
Receivables, Net assets — Unrealized
appreciation 1,836,294 *Payables, Net assets —
Unrealized depreciation 1,561,232 *
Total $31,506,816 $14,597,843
* Includes cumulative appreciation/depreciation of futures contracts and/or centrally cleared swaps as reported in the fund’s portfolio. Only current day’s variation margin is reported within the Statement of assets and liabilities.

120 Dynamic Asset Allocation Growth Fund
The following is a summary of realized and change in unrealized gains or losses of derivative instruments in the Statement of operations for the reporting period (Note 1):
Amount of realized gain or (loss ) on derivatives recognized in net gain or (loss ) on investmentsDerivatives not accounted for as hedging instruments under ASC 815 Warrants Options Futures
Forward currency
contracts Swaps Total
Credit contracts $— $— $— $— $3,849,631 $3,849,631
Foreign exchange contracts — 1,230,008 — 4,218,251 — $5,448,259
Equity contracts 601,906 (332,712 ) 82,849,764 — 5,230,583 $88,349,541
Interest rate contracts — (156,769 ) 154,290 — 1,974,964 $1,972,485
Total $601,906 $740,527 $83,004,054 $4,218,251 $11,055,178 $99,619,916
Change in unrealized appreciation or (depreciation ) on derivatives recognized in net gain or (loss ) on investmentsDerivatives not accounted for as hedging instruments under ASC 815 Warrants Options Futures
Forward currency
contracts Swaps Total
Credit contracts $— $— $— $— $(627,123 ) $(627,123 )
Foreign exchange contracts — (123,580 ) — (908,363 ) — $(1,031,943 )
Equity contracts 108,615 (94,477 ) 5,515,749 — (4,700,000 ) $829,887
Interest rate contracts — 164,933 749,969 — 337,868 $1,252,770
Total $108,615 $(53,124 ) $6,265,718 $(908,363 ) $(4,989,255 ) $423,591
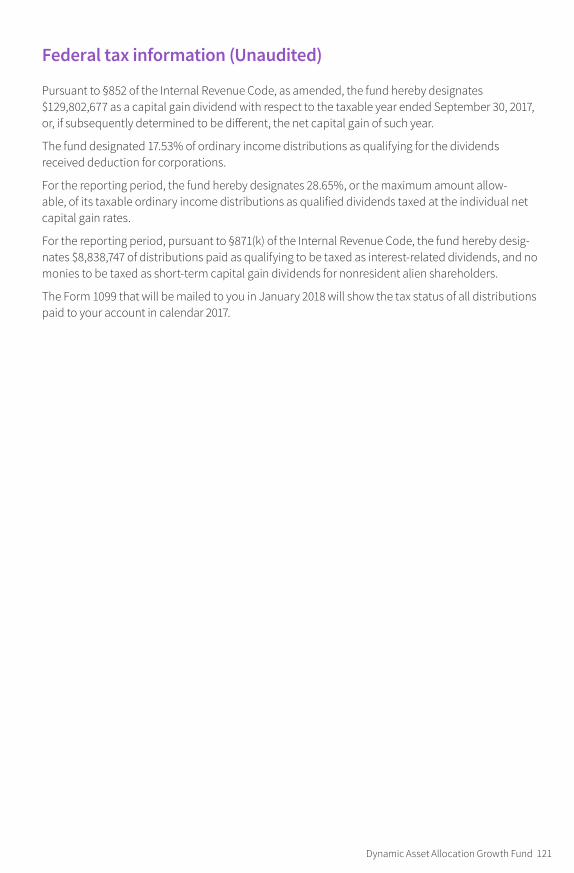
Dynamic Asset Allocation Growth Fund 121
Federal tax information (Unaudited)
Pursuant to §852 of the Internal Revenue Code, as amended, the fund hereby designates $129,802,677 as a capital gain dividend with respect to the taxable year ended September 30, 2017, or, if subsequently determined to be different, the net capital gain of such year.
The fund designated 17.53% of ordinary income distributions as qualifying for the dividends received deduction for corporations.
For the reporting period, the fund hereby designates 28.65%, or the maximum amount allow-able, of its taxable ordinary income distributions as qualified dividends taxed at the individual net capital gain rates.
For the reporting period, pursuant to §871(k) of the Internal Revenue Code, the fund hereby desig-nates $8,838,747 of distributions paid as qualifying to be taxed as interest-related dividends, and no monies to be taxed as short-term capital gain dividends for nonresident alien shareholders.
The Form 1099 that will be mailed to you in January 2018 will show the tax status of all distributions paid to your account in calendar 2017.
Federal tax information

About the TrusteesINDEPENDENT TRUSTEES
Liaquat Ahamed Born 1952, Trustee since 2012Principal occupations during past five years: Pulitzer Prize-winning author of Lords of Finance: The Bankers Who Broke
the World, whose articles on economics have appeared in such publications as the New York Times, Foreign Affairs, and the Financial Times. Director of Aspen Insurance Co., a New York Stock Exchange company, and Chair of the Aspen Board’s Investment Committee. Trustee of the Brookings Institution.
Other directorships: The Rohatyn Group, an emerging-market fund complex that manages money for institutions
Ravi AkhouryBorn 1947, Trustee since 2009Principal occupations during past five years: Trustee of American India Foundation and of the Rubin Museum.
From 1992 to 2007, was Chairman and CEO of MacKay Shields, a multi-product investment management firm.
Other directorships: RAGE Frameworks, Inc., a private software company; English Helper, Inc., a private software company
Barbara M. Baumann Born 1955, Trustee since 2010Principal occupations during past five years: President and Owner of Cross Creek Energy Corporation, a strategic
consultant to domestic energy firms and direct investor in energy projects. Current Board member of The Denver Foundation. Former Chair and current Board member of Girls Incorporated of Metro Denver. Member of the Finance Committee, the Children’s Hospital of Colorado.
Other directorships: Buckeye Partners, L.P., a publicly traded master limited partnership focused on pipeline transport, storage, and distribution of petroleum products; Devon Energy Corporation, a leading independent natural gas and oil exploration and production company
Jameson A. BaxterBorn 1943, Trustee since 1994, Vice Chair from 2005 to 2011, and Chair since 2011Principal occupations during past five years: President of Baxter Associates,
Inc., a private investment firm. Chair of Mutual Fund Directors Forum. Chair Emeritus of the Board of Trustees of Mount Holyoke College. Director of the Adirondack Land Trust and Trustee of the Nature Conservancy’s Adirondack Chapter.
Katinka DomotorffyBorn 1975, Trustee since 2012Principal occupations during past five years: Voting member of the Investment Committees of the Anne Ray Charitable
Trust and Margaret A. Cargill Foundation, part of the Margaret A. Cargill Philanthropies. Until 2011, Partner, Chief Investment Officer, and Global Head of Quantitative Investment Strategies at Goldman Sachs Asset Management.
Other directorships: Reach Out and Read of Greater New York, an organization dedicated to promoting childhood literacy; Great Lakes Science Center; College Now Greater Cleveland
Catharine Bond HillBorn 1954, Trustee since 2017Principal occupations during past five years: Managing Director of Ithaka S+R, a not-for-profit service that helps
the academic community navigate economic and technological change. From 2006 to 2016, served as the 10th President of Vassar College. Prior to 2006, was Provost of Williams College.
Other directorships: Director of Yale-NUS College; Alumni Fellow to the Yale Corporation
122 Dynamic Asset Allocation Growth Fund

Paul L. JoskowBorn 1947, Trustee since 1997Principal occupations during past five years: Economist and President of the Alfred P. Sloan Foundation,
a philanthropic institution focused primarily on research and education on issues related to science, technology, and economic performance. Elizabeth and James Killian Professor of Economics, Emeritus at the Massachusetts Institute of Technology (MIT). Prior to 2007, served as the Director of the Center for Energy and Environmental Policy Research at MIT.
Other directorships: Yale University; Exelon Corporation, an energy company focused on power services; Boston Symphony Orchestra; Prior to April 2013, served as Director of TransCanada Corporation and TransCanada Pipelines Ltd., energy companies focused on natural gas transmission, oil pipelines and power services
Kenneth R. LeiblerBorn 1949, Trustee since 2006 and Vice Chair since 2016Principal occupations during past five years: Founder and former Chairman
of Boston Options Exchange, an electronic marketplace for the trading of derivative securities. Vice Chairman Emeritus of the Board of Trustees of Beth Israel Deaconess Hospital in Boston, Massachusetts. Director of Beth Israel Deaconess Care Organization. Until November 2010, director of Ruder Finn Group, a global communications and advertising firm.
Other directorships: Eversource Corporation, which operates New England’s largest energy delivery system
Robert E. PattersonBorn 1945, Trustee since 1984Principal occupations during past five years: Co-Chairman of Cabot Properties, Inc., a private equity firm
investing in commercial real estate, and Chairman or Co-Chairman of the Investment Committees for various Cabot Funds. Past Chairman and Trustee of the Joslin Diabetes Center.
George Putnam, IIIBorn 1951, Trustee since 1984Principal occupations during past five years: Chairman of New Generation Research, Inc., a publisher of financial
advisory and other research services. Founder and President of New Generation Advisors, LLC, a registered investment advisor to private funds. Director of The Boston Family Office, LLC, a registered investment advisor.
Manoj P. SinghBorn 1952, Trustee since 2017Principal occupations during past five years: Until 2015, Chief Operating Officer and Global Managing Director at
Deloitte Touche Tohmatsu, Ltd., a global professional services organization. Served on the Deloitte U.S. Board of Directors and the boards of Deloitte member firms in China, Mexico, and Southeast Asia.
Other directorships: Director of Abt Associates, a global research firm focused on health, social and environmental policy, and international development. Trustee of Carnegie Mellon University. Trustee of Rubin Museum of Art. Director of Pratham USA, an organization dedicated to children’s education in India. Member of the Advisory Board of Altimetrik, a business transformation and technology solutions firm. Director of DXC Technology, a global IT services and consulting company
INTERESTED TRUSTEE
Robert L. Reynolds*
Born 1952, Trustee since 2008 and President of the Putnam Funds since 2009
Principal occupations during past five years: President and Chief Executive
Officer of Putnam Investments since 2008 and, since 2014, President and Chief Executive Officer of Great-West Financial, a financial services company that provides retirement savings plans, life insurance, and annuity and executive benefits products, and of Great-West Lifeco U.S. Inc., a holding company that owns Putnam Investments and Great-West Financial. Prior to joining Putnam Investments, served as Vice Chairman and Chief Operating Officer of Fidelity Investments from 2000 to 2007.
* Mr. Reynolds is an “interested person” (as defined in the Investment Company Act of 1940) of the fund and Putnam Investments. He is President and Chief Executive Officer of Putnam Investments, as well as the President of your fund and each of the other Putnam funds.
The address of each Trustee is One Post Office Square, Boston, MA 02109.
As of September 30, 2017, there were 106 Putnam funds. All Trustees serve as Trustees of all Putnam funds.
Each Trustee serves for an indefinite term, until his or her resignation, retirement at age 75, removal, or death.
Dynamic Asset Allocation Growth Fund 123
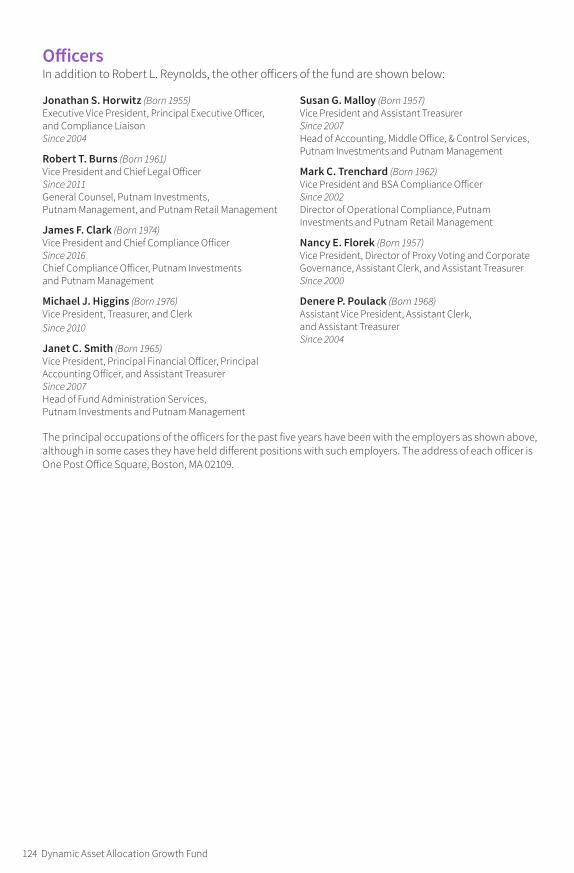
The principal occupations of the officers for the past five years have been with the employers as shown above, although in some cases they have held different positions with such employers. The address of each officer is One Post Office Square, Boston, MA 02109.
OfficersIn addition to Robert L. Reynolds, the other officers of the fund are shown below:
Jonathan S. Horwitz (Born 1955)Executive Vice President, Principal Executive Officer, and Compliance LiaisonSince 2004
Robert T. Burns (Born 1961)Vice President and Chief Legal OfficerSince 2011General Counsel, Putnam Investments, Putnam Management, and Putnam Retail Management
James F. Clark (Born 1974)Vice President and Chief Compliance OfficerSince 2016Chief Compliance Officer, Putnam Investmentsand Putnam Management
Michael J. Higgins (Born 1976)Vice President, Treasurer, and ClerkSince 2010
Janet C. Smith (Born 1965)Vice President, Principal Financial Officer, Principal Accounting Officer, and Assistant TreasurerSince 2007Head of Fund Administration Services, Putnam Investments and Putnam Management
Susan G. Malloy (Born 1957)Vice President and Assistant TreasurerSince 2007Head of Accounting, Middle Office, & Control Services, Putnam Investments and Putnam Management
Mark C. Trenchard (Born 1962)Vice President and BSA Compliance OfficerSince 2002Director of Operational Compliance, Putnam Investments and Putnam Retail Management
Nancy E. Florek (Born 1957)Vice President, Director of Proxy Voting and Corporate Governance, Assistant Clerk, and Assistant TreasurerSince 2000
Denere P. Poulack (Born 1968)Assistant Vice President, Assistant Clerk, and Assistant TreasurerSince 2004
124 Dynamic Asset Allocation Growth Fund

Fund informationFounded over 75 years ago, Putnam Investments was built around the concept that a balance between risk and reward is the hallmark of a well-rounded financial program. We manage over 100 funds across income, value, blend, growth, asset allocation, absolute return, and global sector categories.
Investment ManagerPutnam Investment Management, LLC One Post Office Square Boston, MA 02109
Investment Sub-AdvisorsPutnam Investments Limited 57–59 St James’s Street London, England SW1A 1LD
The Putnam Advisory Company, LLC One Post Office Square Boston, MA 02109
Marketing ServicesPutnam Retail Management One Post Office Square Boston, MA 02109
CustodianState Street Bank and Trust Company
Legal CounselRopes & Gray LLP
Independent Registered Public Accounting FirmPricewaterhouseCoopers LLP
TrusteesJameson A. Baxter, Chair Kenneth R. Leibler, Vice Chair Liaquat Ahamed Ravi Akhoury Barbara M. Baumann Katinka Domotorffy Catharine Bond Hill Paul L. Joskow Robert E. Patterson George Putnam, III Robert L. Reynolds Manoj P. Singh
OfficersRobert L. Reynolds President
Jonathan S. Horwitz Executive Vice President, Principal Executive Officer, and Compliance Liaison
Robert T. Burns Vice President and Chief Legal Officer
James F. Clark Vice President and Chief Compliance Officer
Michael J. Higgins Vice President, Treasurer, and Clerk
Janet C. Smith Vice President, Principal Financial Officer, Principal Accounting Officer, and Assistant Treasurer
Susan G. Malloy Vice President and Assistant Treasurer
Mark C. Trenchard Vice President and BSA Compliance Officer
Nancy E. Florek Vice President, Director of Proxy Voting and Corporate Governance, Assistant Clerk, and Assistant Treasurer
Denere P. Poulack Assistant Vice President, Assistant Clerk, and Assistant Treasurer
This report is for the information of shareholders of Putnam Dynamic Asset Allocation Growth Fund. It may also be used as sales literature when preceded or accompanied by the current prospectus, the most recent copy of Putnam’s Quarterly Performance Summary, and Putnam’s Quarterly Ranking Summary. For more recent performance, please visit putnam.com. Investors should carefully consider the investment objectives, risks, charges, and expenses of a fund, which are described in its prospectus. For this and other information or to request a prospectus or summary prospectus, call 1-800-225-1581 toll free. Please read the prospectus carefully before investing. The fund’s Statement of Additional Information contains additional information about the fund’s Trustees and is available without charge upon request by calling 1-800-225-1581.

Elec
tron
ic se
rvic
e re
ques
ted
Go p
aper
less
: Log
on
to p
utna
m.c
om o
r sca
n th
is c
ode
to u
pdat
e yo
ur m
ailin
g op
tions
.
One
Pos
t Offi
ce S
quar
e
Bost
on, M
A 02
109
1-80
0-22
5-15
81pu
tnam
.com
PRSR
T ST
D
U.S
. PO
STAG
E PA
ID
BRO
CKTO
N, M
A
PERM
IT N
O. 6
00
AN05
8 30
8150
11
/17