Embed Size (px)
Citation preview

Metrics: You Are What You Measure!
by
John R. Hauser and Gerald M. Katz
April 1998
John R. Hauser is the Kirin Professor of Marketing, Massachusetts Institute of Technology, Sloan
School of Management, 38 Memorial Drive, E56-314, Cambridge, MA 02142, (617) 253-5056, fax
(617) 258-7597, [email protected]. Gerald M. Katz is Vice President of Applied Marketing Science,
Inc., 303 Wyman Street, Waltham, MA 02154, (781) 684-1230 x128, fax (781) 684-0075, gkatz@ams-
inc.com.
This research was funded, in part, by the International Center for Research on the Management of
Technology (ICRMOT) and by the Center for Innovation in Product Development (CIPD). We wish to
thank Robert Klein, Mel Klein, William Lucas, Edward Roberts, and Florian Zettelmeyer for their
insights and recommendations on the use of metrics within organizations.

Firms use metrics for a variety of laudable purposes. Metrics such as market share, sales
increases, margins, and customer satisfaction surveys enable firms to take stock of where they
are and to plan for the future. Metrics such as projected revenue, contingent sales forecasts, the
net present value of an investment, and the option value of an R&D program provide indicators
of future performance. Managers use these metrics to allocate assets and select strategies.
Metrics such as an R&D effectiveness index, reductions in the operating cost of a telephone
service center, and reduced absenteeism provide the basis for bonuses and promotions for
managers and their employees.
Our thesis is that every metric, whether it is used explicitly to influence behavior, to
evaluate future strategies, or simply to take stock, will affect actions and decisions. If a brand
manager knows that, in his or her company’s culture, a “good brand is a high share brand,” he or
she will make decisions to maximize market share – even if those decisions inadvertently
sacrifice long-term profit or adversely affect other brands in the company’s portfolio. If an R&D
manager knows that projects are chosen based on projected net present value (NPV), he or she
will encourage research scientists and engineers to work on programs and make forecasts which
make NPV look good – even if the NPV calculations are misleading. If a telephone service
center manager is rewarded for reduced absenteeism he or she will seek to do well on the firm’s
measure of absenteeism – even if the measure does not lead to improved productivity. For
example, Kerr (1975) cites a case where the firm measured the number of instances an employee
was absent, but not how long they were absent. From a manager’s standpoint, if an employee
missed a Monday, it was better for the employee to stay out all week than to come back for three
days and then miss a Friday.
The link is simple. If a firm measures a, b, and c, but not x, y, and z, then managers begin
to pay more attention to a, b, and c. Soon those managers who do well on a, b, and c are
promoted or are given more responsibilities. Increased pay and bonuses follow. Recognizing
these rewards, managers start asking their employees to make decisions and take actions that
improve the metrics. (Often, they don’t even need to ask!) Soon the entire organization is
focused on ways to improve the metrics. The firm gains core strengths in producing a, b, and c.
The firm becomes what it measures.
If maximizing a, b, and c leads to long-term profit, the metrics are effective. If a, b, and
c lead to counterproductive decisions and actions, then the metrics have failed. But it is even

Metrics: You Are What You Measure! Page 2
worse! Once the enterprise is committed to these metrics, the metrics gain tremendous inertia.
Those who know how to maximize a, b, and c fear to change course. It is extremely hard to
refocus the enterprise on new goals.
Choosing the right metrics is critical to success, but the road to good metrics is fraught
with pitfalls. We recently worked with a credit card company to improve its products and
services. This company had a long-standing tradition of using metrics, displaying more than 100
different measures in their lobby for all to see. One critical metric focused on the quality of the
plastic used in their credit cards – no bubbles or blemishes were tolerated. But after talking to
customers, we found that customers never noticed the blemishes as long as the magnetic strip on
the back worked. On the other hand, customers were extremely concerned with other aspects of
the service. By focusing on the quality of the plastic, the company was diverting resources away
from issues that mattered to customers. By truly listening to and understanding the customer, we
helped this company reduce the number of their metrics by more than half and refocus efforts
toward those aspects of the service which increased revenues and enhanced profit.
This paper focuses on the selection of good metrics. There is no magic bullet. Many
metrics seem right and are easy to measure, but have subtle, counter-productive consequences.
Other metrics are more difficult to measure, but focus the enterprise on those decisions and
actions that are critical to success. We suggest how to identify metrics that achieve balance in
these effects and enhance long-term profitability. To gain an understanding of the properties of
good metrics we begin with a summary of how metrics fail. These seven pitfalls provide
examples of where metrics have produced counter-productive results. We then suggest a seven-
step system to design effective, “lean” metrics. We base our recommendations on our own
experience and on concepts drawn from the quality movement, from product and service design,
from organizational studies, and from recent management theory. These concepts include The
Voice of the Customer, The Voice of the Employee, the House of Quality matrix (drawn from
the Quality Function Deployment [QFD] process), metrics tracking, employee involvement, and
creative management.
Seven Pitfalls That Lead to Counter-Productive Metrics

Metrics: You Are What You Measure! Page 3
A good metric is precise, tied to overall profit, applicable to all employees, and designed
to encourage extranormal effort – or is it? These are all desirable properties, but if pushed to
their limits, they lead to counterproductive actions. In this section we highlight seven pitfalls
that we have seen in practice. Wherever possible we back up these recommendations with
citations from the academic literature.
Pitfall 1. Delaying Rewards
It is rational for any employee or manager to be more short-term oriented than the firm.
Managers and employees change jobs or are promoted. They may not be around to collect future
rewards. A manager or employee might do his or her job well and it might maximize long-term
profit, but it might be hard to tie that profit back to that manager or employee. Change happens.
Promises of future rewards might never be fulfilled. People have mortgages, face college tuition,
and have other pressing needs. All of these phenomena imply that any rewards which depend
upon future outcomes will be discounted more by managers and employees than by the firm. In
the “present,” when the actions and decisions are being made, rewards will be under-valued if
they occur too far in the future. Metrics such as 10-year sales, 5-year revenue, long-term cost
reductions, reduced lifetime product development costs, or defects discovered over the life of the
product, all delay rewards and bias employees toward decisions and actions that have shorter-
term payoffs.
To avoid this pitfall, you should look for metrics that can be measured today but which
impact future outcomes. For example, Hauser, Simester, and Wernerfelt (1994) show how
measures of customer satisfaction can be used to encourage customer-contact employees to make
the “right” tradeoffs between actions and decisions that have immediate impact and those that
have enduring long-term impact. By “right,” we mean that the employees make tradeoffs that
maximize long-term profit to the firm.
Pitfall 2. Using Risky Rewards
It is much more difficult for individual managers and employees to diversify risk than it
is for the firm.1 While few managers and employees bear all the risk resulting from their actions
and decisions, they do bear some. A business unit manager expects praise, promotions, and,
1 Even if the firm cannot diversify risk, investors in publicly traded firms can diversify risk in the stock market.
Metrics: You Are What You Measure! Page 4
perhaps, bonuses, if the business unit does well on sales, revenue, or profit targets. An employee
expects praise, promotions, and bonuses if his or her product development team develops a
successful new product.
Any metric that depends on an uncertain outcome from influences that are beyond their
control imposes risk on the manager or employee. Managers and employees who cannot
diversify this risk are likely to be risk averse. They will value guaranteed outcomes more than
risky outcomes even if the risky outcomes have the same expected value to the firm. Put another
way, there is a “risk cost” associated with any metric based on vague or uncertain outcomes that
are beyond the control of the managers and employees subject to the metrics.2
For example, consider the R&D effectiveness index, EI, proposed by McGrath and
Romeri (1994). This index, roughly equal to the percent of profit obtained from new products
divided by the percent of revenue spent on R&D, attempts to measure R&D effectiveness based
on the net revenue that R&D contributes to the firm.3 But R&D is one of the most risky and
long-term investments that the firm can make. If managers and employees perceive that they are
rewarded based on EI, then they will prefer projects that are less risky (and more short-term
oriented). This effect can be huge. Hauser (1998) demonstrates that a significant fraction of
R&D projects can be falsely rejected or falsely selected if EI is the only metric. He shows
further that a firm can balance this effect by placing a smaller reward on EI and a larger one on
other metrics that are less risky to the individual researcher.
Fortunately, some firms are experimenting with metrics that allow them to manage risk
through the use of “options.” See Mitchell and Hamilton (1988) and Faulkner (1996). In an
analogy to financial options (e.g., Black and Scholes 1973), metrics are used to reward upside
potential while limiting the firm’s downside risk. Naturally, these metrics assume that the firm
has the discipline to de-escalate commitments when necessary (Boulding, et. al. 1997, Simonson
and Staw 1992, Staw 1976).
Pitfall 3. Making Metrics Hard to Control
Consider the engineering team charged with the design of the door for a new automobile.
This is an extremely important job. Car doors have complex electrical and mechanical
2 We can assign a numerical value to this risk cost. See Keeney and Raiffa (1976).

Metrics: You Are What You Measure! Page 5
subsystems. They interact with ride and handling, with passenger comfort, with noise control,
with styling, with power (through wind resistance and weight), and with many other components
of the automobile. A good design clearly influences sales at some level.
Nonetheless, the car door is only one of many components in the automobile design.4
Sales also depend upon the actions of many suppliers, dealers, and competitors, and upon
decisions the firm has yet to make about advertising and promotions. The macro economy
affects sales as do interactions with other automobiles in the firm’s product line. The car-door
engineering team may affect revenues, but any change in revenue directly attributable to the
team is probably small. From the team’s perspective, the effect is tenuous at best.
However, the team can affect other metrics more directly. Its decisions and actions
directly affect metrics such as the time it takes to design the door or the percent of parts that are
re-used from a previous design. Even if the revenue and cost metrics are valued equally by the
firm, the engineering team will be influenced more by the metrics it affects directly than by those
for which it has only a small impact. It is easy to imagine the team avoiding a decision to spend
six months redesigning the door with an entirely new part even though that redesign might be in
the firm’s best long-term interest.
To overcome this pitfall, the firm must identify metrics that the team can affect today, but
which, ultimately, will affect the firm’s long-term goals. For example, we argue later in this
paper that the firm can do better by rewarding the team for satisfying those customer needs
which are most directly affected by the car-door design. We suggest methods to identify such
needs and to link them to the decisions the team can make and the actions they can take.
Pitfall 4. Losing Sight of the Goal.
We worked with an office furniture manufacturer a few years ago on the design of
seating products. This manufacturer, which wanted to create chairs that were highly durable,
was using sophisticated testing procedures to assure durability. The engineering-design and the
quality-testing teams were among the best in the business. However, as part of a desire to
continually improve profit, the firm questioned established procedures to determine whether it
3 Specifically, their effectiveness index (EI) is equal to (% of revenue from new products)*[(% of revenue that is profit)/(% of revenue spent on R&D) + 1]. 4 One firm told us that the redesign for a typical automobile requires over 1,000 person-years of engineering effort. 5 Such a statement is now part of the vision statement of General Motors Corporation. See Hauser (1997).
Metrics: You Are What You Measure! Page 6
was measuring the right things. After all, few of their chairs ever failed, and many in the firm
expressed the belief that their products were “over-engineered.” Furthermore, there were few
users who weighed 550 kilos and few users who would ever sit down 50,000 times over the
lifetime of the chair. While such over-designed durability might be good at some level, this
over-engineering added significant cost to the chair and limited the ability of the engineers to
provide other valued features to the customer. By refocusing and balancing the ultimate goals of
customer satisfaction and long-term profit, the firm was able to modify its metrics to encourage
better designs.
In other instances, misaligned metrics can be more subtle. For example, many R&D
organizations seek to identify the best scientists and engineers by tallying the new ideas, new
concepts, new technologies, or new science that these employees discover. As a result,
internally discovered ideas, concepts, technologies, and science (“ideas” for short) weigh heavily
in the incentive system. Soon the organization values internal “ideas” to the exclusion of all
others. Quickly a “not-invented-here” culture takes hold. This, in turn, leads to internal research
“empires” that may be larger than necessary. Ultimately, more internal “ideas,” but, in total,
fewer “ideas” are identified than would otherwise be profitable for the firm (Hauser 1998).
But the goal is not internal “ideas.” The goal is the ability to be competitive and
profitable based on “ideas.” Today, many firms believe that their core competence is the ability
to exploit the profitability of “ideas” better than their competitors. If this is the case, then the
firm should value all “ideas” no matter their source.5 If the firm rewards all “ideas” and
encourages managers, scientists, and engineers to look outside the firm when necessary, it can
overcome the “not-invented-here” syndrome and become more profitable.
Notice that we did not recommend rewarding R&D managers and researchers for the
profit impact of their “ideas.” This would have fallen prey to the traps of pitfalls 1, 2, and 3.
The key concept is not that the metrics themselves must have a direct causal effect on eventual
outcomes (or other macro goals). The key concept is that the metrics are chosen so that actions
and decisions which move the metrics in the desired direction also move the firm’s desired
outcomes in the same direction. It is even better if the metrics can be measured sooner, and with
less uncertainty, than the outcomes.6 See Figure 1.
6 This argument is formalized by Baker, Gibbons and Murphy (1994) and Gibbons (1997). If O is outcomes, m is the metric, and e is effort, then the firm wants O/ e and m/ e to be correlated across projects or over time.

Metrics: You Are What You Measure! Page 7
Metrics
Actions and Decisions
Outcomes(Market Share,
Profit, etc.)
time and uncertainty
Figure 1. Metrics are Good if the Actions and Decisions which Improve the Metrics
also Improve the Firm’s Desired Long-Term Outcomes
For example, consider a sales team, a product development team, and a basic research
team. A sales team directly affects revenue by its selling effort. Revenue, or sales times
margins, might be a good metric for the sales force. The product development team also affects
revenue, but less directly and less immediately. Near-term revenue is a reasonable metric, but
the firm may also want to use surrogates, such as customer satisfaction, to represent long-term
revenue. The firm might also include metrics such as cycle time, development cost, and
synergies with other products in the line. The team can affect these directly and, if they are
chosen carefully, the actions the team takes to affect these metrics are the same actions that
produce long-term profit for the firm. By the time we get to the research team, its actions are far
removed from immediate revenue. Thus, the firm seeks metrics which, when maximized, lead to
high-quality, seminal research that the firm might later exploit. Indeed, the common practice of
measuring the number of articles that the research scientists publish in the top technical journals
might, by Figure 1, be rational. Few research managers would argue that publications
themselves lead to profit. In fact, there is a danger that such publications might tip off
competitors. But if the actions that the scientists take to discover publishable “ideas” are the

Metrics: You Are What You Measure! Page 8
same actions that lead to profitable “ideas” for the firm, then publications might be a good
metric.7
Pitfall 5. Choosing Metrics that are Precisely Wrong
There is a natural desire on the part of many managers to seek precise metrics, things that
can be measured with great accuracy. But precision can be misleading. Metrics can be precisely
wrong.
We worked with a variety of services firms: financial-services, health-care providers,
insurance providers, and public utilities. In many of these cases a services firm sought to
enhance its customers’ satisfaction with a telephone-service center.8 In an effort to create
incentives for the telephone representatives, the firm began to measure a variety of metrics
including the number of rings until the phone was answered, the time spent in the queue until a
live representative could come on the line, the number of calls answered per hour by each
representative, the number of times the customer was put on hold, and the percent of each hour
that each representative spent connected to a customer. All of these metrics could be measured
easily, accurately, and automatically by the telephone equipment.
Soon the firm improved dramatically on all of these measures, but the customers were
still dissatisfied. In candid conversations with the telephone service center employees, we came
to understand how these metrics impacted their behavior. To increase the number of calls per
hour and be ready to answer the next call immediately, telephone representatives (reps) rushed
customers and gave them the most convenient answer. Some reps even “gamed” the system by
hanging up on a customer or two immediately after answering (without saying anything) in order
to improve their metrics, hoping that no one would be the wiser! To decrease the number of
times the customer was put on hold, reps were reluctant to transfer a call, even if they themselves
did not know the answer. The service center became precisely what it measured – a place to
process lots of calls quickly.
However, customer research showed that customers did not just want quick answers –
they wanted accurate answers. Most customers would not mind waiting an extra ring or staying
7 In reality, R&D laboratories combine a variety of such “effort” metrics. Some laboratories further refine the measures to include only highly cited “star” articles.

Metrics: You Are What You Measure! Page 9
on the telephone a bit longer if they were then connected or transferred to a knowledgeable
person who could answer their question accurately. Accuracy was much harder to measure than
speed, but that was the true goal. “Accuracy” and “customer-satisfaction” measures were less
precise, but far more relevant to the real goals of the telephone service center.
How did the firm respond? First, they altered their information system to include a data
field in which the rep could enter the customer’s problem or question. After six months, the firm
calculated the percent of calls that involved a problem or question that had been previously
reported or asked by the same customer. An astounding 23% of all calls fit this description! By
focusing on reducing this metric, customer satisfaction scores finally started to improve. An
interesting side benefit was that, by doing so, call volume decreased, further reducing pressure
on the reps to handle calls quickly.
Some firms develop “expert panels” to measure imprecise metrics. For instance, the
Arthur D. Little Company operates one of the most famous quality control laboratories in the
world for sensory analysis. Many attributes of food products can be measured with great
precision by laboratory equipment. However, there are some attributes which defy laboratory
measurement. Examples include sweetness and fruitiness (Acree 1995) or richness, fullness, and
balance (Roussel, et. al. 1991). By training and common agreement, expert panelists develop
their own definitions and rating scales. These subjective methods can become key metrics in
product design and quality control procedures .
The lesson: measure what is truly important, not just what is easy to measure. Vaguely
right is better than precisely wrong!9
Pitfall 6. Assuming Your Managers and Employees Have No Options
Most managers and employees work hard. The goal of a metrics system should be to
make them work smarter. The better the people, the better they are at redirecting their decisions
and actions to maximize metrics. The best people probably already working very hard. If the
metrics system requires they work harder still, you will probably have to pay them more, or lose
them.
8 For ease of exposition and to maintain confidentiality we have merged the lessons from a variety of firms in the “services” example described in this paper. All examples occurred with at least one of these firms, often more. 9 This phrase was originally coined by Lodish (1974) in the context of salesforce allocations.
Metrics: You Are What You Measure! Page 10
Consider a manager who is already working 60 hours per week for a salary of $2,000 per
week. If you could hire other managers, just as good and with knowledge of your system, for
close to that salary, then you are paying market wages. Put another way, your manager probably
has outside options close to $2,000. Now suppose you impose “stretch” metrics that require the
manager to put in an extra 20 hours per week. He or she may do it for a while, but only long
enough to polish his or her résumé. When such stretch metrics are imposed on a group of
managers, it is even worse. The best people leave first! The only people that remain are those
who are not in demand by your competitors.
There’s no such thing as a free lunch. If the metrics system requires more effort and that
effort is perceived as costly to the manager, then soon you will have to pay for the increased
effort. If the metrics system imposes greater risk or time delays, then soon you will have to pay
for that increased risk or time delay. It may be worth it – but it does not come free. When
designing a metrics system it is important that you take into consideration the alternatives that
are available to your managers and employees.
As a corollary to Pitfall 6, we recommend that you consider only “lean” metrics, i.e.
those that do not require a great deal of additional cost or effort to measure. We have seen
organizations where managers and employees spend a significant fraction of their time just
collecting the data on “fat” metrics. If a metrics measurement system requires 10% of the
productive time available, then the metrics system had better raise productivity by more than
11% just to break even. If the metrics measurement system requires 20% of the productive time,
productivity needs to rise by 25%.10
Pitfall 7. Thinking Narrowly.
The last pitfall sits squarely on the shoulders of top management. Do not be paradigm
bound.
In Pitfall 5 we talked about the “right” kind of metrics for a telephone service center. But
why do we need a telephone service center in the first place? What if we designed our products
so that they were so easy to use that customers never needed to call our service center?
Impossible? Perhaps. But this was exactly the goal that Scott Cook, President of Intuit
10 If the metrics system requires t percent of productive time then this leaves only (1-t) percent of productive time to achieve the firm’s goals. Thus, productivity must increase by 1/(1-t) percent just to break even.

Metrics: You Are What You Measure! Page 11
Software, set out to accomplish (Case 1991). The telephone service reps were asked to record
customer questions and problems. They were rewarded for communicating these issues to
software designers so that the next version of the software could anticipate problems and solve
them before they became problems. Market researchers literally followed customers home,
watched them learn and use the software, and listened to their needs. The entire organization
was oriented toward discovering and correcting problems before they occurred. Furthermore,
Intuit took ownership of every problem. Even if the technical cause of the problem was a printer
driver designed by a hardware manufacturer, Intuit took responsibility for the solution. In
contrast to the services firms which focused on answering customer questions and solving
problems, Intuit focused on anticipating customer questions and preventing problems from ever
occurring.
Seven-Steps Toward Good Metrics
Designing a Metrics System is Hard Work
It is easy to select a metric; it is hard to select a good metric. The seven pitfalls are
difficult to avoid. Management wants to tie pay to performance, but if tying pay to performance
delays rewards or exposes managers and employees to undo risk, then the metric will have
unintended implications. Bonuses based on stock price make sense for the few people near the
top who really affect stock price, but the further down we go into the organization, the less
clearly decisions and actions are directly tied to stock price. If stock price is not tied closely to
decisions and actions, rewards based on stock price will have little effect on the managers’ and
employees’ decisions and actions. Precise metrics are desirable, but beware of false precision.
Metrics that count things (calls answered, days absent, quarterly sales) can often be measured
precisely, but if they do not align the motivations of managers and employees with the long-term
goals of the firm, then they become counterproductive.
Fortunately good metrics can be identified. We describe a seven-step system to identify
good metrics. This system is based on a thorough understanding of customers, employees, work
processes, and the underlying properties of metrics. It is a flexible system that can be adapted to
any organization by placing different emphasis on various steps.
Metrics: You Are What You Measure! Page 12
Step 1. Start by Listening to the Customer
This first suggestion sounds almost naïve, but it is remarkable how often it is overlooked.
In practice, most metrics tend to be centered around internal corporate needs such as asset
utilization, staff productivity, cost reduction, and cycle time. While these needs are all honorable
and very real, they usually have little direct impact on the customers’ needs. Profits require sales
and sales require customers. Customers purchase products and services that fulfill their needs
better (and at a lower price) than current options. In order to fulfill those needs profitably, the
firm has to understand those needs.
The first step must be to actually go out and talk to the customer. This sounds simple,
but it rarely is. The first question is: Who is the customer?
Let’s return to the office-furniture example. The end consumer who uses office furniture
is one customer. For the office chair, the design team needs to understand consumer needs for
functionality, comfort, durability, back support, etc. The firm should use Figure 1 to choose
metrics that provide the incentives for the team to make decisions and take actions which
improve the office chair design (and related office furniture designs) with respect to these end-
consumer needs.
But there are other customers. Office furniture purchases, like purchases of most
commercial products and services, are characterized by a complex web of multiple decision
makers and influencers. For office furniture these include: 1) facilities managers who must
move, assemble, disassemble, reconfigure, and maintain the equipment, 2) financial managers
who must decide how much the company can spend on the furniture, 3) purchasing managers
who negotiate the terms of the contract, 4) human resources managers who must deal with
health, safety, and ergonomic issues, 5) information systems managers who must run thousands
of kilometers of cable through cubicle and building walls in order to provide voice, data,
lighting, and electrical power to each and every employee, and 6) the architects and designers
who provide influential recommendations and who assess both aesthetic appeal and the
relationship to the firm’s image.
Furthermore, there are many subsystems in the overall office furniture system. Product
development teams must design chairs, integrated desks, filing systems, and dividers.
Components must be purchased, the subsystems must be manufactured, the entire system must
be assembled, and the brand must be marketed and sold. By standardizing components with

Metrics: You Are What You Measure! Page 13
other product lines, the team can reduce total costs. By matching the architecture of chairs and
desks, with that of other subsystems, the chair and desk teams can enhance quality, reduce cycle
time, and enhance consumer-desirability for the entire office system. By designing for
manufacturability and for assembly, the chair and desk teams can reduce production time and
costs. By coordinating with the marketing and sales teams, the chair and desk teams can make
sure that their design matches the overall market image of the office system.
There are many methods for listening to the Voice of the Customer – for all of these
customers. See Griffin and Hauser (1993) for a review. We have worked with firms in nearly
three dozen industries such as automotive, medical equipment, telecommunications, gas and
electric utilities, power generation, transportation, financial services, consumer package goods,
computer hardware and software, photographic equipment, office furniture, entertainment,
apparel, shipping, government services, education, healthcare, gas and oil drilling, and heavy
industrial equipment. Although the specific method must be adapted to the unique
characteristics of each industry, the basic concepts remain constant. The Voice of the Customer
consists of a set of words and phrases that describe, in the customers’ vocabulary, what the
customer wants or desires in a product or service.
Consider the following six phrases as examples of the seventeen needs that we identified
for a specialized imaging product. Notice that they are sufficiently broad to allow a variety of
solutions, but sufficiently specific to describe the product category.
Produces a sharp image
Anyone can use
Can switch image types without waste
Compact and portable
Equipment and supplies always available
Equipment looks serious and professional
Likewise, the following six phrases are examples of some of the twenty-five needs that we
identified for a telephone service center. These needs were used in the metrics project described
earlier.
Metrics: You Are What You Measure! Page 14
Easy to get through at any time
Always able to talk to a real person
Able to have things taken care of in one phone call
The first person to answer is able to handle your call
Phone center works smoothly and efficiently
Phone system menu options are brief and fit my needs
Furthermore, these six phrases can be aggregated to form even higher-level needs, in this case
“Accessibility.” They can also be disaggregated to provide more detailed information.
Customer needs are best determined by direct interviews with customers. We normally
tape record these interviews, transcribe the recordings, identify the words and phrases, and
“winnow” these words and phrases to identify a unique set. We then ask customers to sort the
needs and provide prioritization of the needs.
These needs are not yet metrics. They are indicators of the outcomes that, ultimately,
lead to long-term profit. If the Voice of the Customer is sufficiently detailed, these customers’
needs can be tied to the decisions and actions of the imaging system or the telephone service
center design team. We then search for metrics which align those decisions and actions with the
long-term profitability of the firm. These metrics become the “knobs” we turn to focus
managers and employees on fulfilling customer needs profitably.
Step 2. Understand the Job
After we understand the customer, we must understand the managers and employees. We
need answers to the following questions: What do managers and employees value? And how do
their decisions and actions affect the metrics and the desired outcomes? The methods are
analogous to the Voice of the Customer, but we now focus on the firm’s own managers and
employees. We call this step “The Voice of the Employee (VOE).”
What managers and employees value. Managers and employees value more than salary
and bonuses. They value respect, the ability to learn new skills, an interesting and exciting
challenge, the chance to choose the assignment upon which they will work, the perception that
their rewards are fair relative to their peers, a good work environment, and a feeling that they
themselves provide value. These are but a few of the phrases we have heard from interviews

Metrics: You Are What You Measure! Page 15
with employees all the way from the factory floor to the highest professional ranks. More
importantly, these “softer” rewards have high monetary value. For example, in interviews with
121 U.S. executives, Wernerfelt, et. al. (1997) found that these soft rewards had high values
relative to monetary salaries. In their sample, the average salary was $62,000 per year. But
relative to that, the average executive placed a value on “respect” at over $13,000 and on “clear
expectations” at almost $5,000.
We are often able to identify rewards that are low in cost to the firm but high in value to
the employees. For example, employees at the telephone service center of an electric utility felt
isolated from the power generation and transmission parts of the organization. As a reward for
improvements in their customer-satisfaction scores, they requested a day to tour a power plant,
something that most utility phone reps never experience! The firm was more than happy to
provide this reward.
How decisions and actions affect metrics and desired outcomes. We worked with a
government research and engineering center that wanted to enhance its performance and results.
But before we could evaluate candidate metrics, we had to understand how the scientists,
engineers, managers, and support personnel produced results. We interviewed a representative
sample of all of the center’s employees in order to identify and classify their daily tasks. Some
activities related directly to the center’s core output while other activities enhanced its capability
to do so. Still other activities enabled communication among critical employees, “sold” research
to internal customers, and kept costs down. Other activities maintained an attractive working
environment and enhanced collegiality.
Such an understanding of work processes is critical to the implementation of a metrics
system. If we measure time and effort allocations under the current metrics system, this becomes
a baseline against which changes can be measured. If the metrics system is effective, then
employees change their efforts in response to the new metrics system and these efforts improve
outcomes. By first creating a detailed map of work processes, we track and diagnose these
changes to improve the implementation of new metrics.
Sometimes a detailed understanding of the work process provides simple solutions to
critical bottlenecks. By removing these bottlenecks we make it easier for employees to change
their behavior in response to a metrics system. In one instance, we discovered that employees
liked to work late in order to complete their tasks, but could not do so because the parking lots

Metrics: You Are What You Measure! Page 16
were poorly lighted and perceived as unsafe. In another instance, a high technology company
had installed blackboards in the halls to encourage the informal exchange of information among
scientists and engineers. The concept was good in theory, but in practice the halls were too
narrow.11 In both cases no metric system would improve outputs without a redesign of the
workspace to enable employees to make the decisions and take the actions that they knew were
necessary to achieve their metrics-based goals.
Step 3. Understand the Interrelationships
Let’s return to the car-door design team. Their internal customer might be the
manufacturing division. Suppose we ask the manufacturing division to rate their satisfaction
with the design team’s design. In turn, we might evaluate the manufacturing division on
manufacturing costs and on manufactured quality (few defects). It should not surprise us that
these metrics cause manufacturing to reward simple, low-cost car-door designs. Unless we
balance these demands with demands to fulfill external customer needs, we risk misaligning the
pressures on the car-door team. They may eschew highly-valued styling or new features for
reduced manufacturing costs.
Thus, at a minimum, we must include in any Voice of the Customer analysis the demands
of all internal customers and internal suppliers. Perhaps more importantly, we must consider
these interrelationships in the design of a metrics system. Hauser, Simester, and Wernerfelt
(1997) demonstrate how interdependent metrics systems align internal customers and internal
suppliers. In one of their examples, called a “target value system,” the internal customer chooses
its targets and is rewarded for achieving those targets. The internal supplier is rewarded based
on the targets themselves. This system gives the internal supplier the incentives to produce
outputs or supply services which encourage the internal customer to set higher targets. The car-
door design team (the internal supplier) will select designs that encourage manufacturing (the
internal customer) to set lower cost targets. The car-door design team will balance these designs
to encourage marketing (another internal customer) to set higher sales targets. Lower costs and
greater sales lead to more profit for the firm.
11 Personal communication from Ralph Katz of Northeastern University.

Metrics: You Are What You Measure! Page 17
Step 4. Understand the Linkages
The Voice of the Customer (Step 1), combined with a deep understanding of the firm’s
objectives, identifies the outcomes that we are trying to improve with the metrics system. The
Voice of the Employee (Step 2) identifies the efforts and work processes. The interrelationship
analysis (Step 3) makes sure that we have considered all customers, suppliers, peers, and other
actors. To complete Figure 1 we must now link efforts to metrics and efforts to outcomes.
The “House of Quality” paradigm is an effective tool to understand that linkage. The
House of Quality (Hauser and Clausing 1988) was developed as part of the quality movement. It
is used by many firms to link customer needs to engineering characteristics and design decisions.
We have found that it adapts nicely to the linkage of work processes.
The basic House-of-Quality Metrics matrix is illustrated in Figure 2. We begin by listing
the desired outcomes on the left side of the matrix. These outcomes are often customer needs,
but they can include high-level corporate goals such as sales, profit, customer satisfaction, or
reduced costs. To avoid pitfalls 1 and 2, they should be observable without excessive delays or
risk. To avoid pitfall 3, managers and employees should be able to make decisions and take
actions that have a direct influence on these outcomes. To help us set priorities, we list
importance weights for each of the outcomes on the right-hand side of the matrix. These are
usually displayed in a numerical scale, say from 0 to 100. The priority rating for customer needs
comes from the Voice of the Customer analysis; the priority rating for other outcomes from
managerial goals.

Metrics: You Are What You Measure! Page 18
Outcomes
Customer NeedsRevenueCostsProfit IndicatorsEtc.
Team Performance
and
Team Goals
Performance Metrics
Impo
rtanc
es
Correlations
Priorities
Benchmarks
Targets
Relation-ships
Figure 2. House-of-Quality Metrics Matrix
We next list candidate performance metrics along the top of the matrix. These metrics
are the “knobs” that the managers and employees turn to respond to the needs and outcomes
listed on the left-hand side of the matrix. The body of the matrix indicates the correlations
between the metrics and the outcomes. For the metrics matrix we assign a high correlation if
decisions and actions which improve the metric also improve the outcome. (If efforts affect both
metrics and outcomes, then this will induce a correlation between metrics and outcomes.) We
infer these correlations by understanding the work processes identified through the Voice of the
Employee. This understanding allows us to select metrics which align work processes with
outcome goals.
Along the right-hand side of the matrix, we also list current performance levels and team
goals. Along the bottom of the matrix we list benchmarks and tentative targets. From the
importances and the correlations we impute priorities for the metrics. Finally, we summarize the
interrelationships (Step 3) among metrics in the “roof” of the House. These interrelationships
are particularly important if we are simultaneously setting metrics for internal customers and
internal suppliers in order to highlight and avoid (or at least manage) potential conflicts.

Metrics: You Are What You Measure! Page 19
We now have the information with which to select candidate metrics. By using the
House-of-Quality Metrics matrix and by keeping the seven pitfalls in mind, management teams
can propose metrics that have a good chance of aligning employee actions and decisions with the
long-term needs of the firm.
Let’s return to our telephone service center. One of the customer needs was “phone
menu options that are brief and fit my needs.” The firm identified metrics that were linked to
this need. These metrics included: (1) the number of seconds it took for a caller to listen to all
of the options, (2) the percent of callers who used one of the standard options rather than
pressing “0” or the “all other” selection, and (3) the percent of callers who chose the “right”
option for their need (and thus did not require a transfer). By seeking to do well on these
metrics, the phone-system designers were likely to fulfill the customers’ needs.
Step 5. Test the Correlations and Test Manager and Employee Reaction
The best firms hire bright, creative managers and employees. No matter how carefully
we design a metrics system, these managers and employees have the motives and capabilities to
maximize their own well-being under the system. We hope that those decisions and actions are
the decisions and actions that are in the firm’s best interests, but, a priori, we cannot be sure.
Step 5 tests the metrics system. We recommend two types of tests. Test the correlations and then
test manager and employee reaction.
Testing the correlations. We illustrate this test with an example. The Charles Stark
Draper Laboratory (Draper) is an independent, but government-funded, research laboratory. Its
mission is the discovery and development of new scientific and technical capabilities. They
proposed a set of metrics to evaluate the selection and execution of research programs (Pien
1997). The candidate list contained forty-four metrics in the following six categories.
• Personnel capabilities
• Technical capabilities
• Strategic fit
• Project management performance
• Match to customer needs
• Financial outcomes
Metrics: You Are What You Measure! Page 20
To test these metrics and to identify and select a reduced set of “lean metrics,” Pien
traced each program back five years to determine what value each metric would have had in
1992. He evaluated and summarized each program with a single composite score based on the
complete set of metrics. He then obtained judged performance (from Draper’s management) in
1997 and he compared the 1997 management evaluation to the 1992 metric score. They were
highly correlated (0.934 correlation, significant at the 0.01 level) suggesting that when
researchers maximized the metrics they were also maximizing outcomes. More importantly, Pien
was able to identify a much smaller subset of these metrics that were easier to collect and
simpler to implement, but which provided equally impressive predictive correlations.12 We are
currently in the process of testing Pien’s methodology more widely.
Test manager and employee reaction. Once we establish that the metrics have high
correlations, we are ready to test the system in situ by implementing the metrics system. We
would prefer to compare the before/after reaction of a test group, which is subject to the metrics,
with a control group, which is not. However, this is not always feasible.13 It is important,
however, that we “instrument” the implementation. For example, in one pilot application we
used a methodology, pioneered by Allen (1970, 1984), to track the work processes identified by
the Voice of the Employee. Each month all managers and employees, who were subject to the
new metrics system, completed short surveys in which they indicated how they allocated their
time among the work processes. By tracking changes in the patterns of work processes over time
we trace the impact of the metrics system. We supplement this tracking with brief surveys to
determine job satisfaction, morale, commitment to the organization, attitudes, and the judged
impact of the metrics system. We also track internal measures such as attrition and the outcome
measures which are listed on the left side of the House-of-Quality Metrics matrix. These
methodologies are still under development. However, early indications suggest that the
“instrumentation” does not require significant time from the managers and employees and that it
yields valuable insight.
12 Pien (1997) asked a cross-section of managers to rate the importance of each candidate metric. He then chose the highest scoring metric from each category. By using stepwise regression (metrics vs. outcomes) he was able to obtain a set of weights for the lean metrics. In addition, he used factor analysis to display the metrics on a two-dimensional grid. This grid provides a simple summary of program performance. 13 For one before/after, test vs. control design implemented in both the US and Spain, see Simester, et.al. (1997).

Metrics: You Are What You Measure! Page 21
Step 6. Involve Managers and Employees
Our philosophy has always been that those who are subject to the metrics systems should
be part of the team that is responsible for developing them. “Town meetings” and other
feedback systems are extremely valuable in the implementation of any metrics system.
Managers and employees want to do well for the firm – they are frustrated when they perceive
that a metrics system is counterproductive. They are vocal and their recommendations are
valuable. Any metrics system which is simply imposed from above without participation from
those it impacts is likely to encounter resistance and even sabotage! The reps in our telephone
service center example were, in fact, a unionized work force. Only by including some of the
most senior and highly respected union members on the team was it possible to design a system
that the union could accept and embrace.
Another principal of metrics comes straight from the father of the quality movement, W.
Edwards Deming. Deming advocated measuring “the system” rather than the individual. This
principal was used in measuring “call courtesy.” By having highly respected peers (an expert
panel) secretly listen to and grade calls for courtesy, but by only publishing the results as a
composite for the entire group, the phone reps were able to focus on team performance rather
than worrying about being “caught” or “labeled” as a culprit.
We always involve managers and employees in the development of their metrics. R&D
scientists will tell you when their evaluation system is forcing them to sacrifice the long-term
capabilities of the firm; telephone service reps will tell you how the evaluation system is forcing
them to engage in counterproductive activities; and production employees will tell you when
their managers are not giving them the advice and guidance that they need. These employees are
the front-line of your organization. They live with the metrics system every day and it can affect
their lives in big ways. They have the knowledge. You need only listen and react.
Step 7. Seek New Paradigms
Our seventh step is a caution. Use the information of Steps 1-6 creatively. Metrics
enable you to get the most out of your managers, employees, and current work processes, but
they should not limit you. Just as Scott Cook looked at his telephone service center and
determined that his real goal was to design software that did not need support, so should you
look at any metrics system and ask whether there is a new paradigm by which you can achieve

Metrics: You Are What You Measure! Page 22
your goals. Metrics need not reinforce current processes. By considering your goals creatively
you can develop new processes. By focusing on the outputs (the outcomes in Figure 2) rather
than the inputs (the work processes) you can identify new paradigms. Good metrics free your
managers and employees to discover new, more efficient ways to accomplish your goals.
A final example should illustrate this. Following industry practice, one of our electric-
utility clients routinely charged a hefty deposit for any new account in order to protect itself
against bad credit risks and non-payment. This was sound financial practice for residential
accounts. However, many of its commercial accounts were large real-estate developers,
retailers, or other businesses who constantly needed to establish service on a vacant space for a
short period until the space was leased to a new tenant. To the electric company, these looked
like and were treated as “new accounts.” But to the customers, who were large, reliable, well-
known businesses, this was an incredible nuisance and irritant. Digging deeper we found that, if
the customer called to complain, the deposit requirement was routinely waived. The firm began
its analysis of this customer-articulated problem by establishing three metrics: (1) the percent of
commercial deposit requests that were waived, (2) the percent of customers who did not pay,
and (3) the monetary value of these uncollected accounts. After analyzing several months of
data, the firm discovered that an astonishing 40% of all commercial deposit requests were
waived, that few commercial customers defaulted, and that the monetary value of uncollected
accounts was small!
A team met to discuss this data. After several hours discussion about how to make the
deposit collection process smoother and more palatable, one team member asked the key
paradigm-shifting question: Does the protection against bad debts that we are obtaining from
deposit requirements justify the ill will created among our customers? Does it even justify the
administrative time it takes to process the waivers? It didn’t take long to reach the obvious
consensus or to alter the process. The policy was changed. A deposit is now required only if the
customer is a known credit risk. As a default, the firm trusts its customers until there is evidence
to the contrary – a new paradigm, and a better solution!
Good Metrics Empower the Organization
Metrics empower managers and employees to make the decisions and take the actions
that they believe are the best decisions and actions to achieve their metrics. If the metrics are
Metrics: You Are What You Measure! Page 23
chosen carefully, then, in the process of achieving their metrics, managers and employees will
make the right decisions and take the right actions that enable the firm to maximize its long-term
profit.
But choosing the right metrics system is not easy. Metrics can have unintended and
unanticipated consequences. They have unanticipated consequences simply because managers
and employees are smart and creative in their efforts to succeed. The firm becomes exactly what
it seeks to measure.
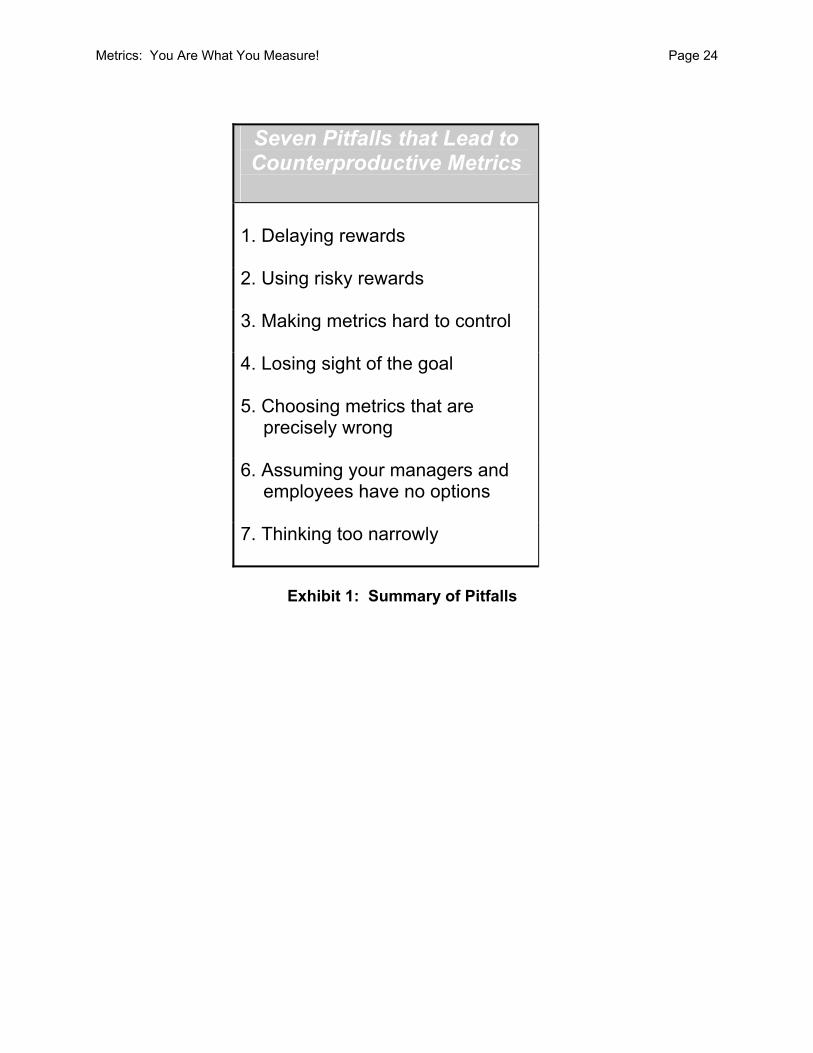
In this paper we summarized our experience (and the academic literature) to indicate
seven pitfalls to avoid when selecting metrics (see Exhibit 1). If you avoid these pitfalls, you
have gone a long way toward choosing effective metrics. But identifying and implementing a
metrics system is hard work. You must listen to your customers and your employees, understand
their work processes and interrelationships, test your metrics, enlist your managers and
employees, and, above all, be creative (see Exhibit 2). By following these seven steps you can
assure that your metrics system is productive and that your metrics system is “lean” and
efficient.
Metrics: You Are What You Measure! Page 24
Seven Pitfalls that Lead to Counterproductive Metrics
1. Delaying rewards 2. Using risky rewards 3. Making metrics hard to control 4. Losing sight of the goal 5. Choosing metrics that are
precisely wrong 6. Assuming your managers and
employees have no options 7. Thinking too narrowly
Exhibit 1: Summary of Pitfalls
Metrics: You Are What You Measure! Page 25
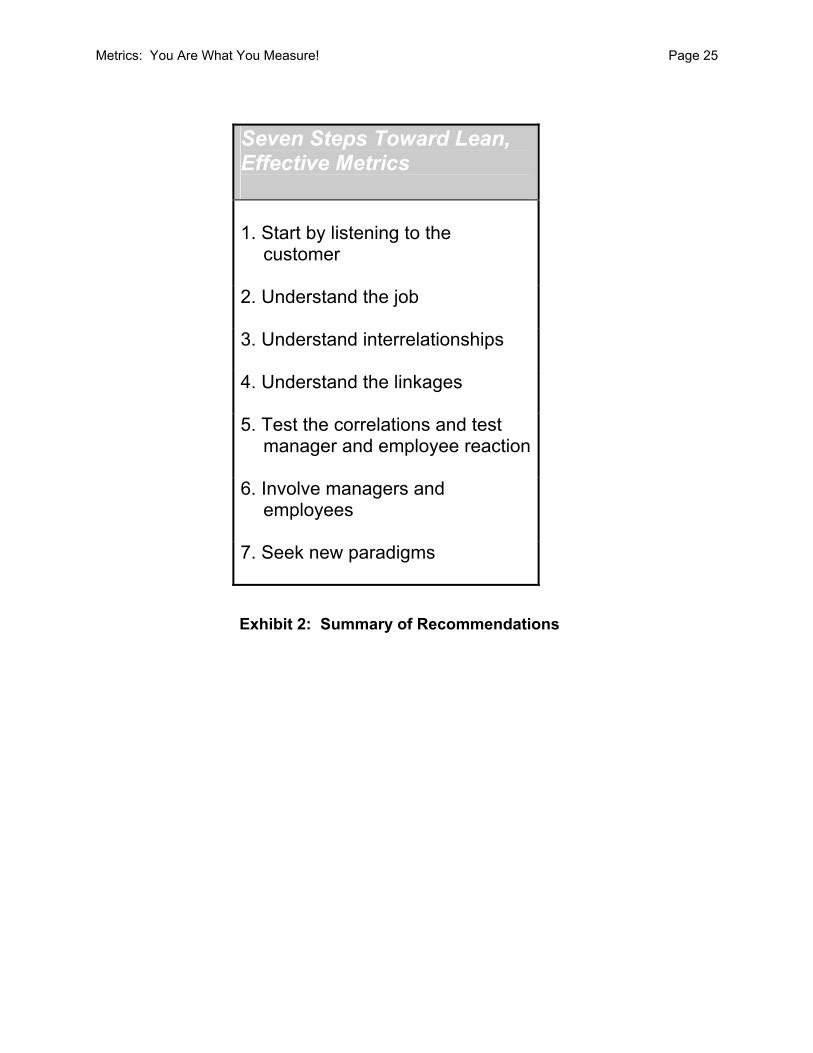
Seven Steps Toward Lean, Effective Metrics 1. Start by listening to the
customer 2. Understand the job 3. Understand interrelationships 4. Understand the linkages 5. Test the correlations and test
manager and employee reaction 6. Involve managers and
employees 7. Seek new paradigms
Exhibit 2: Summary of Recommendations

Metrics: You Are What You Measure! Page 26
References Acree, Terry E. (1995), Encyclopedia of Chemical Technology, 4th Edition, 11,1-16, John Wiley &
Sons, New York, NY. Allen, Thomas J. (1970), “Communications networks in R&D Laboratories,” R&D Management,
1, 14-21. ______ (1984), Managing the Flow of Technology, MIT Press, Cambridge, MA 02142. Baker, George, Robert Gibbons, and Kevin J. Murphy (1994), “Subjective Performance
Measures in Optimal Incentive Contracts,” Quarterly Journal of Economics, (November).
Black, Fischer and Myron Scholes (1973), “The Pricing of Options and Corporate Liabilities,”
Journal of Political Economy, 3, 637-654. Boulding, William, Ruskin Morgan, and Richard Staelin (1997), “Pulling the Plug to Stop the
New Product Drain,” Journal of Marketing Research, 34, (February), 164-176. Case, John (1991), ”Customer Service, The Last Word,” Inc. Magazine, (April). Gibbons, Robert (1997), “Incentives and Careers in Organizations,” in D. Kreps and K. Wallis
(eds.) Advances in Economic Theory and Econometrics, Cambridge, UK: Cambridge University Press), 1-37.
Griffin, Abbie and John R. Hauser (1993), "The Voice of the Customer," Marketing Science, vol.
12, No. 1, (Winter), 1-27. Faulkner, Terrence W. (1996), "Applying `Options Thinking' to R&D Valuation," Research
Technology Management, (May-June), 50-56. Hauser, John R. (1998), “Research, Development, and Engineering Metrics,” forthcoming
Management Science. ______ and Don Clausing (1988), "The House of Quality," Harvard Business Review, Vol. No.
3, (May-June), pp. 63-73. ______, Duncan I. Simester, and Birger Wernerfelt (1994), "Customer Satisfaction Incentives,"
Marketing Science, 13, 4, 327-350. ______, ______, and ______ (1996), "Internal Customers and Internal Suppliers," Journal of
Marketing Research, 33, 3, (August), 268-280.

Metrics: You Are What You Measure! Page 27
______ and Florian Zettelmeyer (1997), “Metrics to Evaluate R,D&E,” Research Technology Management, (July-August), 32-38.
Keeney, Ralph L. and Howard Raiffa (1976), Decisions with Multiple Objectives: Preferences
and Value Tradeoffs, (New York: John Wiley & Sons). Kerr, Steven (1975), “On the Folly of Rewarding A, While Hoping for B, Academy of
Management Journal, 18, 769-783. Lodish, Leonard (1974), “`Vaguely Right’ Approach to Sales Force Allocations,” Harvard
Business Review, 52, (January-February), 119-124. McGrath Michael E. and Michael N. Romeri (1994), "The R&D Effectiveness Index: A Metric for
Product Development Performance," Journal of Product Innovation Management, 11, 213-220.
Mitchell, Graham R. and William F. Hamilton (1988), “Managing R&D as a Strategic Option,”
Research Technology Management, (May-June), 15-22. Pien, Homer H. (1997), “R&D Management and the Use of Dynamic Metrics,” S.M. Thesis,
Management of Technology Program, MIT, Cambridge, MA 02142 (June). Roussel, Philip A., Kamal N. Saad, and Tamara J. Erickson (1991), Managing the Link to
Corporate Strategy: Third Generation R&D, Harvard Business School Press, Boston, MA.
Simester, Duncan I., John R. Hauser, Birger Wernerfelt, and Roland Rust (1997), “Implementing Quality Improvement Programs Designed to Enhance Customer Satisfaction: Quasi-experiments in the U.S. and Spain,” Working Paper, International Center for Research on the Management of Technology, MIT, Cambridge, MA 02142.
Simonson, Itamar and Barry M. Staw (1992), “De-escalation Strategies: A Comparison of
Techniques for Reducing Commitment to Losing Courses of Action,” Journal of Applied Psychology, 77, 4, 419-426.
Staw, Barry M. (1976), “Knee-Deep in the Big Muddy: A Study of Escalating Commitment to a
Chosen Course of Action,” Organizational Behavior and Human Performance, 16, 27-44.
Wernerfelt, Birger, Duncan I. Simester, and John R. Hauser (1997), “Influence Transfers,
Performance, and Performance Ratings,” Working Paper, International Center for Research on the Management of Technology, MIT, Cambridge, MA 02142.