Embed Size (px)
Citation preview

METODE PENELITIAN KUANTITATIF
DALAM KAJIAN LINGKUNGAN
Bahan kajian Metode Penelitian Kajian Lingkungan
Diabstraksikan oleh
Soemarno, PMPSLP PPSUB 2011

Quantitative research
In the social sciences, quantitative research refers to the systematic empirical investigation of quantitative
properties and phenomena and their relationships.
The objective of quantitative research is to develop and employ mathematical models, theories and/or hypotheses
pertaining to phenomena.
The process of measurement is central to quantitative research because it provides the fundamental connection
between empirical observation and mathematical expression of quantitative relationships
ImageCharacteristics of the qualitative-quantitative research continuum
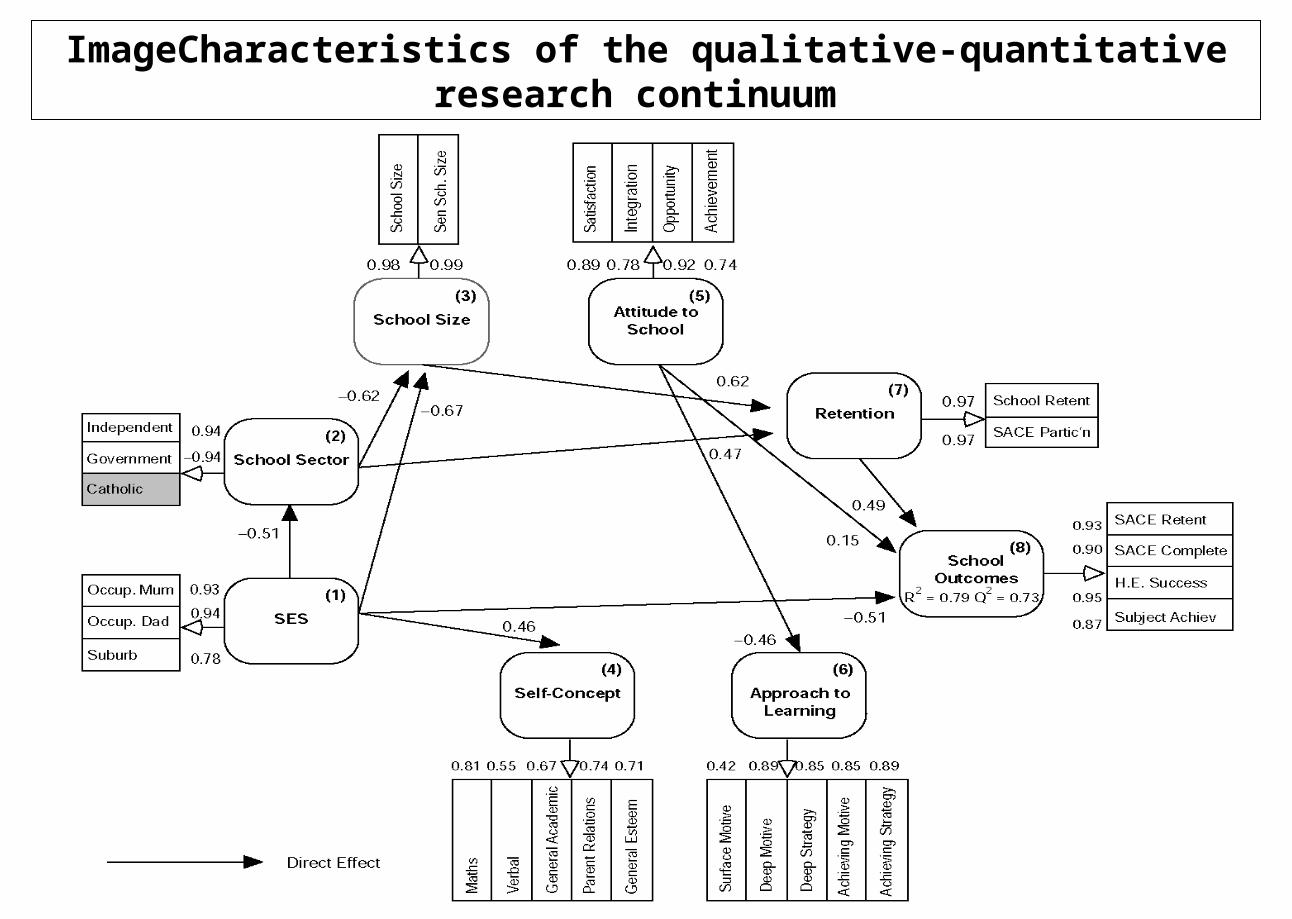
In across-stage mixed model research, quantitative and qualitative approaches are mixed across at least two of the stages of research.
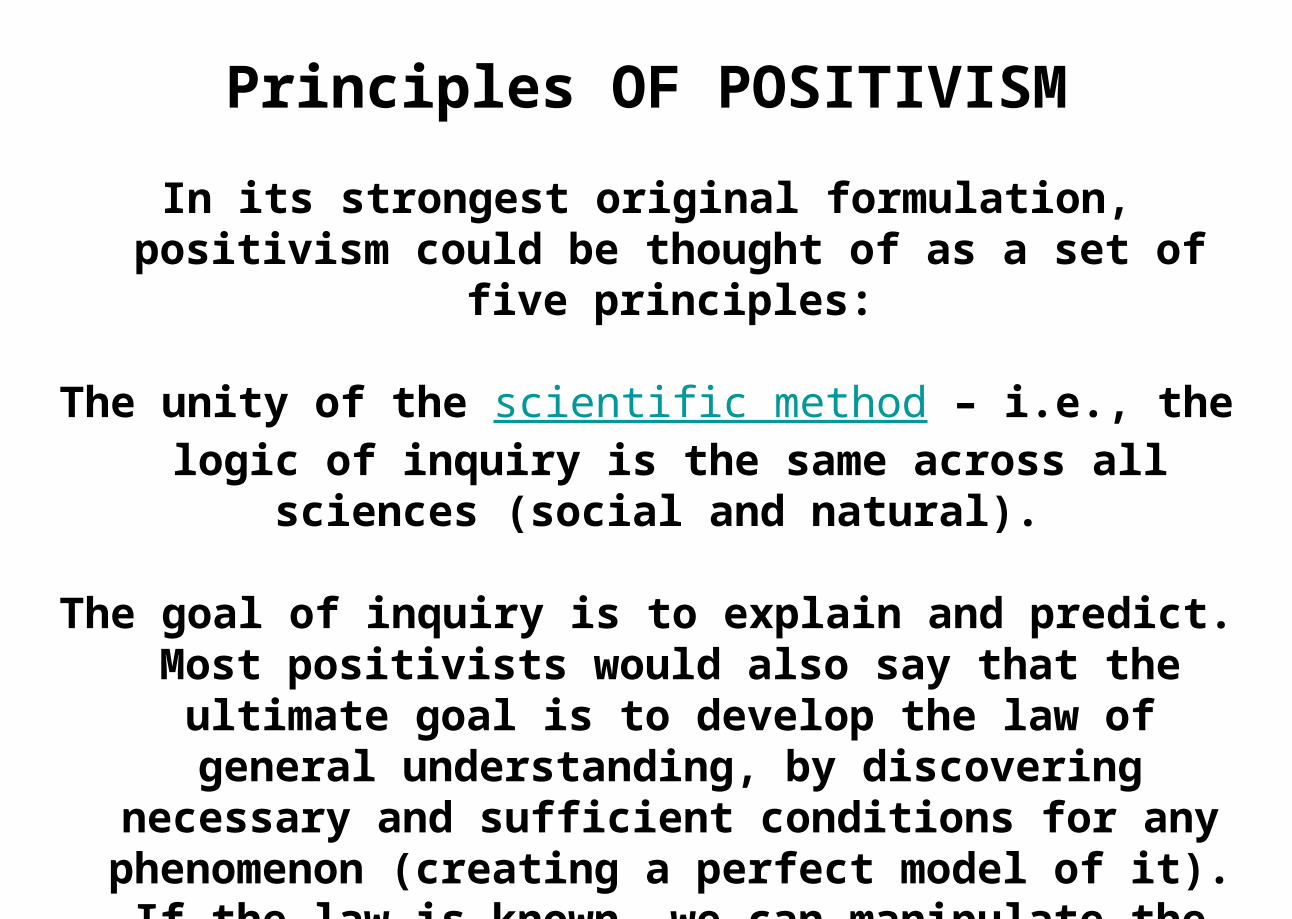
Principles OF POSITIVISM
In its strongest original formulation, positivism could be thought of as a set of five principles:
The unity of the scientific method – i.e., the logic of inquiry is the same across all sciences (social and natural).
The goal of inquiry is to explain and predict. Most positivists would also say that the ultimate goal is to
develop the law of general understanding, by discovering necessary and sufficient conditions for any phenomenon (creating a perfect model of it). If the law is known, we can manipulate the conditions to produce the
predicted result.

Principles OF POSITIVISM
Scientific knowledge is testable. Research can be proved only by empirical means, not argumentations.
Research should be mostly deductive, i.e. deductive logic is used to develop statements that can be tested (theory leads to hypothesis which in turn leads to discovery
and/or study of evidence).
Research should be observable with the human senses (arguments are not enough, sheer belief is out of the
question). Positivists should prove their research using the logic of confirmation.
Principles OF POSITIVISM
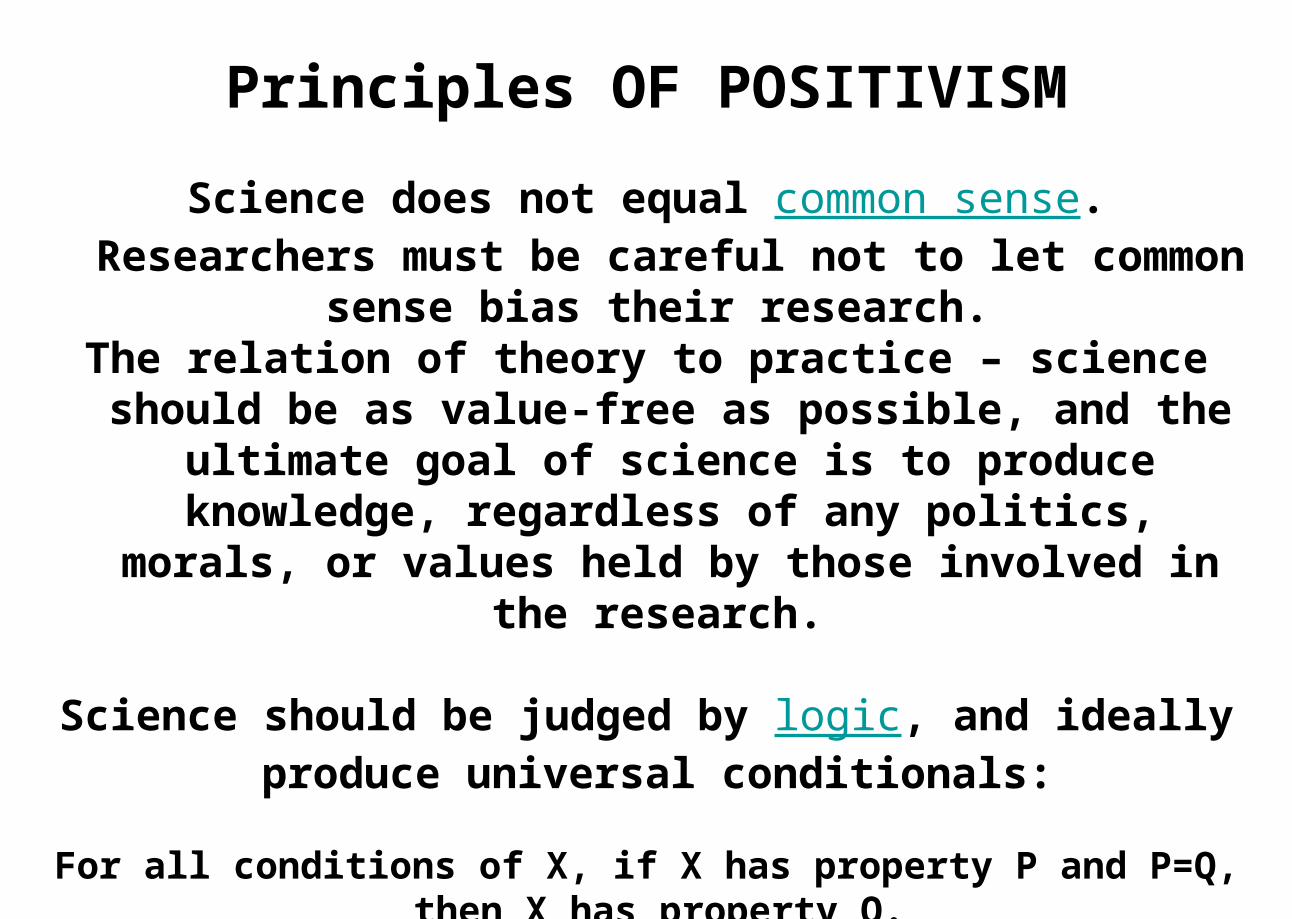
Science does not equal common sense. Researchers must be careful not to let common sense bias their research.
The relation of theory to practice – science should be as value-free as possible, and the ultimate goal of science is
to produce knowledge, regardless of any politics, morals, or values held by those involved in the research.
Science should be judged by logic, and ideally produce universal conditionals:
For all conditions of X, if X has property P and P=Q, then X has property Q.
Statements must be true for all times and places.
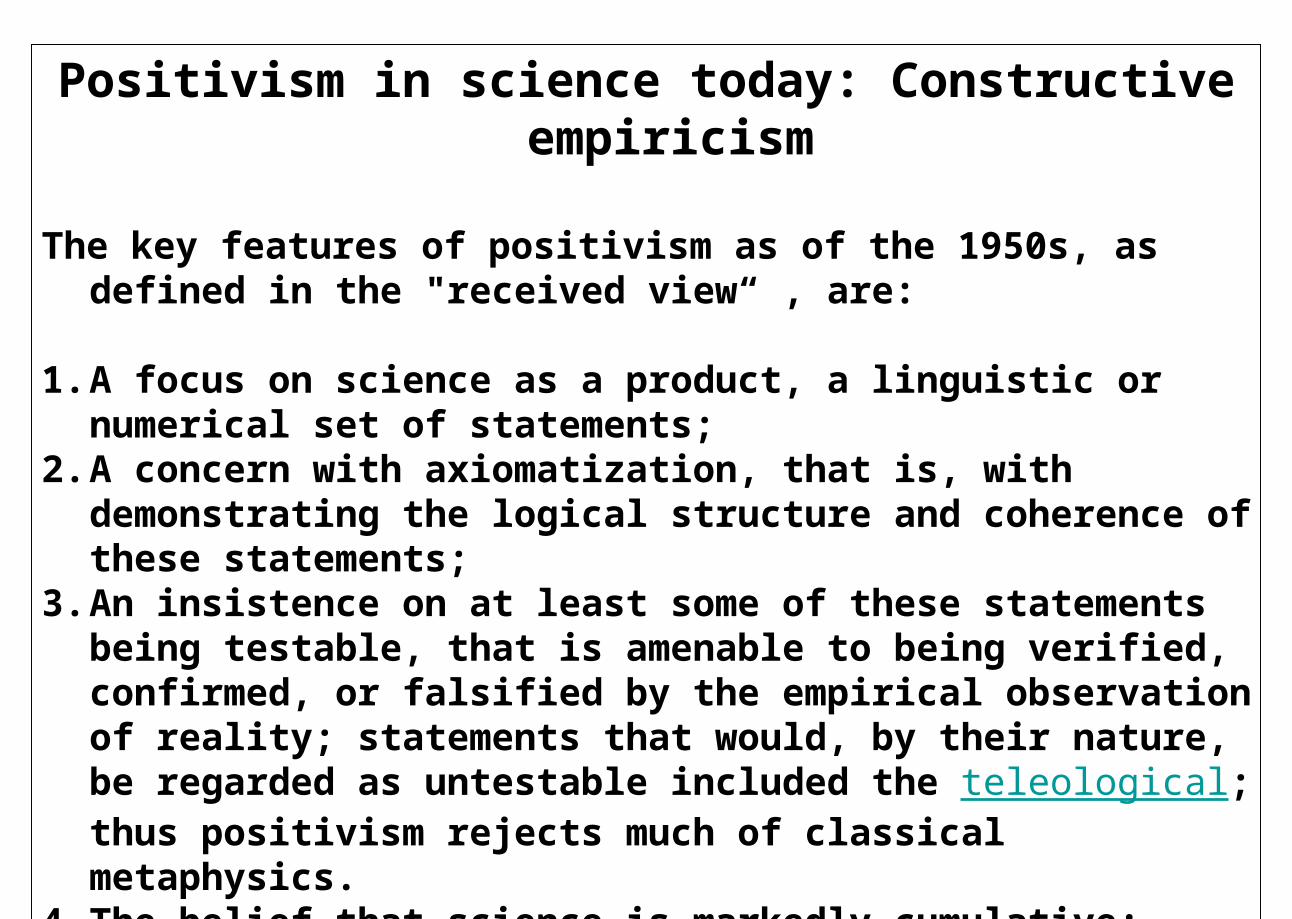
Positivism in science today: Constructive empiricism
The key features of positivism as of the 1950s, as defined in the "received view“ , are:
1. A focus on science as a product, a linguistic or numerical set of statements;
2. A concern with axiomatization, that is, with demonstrating the logical structure and coherence of these statements;
3. An insistence on at least some of these statements being testable, that is amenable to being verified, confirmed, or falsified by the empirical observation of reality; statements that would, by their nature, be regarded as untestable included the teleological; thus positivism rejects much of classical metaphysics.
4. The belief that science is markedly cumulative;
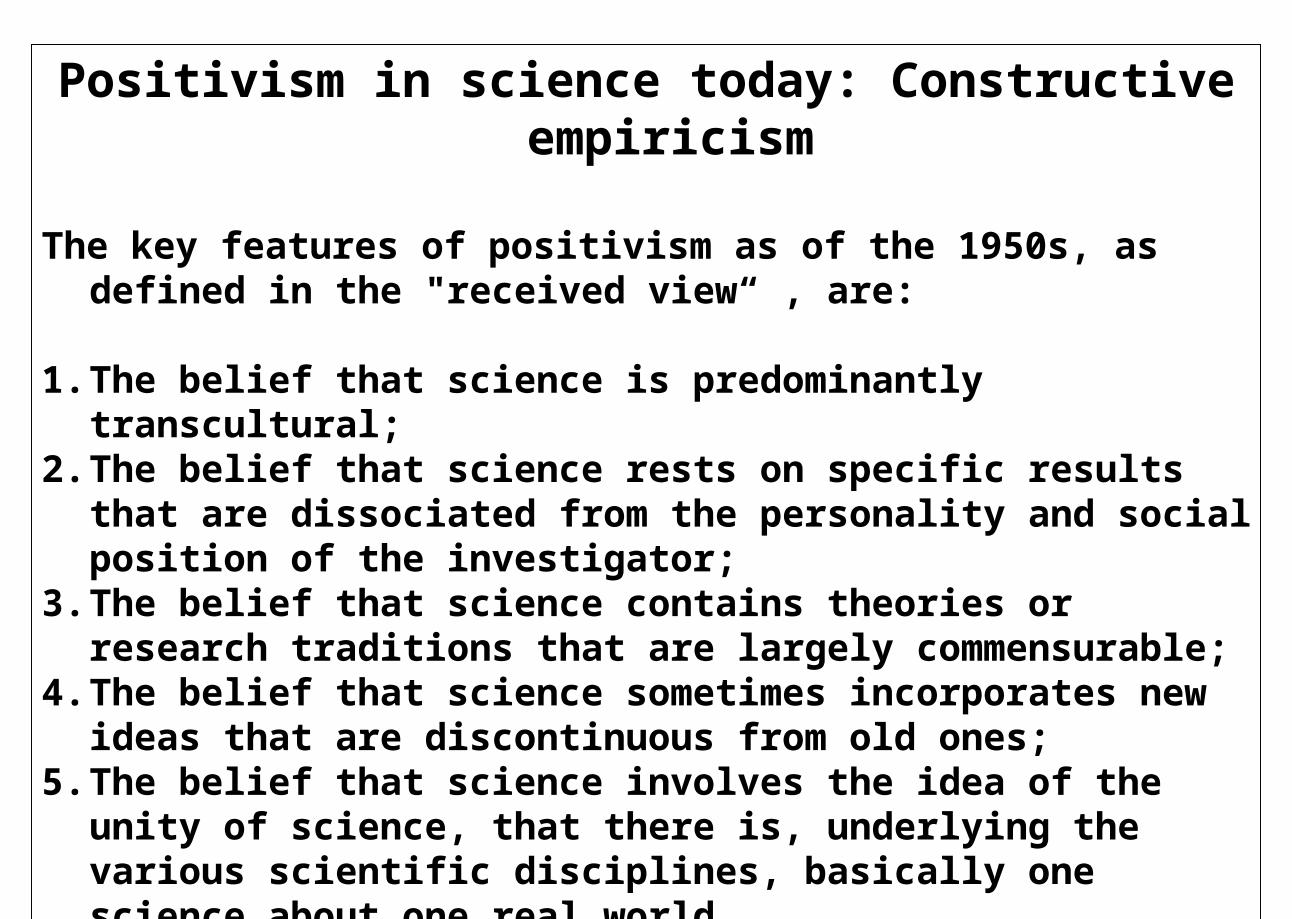
Positivism in science today: Constructive empiricism
The key features of positivism as of the 1950s, as defined in the "received view“ , are:
1. The belief that science is predominantly transcultural; 2. The belief that science rests on specific results that are
dissociated from the personality and social position of the investigator;
3. The belief that science contains theories or research traditions that are largely commensurable;
4. The belief that science sometimes incorporates new ideas that are discontinuous from old ones;
5. The belief that science involves the idea of the unity of science, that there is, underlying the various scientific disciplines, basically one science about one real world.
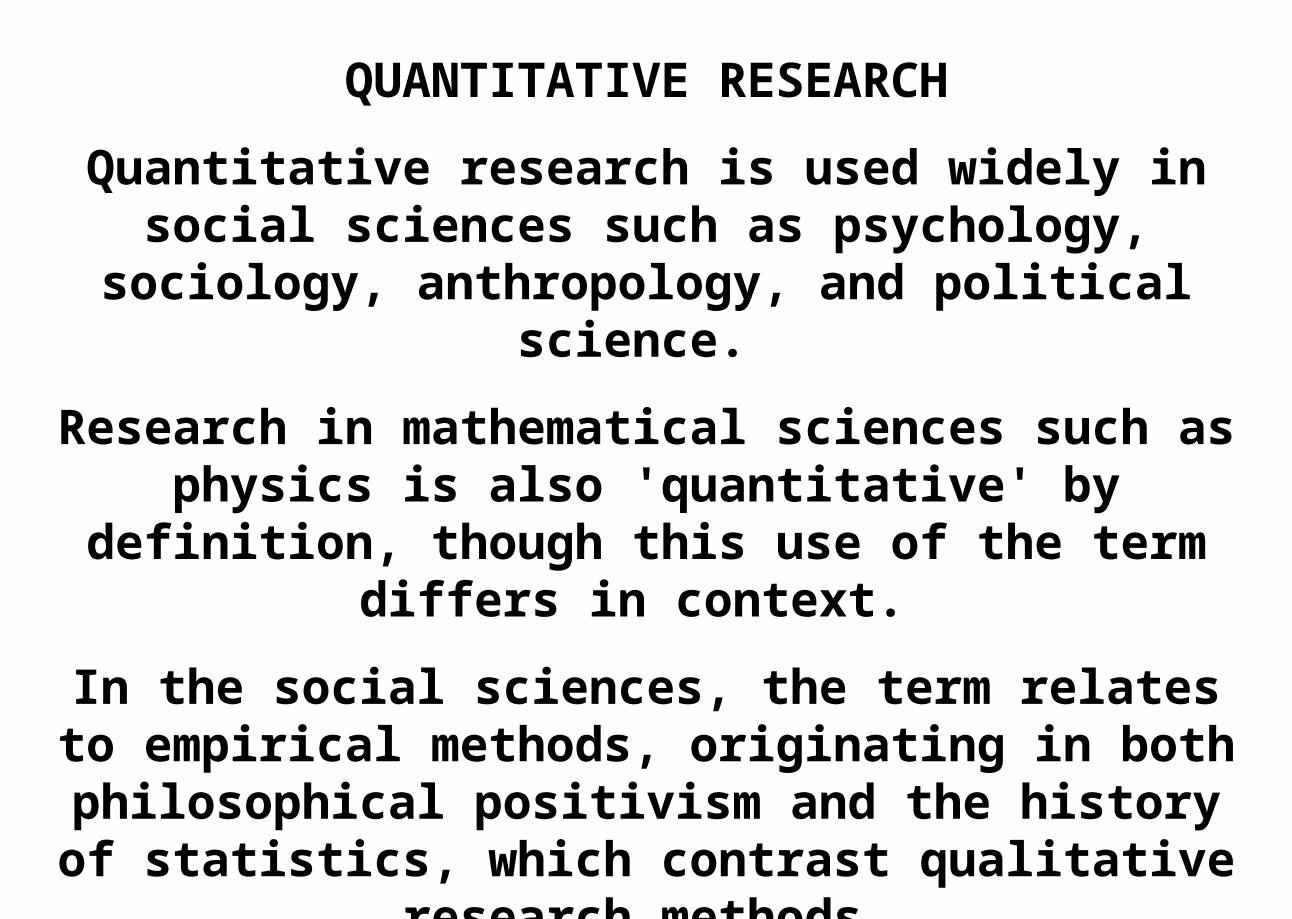
QUANTITATIVE RESEARCH
Quantitative research is used widely in social sciences such as psychology, sociology,
anthropology, and political science.
Research in mathematical sciences such as physics is also 'quantitative' by definition, though this use of
the term differs in context.
In the social sciences, the term relates to empirical methods, originating in both philosophical
positivism and the history of statistics, which contrast qualitative research methods.
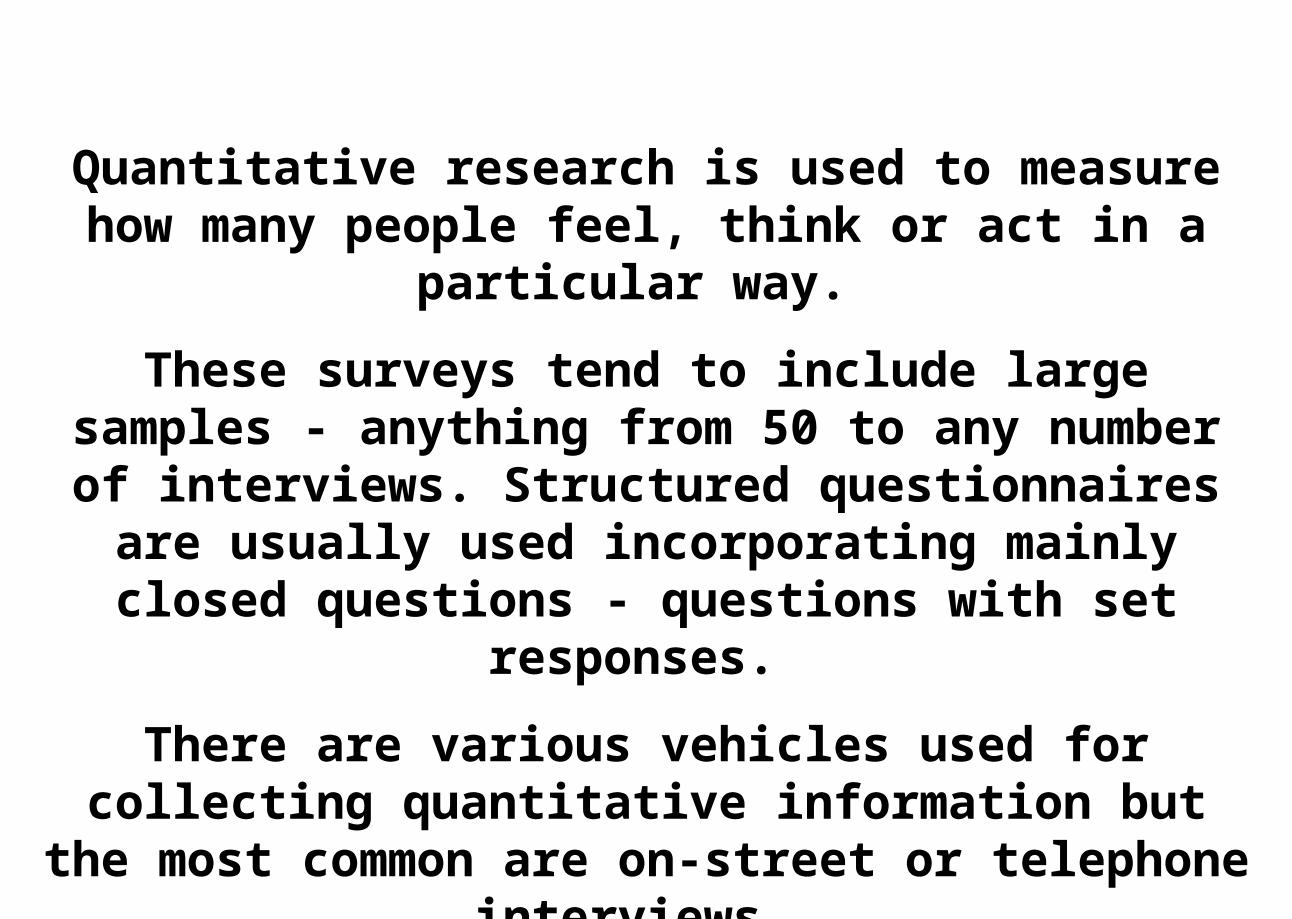
Quantitative research is used to measure how many people feel, think or act in a particular way.
These surveys tend to include large samples - anything from 50 to any number of interviews.
Structured questionnaires are usually used incorporating mainly closed questions - questions
with set responses.
There are various vehicles used for collecting quantitative information but the most common are
on-street or telephone interviews.
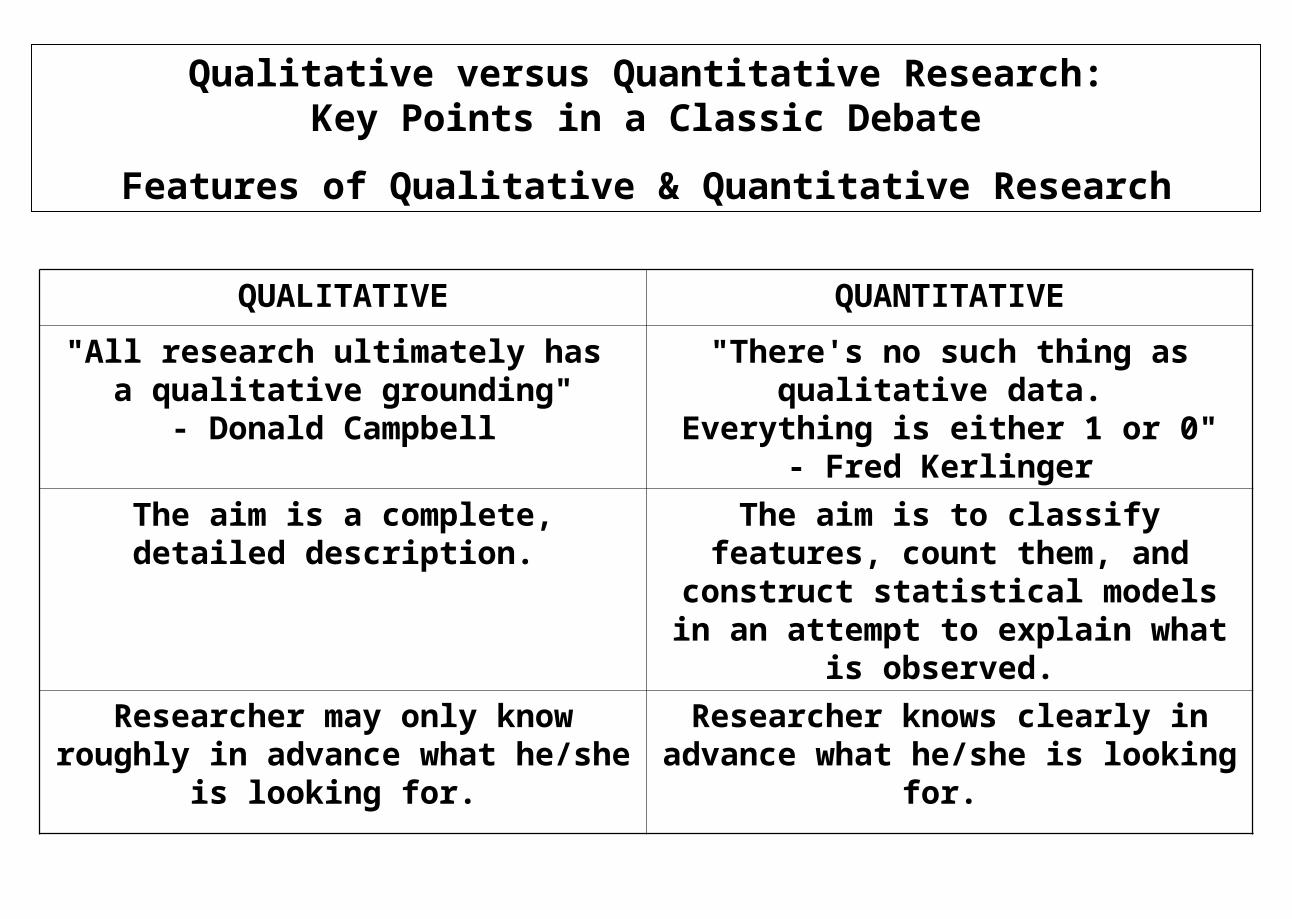
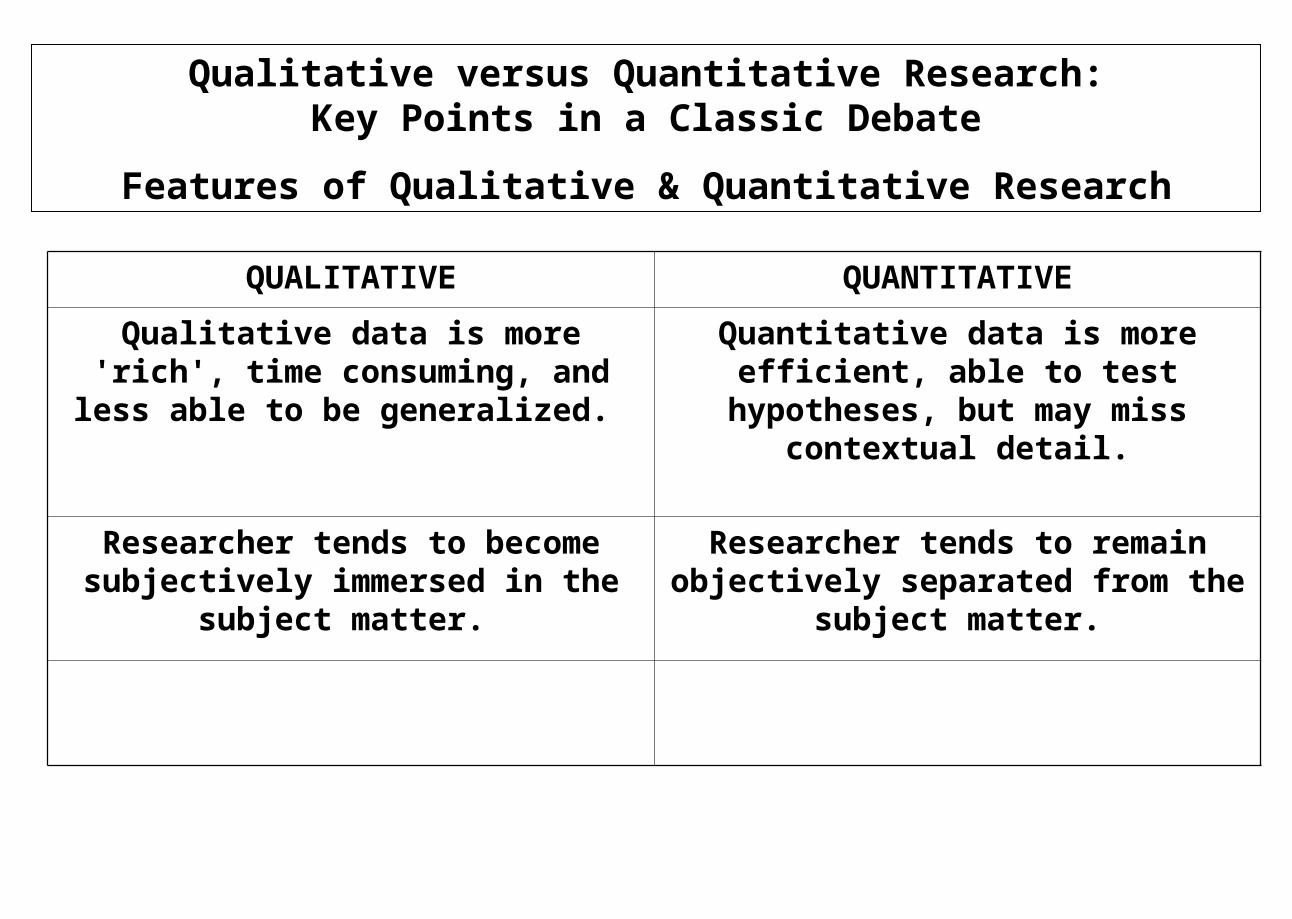
Qualitative versus Quantitative Research:Key Points in a Classic Debate
Features of Qualitative & Quantitative Research
QUALITATIVE QUANTITATIVE
"All research ultimately has a qualitative grounding"
- Donald Campbell
"There's no such thing as qualitative data.
Everything is either 1 or 0"- Fred Kerlinger
The aim is a complete, detailed description.
The aim is to classify features, count them, and construct statistical models
in an attempt to explain what is observed.
Researcher may only know roughly in advance what he/she is looking for.
Researcher knows clearly in advance what he/she is looking for.
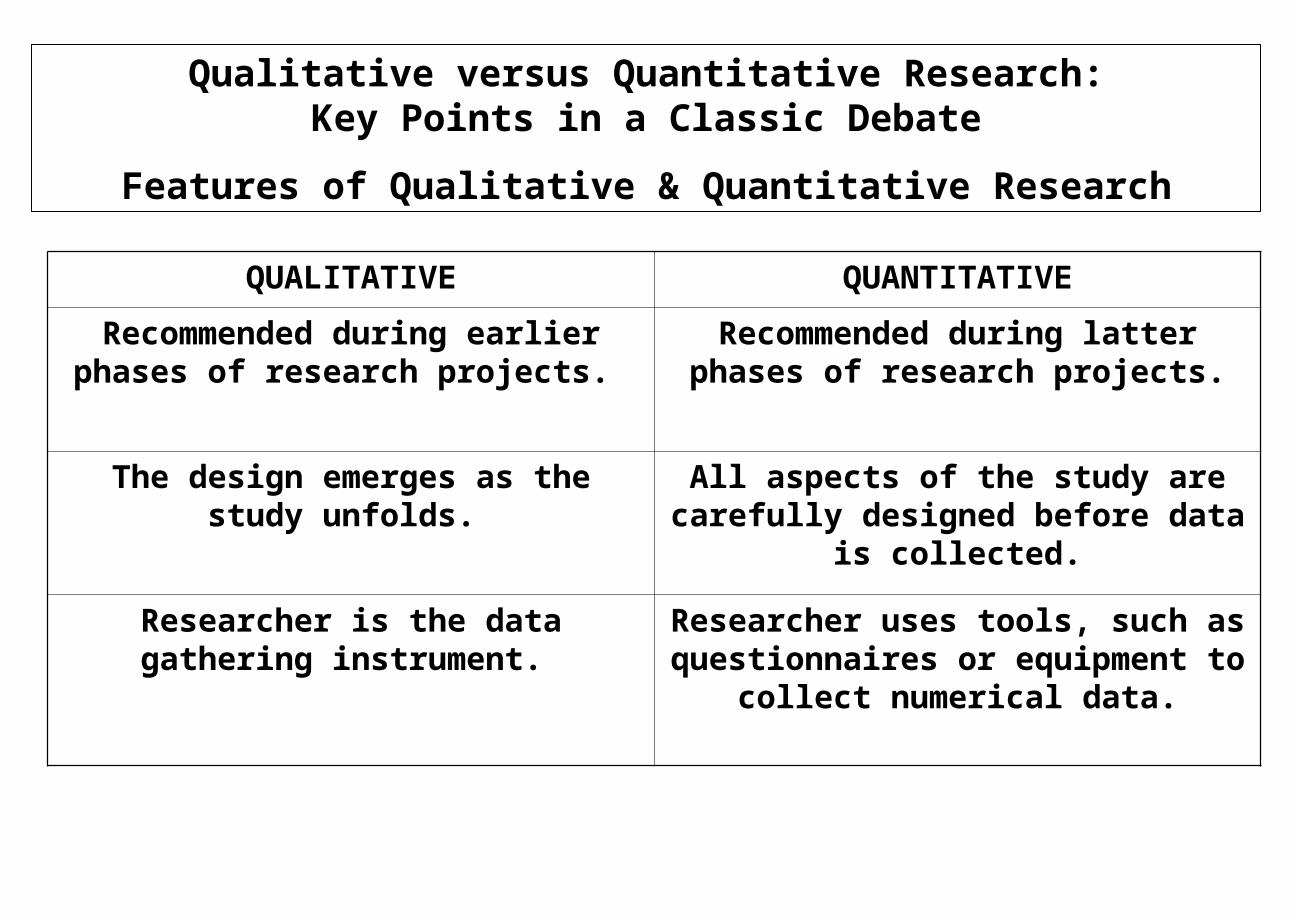
Qualitative versus Quantitative Research:Key Points in a Classic Debate
Features of Qualitative & Quantitative Research
QUALITATIVE QUANTITATIVE
Recommended during earlier phases of research projects.
Recommended during latter phases of research projects.
The design emerges as the study unfolds.
All aspects of the study are carefully designed before data is collected.
Researcher is the data gathering instrument.
Researcher uses tools, such as questionnaires or equipment to collect
numerical data.
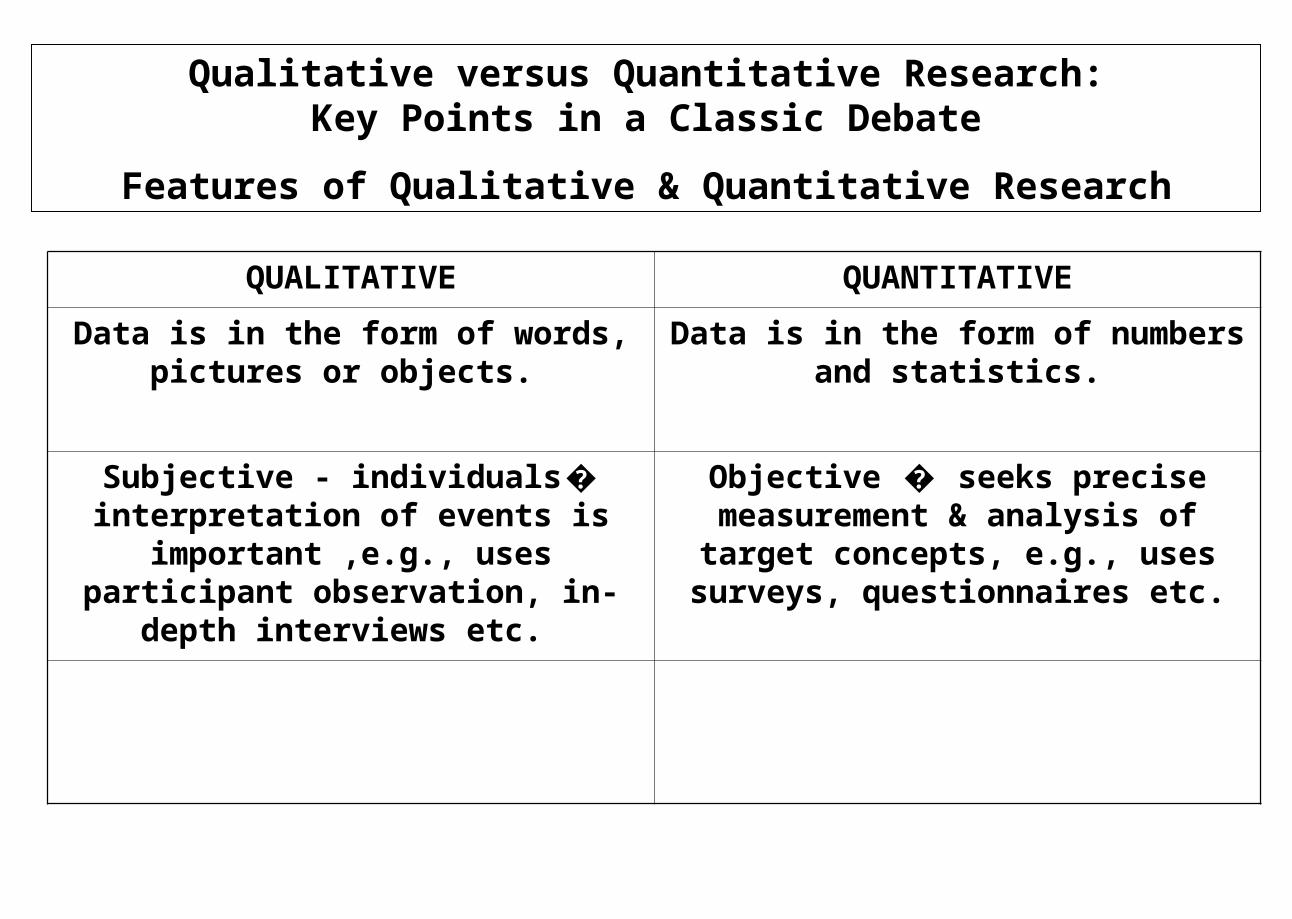
Qualitative versus Quantitative Research:Key Points in a Classic Debate
Features of Qualitative & Quantitative Research
QUALITATIVE QUANTITATIVE
Data is in the form of words, pictures or objects.
Data is in the form of numbers and statistics.
Subjective - individuals �interpretation of events is
important ,e.g., uses participant observation, in-depth interviews etc.
Objective seeks precise �measurement & analysis of target
concepts, e.g., uses surveys, questionnaires etc.
Qualitative versus Quantitative Research:Key Points in a Classic Debate
Features of Qualitative & Quantitative Research
QUALITATIVE QUANTITATIVE
Qualitative data is more 'rich', time consuming, and less able to be
generalized.
Quantitative data is more efficient, able to test hypotheses, but may miss
contextual detail.
Researcher tends to become subjectively immersed in the subject
matter.
Researcher tends to remain objectively separated from the subject
matter.
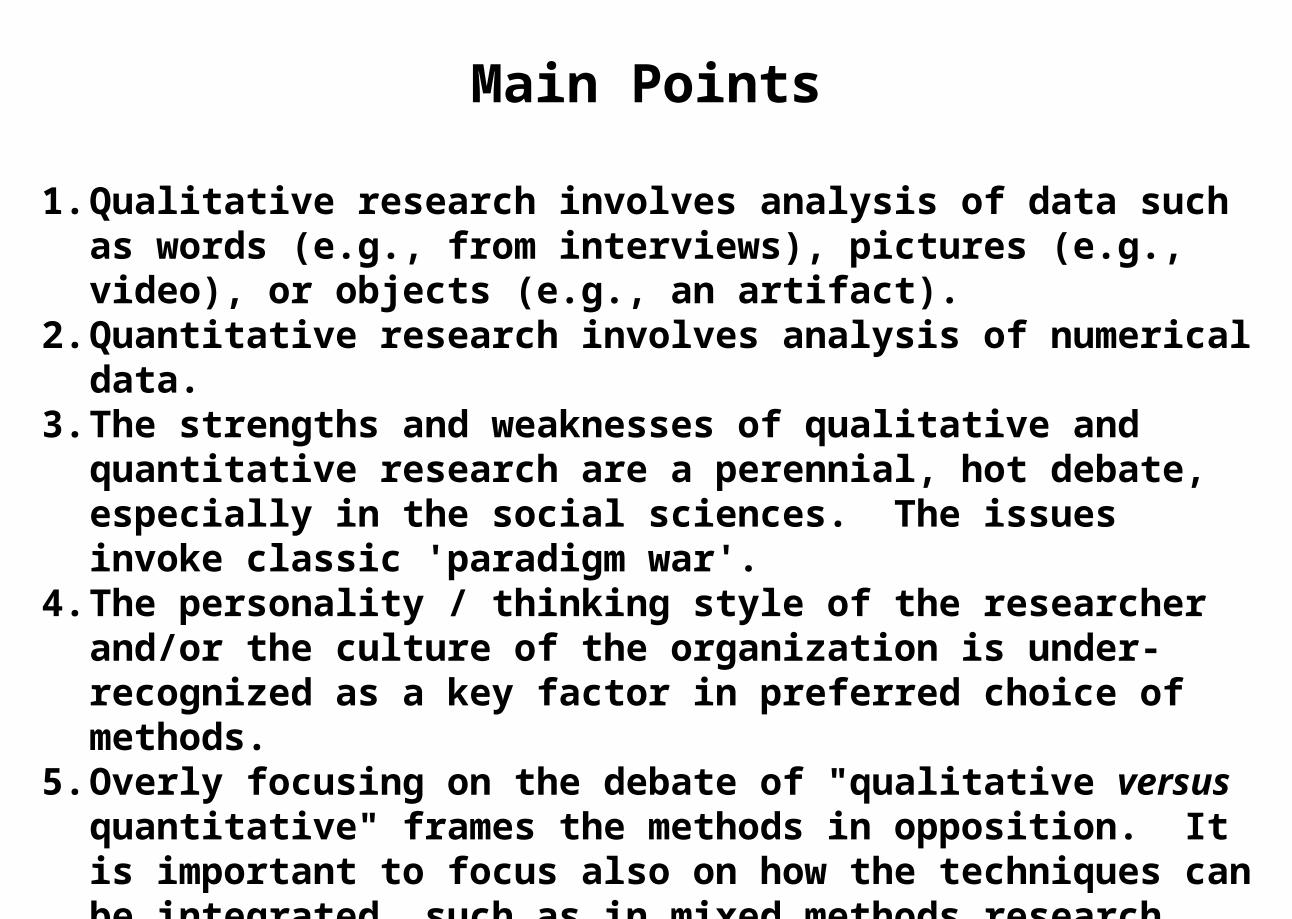
Main Points
1. Qualitative research involves analysis of data such as words (e.g., from interviews), pictures (e.g., video), or objects (e.g., an artifact).
2. Quantitative research involves analysis of numerical data. 3. The strengths and weaknesses of qualitative and quantitative
research are a perennial, hot debate, especially in the social sciences. The issues invoke classic 'paradigm war'.
4. The personality / thinking style of the researcher and/or the culture of the organization is under-recognized as a key factor in preferred choice of methods.
5. Overly focusing on the debate of "qualitative versus quantitative" frames the methods in opposition. It is important to focus also on how the techniques can be integrated, such as in mixed methods research. More good can come of social science researchers developing skills in both realms than debating which method is superior.
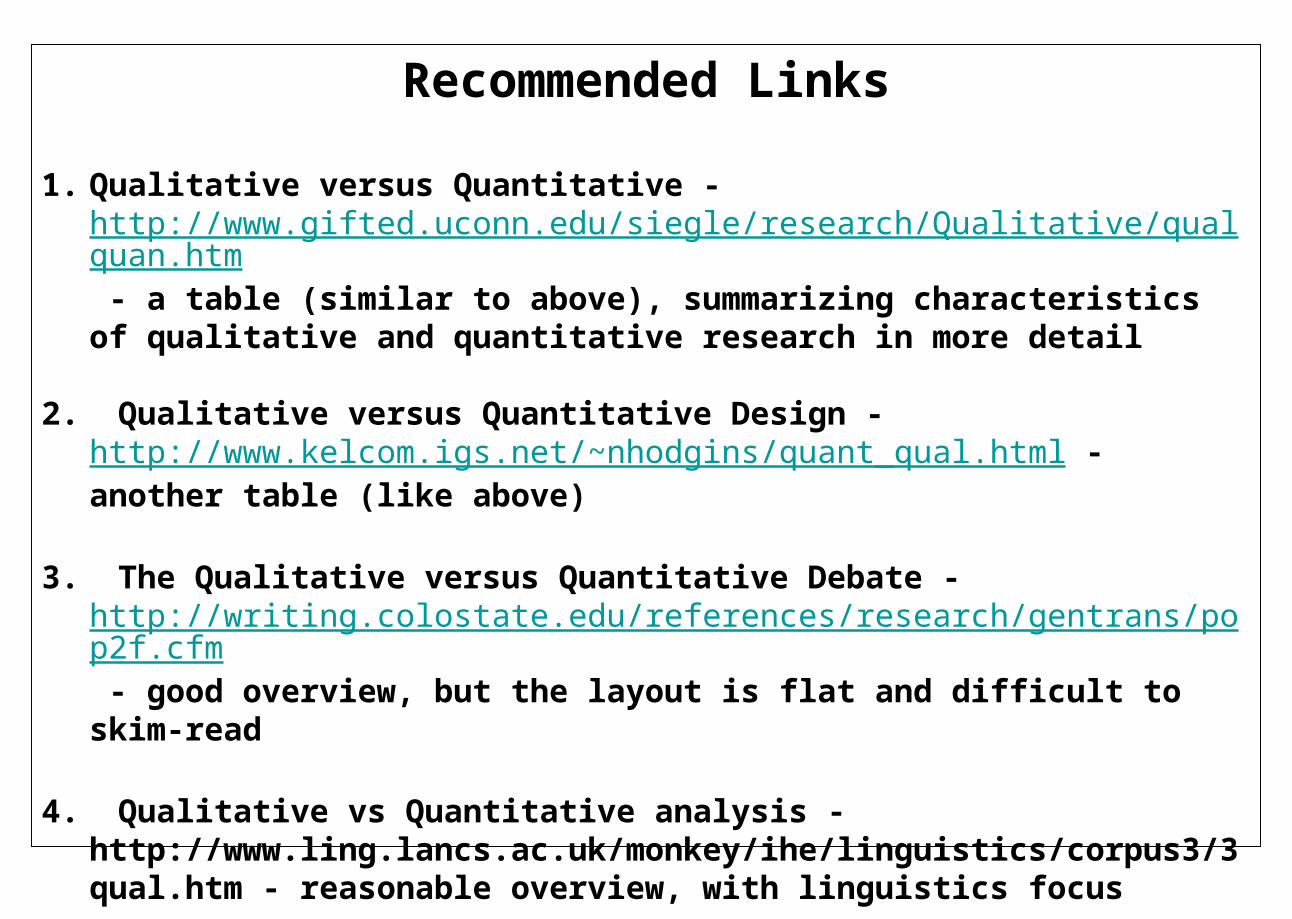
Recommended Links
1. Qualitative versus Quantitative - http://www.gifted.uconn.edu/siegle/research/Qualitative/qualquan.htm - a table (similar to above), summarizing characteristics of qualitative and quantitative research in more detail
2. Qualitative versus Quantitative Design - http://www.kelcom.igs.net/~nhodgins/quant_qual.html - another table (like above)
3. The Qualitative versus Quantitative Debate - http://writing.colostate.edu/references/research/gentrans/pop2f.cfm - good overview, but the layout is flat and difficult to skim-read
4. Qualitative vs Quantitative analysis - http://www.ling.lancs.ac.uk/monkey/ihe/linguistics/corpus3/3qual.htm - reasonable overview, with linguistics focus
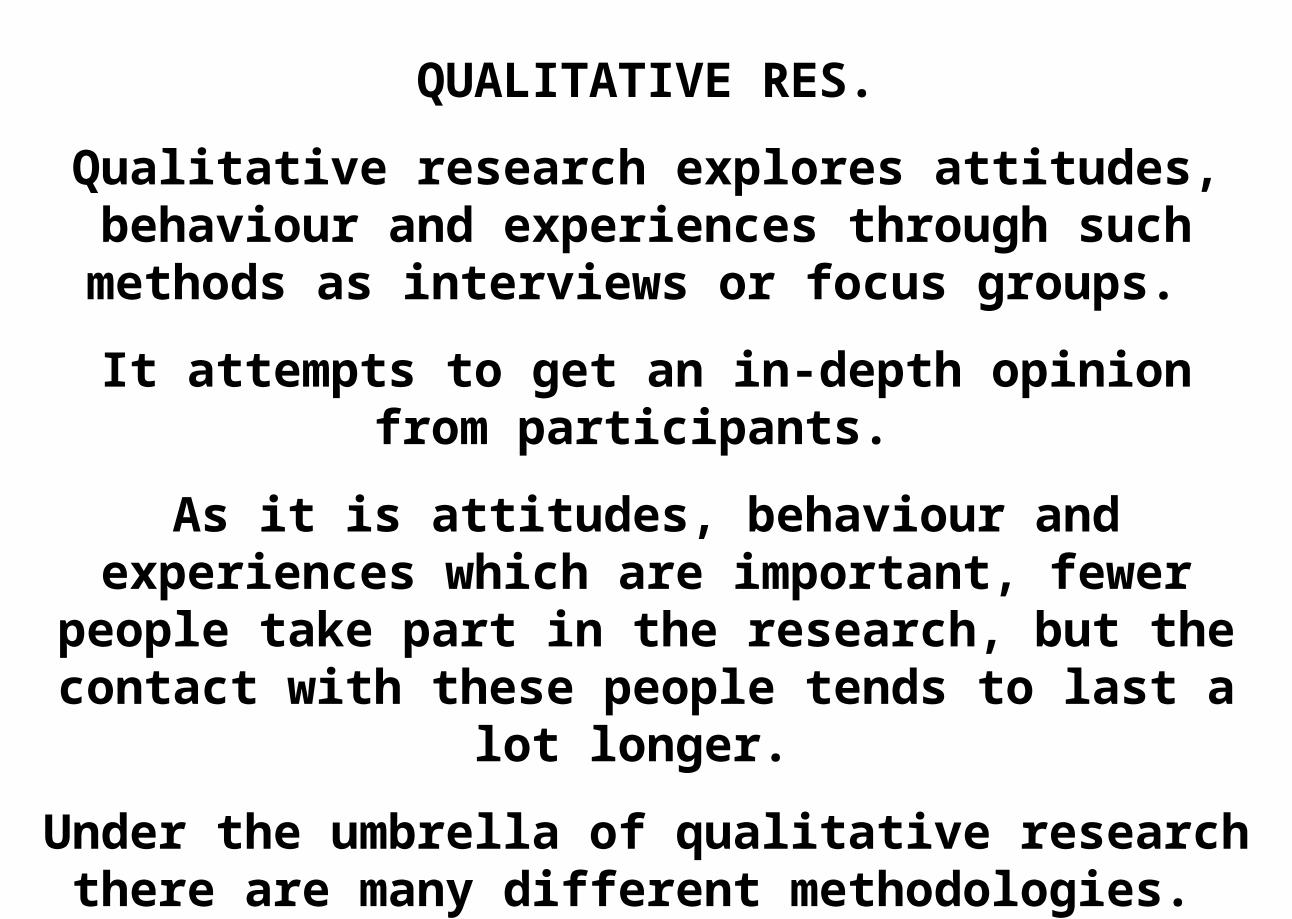
QUALITATIVE RES.
Qualitative research explores attitudes, behaviour and experiences through such methods as
interviews or focus groups.
It attempts to get an in-depth opinion from participants.
As it is attitudes, behaviour and experiences which are important, fewer people take part in the research, but the contact with these people tends to last a lot
longer.
Under the umbrella of qualitative research there are many different methodologies.
Quantitative researchQuantitative research generates statistics through the use
of large-scale survey research, using methods such as questionnaires or structured interviews.
If a market researcher has stopped you on the streets, or you have filled in a questionnaire which has arrived
through the post, this falls under the umbrella of quantitative research.
This type of research reaches many more people, but the contact with those people is much quicker than it is in
qualitative research.
Qualitative versus quantitative inquiry
Over the years there has been a large amount of complex discussion and argument surrounding the topic of research methodology and the theory of how inquiry should proceed.
Much of this debate has centred on the issue of qualitative versus quantitative inquiry – which might be the best and which is more
‘scientific’. Different methodologies become popular at different social,
political, historical and cultural times in our development, and, in my opinion, all methodologies have their specific strengths and
weaknesses. These should be acknowledged and addressed by the researcher.
Certainly, if you were to do so, it would help you to think about your research methodology in considerable depth.
Deciding which methodology is right for you
Don’t fall into the trap which many beginning (and experienced) researchers do in thinking
that quantitative research is ‘better ’ than qualitative research.
Neither is better than the other – they are just different and both have their strengths and
weaknesses.
Deciding which methodology is right for you
What you will find, however, is that your instincts probably lean you towards one rather than the other.
Listen to these instincts as you will find it more productive to conduct the type of research with which you will feel comfortable, especially if you’re to keep your motivation
levels high.
Also, be aware of the fact that your tutor or boss might prefer one type of research over the other. If this is the
case, you might have a harder time justifying your chosen methodology, if it goes against their preferences.
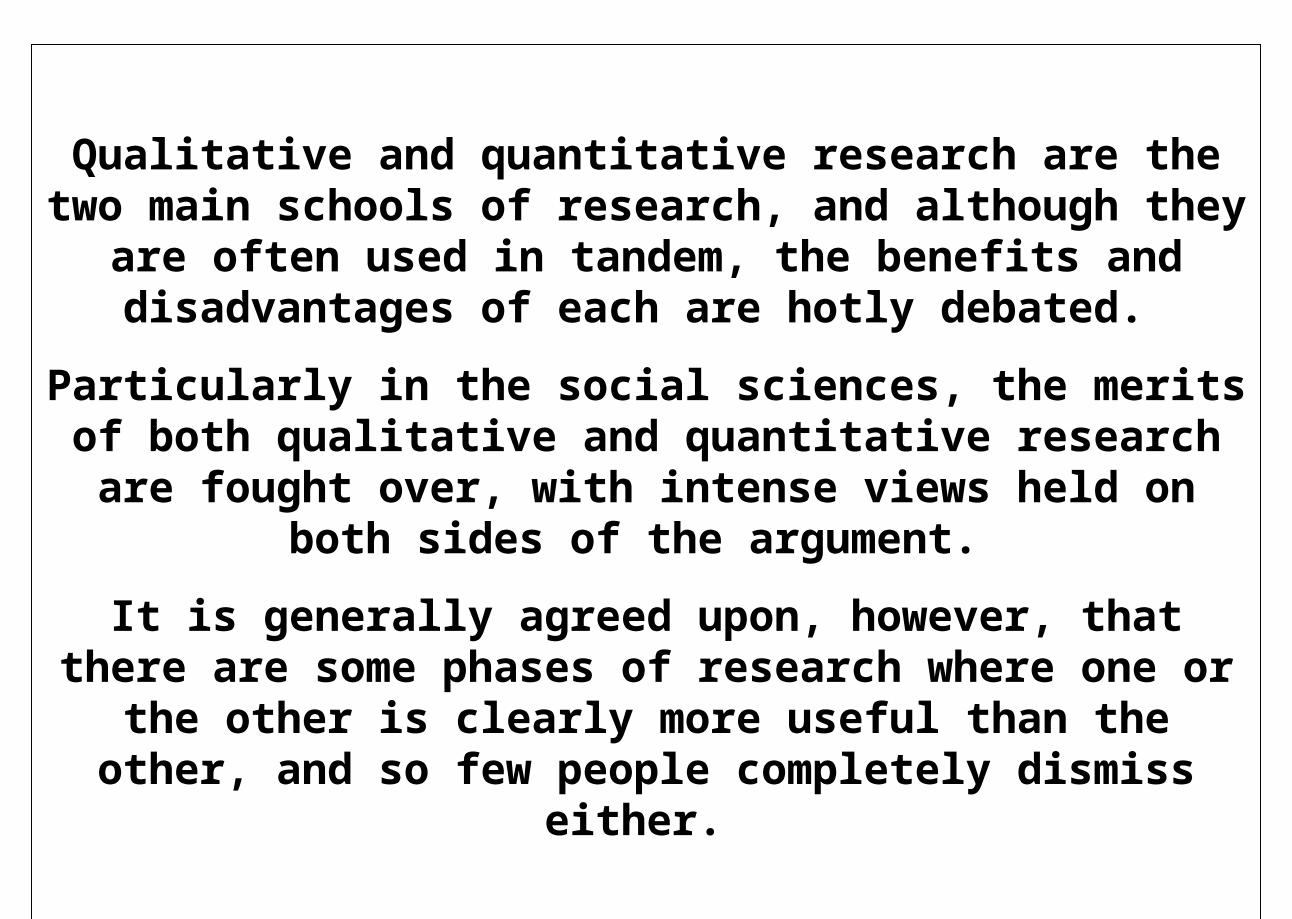
Qualitative and quantitative research are the two main schools of research, and although they are often used in tandem, the benefits and disadvantages of each are hotly
debated.
Particularly in the social sciences, the merits of both qualitative and quantitative research are fought over, with
intense views held on both sides of the argument.
It is generally agreed upon, however, that there are some phases of research where one or the other is clearly more
useful than the other, and so few people completely dismiss either.

Quantitative research is probably the least contentious of the two schools, as it is more closely aligned with what is
viewed as the classical scientific paradigm.
Quantitative research involves gathering data that is absolute, such as numerical data, so that it can be examined in as unbiased a manner as possible.
There are many principles that go along with quantitative research, which help promote its supposed neutrality.
Quantitative research generally comes later in a research project, once the scope of the project is well understood.
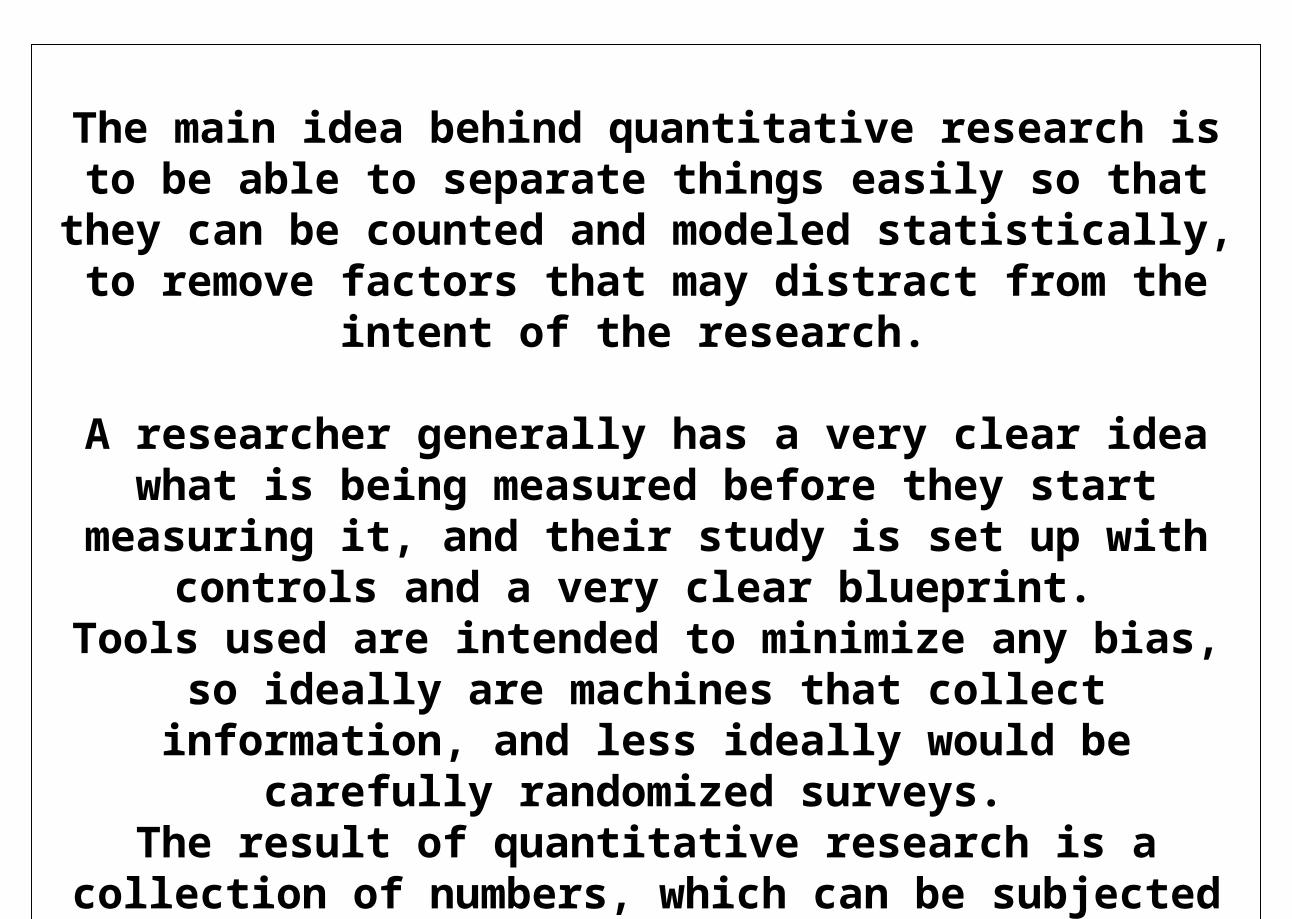
The main idea behind quantitative research is to be able to separate things easily so that they can be counted and
modeled statistically, to remove factors that may distract from the intent of the research.
A researcher generally has a very clear idea what is being measured before they start measuring it, and their study is
set up with controls and a very clear blueprint. Tools used are intended to minimize any bias, so ideally are machines that collect information, and less ideally
would be carefully randomized surveys. The result of quantitative research is a collection of
numbers, which can be subjected to statistical analysis to come to results.
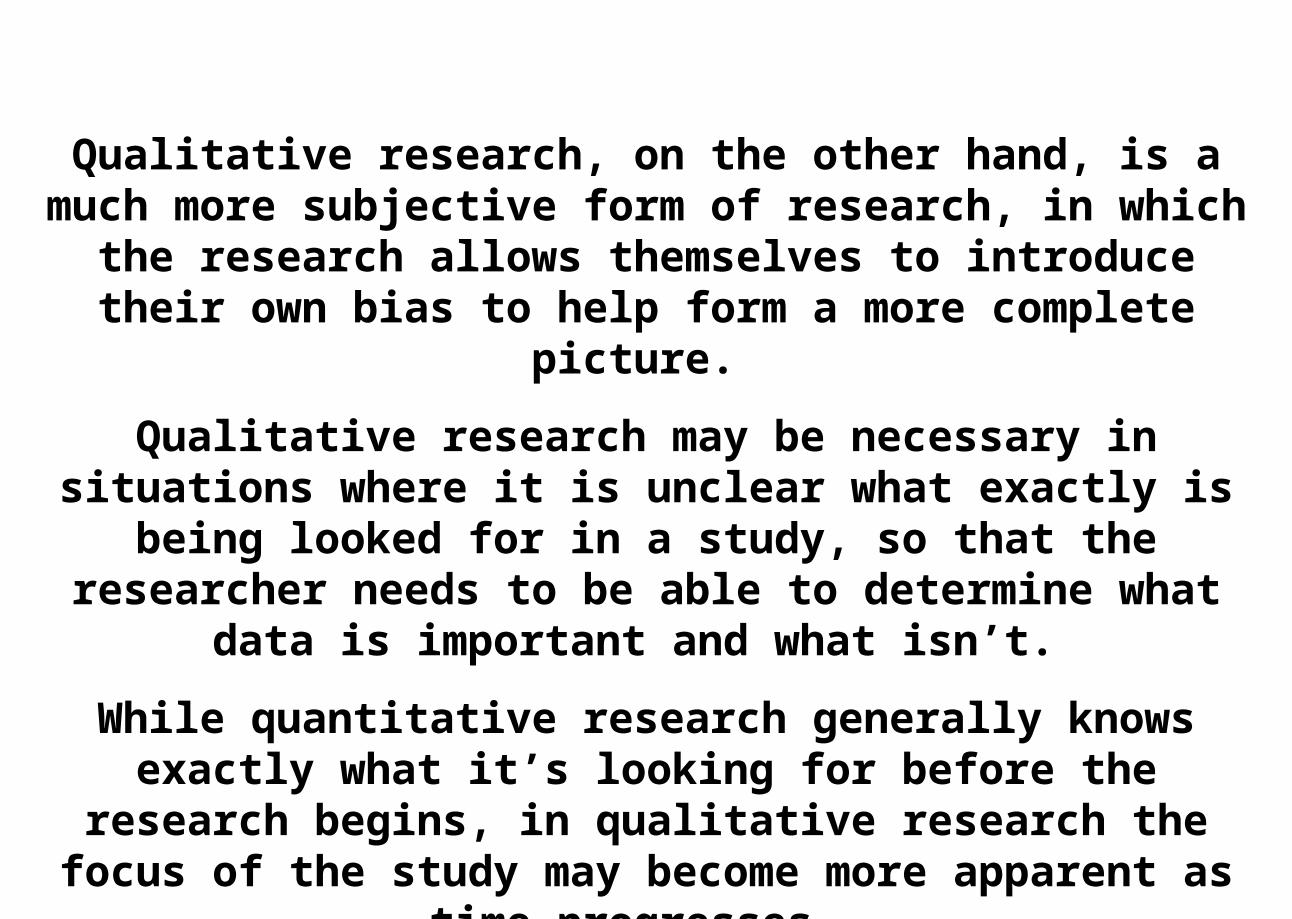
Qualitative research, on the other hand, is a much more subjective form of research, in which the research allows
themselves to introduce their own bias to help form a more complete picture.
Qualitative research may be necessary in situations where it is unclear what exactly is being looked for in a study, so
that the researcher needs to be able to determine what data is important and what isn’t.
While quantitative research generally knows exactly what it’s looking for before the research begins, in qualitative
research the focus of the study may become more apparent as time progresses.
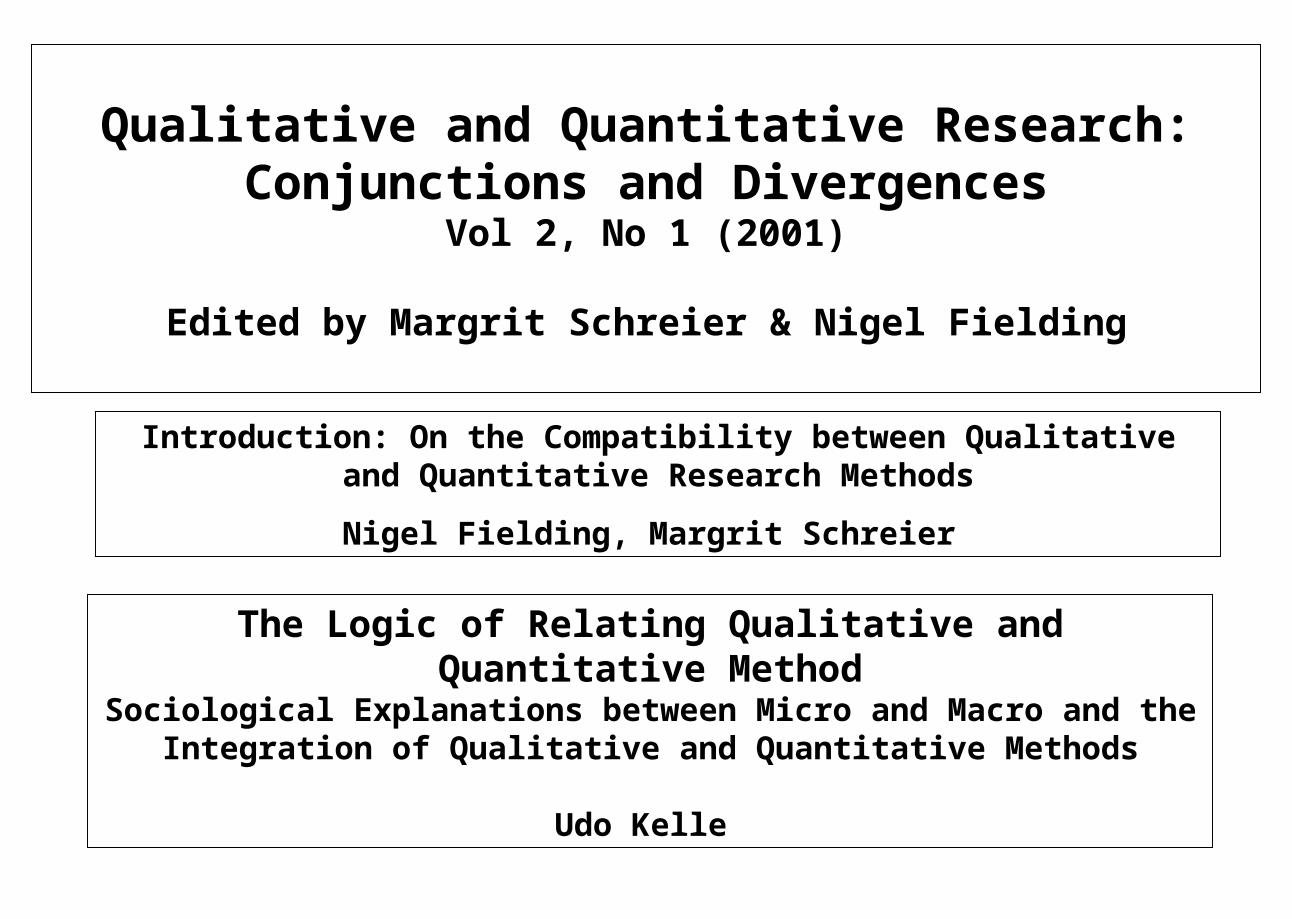
Qualitative and Quantitative Research: Conjunctions and Divergences
Vol 2, No 1 (2001)
Edited by Margrit Schreier & Nigel Fielding
Introduction: On the Compatibility between Qualitative and Quantitative Research Methods
Nigel Fielding, Margrit Schreier
The Logic of Relating Qualitative and Quantitative MethodSociological Explanations between Micro and Macro and the Integration
of Qualitative and Quantitative Methods
Udo Kelle
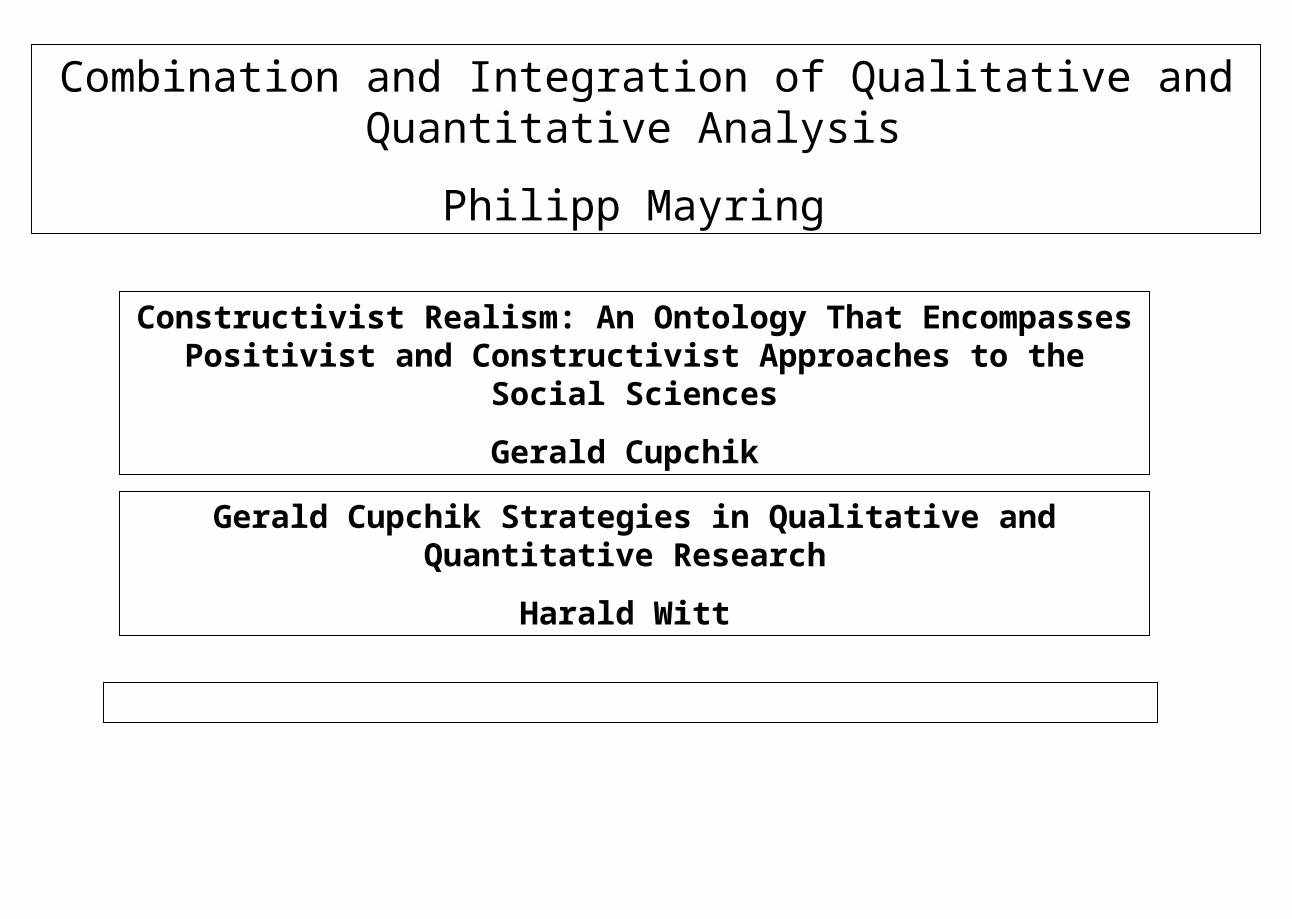
Combination and Integration of Qualitative and Quantitative Analysis
Philipp Mayring
Constructivist Realism: An Ontology That Encompasses Positivist and Constructivist Approaches to the Social Sciences
Gerald Cupchik
Gerald Cupchik Strategies in Qualitative and Quantitative Research
Harald Witt
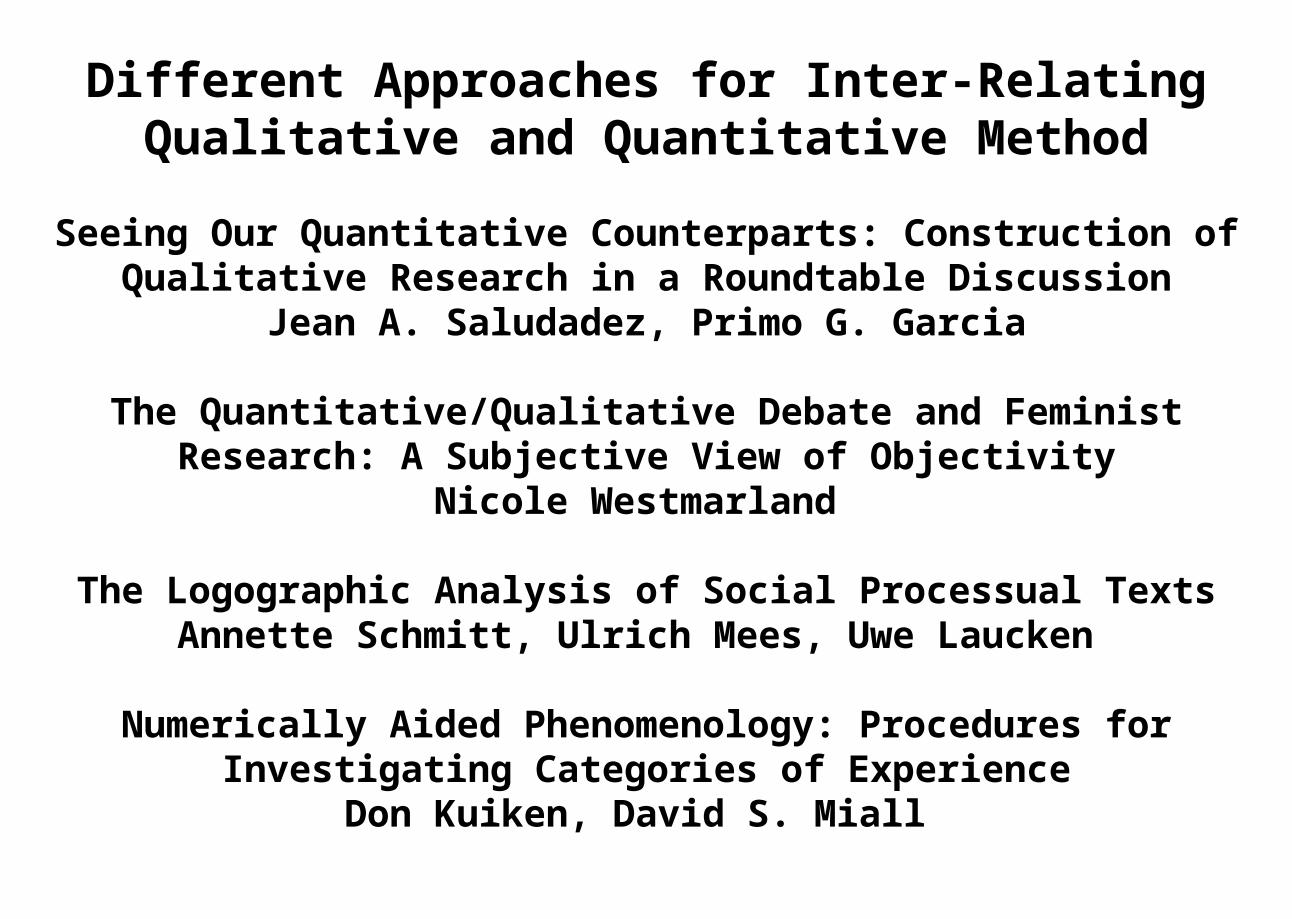
Different Approaches for Inter-Relating Qualitative and Quantitative Method
Seeing Our Quantitative Counterparts: Construction of Qualitative Research in a Roundtable Discussion Jean A. Saludadez, Primo G. Garcia
The Quantitative/Qualitative Debate and Feminist Research: A Subjective View of Objectivity
Nicole Westmarland
The Logographic Analysis of Social Processual TextsAnnette Schmitt, Ulrich Mees, Uwe Laucken
Numerically Aided Phenomenology: Procedures for Investigating Categories of Experience
Don Kuiken, David S. Miall

Innovative Applications of Methodological Inter-Relation
How Do You Find Out What Really Matters for Public Acceptance—The Case of Swine Production Sites in Rural Communities
Stefan Mann
Understanding Online Communities Through Multiple Methodologies Combined Under a Postmodern Research
Endeavour Natilene Irain Bowker
On the Triangulation of Quantitative and Qualitative Data in Typological Social Research: Reflections on a Typology of
Conceptualizing "Uncertainty" in the Context of Employment Biographies
Alexander Jakob

quantitative research
Use of sampling techniques (such as consumer surveys) whose findings may be expressed
numerically, and are amenable to mathematical (statistical) manipulation enabling the researcher to
estimate (forecast) future events or quantities.
Read more:http://www.businessdictionary.com/definition/quantitative-
research.html#ixzz14N3yE08e
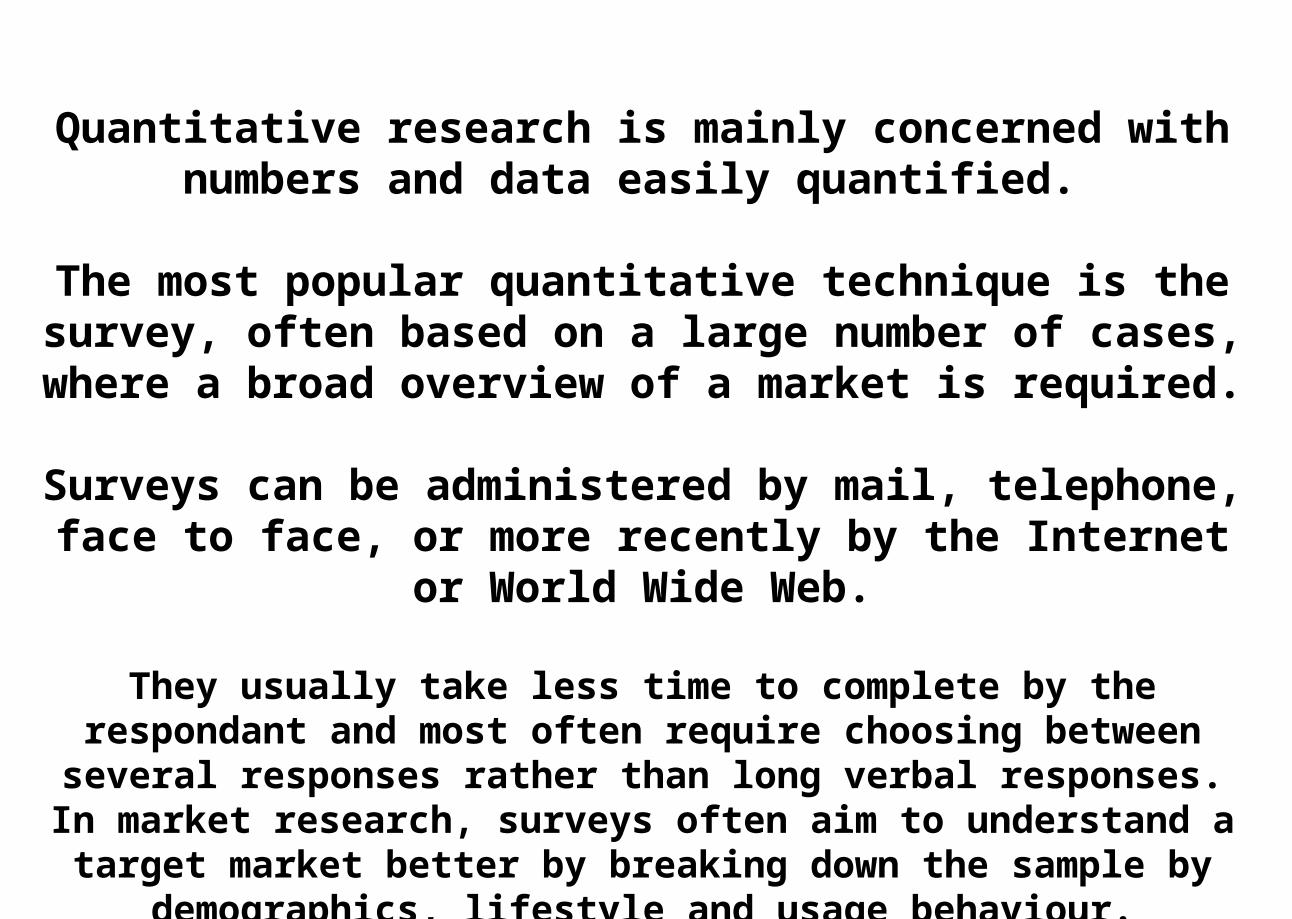
Quantitative research is mainly concerned with numbers and data easily quantified.
The most popular quantitative technique is the survey, often based on a large number of cases, where a broad
overview of a market is required.
Surveys can be administered by mail, telephone, face to face, or more recently by the Internet or World Wide Web.
They usually take less time to complete by the respondant and most often require choosing between several responses rather
than long verbal responses. In market research, surveys often aim to understand a target market better by breaking down the sample
by demographics, lifestyle and usage behaviour.
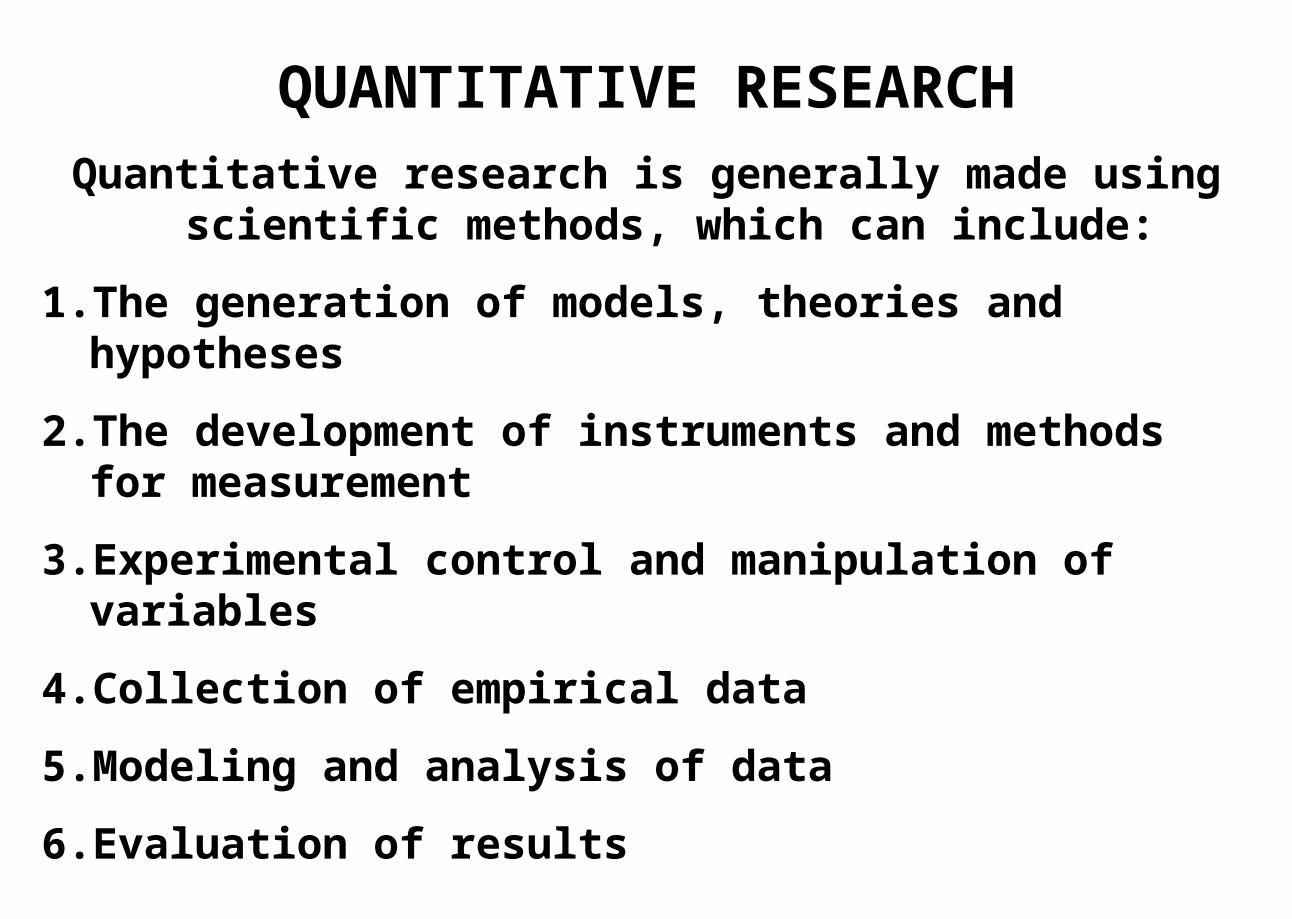
QUANTITATIVE RESEARCHQuantitative research is generally made using scientific
methods, which can include:
1. The generation of models, theories and hypotheses
2. The development of instruments and methods for measurement
3. Experimental control and manipulation of variables
4. Collection of empirical data
5. Modeling and analysis of data
6. Evaluation of results
Use of statistics
Statistics is the most widely used branch of mathematics in quantitative research outside of the physical sciences, and also finds applications within the physical sciences, such
as in statistical mechanics.
Statistical methods are used extensively within fields such as economics, social sciences and biology.
Quantitative research using statistical methods starts with the collection of data, based on the hypothesis or theory.
Usually a big sample of data is collected - this would require verification, validation and recording before the
analysis can take place.
Empirical relationships and associations are also frequently studied by using some form of General linear
model, non-linear model, or by using factor analysis.
A fundamental principle in quantitative research is that correlation does not imply causation. This principle follows
from the fact that it is always possible a spurious relationship exists for variables between which covariance
is found in some degree.
Associations may be examined between any combination of continuous and categorical variables using methods of
statistics.
Measurement
Views regarding the role of measurement in quantitative research are somewhat divergent.
Measurement is often regarded as being only a means by which observations are expressed numerically in order to investigate causal relations or associations. However, it has been argued that measurement often plays a more
important role in quantitative research.
For example, Kuhn argued that within quantitative research, the results that are shown can prove to be
strange. This is because accepting a theory based on results of quantitative data could prove to be a natural
phenomenon.
Quantitative methods
Quantitative methods are research techniques that are used to gather quantitative data - information
dealing with numbers and anything that is measurable.
Statistics, tables and graphs, are often used to present the results of these methods.
They are therefore to be distinguished from qualitative methods.
Quantitative methods
In most physical and biological sciences, the use of either quantitative or qualitative methods is
uncontroversial, and each is used when appropriate.
In the social sciences, particularly in sociology, social anthropology and psychology, the use of one
or other type of method has become a matter of controversy and even ideology, with particular
schools of thought within each discipline favouring one type of method and pouring scorn on to the
other.
Quantitative methods
Advocates of quantitative methods argue that only by using such methods can the social sciences become truly
scientific; advocates of qualitative methods argue that quantitative
methods tend to obscure the reality of the social phenomena under study because they underestimate or neglect the non-measurable factors, which may be the
most important.
The modern tendency (and in reality the majority tendency throughout the history of social science) is to use eclectic
approaches.
Quantitative methods
Quantitative methods might be used with a global qualitative frame.
Qualitative methods might be used to understand the meaning of the numbers produced by quantitative
methods. Using quantitative methods, it is possible to give precise
and testable expression to qualitative ideas.
This combination of quantitative and qualitative data gathering is often referred to as mixed-methods research.
Quantitative Research Design
In quantitative research your aim is to determine the relationship between one thing (an independent variable)
and another (a dependent or outcome variable) in a population.
Quantitative research designs are either descriptive (subjects usually measured once) or experimental (subjects measured before and after a treatment).
A descriptive study establishes only associations between variables. An experiment establishes causality.
Quantitative Research Design
For an accurate estimate of the relationship between variables, a descriptive study usually needs a sample of hundreds or even thousands of subjects; an experiment, especially a crossover, may need only tens of subjects.
The estimate of the relationship is less likely to be biased if you have a high participation rate in a sample selected
randomly from a population.
In experiments, bias is also less likely if subjects are randomly assigned to treatments, and if subjects and researchers are blind to the identity of the treatments.
Quantitative Research Design
In all studies, subject characteristics can affect the relationship you are investigating.
Limit their effect either by using a less heterogeneous sample of subjects or preferably by measuring the characteristics and including them in the analysis.
In an experiment, try to measure variables that might explain the mechanism of the treatment.
In an unblinded experiment, such variables can help define the magnitude of any placebo effect.
Quantitative research is all about quantifying relationships between variables.
Variables are things like weight, performance, time, and treatment.
Researcher measure variables on a sample of subjects, which can be tissues, cells, animals, or
humans.
Researcher express the relationship between variable using effect statistics, such as correlations, relative frequencies, or differences between means.
TYPES OF STUDY
Studies aimed at quantifying relationships are of two types: descriptive and experimental.
In a descriptive study, no attempt is made to change behavior or conditions – researcher measure things
as they are.
In an experimental study, researcher take measurements, try some sort of intervention, then take measurements again to see what happened.
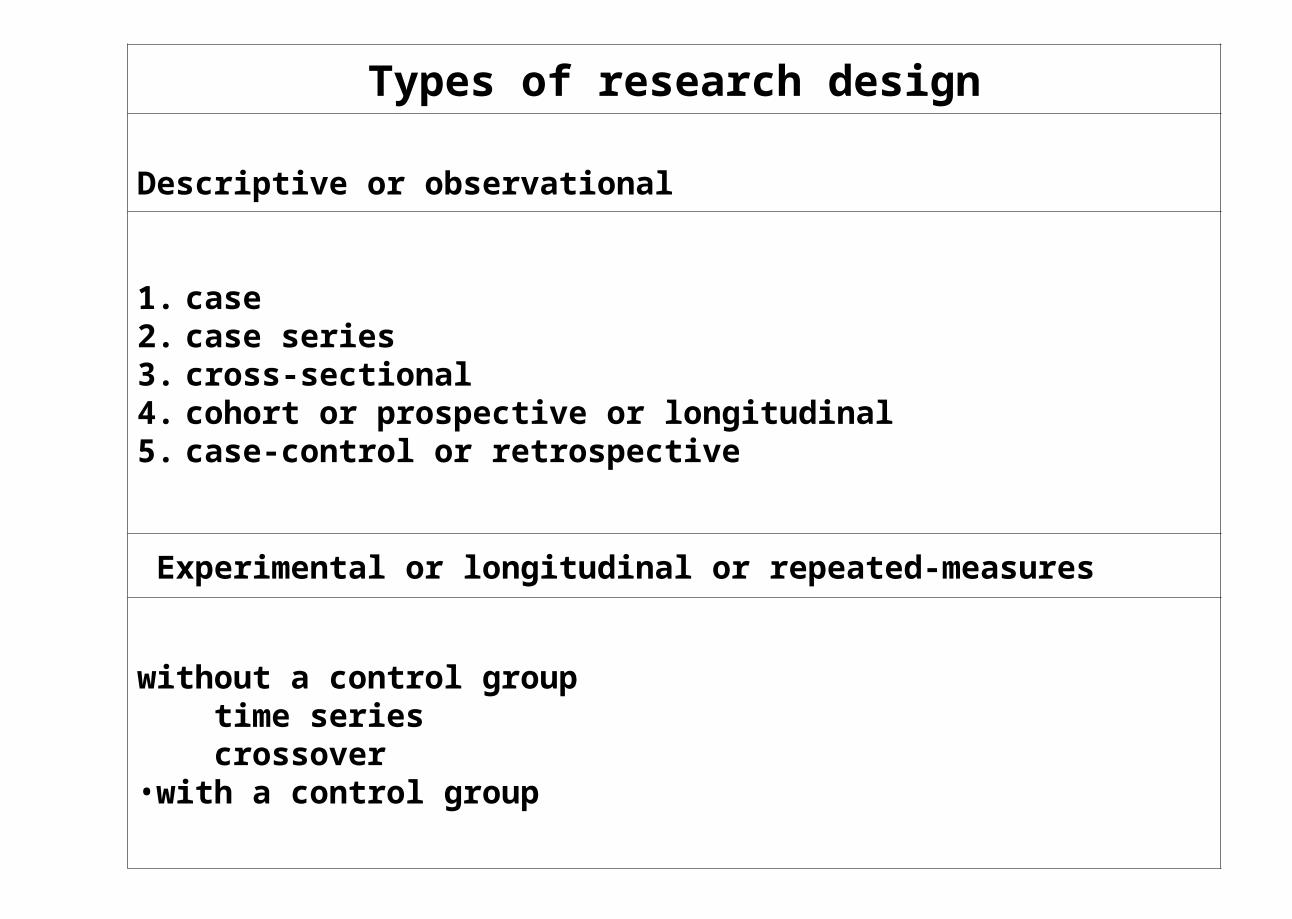
Types of research design
Descriptive or observational
1. case 2. case series 3. cross-sectional 4. cohort or prospective or longitudinal 5. case-control or retrospective
Experimental or longitudinal or repeated-measures
without a control group time series crossover •with a control group
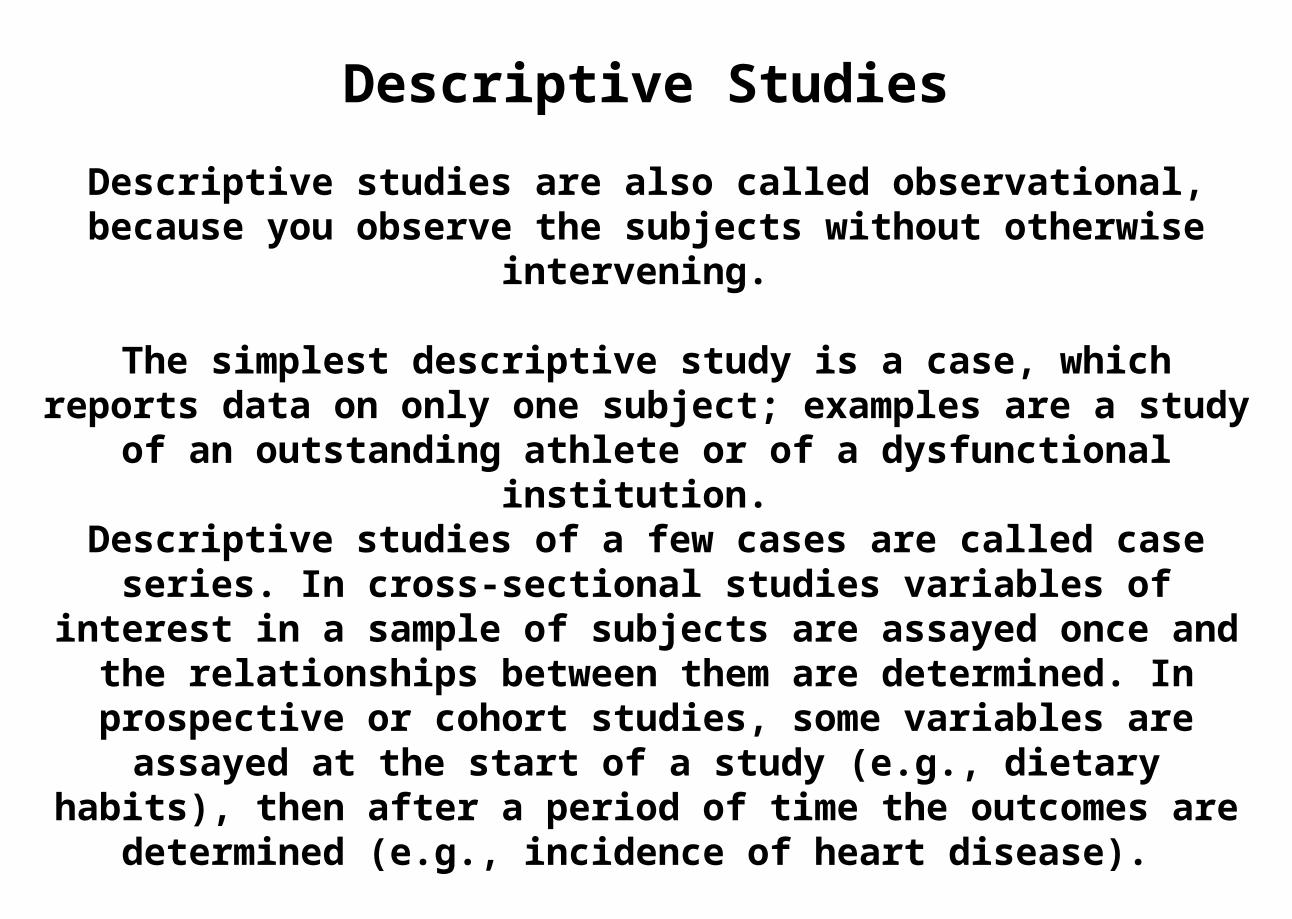
Descriptive Studies
Descriptive studies are also called observational, because you observe the subjects without otherwise intervening.
The simplest descriptive study is a case, which reports data on only one subject; examples are a study of an outstanding athlete or of a
dysfunctional institution. Descriptive studies of a few cases are called case series. In cross-sectional studies variables of interest in a sample of subjects are
assayed once and the relationships between them are determined. In prospective or cohort studies, some variables are assayed at the start of a study (e.g., dietary habits), then after a period of time the
outcomes are determined (e.g., incidence of heart disease).
Another label for this kind of study is longitudinal, although this term also applies to experiments.
Descriptive Studies
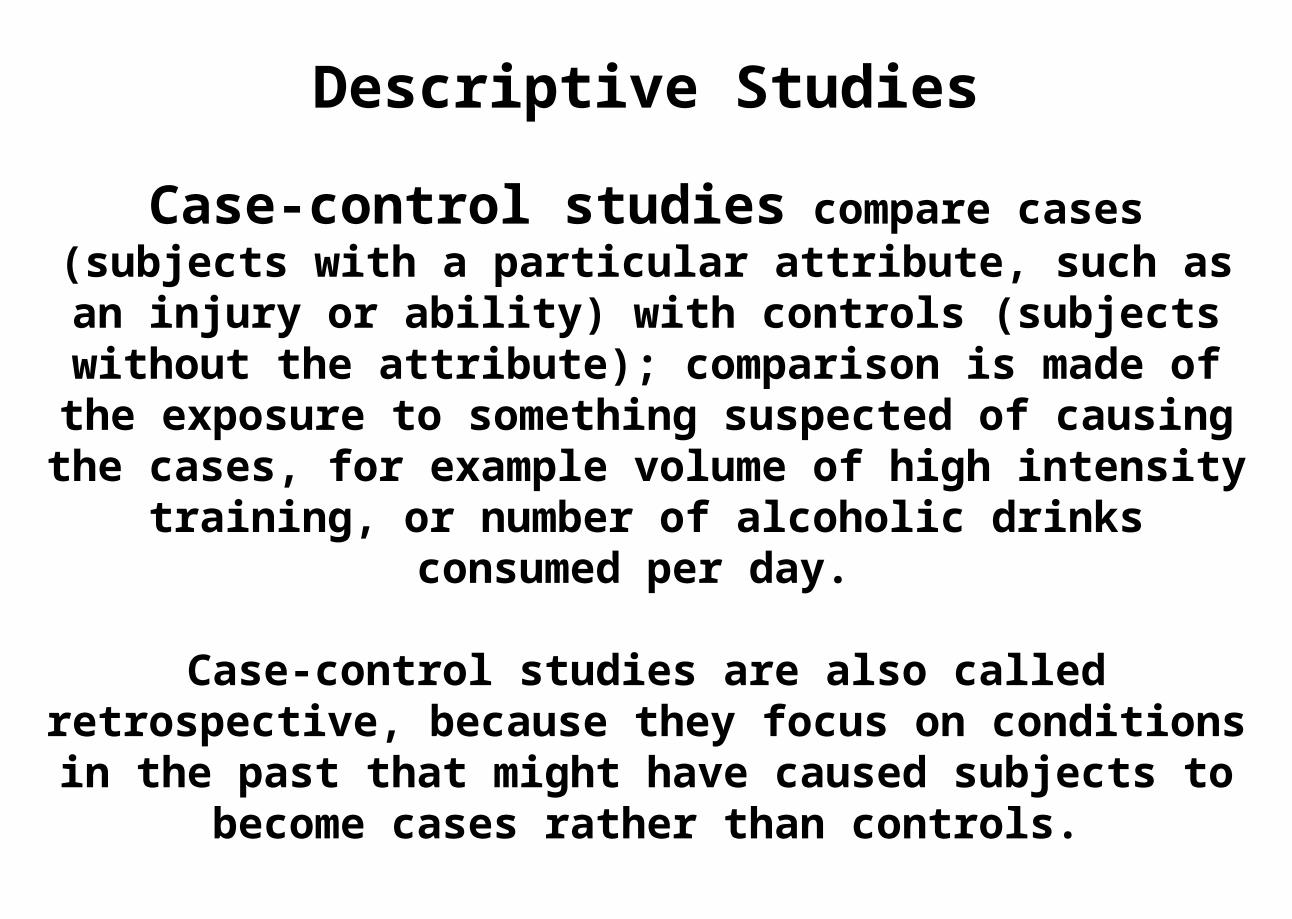
Case-control studies compare cases (subjects with a particular attribute, such as an injury or ability) with
controls (subjects without the attribute); comparison is made of the exposure to something suspected of causing
the cases, for example volume of high intensity training, or number of alcoholic drinks consumed per day.
Case-control studies are also called retrospective, because they focus on conditions in the past that might have
caused subjects to become cases rather than controls.
Descriptive Studies
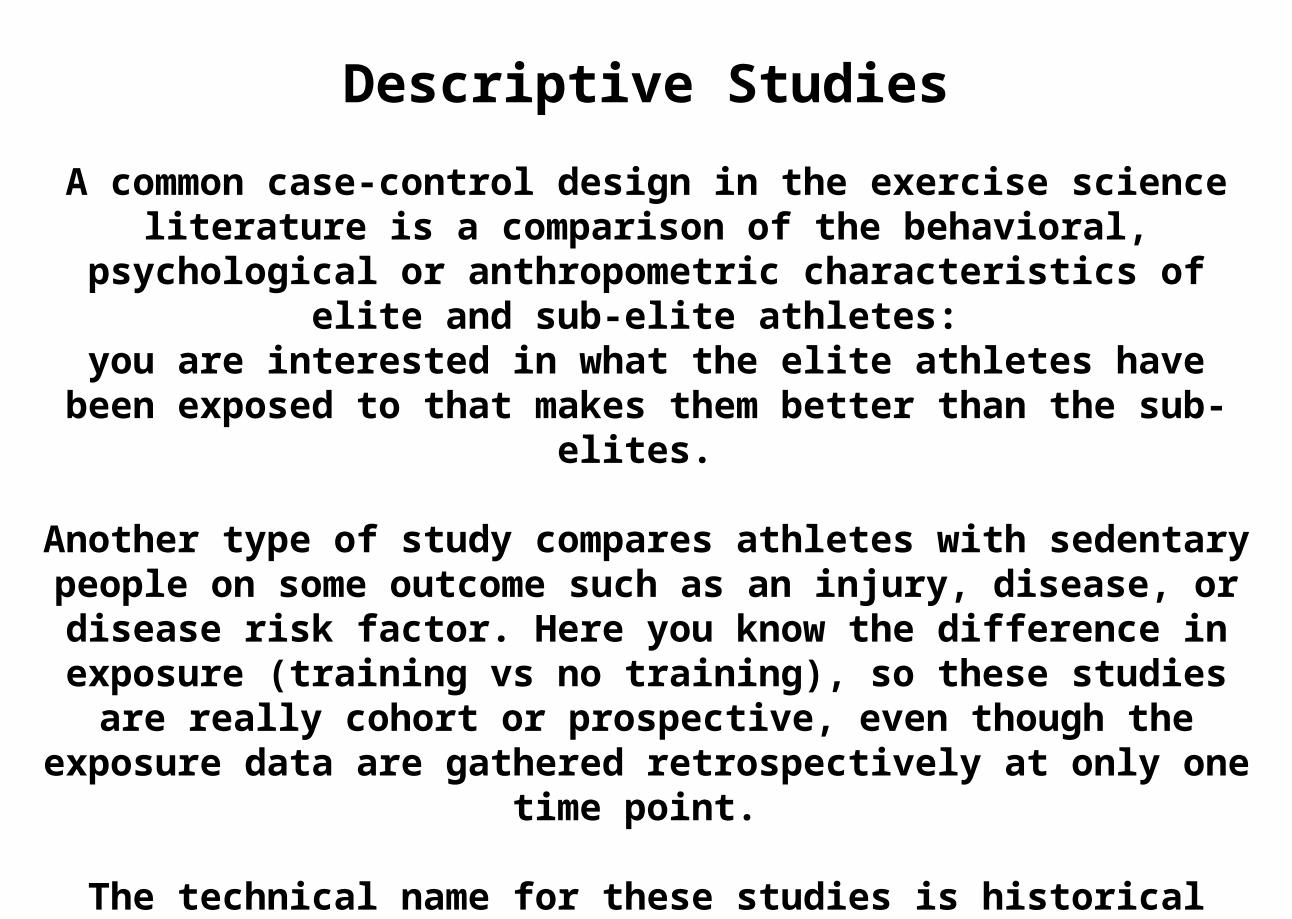
A common case-control design in the exercise science literature is a comparison of the behavioral, psychological or anthropometric
characteristics of elite and sub-elite athletes: you are interested in what the elite athletes have been exposed to
that makes them better than the sub-elites.
Another type of study compares athletes with sedentary people on some outcome such as an injury, disease, or disease risk factor.
Here you know the difference in exposure (training vs no training), so these studies are really cohort or prospective, even though the exposure data are gathered retrospectively at only one time point.
The technical name for these studies is historical cohort.
Experimental Studies
Experimental studies are also known as longitudinal or repeated-measures studies, for obvious reasons.
They are also referred to as interventions, because you do more than just observe the subjects.
In the simplest experiment, a time series, one or more measurements are taken on all subjects before and after a
treatment. A special case of the time series is the so-called single-subject
design, in which measurements are taken repeatedly (e.g., 10 times) before and after an intervention on one or a few subjects.
Experimental Studies
Time series suffer from a major problem: any change you see could be due to something other than the treatment.
For example, subjects might do better on the second test because of their experience of the first test, or they might change their diet
between tests because of a change in weather, and diet could affect their performance of the test. The crossover design is one solution
to this problem. Normally the subjects are given two treatments, one being the real
treatment, the other a control or reference treatment. Half the subjects receive the real treatment first, the other half the control
first. After a period of time sufficient to allow any treatment effect to
wash out, the treatments are crossed over. Any effect of retesting or of anything that happened between the
tests can then be subtracted out by an appropriate analysis.
Experimental Studies
Multiple crossover designs involving several treatments are also possible.
If the treatment effect is unlikely to wash out between measurements, a control group has to be used.
In these designs, all subjects are measured, but only some of them--the experimental group--then receive the
treatment. All subjects are then measured again, and the change in
the experimental group is compared with the change in the control group.
Experimental Studies
If the subjects are assigned randomly to experimental and control groups or treatments, the design is known as a randomized
controlled trial. Random assignment minimizes the chance that either group is not typical of the population. If the subjects are blind (or masked) to the identity of the treatment, the design is a single-
blind controlled trial. The control or reference treatment in such a study is called a
placebo: the name physicians use for inactive pills or treatments that are given to patients in the guise of effective treatments.
Blinding of subjects eliminates the placebo effect, whereby people react differently to a treatment if they think it is in some way special. In a double-blind study, the experimenter also does not know which
treatment the subjects receive until all measurements are taken. Blinding of the experimenter is important to stop him or her treating
subjects in one group differently from those in another.
Experimental Studies
In the best studies even the data are analyzed blind, to prevent conscious or unconscious fudging or prejudiced
interpretation.Ethical considerations or lack of cooperation (compliance) by the subjects sometimes prevent experiments from being
performed. For example, a randomized controlled trial of the effects of
physical activity on heart disease may not have been performed yet, because it is unethical and unrealistic to
randomize people to 10 years of exercise or sloth. But there have been many short-term studies of the effects
of physical activity on disease risk factors (e.g., blood pressure).
Quality of Designs
The various designs differ in the quality of evidence they provide for a cause-and-effect relationship between variables. Cases and case series are the weakest. A well-designed cross-sectional or
case-control study can provide good evidence for the absence of a relationship. But if such a study does reveal a relationship, it
generally represents only suggestive evidence of a causal connection.
A cross-sectional or case-control study is therefore a good starting point to decide whether it is worth proceeding to better designs.
Prospective studies are more difficult and time-consuming to perform, but they produce more convincing conclusions about
cause and effect. Experimental studies provide the best evidence about how
something affects something else, and double-blind randomized controlled trials are the best experiments.
Quality of Designs
Confounding is a potential problem in descriptive studies that try to establish cause and effect.
Confounding occurs when part or all of a significant association between two variables arises through both being causally
associated with a third variable. For example, in a population study you could easily show a negative association between habitual
activity and most forms of degenerative disease. But older people are less active, and older people are more diseased, so you're
bound to find an association between activity and disease without one necessarily causing the other.
To get over this problem you have to control for potential confounding factors. For example, you make sure all your subjects
are the same age, or you include age in the analysis to try to remove its effect on the relationship between the other two
variables.
SAMPLES
You almost always have to work with a sample of subjects rather than the full population. But people are interested in the population, not your sample.
To generalize from the sample to the population, the sample has to be representative of the population.
The safest way to ensure that it is representative is to use a random selection procedure. You can also
use a stratified random sampling procedure, to make sure that you have proportional representation of
population subgroups (e.g., sexes, races, regions).
SAMPLES
When the sample is not representative of the population, selection bias is a possibility. A statistic is biased if the
value of the statistic tends to be wrong (or more precisely, if the expected value--the average value from many
samples drawn using the same sampling method--is not the same as the population value.)
A typical source of bias in population studies is age or socioeconomic status: people with extreme values for
these variables tend not to take part in the studies. Thus a high compliance (the proportion of people contacted who end up as subjects) is important in avoiding bias. Journal editors are usually happy with compliance rates of at least
70%.
SAMPLES
Failure to randomize subjects to control and treatment groups in experiments can also produce bias. If you let
people select themselves into the groups, or if you select the groups in any way that makes one group different from
another, then any result you get might reflect the group difference rather than an effect of the treatment.
For this reason, it's important to randomly assign subjects in a way that ensures the groups are balanced in terms of
important variables that could modify the effect of the treatment (e.g., age, gender, physical performance).
Human subjects may not be happy about being randomized, so you need to state clearly that it is a
condition of taking part.
SAMPLES
Often the most important variable to balance is the pre-test value of the dependent variable itself.
You can get close to perfectly balanced randomization for this or another numeric variable as follows:
1. rank-order the subjects on the value of the variable; 2. split the list up into pairs (or triplets for three treatments,
etc.); 3. assign the lowest ranked subject to a treatment by
flipping a coin; 4. assign the next two subjects (the other member of the
pair, and the first member of the next pair) to the other treatment;
5. assign the next two subjects to the first treatment, and so on.
SAMPLES
When selecting subjects and designing protocols for experiments, researchers often strive to eliminate all
variation in subject characteristics and behaviors. Their aim is to get greater precision in the estimate of the effect
of the treatment. The problem with this approach is that the effect
generalizes only to subjects with the same narrow range of characteristics and behaviors as in the sample. Depending on the nature of the study, you may therefore have to strike
a balance between precision and applicability.
If you lean towards applicability, your subjects will vary substantially on some characteristic or behavior that you
should measure and include in your analysis.
WHAT TO MEASURE
In any study, you measure the characteristics of the subjects, and the independent and
dependent variables defining the research question.
For experiments, you can also measure mechanism variables, which help you explain
how the treatment works.
Characteristics of Subjects
You must report sufficient information about your subjects to identify the population group from which they were
drawn. For human subjects, variables such as sex, age, height, weight, socioeconomic status, and ethnic origin are
common, depending on the focus of the study.
Show the ability of athletic subjects as current or personal-best performance, preferably expressed as a percent of world-record. For endurance athletes a direct or indirect
estimate of maximum oxygen consumption helps characterize ability in a manner that is largely independent
of the sport.
Dependent and Independent Variables
Usually you have a good idea of the question you want to answer. That question defines the main variables to measure. For example,
if you are interested in enhancing sprint performance, your dependent variable (or outcome variable) is automatically some
measure of sprint performance.
Cast around for the way to measure this dependent variable with as much precision as possible.
Next, identify all the things that could affect the dependent variable.
These things are the independent variables: training, sex, the treatment in an experimental study, and so on.
For an experimental study, the main independent variable is the one indicating when the dependent variable is
measured (e.g., before, during, and after the treatment).
If there is a control group (as in controlled trials) or control treatment (as in crossovers), the identity of the group or treatment is another essential independent variable (e.g.,
Drug A, Drug B, placebo in a controlled trial; drug-first and placebo-first in a crossover).
These variables obviously have an affect on the dependent variable, so you automatically include them in any analysis.
Mechanism Variables
With experiments, the main challenge is to determine the magnitude and confidence intervals of the treatment effect. But sometimes you
want to know the mechanism of the treatment--how the treatment works or doesn't work.
To address this issue, try to find one or more variables that might connect the treatment to the outcome variable, and measure these
at the same times as the dependent variable. For example, you might want to determine whether a particular training method enhanced strength by increasing muscle mass, so you might measure limb girths at the same time as the strength tests.
When you analyze the data, look for associations between change in limb girth and change in strength. Keep in mind that errors of
measurement will tend to obscure the true association.