Embed Size (px)
Citation preview
Methods for Producing Biochar
and Advanced Biofuels in
Washington State
Part 4: Literature Review
Sustainability Issues, Business Models, and Financial Analyses
February 2013 Publication no. 12-07-035

Publication and Contact Information
This report is available on the Department of Ecology’s website at www.ecy.wa.gov/biblio/1207035.html For more information contact: Waste 2 Resources P.O. Box 47600 Olympia, WA 98504-7600
Phone: (360) 407-6900
Washington State Department of Ecology - www.ecy.wa.gov
o Headquarters, Olympia 360-407-6000
o Northwest Regional Office, Bellevue 425-649-7000
o Southwest Regional Office, Olympia 360-407-6300
o Central Regional Office, Yakima 509-575-2490
o Eastern Regional Office, Spokane 509-329-3400 If you need this document in a format for the visually impaired, call Waste 2 Resources at (360) 407-6900. Persons with hearing loss can call 711 for Washington Relay Service. Persons with a speech disability can call 877-833-6341.
Methods for Producing Biochar and
Advanced Bio-fuels in Washington State
Part 4: Literature Review of
Sustainability Issues, Business Models and Financial
Analyses
Manuel Garcia-Perez1, Jesus A. Garcia-Nunez1, Trevor Lewis1, Chad Kruger2, Mark R. Fuchs3, Gloria Flora4, Gretchen Newman3, Sylvia Kantor2
1Biological Systems Engineering Department, Washington State University
2Center for Sustaining Agriculture and Natural Resources, Washington State University 3Waste 2 Resources, Washington State Department of Ecology
4 US Biochar Initiative
This work was conducted under Interagency Agreement C1000172 with the Center for Sustaining Agriculture and Natural Resources,
Washington State University
Waste 2 Resources Washington State Department of Ecology
Olympia, Washington

Legal Notice This report was prepared as a result of work sponsored by the Washington State Department of
Ecology (Ecology). It does not necessarily represent the views of the Ecology, their employees,
or the State of Washington. The report describes an innovative technology that is subject to
patent application by the Authors (see contact information on cover page). Inquires related to
this final report should be directed to the Authors. Publishing the report in full or in part is
subject to the prior approval (in writing) from the Authors.
i
Table of Contents
Page
List of Figures and Tables................................................................................................... ii Figures........................................................................................................................... ii
Tables ........................................................................................................................... iii
Acknowledgements ............................................................................................................ iv
Executive Summary ........................................................................................................... vi
1. A Sustainable Biomass Economy ....................................................................................1 1.1 Environmental sustainability ...................................................................................4
1.2 Social sustainability .................................................................................................9
1.3 Financial sustainability ..........................................................................................10
2. Frameworks for the Development of Business Models .................................................12 2.1. Current status in biochar business development ...................................................12
2.2 Heat recovery and bio-oil combustion ...................................................................21 2.3 Bio-oil refining.......................................................................................................22
2.4. Building a business model ....................................................................................24
3. Development and Testing of Pyrolysis Plants for Biochar Production .......................266 3.1 Functional specification for pyrolysis plant .........................................................277
3.2. Process flow diagram and mass and energy balances .........................................311 3.3. Process and instrumentation diagram (PID) .......................................................322
3.4. Hazard and operability study methodology (HAZOP) .........................................32
3.5 Detailed design and costing ...................................................................................32
3.6 Design review ........................................................................................................32 3.7 Life cycle analysis..................................................................................................32
3.8 Documentation .......................................................................................................33
4. Financial Analyses .........................................................................................................34 4.1 Biomass supply chain ............................................................................................34
4.2 Biomass preprocessing...........................................................................................42 4.2.1 Capital costs ........................................................................................................42
4.2.2 Operating costs....................................................................................................45 4.3 Pyrolysis units (pyrolysis reactor + condensation system) ....................................46 4.3.1 Capital costs ........................................................................................................46 4.3.2 Operating costs....................................................................................................52 4.4 Bio-oil production costs .........................................................................................56
4.5 Bio-oil refineries ....................................................................................................56 4.5.1 Bio-oil hydrotreatment refinery ..........................................................................57
4.5.2 Bio-oil gasification/Fischer-Tropsch (F-T) refinery ...........................................59
5. Technology Improvements and Development of New Products ...................................60
6. Conclusion .....................................................................................................................63
7. References ......................................................................................................................65
ii
List of Figures and Tables
Figures
Page
Figure 1. Sustainability criteria affect all aspects of the biomass to bioenergy supply chain. ....... 4
Figure 2. Soils reclaimed with PermaMatrix mixed with 10% biochar.. ........................................ 6
Figure 3. Roof drain using biochar for filtering zinc from roof runoff.. ......................................... 6
Figure 4. Schemes to use pyrolysis technologies to produce drop-in fuels. A. Distributed
pyrolysis units, rural bio-oil refinery, petroleum refinery, B. Distributed pyrolysis units,
centralized bio-oil refinery C. Integrated pyrolysis unit with bio-oil refinery.. ........................... 23
Figure 5. Process analysis approach. ............................................................................................ 26
Figure 6. Biomass pyrolysis unit model proposed by Ringer et al. (2006). ................................. 28
Figure 7. Changes in the yield of bio-oil as a function of condensation temperature in the first
condenser. The temperature of second condenser was kept at 25 oC . ......................................... 30
Figure 8. Sankey diagram representation of the results of energy balances of a pyrolysis plant
processing corn stover................................................................................................................... 31
Figure 9. Solid waste generated in Washington (2010). ............................................................... 38
Figure 10. Organic woody material recovered and disposed (2010). ........................................... 38
Figure 11. Organic woody material recycled, diverted, and disposed in Washington: 2001 –
2010............................................................................................................................................... 40
Figure 12. Tipping fees of MSW in landfills in Washington State showing the range plus or
minus one standard deviation........................................................................................................ 41
Figure 13. Carbonization units < $1,000. ..................................................................................... 47
Figure 14. Pyrolysis reactors costing less than $10,000. .............................................................. 47
Figure 15. Carbonization system costing under $500,000. ........................................................... 48
Figure 16. Pyrolysis reactors under $1,000,000. .......................................................................... 48
Figure 17. Pyrolysis reactor under $10,000,000. .......................................................................... 49
Figure 18. BEST Energies System................................................................................................ 49
Figure 19. Operational cost pie chart for 100, 200 and 400 ton/day plants respectively.............. 54
Figure 20. Moen and Nolan strategy for process improvements. ................................................. 61
Figure 21. General strategy for products development. ................................................................ 62
iii
Tables
Page
Table 1. Sustainability aspects of pyrolysis technologies as business models. ............................ 12 Table 2. A sample of companies commercializing biochar making technologies. ....................... 13 Table 3. Biochar based soil amendment products (advantages and disadvantages. ..................... 14 Table 4. Companies commercializing biochar making technologies. .......................................... 15
Table 5. Biochar business models ................................................................................................. 17 Table 6. Global demand of activated carbon ................................................................................ 19 Table 7. Features and considerations for selecting pyrolysis units. .............................................. 25 Table 8. Components of the Functional Specification Document ................................................ 27 Table 9. Design parameters for a particular pyrolysis scheme proposed by Ringer et al. (2006). 28
Table 10. Process design key assumptions made by Wright et al. (2010). ................................... 30
Table 11. Types and quantities of wolid waste facilities in Washington. ..................................... 35
Table 12. Woody materials going to solid waste facilities in Washington (2010) ....................... 35
Table 13. Number of facilities by county reporting organic woody materials for composting,
recycling, or diversion in 2010. .................................................................................................... 36 Table 14. Percent of organic woody material in MSW. ............................................................... 37
Table 15. Organic woody material recovered and disposed in Washington in 2010 (tons) ......... 39 Table 16. Logistic costs of dry herbaceous feedstock (i.e. field dried corn stover) ($/dry ton). .. 42
Table 17. Dry woody biomass feedstock logistics projection. ..................................................... 42 Table 18. Biomass fuel preparation capital costs.......................................................................... 43 Table 19. Capital cost summary including the cost of transportation trucks and driers. .............. 44
Table 20. Preprocessing labor requirements. ................................................................................ 45 Table 21. Cost of different carbonization units for biochar production. ...................................... 46
Table 22. Dynamotive bio-oil plant capital cost including site planning, preparation, feedstock
and combustion costs. ................................................................................................................... 51
Table 23. 550 ton/day pyrolysis units installed equipment costs.................................................. 51 Table 24. Capital investment cost for a 550 ton/day unit. ............................................................ 52 Table 25. Dynamotive plant utility costs. ..................................................................................... 52
Table 26. Estimated transportation costs. ..................................................................................... 52 Table 27. Break down of labor and wages for 100 and 550 ton/day units. .................................. 53
Table 28. Annual average general and administrative fixed insurance expenses based on 100 dry
tons per day (DTPD). .................................................................................................................... 53 Table 29. Estimated (yearly) maintenance costs for wet wood pyrolysis plants. ......................... 54
Table 30. Total capital and operating costs. ................................................................................. 55 Table 31. Breakdown of ROI operating and capital costs (US $/year), 80% online. ................... 55 Table 32. Bio-oil production costs. ............................................................................................... 56
Table 33. Total project capital investment cost for a stand-alone fast pyrolysis plant using wood
biomass. ........................................................................................................................................ 57 Table 34. Average annual costs of a stand-alone pyrolysis oil production and refining plant with
a capacity of 2,000 tons/day.. ........................................................................................................ 58 Table 35. Parameters used in the sensibility analysis. .................................................................. 58 Table 36. Capital cost and product value for the scenarios studied. ............................................. 59
iv
Acknowledgements
Funding for this study is provided by the Washington State Department of Ecology with the
intention to address the growing demand for information on the design of advanced pyrolysis
units and systems to collect, transport and pre-treat feedstock to be processed in these units. The
authors wish to thank Mark Fuchs from the Waste 2 Resources Program (Washington State
Department of Ecology), and David Sjoding from the WSU Energy program for their continuous
support and encouragement. This is the third of a series of reports exploring the use of biomass
pyrolysis to sequester carbon and to produce fuels and chemicals.
This report is the last of a series of four reports available on the Department of Ecology’s
website at: www.ecy.wa.gov/beyondwaste /organics. The reports are titled: Methods for
Producing Biochar and Advanced Biofuels in Washington State. They are as follows:
Part 1: Literature Review of Pyrolysis Reactors. This report reviews the technologies that
have been developed for kilns, retorts and pyrolysers. It can be found at:
http://www.ecy.wa.gov/biblio/1107017.html.
Part 2: Literature Review of the Biomass Supply Chain and Preprocessing Technologies,
(From Field to Pyrolysis Reactor). This report reviews biomass sources, collection, and
pretreatment. It can be found at: http://www.ecy.wa.gov/biblio/1207033.html.
Part 3: Literature Review of Technologies for Product Collection and Refining. The
report describes technologies and methods for bio-oil products recovery and
characterization, biochar activation, bio-oil refining strategies and regulatory issues
related with deployment of pyrolysis technologies. It can be found at:
http://www.ecy.wa.gov/biblio/1207034.html.
Part 4: Literature Review of Sustainability Goals, Business Models, and Economic
Analyses. This report focuses on the criteria that need to be followed to integrate these
technologies into sustainable business models. The last report presents sustainability
criteria and several business models that could be used to build sustainable enterprises
based on biomass pyrolysis technologies. It can be found at:
http://www.ecy.wa.gov/biblio/1207035.html.
Some figures and photos in this report can be seen in color in the online file. Additional project
reports supported by organic Waste to Fuel Technology sponsored by Ecology are also available
on this web site. This report is also available at the Washington State University Extension
Energy Program library of bioenergy information at www.pacificbiomass.org.
Citation: Garcia-Perez M., J.A. Garcia-Nunez, T. Lewis, C. E. Kruger, M.R. Fuchs, G. Flora, S.
Kantor 2012. Methods for Producing Biochar and Advanced Bio-fuels in Washington State. Part
4: Literature Review of Financial Analysis. Fourth Project Report. Department of Biological
Systems Engineering and the Center for Sustaining Agriculture and Natural Resources,
Washington State University, Pullman, WA, 75 pp.
v
Beyond Waste Objectives Turning organic waste into resources, such as compost and biofuels, and the recovery of stable
carbon and nutrients along with other products, promotes economic vitality in growing
industries, and protects the environment. This creates robust markets and sustainable jobs in all
sectors of the economy, and facilitates closed-loop materials management where a by-product
from one process becomes feedstock for another with no waste generated.
Disclaimer This is the fourth in a series of publications on thermochemical (pyrolysis) products and
processes to recover energy, fuels, and stable carbon from organic waste. The objective of this
series of reports is to describe existing technologies to create clean, non-polluting pyrolysis units.
The Department of Ecology and Washington State University provide these publications to the
public to help individuals interested in the development of a biomass pyrolysis industry in order
to identify suitable technologies for bio-oil condensers, pyrolysis vapor combustion, removal,
cooling, briquetting, pelletization and activation of biochar and bio-oil refineries. These reports
also summarize the analytical techniques needed to characterize bio-oils and biochar and the
permits needed to implement a biomass pyrolysis industry in Washington State. Another major
goal of this project is to identify what new technologies need to be developed or what hurdles
need to be overcome to convert organic waste resources available in Washington State into
valuable products. This review does not represent an endorsement of the processes described and
is not intended to exclude any technology or company offering similar services, that due to time
and space limitations was not cited.
vi
Executive Summary
This is the last report of a series reviewing the technologies that need to be put together to build a
sustainable biomass economy to convert waste lignocellulosic resources into fuels, chemicals
and engineered biochar using pyrolysis. The first three reports of this series were descriptions of
technologies for: biomass supply chain, pre-processing, pyrolysis reactors, products collection,
heat production, bio-oil refining and biochar activation. This report focuses on the criteria that
need to be followed to integrate these technologies into sustainable business models. It discusses
several sustainability criteria and summarizes cost data needed by engineering practitioners to
conduct enterprise-level financial analyses of different biomass economy models based on
pyrolysis technologies. Finally we present some approaches to continuously improve these
technologies and develop new products. The continuous innovation, evolution and improvement
of technologies and products are critical for the success of a sustainable biomass pyrolysis
industry.
1
1. A Sustainable Biomass Economy
During a memorable speech at the Jorburg Summit, the United Nations Secretary, Kofi Annan,
discussed the challenges humans face to secure a sustainable future (Annan 2002). He pointed
out the existence of two extreme schools of thought about economic development. While the first
one focuses on economic gains without regards for the environment, the second school positions
itself on the other extreme, downplaying any economic progress because of its potential impact
on the environment. He pointed out that, instead of positioning ourselves in one of these two
extremes, humans should look beyond these two paradigms and try to live in harmony with their
natural environment. Due to our high standard of living, ever-growing population, and the rate at
which resources are being consumed, it will be difficult to expand the prosperity that has been
enjoyed by one fifth of the humans to the rest of the population with current paradigms. In the
past years, humans have destroyed over one third of the natural world. We are today consuming
20% more natural resources than the world can produce sustainably. On one hand, we are
destroying much of Nature and on the other, given the current economic structures we must
maintain or accelerate development, or market forces will create even greater damage (AtKisson
2001). It seems that our choices are limited to industrial growth destroying the environment, or
deceleration of our economic growth with disastrous social consequences. In his speech Annan
stresses that the solution is not “ecology versus economy”, it is actually how to integrate these
two paradigms (Annan 2002).
And, although science and technology are needed as tools to achieve human sustainability, a
renewed sense of spirituality and the sacred in our actions is imperative to life in harmony with
our environment (AtKisson 2001). He calls for a new sense of the sacred that is inclusive of our
historical heritage, the scientific quest and the technological imperative (AtKisson 2001). In this
regard AtKisson (2001) proposes to reinvent the sacred word “sustainability” in such a way “that
fascinates the hungry mind, satisfy the heart in search of a meaningful life, draw people to it the
way athletes are drawn to compete, the way artists are drawn to create, the way lovers are drawn
to each other.” AtKisson (2001) recommends to use the word “sustainability” only when it
carries the “full radiance of a dream” that will allow the transformation of the “industrial
capitalism or capitalism at all cost” into a more mindful “capitalism conscious of all costs” that is
able to function within the earth’s limits (AtKisson 2001, Boyd 2004). Within this new type of
capitalism, nature would have a higher value and ecosystems services (regulation of atmosphere
and climate, pollination, maintenance of bio-diversity, and cycling of nutrients and water) will
have a value to be accounted for (Lovins et al. 2004). Moving towards a sustainable capitalism
will require a revolution comparable to the Agriculture Revolution of the late Neolithic and the
Industrial Revolution of the past two centuries (Boyd 2004, Flora et al. 2010a). Growing and
developing a biomass carbonization industry, to sequester carbon and provide environmental
services and energy could be a key component in a transformation into a society that is more
sustainable.
Extensive debate occurred in the late 1990’s regarding the appropriate valuation of natural
capital (the global stock of natural resources) and ecosystem services in response to an article by
Constanza et al. (1997) published in Nature. Perspectives on this debate, published by Constanza
(1998) formed the basis for much of the recent societal debate on the issue of sustainability. The
2
essence of these debates is best captured in an article by Daly (2005). Daly states that “the global
economy is now so large that society can no longer safely pretend it operates within a limitless
ecosystem” and that “the biosphere is finite, non-growing, closed (except for the constant input
of solar energy), and constrained by the laws of thermodynamics.” He argues that “any
subsystem, such as the economy, must at some point cease growing and adapt itself to a dynamic
equilibrium, something like a steady state.” Daly’s three-point plan articulates the principles of
transitioning to an ecologically-based economy:
The economy must be transformed so that it can be sustained over the long run. It
must follow three precepts:
1. Limit use of all resources to rates that ultimately result in levels of waste that can
be absorbed by the ecosystem.
2. Exploit renewable resources at rates that do not exceed the ability of the
ecosystem to regenerate the resources.
3. Deplete nonrenewable resources at rates that, as far as possible, do not exceed
the rate of development of renewable substitutes (Daly 2005).
It is now a common, if controversial, proposition that the development of biomass feedstock-
based fuels, chemicals and materials is a key strategy for realizing larger sustainability goals.
Anex et al. (2007) wrestled with these concepts of sustainability in the context of the emerging
biomass feedstock-based economy, stating that:
Whether this is a positive impact or a negative impact will depend largely on how
biomass feedstocks are produced and converted, and the extent to which these two
activities are integrated. As in any managed ecosystem, nutrient management in
industrial biomass … must address multiple criteria, including air and water quality,
nutrient use efficiency, and … economics (Anex et al. 2007).
This fourth report focuses on commercial financial considerations (i.e. business models) for the
application of pyrolysis technology as a strategy for sustainable recovery of energy, carbon,
nutrients and products from organic wastes. The authors think it is critical to consider the
available literature presented below on business models through the larger lens of sustainability
which was not necessarily an explicit goal in all the studies reviewed. The authors also
recommend that further analyses of the larger sustainability issues presented above be conducted
on the implementation of biomass feedstock-based industries to determine whether this emerging
industry is actually achieving outcomes consistent with stated sustainability goals.
One of the ways sustainability is being incorporated in today’s corporate culture is through triple
bottom line analyses (McDonough & Braungart, 2002). The triple bottom line can be understood
with a triple E' triangle. Economic profitability, Environmental protection and social Equity are
presented as variable indexes on the legs of an equilateral triangle (McDonough and Braungart,
2002). This concept has been used recently for corporations as a tool to improve the
environmental performance while maintain economic goals. This tool has resulted in strategies to
improve resource use efficiency and drive down waste production while minimizing
environmental and social liabilities (McDonough & Braungart, 2002). Sustainability represents
an opportunity to build business value through the following drivers: reduced risk and liability,
3
operating efficiencies and cost savings, synergies with stakeholders, and enhanced reputation and
brand differentiation (MBDC, 2010).
Moreover, McDonough & Braungart (2002) recommend a stronger focus from the beginning of a
project which they call the triple top line. The authors differentiate “top line” (targeting
ambitious achievable sustainability goals) versus “bottom line” (targeting minimum
sustainability and social requirements). To incorporate “top line” criteria, project designers must
consider how to “enhance the well being of nature and culture while generating economic
value.” http://www.mcdonough.com/writings/beyond_triple.htm, retrieved 1/18/2013) The
authors argue that “if one approaches the design process asking, right from the start, how to grow
prosperity, celebrate my community, and enhance the health of all species, the result is likely to
be far more positive and enriching than measuring performance against a bottom line standard.”
Introducing positive aspirations in each of our designs and actions is critical to build a
sustainable biochar industry. The authors suggest that rather than balancing equity, ecology and
economy, an intelligent design should use the dynamics among these three points to create
business opportunities and maximize values and services in each of these areas
(http://www.mcdonough.com/writings/design_for_triple.htm, retrieved 1/18/2013,
http://www.renegademedia.info/books/william-mcdonough.html, retrieved 1/18/2013). The
design of sustainable business models based on pyrolysis technologies should adhere to these
concepts and should be able to offer beneficial environmental services, enhanced well being to
people, while producing economic value in the form of heat, power, transportation fuels and
chemicals. Communities in Washington State value a rural lifestyle and access to open spaces,
and enjoy seeing healthy agricultural lands, wild lands and wildlife (Flora 2010a). Sensitivity to
these values is important for developing a biomass economy in our state (Flora 2010a,
McDonough & Braungart 2002).
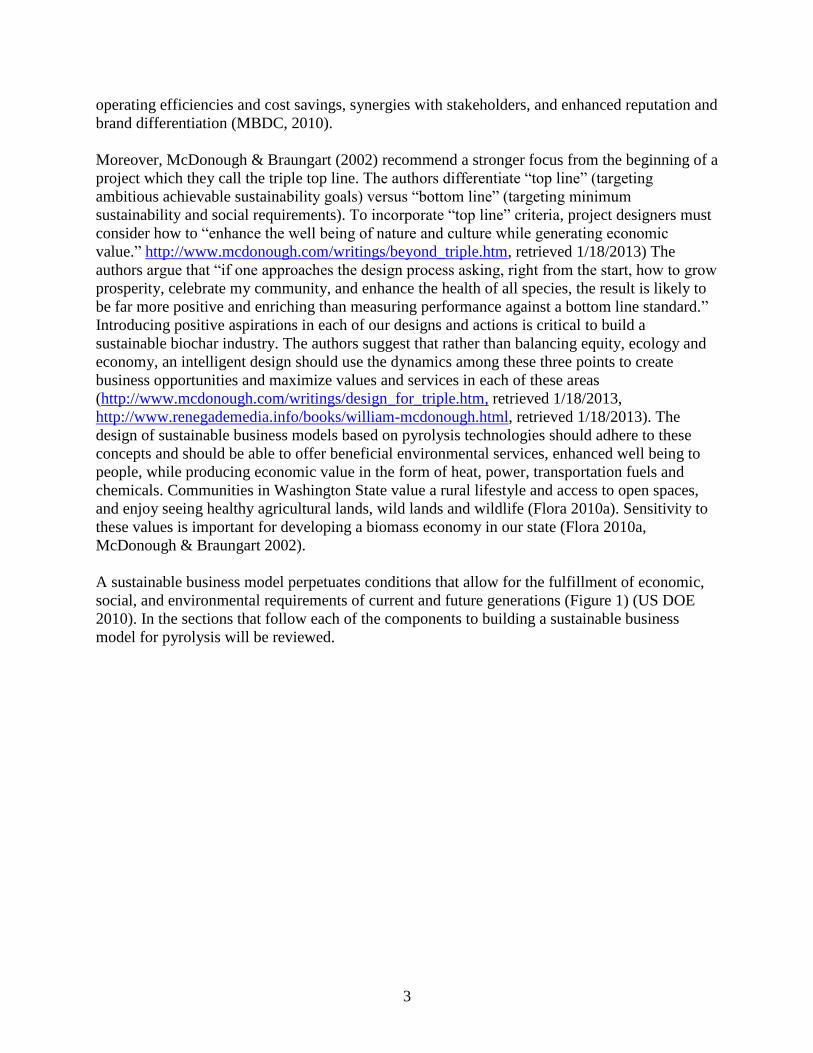
A sustainable business model perpetuates conditions that allow for the fulfillment of economic,
social, and environmental requirements of current and future generations (Figure 1) (US DOE
2010). In the sections that follow each of the components to building a sustainable business
model for pyrolysis will be reviewed.
4
Figure 1. Sustainability criteria affect all aspects of the biomass to bioenergy supply chain (modified from US DOE 2010).
1.1 Environmental sustainability
The International Biochar Initiative (IBI) presents an excellent discussion on biochar production
and sustainability (http://www.biochar-international.org/sustainability, retrieved 1/18/13). It is
very difficult to provide a complete review of all the issues associated with biochar and bio-oil
sustainability (feedstock and land use, personnel production safety, environmental applications
and potential impacts, transportation, application, economics, soil and crop sustainability, carbon
sequestration ability, stability of carbon in soil, and energy use and output). The number of
publications in this area is growing dramatically, so in this section we discuss some of the most
important documents published recently. Biochar sustainability principals prepared by the
International Biochar Initiative (2012) can be found at: http://www.biochar-
International.org/sites/default/files/IBI_Biochar_Sustainability_Principles_September_2012.pdf,
retrieved 1/18/2013).
Deploying a biomass pyrolysis industry could be an important component of building a
sustainable future because this is one of the few alternatives to sequester carbon. In fact a
biomass carbonization industry offers an excellent opportunity to reproduce the natural process
of carbon fixation similar to the one responsible for the formation of coal deposits. Though most
people look to the improvement in soil fertility and other environmental services that biochar
provides as the primary benefit of building a biomass carbonization industry, the use of pyrolysis
vapors to produce heat (electricity) or the production of bio-oil to replace fossil fuels are also
Supply Chain from Biomass to Drop-in Fuels and Engineered Biochar
Feedstock Supply Biomass Pyrolysis Rural and centralized
Bio-oil Refineries
Biochar Activation Engineered Biochar
Crude Bio-oil
Biochar
Environmental Sustainability
Economic Sustainability
Social Sustainability
Sustainability Criteria
Drop-in fuels
High value Chemicals
5
important components that must be considered when evaluating the sustainability of this industry
(Woolf et al. 2010).
Current pyrolysis technologies can recover heat for combined heat and power (CHP),
conditioning building space, for thermal industrial applications and oil, and for further refining.
However, bio-oil refineries do not currently exist. So, commercial biochar production will likely
occur as a result of pyrolysis for heat production. In the future, condensable liquid fuel recovery
may be supported by bio-oil refinery capacity. Although, there are very few studies on the
combustion of pyrolysis vapors, its combustion products are expected to be much cleaner than
those generated when the whole biomass is combusted just as natural gas burns more cleanly
than coal.
Small pyrolysis CHP distributed systems could have many advantages over large systems. Half
of the energy is contained in the biochar produced and half can be used for heat and electricity
production. Lovins (2002) listed 207 benefits of distributed production systems that should be
leveraged to develop more competitive systems. Typically small distributed CHP systems sized
for the needs of local markets shorten construction period, lower capital and interest costs. These
small units can be built on a “pay-as-you-go” basis which can match gradual changes in demand.
One of the major advantages of small systems is that they can be integrated well within existing
infrastructure. Because these units will use distributed resources, which do not need to be
transported long distances, they could produce heat at lower prices. Small systems lower local
impacts and they tend to be inherently benign. This would reduce construction risks. These small
units could shorten the development and production times which could allow exploitation of
rapid learning to develop several generations of the technology in shorter times than is possible
when a single large unit is built. Lessons learned during the operation of these systems can be
applied incrementally and immediately to a new generation of the product. These small CHP
units can be more easily adapted to changes in local feedstock composition and can be adapted to
produce biochar for targeted local environmental services. The portability of small systems
offers advantages because these units can be more readily sold, with higher salvage value than
large centralized units which tend to have high demolition costs at the end of their useful lives
(Lovins 2002).
The use of biomass waste resources from recycled and reclaimed wood materials is intrinsically
more sustainable that the use of energy crops. However, the ability and reliability of supplying
waste materials the whole year is an issue that could be solved by combining the processing of
clean processed waste biomass generated by industries, agricultural and forest operations and
cities as well as biomass produced as energy crops to create a steady stream of feedstock. Soil
quality, biological diversity, and minimal negative land use impact during the feedstock
production are critical considerations of a biomass business model that can also be minimized
when relatively small systems are used. Replenishing, maintaining, and enhancing soil organic
matter is very crucial to develop a sustainable biomass economy. Maintaining a soil cover with
biomass provides soil protection from water erosion and wind (Flora 2010a). To help bring
biochar into the market, its potential as an ecological sorbent, mediator, and facilitator of
environmental services must be more thoroughly demonstrated. The economic value associated
with heat, fuels, chemical and biochar provide huge opportunities to develop a sustainable
biomass economy based on pyrolysis.
6
Globally, biochar is being explored to improve soils for crop production, retain soil moisture,
remediate polluted sites, and to sequester carbon by storing atmospheric carbon dioxide (CO2)
fixed by plants in stable form in soil. Biochar has also been demonstrated to have numerous
environmental applications and ecosystem uses. Recent applications of biochar are evolving and
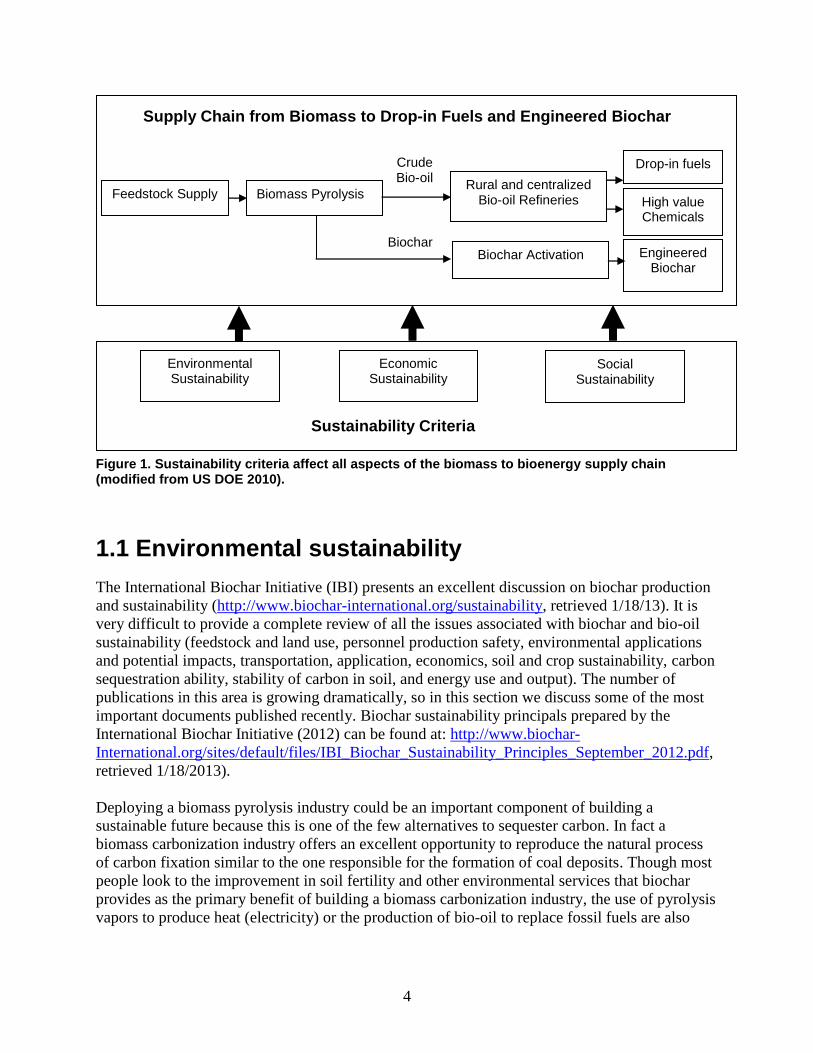
new markets are being created. A spray on fiber mat and seed layer, PermaMatrix, was used to
help establish vegetation on an industrial site with drastically disturbed soils (Figure 2). Biochar
was admixed (10%) with the fiber mat. The area without vegetation (center, Figure 2) did not
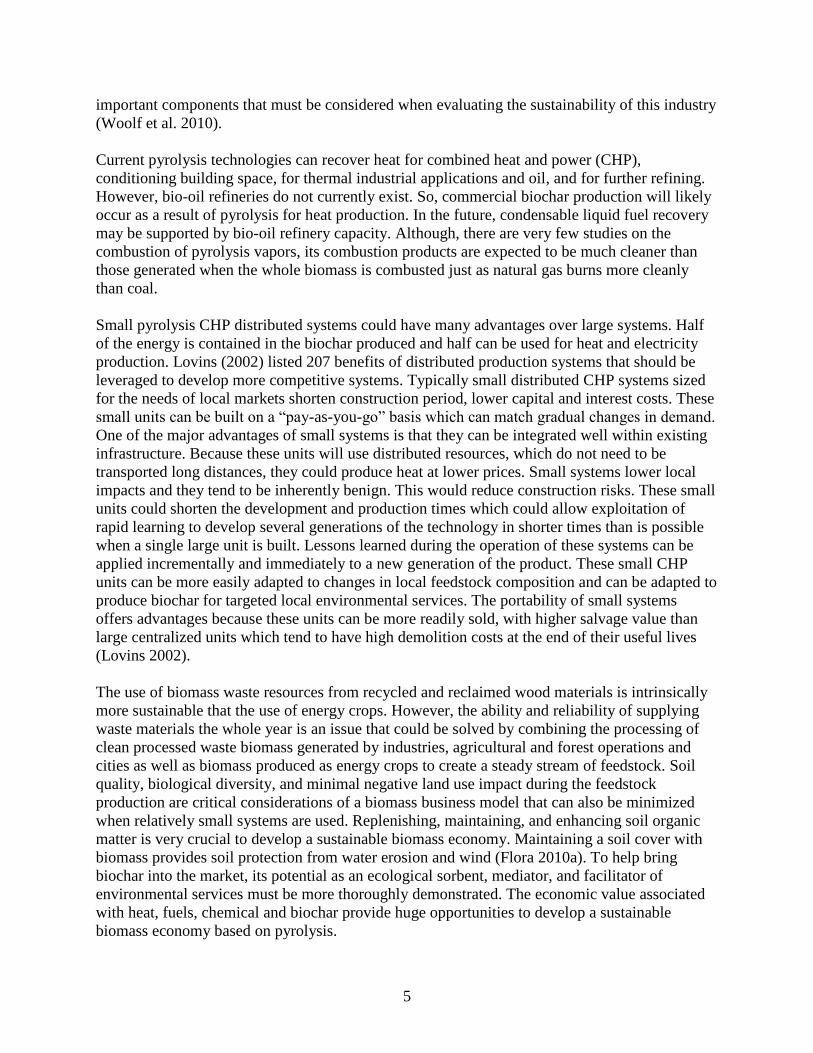
receive the biochar mixture. Biochar is currently being used as a filter media to adsorb
contaminants in rainwater and stormwater runoff (Figures 3). Kearns (2012) used biochar as a
final media in a potable water system.
Figure 2. Soils reclaimed with PermaMatrix mixed with 10% biochar. (Miles 2010, http://www.futureenergyconference.com/2010/FECWA-Presentations/4D_Miles.pdf).
Figure 3. Roof drain using biochar for filtering zinc from roof runoff. (Miles 2010, http://www.futureenergyconference.com/2010/FECWA-Presentations/4D_Miles.pdf).
7
Biochar is an excellent vehicle to develop robust environmental services. It has been identified as
a soil amendment and as a tool for carbon sequestration (Woolf et al., 2010). Studies have
indicated that biochar can reduce greenhouse gas off-gassing from soils; CO2 and nitrous oxide
off-gassing for example can be reduced by 60 to 70% (Felder et al. 2005, Taghizadeh-Toosi, et
al. 2011). Excellent reviews and report on the effect of biochar on climate change and soil can be
found elsewhere (Sohi et al. 2009, Bracmort 2009, Verheijen et al. 2010). Environmental
services supplied by soil organic matter can be provided by specially designed biochar thereby
contributing to the importance and viability of this industry as well.
Although there may be several mechanisms that allow biochar to be considered as a soil
amendment, the direct supply of nutrients to plants and the improvement of nutrients uptake by
improving soil quality are considered the two main mechanisms of biochar action (Chan & Xu
2009). Other environmental services that biochar could provide include: (1) the sorption and
removal of nutrients (Nitrogen-N, Phosphorous-P) or contaminants (Zinc-Zn, Cooper-Cu, Lead-
Pb) from liquid waste streams, (2) odor sorption (such as hydrogen sulphide-H2S, and organo-
sulfur and nitrogen compounds) and removal from gaseous streams and (3) cleanup of
contaminated soils.
The practice of payment for ecosystem or environmental services is typically implemented in the
form of incentives to farmers and landowners in exchange for use of their land to provide
environmental services that benefit households, communities and economies. The Millennium
Ecosystem Assessment (Millennium Ecosystem Assessment, 2005) report”
(http://www.millenniumassessment.org/documents/document.356.aspx.pdf, retrieved 1/18/13)
defined categories of ecosystem services:
1. Food production
2. Fiber production
3. Genetic resources
4. Fresh water
5. Air quality
6. Climate regulation
7. Water regulation
8. Erosion regulation
9. Water purification
10. Water treatment
11. Disease regulation
12. Pest regulation
13. Pollination
14. Natural hazard regulation and cultural services
There are very few studies on the use of biochar as means to provide some of these
environmental services. Biochar sorbs nutrient compounds, and may reduce the quantity of
fertilizers needed while achieving equal or better crop production. Consequently, biochar
mitigates the detrimental effects of nutrients leaching to the surrounding ecosystems.
8
Likewise urban storm water poses a serious threat by degrading surface water bodies, both in the
United States and worldwide. The U.S. National Research Council has named urban storm water
a leading source of water quality impairments due to the amount of pollutants it carries into
receiving waters; these pollutants include heavy metals, nutrients (P, N), pesticides and industrial
organic pollutants. In order to reduce the affect of storm water pollution, green storm water
infrastructures (GSIs) are being constructed. These infrastructures are made to filter, and detain
and allow runoff – essentially mimicking natural landscapes with predevelopment hydrological
conditions. One technique of the GSIs that is particularly popular in the Puget Sound area is the
bioretention system (or rain garden). Likewise the use of biochar in living roof systems captures
and holds rainwater, putting it to beneficial use while capturing pollutants and reducing run-off.
The potential use of biochar in these GSIs and green roof applications, and its effect on the water
purification efficiency should be thoroughly studied. This application could greatly increase the
markets for engineered biochar.
Biochar could also be an important component of the carbon offset markets (either the
compliance or the voluntary market), however, it is not currently recognized as an official
method of producing carbon credits but many experts believe it will be soon accepted (De Gryze
et al. 2010, Baranick et al. 2011, Diamant 2011, Weisberg et al. 2010). The International Biochar
Initiative is working to obtain recognition of biochar in the United Nations Framework
Convention on Climate Change (UNFCCC) as a tool for emission reduction and carbon credits
for emission reductions that are measurable, reportable and verifiable.
The Climate Trust (Weisberg et al. 2010) conducted an assessment of biochar to determine its
appropriateness as a terrestrial carbon sequestration offset and concluded that attractive projects
must meet the following criteria: (1) Projects must use waste biomass, that in the absence of the
project, will be left to decompose. (2) Projects must account carbon credits by producing 25,000
tons (or more) of biochar in 20 years. This capacity is only related to minimum size for which
the carbon credits will be counted and has nothing to do with the scale needed to ensure the
economic viability of the business. (3) Projects must consistently monitor the place where the
biochar produced is incorporated into the soil.
Biochar is currently being investigated for reclamation of abandoned mines. Over 161,000
abandoned mine sites exist in 12 western U.S. states, with at least 33,000 degrading the
environment according to the Government Accountability Office’s 2011 report on the subject.
Biochar is being evaluated as an additive to animal feed to reduce methane emissions, as an
additive to animal bedding to reduce methane and ammonia and control the run-off of nitrogen.
Dow Chemical is evaluating biochar soil amendments to reduce the uptake of mercury in the
aquatic plant and fish food chain near brownfields. Unpublished results suggest reductions in
uptake of up to 85% (personal communication, 2012).
The payment for ecosystem services can be executed as contracts between consumers or
ecosystem services and the suppliers of these services. These payments require an assessment of
the range and value of ecosystem services flowing from a particular locale or region, the
beneficiaries, and a policy, subsidy or market capture value. Biochar can be designed to offer one
or more of these environmental services (see list on page 7). The payment for the environmental
benefits of sequestering carbon by biochar addition to soils could be articulated by either carbon
9
credits in emission markets or carbon taxes. Several excellent presentations on biochar
sustainability issues can be found elsewhere (Roberts et al. 2010, Amonette 2010, Fournier 2012,
Steiner et al. 2010, Verheijen and Montanarella 2010, Cowie et al. 2010, Flora 2012).
1.2 Social sustainability
Social sustainability is frequently overlooked yet critical for developing a business model. It is
critical that business models reflect society’s needs, and support improvements and benefits to
the regional culture. It is not enough to build an enterprise, in economically depressed settings,
providing positive impacts is critical. Supporting nearby living wage jobs with tangential
benefits, such as remediation of brownfields, or providing community access to clean water, or
processing waste materials generated by the community should also be considered to build
sustainable business models. Some aspects of a socially sustainable business model include: 1)
ensuring that the technology contributes to the creation of healthy, satisfying jobs in
communities, 2) demonstrating a positive net energy balance compared to fossil fuels, 3)
increasing access of isolated communities to affordable clean energy and 4) improving energy
densification and security (e.g. reducing the dependency on fossil fuels and increasing the
diversity of energy supplies) (Flora 2010a).
The opportunity to support communities is one of the most important social values of creating a
pyrolysis industry. According to Baranick et al. (2011) the social benefits of pyrolysis plants can
be summarized in four categories: Pyrolysis plants would: 1) provide livable wages to its
workers, 2) provide year round employment, 3) provide workers with the opportunity to work
outdoors, and 4) create partnerships between local industries (for example: composters,
nurseries, urban gardens and farms).
Another less considered but necessary societal benefit would be developing production practices
that produce less waste or in fact zero waste for future generations to manage. As previously
noted 90% of materials used to make a product end up directly landfilled. This social objective
would be to maximize cultural outcomes by leaving future generations abundant resources to
meet their living requirements.
Likewise, business models need to consider factors beyond jobs and community infrastructure,
that is, how can this business enhance relationships, create visually appealing environments and
conserve ecosystem services that benefit health and well-being. These may sound like lofty goals
or perhaps non-germane to the bottom line but a truly successful business generates respect, and
cultivates a positive image, thus benefit greatly from community and employee loyalty and
support.
Business entrepreneurs in the emerging biomass industry need to understand and respond
positively to potential detractors to gain and maintain social capital. Ignoring, or defending
through defaming opponents undermines credibility and threatens success of not only individual
businesses but the broad biomass industry. Opposition to the use of biomass in many instances is
based on previous mistakes or business behaviors which ignored basic conservation and social
principles.
10
People concerned about biomass use tend to share some or all of the following concerns:
Replacing croplands currently used for food and animal feed with biomass plantations
and mono-culture crops
Conversion of native forests or prairie to croplands
Converting Conservation Reserve Program lands to biomass production
Acceleration and expansion of forest thinning, including removal of mature, live trees for
biomass
Building roads and developing wild lands to collect biomass
Shorting current uses/users of current uses of biomass
Deleterious effects on soil nutrient levels, habitat, water and air quality, wildlife by
removal of too much biomass
Loss of up-cycling opportunity
Lack of recognition of the importance of biomass to ecosystem functions including
wildlife habitat.
Each of these concerns have validity and need to be proactively addressed by demonstrating
through a sustainable business model that these factors have been considered and protocols
developed that avoid the deleterious effects of the concerns. Sustainability principles and
practices are currently being developed by IBI and USBI to assist biochar practitioners and
businesses in meeting these challenges and securing a positive reputation for sustainable
practices.
In today’s world, a product’s value is usually measured from an economic standpoint. But, as we
progress, this economic value must also elevate the environmental and social value of the
product or service. Due to the affects that industrialization is having on the earth, environmental
groups and regulatory agencies have been formed in order to preserve the health of this planet.
These groups must work together with the groups of Wall Street and main street if the human
condition is going to improve particularly as populations continue to grow. Our goal is to create
synergistic outcomes that maximize benefits to people, restore and enhance ecosystems and that
are likewise profitable, thus can be successful over a long period. A new paradigm has been
called for by many where enhanced services to the three sectors is paramount and benefit the
entire economic and ecological system including human health and well-being (McDonough and
Braungart 2002, Flora 2010b, Daily 2005).
1.3 Financial sustainability
Finally, the financial sustainability of a proposed business model depends on a vision that goes
beyond short-term profitability. Environmental and social sustainability must be incorporated
into final profitable operations. Financial sustainability requires that profit must occur without
externalizing costs to the environment or to people. The triple top line should be incorporated
from the beginning of the design of a project (McDonough and Braungart 2002). The designers
should take advantage of the dynamics among these three points to create business opportunities
and maximize values in each of these areas.

11
Many companies have understood the business potential inherent to sustainability (MBDC,
2010). They can create business value through the following drivers: reduced risk and liability,
operating efficiencies and cost savings, synergies with stakeholders, and enhanced reputation and
brand differentiation (MBDC, 2010). This vision must catalyze values to innovate continuous
enhancement of productivity and process efficiency (US DOE 2010). Section 2 reviews several
business models that have been developed for pyrolysis based biomass economies.
12
2. Frameworks for the Development of Business Models
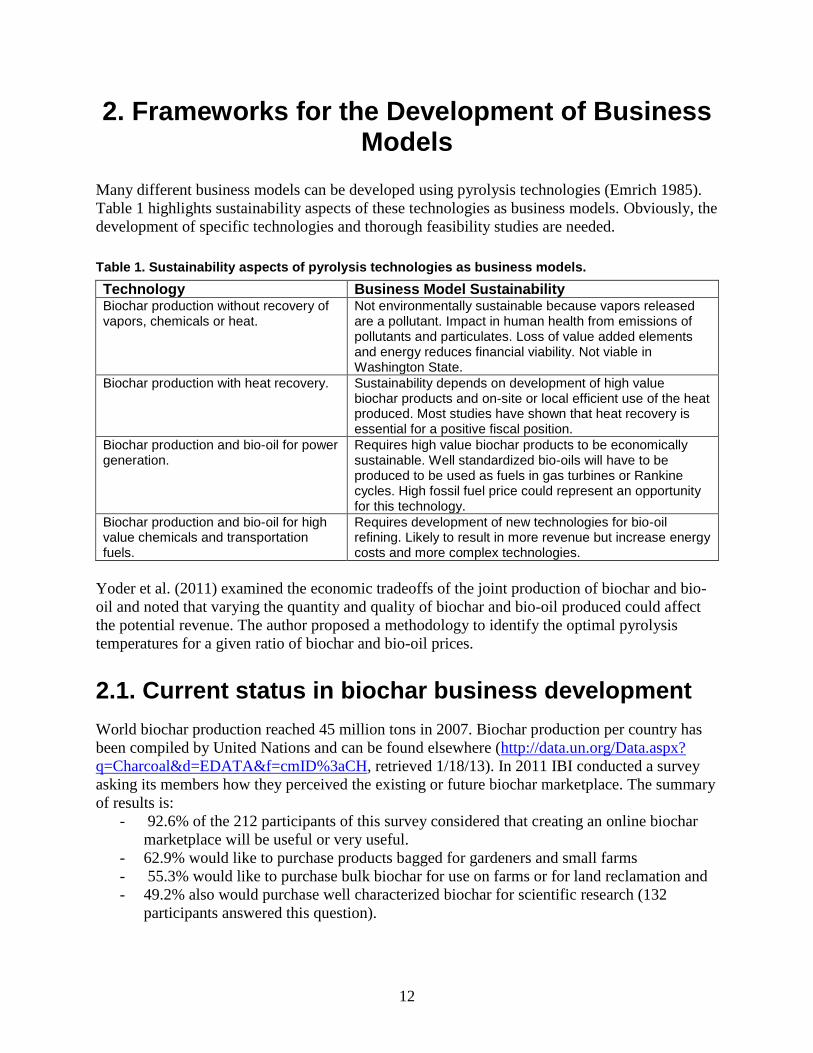
Many different business models can be developed using pyrolysis technologies (Emrich 1985).
Table 1 highlights sustainability aspects of these technologies as business models. Obviously, the
development of specific technologies and thorough feasibility studies are needed.
Table 1. Sustainability aspects of pyrolysis technologies as business models.
Technology Business Model Sustainability Biochar production without recovery of vapors, chemicals or heat.
Not environmentally sustainable because vapors released are a pollutant. Impact in human health from emissions of pollutants and particulates. Loss of value added elements and energy reduces financial viability. Not viable in Washington State.
Biochar production with heat recovery. Sustainability depends on development of high value biochar products and on-site or local efficient use of the heat produced. Most studies have shown that heat recovery is essential for a positive fiscal position.
Biochar production and bio-oil for power generation.
Requires high value biochar products to be economically sustainable. Well standardized bio-oils will have to be produced to be used as fuels in gas turbines or Rankine cycles. High fossil fuel price could represent an opportunity for this technology.
Biochar production and bio-oil for high value chemicals and transportation fuels.
Requires development of new technologies for bio-oil refining. Likely to result in more revenue but increase energy costs and more complex technologies.
Yoder et al. (2011) examined the economic tradeoffs of the joint production of biochar and bio-
oil and noted that varying the quantity and quality of biochar and bio-oil produced could affect
the potential revenue. The author proposed a methodology to identify the optimal pyrolysis
temperatures for a given ratio of biochar and bio-oil prices.
2.1. Current status in biochar business development
World biochar production reached 45 million tons in 2007. Biochar production per country has
been compiled by United Nations and can be found elsewhere (http://data.un.org/Data.aspx?
q=Charcoal&d=EDATA&f=cmID%3aCH, retrieved 1/18/13). In 2011 IBI conducted a survey
asking its members how they perceived the existing or future biochar marketplace. The summary
of results is:
- 92.6% of the 212 participants of this survey considered that creating an online biochar
marketplace will be useful or very useful.
- 62.9% would like to purchase products bagged for gardeners and small farms
- 55.3% would like to purchase bulk biochar for use on farms or for land reclamation and
- 49.2% also would purchase well characterized biochar for scientific research (132
participants answered this question).
13
Some biochar enthusiasts are currently producing biochar at varying scales or are creating the
technology for biochar production. Much can be learned from these early adopters. Several
listservs exist allowing for open discussion and information sharing about all aspects of biochar
(http://tech.groups.yahoo.com/group/biochar-production/, retrieved 1/18/13;
http://terrapreta.bioenergylists.org/buy_biochar, retrieved 1/18/13). For example, an interesting
group of discussions on biochar production where members intending to produce biochar, are
already producing biochar for personal use, or are commercializing their products can be found
at http://tech.groups.yahoo.com/group/biochar-production/ (retrieved 1/18/13). A list of some of
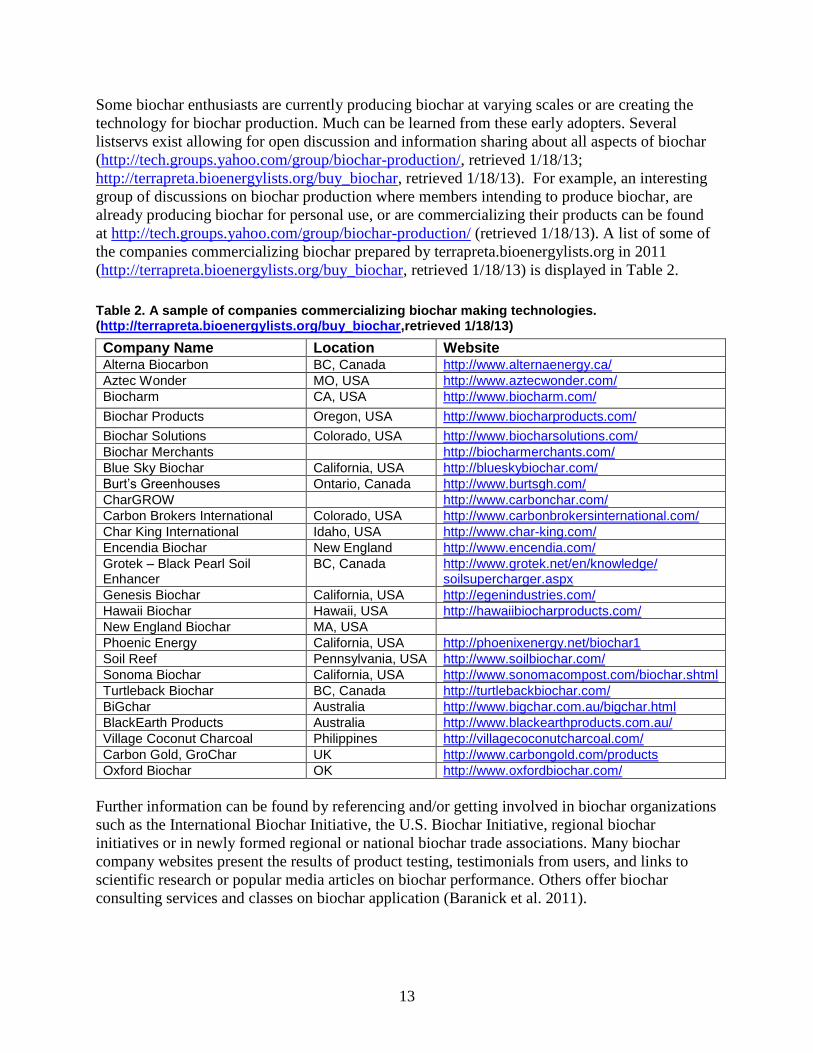
the companies commercializing biochar prepared by terrapreta.bioenergylists.org in 2011
(http://terrapreta.bioenergylists.org/buy_biochar, retrieved 1/18/13) is displayed in Table 2.
Table 2. A sample of companies commercializing biochar making technologies. (http://terrapreta.bioenergylists.org/buy_biochar,retrieved 1/18/13)
Company Name Location Website Alterna Biocarbon BC, Canada http://www.alternaenergy.ca/
Aztec Wonder MO, USA http://www.aztecwonder.com/
Biocharm CA, USA http://www.biocharm.com/
Biochar Products Oregon, USA http://www.biocharproducts.com/
Biochar Solutions Colorado, USA http://www.biocharsolutions.com/
Biochar Merchants http://biocharmerchants.com/
Blue Sky Biochar California, USA http://blueskybiochar.com/
Burt’s Greenhouses Ontario, Canada http://www.burtsgh.com/
CharGROW http://www.carbonchar.com/
Carbon Brokers International Colorado, USA http://www.carbonbrokersinternational.com/
Char King International Idaho, USA http://www.char-king.com/
Encendia Biochar New England http://www.encendia.com/
Grotek – Black Pearl Soil Enhancer
BC, Canada http://www.grotek.net/en/knowledge/ soilsupercharger.aspx
Genesis Biochar California, USA http://egenindustries.com/
Hawaii Biochar Hawaii, USA http://hawaiibiocharproducts.com/
New England Biochar MA, USA
Phoenic Energy California, USA http://phoenixenergy.net/biochar1
Soil Reef Pennsylvania, USA http://www.soilbiochar.com/
Sonoma Biochar California, USA http://www.sonomacompost.com/biochar.shtml
Turtleback Biochar BC, Canada http://turtlebackbiochar.com/
BiGchar Australia http://www.bigchar.com.au/bigchar.html
BlackEarth Products Australia http://www.blackearthproducts.com.au/
Village Coconut Charcoal Philippines http://villagecoconutcharcoal.com/
Carbon Gold, GroChar UK http://www.carbongold.com/products
Oxford Biochar OK http://www.oxfordbiochar.com/
Further information can be found by referencing and/or getting involved in biochar organizations
such as the International Biochar Initiative, the U.S. Biochar Initiative, regional biochar
initiatives or in newly formed regional or national biochar trade associations. Many biochar
company websites present the results of product testing, testimonials from users, and links to
scientific research or popular media articles on biochar performance. Others offer biochar
consulting services and classes on biochar application (Baranick et al. 2011).
14
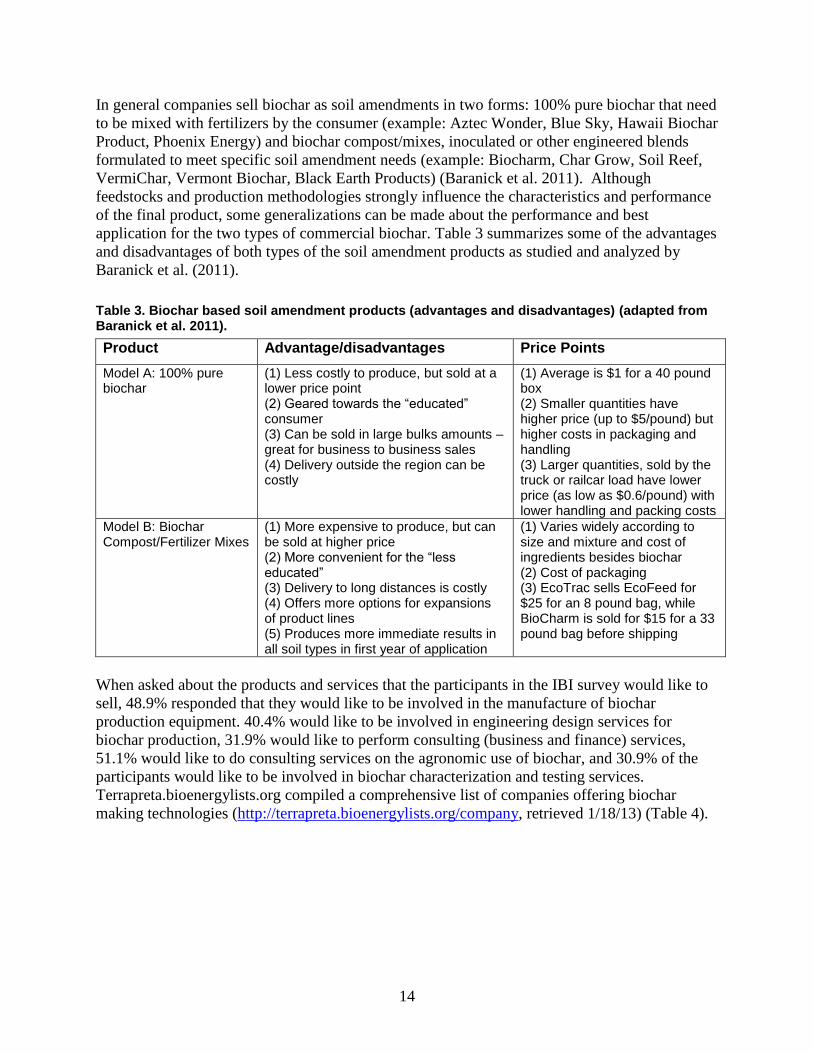
In general companies sell biochar as soil amendments in two forms: 100% pure biochar that need
to be mixed with fertilizers by the consumer (example: Aztec Wonder, Blue Sky, Hawaii Biochar
Product, Phoenix Energy) and biochar compost/mixes, inoculated or other engineered blends
formulated to meet specific soil amendment needs (example: Biocharm, Char Grow, Soil Reef,
VermiChar, Vermont Biochar, Black Earth Products) (Baranick et al. 2011). Although
feedstocks and production methodologies strongly influence the characteristics and performance
of the final product, some generalizations can be made about the performance and best
application for the two types of commercial biochar. Table 3 summarizes some of the advantages
and disadvantages of both types of the soil amendment products as studied and analyzed by
Baranick et al. (2011).
Table 3. Biochar based soil amendment products (advantages and disadvantages) (adapted from Baranick et al. 2011).
Product Advantage/disadvantages Price Points
Model A: 100% pure biochar
(1) Less costly to produce, but sold at a lower price point (2) Geared towards the “educated” consumer (3) Can be sold in large bulks amounts – great for business to business sales (4) Delivery outside the region can be costly
(1) Average is $1 for a 40 pound box (2) Smaller quantities have higher price (up to $5/pound) but higher costs in packaging and handling (3) Larger quantities, sold by the truck or railcar load have lower price (as low as $0.6/pound) with lower handling and packing costs
Model B: Biochar Compost/Fertilizer Mixes
(1) More expensive to produce, but can be sold at higher price (2) More convenient for the “less educated” (3) Delivery to long distances is costly (4) Offers more options for expansions of product lines (5) Produces more immediate results in all soil types in first year of application
(1) Varies widely according to size and mixture and cost of ingredients besides biochar (2) Cost of packaging (3) EcoTrac sells EcoFeed for $25 for an 8 pound bag, while BioCharm is sold for $15 for a 33 pound bag before shipping
When asked about the products and services that the participants in the IBI survey would like to
sell, 48.9% responded that they would like to be involved in the manufacture of biochar
production equipment. 40.4% would like to be involved in engineering design services for
biochar production, 31.9% would like to perform consulting (business and finance) services,
51.1% would like to do consulting services on the agronomic use of biochar, and 30.9% of the
participants would like to be involved in biochar characterization and testing services.
Terrapreta.bioenergylists.org compiled a comprehensive list of companies offering biochar
making technologies (http://terrapreta.bioenergylists.org/company, retrieved 1/18/13) (Table 4).
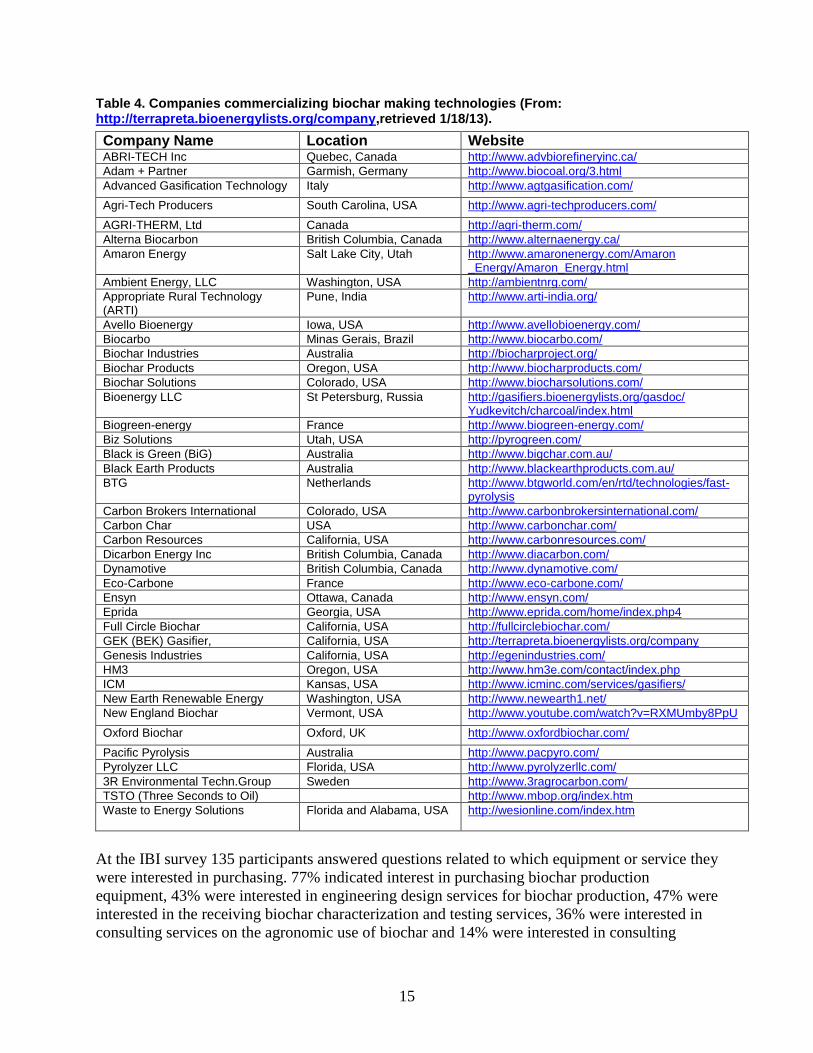
15
Table 4. Companies commercializing biochar making technologies (From: http://terrapreta.bioenergylists.org/company,retrieved 1/18/13).
Company Name Location Website ABRI-TECH Inc Quebec, Canada http://www.advbiorefineryinc.ca/
Adam + Partner Garmish, Germany http://www.biocoal.org/3.html
Advanced Gasification Technology Italy http://www.agtgasification.com/
Agri-Tech Producers South Carolina, USA http://www.agri-techproducers.com/
AGRI-THERM, Ltd Canada http://agri-therm.com/
Alterna Biocarbon British Columbia, Canada http://www.alternaenergy.ca/
Amaron Energy Salt Lake City, Utah http://www.amaronenergy.com/Amaron _Energy/Amaron_Energy.html
Ambient Energy, LLC Washington, USA http://ambientnrg.com/
Appropriate Rural Technology (ARTI)
Pune, India http://www.arti-india.org/
Avello Bioenergy Iowa, USA http://www.avellobioenergy.com/
Biocarbo Minas Gerais, Brazil http://www.biocarbo.com/
Biochar Industries Australia http://biocharproject.org/
Biochar Products Oregon, USA http://www.biocharproducts.com/
Biochar Solutions Colorado, USA http://www.biocharsolutions.com/
Bioenergy LLC St Petersburg, Russia http://gasifiers.bioenergylists.org/gasdoc/ Yudkevitch/charcoal/index.html
Biogreen-energy France http://www.biogreen-energy.com/
Biz Solutions Utah, USA http://pyrogreen.com/
Black is Green (BiG) Australia http://www.bigchar.com.au/
Black Earth Products Australia http://www.blackearthproducts.com.au/
BTG Netherlands http://www.btgworld.com/en/rtd/technologies/fast-pyrolysis
Carbon Brokers International Colorado, USA http://www.carbonbrokersinternational.com/
Carbon Char USA http://www.carbonchar.com/
Carbon Resources California, USA http://www.carbonresources.com/
Dicarbon Energy Inc British Columbia, Canada http://www.diacarbon.com/
Dynamotive British Columbia, Canada http://www.dynamotive.com/
Eco-Carbone France http://www.eco-carbone.com/
Ensyn Ottawa, Canada http://www.ensyn.com/
Eprida Georgia, USA http://www.eprida.com/home/index.php4
Full Circle Biochar California, USA http://fullcirclebiochar.com/
GEK (BEK) Gasifier, California, USA http://terrapreta.bioenergylists.org/company
Genesis Industries California, USA http://egenindustries.com/
HM3 Oregon, USA http://www.hm3e.com/contact/index.php
ICM Kansas, USA http://www.icminc.com/services/gasifiers/
New Earth Renewable Energy Washington, USA http://www.newearth1.net/
New England Biochar Vermont, USA http://www.youtube.com/watch?v=RXMUmby8PpU
Oxford Biochar Oxford, UK http://www.oxfordbiochar.com/
Pacific Pyrolysis Australia http://www.pacpyro.com/
Pyrolyzer LLC Florida, USA http://www.pyrolyzerllc.com/
3R Environmental Techn.Group Sweden http://www.3ragrocarbon.com/
TSTO (Three Seconds to Oil) http://www.mbop.org/index.htm
Waste to Energy Solutions Florida and Alabama, USA http://wesionline.com/index.htm
At the IBI survey 135 participants answered questions related to which equipment or service they
were interested in purchasing. 77% indicated interest in purchasing biochar production
equipment, 43% were interested in engineering design services for biochar production, 47% were
interested in the receiving biochar characterization and testing services, 36% were interested in
consulting services on the agronomic use of biochar and 14% were interested in consulting

16
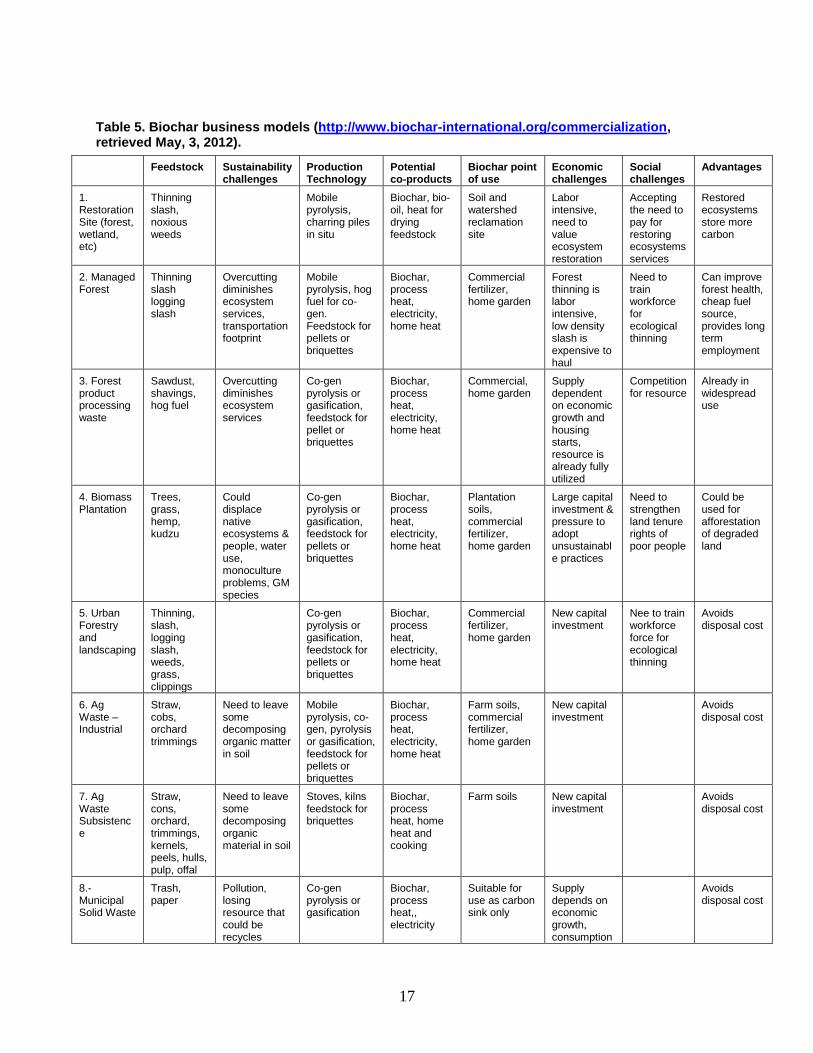
services (business and finance). Table 5 summarizes the feedstock, sustainability challenges,
production technology, post-processing steps, potential co-products, biochar point of use,
economic and social challenges and advantages of several potential business models. It is
important to point out that Table 5 is not exhaustive. Some applications such as storm water
treatment, roof runoff, wastewater applications, compost emissions that are being studied today
are not reflected in this table.
17
Table 5. Biochar business models (http://www.biochar-international.org/commercialization, retrieved May, 3, 2012).
Feedstock Sustainability challenges
Production Technology
Potential co-products
Biochar point of use
Economic challenges
Social challenges
Advantages
1. Restoration Site (forest, wetland, etc)
Thinning slash, noxious weeds
Mobile pyrolysis, charring piles in situ
Biochar, bio-oil, heat for drying feedstock
Soil and watershed reclamation site
Labor intensive, need to value ecosystem restoration
Accepting the need to pay for restoring ecosystems services
Restored ecosystems store more carbon
2. Managed Forest
Thinning slash logging slash
Overcutting diminishes ecosystem services, transportation footprint
Mobile pyrolysis, hog fuel for co-gen. Feedstock for pellets or briquettes
Biochar, process heat, electricity, home heat
Commercial fertilizer, home garden
Forest thinning is labor intensive, low density slash is expensive to haul
Need to train workforce for ecological thinning
Can improve forest health, cheap fuel source, provides long term employment
3. Forest product processing waste
Sawdust, shavings, hog fuel
Overcutting diminishes ecosystem services
Co-gen pyrolysis or gasification, feedstock for pellet or briquettes
Biochar, process heat, electricity, home heat
Commercial, home garden
Supply dependent on economic growth and housing starts, resource is already fully utilized
Competition for resource
Already in widespread use
4. Biomass Plantation
Trees, grass, hemp, kudzu
Could displace native ecosystems & people, water use, monoculture problems, GM species
Co-gen pyrolysis or gasification, feedstock for pellets or briquettes
Biochar, process heat, electricity, home heat
Plantation soils, commercial fertilizer, home garden
Large capital investment & pressure to adopt unsustainable practices
Need to strengthen land tenure rights of poor people
Could be used for afforestation of degraded land
5. Urban Forestry and landscaping
Thinning, slash, logging slash, weeds, grass, clippings
Co-gen pyrolysis or gasification, feedstock for pellets or briquettes
Biochar, process heat, electricity, home heat
Commercial fertilizer, home garden
New capital investment
Nee to train workforce force for ecological thinning
Avoids disposal cost
6. Ag Waste – Industrial
Straw, cobs, orchard trimmings
Need to leave some decomposing organic matter in soil
Mobile pyrolysis, co-gen, pyrolysis or gasification, feedstock for pellets or briquettes
Biochar, process heat, electricity, home heat
Farm soils, commercial fertilizer, home garden
New capital investment
Avoids disposal cost
7. Ag Waste Subsistence
Straw, cons, orchard, trimmings, kernels, peels, hulls, pulp, offal
Need to leave some decomposing organic material in soil
Stoves, kilns feedstock for briquettes
Biochar, process heat, home heat and cooking
Farm soils New capital investment
Avoids disposal cost
8.- Municipal Solid Waste
Trash, paper
Pollution, losing resource that could be recycles
Co-gen pyrolysis or gasification
Biochar, process heat,, electricity
Suitable for use as carbon sink only
Supply depends on economic growth, consumption
Avoids disposal cost
18
In a recent article (Whitfield, 2012), Whitfield a pioneer in the US commercialization of wood
pellet stoves in the 1980s, discusses how knowledge from the pellet industry can help develop
the biochar industry. He notes that wood pellet stoves were successfully commercialized because
of two primary factors: the existence of companies looking for contracts to commercialize wood
pellets, and public pressure to reduce emissions from woodstoves (which resulted in legislation
in Oregon and Washington to limit wood burning).
Whitfield noted that although environmental concerns spurred the invention of wood pellet
stoves, the advantages of the wood pellet stoves over other forms of heat heating was the major
reason for the market success of this technology. Pellet stoves used a consistent high energy fuel
that could be delivered in clean 40 pound sacks. The stoves could be thermostatically controlled,
self- ignited and only required one load a day. These conditions triggered the investment of $500
million in the construction of 85 pellet mills across North-America and the commercialization of
200,000 pellet stoves (Whitfield, 2012).
The newly forming biochar industry is similar in development to the wood pellet industry of the
early 1980s. Whitfield notes that while wood pellets were developed for heating use only,
biochar has multiple uses across a broad range of settings. He strongly cautioned that while the
multi-dimensional nature and diversity of markets for the biochar industry could eventually
increase the market scope and decrease risk when competing for well-established markets
(agriculture and energy), it could also blur focus at the initial stages when small but profitable
specialty markets (at vineyards, nurseries, greenhouses and small organic farms) are developing.
Whitfield strongly recommends focusing on and serving well these markets initially. He
recommends demonstrating increased plant yields for growers and developing “designer”
biochar for targeted these applications. Also critical are the development and implementation of
industrial standards like the ones recently proposed by IBI (2012). Whitfield also noted that the
“pyrolysis reactor” used should be easy to operate, produce good quality biochar at low cost
from a wide range of feedstocks, meet current air emission standards and produce heat from the
pyrolysis vapors that can be used either to dry the biomass or to satisfy a local need for heat or
electricity. He noted that compared to the 1980s, marketing biochar should be easier and quicker
than wood pellets. He anticipates that the biochar industry could grow well beyond the current
wood pellet business in scope and scale.
Baranick et al. (2011) conducted a feasibility study as part of a Seattle University MBA
Sustainable Business Practicum researching the environmental, social, and economic value of a
biochar business converting slash piles from forest management activities in the Methow Valley
of North Central Washington (Okanogan National Forest) into biochar to be marketed solely as a
soil amendment . The client charged them to explore the possibilities of creating a truly
sustainable business combining environmentally, socially and financially sound strategies
(Baranick et al. 2011). The authors focused their analysis on two business models (the supply
business model which produces more biochar than the potential market in the region and a
business model from the demand side) and concluded that lack of consumer demand is the main
hurdle in deploying their business models. Like Whitfield, Baranick’s team also recommended
that their costumers implement a small operation to produce biochar that will be tested in
targeted local applications and to conduct market studies with the results obtained.
19
Baranick et al. (2011) identified five major challenges facing the biochar industry: 1) high start
up costs compared with the competing composting sector, 2) lack of consensus on biochar
benefits, 3) difficulty educating potential consumers on the benefits of the product (because
limited production makes it very difficult to test biochar properties at commercial scale), 4) over
competition for feedstock resources, and 5) high costs associated with long distance distribution
of biochar. In the opinion of the authors the major challenge facing the industry is the fact that
“not all biochars are equal.” Biochar characteristics and responses differ based on feedstock
used, process employed, and production parameters. This represents a major hurdle to
extrapolate results from one location to another. The development of general production and uses
rules is critical to the success of this industry.
Baranick et al. (2011) noted that the biochar industry is in the market introduction stage and that
during this phase costs tend to be high and sales volume low with poor competition and low
demand. Along the recommendations of Whitfield, Baranick et al. (2011) argue that under
existing conditions “demand must be created, which require educating the potential consumer
base to try the product and then working to retain them as a customer.” One producer in the U.S.
actually gave biochar to potential customers for free. Once they were convinced that the product
was effective, they were back for more and formed a loyal and solid customer base. Importantly,
they spread the word among their fellow gardeners and agriculture operations. That commercial
biochar business is now growing briskly. Baranick et al. (2011) recommend building small
production units first and then consider the “growth stage” in which production costs will
decrease together with prices to maintain competitive advantage. Realistically, competition in
current biochar markets is extremely limited as there are very few producers. Until very recently,
even obtaining biochar for research has been extremely difficult. More research must be done to
convince end users (the market) of the benefits of biochar use but practical demonstrations are
often more convincing than theoretical research.
The development of regulations for biochar will certainly accelerate its market acceptability
however it will also raise costs and place a significant burden on producers already struggling to
make their business economically viable. Biochar supporters recommend that first voluntary
compliance with characterization and testing be encouraged, evolving to more mandatory
standards as the industry and the market mature. The European Union, with a consumer public
and industry much more tolerant of tighter controls, is currently moving towards development of
mandatory standards. In this regard the characterization standards developed by IBI should be
commended for both the methodology employed in creating the standards and in their
recommendations for implementation (IBI, 2012). Some of the biochar produced could be further
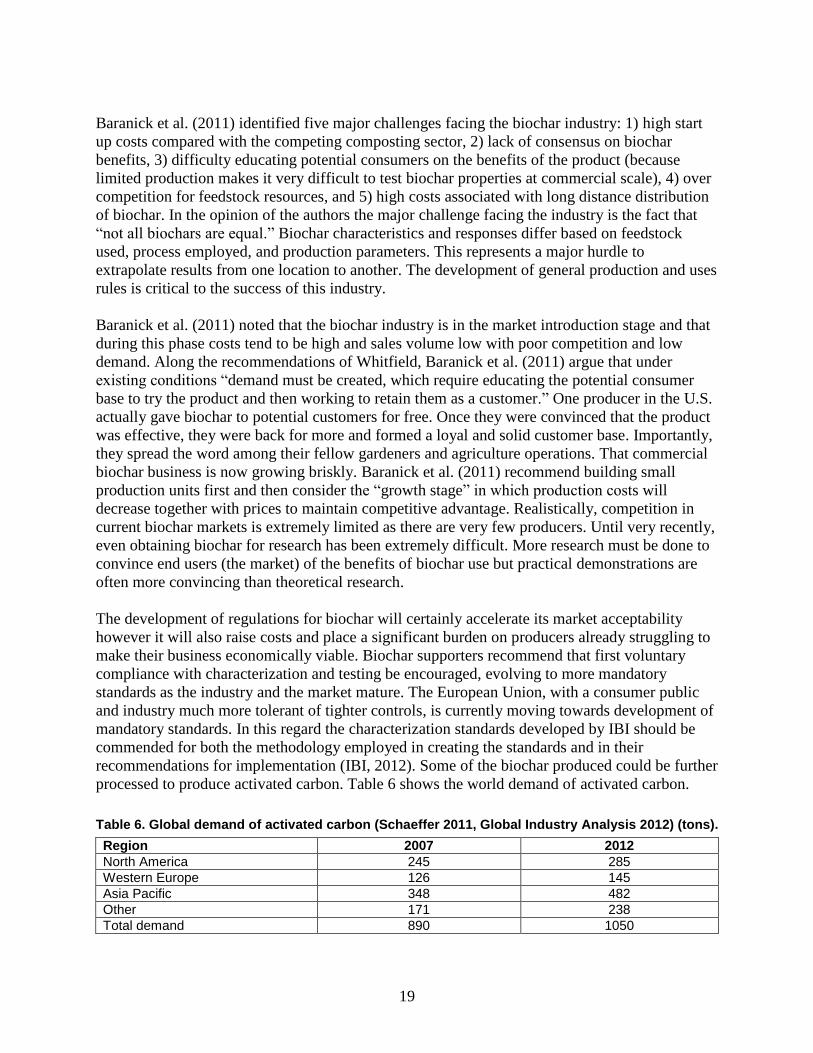
processed to produce activated carbon. Table 6 shows the world demand of activated carbon.
Table 6. Global demand of activated carbon (Schaeffer 2011, Global Industry Analysis 2012) (tons).
Region 2007 2012
North America 245 285
Western Europe 126 145
Asia Pacific 348 482
Other 171 238
Total demand 890 1050
20
In 2012 the demand for activated carbon was only 1,150 tons, mostly in the Asia Pacific region.
The activated carbon market is forecast to reach 2.3 million tons in 2017 mostly due to more
stringent regulations to remove mercury at coal power plants, air purification, water treatment,
food and beverage processing, air purification, automotive emission canister, solvent vapor
recovery and medical-pharmaceutical applications (Global Industry Analysis 2012)
(http://www.researchandmarkets.com/reportinfo.asp?report_id=450634&t=e). Some of the main
companies commercializing activated carbon are:
CECA Specialty Chemicals (France)
(http://www.cecachemicals.com/sites/ceca/en/business/activated_carbons/home.page),
Calgon Carbon Corp (USA)
(http://www.calgoncarbon.com/carbon_products/index.html), Chemiviron Carbon
(Belgium) (http://www.chemvironcarbon.com/en),
Clarimex SA de CV (Mexico) (http://www.clarimex.com/corporativo-i.htm),
Haycarb Ltd (Sir Lanka) (http://www.haycarb.com/),
Kurarat Chemical Co Ltd (Japan) (http://www.kuraraychemical.com/index.shtml),
MeadWestvapo Corp (USA)
(http://www.meadwestvaco.com/SpecialtyChemicals/ActivatedCarbon/index.htm),
NORIT Americas, Inc (USA) (http://www.norit.com/),
Osaka Gas Chemicals Co., Ltd (Japan) (http://www.ogc.co.jp/e/products/e-
purification/index.html),
Jacobi The carbon company (http://www.jacobi.net/index.php?/site),
TIGG Corporation (USA)
(http://www.tigg.com/?utm_source=bing&utm_medium=ppc&utm_campaign=
activatedcarbon1), and
General Carbon Corporation (USA) (http://www.generalcarbon.net/).
These well-established industries could be excellent markets for biochar or could serve as
models for the production of engineered biochar for environmental applications.
US industrial facilities (i.e. clinker cement plants and coal fired plants) are likely to drive the
need for additional activated carbon for mercury control. Another application that is likely to
grow is in carbon clothing to protect the military against radiological, biological and chemical
weapons. US demand is expected to grow an annual average of 13% in the long term due to new
environmental standards
(http://www.prweb.com/releases/activated_carbon/water_treatment/prweb8286149.htm,
retrieved February 4, 2013)
. The development of engineered biochar for environmental applications is critical for the future
of the industry Global Industry Analysis 2012
(http://www.researchandmarkets.com/reports/450634/activated_carbon_global_strategic_busines
s#description, retrieved February 4, 2013).
21
2.2 Heat recovery and bio-oil combustion
A major weakness of most business models for biochar production is that they disregard the use
of the energy produced from pyrolysis vapors. The revenue resulting from commercialization of
the heat or electricity derived from pyrolysis vapors is critical for the success of biochar
businesses. However, very little information is found in the literature on business models to
utilize pyrolysis vapors.
Pyrolysis vapors can be condensed to produce bio-oils. Bio-oil combustion tests have been
ongoing ever since the development of pyrolysis technologies. Many combustion tests at
atmospheric pressure in flame tunnels and boilers have been reported in the literature at
Massachusetts Institute of Technology (MIT) (Shihadeh et al. 1994), Canada Centre for Mineral
and Energy Technology (CANMET) (Bank et al. 1992, Lee 1993), ENEL (Barbucci et al. 1995,
Rossi et al. 1993), Colorado Oil and Gas Information System (COGIS) (Salvi et al. 1991), Red
Arrow (Freel et al. 1990, Freel and Huffman 1994), Neste Oy (Gust 1994, 1995, 1996, 1997),
Technical Research Centre of Finland (Oasmaa 2001), and International Flame Research
Foundation (IFRF) (van de Kamp and Smart 1991, 1993).
One of the advantages of the conversion of biomass into liquid fuels is the possibility of using
these fuels for highly efficient engines such gas turbines with efficiencies around 28% (Andrews
et al. 1996, 1997) and diesel engines with efficiencies close to 45% (Gross 1995, Jay et al. 1995,
Leech 1997, Ormrod and Webster 2000). Nevertheless, several limitations must be overcome
prior to using crude bio-oils as fuels in gas turbines and diesel engines. The residence time in the
combustion chamber of gas turbines is much smaller than for boilers and the ash content and
alkalinity must be strictly controlled.
Currently, bio-oil is primarily used as a substitute for heavy fuels used for creating heat typically
for industrial applications. Bio-oil, like bunker fuel, requires preheating or atomization prior to
combustion, and therefore is limited in use. Because its heating power is less than half of that of
petroleum-based fuel oil and has a much higher moisture content, twice as much bio-oil is
needed to reach and maintain desired temperatures.
Bio-oil production is maximized when temperatures are higher than necessary for creating
biochar (450-600° C) and can be a desirable by-product of pyrolysis. However, some producers
find that the acidity of the oil and the viscosity make it problematic for equipment maintenance
and use when trying to produce marketable quantities of biochar simultaneously. Several
companies in Canada and the U.S. focus on bio-oil as their primary product.
As discussed in the following section, bio-oil requires energy intensive refining to move it from a
bunker oil equivalent to a finer fuel usable in a broader range of engines. Energy return on
energy invested is a hurdle for the commercialization of a finer grade of bio-oil.
The increased efficiency of gas turbines and diesel engines has been the main drive for bio-oil
tests performed since the 1990s [Orenda Aerospace corporation (Andrews et al. 1996, 1997),
Wartsila (Gross 1995, Jay et al. 1995), Ormrod Diesels (Leech 1997, Ormrod and Webster
2000), VTT energy (Jay et al. 1995, Solantausta et al. 1993, 1994), University of Rostock
22
(Strenziok et al. 2001), University of Kansas (Suppes et al. 1996), MIT (Shihadeh and Hochgreb
2000), Pasuali Macchine agricole (Baglioni et al. 2001), Institute Motori (Frigo et al. 1998,
Bertoli et al. 2000), University of Florence (Chiaramonti et al. 2003), Universidad Politecnica de
Madrid (Lopez Juste and Salva Monfort 2000)]. Reviews on the challenges of using bio-oils as
fuels can be found elsewhere (Czernik and Bridgewater 2004, Chiaramonti et al. 2007). The lack
of bio-oil specifications and commercial engines able to operate with these oils is the main
hurdle to implementing this business model.
2.3 Bio-oil refining
Although several bio-oil refinery concepts are under study at the laboratory level (see third
report: http://www.ecy.wa.gov/biblio/1207034.html, section 5.4.2 ) to produce fuel and
chemicals from bio-oils, only the bio-oil hydrotreatment and bio-oil gasification concepts are
currently being evaluated at pilot and demonstration scales (Yu and Wu 2010). The lack of
technologies at the commercialization stage to produce a stabilized bio-oil compatible with the
existing petroleum refineries or large bio-oil gasification plants are the main hurdle in
developing a biomass economy based on pyrolysis. Several options for producing green gasoline
and green diesel (drop-in fuels) via two step bio-oil hydrotreatment are shown in Figure 4. The
wastewater stream shown in Figure 4B is the water produced as the result of the hydrotreatment
(reaction between the oxygen and the hydrogen). Until bio-oil refineries are deployed at the
commercial stage, business models based on the condensation of pyrolysis vapors will only
succeed if they are able to develop one or two high-value products from bio-oil. This was the
case with Ensyn which started with the production of food ingredients and specialty chemicals
and is now working with Universal Oil Products (UOP) to build a bio-oil refinery based on bio-
oil hydrotreatment (http://www.ensyn.com/about-ensyn/overview/).
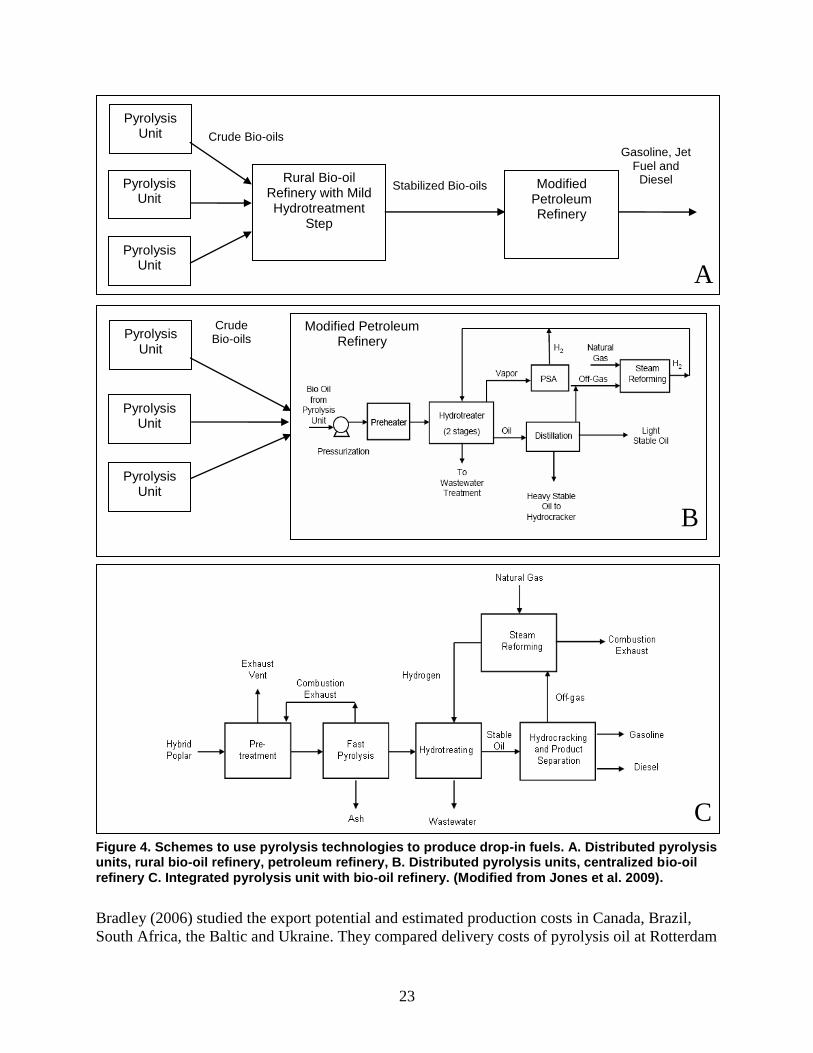
23
Figure 4. Schemes to use pyrolysis technologies to produce drop-in fuels. A. Distributed pyrolysis units, rural bio-oil refinery, petroleum refinery, B. Distributed pyrolysis units, centralized bio-oil refinery C. Integrated pyrolysis unit with bio-oil refinery. (Modified from Jones et al. 2009).
Bradley (2006) studied the export potential and estimated production costs in Canada, Brazil,
South Africa, the Baltic and Ukraine. They compared delivery costs of pyrolysis oil at Rotterdam
Pyrolysis Unit
Pyrolysis Unit
Pyrolysis Unit
Rural Bio-oil Refinery with Mild Hydrotreatment
Step
Modified Petroleum Refinery
Crude Bio-oils
Stabilized Bio-oils
Gasoline, Jet Fuel and
Diesel
Pyrolysis Unit
Pyrolysis Unit
Pyrolysis Unit
Crude Bio-oils
Modified Petroleum Refinery
B
C
A
24
with the prices of competitive fossil fuels as well as potential markets in The Netherlands,
Germany, Belgium, United Kingdom, Finland, Sweden and Denmark.
Prospective entrepreneurs wanting to combine biochar and bio-oil production are recommended
to start on a relatively small scale addressing niche market need. Somewhere between 50 and 80
tons of wood per day would be required by a practical small enterprise (to produce 10 to 20 tons
of biochar per day). Biochar can be sold to the final customers or it can be sold in bulk to a
wholesaler (Simmons 1957). The success of the enterprise depends on obtaining a sufficient
average price from a few different types of outlets (Simmons 1957). As a typical business
development process, when small companies emerge and are successful they grow to take
advantage of the size scale. This company expansion also depends on the biomass availability
near the plant. Development of bio-oil, biochar, and high-value products should address local
needs.
2.4. Building a business model
Business models must be developed in accordance with the type of pyrolysis unit selected.
Granatstein et al. (2009) evaluated the feasibility of designing pyrolysis units to target specific
applications. They classified pyrolysis units into mobile, transportable, relocatable and stationary
units (Table 7).
Perhaps the main limitation of the models that have been proposed so far is that most of them
consider that the pyrolysis unit will utilize waste materials. While there are many facility
locations where municipal solid waste woody materials are collected (see Biomass supply chain
section 4.1), agricultural or forest operations are broadly spread and biomass may not be
collected even to a local point. The business model for dispersed biomass may require complex
supply chains, roads, auxiliary systems and most importantly, the blessing of the communities
where the units will be built. Unfortunately, all the financial studies found in the literature are
based on a centralized location business model, lending a potential advantage for collected
biomass. A promising alternative is the integration of pyrolysis units and/or bio-oil refineries into
existing biomass processing industries (example: msw wood waste collection, and agricultural
sugarcane, nut, and palm oil mills and log saw, and pulp and paper mills). These business models
are likely to be more successful because the waste biomass generated by current businesses is
already concentrated in a single location, the heat and/or energy produced can displace the use of
external fossil fuel-based energy sources. These new units can take advantage of existing
infrastructure. These factors all contribute to reduced capital and operational costs as well as
higher and faster return on investment.
Some of these units using industrial wastes could later expand to process waste biomass
available in the region. Furthermore, the pyrolysis component of the industry can take advantage
of highly trained on-site managers, and technical and operations staff thereby reducing
operational costs. The integration of pyrolysis units as part of the shift of existing biomass
conversion industries into biochar production and bio-refineries is an exciting area of research
with great potential.
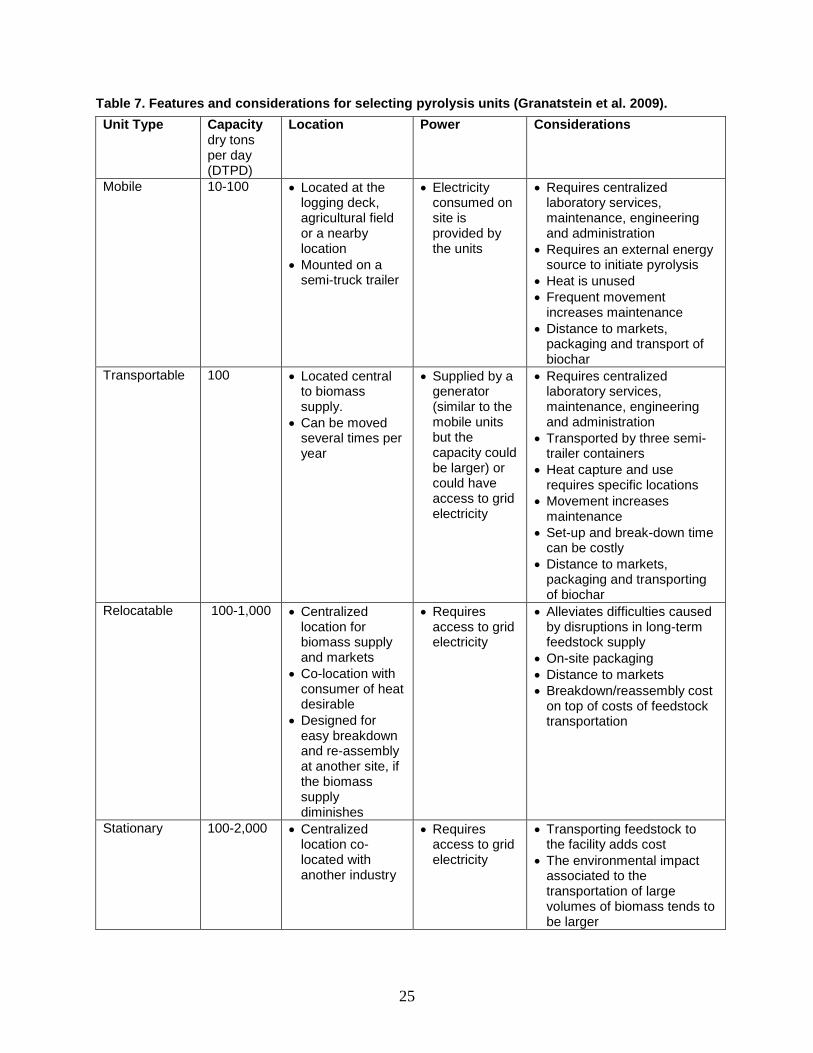
25
Table 7. Features and considerations for selecting pyrolysis units (Granatstein et al. 2009).
Unit Type Capacity dry tons per day (DTPD)
Location Power Considerations
Mobile 10-100
Located at the logging deck, agricultural field or a nearby location
Mounted on a semi-truck trailer
Electricity consumed on site is provided by the units
Requires centralized laboratory services, maintenance, engineering and administration
Requires an external energy source to initiate pyrolysis
Heat is unused
Frequent movement increases maintenance
Distance to markets, packaging and transport of biochar
Transportable 100 Located central to biomass supply.
Can be moved several times per year
Supplied by a generator (similar to the mobile units but the capacity could be larger) or could have access to grid electricity
Requires centralized laboratory services, maintenance, engineering and administration
Transported by three semi-trailer containers
Heat capture and use requires specific locations
Movement increases maintenance
Set-up and break-down time can be costly
Distance to markets, packaging and transporting of biochar
Relocatable 100-1,000 Centralized location for biomass supply and markets
Co-location with consumer of heat desirable
Designed for easy breakdown and re-assembly at another site, if the biomass supply diminishes
Requires access to grid electricity
Alleviates difficulties caused by disruptions in long-term feedstock supply
On-site packaging
Distance to markets
Breakdown/reassembly cost on top of costs of feedstock transportation
Stationary 100-2,000 Centralized location co-located with another industry
Requires access to grid electricity
Transporting feedstock to the facility adds cost
The environmental impact associated to the transportation of large volumes of biomass tends to be larger
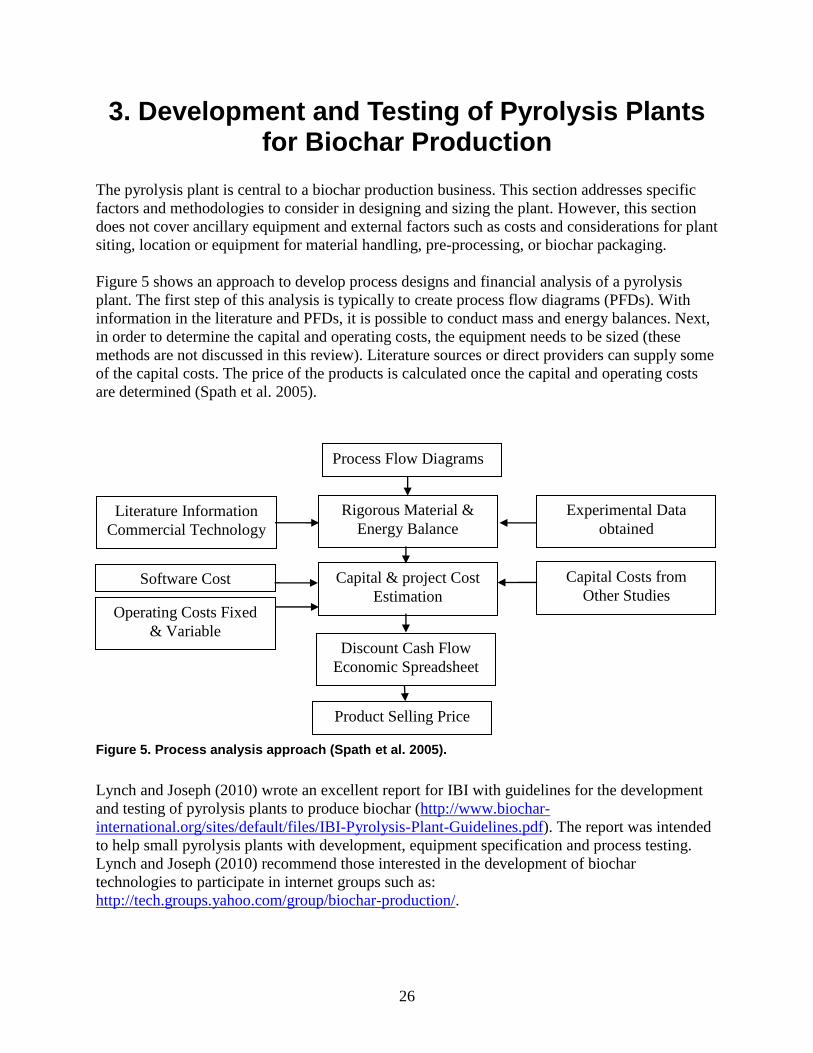
26
3. Development and Testing of Pyrolysis Plants for Biochar Production
The pyrolysis plant is central to a biochar production business. This section addresses specific
factors and methodologies to consider in designing and sizing the plant. However, this section
does not cover ancillary equipment and external factors such as costs and considerations for plant
siting, location or equipment for material handling, pre-processing, or biochar packaging.
Figure 5 shows an approach to develop process designs and financial analysis of a pyrolysis
plant. The first step of this analysis is typically to create process flow diagrams (PFDs). With
information in the literature and PFDs, it is possible to conduct mass and energy balances. Next,
in order to determine the capital and operating costs, the equipment needs to be sized (these
methods are not discussed in this review). Literature sources or direct providers can supply some
of the capital costs. The price of the products is calculated once the capital and operating costs
are determined (Spath et al. 2005).
Figure 5. Process analysis approach (Spath et al. 2005).
Lynch and Joseph (2010) wrote an excellent report for IBI with guidelines for the development
and testing of pyrolysis plants to produce biochar (http://www.biochar-
international.org/sites/default/files/IBI-Pyrolysis-Plant-Guidelines.pdf). The report was intended
to help small pyrolysis plants with development, equipment specification and process testing.
Lynch and Joseph (2010) recommend those interested in the development of biochar
technologies to participate in internet groups such as:
http://tech.groups.yahoo.com/group/biochar-production/.
Process Flow Diagrams
Rigorous Material &
Energy Balance
Experimental Data
obtained Literature Information
Commercial Technology
Capital & project Cost
Estimation
Capital Costs from
Other Studies Software Cost
Estimation Operating Costs Fixed
& Variable Discount Cash Flow
Economic Spreadsheet
Product Selling Price
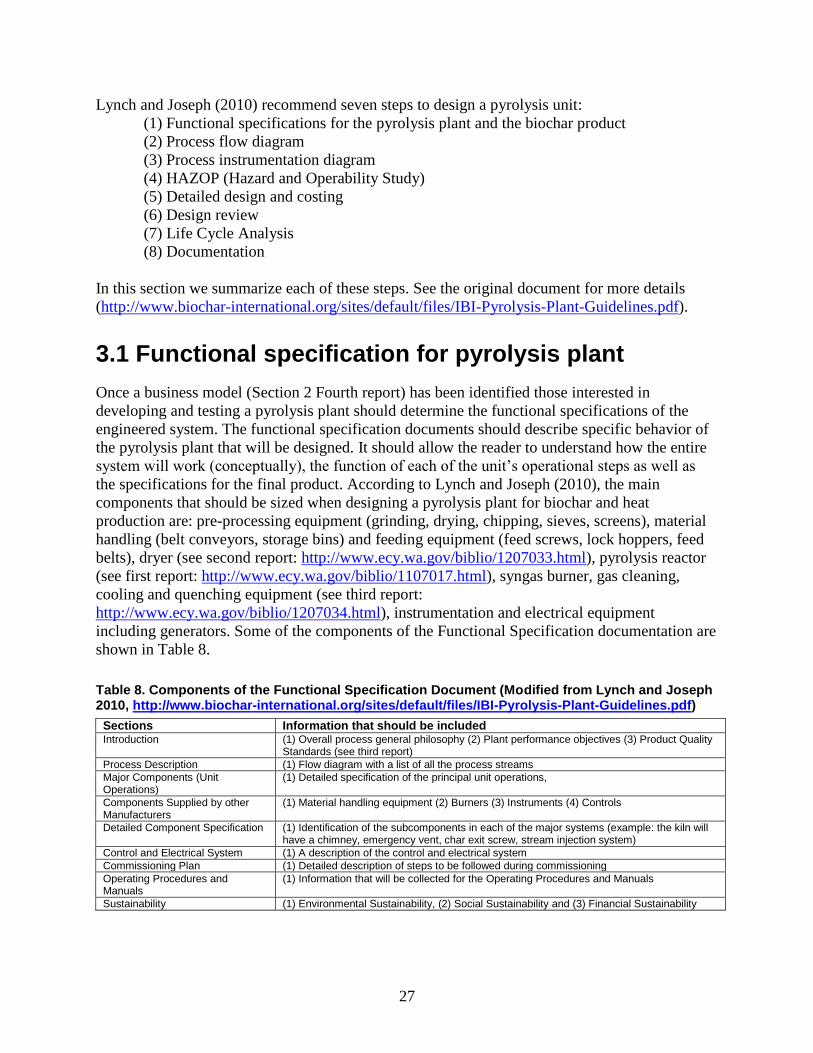
27
Lynch and Joseph (2010) recommend seven steps to design a pyrolysis unit:
(1) Functional specifications for the pyrolysis plant and the biochar product
(2) Process flow diagram
(3) Process instrumentation diagram
(4) HAZOP (Hazard and Operability Study)
(5) Detailed design and costing
(6) Design review
(7) Life Cycle Analysis
(8) Documentation
In this section we summarize each of these steps. See the original document for more details
(http://www.biochar-international.org/sites/default/files/IBI-Pyrolysis-Plant-Guidelines.pdf).
3.1 Functional specification for pyrolysis plant
Once a business model (Section 2 Fourth report) has been identified those interested in
developing and testing a pyrolysis plant should determine the functional specifications of the
engineered system. The functional specification documents should describe specific behavior of
the pyrolysis plant that will be designed. It should allow the reader to understand how the entire
system will work (conceptually), the function of each of the unit’s operational steps as well as
the specifications for the final product. According to Lynch and Joseph (2010), the main
components that should be sized when designing a pyrolysis plant for biochar and heat
production are: pre-processing equipment (grinding, drying, chipping, sieves, screens), material
handling (belt conveyors, storage bins) and feeding equipment (feed screws, lock hoppers, feed
belts), dryer (see second report: http://www.ecy.wa.gov/biblio/1207033.html), pyrolysis reactor
(see first report: http://www.ecy.wa.gov/biblio/1107017.html), syngas burner, gas cleaning,
cooling and quenching equipment (see third report:
http://www.ecy.wa.gov/biblio/1207034.html), instrumentation and electrical equipment
including generators. Some of the components of the Functional Specification documentation are
shown in Table 8.
Table 8. Components of the Functional Specification Document (Modified from Lynch and Joseph 2010, http://www.biochar-international.org/sites/default/files/IBI-Pyrolysis-Plant-Guidelines.pdf)
Sections Information that should be included Introduction (1) Overall process general philosophy (2) Plant performance objectives (3) Product Quality
Standards (see third report)
Process Description (1) Flow diagram with a list of all the process streams
Major Components (Unit Operations)
(1) Detailed specification of the principal unit operations,
Components Supplied by other Manufacturers
(1) Material handling equipment (2) Burners (3) Instruments (4) Controls
Detailed Component Specification (1) Identification of the subcomponents in each of the major systems (example: the kiln will have a chimney, emergency vent, char exit screw, stream injection system)
Control and Electrical System (1) A description of the control and electrical system
Commissioning Plan (1) Detailed description of steps to be followed during commissioning
Operating Procedures and Manuals
(1) Information that will be collected for the Operating Procedures and Manuals
Sustainability (1) Environmental Sustainability, (2) Social Sustainability and (3) Financial Sustainability
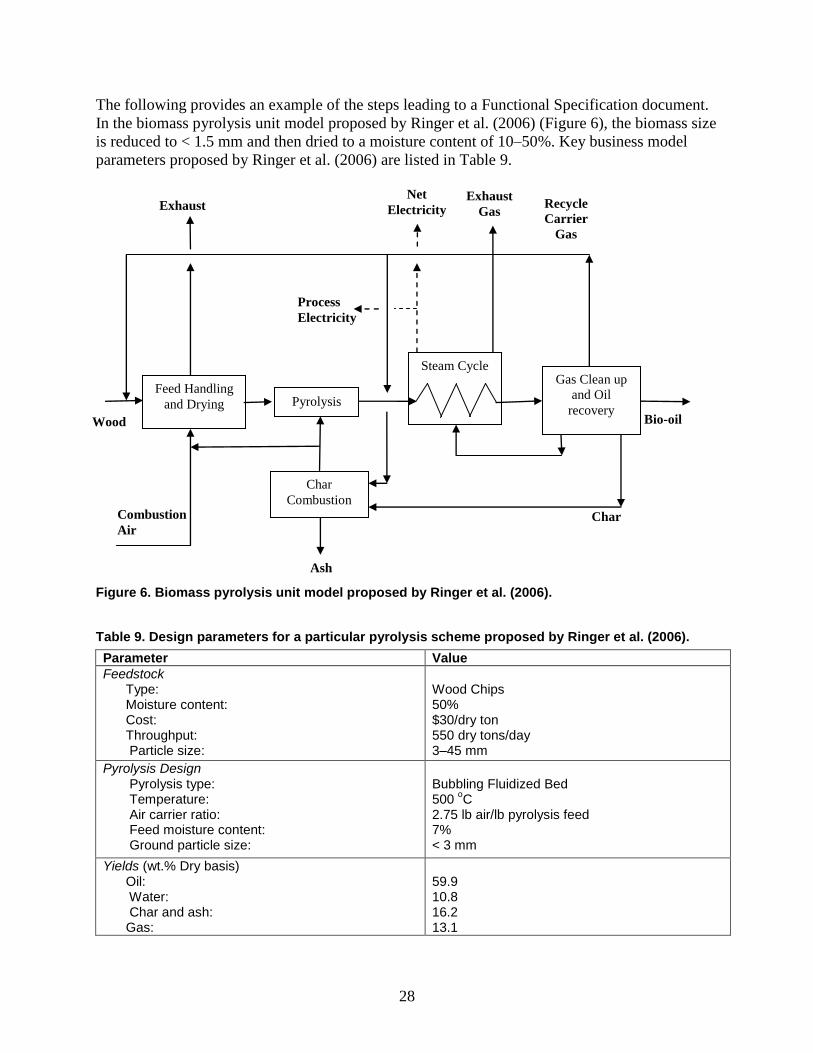
28
The following provides an example of the steps leading to a Functional Specification document.
In the biomass pyrolysis unit model proposed by Ringer et al. (2006) (Figure 6), the biomass size
is reduced to < 1.5 mm and then dried to a moisture content of 10–50%. Key business model
parameters proposed by Ringer et al. (2006) are listed in Table 9.
Figure 6. Biomass pyrolysis unit model proposed by Ringer et al. (2006).
Table 9. Design parameters for a particular pyrolysis scheme proposed by Ringer et al. (2006).
Parameter Value
Feedstock Type: Moisture content: Cost: Throughput: Particle size:
Wood Chips 50% $30/dry ton 550 dry tons/day 3–45 mm
Pyrolysis Design Pyrolysis type: Temperature: Air carrier ratio: Feed moisture content: Ground particle size:
Bubbling Fluidized Bed 500
oC
2.75 lb air/lb pyrolysis feed 7% < 3 mm
Yields (wt.% Dry basis) Oil: Water: Char and ash: Gas:
59.9 10.8 16.2 13.1
Feed Handling
and Drying
Steam Cycle Gas Clean up
and Oil
recovery
Combustion
Air
Pyrolysis
Char
Combustion
Ash
Char
Bio-oil
Recycle
Carrier
Gas
Wood
Exhaust
Process
Electricity
Net
Electricity Exhaust
Gas
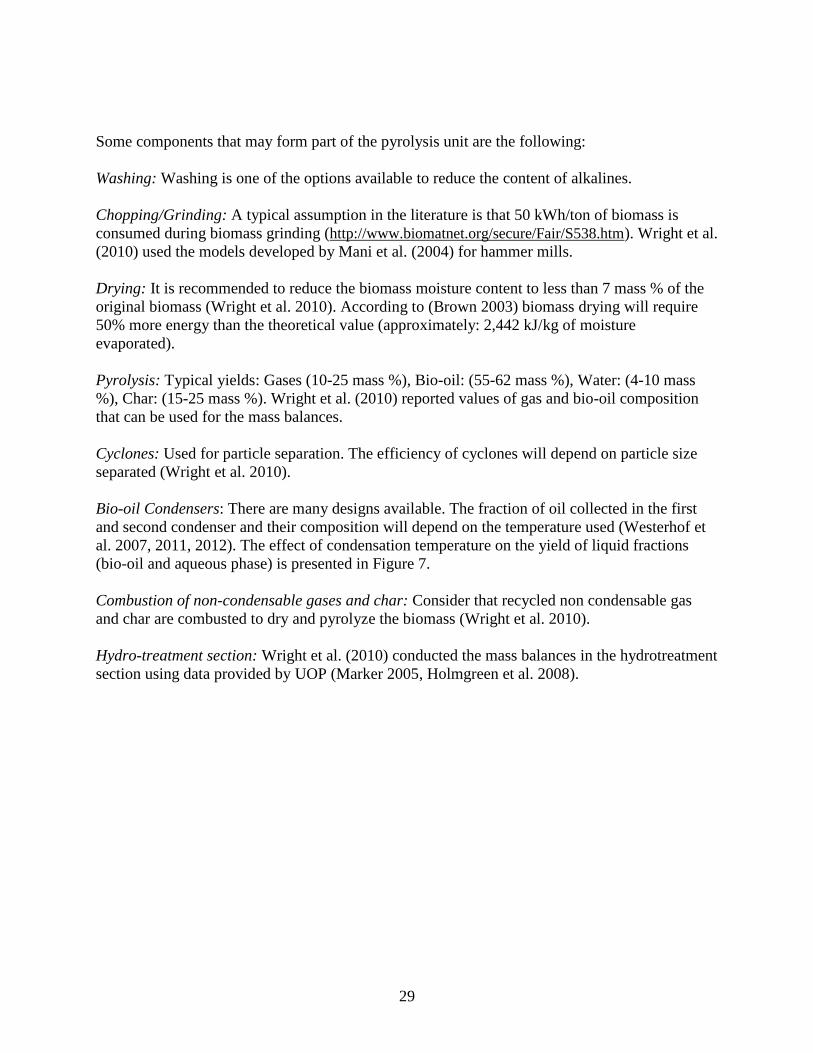
29
Some components that may form part of the pyrolysis unit are the following:
Washing: Washing is one of the options available to reduce the content of alkalines.
Chopping/Grinding: A typical assumption in the literature is that 50 kWh/ton of biomass is
consumed during biomass grinding (http://www.biomatnet.org/secure/Fair/S538.htm). Wright et al.
(2010) used the models developed by Mani et al. (2004) for hammer mills.
Drying: It is recommended to reduce the biomass moisture content to less than 7 mass % of the
original biomass (Wright et al. 2010). According to (Brown 2003) biomass drying will require
50% more energy than the theoretical value (approximately: 2,442 kJ/kg of moisture
evaporated).
Pyrolysis: Typical yields: Gases (10-25 mass %), Bio-oil: (55-62 mass %), Water: (4-10 mass
%), Char: (15-25 mass %). Wright et al. (2010) reported values of gas and bio-oil composition
that can be used for the mass balances.
Cyclones: Used for particle separation. The efficiency of cyclones will depend on particle size
separated (Wright et al. 2010).
Bio-oil Condensers: There are many designs available. The fraction of oil collected in the first
and second condenser and their composition will depend on the temperature used (Westerhof et
al. 2007, 2011, 2012). The effect of condensation temperature on the yield of liquid fractions
(bio-oil and aqueous phase) is presented in Figure 7.
Combustion of non-condensable gases and char: Consider that recycled non condensable gas
and char are combusted to dry and pyrolyze the biomass (Wright et al. 2010).
Hydro-treatment section: Wright et al. (2010) conducted the mass balances in the hydrotreatment
section using data provided by UOP (Marker 2005, Holmgreen et al. 2008).
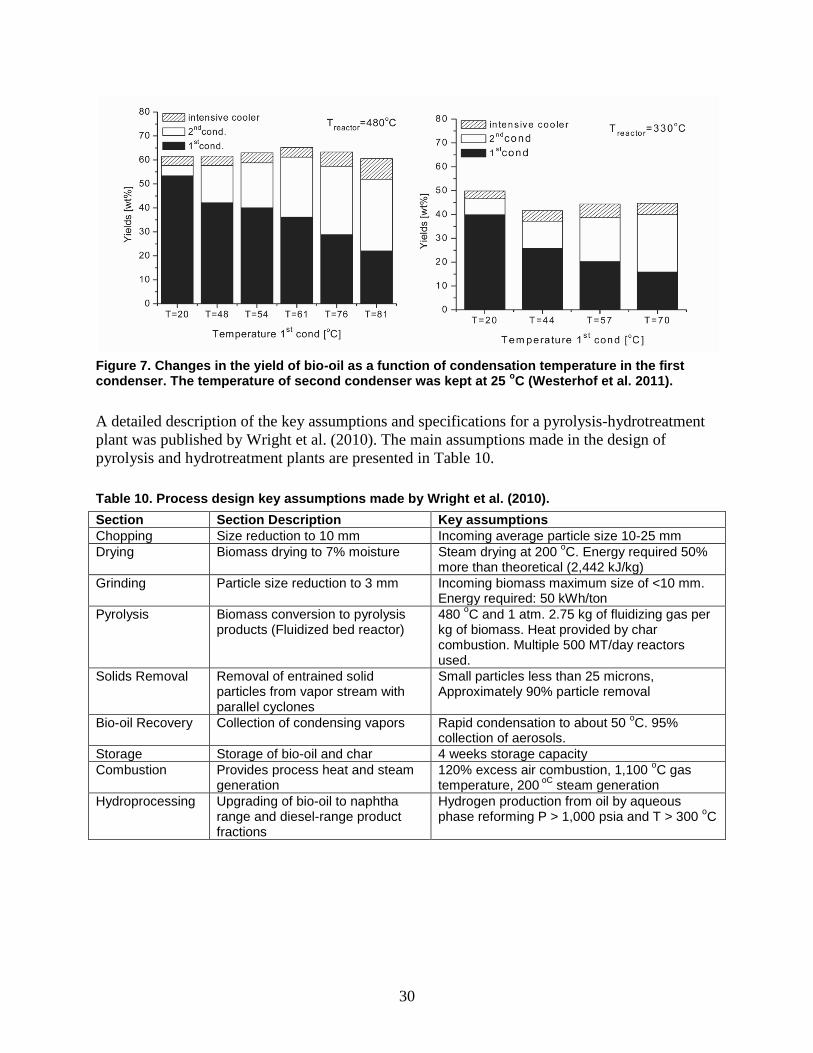
30
Figure 7. Changes in the yield of bio-oil as a function of condensation temperature in the first condenser. The temperature of second condenser was kept at 25
oC (Westerhof et al. 2011).
A detailed description of the key assumptions and specifications for a pyrolysis-hydrotreatment
plant was published by Wright et al. (2010). The main assumptions made in the design of
pyrolysis and hydrotreatment plants are presented in Table 10.
Table 10. Process design key assumptions made by Wright et al. (2010).
Section Section Description Key assumptions
Chopping Size reduction to 10 mm Incoming average particle size 10-25 mm
Drying Biomass drying to 7% moisture Steam drying at 200 oC. Energy required 50%
more than theoretical (2,442 kJ/kg)
Grinding Particle size reduction to 3 mm Incoming biomass maximum size of <10 mm. Energy required: 50 kWh/ton
Pyrolysis Biomass conversion to pyrolysis products (Fluidized bed reactor)
480 oC and 1 atm. 2.75 kg of fluidizing gas per
kg of biomass. Heat provided by char combustion. Multiple 500 MT/day reactors used.
Solids Removal Removal of entrained solid particles from vapor stream with parallel cyclones
Small particles less than 25 microns, Approximately 90% particle removal
Bio-oil Recovery Collection of condensing vapors Rapid condensation to about 50 oC. 95%
collection of aerosols.
Storage Storage of bio-oil and char 4 weeks storage capacity
Combustion Provides process heat and steam generation
120% excess air combustion, 1,100 oC gas
temperature, 200 oC
steam generation
Hydroprocessing Upgrading of bio-oil to naphtha range and diesel-range product fractions
Hydrogen production from oil by aqueous phase reforming P > 1,000 psia and T > 300
oC
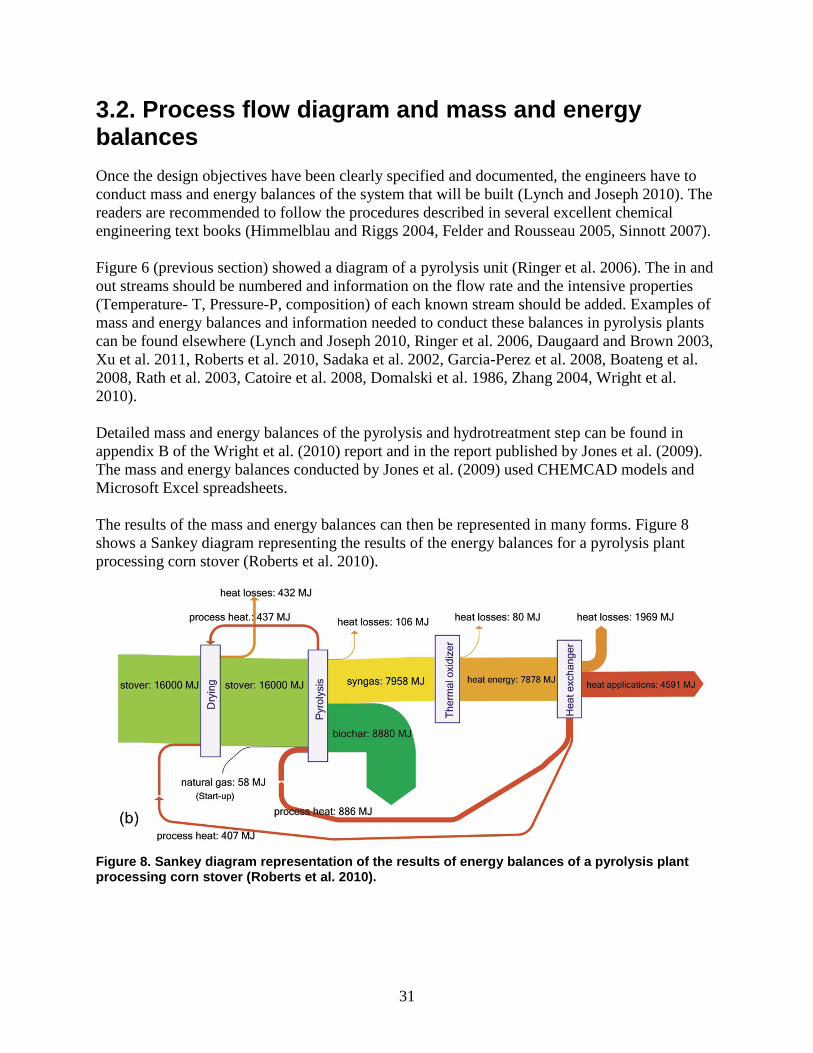
31
3.2. Process flow diagram and mass and energy balances
Once the design objectives have been clearly specified and documented, the engineers have to
conduct mass and energy balances of the system that will be built (Lynch and Joseph 2010). The
readers are recommended to follow the procedures described in several excellent chemical
engineering text books (Himmelblau and Riggs 2004, Felder and Rousseau 2005, Sinnott 2007).
Figure 6 (previous section) showed a diagram of a pyrolysis unit (Ringer et al. 2006). The in and
out streams should be numbered and information on the flow rate and the intensive properties
(Temperature- T, Pressure-P, composition) of each known stream should be added. Examples of
mass and energy balances and information needed to conduct these balances in pyrolysis plants
can be found elsewhere (Lynch and Joseph 2010, Ringer et al. 2006, Daugaard and Brown 2003,
Xu et al. 2011, Roberts et al. 2010, Sadaka et al. 2002, Garcia-Perez et al. 2008, Boateng et al.
2008, Rath et al. 2003, Catoire et al. 2008, Domalski et al. 1986, Zhang 2004, Wright et al.
2010).
Detailed mass and energy balances of the pyrolysis and hydrotreatment step can be found in
appendix B of the Wright et al. (2010) report and in the report published by Jones et al. (2009).
The mass and energy balances conducted by Jones et al. (2009) used CHEMCAD models and
Microsoft Excel spreadsheets.
The results of the mass and energy balances can then be represented in many forms. Figure 8
shows a Sankey diagram representing the results of the energy balances for a pyrolysis plant
processing corn stover (Roberts et al. 2010).
Figure 8. Sankey diagram representation of the results of energy balances of a pyrolysis plant processing corn stover (Roberts et al. 2010).
32
3.3. Process and instrumentation diagram (PID)
Lynch and Joseph (2010) show a detailed process and instrumentation diagram (PID). The
diagram should show that there is enough monitoring and control to ensure that the plant is
operating properly and meeting emission and safety standards (http://www.biochar-
international.org/sites/default/files/IBI-Pyrolysis-Plant-Guidelines.pdf).
3.4. Hazard and operability study methodology (HAZOP)
The first and the third reports in the series of this report cover many of the potential hazards in
carbonization processes (http://www.ecy.wa.gov/ biblio/1107017.html, http://www.ecy.wa.gov
/biblio/1207034.html). According to Lynch and Joseph (2010) the HAZOP should include the
following risks for operator and the public: 1) fire and explosion, 2) particle and gaseous
emissions, 3) gas leakage (particularly CO), and 4) noise pollution. The system should have
pressure relief systems to prevent explosions. Furthermore, pyrolysis system designers should
make sure that equipment meets and preferably exceeds all gaseous and particulate emission
standards as well as noise and odor beyond the site boundary (see third report: http://www.ecy.
wa.gov/biblio/1207034.html). The project should comply with all air, water, and soil quality
directives. Likewise, designers need to ensure that feedstock comes from a sustainable source
and that the use of all feedstocks that will be processed does not have any negative
environmental impact and that the system is able to produce biochar that is tested and suitable for
application in soils.
3.5 Detailed design and costing
A detailed design implies the selection of equipments, pipes, pumps, fans. It should be conducted
by specialized credited engineers (Lynch and Joseph 2010). At this stage designers should also
make sure that construction materials have been appropriately selected to withstand operational
temperature, pressures and the materials used. Information for cost estimation can be found in
section 4 of this report.
3.6 Design review
The review of designs and cost estimates should be conducted by independent experts (Lynch
and Joseph 2010).
3.7 Life cycle analysis
Very few life cycle analyses on biomass pyrolysis are reported in the literature (Hsu 2011). Hsu
(2011) quantified the green house gas (GHG) emissions and net energy value (NEV) for
pyrolysis-derived green gasoline and green diesel produced via hydrotreatment of crude bio-oils.
The Energy Independence and Security Act (EISA) of 2007 set advanced biofuels GHG
33
emissions and NEV requirements compared with petroleum derived fuels in 2005
(http://www.gpo.gov/fdsys/pkg/BILLS-110hr6enr/pdf/BILLS-110hr6enr.pdf). The method
followed was the same used by Hsu et al. (2011) in a previous study for ethanol. While SimaPro
c.7.2 was the main life cycle assessment modeling software used, Econoinvent v. 2.1 was the
source for life cycle inventories for secondary materials and energy of these unit processes. The
impact of GHG emissions was calculated using the 100 year global warming potential for the
gases. GHG emissions for the pyrolysis fuels reference was 0.142 kg CO2 equiv. per km (53%
lower than conventional gasoline). The NEV calculated was 1.12 MJ/km gasoline and 0.93
MJ/km of diesel. These values are higher than the NEV for gasoline of -1.2 MJ per km in 2005
(Hsu 2011). Electricity use accounts for 27% of the net GHG emissions, and fossil-based
hydrogen accounts for 6% of the GHG emissions. The GHG emissions can be lowered if
electricity and hydrogen are produced from biomass instead of from fossil sources (Hsu 2011).
3.8 Documentation
The documentation should be produced for: The Commissioning Manual, Operation and
Maintenance Manual, and the HAZOP (Lynch and Joseph 2010). In the documentation it is
desirable to indicate what level of training is required to operate the plant, how many shifts will
be required and how staff will be trained and certified to operate these units.
34
4. Financial Analyses
A number of technoeconomic analyses on biomass pyrolysis have been published (Rogers and
Brammer 2009, 2012; Bridgewater et al. 2002, Peacock et al. 2006, Farag et al. 2002, Ringer et
al. 2006, Solantausta and Huetair 2000, Badger et al. 2011, Wright et al. 2010, Jones et al. 2009).
Pyrolysis of biomass is still an emergent technology. System investment costs are not easy to
estimate (Kuppens et al. 2010).There is not enough information to do financial analyses with the
frame of reference of the application of the triple top line concept from the design. In this
section, data available in the literature is shown mainly for feedstock cost, and capital and
operating costs. A detailed explanation of assumptions made for pyrolysis technoeconomic
studies can be found in Appendix D at Wright et al. 2010. Please be cautioned that the
information provided corresponds to currently available equipment costs (typically first
generation designs) and that opportunities exist to develop new solutions that will drive down
these costs. Some authors (Wright et al. 2010) used the RAND Corporation analysis, which take
into account risks associated with estimating costs of building a pioneer plant.
4.1 Biomass supply chain
The biomass supply chain must be analyzed in order to estimate the cost of biomass at the gate of
the pyrolysis unit. Negotiating the price of the biomass prior to construction of the plant is highly
recommended. Contracts are typically based on a five year minimum with the option for longer
contracts.
Urban wood waste, forest and agricultural residues can be integrated into a sustainable business
model, thereby avoiding development of monoculture plantations to sustain the biomass/biochar
industry (Flora 2012). Facilities should be designed to co-process organic resources generated in
local communities, farms and forests to reduce costs associated with industrial scale production
and/or collection of biomass and to minimize the carbon footprint associated with transportation
of feedstocks and products. In the case of urban wood waste one is able to take advantage of the
fact that they are already associated in a collection system. Systems should be designed to
significantly reduce greenhouse gas emissions associated with the production of biofuel. Bio-
fuel recovery and carbon sequestration pyrolysis technologies should be carbon neutral or
negative (Flora 2012).
The Department of Ecology Waste 2 Resources (W2R) program has tracked organic materials in
the solid waste stream in Washington since 1992 using facility reports, recycling surveys, and
waste characterization studies. Facilities report the quantity, type, and county of origin of organic
waste materials that are collected for uses such as recycling, composting, other types of waste
diversion, incineration, and landfill disposal. W2R determines the makeup of the disposed wastes
by completing waste composition studies. This information can be used to estimate the available
feedstocks for pyrolysis applications.
Annual Solid Waste Reports and Recycling Survey: Washington’s solid waste rules require
annual reporting from solid waste facilities with permits or conditional exemptions. In addition
to the required reports, voluntary recycling surveys are sent to non-regulated facilities that handle
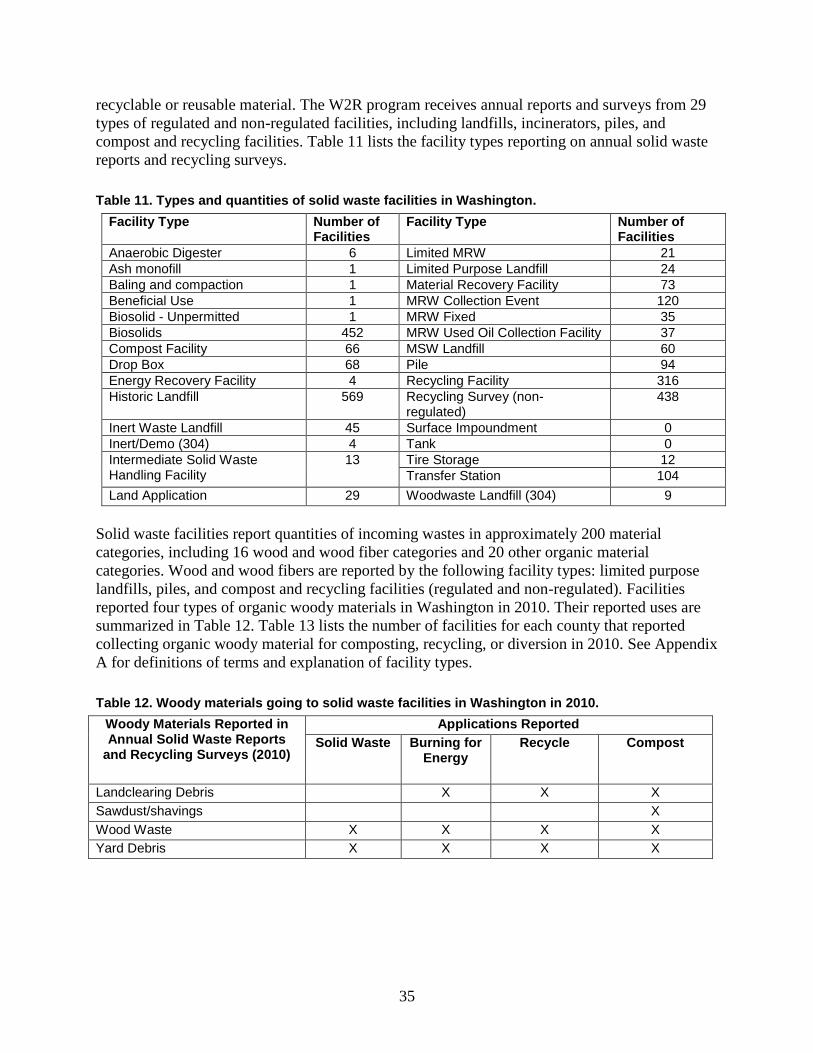
35
recyclable or reusable material. The W2R program receives annual reports and surveys from 29
types of regulated and non-regulated facilities, including landfills, incinerators, piles, and
compost and recycling facilities. Table 11 lists the facility types reporting on annual solid waste
reports and recycling surveys.
Table 11. Types and quantities of solid waste facilities in Washington.
Facility Type Number of Facilities
Facility Type Number of Facilities
Anaerobic Digester 6 Limited MRW 21
Ash monofill 1 Limited Purpose Landfill 24
Baling and compaction 1 Material Recovery Facility 73
Beneficial Use 1 MRW Collection Event 120
Biosolid - Unpermitted 1 MRW Fixed 35
Biosolids 452 MRW Used Oil Collection Facility 37
Compost Facility 66 MSW Landfill 60
Drop Box 68 Pile 94
Energy Recovery Facility 4 Recycling Facility 316
Historic Landfill 569 Recycling Survey (non-regulated)
438
Inert Waste Landfill 45 Surface Impoundment 0
Inert/Demo (304) 4 Tank 0
Intermediate Solid Waste Handling Facility
13
Tire Storage 12
Transfer Station 104
Land Application 29 Woodwaste Landfill (304) 9
Solid waste facilities report quantities of incoming wastes in approximately 200 material
categories, including 16 wood and wood fiber categories and 20 other organic material
categories. Wood and wood fibers are reported by the following facility types: limited purpose
landfills, piles, and compost and recycling facilities (regulated and non-regulated). Facilities
reported four types of organic woody materials in Washington in 2010. Their reported uses are
summarized in Table 12. Table 13 lists the number of facilities for each county that reported
collecting organic woody material for composting, recycling, or diversion in 2010. See Appendix
A for definitions of terms and explanation of facility types.
Table 12. Woody materials going to solid waste facilities in Washington in 2010.
Woody Materials Reported in Annual Solid Waste Reports
and Recycling Surveys (2010)
Applications Reported
Solid Waste Burning for Energy
Recycle Compost
Landclearing Debris X X X
Sawdust/shavings X
Wood Waste X X X X
Yard Debris X X X X
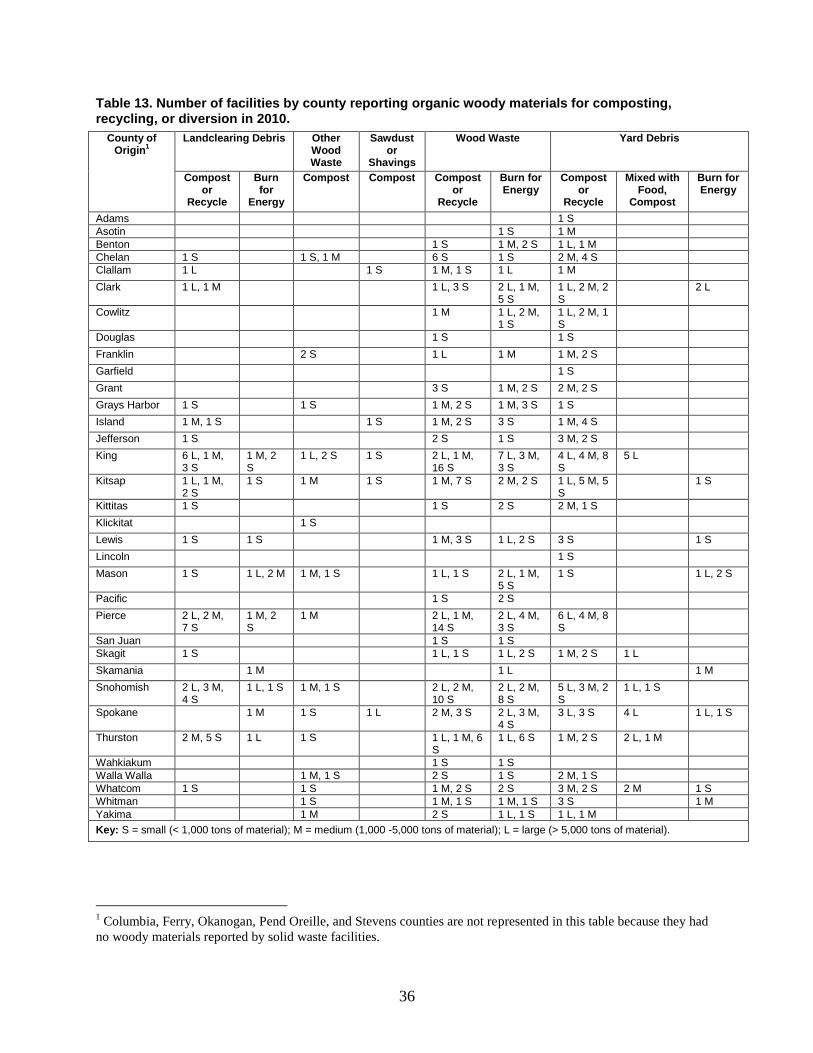
36
Table 13. Number of facilities by county reporting organic woody materials for composting, recycling, or diversion in 2010.
County of Origin
1
Landclearing Debris Other Wood Waste
Sawdust or
Shavings
Wood Waste Yard Debris
Compost or
Recycle
Burn for
Energy
Compost Compost Compost or
Recycle
Burn for Energy
Compost or
Recycle
Mixed with Food,
Compost
Burn for Energy
Adams 1 S
Asotin 1 S 1 M
Benton 1 S 1 M, 2 S 1 L, 1 M
Chelan 1 S 1 S, 1 M 6 S 1 S 2 M, 4 S
Clallam 1 L 1 S 1 M, 1 S 1 L 1 M
Clark 1 L, 1 M 1 L, 3 S 2 L, 1 M, 5 S
1 L, 2 M, 2 S
2 L
Cowlitz 1 M 1 L, 2 M, 1 S
1 L, 2 M, 1 S
Douglas 1 S 1 S
Franklin 2 S 1 L 1 M 1 M, 2 S
Garfield 1 S
Grant 3 S 1 M, 2 S 2 M, 2 S
Grays Harbor 1 S 1 S 1 M, 2 S 1 M, 3 S 1 S
Island 1 M, 1 S 1 S 1 M, 2 S 3 S 1 M, 4 S
Jefferson 1 S 2 S 1 S 3 M, 2 S
King 6 L, 1 M, 3 S
1 M, 2 S
1 L, 2 S 1 S 2 L, 1 M, 16 S
7 L, 3 M, 3 S
4 L, 4 M, 8 S
5 L
Kitsap 1 L, 1 M, 2 S
1 S 1 M 1 S 1 M, 7 S 2 M, 2 S 1 L, 5 M, 5 S
1 S
Kittitas 1 S 1 S 2 S 2 M, 1 S
Klickitat 1 S
Lewis 1 S 1 S 1 M, 3 S 1 L, 2 S 3 S 1 S
Lincoln 1 S
Mason 1 S 1 L, 2 M 1 M, 1 S 1 L, 1 S 2 L, 1 M, 5 S
1 S 1 L, 2 S
Pacific 1 S 2 S
Pierce 2 L, 2 M, 7 S
1 M, 2 S
1 M 2 L, 1 M, 14 S
2 L, 4 M, 3 S
6 L, 4 M, 8 S
San Juan 1 S 1 S
Skagit 1 S 1 L, 1 S 1 L, 2 S 1 M, 2 S 1 L
Skamania 1 M 1 L 1 M
Snohomish 2 L, 3 M, 4 S
1 L, 1 S 1 M, 1 S 2 L, 2 M, 10 S
2 L, 2 M, 8 S
5 L, 3 M, 2 S
1 L, 1 S
Spokane 1 M 1 S 1 L 2 M, 3 S 2 L, 3 M, 4 S
3 L, 3 S 4 L 1 L, 1 S
Thurston 2 M, 5 S 1 L 1 S 1 L, 1 M, 6 S
1 L, 6 S 1 M, 2 S 2 L, 1 M
Wahkiakum 1 S 1 S
Walla Walla 1 M, 1 S 2 S 1 S 2 M, 1 S
Whatcom 1 S 1 S 1 M, 2 S 2 S 3 M, 2 S 2 M 1 S
Whitman 1 S 1 M, 1 S 1 M, 1 S 3 S 1 M
Yakima 1 M 2 S 1 L, 1 S 1 L, 1 M
Key: S = small (< 1,000 tons of material); M = medium (1,000 -5,000 tons of material); L = large (> 5,000 tons of material).
1 Columbia, Ferry, Okanogan, Pend Oreille, and Stevens counties are not represented in this table because they had
no woody materials reported by solid waste facilities.
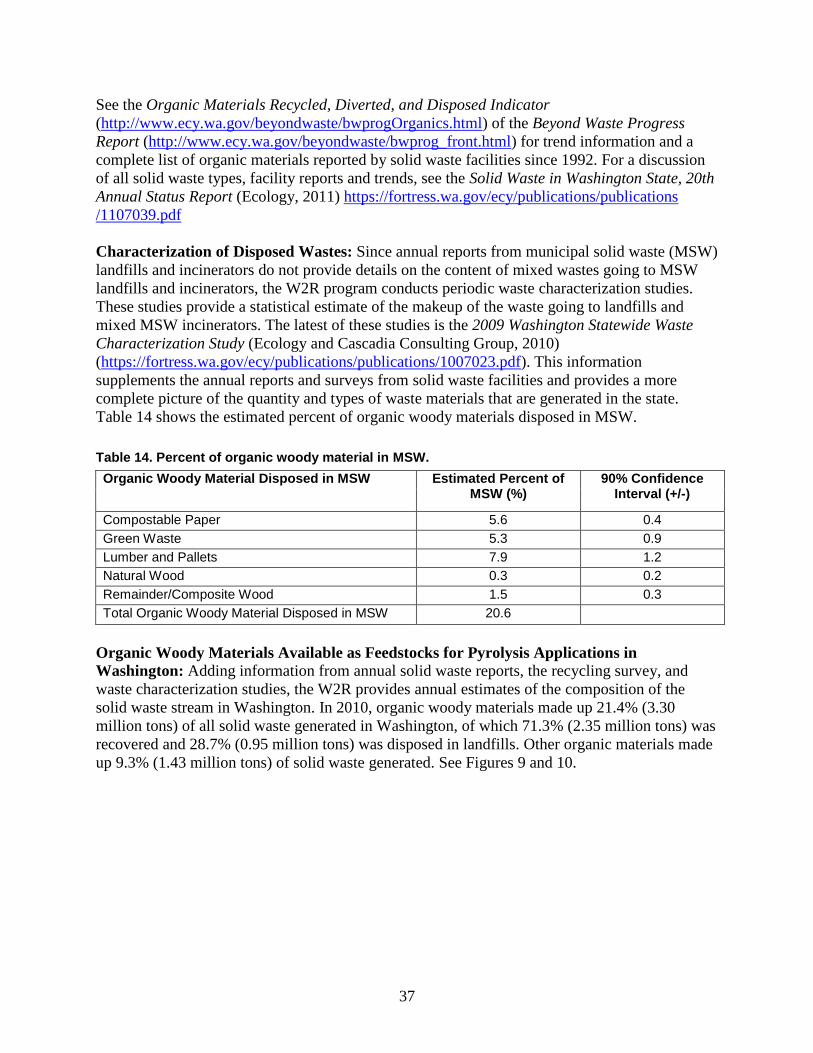
37
See the Organic Materials Recycled, Diverted, and Disposed Indicator
(http://www.ecy.wa.gov/beyondwaste/bwprogOrganics.html) of the Beyond Waste Progress
Report (http://www.ecy.wa.gov/beyondwaste/bwprog_front.html) for trend information and a
complete list of organic materials reported by solid waste facilities since 1992. For a discussion
of all solid waste types, facility reports and trends, see the Solid Waste in Washington State, 20th
Annual Status Report (Ecology, 2011) https://fortress.wa.gov/ecy/publications/publications
/1107039.pdf
Characterization of Disposed Wastes: Since annual reports from municipal solid waste (MSW)
landfills and incinerators do not provide details on the content of mixed wastes going to MSW
landfills and incinerators, the W2R program conducts periodic waste characterization studies.
These studies provide a statistical estimate of the makeup of the waste going to landfills and
mixed MSW incinerators. The latest of these studies is the 2009 Washington Statewide Waste
Characterization Study (Ecology and Cascadia Consulting Group, 2010)
(https://fortress.wa.gov/ecy/publications/publications/1007023.pdf). This information
supplements the annual reports and surveys from solid waste facilities and provides a more
complete picture of the quantity and types of waste materials that are generated in the state.
Table 14 shows the estimated percent of organic woody materials disposed in MSW.
Table 14. Percent of organic woody material in MSW.
Organic Woody Material Disposed in MSW Estimated Percent of MSW (%)
90% Confidence Interval (+/-)
Compostable Paper 5.6 0.4
Green Waste 5.3 0.9
Lumber and Pallets 7.9 1.2
Natural Wood 0.3 0.2
Remainder/Composite Wood 1.5 0.3
Total Organic Woody Material Disposed in MSW 20.6
Organic Woody Materials Available as Feedstocks for Pyrolysis Applications in
Washington: Adding information from annual solid waste reports, the recycling survey, and
waste characterization studies, the W2R provides annual estimates of the composition of the
solid waste stream in Washington. In 2010, organic woody materials made up 21.4% (3.30
million tons) of all solid waste generated in Washington, of which 71.3% (2.35 million tons) was
recovered and 28.7% (0.95 million tons) was disposed in landfills. Other organic materials made
up 9.3% (1.43 million tons) of solid waste generated. See Figures 9 and 10.
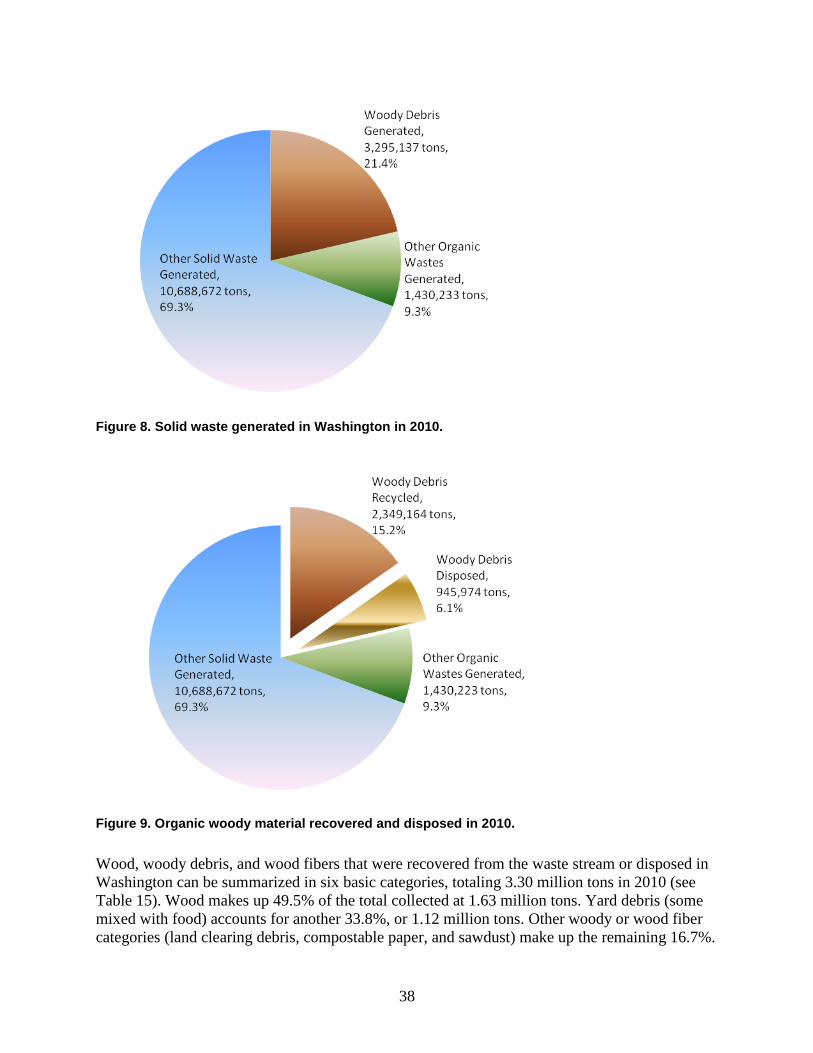
38
Figure 8. Solid waste generated in Washington in 2010.
Figure 9. Organic woody material recovered and disposed in 2010.
Wood, woody debris, and wood fibers that were recovered from the waste stream or disposed in
Washington can be summarized in six basic categories, totaling 3.30 million tons in 2010 (see
Table 15). Wood makes up 49.5% of the total collected at 1.63 million tons. Yard debris (some
mixed with food) accounts for another 33.8%, or 1.12 million tons. Other woody or wood fiber
categories (land clearing debris, compostable paper, and sawdust) make up the remaining 16.7%.
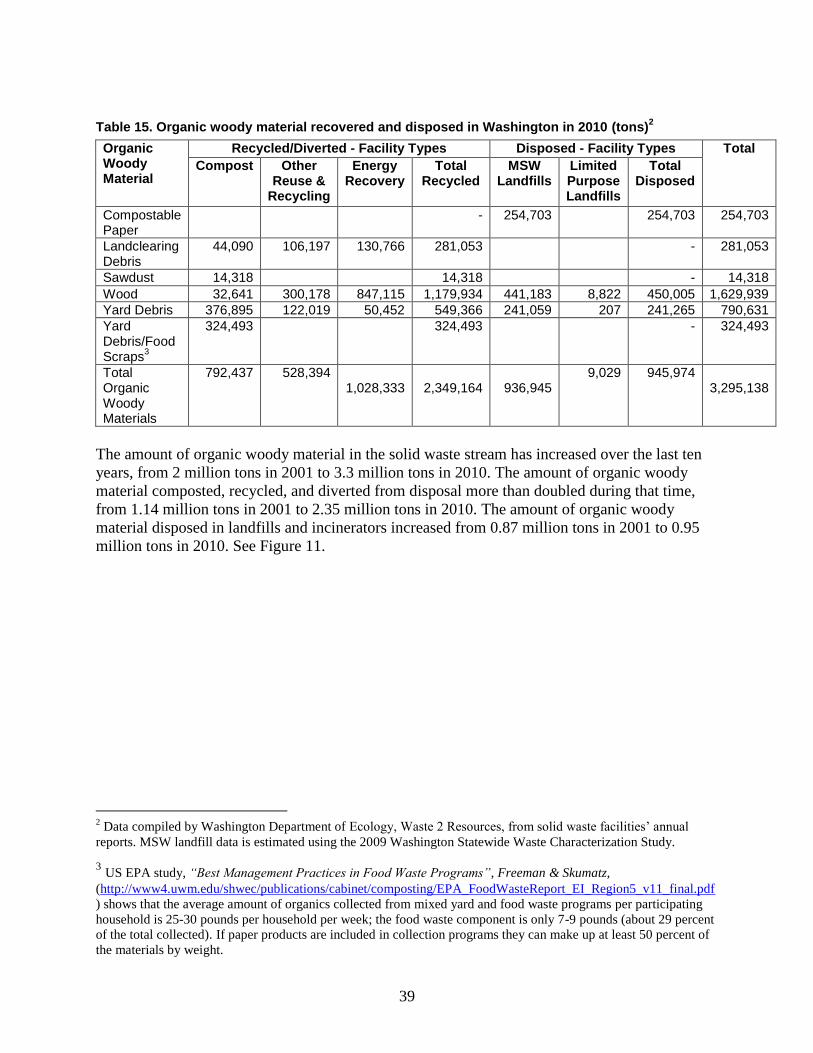
39
Table 15. Organic woody material recovered and disposed in Washington in 2010 (tons)2
Organic Woody Material
Recycled/Diverted - Facility Types Disposed - Facility Types Total
Compost Other Reuse &
Recycling
Energy Recovery
Total Recycled
MSW Landfills
Limited Purpose Landfills
Total Disposed
Compostable Paper
- 254,703 254,703 254,703
Landclearing Debris
44,090 106,197 130,766 281,053 - 281,053
Sawdust 14,318 14,318 - 14,318
Wood 32,641 300,178 847,115 1,179,934 441,183 8,822 450,005 1,629,939
Yard Debris 376,895 122,019 50,452 549,366 241,059 207 241,265 790,631
Yard Debris/Food Scraps
3
324,493 324,493 - 324,493
Total Organic Woody Materials
792,437 528,394 1,028,333
2,349,164
936,945
9,029 945,974 3,295,138
The amount of organic woody material in the solid waste stream has increased over the last ten
years, from 2 million tons in 2001 to 3.3 million tons in 2010. The amount of organic woody
material composted, recycled, and diverted from disposal more than doubled during that time,
from 1.14 million tons in 2001 to 2.35 million tons in 2010. The amount of organic woody
material disposed in landfills and incinerators increased from 0.87 million tons in 2001 to 0.95
million tons in 2010. See Figure 11.
2 Data compiled by Washington Department of Ecology, Waste 2 Resources, from solid waste facilities’ annual
reports. MSW landfill data is estimated using the 2009 Washington Statewide Waste Characterization Study.
3 US EPA study, “Best Management Practices in Food Waste Programs”, Freeman & Skumatz,
(http://www4.uwm.edu/shwec/publications/cabinet/composting/EPA_FoodWasteReport_EI_Region5_v11_final.pdf
) shows that the average amount of organics collected from mixed yard and food waste programs per participating
household is 2530 pounds per household per week; the food waste component is only 7-9 pounds (about 29 percent
of the total collected). If paper products are included in collection programs they can make up at least 50 percent of
the materials by weight.
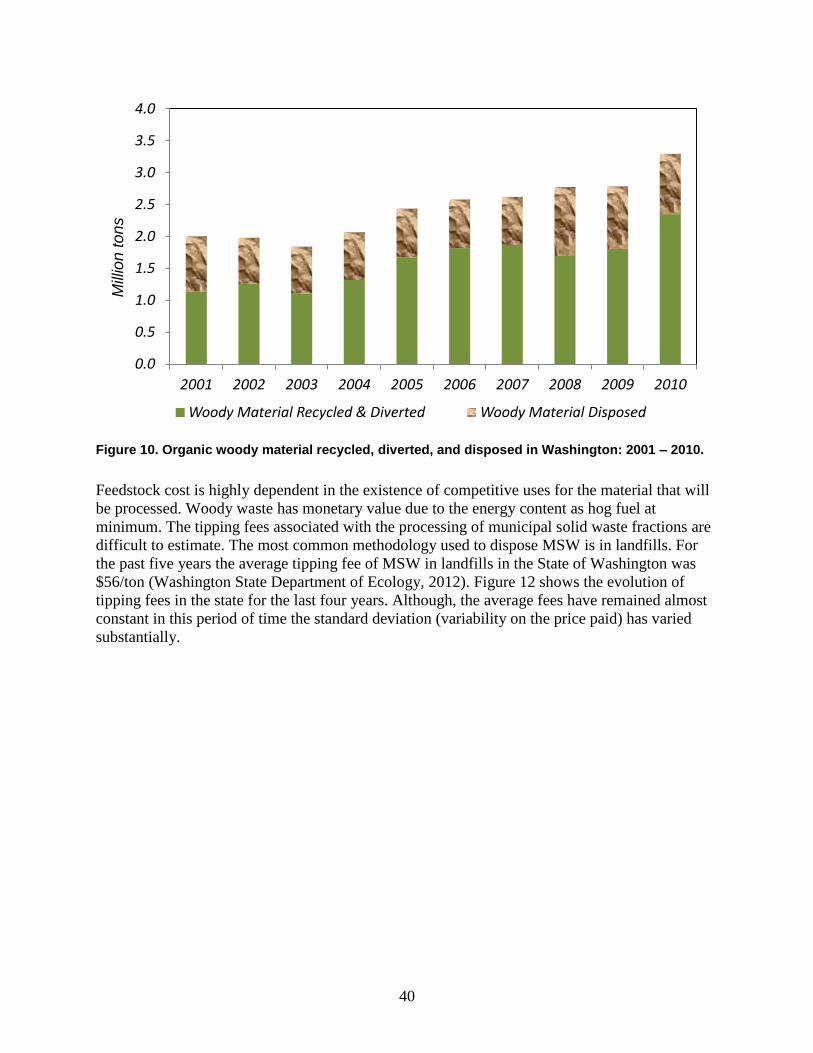
40
Figure 10. Organic woody material recycled, diverted, and disposed in Washington: 2001 – 2010.
Feedstock cost is highly dependent in the existence of competitive uses for the material that will
be processed. Woody waste has monetary value due to the energy content as hog fuel at
minimum. The tipping fees associated with the processing of municipal solid waste fractions are
difficult to estimate. The most common methodology used to dispose MSW is in landfills. For
the past five years the average tipping fee of MSW in landfills in the State of Washington was
$56/ton (Washington State Department of Ecology, 2012). Figure 12 shows the evolution of
tipping fees in the state for the last four years. Although, the average fees have remained almost
constant in this period of time the standard deviation (variability on the price paid) has varied
substantially.
0.0
0.5
1.0
1.5
2.0
2.5
3.0
3.5
4.0
2001 2002 2003 2004 2005 2006 2007 2008 2009 2010
Mill
ion
to
ns
Woody Material Recycled & Diverted Woody Material Disposed
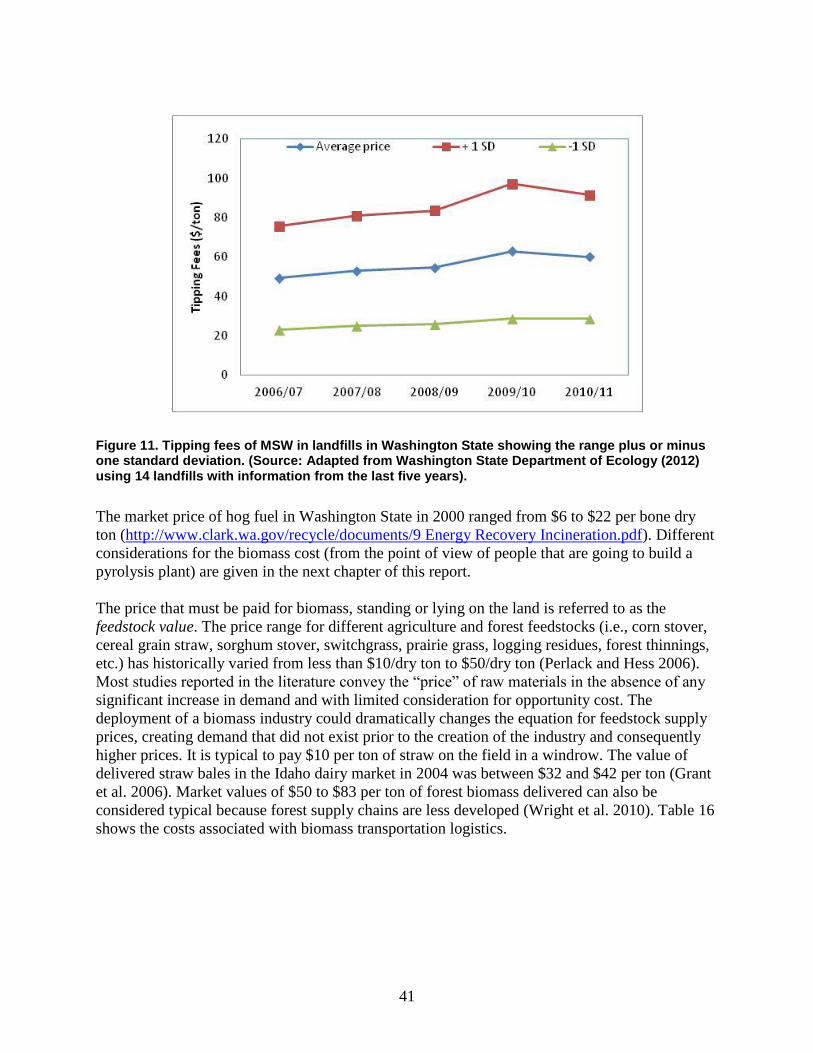
41
Figure 11. Tipping fees of MSW in landfills in Washington State showing the range plus or minus one standard deviation. (Source: Adapted from Washington State Department of Ecology (2012) using 14 landfills with information from the last five years).
The market price of hog fuel in Washington State in 2000 ranged from $6 to $22 per bone dry
ton (http://www.clark.wa.gov/recycle/documents/9 Energy Recovery Incineration.pdf). Different
considerations for the biomass cost (from the point of view of people that are going to build a
pyrolysis plant) are given in the next chapter of this report.
The price that must be paid for biomass, standing or lying on the land is referred to as the
feedstock value. The price range for different agriculture and forest feedstocks (i.e., corn stover,
cereal grain straw, sorghum stover, switchgrass, prairie grass, logging residues, forest thinnings,
etc.) has historically varied from less than $10/dry ton to $50/dry ton (Perlack and Hess 2006).
Most studies reported in the literature convey the “price” of raw materials in the absence of any
significant increase in demand and with limited consideration for opportunity cost. The
deployment of a biomass industry could dramatically changes the equation for feedstock supply
prices, creating demand that did not exist prior to the creation of the industry and consequently
higher prices. It is typical to pay $10 per ton of straw on the field in a windrow. The value of
delivered straw bales in the Idaho dairy market in 2004 was between $32 and $42 per ton (Grant
et al. 2006). Market values of $50 to $83 per ton of forest biomass delivered can also be
considered typical because forest supply chains are less developed (Wright et al. 2010). Table 16
shows the costs associated with biomass transportation logistics.
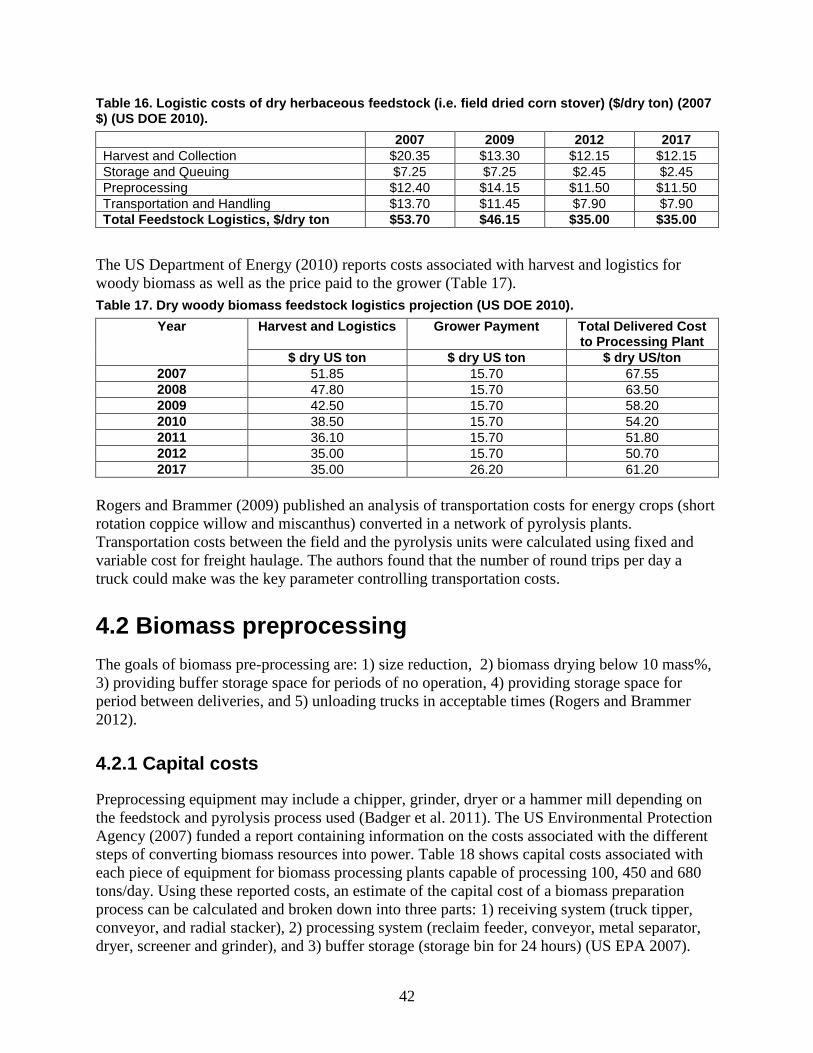
42
Table 16. Logistic costs of dry herbaceous feedstock (i.e. field dried corn stover) ($/dry ton) (2007 $) (US DOE 2010).
2007 2009 2012 2017
Harvest and Collection $20.35 $13.30 $12.15 $12.15
Storage and Queuing $7.25 $7.25 $2.45 $2.45
Preprocessing $12.40 $14.15 $11.50 $11.50
Transportation and Handling $13.70 $11.45 $7.90 $7.90
Total Feedstock Logistics, $/dry ton $53.70 $46.15 $35.00 $35.00
The US Department of Energy (2010) reports costs associated with harvest and logistics for
woody biomass as well as the price paid to the grower (Table 17).
Table 17. Dry woody biomass feedstock logistics projection (US DOE 2010).
Year Harvest and Logistics Grower Payment Total Delivered Cost to Processing Plant
$ dry US ton $ dry US ton $ dry US/ton
2007 51.85 15.70 67.55
2008 47.80 15.70 63.50
2009 42.50 15.70 58.20
2010 38.50 15.70 54.20
2011 36.10 15.70 51.80
2012 35.00 15.70 50.70
2017 35.00 26.20 61.20
Rogers and Brammer (2009) published an analysis of transportation costs for energy crops (short
rotation coppice willow and miscanthus) converted in a network of pyrolysis plants.
Transportation costs between the field and the pyrolysis units were calculated using fixed and
variable cost for freight haulage. The authors found that the number of round trips per day a
truck could make was the key parameter controlling transportation costs.
4.2 Biomass preprocessing
The goals of biomass pre-processing are: 1) size reduction, 2) biomass drying below 10 mass%,
3) providing buffer storage space for periods of no operation, 4) providing storage space for
period between deliveries, and 5) unloading trucks in acceptable times (Rogers and Brammer
2012).
4.2.1 Capital costs
Preprocessing equipment may include a chipper, grinder, dryer or a hammer mill depending on
the feedstock and pyrolysis process used (Badger et al. 2011). The US Environmental Protection
Agency (2007) funded a report containing information on the costs associated with the different
steps of converting biomass resources into power. Table 18 shows capital costs associated with
each piece of equipment for biomass processing plants capable of processing 100, 450 and 680
tons/day. Using these reported costs, an estimate of the capital cost of a biomass preparation
process can be calculated and broken down into three parts: 1) receiving system (truck tipper,
conveyor, and radial stacker), 2) processing system (reclaim feeder, conveyor, metal separator,
dryer, screener and grinder), and 3) buffer storage (storage bin for 24 hours) (US EPA 2007).
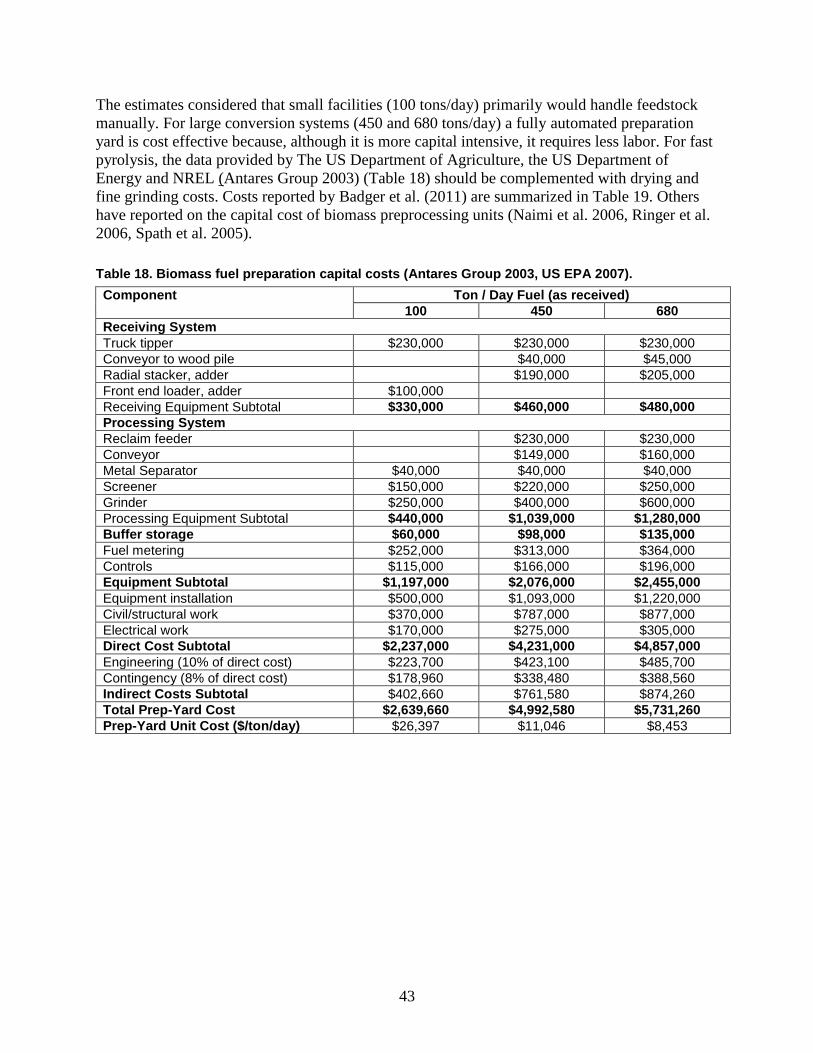
43
The estimates considered that small facilities (100 tons/day) primarily would handle feedstock
manually. For large conversion systems (450 and 680 tons/day) a fully automated preparation
yard is cost effective because, although it is more capital intensive, it requires less labor. For fast
pyrolysis, the data provided by The US Department of Agriculture, the US Department of
Energy and NREL (Antares Group 2003) (Table 18) should be complemented with drying and
fine grinding costs. Costs reported by Badger et al. (2011) are summarized in Table 19. Others
have reported on the capital cost of biomass preprocessing units (Naimi et al. 2006, Ringer et al.
2006, Spath et al. 2005).
Table 18. Biomass fuel preparation capital costs (Antares Group 2003, US EPA 2007).
Component Ton / Day Fuel (as received)
100 450 680
Receiving System
Truck tipper $230,000 $230,000 $230,000
Conveyor to wood pile $40,000 $45,000
Radial stacker, adder $190,000 $205,000
Front end loader, adder $100,000
Receiving Equipment Subtotal $330,000 $460,000 $480,000
Processing System
Reclaim feeder $230,000 $230,000
Conveyor $149,000 $160,000
Metal Separator $40,000 $40,000 $40,000
Screener $150,000 $220,000 $250,000
Grinder $250,000 $400,000 $600,000
Processing Equipment Subtotal $440,000 $1,039,000 $1,280,000
Buffer storage $60,000 $98,000 $135,000
Fuel metering $252,000 $313,000 $364,000
Controls $115,000 $166,000 $196,000
Equipment Subtotal $1,197,000 $2,076,000 $2,455,000
Equipment installation $500,000 $1,093,000 $1,220,000
Civil/structural work $370,000 $787,000 $877,000
Electrical work $170,000 $275,000 $305,000
Direct Cost Subtotal $2,237,000 $4,231,000 $4,857,000
Engineering (10% of direct cost) $223,700 $423,100 $485,700
Contingency (8% of direct cost) $178,960 $338,480 $388,560
Indirect Costs Subtotal $402,660 $761,580 $874,260
Total Prep-Yard Cost $2,639,660 $4,992,580 $5,731,260
Prep-Yard Unit Cost ($/ton/day) $26,397 $11,046 $8,453
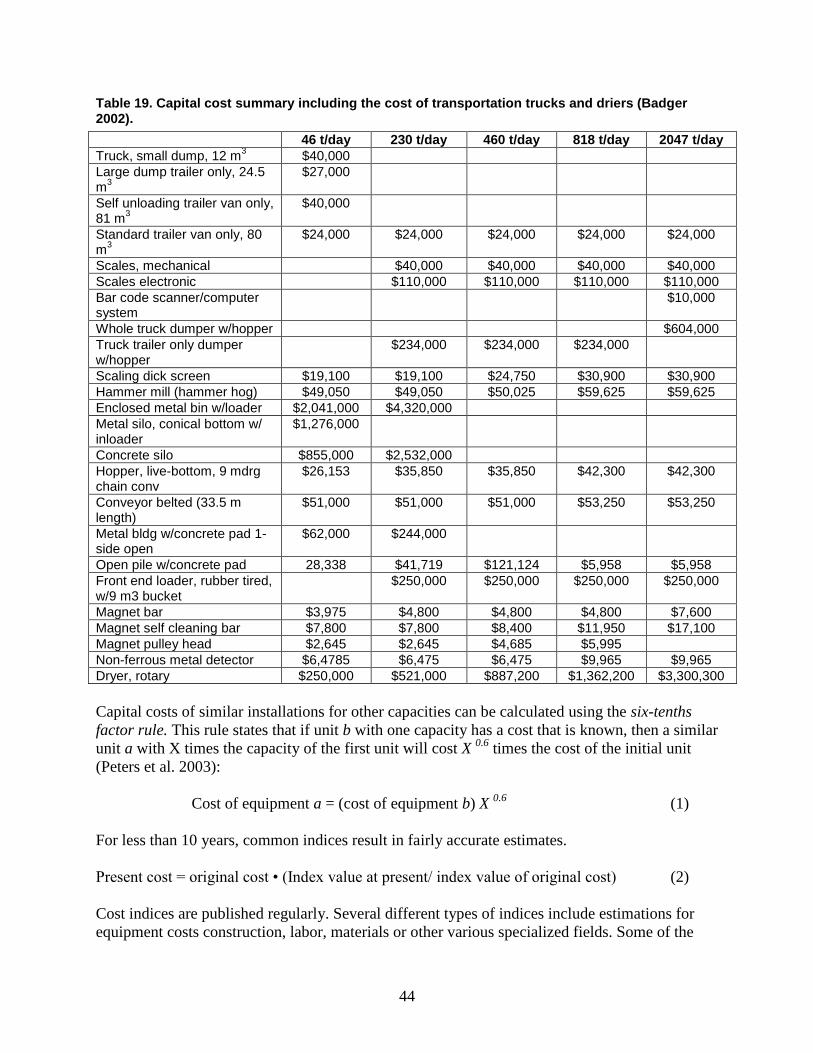
44
Table 19. Capital cost summary including the cost of transportation trucks and driers (Badger 2002).
46 t/day 230 t/day 460 t/day 818 t/day 2047 t/day
Truck, small dump, 12 m3 $40,000
Large dump trailer only, 24.5 m
3
$27,000
Self unloading trailer van only, 81 m
3
$40,000
Standard trailer van only, 80 m
3
$24,000 $24,000 $24,000 $24,000 $24,000
Scales, mechanical $40,000 $40,000 $40,000 $40,000
Scales electronic $110,000 $110,000 $110,000 $110,000
Bar code scanner/computer system
$10,000
Whole truck dumper w/hopper $604,000
Truck trailer only dumper w/hopper
$234,000 $234,000 $234,000
Scaling dick screen $19,100 $19,100 $24,750 $30,900 $30,900
Hammer mill (hammer hog) $49,050 $49,050 $50,025 $59,625 $59,625
Enclosed metal bin w/loader $2,041,000 $4,320,000
Metal silo, conical bottom w/ inloader
$1,276,000
Concrete silo $855,000 $2,532,000
Hopper, live-bottom, 9 mdrg chain conv
$26,153 $35,850 $35,850 $42,300 $42,300
Conveyor belted (33.5 m length)
$51,000 $51,000 $51,000 $53,250 $53,250
Metal bldg w/concrete pad 1-side open
$62,000 $244,000
Open pile w/concrete pad 28,338 $41,719 $121,124 $5,958 $5,958
Front end loader, rubber tired, w/9 m3 bucket
$250,000 $250,000 $250,000 $250,000
Magnet bar $3,975 $4,800 $4,800 $4,800 $7,600
Magnet self cleaning bar $7,800 $7,800 $8,400 $11,950 $17,100
Magnet pulley head $2,645 $2,645 $4,685 $5,995
Non-ferrous metal detector $6,4785 $6,475 $6,475 $9,965 $9,965
Dryer, rotary $250,000 $521,000 $887,200 $1,362,200 $3,300,300
Capital costs of similar installations for other capacities can be calculated using the six-tenths
factor rule. This rule states that if unit b with one capacity has a cost that is known, then a similar
unit a with X times the capacity of the first unit will cost X 0.6
times the cost of the initial unit
(Peters et al. 2003):
Cost of equipment a = (cost of equipment b) X 0.6
(1)
For less than 10 years, common indices result in fairly accurate estimates.
Present cost = original cost • (Index value at present/ index value of original cost) (2)
Cost indices are published regularly. Several different types of indices include estimations for
equipment costs construction, labor, materials or other various specialized fields. Some of the
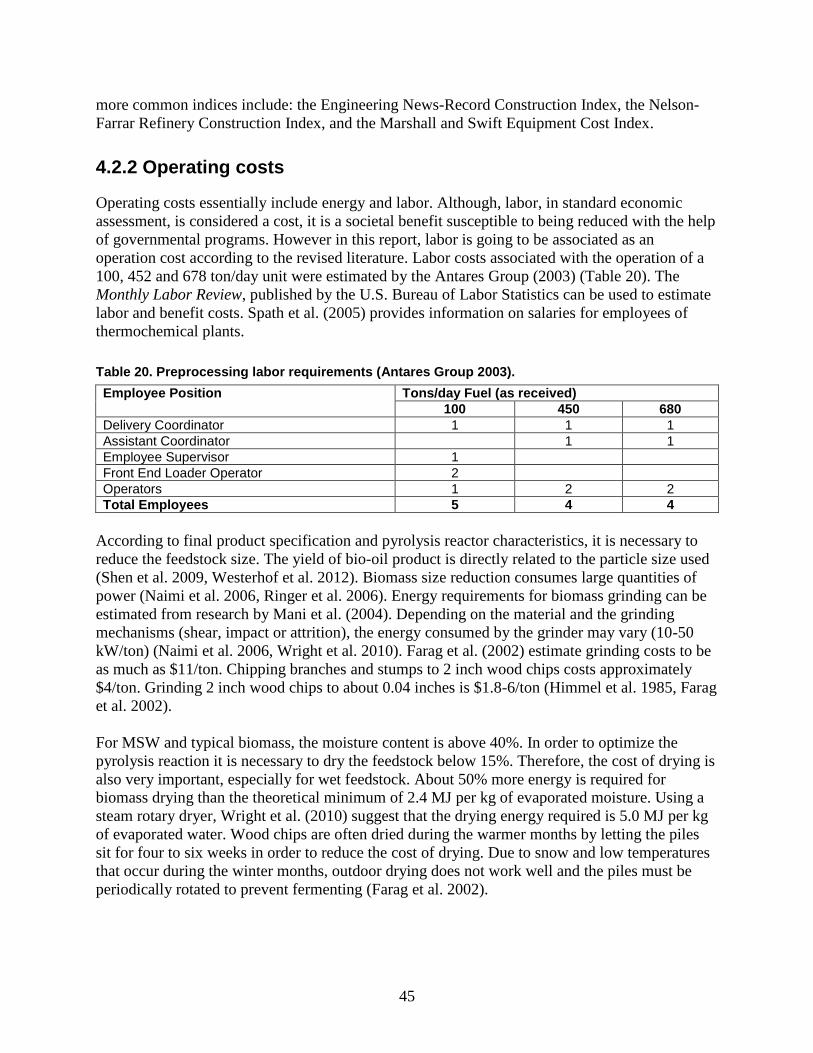
45
more common indices include: the Engineering News-Record Construction Index, the Nelson-
Farrar Refinery Construction Index, and the Marshall and Swift Equipment Cost Index.
4.2.2 Operating costs
Operating costs essentially include energy and labor. Although, labor, in standard economic
assessment, is considered a cost, it is a societal benefit susceptible to being reduced with the help
of governmental programs. However in this report, labor is going to be associated as an
operation cost according to the revised literature. Labor costs associated with the operation of a
100, 452 and 678 ton/day unit were estimated by the Antares Group (2003) (Table 20). The
Monthly Labor Review, published by the U.S. Bureau of Labor Statistics can be used to estimate
labor and benefit costs. Spath et al. (2005) provides information on salaries for employees of
thermochemical plants.
Table 20. Preprocessing labor requirements (Antares Group 2003).
Employee Position Tons/day Fuel (as received)
100 450 680
Delivery Coordinator 1 1 1
Assistant Coordinator 1 1
Employee Supervisor 1
Front End Loader Operator 2
Operators 1 2 2
Total Employees 5 4 4
According to final product specification and pyrolysis reactor characteristics, it is necessary to
reduce the feedstock size. The yield of bio-oil product is directly related to the particle size used
(Shen et al. 2009, Westerhof et al. 2012). Biomass size reduction consumes large quantities of
power (Naimi et al. 2006, Ringer et al. 2006). Energy requirements for biomass grinding can be
estimated from research by Mani et al. (2004). Depending on the material and the grinding
mechanisms (shear, impact or attrition), the energy consumed by the grinder may vary (10-50
kW/ton) (Naimi et al. 2006, Wright et al. 2010). Farag et al. (2002) estimate grinding costs to be
as much as $11/ton. Chipping branches and stumps to 2 inch wood chips costs approximately
$4/ton. Grinding 2 inch wood chips to about 0.04 inches is $1.8-6/ton (Himmel et al. 1985, Farag
et al. 2002).
For MSW and typical biomass, the moisture content is above 40%. In order to optimize the
pyrolysis reaction it is necessary to dry the feedstock below 15%. Therefore, the cost of drying is
also very important, especially for wet feedstock. About 50% more energy is required for
biomass drying than the theoretical minimum of 2.4 MJ per kg of evaporated moisture. Using a
steam rotary dryer, Wright et al. (2010) suggest that the drying energy required is 5.0 MJ per kg
of evaporated water. Wood chips are often dried during the warmer months by letting the piles
sit for four to six weeks in order to reduce the cost of drying. Due to snow and low temperatures
that occur during the winter months, outdoor drying does not work well and the piles must be
periodically rotated to prevent fermenting (Farag et al. 2002).
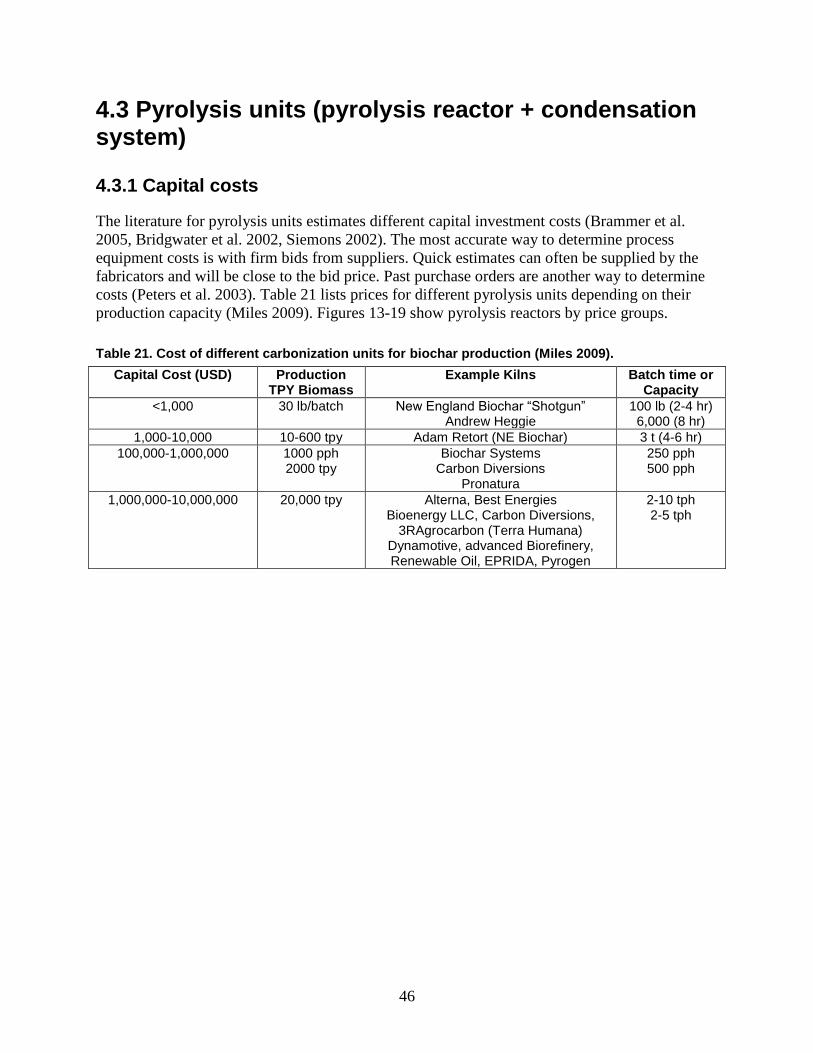
46
4.3 Pyrolysis units (pyrolysis reactor + condensation system)
4.3.1 Capital costs
The literature for pyrolysis units estimates different capital investment costs (Brammer et al.
2005, Bridgwater et al. 2002, Siemons 2002). The most accurate way to determine process
equipment costs is with firm bids from suppliers. Quick estimates can often be supplied by the
fabricators and will be close to the bid price. Past purchase orders are another way to determine
costs (Peters et al. 2003). Table 21 lists prices for different pyrolysis units depending on their
production capacity (Miles 2009). Figures 13-19 show pyrolysis reactors by price groups.
Table 21. Cost of different carbonization units for biochar production (Miles 2009).
Capital Cost (USD) Production TPY Biomass
Example Kilns Batch time or Capacity
<1,000 30 lb/batch New England Biochar “Shotgun” Andrew Heggie
100 lb (2-4 hr) 6,000 (8 hr)
1,000-10,000 10-600 tpy Adam Retort (NE Biochar) 3 t (4-6 hr)
100,000-1,000,000 1000 pph 2000 tpy
Biochar Systems Carbon Diversions
Pronatura
250 pph 500 pph
1,000,000-10,000,000 20,000 tpy Alterna, Best Energies Bioenergy LLC, Carbon Diversions,
3RAgrocarbon (Terra Humana) Dynamotive, advanced Biorefinery, Renewable Oil, EPRIDA, Pyrogen
2-10 tph 2-5 tph
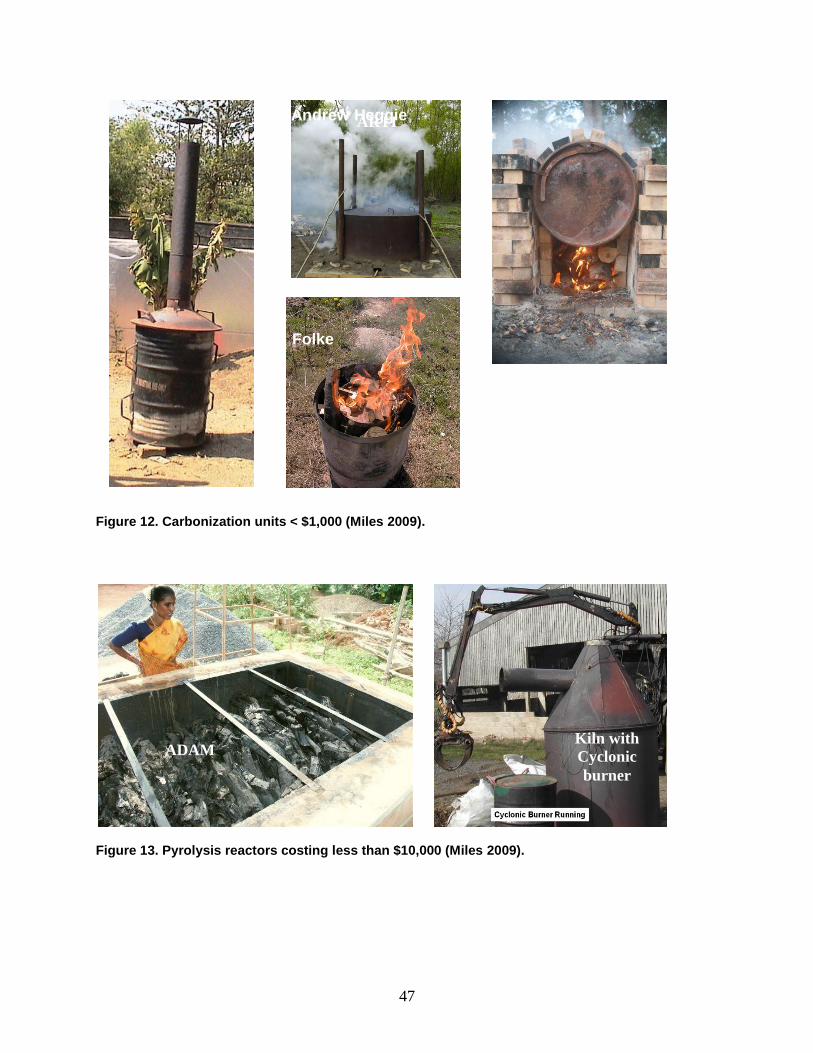
47
Figure 12. Carbonization units < $1,000 (Miles 2009).
Figure 13. Pyrolysis reactors costing less than $10,000 (Miles 2009).
ARTI
India
Folke
Gunther
Andrew Heggie
UK
Max
Henderson
ADAM
RETORT
Kiln with
Cyclonic
burner
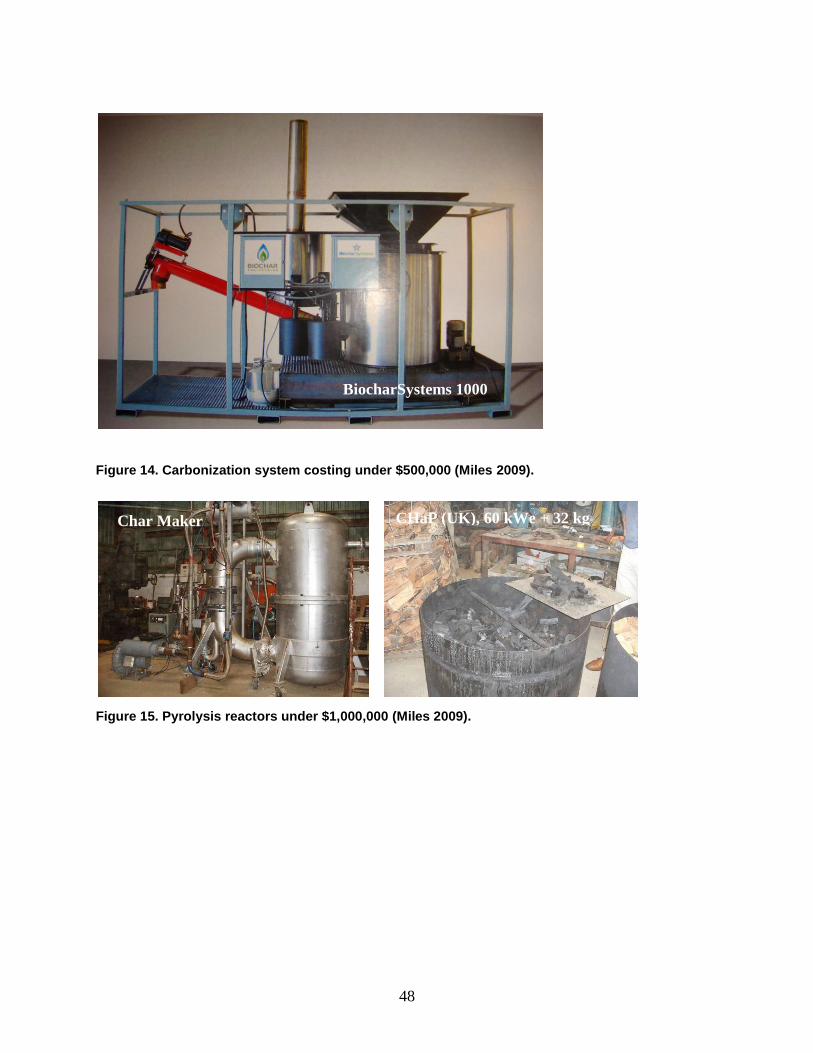
48
Figure 14. Carbonization system costing under $500,000 (Miles 2009).
Figure 15. Pyrolysis reactors under $1,000,000 (Miles 2009).
Char Maker
(Heggie)
CHaP (UK), 60 kWe + 32 kg
Char
BiocharSystems 1000
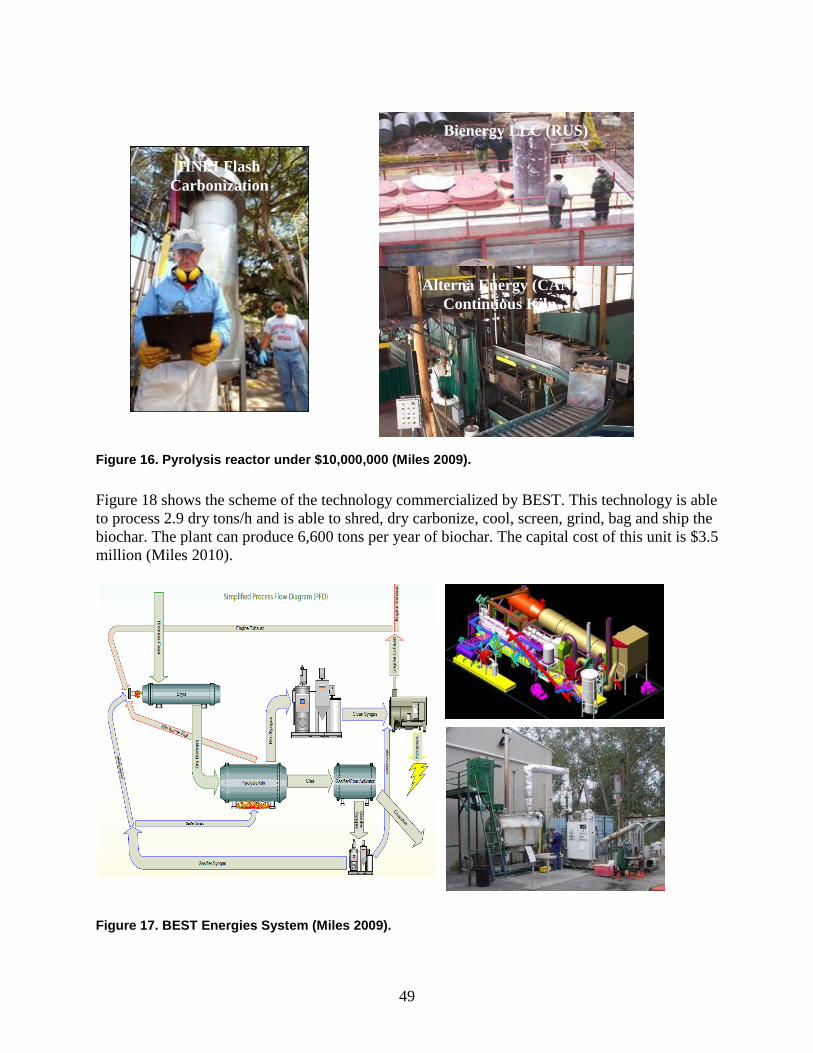
49
Figure 16. Pyrolysis reactor under $10,000,000 (Miles 2009).
Figure 18 shows the scheme of the technology commercialized by BEST. This technology is able
to process 2.9 dry tons/h and is able to shred, dry carbonize, cool, screen, grind, bag and ship the
biochar. The plant can produce 6,600 tons per year of biochar. The capital cost of this unit is $3.5
million (Miles 2010).
Figure 17. BEST Energies System (Miles 2009).
HNEI Flash
Carbonization
Bioenergy LLC
(RUS)
Alterna Energy (CAN)
Continuous Kiln
Bienergy LLC (RUS)
HNEI Flash
Carbonization
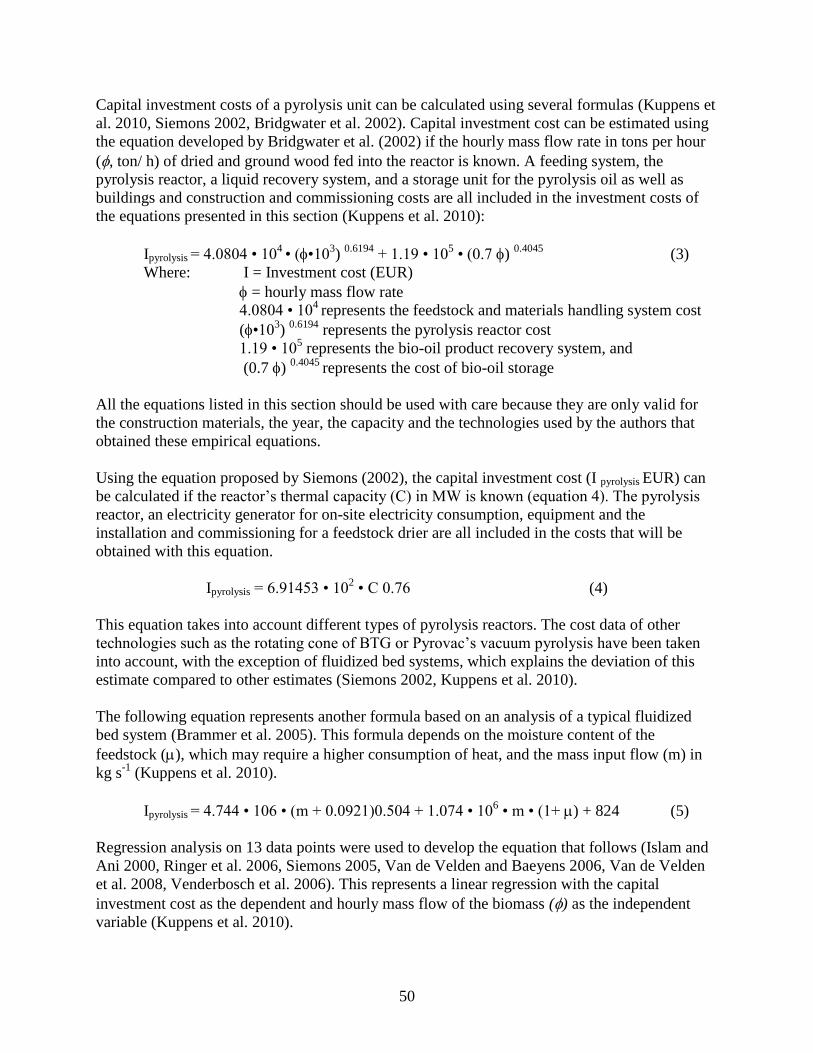
50
Capital investment costs of a pyrolysis unit can be calculated using several formulas (Kuppens et
al. 2010, Siemons 2002, Bridgwater et al. 2002). Capital investment cost can be estimated using
the equation developed by Bridgwater et al. (2002) if the hourly mass flow rate in tons per hour
(, ton/ h) of dried and ground wood fed into the reactor is known. A feeding system, the
pyrolysis reactor, a liquid recovery system, and a storage unit for the pyrolysis oil as well as
buildings and construction and commissioning costs are all included in the investment costs of
the equations presented in this section (Kuppens et al. 2010):
Ipyrolysis = 4.0804 • 104
• (•103)
0.6194 + 1.19 • 10
5 • (0.7)
0.4045 (3)
Where: I = Investment cost (EUR)
= hourly mass flow rate
4.0804 • 104
represents the feedstock and materials handling system cost
(•103)
0.6194 represents the pyrolysis reactor cost
1.19 • 105 represents the bio-oil product recovery system, and
(0.7) 0.4045
represents the cost of bio-oil storage
All the equations listed in this section should be used with care because they are only valid for
the construction materials, the year, the capacity and the technologies used by the authors that
obtained these empirical equations.
Using the equation proposed by Siemons (2002), the capital investment cost (I pyrolysis EUR) can
be calculated if the reactor’s thermal capacity (C) in MW is known (equation 4). The pyrolysis
reactor, an electricity generator for on-site electricity consumption, equipment and the
installation and commissioning for a feedstock drier are all included in the costs that will be
obtained with this equation.
Ipyrolysis = 6.91453 • 102 • C 0.76 (4)
This equation takes into account different types of pyrolysis reactors. The cost data of other
technologies such as the rotating cone of BTG or Pyrovac’s vacuum pyrolysis have been taken
into account, with the exception of fluidized bed systems, which explains the deviation of this
estimate compared to other estimates (Siemons 2002, Kuppens et al. 2010).
The following equation represents another formula based on an analysis of a typical fluidized
bed system (Brammer et al. 2005). This formula depends on the moisture content of the
feedstock (), which may require a higher consumption of heat, and the mass input flow (m) in
kg s-1
(Kuppens et al. 2010).
Ipyrolysis = 4.744 • 106 • (m + 0.0921)0.504 + 1.074 • 106 • m • (1+ ) + 824 (5)
Regression analysis on 13 data points were used to develop the equation that follows (Islam and
Ani 2000, Ringer et al. 2006, Siemons 2005, Van de Velden and Baeyens 2006, Van de Velden
et al. 2008, Venderbosch et al. 2006). This represents a linear regression with the capital
investment cost as the dependent and hourly mass flow of the biomass () as the independent
variable (Kuppens et al. 2010).
51
Ipyrolysis = (1.906 + 0.598 • ) • 106 (6)
Farag et al. (2002), Badger et al. (2011), Jones and Anderson (2011), Cole Hill Associates
(2004) and Ringer et al. (2006) estimated the capital plant cost of different sized pyrolysis units
that include feed preparation, planning, and construction (Table 22). The cost of land and site
preparation is not included in these estimates (Farag et al. 2002).
Table 22. Dynamotive bio-oil plant capital cost including site planning, preparation, feedstock and combustion costs (Cole Hill Associates 2004, Jones and Anderson 2011, Farag et al. 2002).
Capacity (ton/day) Capital Cost ($ million)
6 ton/day (BEC) (Jones and Anderson 2011) 0.1 – 0.2
20-25 ton/day (BECG) (Jones and Anderson 2011) 1.0 – 1.5
25 ton/day (Dynamotive) (Cole Hill Ass. 2004) 2.6
45 ton/day (Cole Hill Ass. 2004) 2.5
100 ton/day (Dynamotive) (Farag et al. 2002) 6.6
100 ton/day (Dynamotive) (Cole Hill Ass 2004) 5.6
100 ton/day (ROI) (Badger et al. 2011) 6.0
200 ton/day (Dynamotive) (Farag et al. 2002) 8.8
200 ton/day (Dynamotive) (Cole Hill Ass. 2004) 8.2
400 ton/day (Dynamotive) (Farag et al. 2002) 14.3
400 ton/day (Dynamotive) (Cole Hill Ass. 2004) 12.6
550 ton/day (Ringer et al. 2006) (includes 35% contingency) 28.4
A detailed cost breakdown of the installed equipment for feedstock preparation, pyrolysis,
quench system with steam, and power production for a 550 t/day unit estimated by Ringer et al.
(2006) is shown in Table 23.
Table 23. Installed equipment costs for 550 ton/day pyrolysis units (Ringer et al. 2006, Wright et al. 2008).
Plant Area Installed Equipment
Cost ($ Million)
%
Feedstock Handling and Drying $5.57 19.61
Pyrolysis $3.92 13.80
Quench $1.94 6.83
Heat recovery $1.14 4.01
Product Recovery and Storage $0.80 2.81
Recycle $1.38 4.86
Steam and Power Production $3.16 11.12
Utilities $3.13 11.02
Equipment Contingency – 35% $7.37 25.94
Total Installed Equipment Cost $28.41 100
The total capital investment cost for a 550 ton/day pyrolysis plant as estimated by Ringer et al.
(2006) is shown in Table 24. The total equipment cost is used to estimate other costs.
52
Table 24. Capital investment cost for a 550 ton/day unit (Ringer et al. 2006).
Component Basis Cost
Total Equipment Cost Warehouse Site Development
Calculated by equations 1.5% of equipment costs 9% of ISBL
$28,410,567 $426,159 $826,448
Total Installed Cost (TIC) Sum of Above $29,663,173
Indirect Costs Filed Expenses Home Office & Construction Fee Project Contingency
20% of TIC 25% of TIC 3% TIC
$5,932,635 $7,415,793 $889,895
Total Capital Investment (TCI) Sum of Above $43,901,497
Other Costs (Startup) 10% of TCI $4,390,150
Total Project Investment Sum of Above $48,291,646
A detailed estimation of the cost of equipments needed for a pyrolysis and hydrotreatment unit
can be found in Appendix A of the Wright et al. (2010) report.
4.3.2 Operating costs
Mass and energy balances are needed to determine variable costs (Ringer et al. 2006). The cost
of electricity could represent approximately 17% of the annual operating cost (at $0.05-0.08 per
kWh) (Wright et al. 2010). Utility costs proposed by Farag et al. (2002) associated with a 100,
200 and a 400 ton/day pyrolysis unit are shown in Table 25.
Table 25. Dynamotive plant utility costs (Farag et al. 2002).
Wet Wood Plant Size 100 ton/day 200 ton/day 400 ton/day
Electricity used per operating hour 550 kWh/h 962 kWh/h 1788 kWh/hr
Yearly operating hours 7920 hrs/year
Electricity @ $0.065/kWh (per year) $283,140 $495,238 $920,462
Nitrogen* (per year) $80,000 $160,000 $320,000
Miscellaneous chemicals (per year) $120,000 $240,000 $480,000
Natural as needed (MJ/year) 13,068,000 26,136,000 52,272,000
Natural Gas** @ ($0.00672/MS) (per year) $88,214 $176,428 $352,856
*Nitrogen used as a fluidized bed
** A 2001 Dynamotive claim was used to calculate the amount of natural gas used in the process. This claim stated
that .0 MJ of energy from an external fuel source out of a total 2.5 MJ is needed per kg of bio-oil produced.
Assuming an average one way haul distance to the bio-oil refinery, pyrolysis oil transportation
costs can be estimated on a cost per gallon basis (Badger et al. 2011). Transportation cost for
bio-oil estimate by Farag et al. (2002) is $0.05/gal of liquid oil. The estimated bio-oil
transportation costs for various industrial capacities are seen in Table 26.
Table 26. Estimated transportation costs (Farag et al. 2002).
Wet Wood Plant Size 100 ton/day 200 ton/day 400 ton/day
Bio-oil Produced (gallons/day) 8,790.9 17,581 35,163
Cost for Transportation ($/year) 145,049 290,099 580,197
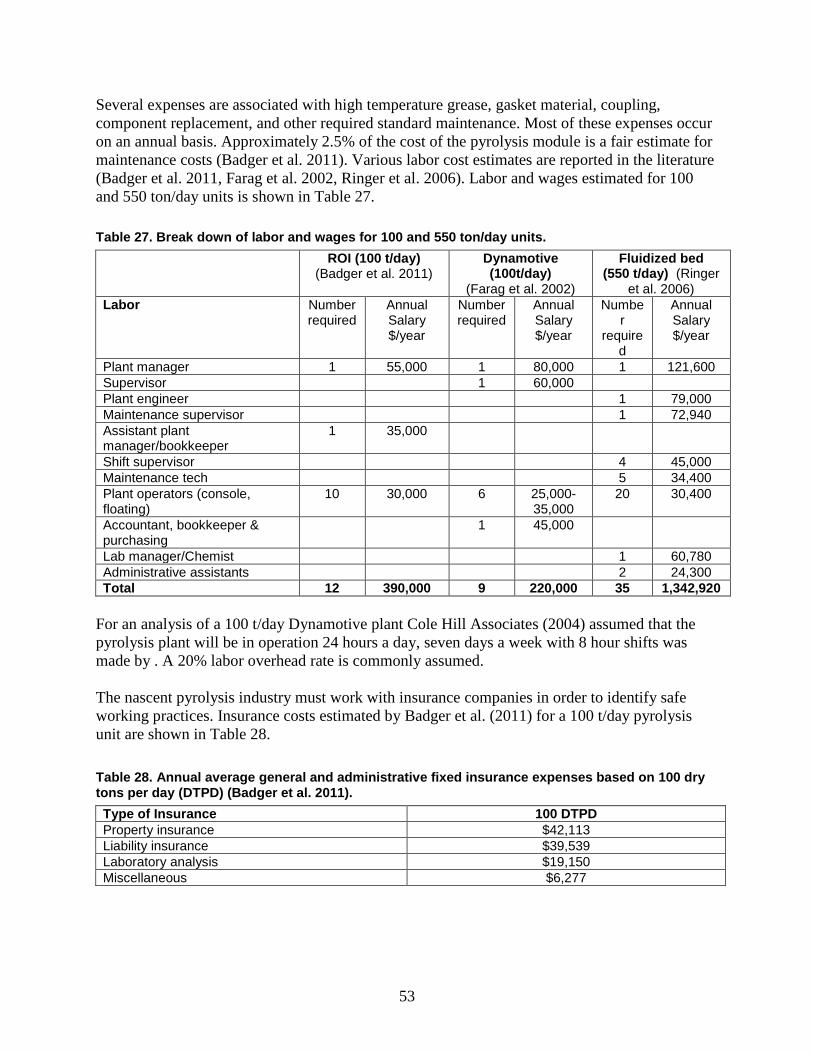
53
Several expenses are associated with high temperature grease, gasket material, coupling,
component replacement, and other required standard maintenance. Most of these expenses occur
on an annual basis. Approximately 2.5% of the cost of the pyrolysis module is a fair estimate for
maintenance costs (Badger et al. 2011). Various labor cost estimates are reported in the literature
(Badger et al. 2011, Farag et al. 2002, Ringer et al. 2006). Labor and wages estimated for 100
and 550 ton/day units is shown in Table 27.
Table 27. Break down of labor and wages for 100 and 550 ton/day units.
ROI (100 t/day) (Badger et al. 2011)
Dynamotive (100t/day)
(Farag et al. 2002)
Fluidized bed (550 t/day) (Ringer
et al. 2006)
Labor Number required
Annual Salary $/year
Number required
Annual Salary $/year
Number
required
Annual Salary $/year
Plant manager 1 55,000 1 80,000 1 121,600
Supervisor 1 60,000
Plant engineer 1 79,000
Maintenance supervisor 1 72,940
Assistant plant manager/bookkeeper
1 35,000
Shift supervisor 4 45,000
Maintenance tech 5 34,400
Plant operators (console, floating)
10 30,000 6 25,000-35,000
20 30,400
Accountant, bookkeeper & purchasing
1 45,000
Lab manager/Chemist 1 60,780
Administrative assistants 2 24,300
Total 12 390,000 9 220,000 35 1,342,920
For an analysis of a 100 t/day Dynamotive plant Cole Hill Associates (2004) assumed that the
pyrolysis plant will be in operation 24 hours a day, seven days a week with 8 hour shifts was
made by . A 20% labor overhead rate is commonly assumed.
The nascent pyrolysis industry must work with insurance companies in order to identify safe
working practices. Insurance costs estimated by Badger et al. (2011) for a 100 t/day pyrolysis
unit are shown in Table 28.
Table 28. Annual average general and administrative fixed insurance expenses based on 100 dry tons per day (DTPD) (Badger et al. 2011).
Type of Insurance 100 DTPD
Property insurance $42,113
Liability insurance $39,539
Laboratory analysis $19,150
Miscellaneous $6,277
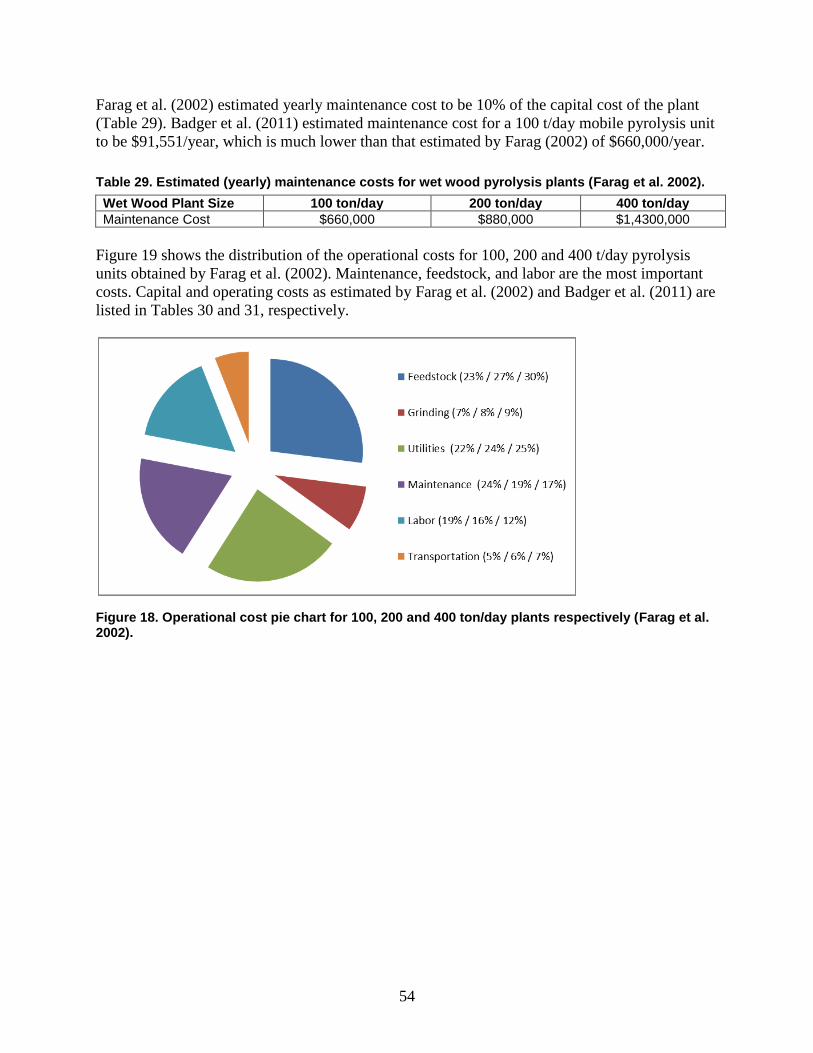
54
Farag et al. (2002) estimated yearly maintenance cost to be 10% of the capital cost of the plant
(Table 29). Badger et al. (2011) estimated maintenance cost for a 100 t/day mobile pyrolysis unit
to be $91,551/year, which is much lower than that estimated by Farag (2002) of $660,000/year.
Table 29. Estimated (yearly) maintenance costs for wet wood pyrolysis plants (Farag et al. 2002).
Wet Wood Plant Size 100 ton/day 200 ton/day 400 ton/day
Maintenance Cost $660,000 $880,000 $1,4300,000
Figure 19 shows the distribution of the operational costs for 100, 200 and 400 t/day pyrolysis
units obtained by Farag et al. (2002). Maintenance, feedstock, and labor are the most important
costs. Capital and operating costs as estimated by Farag et al. (2002) and Badger et al. (2011) are
listed in Tables 30 and 31, respectively.
Figure 18. Operational cost pie chart for 100, 200 and 400 ton/day plants respectively (Farag et al. 2002).
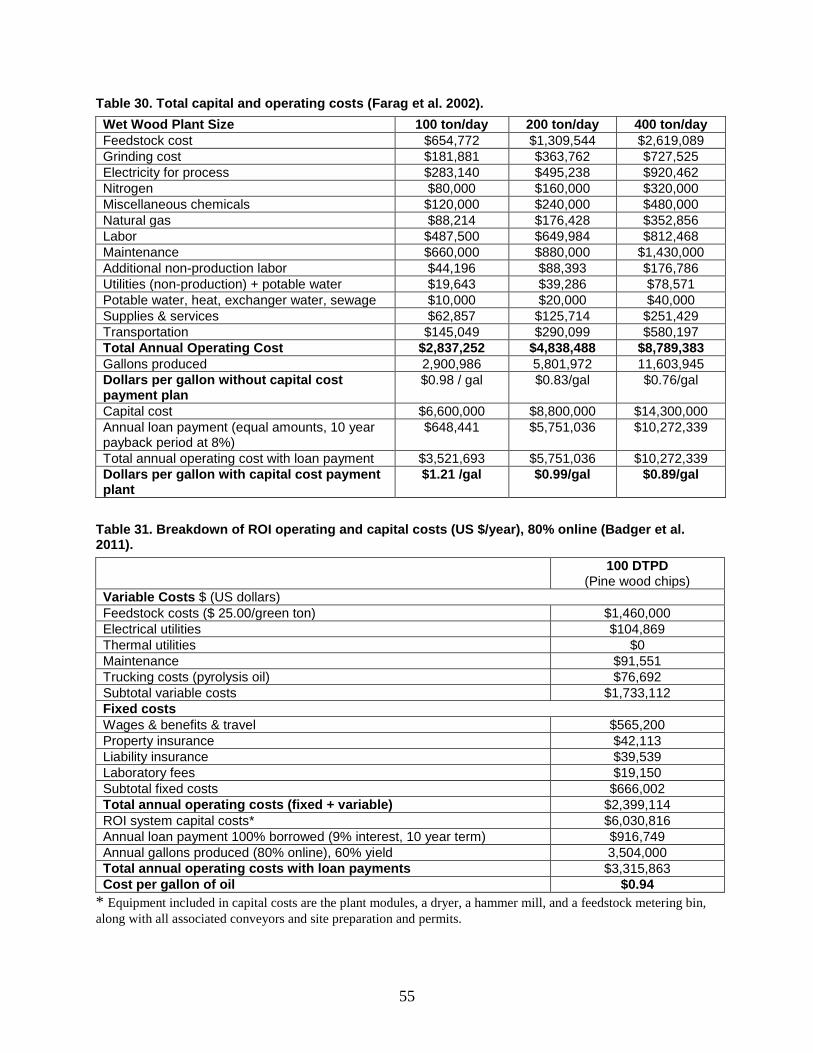
55
Table 30. Total capital and operating costs (Farag et al. 2002).
Wet Wood Plant Size 100 ton/day 200 ton/day 400 ton/day
Feedstock cost $654,772 $1,309,544 $2,619,089
Grinding cost $181,881 $363,762 $727,525
Electricity for process $283,140 $495,238 $920,462
Nitrogen $80,000 $160,000 $320,000
Miscellaneous chemicals $120,000 $240,000 $480,000
Natural gas $88,214 $176,428 $352,856
Labor $487,500 $649,984 $812,468
Maintenance $660,000 $880,000 $1,430,000
Additional non-production labor $44,196 $88,393 $176,786
Utilities (non-production) + potable water $19,643 $39,286 $78,571
Potable water, heat, exchanger water, sewage $10,000 $20,000 $40,000
Supplies & services $62,857 $125,714 $251,429
Transportation $145,049 $290,099 $580,197
Total Annual Operating Cost $2,837,252 $4,838,488 $8,789,383
Gallons produced 2,900,986 5,801,972 11,603,945
Dollars per gallon without capital cost payment plan
$0.98 / gal $0.83/gal $0.76/gal
Capital cost $6,600,000 $8,800,000 $14,300,000
Annual loan payment (equal amounts, 10 year payback period at 8%)
$648,441 $5,751,036 $10,272,339
Total annual operating cost with loan payment $3,521,693 $5,751,036 $10,272,339
Dollars per gallon with capital cost payment plant
$1.21 /gal $0.99/gal $0.89/gal
Table 31. Breakdown of ROI operating and capital costs (US $/year), 80% online (Badger et al. 2011).
100 DTPD (Pine wood chips)
Variable Costs $ (US dollars)
Feedstock costs ($ 25.00/green ton) $1,460,000
Electrical utilities $104,869
Thermal utilities $0
Maintenance $91,551
Trucking costs (pyrolysis oil) $76,692
Subtotal variable costs $1,733,112
Fixed costs
Wages & benefits & travel $565,200
Property insurance $42,113
Liability insurance $39,539
Laboratory fees $19,150
Subtotal fixed costs $666,002
Total annual operating costs (fixed + variable) $2,399,114
ROI system capital costs* $6,030,816
Annual loan payment 100% borrowed (9% interest, 10 year term) $916,749
Annual gallons produced (80% online), 60% yield 3,504,000
Total annual operating costs with loan payments $3,315,863
Cost per gallon of oil $0.94
* Equipment included in capital costs are the plant modules, a dryer, a hammer mill, and a feedstock metering bin,
along with all associated conveyors and site preparation and permits.
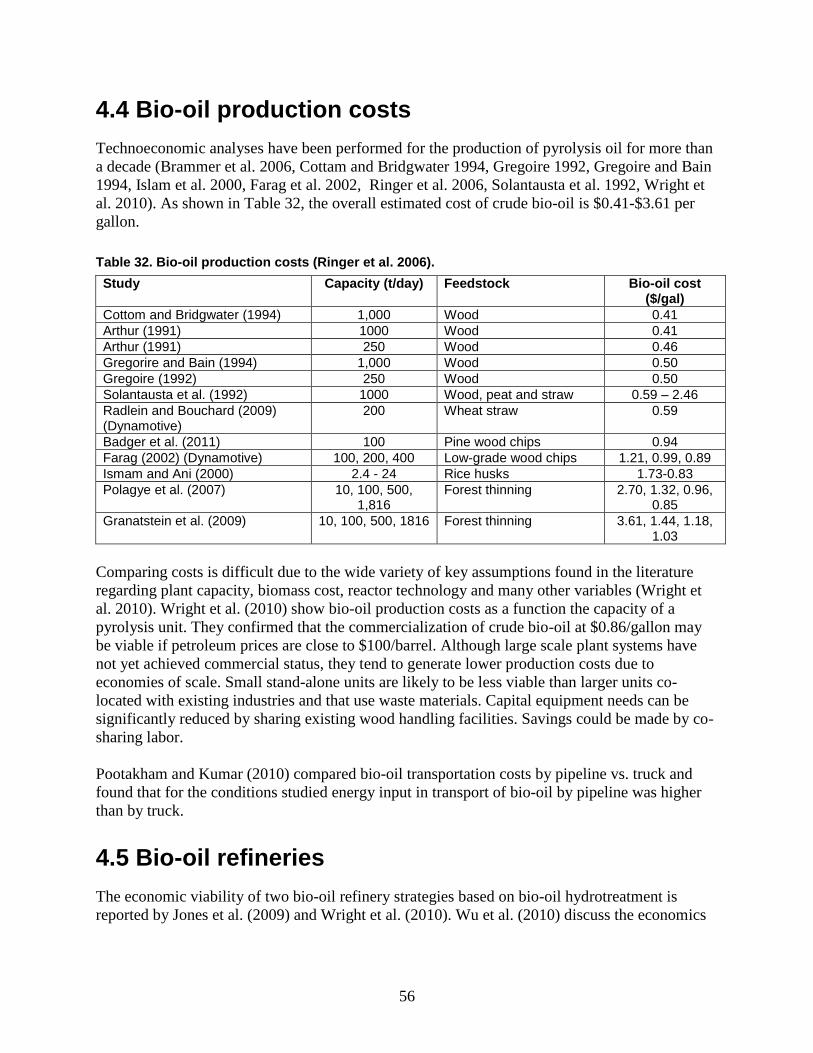
56
4.4 Bio-oil production costs
Technoeconomic analyses have been performed for the production of pyrolysis oil for more than
a decade (Brammer et al. 2006, Cottam and Bridgwater 1994, Gregoire 1992, Gregoire and Bain
1994, Islam et al. 2000, Farag et al. 2002, Ringer et al. 2006, Solantausta et al. 1992, Wright et
al. 2010). As shown in Table 32, the overall estimated cost of crude bio-oil is $0.41-$3.61 per
gallon.
Table 32. Bio-oil production costs (Ringer et al. 2006).
Study Capacity (t/day) Feedstock Bio-oil cost ($/gal)
Cottom and Bridgwater (1994) 1,000 Wood 0.41
Arthur (1991) 1000 Wood 0.41
Arthur (1991) 250 Wood 0.46
Gregorire and Bain (1994) 1,000 Wood 0.50
Gregoire (1992) 250 Wood 0.50
Solantausta et al. (1992) 1000 Wood, peat and straw 0.59 – 2.46
Radlein and Bouchard (2009) (Dynamotive)
200 Wheat straw 0.59
Badger et al. (2011) 100 Pine wood chips 0.94
Farag (2002) (Dynamotive) 100, 200, 400 Low-grade wood chips 1.21, 0.99, 0.89
Ismam and Ani (2000) 2.4 - 24 Rice husks 1.73-0.83
Polagye et al. (2007) 10, 100, 500, 1,816
Forest thinning 2.70, 1.32, 0.96, 0.85
Granatstein et al. (2009) 10, 100, 500, 1816 Forest thinning 3.61, 1.44, 1.18, 1.03
Comparing costs is difficult due to the wide variety of key assumptions found in the literature
regarding plant capacity, biomass cost, reactor technology and many other variables (Wright et
al. 2010). Wright et al. (2010) show bio-oil production costs as a function the capacity of a
pyrolysis unit. They confirmed that the commercialization of crude bio-oil at $0.86/gallon may
be viable if petroleum prices are close to $100/barrel. Although large scale plant systems have
not yet achieved commercial status, they tend to generate lower production costs due to
economies of scale. Small stand-alone units are likely to be less viable than larger units co-
located with existing industries and that use waste materials. Capital equipment needs can be
significantly reduced by sharing existing wood handling facilities. Savings could be made by co-
sharing labor.
Pootakham and Kumar (2010) compared bio-oil transportation costs by pipeline vs. truck and
found that for the conditions studied energy input in transport of bio-oil by pipeline was higher
than by truck.
4.5 Bio-oil refineries
The economic viability of two bio-oil refinery strategies based on bio-oil hydrotreatment is
reported by Jones et al. (2009) and Wright et al. (2010). Wu et al. (2010) discuss the economics
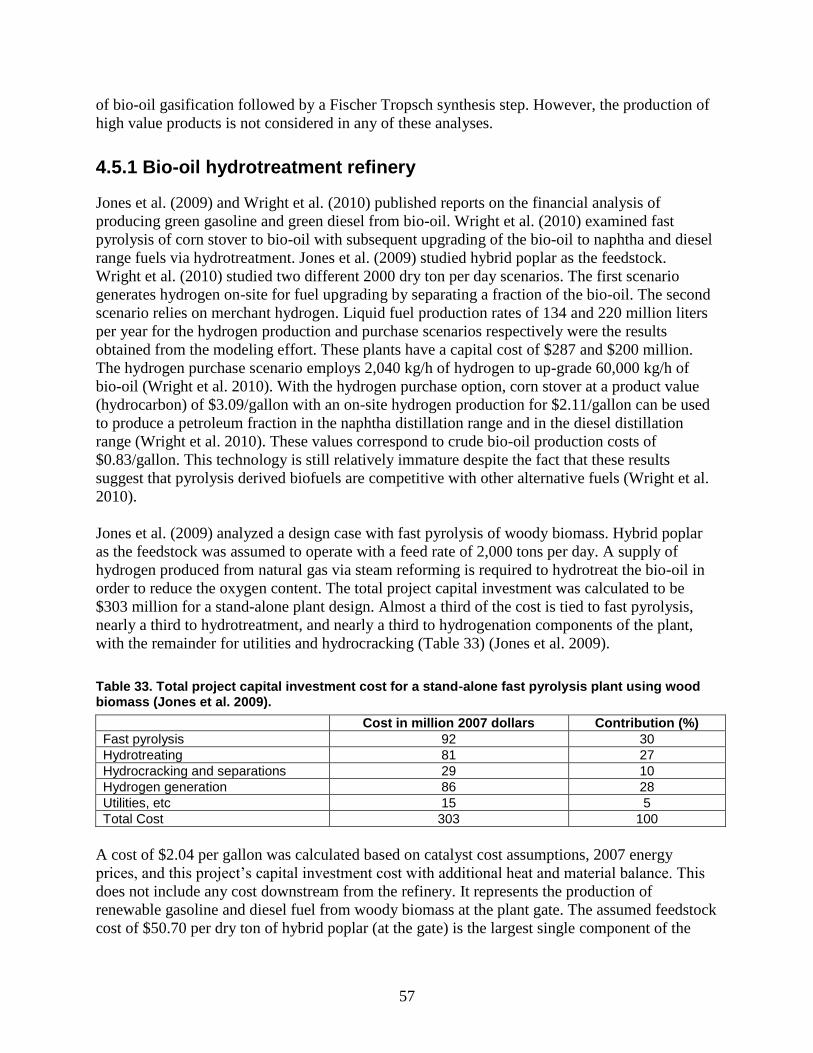
57
of bio-oil gasification followed by a Fischer Tropsch synthesis step. However, the production of
high value products is not considered in any of these analyses.
4.5.1 Bio-oil hydrotreatment refinery
Jones et al. (2009) and Wright et al. (2010) published reports on the financial analysis of
producing green gasoline and green diesel from bio-oil. Wright et al. (2010) examined fast
pyrolysis of corn stover to bio-oil with subsequent upgrading of the bio-oil to naphtha and diesel
range fuels via hydrotreatment. Jones et al. (2009) studied hybrid poplar as the feedstock.
Wright et al. (2010) studied two different 2000 dry ton per day scenarios. The first scenario
generates hydrogen on-site for fuel upgrading by separating a fraction of the bio-oil. The second
scenario relies on merchant hydrogen. Liquid fuel production rates of 134 and 220 million liters
per year for the hydrogen production and purchase scenarios respectively were the results
obtained from the modeling effort. These plants have a capital cost of $287 and $200 million.
The hydrogen purchase scenario employs 2,040 kg/h of hydrogen to up-grade 60,000 kg/h of
bio-oil (Wright et al. 2010). With the hydrogen purchase option, corn stover at a product value
(hydrocarbon) of $3.09/gallon with an on-site hydrogen production for $2.11/gallon can be used
to produce a petroleum fraction in the naphtha distillation range and in the diesel distillation
range (Wright et al. 2010). These values correspond to crude bio-oil production costs of
$0.83/gallon. This technology is still relatively immature despite the fact that these results
suggest that pyrolysis derived biofuels are competitive with other alternative fuels (Wright et al.
2010).
Jones et al. (2009) analyzed a design case with fast pyrolysis of woody biomass. Hybrid poplar
as the feedstock was assumed to operate with a feed rate of 2,000 tons per day. A supply of
hydrogen produced from natural gas via steam reforming is required to hydrotreat the bio-oil in
order to reduce the oxygen content. The total project capital investment was calculated to be
$303 million for a stand-alone plant design. Almost a third of the cost is tied to fast pyrolysis,
nearly a third to hydrotreatment, and nearly a third to hydrogenation components of the plant,
with the remainder for utilities and hydrocracking (Table 33) (Jones et al. 2009).
Table 33. Total project capital investment cost for a stand-alone fast pyrolysis plant using wood biomass (Jones et al. 2009).
Cost in million 2007 dollars Contribution (%)
Fast pyrolysis 92 30
Hydrotreating 81 27
Hydrocracking and separations 29 10
Hydrogen generation 86 28
Utilities, etc 15 5
Total Cost 303 100
A cost of $2.04 per gallon was calculated based on catalyst cost assumptions, 2007 energy
prices, and this project’s capital investment cost with additional heat and material balance. This
does not include any cost downstream from the refinery. It represents the production of
renewable gasoline and diesel fuel from woody biomass at the plant gate. The assumed feedstock
cost of $50.70 per dry ton of hybrid poplar (at the gate) is the largest single component of the
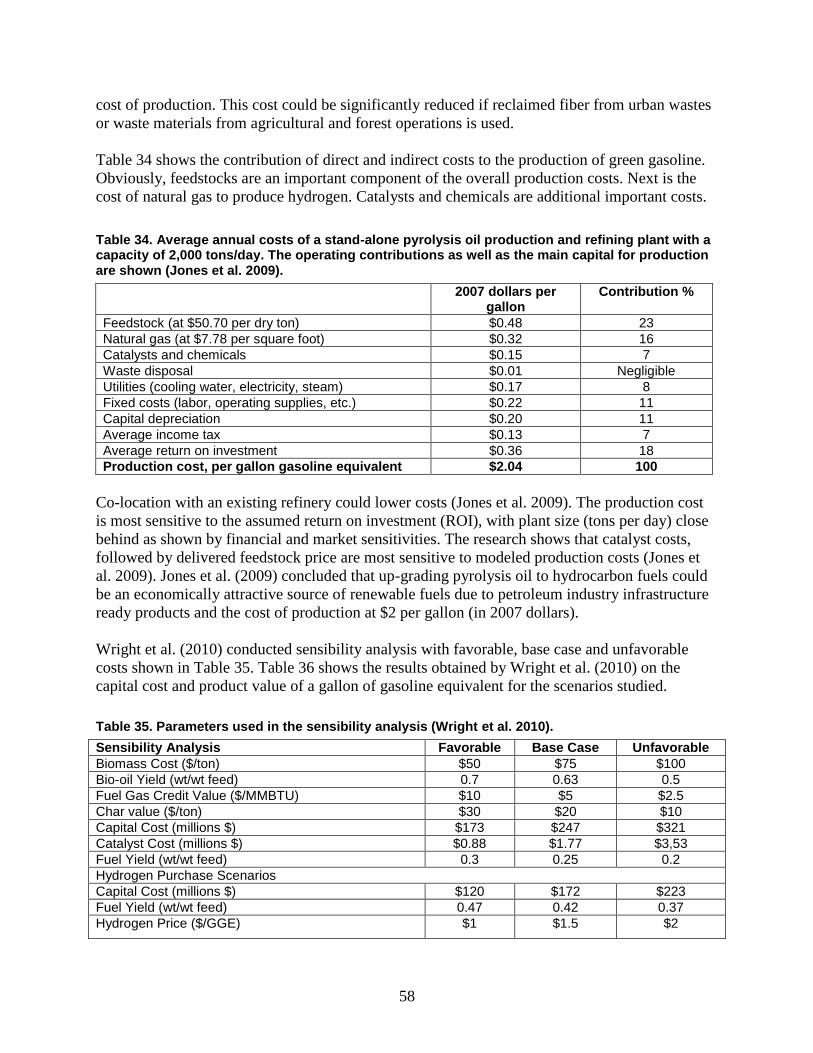
58
cost of production. This cost could be significantly reduced if reclaimed fiber from urban wastes
or waste materials from agricultural and forest operations is used.
Table 34 shows the contribution of direct and indirect costs to the production of green gasoline.
Obviously, feedstocks are an important component of the overall production costs. Next is the
cost of natural gas to produce hydrogen. Catalysts and chemicals are additional important costs.
Table 34. Average annual costs of a stand-alone pyrolysis oil production and refining plant with a capacity of 2,000 tons/day. The operating contributions as well as the main capital for production are shown (Jones et al. 2009).
2007 dollars per gallon
Contribution %
Feedstock (at $50.70 per dry ton) $0.48 23
Natural gas (at $7.78 per square foot) $0.32 16
Catalysts and chemicals $0.15 7
Waste disposal $0.01 Negligible
Utilities (cooling water, electricity, steam) $0.17 8
Fixed costs (labor, operating supplies, etc.) $0.22 11
Capital depreciation $0.20 11
Average income tax $0.13 7
Average return on investment $0.36 18
Production cost, per gallon gasoline equivalent $2.04 100
Co-location with an existing refinery could lower costs (Jones et al. 2009). The production cost
is most sensitive to the assumed return on investment (ROI), with plant size (tons per day) close
behind as shown by financial and market sensitivities. The research shows that catalyst costs,
followed by delivered feedstock price are most sensitive to modeled production costs (Jones et
al. 2009). Jones et al. (2009) concluded that up-grading pyrolysis oil to hydrocarbon fuels could
be an economically attractive source of renewable fuels due to petroleum industry infrastructure
ready products and the cost of production at $2 per gallon (in 2007 dollars).
Wright et al. (2010) conducted sensibility analysis with favorable, base case and unfavorable
costs shown in Table 35. Table 36 shows the results obtained by Wright et al. (2010) on the
capital cost and product value of a gallon of gasoline equivalent for the scenarios studied.
Table 35. Parameters used in the sensibility analysis (Wright et al. 2010).
Sensibility Analysis Favorable Base Case Unfavorable
Biomass Cost ($/ton) $50 $75 $100
Bio-oil Yield (wt/wt feed) 0.7 0.63 0.5
Fuel Gas Credit Value ($/MMBTU) $10 $5 $2.5
Char value ($/ton) $30 $20 $10
Capital Cost (millions $) $173 $247 $321
Catalyst Cost (millions $) $0.88 $1.77 $3,53
Fuel Yield (wt/wt feed) 0.3 0.25 0.2
Hydrogen Purchase Scenarios
Capital Cost (millions $) $120 $172 $223
Fuel Yield (wt/wt feed) 0.47 0.42 0.37
Hydrogen Price ($/GGE) $1 $1.5 $2
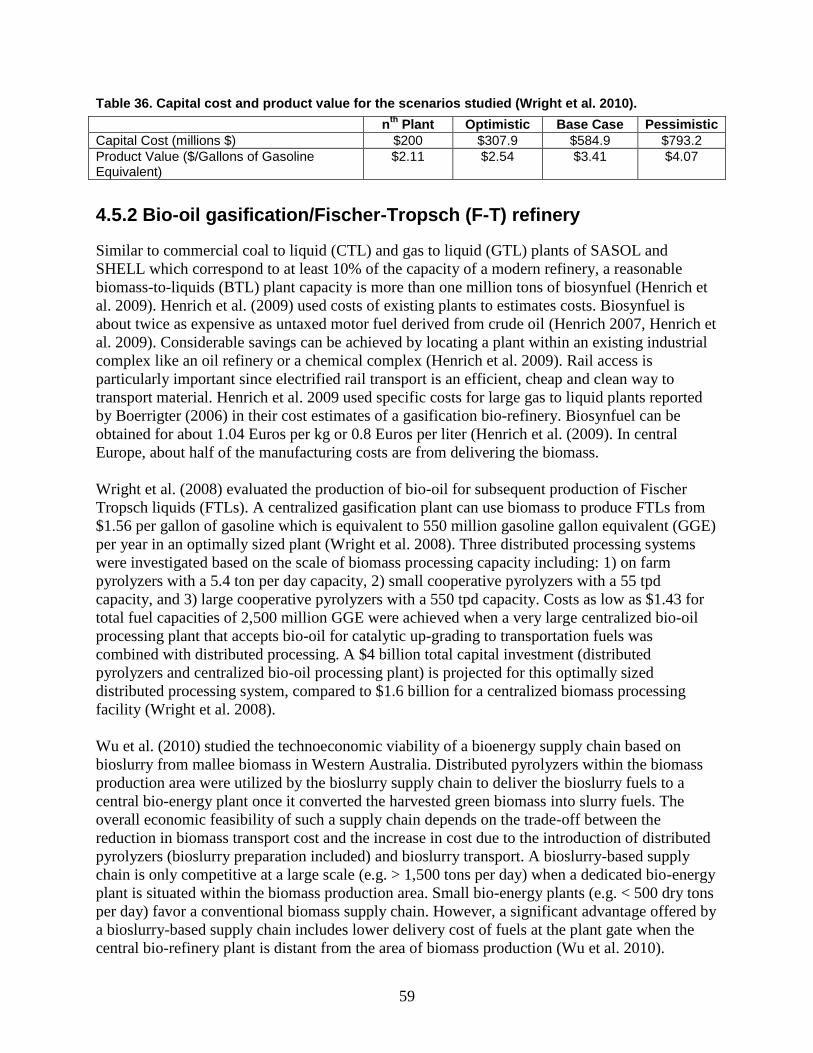
59
Table 36. Capital cost and product value for the scenarios studied (Wright et al. 2010).
nth
Plant Optimistic Base Case Pessimistic
Capital Cost (millions $) $200 $307.9 $584.9 $793.2
Product Value ($/Gallons of Gasoline Equivalent)
$2.11 $2.54 $3.41 $4.07
4.5.2 Bio-oil gasification/Fischer-Tropsch (F-T) refinery
Similar to commercial coal to liquid (CTL) and gas to liquid (GTL) plants of SASOL and
SHELL which correspond to at least 10% of the capacity of a modern refinery, a reasonable
biomass-to-liquids (BTL) plant capacity is more than one million tons of biosynfuel (Henrich et
al. 2009). Henrich et al. (2009) used costs of existing plants to estimates costs. Biosynfuel is
about twice as expensive as untaxed motor fuel derived from crude oil (Henrich 2007, Henrich et
al. 2009). Considerable savings can be achieved by locating a plant within an existing industrial
complex like an oil refinery or a chemical complex (Henrich et al. 2009). Rail access is
particularly important since electrified rail transport is an efficient, cheap and clean way to
transport material. Henrich et al. 2009 used specific costs for large gas to liquid plants reported
by Boerrigter (2006) in their cost estimates of a gasification bio-refinery. Biosynfuel can be
obtained for about 1.04 Euros per kg or 0.8 Euros per liter (Henrich et al. (2009). In central
Europe, about half of the manufacturing costs are from delivering the biomass.
Wright et al. (2008) evaluated the production of bio-oil for subsequent production of Fischer
Tropsch liquids (FTLs). A centralized gasification plant can use biomass to produce FTLs from
$1.56 per gallon of gasoline which is equivalent to 550 million gasoline gallon equivalent (GGE)
per year in an optimally sized plant (Wright et al. 2008). Three distributed processing systems
were investigated based on the scale of biomass processing capacity including: 1) on farm
pyrolyzers with a 5.4 ton per day capacity, 2) small cooperative pyrolyzers with a 55 tpd
capacity, and 3) large cooperative pyrolyzers with a 550 tpd capacity. Costs as low as $1.43 for
total fuel capacities of 2,500 million GGE were achieved when a very large centralized bio-oil
processing plant that accepts bio-oil for catalytic up-grading to transportation fuels was
combined with distributed processing. A $4 billion total capital investment (distributed
pyrolyzers and centralized bio-oil processing plant) is projected for this optimally sized
distributed processing system, compared to $1.6 billion for a centralized biomass processing
facility (Wright et al. 2008).
Wu et al. (2010) studied the technoeconomic viability of a bioenergy supply chain based on
bioslurry from mallee biomass in Western Australia. Distributed pyrolyzers within the biomass
production area were utilized by the bioslurry supply chain to deliver the bioslurry fuels to a
central bio-energy plant once it converted the harvested green biomass into slurry fuels. The
overall economic feasibility of such a supply chain depends on the trade-off between the
reduction in biomass transport cost and the increase in cost due to the introduction of distributed
pyrolyzers (bioslurry preparation included) and bioslurry transport. A bioslurry-based supply
chain is only competitive at a large scale (e.g. > 1,500 tons per day) when a dedicated bio-energy
plant is situated within the biomass production area. Small bio-energy plants (e.g. < 500 dry tons
per day) favor a conventional biomass supply chain. However, a significant advantage offered by
a bioslurry-based supply chain includes lower delivery cost of fuels at the plant gate when the
central bio-refinery plant is distant from the area of biomass production (Wu et al. 2010).
60
5. Technology Improvements and Development of New Products
The economic analyses described in the previous sections should not be reduced to simple cost
estimates, but should be used to identify areas for improvement in an iterative and permanent
process to increase total quality and reduce costs. First generation technologies are unlikely to
result in huge profits. It is through continued research and development efforts to reduce costs
and increase total process quality that these technologies will mature and gradually became
competitive and sustainable. Lynch and Joseph (2010) wrote a detailed methodology for testing,
data collection and safe operation of a pyrolysis plant. Once the plant is in operation, focus
should be maintained on further improving the design (reduce cost or increase total quality or
reduce costs). Figure 20 shows a general strategy for process improvements proposed by Moen
and Nolan (Edosomwan 1996) . This strategy, along with others available in the literature,
should guide research and development actions driving the gradual evolution of pyrolysis units
and bio-oil refineries to build new, better performing units. The Moen and Nolan strategy is an
eleven-step process that makes use of the plan-do-check-act Shewhart scheme to improve
processes. The strategy begins with the selection of the area that will be improved followed by a
continuous improvement cycle (Edosomwan 1996).
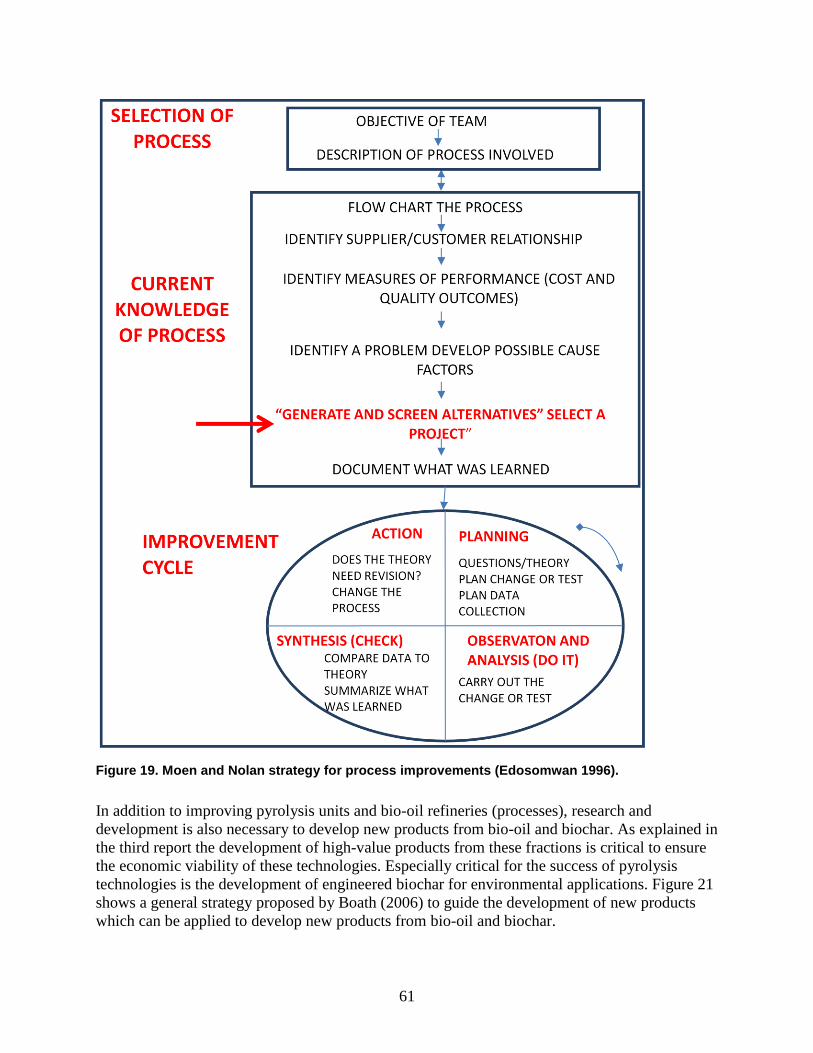
61
Figure 19. Moen and Nolan strategy for process improvements (Edosomwan 1996).
In addition to improving pyrolysis units and bio-oil refineries (processes), research and
development is also necessary to develop new products from bio-oil and biochar. As explained in
the third report the development of high-value products from these fractions is critical to ensure
the economic viability of these technologies. Especially critical for the success of pyrolysis
technologies is the development of engineered biochar for environmental applications. Figure 21
shows a general strategy proposed by Boath (2006) to guide the development of new products
which can be applied to develop new products from bio-oil and biochar.
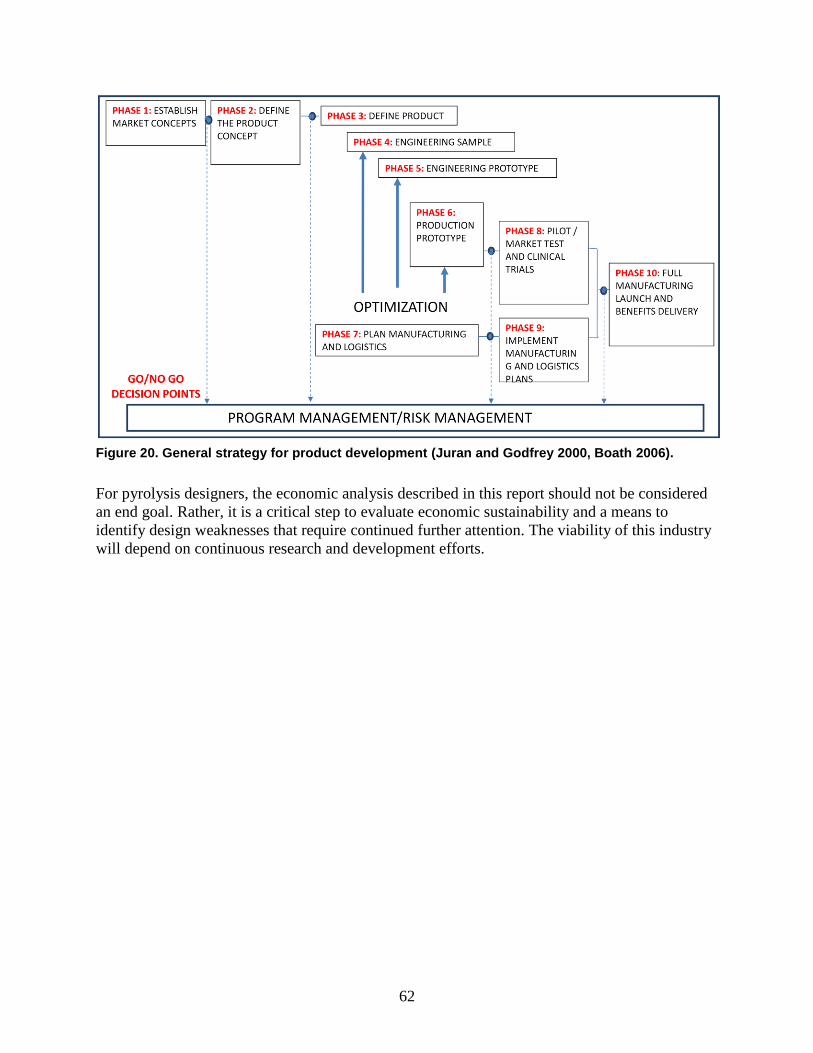
62
Figure 20. General strategy for product development (Juran and Godfrey 2000, Boath 2006).
For pyrolysis designers, the economic analysis described in this report should not be considered
an end goal. Rather, it is a critical step to evaluate economic sustainability and a means to
identify design weaknesses that require continued further attention. The viability of this industry
will depend on continuous research and development efforts.
63
6. Conclusion
Most of the business models described in the literature are based on waste biomass resources
generated from agricultural and forest operations. Very little information is available on
pyrolysis business models using separated fractions from Municipal Solid Wastes. Another
business model with great potential is the use of waste materials generated by existing biomass
processing industries (pulp and paper, sugar cane, palm oil mills) as feedstocks for the pyrolysis
process. A sustainable pyrolysis business model design must incorporate triple top line analysis.
Depending on components of a chosen business model (e.g. co-location, low feedstock prices,
use of waste materials), bio-oil production costs could be competitive (< $0.83/gal) with current
petroleum prices (> $100/ barrel). However, with low petroleum prices, it is very difficult to
develop a viable bio-oil industry for the production of transportation fuels. After the cost of
biomass, the cost of methane to produce hydrogen is the second most important component in
the production of biofuels, according to the financial analysis of bio-oil hydrotreatment
refineries. Development of technologies to produce high-value bio-oil products is vital to the
financial viability of this industry.
The economic analyses should not be reduced to simple cost estimates. The cost structure
obtained is a powerful tool to identify areas susceptible to improvements. First generation
technologies are unlikely to result in huge profits, but through continued research and
development efforts to reduce costs and increase their total quality these technologies will
mature and gradually became competitive and sustainable.
Washington has the entrepreneurial wisdom, technical and research strength, and agency
capacity for developing a biochar industry utilizing local biomass resources. A coordinated effort
of interested stakeholders is needed to drive industry development. Stakeholders include: biochar
reactor technology developers/manufacturers, environmental and agronomic applications
businesses, distributors, government agencies, NGOs, and researchers (Fuchs et al. 2012). All
will be required to support biochar commercialization. While a trade association would be best
for this effort, no such entity currently exists.
The biochar industry could grow based on the example of the wood pellet industry which began
in the 1980s in response to the need for clean burning solid fuel devices as an alternative to fuel
oil for heating homes and small businesses (Fuchs et al. 2012). Nationally, the wood pellet
industry now has numerous appliance manufacturers, hundreds of distributors and employs many
hundreds of installers, not to mention over 80 wood pellet mills nearing a half billion dollars of
capital investment. All of this began in Washington and the Pacific Northwest. Biochar industry
development will occur globally. With pyrolysis business ventures and biochar applications
expanding across the nation, why should leaders in the Pacific Northwest conduct a coordinated
effort to develop this industry? Regionally, we are at the right time and right place with the
technical capability to lead this global industry. Our capability to lead the biochar market sector
development comes from the following strengths:
64
1. Entrepreneurial capability to develop the production technology and field uses in
environmental, agricultural and industrial applications.
2. Pacific Rim location for marketing technology capability and intellectual property.
3. Resource base in our woody refuse and our forest resources to create sustainable carbon
negative solutions and provide technology and capacity for a regional bio-economy.
4. Regional strength in our research centers’ scientists, engineers and extension specialists
to conduct the laboratory and field work to support new applications and develop new
markets for stable, highly porous and adsorptive carbon for expanded environmental
ecological and soils uses.
5. Non-governmental Organization leadership with the regional carbon strategy through the
Northwest Biocarbon Initiative, (Climate Solutions), and activities of International
Biochar Initiative (IBI) and US Biochar Initiative (USBI) have expanded rapidly.
Ideally, a trade association or other group would form to support the industry development.
However, we are at early stages in this industry (Fuchs et al. 2012). Therefore, the leadership of
a team is needed to bring biochar to the market place to provide the numerous environmental
services identified above. Therefore, we recommend forming a support group with the following
functions:
Organizing an industry development effort.
Establishing a trade group and industry practice areas to help organize specific
committees. Committees could include: building robust and expanding markets, industry
marketing for biochar producers, educational needs, consultants and applications,
feedstock biomass resources, environmental, agronomic and forestry applications,
functionalizing biochar for specific characteristics and niche markets, regulatory and
permitting for production facilities.
Identifying funding needs and secure funding sources.
Conducting a needs and opportunities assessment, writing and or coordinating grant
applications with industry partners, agencies, universities and NGOs as necessary to
support the developing industry.
Creating connections among industry technology leaders and developers with regional
and international research leaders and potential investors.
Developing markets for biochar uses for numerous applications.
65
7. References
Amonette, J. 2010. Maximum Sustainable Technical Potential of Biochar to Mitigate Climate
Change. Presented at 2010 U.S. Biochar National Conference, Ames, IA. June 27-30
2010.
Andrews RG, Fuleki D, Zukowski S, and Patnaik PC. 1996. Results of Industrial Gas Turbine
tests Using a Biomass Derived Fuel. In: Developments in Thermochemical Biomass
Conversion Proceedings, Vol. 1, p. 495-506.
Andrews RG, Zukowski S, and Patnaik PC. 1997. Feasibility of Firing an Industrial Ags Turbine
Using a Biomass Derived Fuel. Developments in Thermochemical Biomass Conversion.
AV Bridgwater and DGB Boocock, Eds. Blackie Academic and Professional, London,
UK, 1997, pp. 495-506.
Anex, Robert P., Lee R. Lynd, Mark S. Laser, Andrew H. Heggenstaller, and Matt Liebman.
2007. Potential for Enhanced Nutrient Cycling Through Coupling of Agricultural and
Bioenergy Systems. Crop Science 47, no. 4: 1327.
Annan KA. 2002. A Chance to Secure our Future. Joburg Summit, 2002.
http://www.thejakartapost.com /news/2002/05/30/joburg-summit-a-chance-secure-our-
future.html
Antares Group Inc. 2003. Assessment of Power Production at Rural Utilities Using Forest
Thinning and Commercially Available Biomass Power Technologies. Prepared for the U.S.
Department of Agriculture, U.S. Department of Energy and National Renewable Energy
Laboratory.
AtKisson A. 2001.Sustainability Is Dead – Long Live Sustainability. A Manifesto: Written to
Mark the End of Millennium Two, and the Beginning of Millennium Three.
http://www.rrcap.unep.org/uneptg06/course/Robert/SustainabilityManifesto2001.pdf
Badger P.C. 2002. Processing Cost Analysis for Biomass Feedstock. Preopared for the US
Department of Energy. Under contract DE-AC05-00OR22725. ORNL/TM-2002/199
Badger, P., S. Badger, M. Puettmann, P.H. Steele, and J. Cooper. 2011. Technoeconomic
analysis: Preliminary assessment of pyrolysis oil production costs and material energy
balance associated with a transportable fast pyrolysis system. BioResources 6(1):34-47.
Baglioni P, Chiramonti D, Bonini M, Soldani I, and Tondi G. 2001. Bio-crude-Oil/Diesel Oil
Emulsification: Main Achievements of the Emulsification Process and Preliminary Tests on
Diesel Engine. In: Progresses in Thermochemical Biomass Conversion, Bridgwater AV Ed.
Blackwell Science, Oxford 2001, p. 1525-1539.
Bank GN, Wong JKL, and Whaley H. 1992. Combustion Evaluation and Heat Transfer
Characterization of Fast Pyrolysis Product. Division Report ERL 92-35 (CF) CANMET,
Energy Mines and Resources. Ottawa, Canada.
Baranick M, McElwee D, and Zazycki M. 2011. Biochar Feasility Study: Exploring the
Environmental, Social, and Economic Value of a Biochar Business in the Methow Valley.
MKTG 591: Sustainable Business Practicum, June 9, 2011, Seattle University.
66
http://www.biochar-
international.org/sites/default/files/Biochar_Final_Paper_For_Distribution_v9.29.pdf
Barbucci P, Constanzi F, Lagasacchi S, Mosti A, and Rossi C. 1995. Bio-fuel Oil Combustion in
a 0.5 MW Furnace. In: Proceeding of the Second Biomass Conference of the Americas
NREL/CP 200-8090, Golden, CO.
Bertoli C, D’Alessio J, Del Giacomo N, Lazzaro M, Massoli P, and Moccia V. 2000. Running
Light Duty DI Diesel Engines with Wood Pyrolysis Oil. SAE Technical Paper Series,
International Fall Fuels and Lubricants Meeting and Exposition, Baltimore, Maryland,
October 16-19, 2000, Document number: 2000-01-2975.
Boateng AA, Mullen CA, Goldberg N, Hicks KB, Jung H-J G and Lamb JFS. 2008. Production
of Bio-oil from Alfafa Stems by Fluidized-Bed Fast Pyrolysis. Ind. Eng. Chem. Res. 47,
4115-4122.
Boath D. 2006. Reengineering the Product Development Process. Proceedings of Symposium on
Managing for Quality in Research and Development. Juran Institute, Wilton CT, p. 2B-36.
Boerrigter H. 2006. Economy of Biomass to Liquid (BTL) Plants: An Engineering Assessment,
ECN-C-06-019. http://www.ecn.nl/publications/ECN-C--06-019
Boyd DR. 2004. Sustainability within a Generation: A New Vision for Canada. David Suzuki
Foundation. http://www.davidsuzuki.org/publications/downloads/2004/DSF-GG-En-
Final.pdf
Bracmort KS. 2009. Biochar: Examination of an Emerging Concept to Mitigate Climate Change.
February 2009, Congressional Research Service.
http://assets.opencrs.com/rpts/R40186_20090203.pdf
Bradley D. 2006. European Market Study for BioOil (Pyrolysis Oil), Dec. 15, 2006. Climate
Change Solutions. IEA Bioenergy Task 40. Bio-Trade.Brammer JG, Lauer M, and
Bridgwater AV. 2006. Opportunities for Biomass-derived “Bio-oil” in European Heat and
Power Markets. Energy Policy 34 (2006) 2871-2880.
Brammer, J.G., Bridgwater, A.V., Lauer, M., and Jungmeier, G. 2005. Opportunities for Bio-oil
in European Heat and Power Markets. In: Bridgwater, A.V. (Ed.), Fast Pyrolysis of Biomass:
a Handbook, vol. 3. CPL Press, Newbury, pp. 179-204.
Bridgwater, A.V., Toft, A.J., and Brammer, J.G. 2002. A Technoeconomic Comparison of Power
Production by Biomass Fast Pyrolysis with Gasification and Combustion. Energy Rev. 6,
181-248.
Brown RC. 2003. Bioreneable Resources: Engineering New Products from Agriculture. Iowa
State Press. Ames, IA.
Catoire L, Yahyaoui M, Osmont A, Gokalp I, Brothier M, Lorcet H, and Guenadou D. 2008.
Thermochemistry of Compounds Formed During Fast Pyrolysis of Lignocellulosic Biomass.
Energy & Fuels 22, 6, 4265-4273.
Chan, K. Y., and Xu, Z. 2009. Biochar: Nutrient Properties and Their Enhancement. In: Biochar
for Environmental Management: Science and technology (pp. 67-84). Johannes Lehmann &
S. Joseph (Eds.),. London, UK: Earthscan.
67
Chiaramonti D, Bonini M, Frantini E, Tondi G, Garter K, Bridgwater AV, Grimm HP, Soldani I,
Webster A, and Baglioni P. 2003. Developments of Emulsions from Biomass Pyrolysis
Liquid and Diesel and their Use in Engines. Part 1.- Emulsion Production. Biomass &
Bioenergy 25, p. 85-99, Part 2: Test in Diesel Engines. Biomass & Bioenergy, 25, p. 101-
111.
Chiaramonti D, Oasmaa A, and Solantausta Y. 2007. Power Generation Using Fast Pyrolysis
Liquids From Biomass. Renewable and Sustainable Energy Reviews. Volume 11, Issue 6,
1056-1086.
Cole Hill Associates. 2004 Bio-oil Commercialization Plan. Report prepared for the New
Hampshire Office of Energy and Planning.
http://www.nh.gov/oep/programs/energy/documents/appendixanhbio-
oilcommercializationplan.pdf
Constanza R, d’Arge R, de Groot R, Farber S, Grasso M , Hannon B, Limburg K, Naeem S,
O’Neill RV, Paruelo J, Raskin RG, Sutton P, van den Belt M. 1997. The value of the world’s
ecosystem services and natural capital. Nature, 387 pp 253-260.
Constanza R, d’Arge R, de Groot R, Farber S, Grasso M , Hannon B, Limburg K, Naeem S,
O’Neill RV, Paruelo J, Raskin RG, Sutton P, van den Belt M. 1998. The value of the world’s
ecosystem services and natural capital. Ecological Economics, Volume 25, Number 1, April
1998, pp. 3-15 (13).
Cottam M and Birdgwater A.1994. Techno-Economic Modeling of Biomass Flash Pyrolysis and
Up-grading Systems. Biomass Bioenergy 7 (1): 267-73.
Cowie A. 2010. Ensuring Sustainability of Biochar: Learning from the Experience of Bio-
energy. Presented at IBI 2010, Rio de Janeiro, Brazil. http://www.ibi2010.org/wp-
content/uploads/Cowie_IBI_13Sept2010_sustainability.pdf
Czernik S and Bridgwater AV. 2004. Overview of Applications of Biomass Fast Pyrolysis Oils.
Energy & Fuels 18 (2), p. 590-598.
Daly, HE. 2005. Economics in a Full World. Scientific American, 293(3), 100-7.
Daugaard DE and Brown R. 2003. Enthalpy for Pyrolysis for Several Types of Biomass. Energy
& Fuel 17, 934-939.
De Gryze S, Cullen M, and Durschinger L. 2010. Evaluation of the Opportunities for Generating
Carbon Offsents from Soil Sequestration of Biochar. Paper commissioned by the Climate
Action Reserve. April 2010.
http://terraglobalcapital.com/press/Soil_Sequestration_Biochar_Issue_Paper1.pdf
Diamant A. 2011. Blue Sky Approaches to Reduce Greenhouse Gas Emissions. An Initial
Assessment of Potential New Types of Greenhouse Gas Emissions Offsets. 1023662.
Technical Update, December 2011.
http://www.epri.com/abstracts/Pages/ProductAbstract.aspx?ProductId=00000000000102366
2
68
Domalski ES, Jobe TL and Milne TA. 1986. Thermodynamic Data for Biomass Conversion and
Waste Incineration. A Product of the Solar Technical Information Program of the Solar
Energy Research Institute. http://www.nrel.gov/biomass/pdfs/2839.pdf
Ecology, 2011. Solid Waste in Washington State, 20th Annual Status Report. Washington
Department of Ecology. ECY Publication No. 11-07-039.
https://fortress.wa.gov/ecy/publications/publications/1107039.pdf
Ecology and Cascadia Consulting Group, 2010. 2009 Washington Statewide Waste
Characterization Study. Washington Department of Ecology. ECY Publication No. 10-07-
023 https://fortress.wa.gov/ecy/publications/publications/1007023.pdf
Edosomwan JA. 1996. Organizational Transformation and Process Reengineering. St. Lucie
Press and The Quality Observer Corporation.
Emrich W: Handbook of biochar Making. The Traditional and Industrial Methods. 1985, D.
Reidel Publishing Company, 1985.
Farag IH, LaClair CE and Barrett C. 2002. Technical, Environmental and Economic Feasibility
of Bio-oil in New Hampshire’s North County. UNH Project Number 14B316 or ABAN-URI-
B043.
Felder RM, Rousseau RW. 2005. Elementary Principles of Chemical Processes. Third Edition.
John Wiley & Sons.
Flora G. 2012. Biochar: The Sustainability Challenge. US Biochar Initiative.
http://2012.biochar.us.com/382/biochar-sustainability-challenge
Flora, G. 2010a. The Human Dimension: Building Support for Biomass to Biochar Projects. US
Biochar Initiative Conference, June 27-30, 2010 Iowa State University, Bioeconomy
Institute. http://www-archive.biorenew.iastate.edu/events/biochar2010/conference-
agenda/agenda-overview/creating-positive-communitysocial-impacts-with-biochar-
projects.html
Flora, G. 2010b. The Post Carbon Reader Series: Culture and Behavior. Remapping
Relationships: Humans in Nature. http://www.scribd.com/doc/63608047/CULTURE-AND-
BEHAVIOR-Remapping-Relationships-Humans-in-Nature-by-Gloria-Flora
Fournier J. 2012. Biochar’s Role in Global Carbon Management. 3rd
International Biochar
Initiative Conference. Rio de Janeiro, September 13, 2012. http://www.ibi2010.org/wp-
content/uploads/fournier.pdf
Freel BA, Graham RG and Huffman DR. 1990. The Scale Up and Development of Rapid
Thermal Processing (RTP) to Produce Liquid Fuels from Wood. Ontario Ministry of Energy
Report (CF), Toronto, Canada.
Freel BA and Huffman DR. 1998. Applied Bio-oil Combustion. Proceedings: Workshop on
Biomass Pyrolysis Oil Properties and Combustion. Estes Park, CO. 1994, p. 309-315.
Frigo S, Gentilli R, Tognotti L, Zanforlin S and Benelli G. 1998. Feasibility of Using Wood
Flash Bio-oil in Diesel Engines. SAW Technical Paper Series, 982529.
Fuchs M, Garcia-Perez M and Sjoding D. 2012. Biochar: Background and Early Steps to Market
Development: Biochar Industry Opportunities in the Pacific Northwest. WA Department of
69
Ecology. Publication number is: 12-07-067.
https://fortress.wa.gov/ecy/publications/SummaryPages/1207067.html
Garcia-Perez M, Wang S-X, Shen J, Rhodes MJ, Tian F, Lee W-J, Wu H, and Li C-Z. 2008. Fast
Pyrolysis of Oil Mallee Woody Biomass: Effect of Temperature on the Yield and Quantity of
Pyrolysis Products. Ind. Eng. Chem. Res. 47, 1846-1854.
Global Industry Analysis Inc. 2012. Activated Carbon - Global Strategic Business Report.
http://www.researchandmarkets.com/research/6a0de3/activated_carbon
Granatstein D, Kruger C, Collins H, Garcia-Perez M and Yoder J. 2009. Use of Biochar from the
Pyrolysis of Waste Organic Material as a Soil Amendment. Report Submitted by the Center
for Sustainable Agriculture and Natural Resources, Washington State University to the WA
Department of Ecology. http://www.ecy.wa.gov/pubs/0907062.pdf.
Grant D, Hess RJ, Kenney K, Laney P, Muth D, Pryfogle P and Wright C. 2006. Feasibility of a
Producer Owned Ground Straw Feedstock Supply System for Ethanol and Other Products.
Idaho National Laboratory. Prepared Under Contracts: DOE Office of Biomass DE-AC07-
05ID145167, USDA Rural Business Cooperative Service producer Grant 12-034-82036979.
http://www.inl.gov/bioenergy/projects/d/1001_feasibility.pdf
Gregoire CE. 1992. Technoeconomic Analysis of the Production of Bio-crude from Wood.
NREL/TP-430-5435. Natural Renewable Energy Laboratory. Golden, CO.
Gregoire CE and Bain R. 1994. Technoeconomic Analysis of the Production of Bio-crude from
Wood. Biomass Bioenergy 7 (1-6) 275-83.
Gross S. 1995. Pyrolysis liquid as Diesel Fuel. Wartsila Diesel International. In: Seminar on
Power Production from Biomass II, 27-28.3. Espoo, Finland.
Gust S. 1994, 1995, 1996. Combustion Experiences of Flash Pyrolysis Fuel and Intermediate
Size Boilers, Project Progress Reports (CF). Porvoo, Finland.
Gust S. 1997. Combustion experiences of Flash Pyrolysis Fuel in Intermediate Size Boiler. In:
Developments. In: Thermochemical Biomass Conversion, p. 481-488. Bridgwater AV,
Boocock DGB, Eds: Blackie academic & Professional: London.
Henrich E. 2007. The Status of the FZK Concept of Biomass Gasification. 2nd
European Summer
School on Renewable Motor Fuels. August 29-31, 2007 Warsaw, Poland.
Henrich, E., Dahmen, N. and Dinjus, E. 2009. Cost Estimate for Biosynfuel Production via
Biosyncrude Gasification. Biofuels, Bioproducts and Biorefining, 3(1), pp.28-41.
Himmel M, Tucker M, Baker J, Rivard C, Oh K and Grohman K. 1985.Comminution of
Biomass: Hammer and Knife Mills. Biotechnology and Bioenergy Symposium, No 15. John
Wiley & Sons Inc. 1985.
Himmelblau DM and Riggs JB. 2004. Basic Principles and Calculations in Chemical
Engineering. Seventh Edition. Prentice Hall International Series in the Physical and
Chemical Engineering Sciences.
Holmgreen J, Nair P, Elliot D, Bain R andMarinangeli R. 2008. Converting Pyrolysis Oils to
Renewable Transportation Fuels: Processing Challenges & Opportunities. National
Pretrochemical & Refineries Annual Meeting, San Diego, CA.
.
70
Hsu DD. 2011. Life Cycle Assessment of Gasoline and Diesel Produced via Fast Pyrolysis and
Hydroprocessing. Technical Report. NREL/TP-6A20-49341, Under Contract No. DE-AC36-
08GO28308.
International Biochar Initiative (IBI). Biochar and Sustainability. http://www.biochar-
international.org/sustainability; retrieved 1/18/13
International Biochar Initiative (IBI). 2012. IBI Biochar Sustainability Principles.
http://www.biochar-
International.org/sites/default/files/IBI_Biochar_Sustainability_Principles_September_2012.
International Biochar Initiative (IBI). 2012. Standardized Product Definition and Product Testing
Guidelines for Biochar That is Used in Soil. http://www.biochar-
international.org/sites/default/files/Guidelines_for_Biochar_That_Is_Used_in_Soil_Final.pdf
Islam, MN and Ani FN. 2000. Technoeconomics of Rice Husk Pyrolysis, Conversion with
Catalytic Treatment to Produce Liquid Fuel. Bioresource Technology, Vol. 73, pp. 67-75.
Jay DC, Sipila KH, Rantanen OA and Nylund NO. 1995. Wood Pyrolysis Oil for Diesel Engines.
ICE-Vol. 25-3 Fall Technical Conference. Volume 3 ASME, p. 51-59.
Jones SB, Valkenburg C, Walton CW, Elliott DC, Holladay JE, Stevens DJ, Kinchin C, Czernik
S: Production of gasoline and diesel from biomass via fast pyrolysis, hydrotreating and
hydrocracking: a design case. PNNL February 2009, Prepared for the US Department of
Energy under Contract DE-AC05-76RL01830.
Jones G and Anderson N. 2011. Biochar Research: Biomass and Pyrolysis Projects at RMRS
Human Dimensions. Rocky Mountain Research Station. Biomass to Biochar Symposium.
March 21, 2011.
Juran JM, Godfrey AB: Junan’s Quality Handbook. McGraw-Hill Professionals 2000.
Kearns, J. 2012. Using Biochar for Water Filtration in Rural South East Asia,
http://www.biochar-international.org/profile/water_filtration.
Kuppens, T, Cornelissen T, Carleer R, Yperman J, Schreurs S, Jans M, Thewys T: 2010.
Economic assessment of flash co-pyrolysis of short rotation coppice and biopolymer waste
streams. Journal of Environmental Management, 91(12), pp.2736-2747.
Lee SW. 1993. Preliminary Combustion Evaluation of Wood Derived Fast Pyrolysis Liquids
Using a Residual Burner. Division Report ERL 93-29 (CF) CANMET. Energy Mines and
Resources Canada, Ottawa, Canada
Leech J. 1997. Running a Dual Fuel Engine on Pyrolysis Oil. In: Biomass Gasification and
Pyrolysis, State of the Art and Future Prospects. Kaltschmitt M, Bridgwater AV. Eds. CPL
Press: Newbury, p. 495-497.
Lopez Juste G, Salva Monfort JJ. 2000. Preliminary Test on Combustion of Wood Derived Fast
Pyrolysis Oils in a Gas Turbine Combustor. Biomass & Bioenergy 19, pp. 119-128.
Lovins LH. 2004. Natural Capitalism: Path to Sustainability? Natural Resources and
Environment, American Bar Association.
http://www.natcapsolutions.org/publications_files/ABA_Path_to_Sustainability.pdf
71
Lovins LH. 2002. Small is Profitable. The Hidden Economic Benefits of Making Electrical
Resources the Right Size. Rocky Mountain Institute. Snowmass, CO.
Lynch J and Joseph S. 2010. Guidelines for the Development and Testing of Pyrolysis Plants to
Produce Biochar. http://www.biochar-international.org/sites/default/files/IBI-Pyrolysis-Plant-
Guidelines.pdf
Mani S, Tabil L and Sokhansanj S. 2004. Grinding Performance and Physical Properties of
Wheat and Barley Straws, Corn Stover and Switchgrass. Biomass Bioenergy, 27 (4) 339-52.
Marker TL. 2005. Opportunities for Biorenewables in Oil Refineries. Final Technical Report.
United States DOEGO15085. Des Plains, IL.
MBDC. 2010. Sustainable Business: Minimization vs. Optimization. Optimisation (p. 15).
Charlottesville, VA.
http://www.globalcitizen.net/data/topic/knowledge/uploads/20110803114637705.pdf
McDonough, W. and Braungart, M. 2002. Beyond the Triple Bottom Line: Design for the Triple
Top Line. http://www.mcdonough.com/writings/beyond_triple.htm.
Miles T. 2009. Converting Wood and Straw to Biochar for Agriculture. North American Biochar
Conference, August 9-12, 2009, Boulder, CO.
http://cees.colorado.edu/biochar_production.html.
Miles T. 2010. Biochar Origins, Markets, Products, and Processes. Washington Future Energy
Conference. http://www.futureenergyconference.com/2010/FECWA-
Presentations/4D_Miles.pdf
Millennium Ecosystem Assessment, 2005. Ecosystems and Human Well-being: Synthesis. Island
Press, Washington, DC.
http://www.millenniumassessment.org/documents/document.356.aspx.pdf
Naimi LJ, Sokhansanj S, Mani S, Hoque M, Bi T, Womac AR andNarayan S. 2006. Cost and
Performance of Woody Biomass Size Reduction for Energy Production. Paper written for the
CSBE/SCGA 2006 Annual Conference. Edmonton, Alberta, July 16-19, 2006.
Oasmaa A, Kyto M and Silipa K. 2001. Pyrolysis Oil Combustion Test in an Industrial Boiler.
In: Proceedings in Thermochemical Biomass Conversion. Bridgwater AV, Ed, Blackwell
Sciences: Oxford; p. 1468-1481.
Ormrod D and Webster A. 2000. Progression in Utilization of Bio-oils in Diesel Engines. PyNe
Newsletter, 2000, 10, 15.
Peacock GVC, Bridgwater AV and Brammer JG. 2006. Technoeconomic Assessment of Power
Production from the Wellman and BTG Fast Pyrolysis Processes. In: Science in Thermal and
Chemical Biomass Conversion. Bridgwater AV, Boocock DG, editors. CPL Press, p. 1785.
Perlack RD and Hess JR. 2006. Biomass resources for liquid fuels production. 28th
. Symposium
of Biotechnology for Fuels and Chemicals. April 30–May 3, Nashville, TN.
Peters, M., Timmerhaus, K.D. and West, R.E., 2003. Plant design and economics for chemical
engineers. 5th ed., New York: McGraw-Hill.
Pootakham T and Kumar A. A Comparison of Pipeline vs. Truck Transport of Bio-oil.
Bioresource Technol. 2010, Jan, 101, 414-424.
72
Rath J, Wolfinger MG, Steiner G, Krammer G, Barontini F and Cozzani V. 2003. Heat of Wood
Pyrolysis. Fuel 82, pp 81-91.
Ringer, M., Putsche, V. and Scahill, J. 2006. Large-scale Pyrolysis Oil Production: a Technology
Assessment and Economic Analysis. Technical Report NREL/TP-510-37779. NREL,
Golden, CO. Available at: http://www.osti.gov/bridge.
Roberts K, Gloy B, Joseph S, Scott N and Lehmann J. 2010. Life Cycle Assessment of Biochar
Systems: Estimating the Energetic, Economic and Climate Change Potential. Environmental
Science and Technology, 44, 827-833.
Rogers JG and Brammer JG. 2009. Analysis of Transport Costs for Energy Crops for Uuse in
Biomass Pyrolysis Plant Networks. Biomass and Bioenergy 33, 1367-1375.
Rogers JG and Brammer JG. 2012. Estimation of the Production cost of fast pyrolysis bio-oil.
Biomass and Bioenergy 36, 209-217.
Rossi C, Frandi R, Bonfitto E, Jacoboni S, Pitone L and Mattiello M. 1993. Combustion Tests of
Bio-oils from Biomass Slow Pyrolysis. In: Advances in Thermochemical Biomass
Conversion. Bridgwater AV. Ed. Blackie Academic & Professional. London, p. 1205-1213.
Sadaka S, Ghaly AE and Sabbah MA. 2002. Two-phase Biomass Air-steam Gasification Model
for Fluidized Bed Reactors: Part III–Model Validation. Biomass and Bioenergy 22, 479-487.
Salvi G and Salvi G Jr. 1991. Pyrolytic Products Assessment Study. Report from Commission of
European Community, Contract No. EN3B-0191-1 (CH).
Schaeffer K. 2011. Activated Carbon Market Supply and Demand Upgrade- or the Carbon
Conundrum. Water Conditioning & Purification, June 2011, 22-14
Shen J, Wang X-S, Garcia-Perez M, Mourant D, Rhodes M and Li C-Z. 2009. Effect of Particle
Size on the Fast Pyrolysis of Oil Mallee Woody Biomass. Fuel 88, 1810-1817.
Shihadeh A and Hochgreb S. 2000. Diesel Engines Combustion of Biomass Pyrolysis Oils.
Energy & Fuels, 14, p. 260-274.
Shihadeh A, Lewis P, Manurung R and Beer J. 1994. Combustion Characterisation of Wood-
derived Flash Pyrolysis Oils in Industrial Scale Turbulent Diffusion Flames. In: Proceedings
of Biomass Pyrolysis Oil Properties and Combustion Meeting. Eastes Park, CO, September
26-28, 1994. NREL-CP-430-7215, p. 281-295.
Simmons FC, 1957. Guides to Manufacturing and Marketing Charcoal in the Northwestern
States. USDA Forest Service Station Paper No. 95, Upper Darby, PA
Siemons, R.V. 2002. A Development Perspective for Biomass-fuelled Electricity Generation
Technologies e Economic Technology Assessment in View of Sustainability. Universiteit
van Amsterdam, Amsterdam.
Siemons, R.V. 2005. Pyrolyse in Groningen. Onderzoek naar de haalbaarheid van een
transitiecoalitie. Eindrapport. MARGE Nederland b.v., Enschede.
Sinnott RK. 2007. Chemical Engineering Design. Coulson & Richardson’s Chemical
Engineering Series Volume 6. Fourth Edition. Elsevier.
73
Sohi S, Lopez-Capel E, Krull E and Bol R. 2009. Biochar, Climate Change and Soil: A Review
to Guide Future Research. CSIRO Land and Water Science Report 05/09, 64 p.
http://www.csiro.au/resources/Biochar-climate-change-and-soil
Solantausta Y, Beckman D, Bridgwater AV, Diebold JP and Elliott DC. 1992. Assessment of
Liquefaction and Pyrolysis Systems. Biomass and Bioenergy. Vol. 2, pp. 272-297.
Solantausta Y and Huetair J. 2000. Power Production for Wood Comparision of the Rankin
Cycle to Concepts Using Gasification and Fast Pyrolysis in VTT. Research note 22. In: IEA
bioenergy task 22 technoeconomic assessment for bioenergy application 1998-1999, 2000.
Solantausta Y, Nylund NO and Gust S. 1994. Use of Pyrolysis Oil in a Test Diesel Engine to
Study the Feasility of a Diesel Power Plant Concept. Biomass and Bioenergy, 7, 297-306.
Solantausta Y, Nylund NO, Westerholm M, Koljonen T and Oasmaa A. 1993. Wood Pyrolysis
Oil as Fuel in a Diesel Power Plant. Bioresour. Technol. 46, p. 177-188.
Spath P, Aden A, Eggeman T, Ringer M, Wallace B and Jechure J. 2005. Biomass to Hydrogen
Production Detailed Design and Economics Utilizing the Battelle Columbus Laboratory
Indirectly – Heated Gasifier. Technical Report NREL/TP-510-37408 May 2005.
http://www.nrel.gov/docs/fy05osti/37408.pdf
Steiner C, Rademakers L and Blum WE. 2010. Biochar Carbon Sequestration. In: Tropical Land
Use Systems. Presented at the 2010 International Biochar Initiative Conference, Rio de
Janeiro, Brazil. http://www.ibi2010.org/wp-content/uploads/TropicalLandUseSteiner.pdf
Strenziok R, Hansen U. 2001. Kunster H: Combustion of Bio-oil in Gas Turbine. In: Progress in
Thermochemical Biomass Conversion, Bridgwater AV, Ed.: Blackwell Sciences: Oxford, pp.
1452-1458
Suppes GJ, Natarajan VP and Chen A. 1996. Autoignition of Selected Oxygenated Fuels in
Simulated Diesel Engines environment, Paper (74 e) presented at the AIChE national
Meeting, New Orleans, LA, February, 26, 1996.
Taghizadeh-Toosi A, Clough TJ, Condron LM, Shelock RR, Anderson CR, Craigie RA: Biochar
Incorporation into Pasture Soil Suppresses in situ Nitrous Oxide Emissions from Ruminant
Urine Patches. Journal of Environmental Quality. Volume 40. March-April 2011 pp. 468-476
US Environmental Protection Agency (EPA). 2007. Biomass Combined Heat and Power Catalog
of Technologies. September 2007.
US Department of Energy (US DOE) Biomass Multi-Year Program Plan. November 2010. US
Department of Energy/Energy Efficiency & Renewable Energy 2010.
http://www1.eere.energy.gov/biomass/pdfs/biomass_mypp_november2010.pdf
Van de Kamp WL and Smart JP. 1993. Atomization and Combustion of Slow Pyrolysis Biomass
oil: In: Advances in Thermochemical Biomass Conversion. Bridgwater AV. Ed. Blackie
Academic & Professional, London, p. 1265-1274.
Van de Kamp WL and Smart JP. 1991. Evaluation of the Combustion Characteristics of
Pyrolysis Oils Derived from Biomass. Prepared for the 7th
European Conference on Biomass
for Industry and Energy, Greece, 1991.
74
Van de Velden M and Baeyens, J. 2006. Fast Pyrolysis of Biomass in a Circulating Fluidized
Bed (CFB). ThermalNet 3, 4-8.
Van de Velden M, Baeyens, J and Boukis I. 2008. Modeling CFB Biomass Pyrolysis Reactors.
Biomass Bioenergy 32, 128-139.
Venderbosch, R.H., Gansekoele, E., Florijn, J.F., Assink, D., Ng, H.Y. 2006. Pyrolysis of Palm
Oil Residues in Malaysia. ThermalNet 1, 2-3.
Verheijen F, Jeffery S, Bastos AC, van der Velde M and Diafas I. 2010. Biochar Application to
Soils. A Critical Scientific Review of Effects on Soil Properties, Processes and Functions.
EUR 24099 EN, European Community JRC Scientific and Technical Report, Office of the
Official Publications of the European Communities, Luxembourg 149 pp.
http://eusoils.jrc.ec.europa.eu/esdb_archive/eusoils_docs/other/eur24099.pdf
Verheijen FGA and Montanarella L. 2010. Biochar-Sustainability, Certification and Legislation.
European Commission. Presented at 2010 IBI Conference, Rio de Janeiro, Brazil.
http://www.ibi2010.org/wp-content/uploads/Montanarella1.pdf
Washington State Department of Ecology. 2012. Solid Waste and Recycling Data. Retrieved
from: http://www.ecy.wa.gov/programs/swfa/solidwastedata/disposal/TippingFees.pdf
Weisberg P, Delaney M and Hawkes J. 2010.Carbon Market Investment Criteria for Biochar
Projects. Public Interest Energy Research (PIER) Program. Final Project. Report. September
2010, Contract Number: 500-238-1915: http://www.biochar-
international.org/sites/default/files/WestCARB %20Biochar%20 Report%20Final.pdf
Westerhof RJM, Brilman DW, Garcia-Perez M, Wang Z, Oudenhoven SRG, van Swaaij WPM,
and Kersten SRA. Fractional Condensation of Biomass Pyrolysis Vapors.Energy Fuels, 2011,
25 (4) pp 1817-1829
Westerhof RJM, Kuipers NJM, Kersten SRA, and van Swaaij WPM. 2007. Controlling the
Water Content of Biomass Fast Pyrolysis Oil. Ind. Eng. Chem. Res. 46, 9238-9247
Westerhof RJM, Nygard H, van Swaaij WPM, Kersten SRA and Brilman DWF. 2012. Effect of
Particle Geometry and Mircrostructure on Fast Pyrolysis of Beech Wood. Energy Fuels, 26
(4).
Whitfield J. 2012. Getting the Biochar Industry up to Speed: What Can We Learn from the Pellet
Business? http://www.biochar-international.org/gettingthebiocharindustryuptospeed
Woolf, D., Amonette, J. E., Street-Perrott, F. A., Lehmann, J., and Joseph, S. 2010. Sustainable
Biochar to Mitigate Global Climate Change. Nature Communications, 1(5), 56.
Wright M, Brown R, and Boateng AA. 2008. Distributed Processing of Biomass to Bio-oil for
Subsequent Production of Fischer-Tropsch Liquids. Biofuels, Bio-products & Biorefining.
229-238.
Wright, M.M. et al. 2010. Technoeconomic Analysis of Biomass Fast Pyrolysis to
Transportation Fuels. Fuel, 89, p.S2-S10.
Wright MM, Satrio JA, Brown RC, Daugaard DE and Hsu DD. 2010. Technoeconomic Analysis
of Biomass Fast Pyrolysis to Transportation Fuels. Technical Report. NREL/TP-6A20-
75
465886, Nov. 2010. Contract No. DE-AC36-08GO28308.
http://www.nrel.gov/docs/fy11osti/46586.pdf
Wu, H, Yu Y and Yip K. 2010. Bioslurry as a Fuel 1. Visbility of a Bioslurry-Based Supply
Chain for Mallee Biomass in Western Australia. Energy Fuels 24, 5652-5659.
Xu R, Ferrante L, Hall K, Briens C and Berruti F. 2011. Thermal Self-sustainability of Biochar
Production by Pyrolysis. Journal of Analytical and Applied Pyrolysis 91, 55-56.
Yoder J, Galinato S, Granatstein D and Garcia-Perez M. 2011. Economic Tradeoff between
Biochar and Bio-oil Production via Pyrolysis. Biomass and Bioenergy Volume 35, 5, 1851-
1862.
Yu Y and Wu H. 2010. Bioslurry as a Fuel 2: Life-Cycle Energy and Carbon Footprints of
Bioslurry Fuels from Malee Biomass in Western Australia. Energy Fuels 24, 5660-5668.
Zhang L. 2004. Sunglight Ancient and Modern: The Relative Energy Efficiency of Hydrogen
from Coal and Current Biomass. MSc Thesis. Georgia Institute of Technology.