Embed Size (px)
Citation preview

United States EnvironmentalProtection Agency
Office of Water EPA 822-R-02-015Washington, DC 20460 March 2002
Methods for evaluating wetland condition
#4 Study Design forMonitoring Wetlands

United States EnvironmentalProtection Agency
Office of Water EPA 822-R-02-015Washington, DC 20460 March 2002
Methods for evaluating wetland condition
#4 Study Design forMonitoring Wetlands
Principal Contributor
Warnell School of Forest Resources, University of GeorgiaAmanda K. Parker
Prepared jointly by:
The U.S. Environmental Protection AgencyHealth and Ecological Criteria Division (Office of Science and Technology)
and
Wetlands Division (Office of Wetlands, Oceans, and Watersheds)

United States EnvironmentalProtection Agency
Office of Water EPA 822-R-02-015Washington, DC 20460 March 2002
Notice
The material in this document has been subjected to U.S. Environmental Protection Agency (EPA)technical review and has been approved for publication as an EPA document. The informationcontained herein is offered to the reader as a review of the “state of the science” concerning wetlandbioassessment and nutrient enrichment and is not intended to be prescriptive guidance or firm advice.Mention of trade names, products or services does not convey, and should not be interpreted asconveying official EPA approval, endorsement, or recommendation.
Appropriate Citation
U.S. EPA. 2002. Methods for Evaluating Wetland Condition: Study Design for MonitoringWetlands. Office of Water, U.S. Environmental Protection Agency, Washington, DC.EPA-822-R-02-015.
This entire document can be downloaded from the following U.S. EPA websites:
http://www.epa.gov/ost/standards
http://www.epa.gov/owow/wetlands/bawwg
ii

iii
Contents
Foreword ................................................................................................................... iv
List of “Methods for Evaluating WetlandCondition” Modules .................................................................................................. v
Summary ........................................................................................................................1
Purpose ........................................................................................................................1
Introduction ...............................................................................................................1
Considerations for Sampling Design ................................................................ 2
Sampling Protocol ...................................................................................................6
Suggested Websites .............................................................................................. 13
References ............................................................................................................... 14
List of Tables
Table 1: Comparison of Stratified Random,Targeted, and BACI Sampling Designs ..........................................7
iv
Foreword
In 1999, the U.S. Environmental Protection Agency (EPA) began work on this series of reports entitledMethods for Evaluating Wetland Condition. The purpose of these reports is to help States andTribes develop methods to evaluate (1) the overall ecological condition of wetlands using biologicalassessments and (2) nutrient enrichment of wetlands, which is one of the primary stressors damagingwetlands in many parts of the country. This information is intended to serve as a starting point for Statesand Tribes to eventually establish biological and nutrient water quality criteria specifically refined forwetlands.
This purpose was to be accomplished by providing a series of “state of the science” modules concerningwetland bioassessment as well as the nutrient enrichment of wetlands. The individual module formatwas used instead of one large publication to facilitate the addition of other reports as wetland scienceprogresses and wetlands are further incorporated into water quality programs. Also, this modularapproach allows EPA to revise reports without having to reprint them all. A list of the inaugural set of20 modules can be found at the end of this section.
This series of reports is the product of a collaborative effort between EPA’s Health and EcologicalCriteria Division of the Office of Science and Technology (OST) and the Wetlands Division of theOffice of Wetlands, Oceans and Watersheds (OWOW). The reports were initiated with the supportand oversight of Thomas J. Danielson (OWOW), Amanda K. Parker and Susan K. Jackson (OST),and seen to completion by Douglas G. Hoskins (OWOW) and Ifeyinwa F. Davis (OST). EPA reliedheavily on the input, recommendations, and energy of several panels of experts, which unfortunatelyhave too many members to list individually:
n Biological Assessment of Wetlands Workgroup
n Wetlands Nutrient Criteria Workgroup
More information about biological and nutrient criteria is available at the following EPA website:
http://www.epa.gov/ost/standards
More information about wetland biological assessments is available at the following EPA website:
http://www.epa.gov/owow/wetlands/bawwg
v
List of “Methods for Evaluating WetlandCondition” Modules
1 .................. Introduction to Wetland Biological Assessment
2 .................. Introduction to Wetland Nutrient Assessment
3 .................. The State of Wetland Science
4 .................. Study Design for Monitoring Wetlands
5 .................. Administrative Framework for the Implementation of a
Wetland Bioassessment Program
6 .................. Developing Metrics and Indexes of Biological Integrity
7 .................. Wetlands Classification
8 .................. Volunteers and Wetland Biomonitoring
9 .................. Developing an Invertebrate Index of Biological
Integrity for Wetlands
10 ............... Using Vegetation to Assess Environmental Conditions
in Wetlands
11 ................ Using Algae to Assess Environmental Conditions in
Wetlands
12 ................ Using amphibians in Bioassessments of Wetlands
13 ................ Biological Assessment Methods for Birds
14 ................ Wetland Bioassessment Case Studies
15 ................ Bioassessment Methods for Fish
16 ................ Vegetation-Based Indicators of Wetland Nutrient
Enrichment
17 ................ Land-Use Characterization for Nutrient and Sediment
Risk Assessment
18 ............... Biogeochemical Indicators
19 ................ Nutrient Load Estimation
20 ............... Sustainable Nutrient Loading
Module # Module Title
1
Summary
S tate and Tribal monitoring programsshould be designed to assess wetland condi-
tion with statistical rigor while maximizing availablemanagement resources. The three study designsdescribed in this module—stratified random sam-pling, targeted/tiered approach, and before/after,control/impact (BACI)—allow for collection of asignificant amount of information for statistical analy-ses with relatively minimal effort. The sampling de-sign selected for a monitoring program will dependon the management question being asked. Sam-pling efforts should be designed to collect informa-tion that will answer management questions in a waythat will allow robust statistical analysis. In addi-tion, site selection, characterization of reference sitesor systems, and identification of appropriate indexperiods are all of particular concern when selectingan appropriate sampling design. Careful selectionof sampling design will allow the best use of finan-cial resources and will result in the collection of high-quality data for evaluation of the wetland resourcesof a State or Tribe. Examples of different samplingdesigns currently in use for State and Tribal wet-land monitoring are described in the Case Study(Bioassessment) module and on http://www.epa.gov/owow/wetlands/bawwg/case.html.
Purpose
T he purpose of this module is to provide tech- nical guidance information on designing
effective sampling programs for State and Tribal wet-land water quality monitoring.
Introduction
W etlands are included as waters of the UnitedStates in the Federal regulations (40 CFR
122.2, 40 CFR 230.3, and 40 CFR 232.2) imple-menting the Clean Water Act [Section 502(7)].Wetlands are important waterbodies; they can pro-
vide many functions that are beneficial to the locallandscape, for example, water storage, water qual-ity improvement, and wildlife habitat. Wetlands arealso valuable as ecosystems in their own right, pro-viding carbon storage, biogeochemical transforma-tions, and aquifer recharge (Mitsch and Gosselink1993). However, few States or Tribes (only sixStates and Tribes reported attainment of designateduses in the “National Water Quality Inventory 1996Report to Congress”) include wetland monitoringin their routine water quality monitoring programs(U.S. EPA 1996, 1998). Yet, wetland chemicaland biological water quality monitoring data arescarce to nonexistent in many States and most Fed-eral databases. The need for water quality moni-toring data on wetlands is obvious; the vast major-ity of data about wetlands are collected in relationto dredge and fill permitting. Indeed, only 4% ofthe nation’s wetlands were surveyed and only 11States and Tribes reported information concerningwetland designated use attainment in the “NationalWater Quality Inventory 1998 Report to Congress”(U.S. EPA 1998). This module is intended to pro-vide guidance to State and Tribal water quality man-agers on designing wetland monitoring programs tobe included as a part of their routine water qualitysampling.
Most States and Tribes will need to begin wet-land monitoring programs to collect water qualityand biological data (U.S. EPA 1990). The bestmonitoring programs are designed to assess wet-land condition with statistical rigor while maximiz-ing available management resources. At the broadestlevel, monitoring should include the following:
n Detecting and characterizing the ambient condi-tion of existing wetlands
n Describing whether wetland condition is improv-ing, degrading, or staying the same
n Defining seasonal patterns in wetland conditions
n Identifying thresholds for system stressors, thatis, how much the system can be disturbed with-

2
out causing unacceptable changes in wetland sys-tem quality or degradation of beneficial uses.
Water quality monitoring programs at the Stateand Tribal level are often poorly and inconsistentlyfunded or are improperly designed and carried out,making it difficult to collect a sufficient number ofsamples over time and space to identify changes insystem condition or to estimate average conditionswith statistical rigor. Three approaches to studydesign for assessing water quality as well as bio-logical and ecological condition and for identifyingdegradation in wetlands are described in this mod-ule. Specific issues to consider in designing moni-toring programs for wetland systems are also dis-cussed in this module. The study designs presentedcan be tailored to fit the specific goals of monitoringprograms. The assemblage-specific modules willdiscuss detailed sampling considerations.
The three approaches described—stratified ran-dom sampling; targeted/tiered approach; andBACI—present study designs that allow one toobtain a significant amount of information with rela-tively minimal effort. Stratified random samplingbegins with a large-scale random monitoring designthat is reduced as the wetland system or habitatconditions are characterized. This approach is usedto find the mean condition of each wetland class, ortype, in a specific region. Stratified random sam-pling design is frequently used for new large-scalemonitoring programs at the State and Federal level(e.g., the Environmental Monitoring and Assess-ment Program, the Regional Environmental Moni-toring and Assessment Program, and State pro-grams in Maine, Montana, and Wisconsin). Thetiered or targeted approach to monitoring beginswith coarse screening and proceeds to more de-tailed monitoring protocols as impaired and high-risk systems are identified for further investigation.Targeted sampling design provides a triage approachto identifying wetland systems in need of restora-tion, protection, and intensive management. Sev-eral State pilot projects use this method or a modi-
fication of this method for wetland assessment (e.g.,Florida, Ohio, Oregon, and Minnesota). The syn-optic approach described in Kentula et al. (1993)uses a modified targeted sampling design. TheBACI design and its modifications are frequentlyused to assess the success of restoration efforts orother management experiments. BACI design al-lows for comparisons in similar systems over timeto determine the rate of change in relation to themanagement activity, for example, to assess the suc-cess of a wetland hydrologic restoration.Detenbeck et al. (1996) used BACI design formonitoring water quality of wetlands in the Minne-apolis/St. Paul, Minnesota, metro area.
Monitoring programs should be designed to an-swer questions such as how, when, where, and atwhat levels do unacceptable wetland conditionsoccur? These questions are interrelated, and a well-designed monitoring program can contribute to an-swering them. Sampling design is dependent onthe management question being asked. Samplingefforts should be designed to collect information thatwill answer the management question. For example,stratified random sampling might be good for ambi-ent monitoring programs, BACI for evaluating res-toration, and targeted sampling for developing anIndex of Biological Integrity or nutrient criteriathresholds. In fact, some State programs will likelyneed to use a combination of approaches.
Considerations forSampling Design
Describing the ManagementQuestion
Clearly defining the question being asked (identi-fying the hypothesis) encourages the use of appro-priate statistical analyses, reduces the occurrenceof false-positive (Type I) errors, and increases theefficient use of management resources (Suter 1993,Leibowitz et al.1992, Kentula et al. 1993). Begin-

3
ning a study or monitoring program with carefullydefined questions and objectives helps to identifythe statistical analyses most appropriate for the studyand reduces the chance that statistical assumptionswill be violated. Management resources are opti-mized because resources are directed at monitor-ing that is most likely to answer management ques-tions. In addition, defining the specific hypothesesto be tested, carefully selecting reference sites, andidentifying the most useful sampling interval can helpreduce the uncertainty associated with the resultsof any sampling design as well as further conservemanagement resources (Kentula et al. 1993).
Site Selection
Site selection is arguably the most important taskin developing a monitoring program (Kentula et al.1993). Site selection for a monitoring program isbased on the need to sample a relatively large num-ber of wetlands to establish the range of wetlandquality in a specific regional setting. Protecting orimproving the quality of a wetland system often de-pends on the ability of the monitoring program toidentify dose-response relationships, for example,the relationship of nutrient concentration (dose) toperiphyton abundance (response). Dose-responserelationships can be identified using large samplesizes and systems that span the gradient (low tohigh) of wetland quality. All ranges of responsesshould be observed along the dosing gradient fromlow levels to high levels of human disturbance. Inaddition, wetland monitoring frequently requires ananalysis of both watershed/landscape characteris-tics and wetland-specific characteristics (Kentulaet al. 1993, Leibowitz et al. 1992). Therefore,wetland sampling sites should be selected on thebasis of land use in the region so that watershedsrange from minimally impaired with few expectedstressors to high levels of development (e.g., agri-culture, forestry, or urban) with multiple expectedstressors (see Module 17: Land-Use Character-ization for Nutrient and Sediment Risk Assessment).Establishing dose-response relationships may be
confounded due to time lags between stressor oc-currence and biological or functional response. Theduration of the time lag between stressor and re-sponse depends on many factors, including the typeof stressor, climate, and system hydrology. Thesefactors should be considered when selecting wet-land sites to establish the range of wetland qualitywithin a region.
The synoptic approach described in Leibowitz etal. (1992) provides a method of rapid assessmentof wetlands at the regional and watershed levelsthat can help identify the range of wetland qualitywithin a region. Leibowitz et al. (1992) recommendan initial assessment for site selection based on cur-rent knowledge of watershed- and landscape-levelfeatures; modification of such an assessment canbe made as more data are collected. Assessingwatershed characteristics through the use of aerialphotography and geographical information systemslinked to natural resource and land-use databasescan aid in identifying reference and degraded sys-tems (see Module 17: Land-Use Characterizationfor Nutrient and Sediment Risk Assessment)(Johnston et al. 1988, 1990, Gwin et al. 1999, Paliket al. 2000). Some examples of watershed char-acteristics that can be evaluated using aerial pho-tography and geographical information systems in-clude land use, land cover (including riparian veg-etation), soil, bedrock, hydrography, and infrastruc-ture (e.g., roads and railroads).
Identifying and CharacterizingReference wetlands
The term “reference” in this module refers to thosesystems that are least impaired by anthropogeniceffects. This term can be confusing because of thedifferent meanings that are currently in use in differ-ent classification methods (particularly inhydrogeomorphic wetland classification). A dis-cussion of the term “reference” and its multiplemeanings is provided in Module 7: WetlandsClassification.
4
Watersheds with little or no development that re-ceive minimal anthropogenic inputs could potentiallycontain wetlands that would serve as minimally im-paired reference sites. Watersheds with a high per-centage of the drainage basin occupied by urbanareas, agricultural land, and altered hydrology arelikely to contain wetlands that are impaired or couldpotentially be considered “at risk” for developingproblems. Wetland loss in the landscape shouldalso be considered when assessing watershed char-acteristics for reference wetland identification.Biodiversity can become impoverished due to wet-land fragmentation or decreases in regional wet-land density, even in the absence of site-specificland-use activities. Reference wetlands may bemore difficult to locate if fragmentation of wetlandhabitats is significant, and they may no longer rep-resent the biodiversity of minimally disturbed wet-lands in the region. The continued high rate of wet-land loss in most States and Tribes requires thatmultiple reference sites be selected to ensure someconsistency in reference sites for multiple-year sam-pling programs (Leibowitz et al. 1992, Kentula etal. 1993). Once the watershed level has been con-sidered, a more site-specific investigation can beinitiated to better assess wetland condition.
Potential reference wetlands should be charac-terized to allow for the identification of appropriatereference wetland systems. Appropriate referencesites will have similar soils, vegetation, hydrologicregimes, and landscape settings to other wetlandsin the region (Adamus 1992, Leibowitz et al. 1992,Kentula et al. 1992, Detenbeck et al. 1996). Clas-sification of wetlands, as discussed in Module 7:Wetlands Classification, will aid in identifying ap-propriate reference wetlands for specific regions andwetland classes. Wetland classification should besupplemented with information on hydroperiod andflood frequency to ensure that the selected refer-ence wetlands are truly representative of wetlandsin the region, class, or subclass of interest. Refer-ence wetlands may not be available for all wetlandclasses. In this case, data from systems that are asclose as possible to the assumed unimpaired state
of wetlands in the wetland class of interest shouldbe sought from within the same geologic province.Development of a conceptual reference may be nec-essary if appropriate reference sites cannot be foundin the local region or geologic province. Techniquesfor defining a conceptual reference are discussed atlength in Harris et al. (1995), Trexler (1995), andToth et al. (1995).
Reference wetlands should be selected on the basisof low levels of human alteration in their watersheds(Leibowitz et al. 1992, Kentula et al. 1993, U.S.EPA 2000). Selecting reference wetlands usuallyinvolves the assessment of land use within water-sheds as well as visits to individual wetland systemsto ground-truth expected land use and check forunsuspected impacts. Ground-truthing visits to ref-erence wetlands are crucial for the identification ofecological impairment that may not be apparent fromland-use and local habitat conditions. Again, a suf-ficient sample size is important to characterize therange of conditions that can be expected in the leastimpacted systems of the region (Detenbeck et al.1996). Reference wetlands should be identified foreach ecoregion or geological province in the Stateor Tribal lands and then characterized with respectto ecological integrity. A minimum of three low-impact reference systems is recommended for eachwetland class for statistical analyses. However,power analysis can be performed to determine thedegree of replication necessary to detect an impactto the systems being investigated (Detenbeck et al.1996, Urquhart et al. 1998; see also http://www.mp1-pwrc.usgs.gov/powcase/index.html). Highestpriority should be given to identifying reference sys-tems for those wetland classes considered to be atthe greatest risk from anthropogenic stress.
When to sample
Sampling may be targeted to the period whenproblems are most likely to occur—the index pe-riod. The appropriate index period will be definedby what the investigator is trying to investigate and

5
by what taxonomic assemblage or parameters arebeing used for that investigation (Barbour et al.1999). For example, increased nutrient concen-trations and sedimentation from nonpoint sourcesmay occur following periods of high runoff duringthe spring and fall, whereas point sources of nutri-ent pollutants may cause plankton blooms and/orincreased water and soil nutrient concentrations inwetland pools during times of low rainfall. Hence,different index periods may be needed for nonpointsource and point source nutrients. Each taxonomicassemblage studied will also have an appropriateindex period—usually in the growing season (seeassemblage methods in the Minnesota case study:http://www.epa.gov/owow/wetlands/bawwg/case/mn1.html). The index period window may be earlyin the growing season for amphibians and algae.Other assemblages, such as vegetation and birds,may require a different sampling window for theindex period (see the assemblage-specific modulesfor recommendations). Once wetland condition hasbeen characterized, one-time annual sampling dur-ing the appropriate index period may be adequatefor multiple-year monitoring of indicators of nutri-ent status, designated use, and biotic integrity. How-ever, criteria and ecological indicator developmentmay require more frequent sampling to define con-ditions that relate to the stressor or the impact ofinterest (Karr and Chu 1999, Stevenson 1996,1997).
Ideally, water quality monitoring programs pro-duce long-term data sets compiled over multipleyears to capture the natural, seasonal, and year-to-year variations in biological communities andwaterbody constituent concentrations (Tate 1990,Dodds et al. 1997, McCormick et al. 1999). Mul-tiple-year data sets can be analyzed with statisticalrigor to identify the effects of seasonality and vari-able hydrology. Once the pattern of natural varia-tion has been described, the data can be analyzedto determine the ecological state of the waterbody.Long-term data sets have also been important ininfluencing management decisions about wetlands,
most notably in the Everglades, where long-termdata sets have induced Federal, State, and Tribalactions for conservation and restoration of the larg-est wetland system in the United States (see Davisand Ogden 1994, Redfield 1999, 2000, 2001;1994 Everglades Forever Act, Florida Statute§ 373.4592).
In spite of the documented value of long-term datasets, there is a tendency to intensively study awaterbody for 1 year before and 1 year after treat-ment. A more cost-effective approach would beto measure only the indices most directly related tothe stressor of interest (i.e., those parameters orindicators that provide the best information to an-swer the specific management question), but todouble or triple the monitoring period. Two or moreyears of data are often needed to identify the ef-fects of years with extreme climatic or hydrologicconditions. Comparisons over time between refer-ence and at-risk or degraded systems can help de-scribe biological response and annual patterns inthe presence of changing climatic conditions. Long-term data sets can also help describe regional trends.Flooding or drought may significantly affect wet-land biological communities and the concentrationof water column and soil constituents. Effects ofuncommon climatic events can be characterized todiscern the overall effect of management actions(e.g., nutrient reduction and water diversion) if sev-eral years of data are available to identify the long-term trends. At the very minimum, 2 years of databefore and 2 after specific management actions, butpreferably 3 or more each, are recommended toevaluate the cost-effectiveness of management ac-tions with some degree of certainty (U.S. EPA2000). If funds are limited, restricting sampling fre-quency and/or numbers of indices analyzed shouldbe considered to preserve a long-term data set.Reducing sampling frequency or numbers of pa-rameters measured will allow for effectiveness ofmanagement approaches to be assessed against thehigh annual variability that is common in most wet-land systems. Wetlands with high hydrological varia-
6
tion from year to year may require more years ofsampling before and after mitigation procedures toidentify the effects of the natural hydrologic vari-ability (Kadlec and Knight 1996).
Using the BACI study design may also providesubstantial benefit for determining the effectivenessof management activities. Tracking both reference(control) and impacted systems within a region overtime will help determine the rate and direction ofchange in monitored systems regardless of systemvariability. The BACI design may require more fre-quent monitoring of reference systems than is sug-gested for random or targeted designs, but it wouldallow useful comparison of system change regard-less of variability (Detenbeck et al. 1996).
Characterizing precision of estimatesEstimates of dose-response relationships, nutri-
ent and biological conditions in reference systems,and wetland conditions in a region are based onsampling, hence precision must be assessed. Pre-cision is defined as “measure of the degree of agree-ment among the replicate analyses of a sample, usu-ally expressed as the standard deviation” (Eaton etal. 2000). Determining precision of measurementsfor one-time assessments from single samples in awetland is often necessary. The variation associ-ated with one-time assessments from single samplescan often be determined by resampling a specificnumber of wetlands during the survey. Measure-ment variation among replicate samples can thenbe used to establish the expected variation for one-time assessment of single samples. Resampling doesnot establish the precision of the assessment pro-cess; it identifies the precision of an individual mea-surement (Kentula et al. 1993). Resampling fre-quency is often conducted for one wetland site inevery block of 10 sites. However, investigatorsshould adhere to the objectives of resampling (of-ten considered an essential element of quality as-sessment/quality control) to evaluate the variation
in a one-time assessment from a single sample. Thelarger the sample size, the better (smaller) will bethe estimate of that variation. Often, more than 1 in10 samples need to be replicated in monitoring pro-grams to provide a reliable estimate of measure-ment precision (Barbour et al. 1999).
Sampling Protocol
Approaches to Sampling Design
Three approaches to sampling design—stratifiedrandom, targeted design, and BACI—have advan-tages and disadvantages that under different circum-stances warrant the choice of one approach overthe other (Table 1). The decision as to the bestapproach for sample design in a new monitoringprogram must be made by the water quality resourcemanager or management team after carefully con-sidering different approaches. Justification of a dose-response relationship is confounded by lack of ran-domization and replication, and must be consideredin choosing a sampling design for a monitoring pro-gram. Direct identification of a cause-response re-lationship is not possible in observational (monitor-ing) studies. However, inferences of causality canbe argued if appropriate information is collected.Beyers (1998) describes assembly rules for causalarguments that can be used to infer causality forstressors of interest. The number of sites to besampled and the sampling frequency are determinedby the type of sampling design chosen by the re-source managers. Power analyses can be used tohelp make this decision by estimating the number ofsites to be sampled and replicates needed to pro-duce a statistically significant result. The U.S. Geo-logical Survey provides an excellent website thatcan assist the resource manager in determining thenumber of sites and replicates needed to producethe desired analytical power for a particular sam-pling design: http://www.mp1-pwrc.usgs.gov/powcase/how.html.
7
Stratified RandomSampling Design
Probabilistic sampling—a sampling process inwhich randomness is a requisite (Hayek 1994)—can be used to characterize the status of water qual-ity conditions and biotic integrity in a region’s wet-land systems. This type of sampling design is usedto describe the average conditions of a wetlandpopulation, identify the variability among sampledwetlands, and to help determine the range of wet-land system conditions in a region. However, thedata collected from a probabilistic random sampledesign will generally be characteristic of the domi-nant class of wetland in the region, and rare wet-lands may be underrepresented or absent from the
probabilistically sampled wetlands. Additional sam-pling sites may need to be added to include the com-plete range of wetland conditions and classes in theregion.
Probabilistic designs are often modified by strati-fication (such as classification). Stratification, orstratified random sampling, is a type of probabilitysampling in which a target population is divided intorelatively homogenous groups (strata) before sam-pling based on factors that influence variability inthat population (Hayek 1994). Analysis of vari-ance can be used to identify statistically differentparameter means among the sampling strata. Thestrata are the analysis of variance treatments (Poole
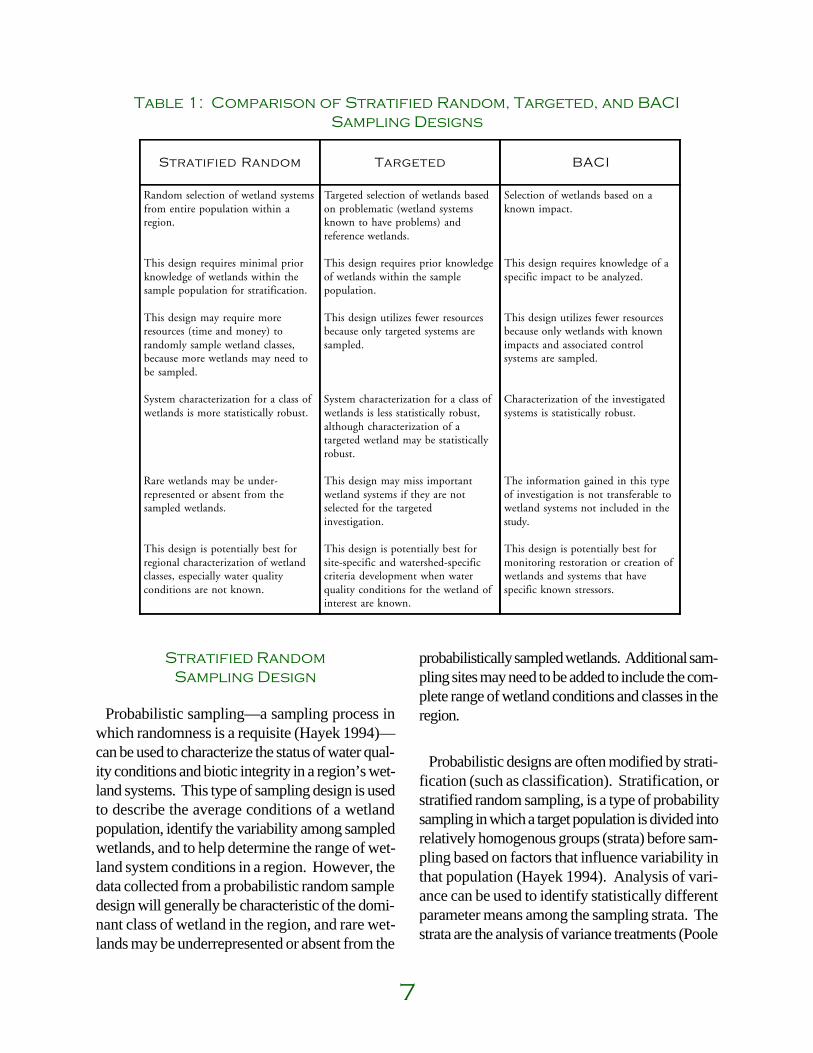
Table 1: Comparison of Stratified Random, Targeted, and BACISampling Designs
Stratified Random Targeted BACI
Random selection of wetland systemsfrom entire population within aregion.
This design requires minimal priorknowledge of wetlands within thesample population for stratification.
This design may require moreresources (time and money) torandomly sample wetland classes,because more wetlands may need tobe sampled.
System characterization for a class ofwetlands is more statistically robust.
Rare wetlands may be under-represented or absent from thesampled wetlands.
This design is potentially best forregional characterization of wetlandclasses, especially water qualityconditions are not known.
Targeted selection of wetlands basedon problematic (wetland systemsknown to have problems) andreference wetlands.
This design requires prior knowledgeof wetlands within the samplepopulation.
This design utilizes fewer resourcesbecause only targeted systems aresampled.
System characterization for a class ofwetlands is less statistically robust,although characterization of atargeted wetland may be statisticallyrobust.
This design may miss importantwetland systems if they are notselected for the targetedinvestigation.
This design is potentially best forsite-specific and watershed-specificcriteria development when waterquality conditions for the wetland ofinterest are known.
Selection of wetlands based on aknown impact.
This design requires knowledge of aspecific impact to be analyzed.
This design utilizes fewer resourcesbecause only wetlands with knownimpacts and associated controlsystems are sampled.
Characterization of the investigatedsystems is statistically robust.
The information gained in this typeof investigation is not transferable towetland systems not included in thestudy.
This design is potentially best formonitoring restoration or creation ofwetlands and systems that havespecific known stressors.
8
1972). The result of collecting and assessing waterquality and biotic responses with a stratified ran-dom sample is, presumably, an unbiased estimateof the descriptive statistics (e.g., means, variances,modes, and quartiles) of all wetlands in a stratum.Stratification by wetland size and class providesmore information about different types of wetlandswithin a region. Sample statistics from random se-lection alone would be most characteristic of thedominant wetland class in a region if the populationof wetlands is not stratified.
Many State 305b and watershed monitoring pro-grams use stratified random sampling designs, forexample, Maine, Montana, and Wisconsin pilotprojects use this design. Details of these monitor-ing designs can be found in the Module 14: CaseStudies (Bioassessment) and at http://www.epa.gov/owow/wetlands/bawwg/index.html.Stratification is based on identifying wetland sys-tems in a region (or watershed) and then selectingan appropriate sample of systems from the definedpopulation. The determination of an appropriatesample population depends on the managementquestions being asked. A sample population of iso-lated depressional wetlands could be identified as asingle stratum, but investigations of these wetlandswould not provide any information on riparian wet-lands in the same region. If the goal of the monitor-ing program is to identify wetland condition for allwetland classes within a region, then a samplepopulation of wetlands should be randomly selectedfrom all wetlands within each class. In practice,most State and Tribal programs stratify randompopulations by size, wetland class (see Module 7:Wetlands Classification), and landscape character-istics or location (see http://www.epa.gov/owow/wetlands/bawwg/case/me.html, http://www.epa.gov/owow/wetlands/bawwg/case/wa.html, andhttp://www.epa.gov/owow/wetlands/bawwg/case/wi1.html).
Once the wetlands for each stratum have beenselected, the sample population is often modified
by deleting systems that are too close to other wet-lands to be different, thereby reducing redundantcollection efforts. For example, the EnvironmentalMonitoring and Assessment Program limits redun-dant collection efforts by applying a regular (hex-agonal) grid to a map of the area. Sampling sitesare chosen by randomly selecting grid cells and ran-domly sampling wetland resources within the cho-sen grid cells (Paulsen et al. 1991). Estimates ofecological conditions from these kinds of modifiedprobabilistic sampling designs can be used to char-acterize the water quality conditions and biologicalintegrity of wetland systems in a region and, overtime, to distinguish trends in ecological conditionwithin a region (see http://www.epa.gov/owow/wet-lands/bawwg/case/mtdev.html and http://www.epa.gov/owow/wetlands/bawwg/case/fl1.html).
Targeted Design
A targeted approach to sampling design may bemore appropriate when resources are limited. Tar-geted sampling is a specialized case of randomstratified sampling. The approach described hereinvolves defining a gradient of impairment. Oncethe gradient has been defined and systems have beenplaced in categories of impairment, investigatorsfocus the most effort on identifying and characteriz-ing wetland systems or sites likely to be impactedby anthropogenic stressors and on relatively undis-turbed wetland systems or sites (see “Identifyingand Characterizing Reference Wetlands”) that canserve as regional, subregional, or watershed ex-amples of natural biological integrity. The FloridaDepartment of Environmental Protection uses a tar-geted sampling design for developing thresholds ofimpairment with macroinvertebrates (http://www.epa.gov/owow/wetlands/bawwg/case/fl2.html). Choosing sampling stations that best al-low the comparison of ecological integrity at refer-ence wetland sites of known condition can conservefinancial resources. A sampling design that testsspecific hypotheses (e.g., the study by the Florida
9
Department of Environmental Protection tested theeffect of elevated water column phosphorus onmacroinvertebrate species richness) can generallybe analyzed with statistical rigor and can conserveresources by answering specific questions. Fur-thermore, the identification of systems with prob-lems and reference conditions eliminates the needfor selecting a random sample of the population formonitoring.
Targeted sampling assumes some knowledge ofthe systems sampled. Systems with evidence ofdegradation are compared with reference systemsthat are similar in physical structure (i.e., in the sameclass of wetlands). Targeted sampling requires thatthe wetlands be characterized by a gradient of im-pairment. Wetland systems should be placed alonga continuum from reference to most impacted. Animpaired or degraded wetland is simply a system inwhich anthropogenic impacts exceed acceptablelevels or interfere with beneficial uses. Compari-son of the monitoring data with the data collectedfrom reference wetlands will allow characterizationof the sampled systems. Wetlands identified as “atrisk” should be evaluated through a sampling pro-gram to characterize the degree of degradation.Once characterized, the wetlands should be placedin categories such as the following:
n Degraded wetlands—wetlands in which the levelof anthropogenic perturbance interferes with des-ignated uses
n High-risk wetlands—wetlands in which anthro-pogenic stress is high but does not significantlyimpair designated uses (In high-risk systems, im-pairment is prevented by one or a few factorsthat could be changed by human actions, althoughcharacteristics of ecological integrity are alreadymarginal.)
n Low-risk wetlands—wetlands in which many fac-tors prevent impairment, stressors are maintainedbelow problem levels, and/or no development iscontemplated that would change these conditions
n Reference wetlands—wetlands in which the eco-logical characteristics most closely represent thepristine or minimally impaired condition.
Once wetland systems have been classified on thebasis of their physical structure (see Module 7:Wetlands Classification) and placed into the cat-egories previously defined, specific wetlands needto be selected for monitoring. At this point, ran-domness is introduced; wetlands should be ran-domly selected within each class and risk categoryfor monitoring. An excellent example of categoriz-ing wetlands in this manner is given in the Ohio En-vironmental Protection Agency’s case study athttp://www.epa.gov/owow/wetlands/bawwg/case/oh1.html. It used the Ohio Rapid AssessmentMethod to categorize wetlands by degree of im-pairment. The Minnesota Pollution Control Agencyalso used a targeted design for monitoring wetlands(see http://www.epa.gov/owow/wetlands/bawwg/case/mn1.html). It used the best professional judg-ment of local resource managers to identify refer-ence sites as well as sites with known impairmentfrom identified stressors (e.g., agriculture andstormwater runoff).
Monitoring efforts are often prioritized to best utilizelimited resources. For example, case study investi-gators in Oregon chose not to monitor depressionalwetlands because of funding constraints; they fur-ther tested the degree of independence of selectedsites (and thus the need to monitor all of those sites)by using cluster analysis and other statistical tests(see http://www.epa.gov/owow/wetlands/bawwg/case/or.html). Frequency of monitoring is deter-mined by the management question being asked andthe intensity of monitoring necessary to collectenough information to answer the question. In ad-dition, monitoring should identify the watershed-levelactivities that are likely to result in ecological deg-radation of wetland systems (Suter et al. 1993).Targeted sampling design involves monitoring iden-tified degraded systems and comparable referencesystems most intensively. Low-risk systems are
10
monitored less frequently (after initial identification),unless changes in the watershed indicate an in-creased risk of degradation.
Activities surrounding impaired wetland systemsmay be used to help identify which actions nega-tively affect wetlands, and therefore may initiatemore intensive monitoring of at-risk wetlands. Moni-toring should focus on factors likely to identify eco-logical degradation and anthropogenic stress andon any actions that might alter those factors. State/Tribal water quality agencies should encourageadoption of local watershed protection plans tominimize ecological degradation of natural wetlandsystems. Development plans in a watershed shouldbe evaluated to identify potential future stressors.Changes in point sources can be monitored throughthe National Pollutant Discharge Elimination Sys-tem permit program (U.S. EPA 2000). Changes innonpoint sources can be evaluated through the iden-tification and tracking of wetland loss and/or deg-radation, increased residential development, in-creased tree harvesting, and shifts to more inten-sive agriculture with greater fertilizer use or increasesin livestock numbers. Local planning agenciesshould be informed of the risk of increased anthro-pogenic stress and encouraged to guide develop-ment accordingly. Ecological degradation oftengradually increases as a result of many growingsources of anthropogenic stress. Therefore, fre-quent monitoring is warranted for high-risk wetlandsif sufficient resources remain after meeting the needsof degraded wetlands. Whenever developmentplans appear likely to alter factors that maintain eco-logical integrity in a high-risk wetland (e.g., veg-etated buffer zones), monitoring should be initiatedat a higher sampling frequency in order to enhancethe understanding of baseline conditions (U.S. EPA2000).
BACI Survey Design
An ideal impact survey has several features: Thetype of impact, time of impact, and place of occur-
rence should be known in advance; the impactshould not have occurred yet; and control areasshould be available (Green 1979). The first featureallows surveys to be efficiently planned to accountfor the probable change in the environment. Thesecond feature allows a baseline study to be estab-lished and to be extended as needed. The thirdfeature allows the surveyor to distinguish betweentemporal effects unrelated to the impact and changesrelated to the impact. In practice, however, ad-vance knowledge of specific impacts is rare andthe ideal impact survey is rarely conducted. BACIdesigns modified to monitor impacts during or aftertheir occurrence can still provide information, butthere is an increase in the uncertainty associatedwith the results, and the likelihood of finding a sta-tistically significant change caused by the impact ismuch less probable. Power analyses of after-onlystudies were conducted by Osenberg et al. (1994).They determined that because of the time constraintsof most studies, relatively few of the population andchemical/physical parameters could provide ad-equate analytical power. They suggest expending agreater effort on monitoring individual-based pa-rameters (e.g., body size and recruitment density)in addition to population and chemical/physical pa-rameters for environmental impact assessments(Osenberg et al. 1994). Defining the study objec-tives, and identifying the specific hypotheses beingtested, greatly increases the certainty of the results.In addition, other aspects of survey design are de-pendent on the study objectives: the sampling inter-val, the length of time the survey is conducted (i.e.,sampling for acute vs. chronic effects), and the sta-tistical analyses appropriate for analyzing the data(Suter 1993).
The best interval for sampling is determined bythe objectives of the study (Kentula et al. 1993). Ifthe objective is to detect changes in trends (e.g.,regular monitoring for detection of changes in wa-ter quality or biotic integrity), regularly spaced in-tervals are preferred because the analysis is easier.However, if the objective is to assess differences
11
before and after impact, then samples at randomtime points are advantageous. Random sample in-tervals reduce the likelihood that cyclic differencesunforeseen by the sampler will influence the size ofthe difference before and after the impact. For ex-ample, surveys taken every summer for several yearsbefore and after a clear-cut may show little differ-ence in system quality; however, differences mayexist that can be detected only in the winter and,therefore, they may go undetected if sampling oc-curs only during summer.
The simplest impact survey design involves takinga single survey before and after the impact event(Green 1979). This type of design has the obviouspitfall that there may be no relationship between theobserved event and the changes in the responsevariable—the change may be entirely coincidental.This pitfall is addressed in BACI design by com-paring before and after impact data with data col-lected from a similar control system nearby. Dataare collected before and after a potential distur-bance in two areas (treatment and a control), withmeasurements on biological and environmental vari-ables in all combinations of time and area (Green1979). For example, consider a study in which theinvestigators want to identify the effects of clear-cutting on wetland systems. In the simplest BACIdesign, two wetlands would be sampled. One wet-land would be adjacent to the clear-cut (the treat-ment wetland); the other wetland would be adja-cent to a control site that is not clear-cut. The con-trol site should have characteristics (i.e., soil, veg-etation, structure, and functions) similar to the treat-ment wetland and should be exposed to climate andweather similar to the first wetland. Both wetlandsare sampled at the same time points before and af-ter the clear-cut occurs. This design is technicallyknown as an area-by-time factorial design. Evi-dence of an impact is found by comparing the con-trol site samples (before and after) with the treat-ment site before and after samples. Area-by-timefactorial design allows for both natural wetland-to-wetland variation and coincidental time effects. If
the clear-cut has had no effect, then the change insystem quality between the two time points shouldbe the same. If the clear-cut has had an effect, thenthe change in system quality between the two timepoints should be different.
There are some potential problems with BACIdesign. First, because the control and impact sitesare not randomly assigned, observed differencesbetween sites may be related solely to some otherfactor that differs between the two sites. One couldargue that it is unfair to ascribe the effect to theimpact (Hurlbert 1984, Underwood 1991). How-ever, as pointed out by Stewart-Oaten et al. (1986),the survey is concerned about a particular impact ina particular place, not about the average of severalimpacts when the survey is replicated in many dif-ferent locations. Consequently, it may be possibleto detect a difference between these two specificsites. However, if there are no randomized repli-cate treatments, the results of the study cannot begeneralized to similar events at different wetlands.However, the likelihood that the differences betweensites are due to factors other than the impact can bereduced by monitoring several control sites(Underwood 1991). If one assumes that the varia-tion in the (before and after) measurements of mul-tiple control sites is the same as the variation amongpotentially impacted sites, and that the variabilityover time between the control sites is not corre-lated, one can estimate the likelihood that the im-pact caused the observed difference at the impactedsite, given the observed variability in the control sites.That is, several control wetlands could be moni-tored at the same time points as the single impactwetland. If the observed difference in the impactwetland is much different than could be expectedbased on the multiple control wetlands, the event issaid to have caused an impact. The lack of ran-domization is less of a concern when several con-trol sites are monitored, because the multiple con-trol sites provide some information about potentialeffects of other factors.
12
The second and more serious concern with thesimple before and after design with a single sam-pling point before and after the impact is that it failsto recognize that natural fluctuations may occur inthe characteristic of interest that are unrelated toany impact (Hurlbert 1984, Stewart-Oaten 1986).Single samples before and after impact would besufficient to detect the effects of the impact if nonatural fluctuations occurred over time. However,if the population also has natural fluctuations overand above the long-term average, then it is impos-sible to distinguish between cases in which no ef-fect occurs from cases in which an impact doesoccur. Consequently, measured differences in sys-tem quality may be artifacts of the sampling dates,and natural fluctuations may obscure differences orlead one to believe differences are present whenthey are not.
The simple BACI design was extended byStewart-Oaten et al. (1986) by pairing surveys atseveral selected time points before and after theimpact to help resolve the issue of pseudoreplication(Hurlbert 1984). This modification of the BACIdesign is referred to as the BACI-paired series (PS)design. The selected sites are measured at the sametime points. The rationale behind this paired designis that repeated sampling before the impact givesan indication of the pattern of differences of poten-tial change between the two sites. BACI-PS studydesign provides information on the mean differencein the wetland system quality before and after im-pact and on the natural variability of the system qual-ity measurements. An effect is detected if thechanges in the mean difference are large relative tonatural variability. Considerations for sampling ateither random and regularly spaced intervals alsoapply here.
BACI-PS study design also has potential pitfalls.As with all studies, numerous assumptions need tobe made during the analysis (Stewart-Oaten et al.1992, Smith et al. 1993). The primary assumptionfor BACI-PS design is that the responses over time
are independent of each other. A lack of indepen-dence over time tends to produce false-positive(Type I) errors, which may lead a manager to de-clare that an effect has occurred when, in fact, nonehas. Formal time series analysis methods or re-peated measures analysis may be necessary(Rasmussen et al. 1993) to eliminate Type I errors.(The analysis of time series is easiest with regularlyspaced sampling points.) In addition, the differ-ence in mean level between control and impact sitesis assumed to be constant over time in the absenceof an impact effect. The effect of the impact is as-sumed to change the arithmetic difference. In theclear-cut example given previously, the differencein mean system quality between the two sites is as-sumed to be constant over time. That is, mean sys-tem quality measurements may fluctuate over time,but both sites are assumed to fluctuate in the samemanner simultaneously, thereby maintaining the sameaverage arithmetic difference. This assumption isviolated if the response variable at the control site isa constant multiple of the response variable at theimpact site. For example, suppose that the read-ings of water quality at two sites at the first timepoint were 200 vs. 100, which has an arithmeticdifference of 100, and at the second time point were20 vs. 10, which has an arithmetic difference of 10,but both pairs are in a 2:1 ratio at both time points.The remedy is simple: A logarithmic transform ofthe raw data converts a multiplicative difference intoa constant arithmetic difference on the logarithmicscale. This is a common problem when system qual-ity measurements are concentrations (e.g., pH).Smith et al. (1993) pointed out that this may notsolve the issue of pseudoreplication. Trends arecommon in most natural populations, but BACIdesign assumes that trends are not present in thepopulations or that the control and impact sites havethe same trends, so that differences between thesites are identified as associated with the impact,not with differences in trends of natural populations(Smith et al. 1993). Violation of the BACI assump-tions may invalidate conclusions drawn from thedata. Enough data must be collected before theimpact to identify the trends in the communities of
13
each sampling site if the BACI assumptions are tobe met. Clearly defining the objectives of the studyand identifying a statistically testable model of therelationships the investigator is studying can helpresolve these issues (Suter 1993).
Underwood (1991) also considered two varia-tions on the BACI-PS design. First, it may not bepossible to sample both sites simultaneously for tech-nical or logistical reasons. Underwood (1991) dis-cussed a modification in which sampling is done atdifferent times in each site before and after impact(i.e., sampling times are no longer paired), but notesthat this modification cannot detect changes thatoccurred in the two sites before the impact. Forexample, differences in system quality may show agradual change over time in the paired design be-fore impact. Without paired sampling, it would bedifficult to detect this change. In addition, samplingonly a single control site still has the problem iden-tified previously, that is, it is not known whetherobserved differences in the impact and the controlsites are site specific. Again, Underwood (1991)suggests that multiple control sites should be moni-tored. The variability in the difference between eachcontrol site and the impact site provides informa-tion on transferability of the impact effects to othersites (i.e., it either refutes or supports the site speci-ficity of the impact and associated system response).
The designs described are suitable for detectinglong-term, or chronic, effects in the mean level ofthe variable of interest. However, the impact mayhave a short-term, or acute, effect, or it may changethe variability in response (e.g., seasonal changesbecome more pronounced) in some cases. Thesampling schedule can be modified to occur at twotemporal scales (enhanced BACI-PS design) thatencompass both acute and chronic effects(Underwood 1991). The modified temporal de-sign introduces randomization by randomly choos-ing sampling occasions in two periods (before andafter) in the control or impacted sites. The twotemporal scales (sampling periods vs. sampling oc-
casions) allow the detection of a change in meanand in variability after impact. For example, groupsof surveys could be conducted every year, with fivesurveys one week apart randomly located withineach group. The analysis of such a design is pre-sented in Underwood (1991). Again, multiple con-trol sites should be used to confound the argumentthat detected differences are specific to the sampledsite.
BACI-PS design is also useful when there aremultiple objectives. For example, the objective forone variable may be to detect a change in trend.The pairing of sample points on a long time scaleleads to efficient detection of trend changes. Theobjectives for another variable may be to detectdifferences in the mean level. A short time scalesurveys randomly located in time and space are ef-ficient for detecting differences in the mean level.The September 2000 issue of the Journal of Agri-cultural, Biological, and Environmental Statis-tics discusses many of the advantages and disad-vantages of the BACI design and provides severalexamples of appropriate statistical analyses for evalu-ation of BACI studies.
Suggested Websites
1 http://ebook.stat.ucla.edu/calculators/powercalc/
2 http://www.math.sfu.ca/stats/Courses/Stat-650/Notes/Handouts/node1.html
3 http://www.mp1-pwrc.usgs.gov/powcase/index.html
4 http://www.salmonweb.org/salmonweb/pubs/pacnwfin.html
5 http://trochim.human.cornell.edu/tutorial/flynn/multivar.htm
6 http://www.tufts.edu/~gdallal/STUDY.HTM
7 http://www.umass.edu/tei/mwwp/studydes.html
14
References
Hurlbert SH. 1984. Pseudo-replication and the design ofecological field experiments. Ecol Monogr 52:187-211.
Johnston CA, Detenbeck NE, Bonde JP, Niemi GJ. 1988.Geographic information systems for cumulative impactassessment. Photogr Engin Remote Sens 54:1609-1615.
Johnston CA, Detenbeck NE, Niemi GJ. 1990. Thecumulative effect of wetlands on stream water qualityand quantity: A landscape approach. Biogeochemistry10:105-141.
Kadlec RH, Knight RL. 1996. Treatment Wetlands. BocaRaton, FL: Lewis Publishers.
Karr JR, Chu EW. 1999. Restoring Life in RunningWaters: Better Biological Monitoring. Washington,DC: Island Press.
Kentula ME, Brooks RP, Gwin SE, Holland CC, ShermanAD, Sifneos JC. 1993. An Approach to ImprovingDecision Making in Wetland Restoration and Creation.Boca Raton, FL: CK Smoley.
Leibowitz SG, Abbruzzese A, Adamus PR, Hughes LE,Irish JT. 1992. A Synoptic Approach to CumulativeImpact Assessment: A Proposed Methodology.Environmental Research Laboratory, U.S. Environmen-tal Protection Agency, Corvallis, OR. EPA/600/R-92/167.
McCormick P, Newman S, Miao S, Reddy R, Gawlick D,Fitz C, Fontaine T, Marley D. 1999. Ecological Needsof the Everglades. In: Redfield G (ed). EvergladesInterim Report. South Florida Water ManagementDistrict, West Palm Beach, FL.
Mitsch WJ, Gosselink JG. 1993. Wetlands, 2nd ed. NewYork: Van Nostrand Reinhold.
Osenberg CW, Schmitt RJ, Holbrook SJ, Abu-Saba KE,Flegal R. 1994. Detection of environmental impactsnatural variability, effect size, power analysis. EcolAppl 4:16-30.
Palik AJ, Goebel CP, Kirkman KL, West L. 2000. Usinglandscape hierarchies to guide restoration of disturbedecosystems. Ecol Appl 10(1):189-202.
Adamus PR. 1992. Choices in Monitoring Wetlands. In:McKenzie DH, Hyatt DE, McDonald VJ (eds). Ecologi-cal Indicators. New York: Elsevier Applied Science,pp. 571-592.
Barbour MT, Gerritsen J, Snyder BD (eds). 1999. RapidBioassessment Protocols for Use in Wadeable Streamsand Rivers: Periphyton, Benthic Macroinvertebrates,and Fish, 2nd ed. U.S. Environmental ProtectionAgency, Washington, DC. EPA 841-B-99-002.
Beyers DW. 1998. Causal inference in environmentalimpact studies. J North Am Benthol Soc 17:367-373.
Davis SM, Ogden JC (eds). 1994. Everglades: TheEcosystem and Its Restoration. Delray Beach, FL: St.Lucie Press.
Detenbeck NE, Taylor DL, Lima A. 1996. Spatial andtemporal variability in wetland water quality in theMinneapolis/St. Paul, MN, metropolitan area. EnvironMonitor Assess 40:11-40.
Dodds WK, Smith VH, Zander B. 1997. Developingnutrient targets to control benthic chlorophyll levels instreams: a case study of the Clark Fork River. WaterRes 31:1738-1750.
Eaton AD, Clesceri LC, Greenberg AE (eds). 2000.Standard Methods for Examination of Water andWastewater, 19th ed. Washington, DC: AmericanPublic Health Association.
Green RH. 1979. Sampling Design and StatisticalMethods for Environmental Biologists. New York:Wiley.
Gwin SE, Kentula ME, Shaffer PW. 1999. Evaluating theeffects of wetland regulation throughhydrogeomorphic classification and landscapeprofiles. Wetlands 19(3):477-489.
Harris SC, Martin TH, Cummins KW. 1995. A model foraquatic invertebrate response to Kissimmee Riverrestoration. Restoration Ecol 3:181-194.
Hayek LC. 1994. Research Design for QuantitativeAmphibian Studies. In: Measuring and MonitoringBiological Diversity, Standard Methods for Amphib-ians. Washington, DC: Smithsonian Institution Press.

15
Paulsen SG, Larsen DP, Kaufmann PR, Whittier TR,Baker JR, Peck DV, McGue J, Hughes RM, McMullenD, Stevens D, Stoddard JL, Lazorchak J, Kinney W,Selle AR, Hjort R. 1991. EMAP-Surface WatersMonitoring and Research Strategy: Fiscal year 1991.Office of Research and Development, U.S. Environ-mental Protection Agency, Washington, DC. EPA/600/3-91/022.
Poole RW. 1972. An Introduction to QuantitativeEcology. New York: McGraw-Hill.
Rasmussen PW, Heisey DM, Nordheim EV, Frost TM.1993. Time Series Intervention Analysis: UnreplicatedLarge-scale Experiments. In: Scheiner SM, Gurevitch J(eds). Design and Analysis of Ecological Experiments.New York: Chapman and Hall.
Redfield G (ed). 1999. Everglades Interim Report. SouthFlorida Water Management District, West Palm Beach,FL.
Redfield G (ed). 2000. Everglades Consolidated Report.South Florida Water Management District, West PalmBeach, FL.
Redfield G (ed). 2001. Everglades Consolidated Report.South Florida Water Management District, West PalmBeach, FL.
Smith EP, Orvos D, Cairns J, Jr. 1993. Impact assessmentusing before-after control-impact (BACI) models:Concerns and comments. Can J Fish Aquat Sci 50:627-637.
Stevenson RJ. 1996. An Introduction to Algal Ecologyin Freshwater Benthic Habitats. In: Stevenson RJ,Bothwell M, Lowe RL (eds). Algal Ecology: Freshwa-ter Benthic Ecosystems. San Diego, CA: AcademicPress, pp. 3-33.
Stevenson RJ. 1997. Scale dependent determinants andconsequences of benthic algal heterogeneity. J NorthAm Benthol Soc 16(1):248-262.
Stewart-Oaten A. 1986. Assessing local impacts:progress and some problems. Oceans ’86 ConferenceRecord 3:964-973.
Stewart-Oaten A, Bence JR, Osenberg CW. 1992.Assessing effects of unreplicated perturbations: Nosimple solutions. Ecology 73:1396-1404.
Stewart-Oaten A, Murdoch WW, Parker KR. 1986.Environmental impact assessment:“Pseudoreplication” in time? Ecology 67:929-940.
Suter GW. 1993. Ecological Risk Assessment. BocaRaton, FL: Lewis Publishers.
Tate CM. 1990. Patterns and controls of nitrogen intallgrass prairie streams. Ecology 71:2007-2018.
Toth LA, Arrington DA, Brady MA, Muszick DA. 1995.Conceptual evaluation of factors potentially affectingrestoration of habitat structure within the channelizedKissimmee River ecosystem. Restoration Ecol 3:160-180.
Trexler JC. 1995. Restoration of the Kissimmee River—Aconceptual model of past and present fish communi-ties and its consequences for evaluating restorationsuccess. Restoration Ecol 3:195-210.
Underwood AJ. 1991. Beyond BACI: Experimentaldesigns for detecting human environmental impactson temporal variations in natural populations. AustralJ Marine Freshw Res 42:569-587.
Urquhart NS, Paulsen SG, Larsen DP. 1998. Monitoringfor policy-relevant regional trends over time. EcolAppl 8(2):246-257.
U.S. Environmental Protection Agency (EPA). 1990.Water Quality Standards for Wetlands: NationalGuidance. Office of Water, Washington, DC. EPA 440/5-90-011.
U.S. EPA. 1996. National Water Quality Inventory 1996Report to Congress. Office of Water, Washington, DC.EPA 841-R-97-008.
U.S. EPA. 1998. National Water Quality Inventory 1998Report to Congress. Office of Water, Washington, DC.EPA 841-S-00-001.
U.S. EPA. 2000. Nutrient Criteria Technical GuidanceManual: Rivers and Streams. Office of Water, Wash-ington, DC. EPA 822-B-00-002.