Embed Size (px)
Citation preview

Energy Procedia 37 ( 2013 ) 4006 – 4014
1876-6102 © 2013 The Authors. Published by Elsevier Ltd.Selection and/or peer-review under responsibility of GHGTdoi: 10.1016/j.egypro.2013.06.300
GHGT-11
Methodology for Evaluating Technical Risks and Monitoring Methods Selection for CO2geological Storage in Oltenia Region
Sorin ANGHELa, Constantin Stefan SAVAb,Alexandra DUDUc aNational Research and Development Institute for Marine Geology and Geoecology-Dimitrie Onciul 23-25, 024054Bucharest, Romania b National Research and Development Institute for Marine Geology and Geoecology-Dimitrie Onciul 23-25, 024054Bucharest, Romania cNational Research and Development Institute for Marine Geology and Geoecology-Dimitrie Onciul 23-25, 024054Bucharest, Romania
Abstract:
The selection of the monitoring methods to be included in the monitoring plan will be madeby analyzing each potential method in relation with the characteristics of the storage area and the degree of applicability in monitoring a CO2 storage site. Will be determine for each monitoring technique the specific parameters for planing the monitoring surveys and the associated costs. A special focus will be put on several specific monitoring techniques and on the way that these can be used for monitoring storage sites similar with the ones from Oltenia region where the Getica Demo Project is located. These techniques are InSar, gravimetry and soil-gas measurements. Although these techniques were applied successfully in a few CO2 storage projects, their feasibility as monitoring methods in the field of CCS was not yet fully demonstrated. The project Geticawill examine the feasibility of these potential monitoring techniques through geophysical,geological and terrain models based on the characteristics of the storage complex and on the predicted CO2 behaviour in the reservoir. The models will rely also on the field data acquired prior to injection. The InSAR phase difference is proportional to the change in range or distance between the antenna (satellite) and the ground surface. This change can be transformed in a precise vertical component and a less precise horizontal one knowing the inclination of the satellite antenna. It returns a map of deformation over a large spatial area with a spatial resolution of the pixels size (which usually converts in about 20 meters for the ESS satellites). A gravity survey is a set of measurements of the gravitational field at a series of different locations over an area of interest. The objective in exploration work is to associate variations with differences in the distribution of densities and hence rock types. Occasionally the whole gravitational field or derivatives of the gravitational field are measured, but usually the difference between the gravity field at two points is measured. © 2013 The Authors. Published by Elsevier Ltd. Selection and/or peer-review under responsibility of GHGT Keywords: CO2 storage; Getica Demo Project; injection; reservoir monitoring; numerical modeling
Available online at www.sciencedirect.com
© 2013 The Authors. Published by Elsevier Ltd.Selection and/or peer-review under responsibility of GHGT

Sorin Anghel et al. / Energy Procedia 37 ( 2013 ) 4006 – 4014 4007
1. Introduction
Monitoring activities will be performed on the selected storage site with the aim of managing the performance of the injection operations and controlling the risk inherent to storage, pursuant to the obligations laid in Annex II of the EU Directive 2009/31/EC and its implementation Guidelines
The Monitoring Plan has been broken down into three categories, according to the objectives of monitoring activities:Injection monitoring: insuring the control of injection operationsVerification monitoring: verifying the reservoir integrity and tracking the fate of the CO2 plumeAssurance monitoring: putting in place a surveillance system with the specific objectives of detecting potential leakage in the
overburden or at the surface, and impact of such a leakage
Not all of them have been applied in the field to CO2 storage projects, and some of them belong to the domain of research and development rather than to commercial technologies. For this reason, a selection process was performed to identify those monitoring technologies that may beapplied (Table 2). The identification of the risk prevention measures by means of monitoring was based on this selection.

4008 Sorin Anghel et al. / Energy Procedia 37 ( 2013 ) 4006 – 4014
Table2: Portfolio of applicable monitoring measures. Geophysical technologies appear in blue as theydiscussed thoroughly in this report. R&Dapproaches appear in light grey.
More specifically, to address injection operation control, well head pressure measurements, bottom hole pressure and temperature measurements as well as injection rate measurements need to be performed for each injection well. To quantify the injected CO2, flow meters need to be used, and gas stream composition and phase needs to be assessed. To assess cap rock and fault integrity, either micro-seismic monitoring or pressure interference tests can be used. For well integrity in both injection and monitoring wells, continuous annulus pressures would be a minimum, but it is also suggested to acquire casing and cement logs at a certain frequency to ensure hydraulic isolation. In case abandoned wells are presentwithin the field, soil gas measurements might be the only feasible measurement, and thus need to be implemented. If potable water aquifers arepresent above the storage site, their quality needs to be carefully assessed, throughout the lifetime of a project, using appropriate measurements.A full monitoring plan, specific for each aquifer that takes into account aquifer circulation, local environmental conditions, etc... needs to be put in place. Atmospheric concentrations can also be measured. Finally, the quantification of leaks is difficult to achieve at the current level of development of available monitoring technologies and only R&D approaches are available.CO2 displacement and fate (plume tracking) and detection of leaks/ migration (leakage detection) needs to be looked at much more in detail, aswill be shown in the remaining of this report. They can be addressed, in specific cases, by geophysical monitoring techniques. These techniquesrequire a technical feasibility study to verify their ability to detect the expected changes in physical properties that they are designed to monitor,as will be shown below.
2.Monitoring technology
2.1Gravity
2.1.1 Application in CO2 storage A gravity survey is a set of measurements of the gravitational field at a series of different locations over an area of interest. The objective in exploration work is to associate variations with differences in the distribution of densities and hence rock types. Occasionally the wholegravitational field or derivatives of the gravitational field are measured, but usually the difference between the gravity field at two points ismeasured.
In the framework of CO2 storage, gravity has been successfully applied in the Sleipner project. Signal was at the limit of detectability in this case , but the gravity survey allowed the geophysicists to determine the value of CO2 density. Since at this depth, CO2 density is highly variable(function of temperature and pressure), it was poorly constrained beforehand.

Sorin Anghel et al. / Energy Procedia 37 ( 2013 ) 4006 – 4014 4009
2.1.2Assumptions We base our calculation on the ECLIPSE model. The results presented in this paragraph assume that the CO2 distribution through time in this model is representative of what will really happen underground. If this vision evolves, this modeling should be redone, and the results might be significantly different. Specifically, if the CO2 plume thickness is smaller, the gravity signal might become much smaller. Gravity is not very sensitive to vertical migration of the CO2 plume. If leakage occurs, and the CO2 moves vertically, it will not be easily be visible in a gravity survey. Gravity is sensitive to lateral migration of the CO2, and, might provide insights in this respect. Onshore, other phenomena can occur, which are not taken into account, for example, water table variations, which will modify the gravity signal. These variations are expected to be taken into account in the background noise level, and contribute to the minimum level of detectability of 10 Gal.
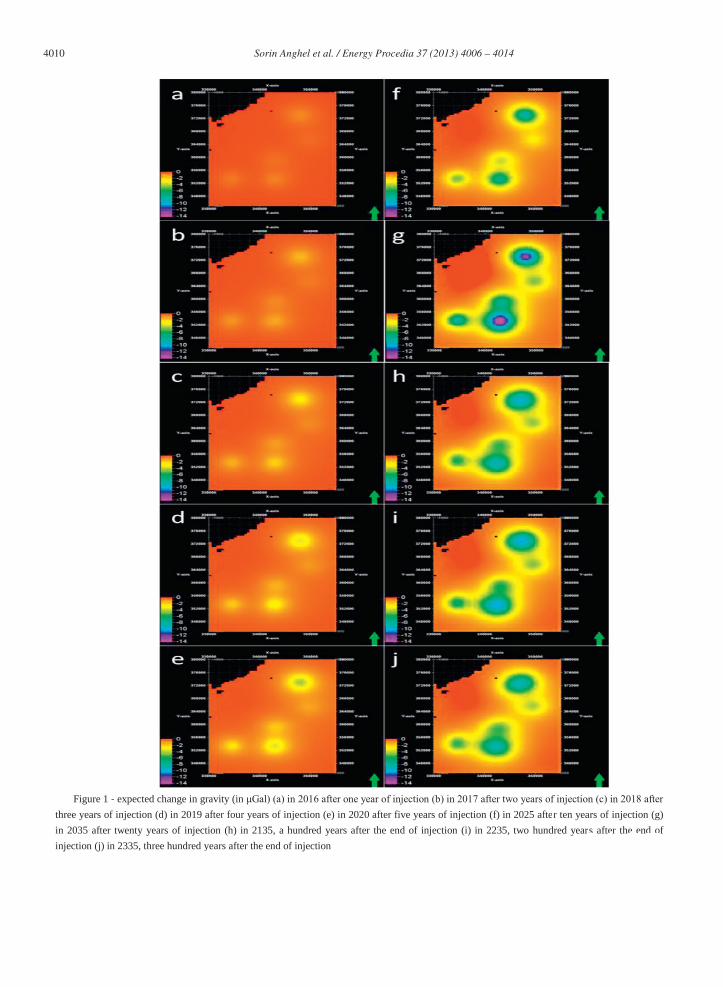
2.1.3 Results and comments The analysis presented in this paragraph is based on the ECLIPSE model. We run a full 3D forward modeling to calculate the expected gravity change through time. Results of this simulation are presented in figure 1 and table 3. As stated above, the level of detectability for gravity measurements is ~5-10 13 years of injection, and only around wells INJ1N and INJ3N. Once detectability is reached, the plume will be detectable during the entire monitoring period around those two injectors, which makes gravity a potentially
Year Gravity change ( Gal)
2016 -0.69
2017 -1.6
2018 -2.58
2019 -3.53
2020 -4.42
2025 -8.45
2035 -14.21
2135 -10.63
2235 -10.11
2335 -9.13
Table3: Gravity change between the beginning of injection and selected years.
4010 Sorin Anghel et al. / Energy Procedia 37 ( 2013 ) 4006 – 4014
Figure 1 - expected change in gravity (inthree years of injection (d) in 2019 after four years of injection (e) in 2020 after five years of injection (f) in 2025 after ten years of injection (g)in 2035 after twenty years of injection (h) in 2135, a hundred years after the end of injection (i) in 2235, two hundred years after the end of injection (j) in 2335, three hundred years after the end of injection

Sorin Anghel et al. / Energy Procedia 37 ( 2013 ) 4006 – 4014 4011
2.2 INSAR 2.2.1 Aplication in CO2 storage
Repeat pass satellite aperture radar interferometry (InSAR) involves interferometric phase comparison of SAR images gathered at different
times and with different baselines (e.g., distance perpendicular to the satellite flight direction between two repeat orbits). The InSAR phase difference is proportional to the change in range or distance between the antenna (satellite) and the ground surface. This change can be transformed in a precise vertical component and a less precise horizontal one knowing the inclination of the satellite antenna. It returns a map of deformation over a large spatial area with a spatial resolution of the pixels size (which usually converts in about 20 meters for the ESS satellites). It can provide vertical deformations with millimetric accuracy in favourable configurations according to some authors (Ferretti et al., 2001, Hooper et al., 2004). The main limitations are related to the problem of permanent scatterers (trees, snow, ice, atmospheric inhomogeneities etc.) which can drastically reduce the accuracy of the method. However, important progress has been made recently with the development of differential SAR Interferometry (DInSAR) (Ferretti et al., 2001). The coupling with a GPS baseline and others developments (processing and algorithms etc.) can improve the precision of this technique. We will not enter here into the different steps of the processing of SAR images and will assume that a precision of 5 to 10 mm for the vertical ground motion based on results obtained by several authors (Patzec et al., 2001; Carnec et al., 2000; Hooper et al., 2004). InSAR is based on the repeat pass of a satellite over a particular region, 35 days for images based on the ESS satellite for example. This technique cannot offer a continuous recording of the ground deformation. At best, a snapshot can be obtained every month, or every few months. This poor sampling in time is balanced by a large spatial coverage and a relatively low cost.
InSAR works best in areas with consistent radar reflections. Zone 5 is located in a rural area with small cities and control points will have to be carefully chosen if this technology is selected for monitoring. Accuracy in displacement with just two scenes is in the cm range but a mm/year level accuracy in displacement rate (i.e., in velocity) can be achieved by stacking data to eliminate atmospheric and orbital errors, as explained above.
One deficiency of standard InSAR is that the measurement is along a slant range which is not able to resolve the horizontal and vertical
components of the recorded motion. Again there are methods available to mitigate this issue. Scenes can be captured on ascending and descending orbits, and newer satellites can provide some right-look/left-look capability. We will consider here that InSAR measurement essentially capture the vertical component of the displacement.
InSAR technology has been applied to the In Salah project, Algeria (Vasco, 2008; Rutqvist et al., 2009).
2.2.2 Assumptions
Deformation resulting from pressure change in the reservoir is assumed to be elastic (the model is homogeneous and elastic). Deformation is assumed to result from reservoir production and injection only. Other sources of deformation (e.g. pressure changes within
shallow aquifers, constructions, sand movement) are assumed to be negligible. 2.2.3 Results and comments
Figure 2 and Table 4 show the expected uplift at selected dates. The uplift should be above detectability (10 mm) only one year after the beginning of injection, and should reach 7.3 cm after 20 years of injection. This is well above detectability threshold and makes InSAR a very appropriate technology for Zone 5 monitoring, if the hypotheses taken in this calculation are correct.

4012 Sorin Anghel et al. / Energy Procedia 37 ( 2013 ) 4006 – 4014

Sorin Anghel et al. / Energy Procedia 37 ( 2013 ) 4006 – 4014 4013
Figure 2 - expected uplift (in mm) (a) in 2016 after one year of injection (b) in 2017 after two years of injection (c) in 2018 after three years of injection (d) in 2019 after four years of injection (e) in 2020 after five years of injection (f) in 2025 after ten years of injection (g) in 2035 after twenty years of injection (h) in 2135, a hundred years after the end of injection (i) in 2235, two hundred years after the end of injection (j) in 2335, three hundred years after the end of injection.
Year Uplift (mm)
2016 10
2017 16
2018 20
2019 24
2020 27
2025 43
2035 73
2135 45
2235 43
2335 43
Table 4: Maximum uplift between the beginning
of injection, and selected years 3. Conclusions
Most of the objectives of a monitoring plan are straightforward to achieve, and technologies need to be selected among possible technologies
listed in Table 2. Technology selection to monitor "CO2 displacement and fate" and for "detection of leaks/migration" is more complicated to address because the applicability of available technologies to the geological environment considered for injection must be evaluated first.
For Zone 5, to monitor "CO2 displacement and fate", we find that time-lapse seismic, time-lapse surface deformation measurements (InSAR)
and time-lapse gravity are applicable. These are global technologies and will acquire information for the entire field in one acquisition. Some local technologies, which will acquire information within a few hundred meters from one monitoring well are also applicable: time-lapse cross-well seismic, time-lapse cross-well electro-magnetic and time-lapse Vertical Seismic Profile. For Getica project, we have two main strategies could be followed, that would answer both monitoring objectives simultaneously, monitor "CO2 displacement and fate" and "detection of leaks/migration". The first strategy relies on repeat 3D seismic surveys. These repeat surveys could be spaced through time if alternative cheaper technologies, such as surface deformation measurements (InSAR), are used to fill the gap. The second strategy relies on using a number of

4014 Sorin Anghel et al. / Energy Procedia 37 ( 2013 ) 4006 – 4014
monitoring wells, equipped with pressure and temperature gauges. This second strategy would make it possible to use additional well log measurements that would provide accurate distributions of CO2 saturation at the monitoring wells. References Alnes, H. E., O.; Nooner, S.; Sasagawa, G.; Stenvold, T.; Zumberge, M. (2011). Results from Sleipner gravity monitoring: updated density and
temperature. Energy procedia(4), 5504-5511. Arts, R. J., Meekes, J. A. C., Brouwer, J. H., van der Werf, M., Noorlandt, R. P., Paap, B., . . . Maas, J. (2011). Results of a monitoring pilot with
a permanent buried multicomponent seismic array at Ketzin. [doi: 10.1016/j.egypro.2011.02.288]. Energy Procedia, 4, 3588-3595. Boait, F., White, N., Chadwick, A., Noy, D., & Bickle, M. (2011). Layer spreading and dimming within the CO2 plume at the sleipner field in
the north sea. [doi: 10.1016/j.egypro.2011.02.244]. Energy Procedia, 4, 3254-3261. Carnec C. and Delacourt C. Three years of mining subsidence monitored by Insar interferometry near gardanne, france. Journal of Applied
Geophysics, 43:43 54, 2000. Chadwick, A. A., R.; Eiken, O.; Williamson, P.; Williams, G. (2006). Geophysical monitoring of the CO2 plume at Sleipner, North Sea: an
outline review. Springer, 303-314. Ferretti A., Prati C., and Rocca F. Permanent scatterers in sar interferometry. IEEE Transactions on Geoscience and Remote Sensing, 39(1):8
20, 2001. Hooper A., Zebker H., Segall P., and Kampes B. A new method for measuring deformation on volcanoes and other natural terrains using insar
persistent scatterers. Geophys. Res. Lett., 31:L23611, 2004. Jones, D. G., Lister, T. R., Smith, D. J., West, J. M., Coombs, P., Gadalia, A., . . . Lombardi, S. (2011). In Salah gas CO2 storage JIP: Surface
gas and biological monitoring. [doi: 10.1016/j.egypro.2011.02.285]. Energy Procedia, 4, 3566-3573. Lüth, S., Bergmann, P., Cosma, C., Enescu, N., Giese, R., Götz, J., . . . Zhang, F. (2011). Time-lapse seismic surface and down-hole
measurements for monitoring CO2 storage in the CO2SINK project (Ketzin, Germany). [doi: 10.1016/j.egypro.2011.02.268]. Energy Procedia, 4, 3435-3442.
Martens, S., Liebscher, A., Möller, F., Würdemann, H., Schilling, F., & Kühn, M. (2011). Progress report on the first european on-shore CO2 storage site at ketzin (Germany) -- Second year of injection. [doi: 10.1016/j.egypro.2011.02.243]. Energy Procedia, 4, 3246-3253.
Mathieson, A., Midgely, J., Wright, I., Saoula, N., & Ringrose, P. (2011). In Salah CO2 Storage JIP: CO2 sequestration monitoring and verification technologies applied at Krechba, Algeria. [doi: 10.1016/j.egypro.2011.02.289]. Energy Procedia, 4, 3596-3603.
Mito, S., & Xue, Z. (2011). Post-Injection monitoring of stored CO2 at the Nagaoka pilot site: 5 years time-lapse well logging results. [doi: 10.1016/j.egypro.2011.02.248]. Energy Procedia, 4, 3284-3289.
Patzek T.W., Silin D.B., and Fielding E. Use of satellite radar images in surveillance and control of two giant oilfields in california. In SPE 71610, editor, SPE Annual Technical Conference and Exhibition, 2001.
Rostron, B., & Whittaker, S. (2011). 10+ years of the IEA-GHG Weyburn-Midale CO2 monitoring and storage project: Successes and lessons learned from multiple hydrogeological investigations. [doi: 10.1016/j.egypro.2011.02.294]. Energy Procedia, 4, 3636-3643.
Schlumberger (1989) Cased hole Log Interpretation Principles/Applications. SMP 7025 Schlumberger Carbom Services (2010) Storage fesability stady-CCS Demo Project J. Rutqvist, D. W. Vascoa and L. Myera, Coupled reservoir-geomechanical analysis of CO2 injection at In Salah, Algeria, Energy Procedia,
Volume 1, Issue 1, February 2009, Pages 1847-1854, Greenhouse Gas Control Technologies 9, Proceedings of the 9th International Conference on Greenhouse Gas Control Technologies (GHGT-9), 16 20 November 2008, Washington DC, USA.
Vandeweijer, V., van der Meer, B., Hofstee, C., Mulders, F., D'Hoore, D., & Graven, H. (2011). Monitoring the CO2 injection site: K12-B. [doi: 10.1016/j.egypro.2011.02.532]. Energy Procedia, 4, 5471-5478.
D.W. Vasco. Reservoir monitoring and characterization using satellite geodetic data: Interferometric Synthetic Aperture Radar observations from the Krechba field, Algeria. Lawrence Berkeley National Laboratory Paper LBNL-308E, 2008.
White, D. J. (2011). Geophysical monitoring of the Weyburn CO2 flood: Results during 10 years of injection. Energy Procedia(4), 3628-3635. Whittaker, S., Rostron, B., Hawkes, C., Gardner, C., White, D., Johnson, J., . . . Seeburger, D. (2011). A decade of CO2 injection into depleting
oil fields: Monitoring and research activities of the IEA GHG Weyburn-Midale CO2 Monitoring and Storage Project. [doi: 10.1016/j.egypro.2011.02.612]. Energy Procedia, 4, 6069-6076.