Embed Size (px)
Citation preview
Geophysical monitoring of permafrost conditions at Iqaluit InternationalAirport, Baffin Island, Nunavut
by G.A. Oldenborger1, A.-M. LeBlanc
2and W.E. Sladen
2
1Geological Survey of Canada, Natural Resources Canada, Ottawa, Ontario, [email protected] Survey of Canada, Natural Resources Canada, Ottawa, Ontario
Oldenborger, G.A., LeBlanc, A.-M. and Sladen, W.E. 2014: Geophysical monitoring of permafrost conditions at Iqaluit International Air-port, Baffin Island, Nunavut; in Summary of Activities 2013, Canada-Nunavut Geoscience Office, p. 129–138.
Abstract
Iqaluit International Airport presently suffers from instability and subsidence along its runway, taxiways and apron. Insta-
bility may be related to permafrost, permafrost degradation and associated drainage conditions. In particular, Taxiway Al-
pha is significantly impacted by permafrost degradation and thaw settlement. A suite of geophysical data was collected in
2012–2013 along a selected section of Taxiway Alpha to characterize permafrost conditions and investigate active perma-
frost processes, including seasonal changes in unfrozen water content. Even with cold permafrost temperatures, the data in-
dicate material types with low electrical resistivity, suggesting fine-grained marine sediments and/or saline pore water with
the potential for freezing-point depression and significant unfrozen water content. Observed seasonal changes in the data
indicate that subsurface temperature fluctuations may result in significant ice formation near the thaw table and changes in
unfrozen moisture content in the permafrost.
Résumé
L’instabilité et l’affaissement du sol risquent de causer des dommages à la piste de l’aéroport international d’Iqaluit, ainsi
qu’à ses voies de circulation et son aire de trafic. Cette instabilité peut être le résultat de l’action du pergélisol, de la dégrad-
ation de ce dernier et des conditions de drainage qui lui sont associées. La voie de circulation Alpha est tout particulièrement
touchée par les effets de la dégradation du pergélisol et du tassement dû au dégel. Une série de données géophysiques a été
recueillie en 2012–2013 le long d’une section déterminée de la voie de circulation Alpha en vue d’établir les caractéris-
tiques propres aux conditions du pergélisol et d’étudier les processus actifs liés au pergélisol, notamment les variations
saisonnières au niveau de la teneur en eau non gelée. Même dans des conditions où les températures de surface du pergélisol
sont froides, les données révèlent qu’il s’agit de types de matériel à faible résistivité électrique, ce qui semble indiquer la
présence de soit des sédiments marins à grain fin, soit d’eau interstitielle saline, ou les deux, lesquels peuvent être aussi bien
sujet à des affaissements lorsque le point de congélation est atteint que se caractériser par la présence d’une teneur élevée en
eau non gelée. Des variations saisonnières dans les données semblent indiquer que les fluctuations de la température
enregistrées en subsurface peuvent potentiellement entraîner la formation de quantités importantes de glace à proximité du
plafond du pergélisol, ainsi que des changements au niveau de la teneur en eau non gelée au sein du pergélisol.
Introduction
Permafrost and associated ground ice can affect land-based
infrastructure through their influence on ground stability
and drainage patterns. Iqaluit International Airport, in the
capital of Nunavut, experiences noticeable settlement and
frost-cracking problems that affect engineered surfaces,
such as the runway, taxiways, aprons and embankments.
Deterioration requiring significant repair has been attrib-
uted to excessive permafrost degradation associated with
the presence of water, possibly extending beneath engi-
neered surfaces in places (Knapik and Hanna, 1998).
Despite extensive studies and remediations, recurring set-
tlement, deformation and noticeable damage have required
several campaigns of resurfacing and reparation (Laroch-
elle and Haché, 1991; Dietrich and Mitchell, 2011). Detailed
and extensive characterization of permafrost and changing
permafrost conditions is critical for understanding risks to
airport infrastructure and to other land-based infrastructure
Summary of Activities 2013 129
This publication is also available, free of charge, as colour digital files in Adobe Acrobat® PDF format from the Canada-NunavutGeoscience Office website: http://cngo.ca/summary-of-activities/2013/.

across Canada’s North. In addition, a better understanding
of permafrost processes is required, particularly with re-
spect to the role of groundwater and unfrozen water con-
tent, and the relationship to thaw susceptibility of materials.
To this end, the Geological Survey of Canada (GSC), in co-
operation with the Canada-Nunavut Geoscience Office
(CNGO), has established a geophysical test site on Taxiway
Alpha of the Iqaluit International Airport to investigate the
potential for electrical resistivity surveys to resolve impor-
tant Earth features, such as sediment or terrain type, ice-
bearing sediment, ice-rich regions, thaw zones and un-
frozen water, in Canada’s continuous permafrost region.
The distinct electrical properties of frozen ground make
electrical and electromagnetic geophysics a potential tool
for spatially extensive and noninvasive characterization of
permafrost terrain (e.g., Scott et al., 1990; Hauck et al.,
2003; Ross et al., 2007; Fortier et al., 2008; Wolfe et al.,
2013). An innovative experiment uses time-lapse data col-
lection and integration of multiple data types to assess the
ability to image subsurface changes in unfrozen water con-
tent, both spatially and temporally. Unfrozen water content
is an important variable in calculating the thermal proper-
ties of sediment, which are used to predict the behaviour of
the ground upon warming and thawing.
Study area
Iqaluit International Airport (YFB, CYFB) is located in
Iqaluit, Nunavut, at the head of Frobisher Bay on Baffin Is-
land (Figure 1a). It is built on flat terrain surrounded by
hills and rocky plateaus of the Precambrian shield within
the continuous permafrost zone (Heginbottom et al., 1995).
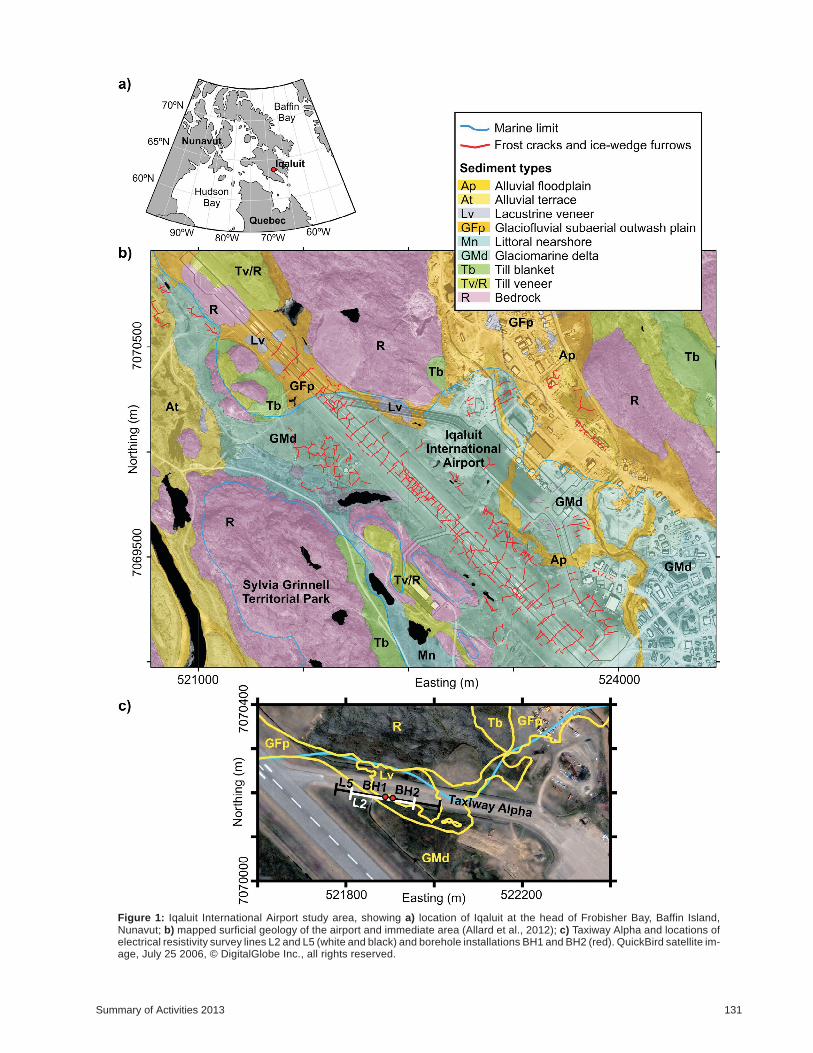
The surficial geology was mapped by Allard et al. (2012).
The present-day Runway 17/35 was originally constructed
(in part) in 1942, followed by a runway extension in 1948.
The 1942 portion of Runway 17/35 is built on glaciomarine
delta deposits composed of sand, silt, boulders and gravel;
the 1948 portion is built on glaciofluvial outwash, bedrock
and fill. Alluvial channels and lacustrine deposits are pres-
ent under the embankments of taxiways, aprons and access
roads, and till and marine sediments are observed in the im-
mediate area (Figure 1b). These smaller scale deposits (par-
ticularly former lake sediments and stream deposits that
were covered by infilling during construction) may play a
critical role in determining permafrost conditions due to
their relationship with water channelling (alluvial sedi-
ments) or excess ice (fine-grained sediments); knowledge
of their subsurface extent is therefore important.
This study focuses on Taxiway Alpha (Taxi A), which is a
known area of distress that includes differential settlement,
undulation and cracking, and displacement (LeBlanc et al.,
2012; Short et al., 2012; Short et al., 2013). In response to
this distress, the pavement was removed from a section of
Taxi A in 2010, thus restoring it to a granular surface. The
stratigraphy underlying Taxi A comprises approximately
1–4 m of gravel embankment material (unlikely to be frost
susceptible) overlying silty sand to sandy silt to depths of at
least 7 m. The bedrock surface was encountered during
cored drilling in the middle of Taxi A at approximately
7.4 m depth (M. Allard, pers. comm., 2013). Bedrock was
also possibly encountered during air-track drilling (no re-
covery) along the shoulder of Taxi A at 16–17 m depth,
demonstrating that the bedrock surface can be expected to
have relatively strong topography in the area. Groundwater
has been reported to flow in a northeast direction under
Taxi A (Larochelle and Haché, 1991), presumably along
the base of the active layer.
The mean annual ground temperature for southern Baffin
Island is –5 to –10ºC, with low to high occurrence of ground
ice, including ice wedges and massive ice bodies (Hegin-
bottom et al., 1995; Allard et al., 2012). As part of GSC-
CNGO activities, thermistor cables were installed in 2010
and 2011 in the natural terrain and within the embankment
infrastructures (LeBlanc et al., 2013). The permafrost tem-
perature recorded in natural terrain is approximately –5ºC
at a depth of 10 m with an active-layer thickness of 1.5 m.
Active-layer thickness is locally observed to be variable
and can be in excess of 4 m under paved infrastructure
(Larochelle and Haché, 1991; Dietrich and Mitchell, 2011).
Methods
Electrical resistivity
Electrical resistivity of Earth materials is a complicated
function of many variables. However, in most near-surface
sedimentary environments, it depends primarily on the
amount and connectivity of the pore water and the mobility
of charge-carrying ions in the pore water. Permafrost has a
strong electrical signature because the freezing of water
greatly reduces the availability and connectivity of pore
water for electrolytic conduction, which results in a signifi-
cant increase in electrical resistivity (King et al., 1988).
Conversely, regions of unfrozen ground within permafrost
terrain will have relatively low electrical resistivity. Al-
though permafrost is generally electrically resistive, appre-
ciable clay content or saline pore water can result in re-
duced electrical resistivity due to increased pore-water
conductivity and freezing-point depression (e.g., Ross et
al., 2007). Measurements of electrical resistivity in perma-
frost terrain can generally be used to interpret some combi-
nation of material type, temperature and the frozen or un-
frozen state of pore water; measurements taken over time
can be compared to infer changes in dynamic properties,
such as temperature, moisture or ice content, while sup-
pressing the effects of material heterogeneity or systematic
errors (LaBrecque and Yang, 2001).
For time-lapse monitoring, a permanent array of 72 elec-
trodes at 2 m spacing was buried along the shoulder of
130 Canada-Nunavut Geoscience Office
Summary of Activities 2013 131
Figure 1: Iqaluit International Airport study area, showing a) location of Iqaluit at the head of Frobisher Bay, Baffin Island,Nunavut; b) mapped surficial geology of the airport and immediate area (Allard et al., 2012); c) Taxiway Alpha and locations ofelectrical resistivity survey lines L2 and L5 (white and black) and borehole installations BH1 and BH2 (red). QuickBird satellite im-age, July 25 2006, © DigitalGlobe Inc., all rights reserved.
Taxi A in July 2012 (L2 in Figure 1c). Installed electrodes
help to reduce the contact resistance (which is high in per-
mafrost terrain) and improve the stability of the data over
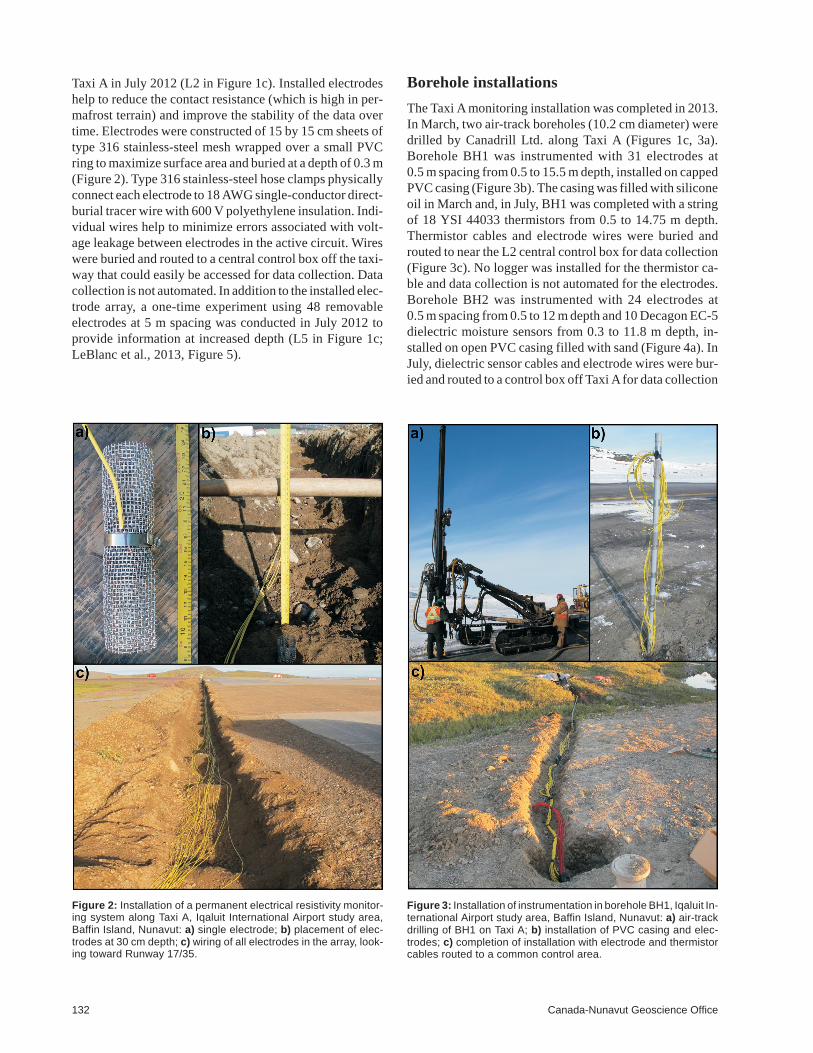
time. Electrodes were constructed of 15 by 15 cm sheets of
type 316 stainless-steel mesh wrapped over a small PVC
ring to maximize surface area and buried at a depth of 0.3 m
(Figure 2). Type 316 stainless-steel hose clamps physically
connect each electrode to 18 AWG single-conductor direct-
burial tracer wire with 600 V polyethylene insulation. Indi-
vidual wires help to minimize errors associated with volt-
age leakage between electrodes in the active circuit. Wires
were buried and routed to a central control box off the taxi-
way that could easily be accessed for data collection. Data
collection is not automated. In addition to the installed elec-
trode array, a one-time experiment using 48 removable
electrodes at 5 m spacing was conducted in July 2012 to
provide information at increased depth (L5 in Figure 1c;
LeBlanc et al., 2013, Figure 5).
Borehole installations
The Taxi A monitoring installation was completed in 2013.
In March, two air-track boreholes (10.2 cm diameter) were
drilled by Canadrill Ltd. along Taxi A (Figures 1c, 3a).
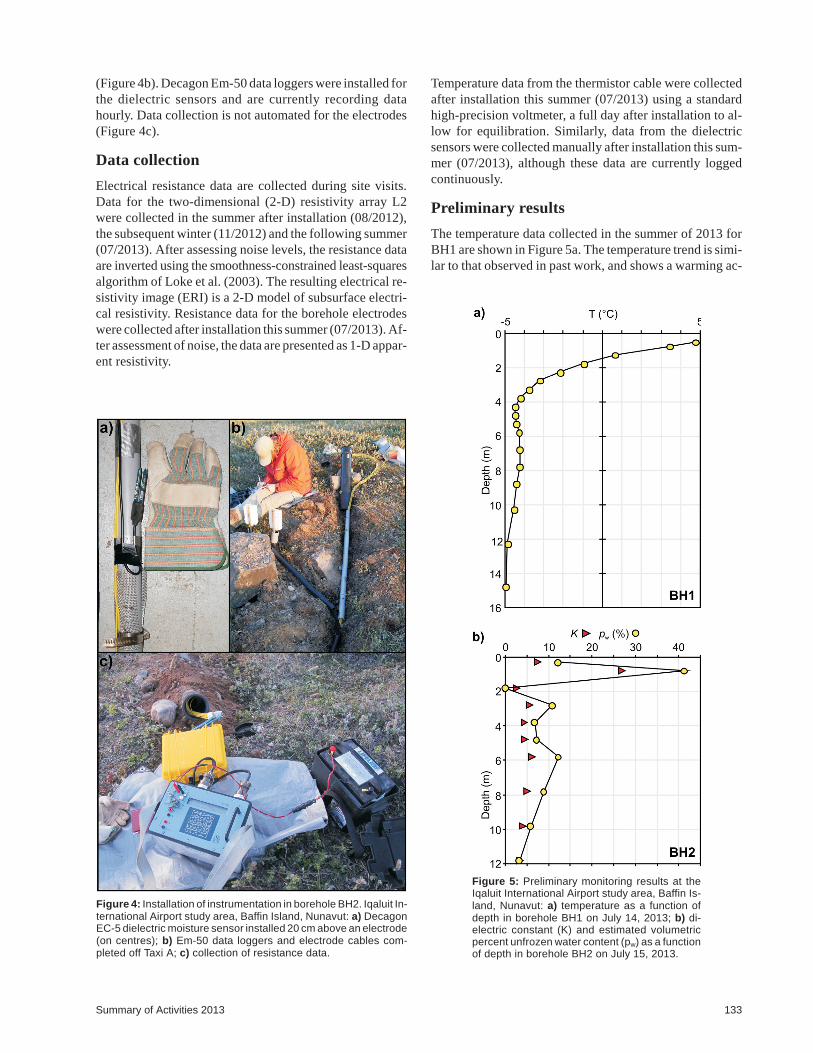
Borehole BH1 was instrumented with 31 electrodes at
0.5 m spacing from 0.5 to 15.5 m depth, installed on capped
PVC casing (Figure 3b). The casing was filled with silicone
oil in March and, in July, BH1 was completed with a string
of 18 YSI 44033 thermistors from 0.5 to 14.75 m depth.
Thermistor cables and electrode wires were buried and
routed to near the L2 central control box for data collection
(Figure 3c). No logger was installed for the thermistor ca-
ble and data collection is not automated for the electrodes.
Borehole BH2 was instrumented with 24 electrodes at
0.5 m spacing from 0.5 to 12 m depth and 10 Decagon EC-5
dielectric moisture sensors from 0.3 to 11.8 m depth, in-
stalled on open PVC casing filled with sand (Figure 4a). In
July, dielectric sensor cables and electrode wires were bur-
ied and routed to a control box off Taxi Afor data collection
132 Canada-Nunavut Geoscience Office
Figure 2: Installation of a permanent electrical resistivity monitor-ing system along Taxi A, Iqaluit International Airport study area,Baffin Island, Nunavut: a) single electrode; b) placement of elec-trodes at 30 cm depth; c) wiring of all electrodes in the array, look-ing toward Runway 17/35.
Figure 3: Installation of instrumentation in borehole BH1, Iqaluit In-ternational Airport study area, Baffin Island, Nunavut: a) air-trackdrilling of BH1 on Taxi A; b) installation of PVC casing and elec-trodes; c) completion of installation with electrode and thermistorcables routed to a common control area.
(Figure 4b). Decagon Em-50 data loggers were installed for
the dielectric sensors and are currently recording data
hourly. Data collection is not automated for the electrodes
(Figure 4c).
Data collection
Electrical resistance data are collected during site visits.
Data for the two-dimensional (2-D) resistivity array L2
were collected in the summer after installation (08/2012),
the subsequent winter (11/2012) and the following summer
(07/2013). After assessing noise levels, the resistance data
are inverted using the smoothness-constrained least-squares
algorithm of Loke et al. (2003). The resulting electrical re-
sistivity image (ERI) is a 2-D model of subsurface electri-
cal resistivity. Resistance data for the borehole electrodes
were collected after installation this summer (07/2013). Af-
ter assessment of noise, the data are presented as 1-D appar-
ent resistivity.
Temperature data from the thermistor cable were collected
after installation this summer (07/2013) using a standard
high-precision voltmeter, a full day after installation to al-
low for equilibration. Similarly, data from the dielectric
sensors were collected manually after installation this sum-
mer (07/2013), although these data are currently logged
continuously.
Preliminary results
The temperature data collected in the summer of 2013 for
BH1 are shown in Figure 5a. The temperature trend is simi-
lar to that observed in past work, and shows a warming ac-
Summary of Activities 2013 133
Figure 4: Installation of instrumentation in borehole BH2. Iqaluit In-ternational Airport study area, Baffin Island, Nunavut: a) DecagonEC-5 dielectric moisture sensor installed 20 cm above an electrode(on centres); b) Em-50 data loggers and electrode cables com-pleted off Taxi A; c) collection of resistance data.
Figure 5: Preliminary monitoring results at theIqaluit International Airport study area, Baffin Is-land, Nunavut: a) temperature as a function ofdepth in borehole BH1 on July 14, 2013; b) di-electric constant (K) and estimated volumetricpercent unfrozen water content (pw) as a functionof depth in borehole BH2 on July 15, 2013.
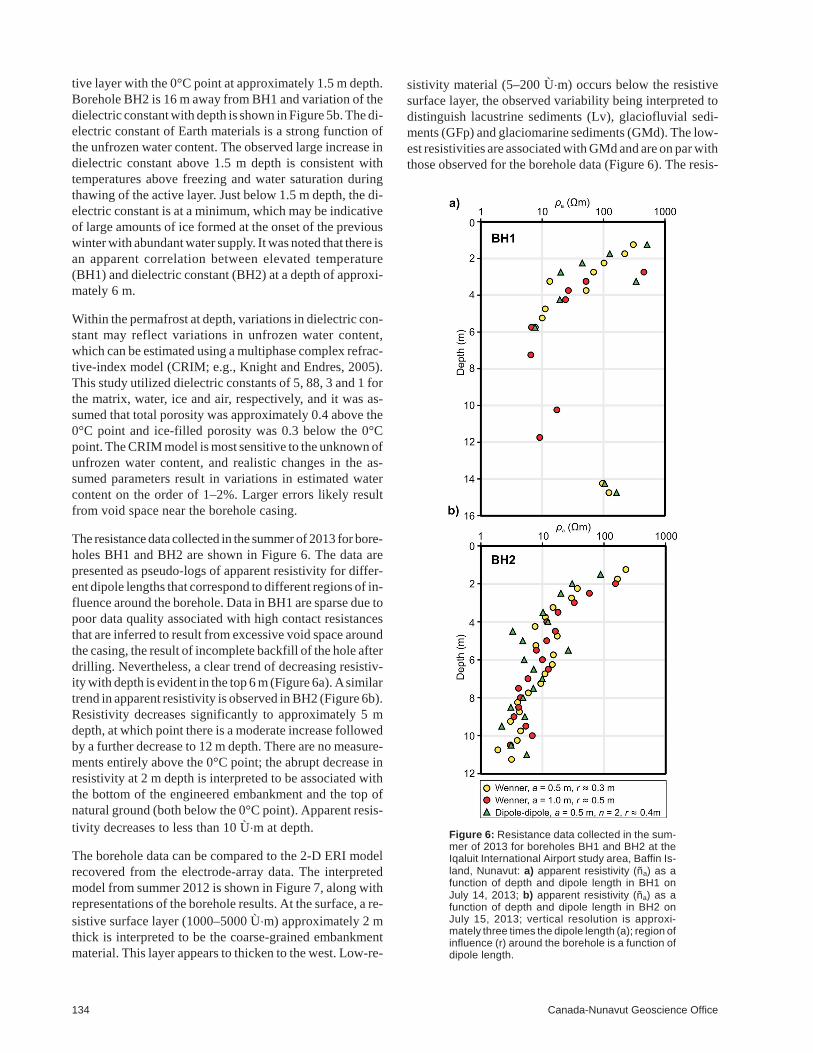
tive layer with the 0°C point at approximately 1.5 m depth.
Borehole BH2 is 16 m away from BH1 and variation of the
dielectric constant with depth is shown in Figure 5b. The di-
electric constant of Earth materials is a strong function of
the unfrozen water content. The observed large increase in
dielectric constant above 1.5 m depth is consistent with
temperatures above freezing and water saturation during
thawing of the active layer. Just below 1.5 m depth, the di-
electric constant is at a minimum, which may be indicative
of large amounts of ice formed at the onset of the previous
winter with abundant water supply. It was noted that there is
an apparent correlation between elevated temperature
(BH1) and dielectric constant (BH2) at a depth of approxi-
mately 6 m.
Within the permafrost at depth, variations in dielectric con-
stant may reflect variations in unfrozen water content,
which can be estimated using a multiphase complex refrac-
tive-index model (CRIM; e.g., Knight and Endres, 2005).
This study utilized dielectric constants of 5, 88, 3 and 1 for
the matrix, water, ice and air, respectively, and it was as-
sumed that total porosity was approximately 0.4 above the
0°C point and ice-filled porosity was 0.3 below the 0°C
point. The CRIM model is most sensitive to the unknown of
unfrozen water content, and realistic changes in the as-
sumed parameters result in variations in estimated water
content on the order of 1–2%. Larger errors likely result
from void space near the borehole casing.
The resistance data collected in the summer of 2013 for bore-
holes BH1 and BH2 are shown in Figure 6. The data are
presented as pseudo-logs of apparent resistivity for differ-
ent dipole lengths that correspond to different regions of in-
fluence around the borehole. Data in BH1 are sparse due to
poor data quality associated with high contact resistances
that are inferred to result from excessive void space around
the casing, the result of incomplete backfill of the hole after
drilling. Nevertheless, a clear trend of decreasing resistiv-
ity with depth is evident in the top 6 m (Figure 6a). Asimilar
trend in apparent resistivity is observed in BH2 (Figure 6b).
Resistivity decreases significantly to approximately 5 m
depth, at which point there is a moderate increase followed
by a further decrease to 12 m depth. There are no measure-
ments entirely above the 0°C point; the abrupt decrease in
resistivity at 2 m depth is interpreted to be associated with
the bottom of the engineered embankment and the top of
natural ground (both below the 0°C point). Apparent resis-
tivity decreases to less than 10 Ù�m at depth.
The borehole data can be compared to the 2-D ERI model
recovered from the electrode-array data. The interpreted
model from summer 2012 is shown in Figure 7, along with
representations of the borehole results. At the surface, a re-
sistive surface layer (1000–5000 Ù�m) approximately 2 m
thick is interpreted to be the coarse-grained embankment
material. This layer appears to thicken to the west. Low-re-
sistivity material (5–200 Ù�m) occurs below the resistive
surface layer, the observed variability being interpreted to
distinguish lacustrine sediments (Lv), glaciofluvial sedi-
ments (GFp) and glaciomarine sediments (GMd). The low-
est resistivities are associated with GMd and are on par with
those observed for the borehole data (Figure 6). The resis-
134 Canada-Nunavut Geoscience Office
Figure 6: Resistance data collected in the sum-mer of 2013 for boreholes BH1 and BH2 at theIqaluit International Airport study area, Baffin Is-land, Nunavut: a) apparent resistivity (ña) as afunction of depth and dipole length in BH1 onJuly 14, 2013; b) apparent resistivity (ña) as afunction of depth and dipole length in BH2 onJuly 15, 2013; vertical resolution is approxi-mately three times the dipole length (a); region ofinfluence (r) around the borehole is a function ofdipole length.
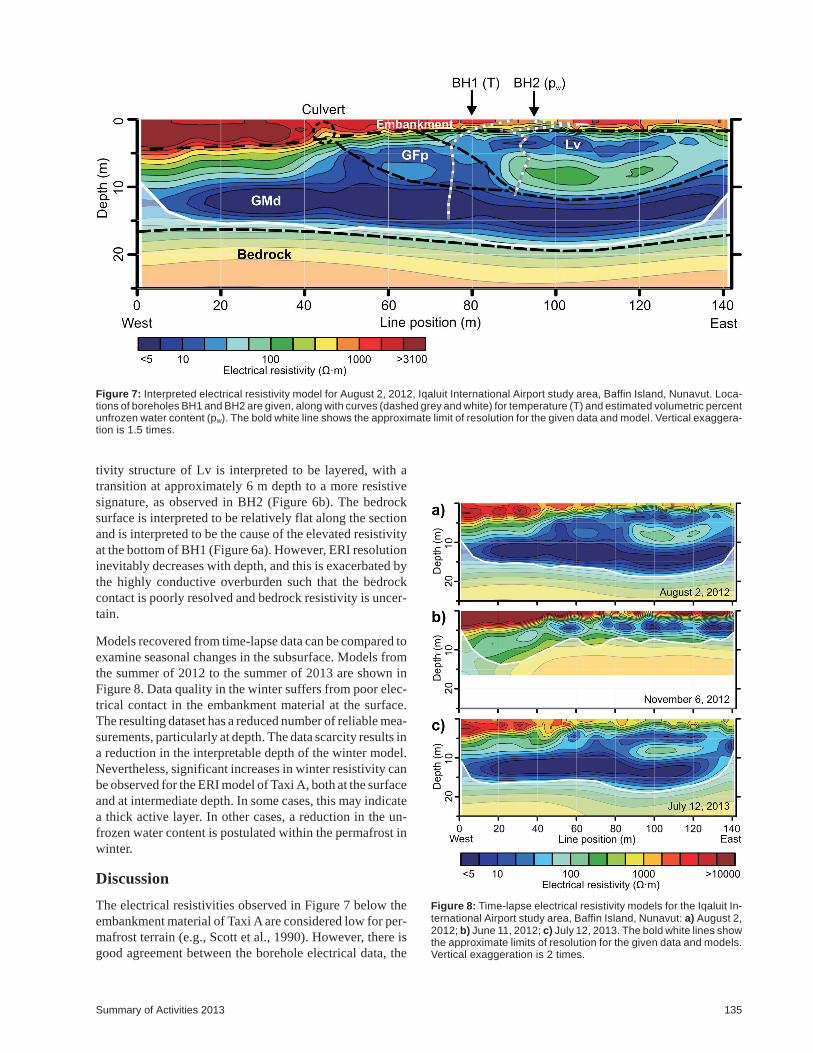
tivity structure of Lv is interpreted to be layered, with a
transition at approximately 6 m depth to a more resistive
signature, as observed in BH2 (Figure 6b). The bedrock
surface is interpreted to be relatively flat along the section
and is interpreted to be the cause of the elevated resistivity
at the bottom of BH1 (Figure 6a). However, ERI resolution
inevitably decreases with depth, and this is exacerbated by
the highly conductive overburden such that the bedrock
contact is poorly resolved and bedrock resistivity is uncer-
tain.
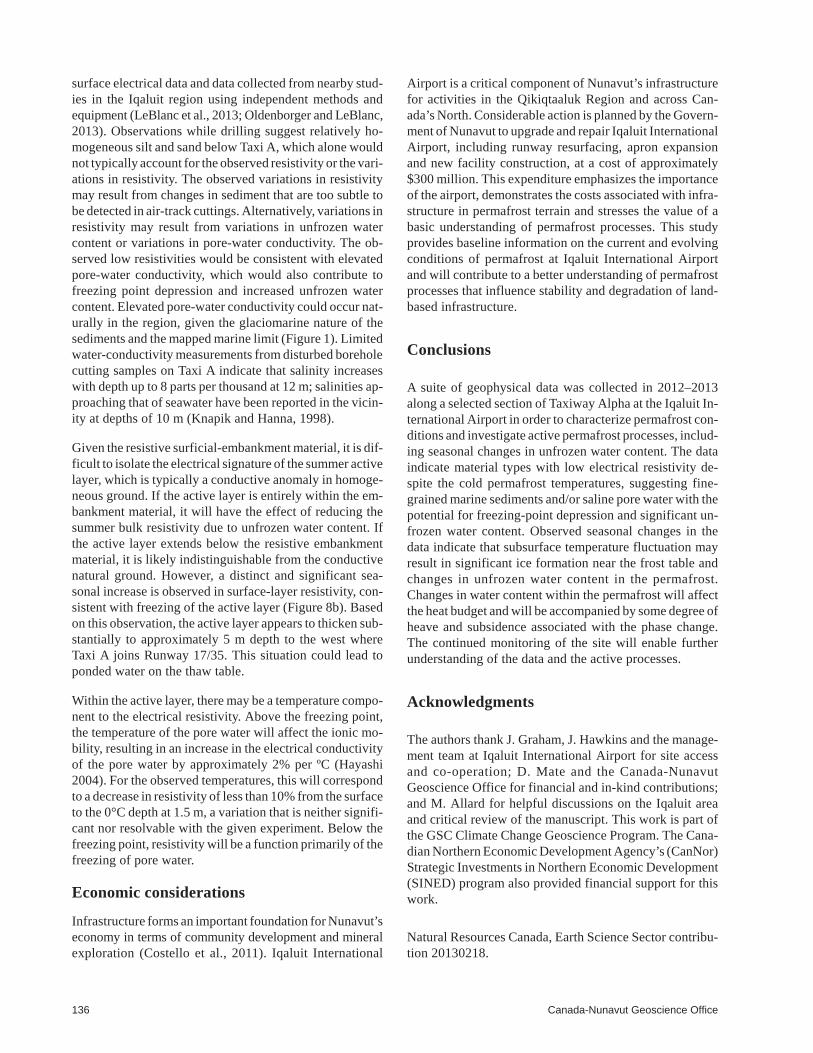
Models recovered from time-lapse data can be compared to
examine seasonal changes in the subsurface. Models from
the summer of 2012 to the summer of 2013 are shown in
Figure 8. Data quality in the winter suffers from poor elec-
trical contact in the embankment material at the surface.
The resulting dataset has a reduced number of reliable mea-
surements, particularly at depth. The data scarcity results in
a reduction in the interpretable depth of the winter model.
Nevertheless, significant increases in winter resistivity can
be observed for the ERI model of Taxi A, both at the surface
and at intermediate depth. In some cases, this may indicate
a thick active layer. In other cases, a reduction in the un-
frozen water content is postulated within the permafrost in
winter.
Discussion
The electrical resistivities observed in Figure 7 below the
embankment material of Taxi A are considered low for per-
mafrost terrain (e.g., Scott et al., 1990). However, there is
good agreement between the borehole electrical data, the
Summary of Activities 2013 135
Figure 7: Interpreted electrical resistivity model for August 2, 2012, Iqaluit International Airport study area, Baffin Island, Nunavut. Loca-tions of boreholes BH1 and BH2 are given, along with curves (dashed grey and white) for temperature (T) and estimated volumetric percentunfrozen water content (pw). The bold white line shows the approximate limit of resolution for the given data and model. Vertical exaggera-tion is 1.5 times.
Figure 8: Time-lapse electrical resistivity models for the Iqaluit In-ternational Airport study area, Baffin Island, Nunavut: a) August 2,2012; b) June 11, 2012; c) July 12, 2013. The bold white lines showthe approximate limits of resolution for the given data and models.Vertical exaggeration is 2 times.
surface electrical data and data collected from nearby stud-
ies in the Iqaluit region using independent methods and
equipment (LeBlanc et al., 2013; Oldenborger and LeBlanc,
2013). Observations while drilling suggest relatively ho-
mogeneous silt and sand below Taxi A, which alone would
not typically account for the observed resistivity or the vari-
ations in resistivity. The observed variations in resistivity
may result from changes in sediment that are too subtle to
be detected in air-track cuttings. Alternatively, variations in
resistivity may result from variations in unfrozen water
content or variations in pore-water conductivity. The ob-
served low resistivities would be consistent with elevated
pore-water conductivity, which would also contribute to
freezing point depression and increased unfrozen water
content. Elevated pore-water conductivity could occur nat-
urally in the region, given the glaciomarine nature of the
sediments and the mapped marine limit (Figure 1). Limited
water-conductivity measurements from disturbed borehole
cutting samples on Taxi A indicate that salinity increases
with depth up to 8 parts per thousand at 12 m; salinities ap-
proaching that of seawater have been reported in the vicin-
ity at depths of 10 m (Knapik and Hanna, 1998).
Given the resistive surficial-embankment material, it is dif-
ficult to isolate the electrical signature of the summer active
layer, which is typically a conductive anomaly in homoge-
neous ground. If the active layer is entirely within the em-
bankment material, it will have the effect of reducing the
summer bulk resistivity due to unfrozen water content. If
the active layer extends below the resistive embankment
material, it is likely indistinguishable from the conductive
natural ground. However, a distinct and significant sea-
sonal increase is observed in surface-layer resistivity, con-
sistent with freezing of the active layer (Figure 8b). Based
on this observation, the active layer appears to thicken sub-
stantially to approximately 5 m depth to the west where
Taxi A joins Runway 17/35. This situation could lead to
ponded water on the thaw table.
Within the active layer, there may be a temperature compo-
nent to the electrical resistivity. Above the freezing point,
the temperature of the pore water will affect the ionic mo-
bility, resulting in an increase in the electrical conductivity
of the pore water by approximately 2% per ºC (Hayashi
2004). For the observed temperatures, this will correspond
to a decrease in resistivity of less than 10% from the surface
to the 0°C depth at 1.5 m, a variation that is neither signifi-
cant nor resolvable with the given experiment. Below the
freezing point, resistivity will be a function primarily of the
freezing of pore water.
Economic considerations
Infrastructure forms an important foundation for Nunavut’s
economy in terms of community development and mineral
exploration (Costello et al., 2011). Iqaluit International
Airport is a critical component of Nunavut’s infrastructure
for activities in the Qikiqtaaluk Region and across Can-
ada’s North. Considerable action is planned by the Govern-
ment of Nunavut to upgrade and repair Iqaluit International
Airport, including runway resurfacing, apron expansion
and new facility construction, at a cost of approximately
$300 million. This expenditure emphasizes the importance
of the airport, demonstrates the costs associated with infra-
structure in permafrost terrain and stresses the value of a
basic understanding of permafrost processes. This study
provides baseline information on the current and evolving
conditions of permafrost at Iqaluit International Airport
and will contribute to a better understanding of permafrost
processes that influence stability and degradation of land-
based infrastructure.
Conclusions
A suite of geophysical data was collected in 2012–2013
along a selected section of Taxiway Alpha at the Iqaluit In-
ternational Airport in order to characterize permafrost con-
ditions and investigate active permafrost processes, includ-
ing seasonal changes in unfrozen water content. The data
indicate material types with low electrical resistivity de-
spite the cold permafrost temperatures, suggesting fine-
grained marine sediments and/or saline pore water with the
potential for freezing-point depression and significant un-
frozen water content. Observed seasonal changes in the
data indicate that subsurface temperature fluctuation may
result in significant ice formation near the frost table and
changes in unfrozen water content in the permafrost.
Changes in water content within the permafrost will affect
the heat budget and will be accompanied by some degree of
heave and subsidence associated with the phase change.
The continued monitoring of the site will enable further
understanding of the data and the active processes.
Acknowledgments
The authors thank J. Graham, J. Hawkins and the manage-
ment team at Iqaluit International Airport for site access
and co-operation; D. Mate and the Canada-Nunavut
Geoscience Office for financial and in-kind contributions;
and M. Allard for helpful discussions on the Iqaluit area
and critical review of the manuscript. This work is part of
the GSC Climate Change Geoscience Program. The Cana-
dian Northern Economic Development Agency’s (CanNor)
Strategic Investments in Northern Economic Development
(SINED) program also provided financial support for this
work.
Natural Resources Canada, Earth Science Sector contribu-
tion 20130218.
136 Canada-Nunavut Geoscience Office
References
Allard, M., Doyon, J., Mathon-Dufour, V., LeBlanc, A.-M.,L’Hérault, E., Mate, D., Oldenborger, G.A. and Sladen W.E.2012: Surficial geology, Iqaluit, Nunavut; Geological Sur-vey of Canada, Canadian Geoscience Map 64, scale1:15 000.
Costello, K., Senkow, M., Bigio, A., Budkewitsch, P. and Ham, L.2011: Nunavut mineral exploration, mining and geoscienceoverview 2011; Aboriginal Affairs and Northern Develop-ment Canada.
Dietrich, J.B. and Mitchell G. 2011: Geotechnical investigation,Taxiway A, Iqaluit Airport (CYFB), Iqaluit, Nunavut; un-published report prepared by Peto MacCallum Ltd. forGenivar Inc., 11KF074.
Fortier, R., LeBlanc, A.-M., Allard, M., Buteau, S. and Calmels, F.2008: Internal structure and conditions of permafrostmounds at Umiujaq in Nunavik, Canada, inferred from fieldinvestigation and electrical resistivity tomography; Cana-dian Journal of Earth Sciences, v. 45, p. 367–387.
Hauck, C., Vonder Muhll, D. and Maurer, H. 2003: Using DC re-sistivity tomography to detect and characterize mountainpermafrost; Geophysical Prospecting, v. 51, p. 273–284.
Hayashi, M. 2004: Temperature-electrical conductivity relation ofwater for environmental monitoring and geophysical datainversion; Environmental Monitoring and Assessment,v. 96, p. 119–128.
Heginbottom, J.A., Dubreuil, M.H. and Harker, P.T. 1995: Can-ada, permafrost; in National Atlas of Canada, 5th edition,Plate 2.1, MCR 4177.
King, M.S., Zimmerman, R.W. and Corwin, R.F. 1988: Seismicand electrical properties of unconsolidated permafrost; Geo-physical Prospecting, v. 36, p. 349–364.
Knapik, D.J. and Hanna A. J. 1998: Foundation soils investigation,settlement of Apron III extension, Iqaluit Airport, Iqaluit,NT; unpublished report prepared by AGRA Earth & Envi-ronmental Ltd. for the Government of the Northwest Territo-ries, Department of Transportation.
Knight, R.J. and Endres, A.L. 2005: An introduction to rock phys-ics principles for near-surface geophysics; in Near-SurfaceGeophysics, D.K. Butler (ed.), Society of Exploration Geo-physicists, p. 31–70.
LaBrecque, D.J. and Yang, X. 2001: Difference inversion of ERTdata: a fast inversion method for 3-D in-situ monitoring;Journal of Environmental and Engineering Geophysics, v. 6,p. 83–89.
Larochelle, Y.P. and Haché, J.G.A.R. 1991: Geotechnical study,Alpha Taxiway, Iqaluit Airport; unpublished report pre-pared by Jacques Whitford Ltd. for Public Works Canada.
LeBlanc, A.-M., Short, N., Oldenborger, G.A., Mathon-Dufour, V.and Allard, M. 2012: Geophysical investigation and InSARmapping of permafrost and ground movement at the IqaluitAirport; in Cold Regions Engineering 2012: Sustainable In-frastructure Development in a Changing Cold Environment,B. Morse and G. Doré (ed.), American Society of Civil Engi-neers, p. 644–654.
LeBlanc, A.-M., Mathon-Dufour, V., Allard, M., Oldenborger,G.A., Short, N., L’Hérault, E. and Sladen, W.E. 2013: Per-mafrost characterization at the Iqaluit International Airport,Nunavut, in support of decision-making and planning; inSummary of Activities 2012, Canada-Nunavut GeoscienceOffice, p. 131–142.
Loke, M.H., Acworth, I. and Dahlin, T. 2003: A comparison ofsmooth and blocky inversion methods in 2D electrical imag-ing surveys; Exploration Geophysics, v. 34, p. 182–187.
Oldenborger, G.A. and LeBlanc, A.-M. 2013: Capacitive resistiv-ity inversion using effective dipole lengths for line antennas;Journal of Applied Geophysics, v. 98, p. 229–236.
Ross, N., Brabham, P.J., Harris, C. and Christiansen, H.H. 2007:Internal structure of open system pingos, Adventdalen,Svalbard: the use of resistivity tomography to assessground-ice conditions; Journal of Environmental and Engi-neering Geophysics, v. 12, p. 113–126.
Scott, W.J., Sellmann, P.V. and Hunter, J.A. 1990: Geophysics inthe study of permafrost; in Geotechnical and EnvironmentalGeophysics, W.J. Ward (ed.), Society of Exploration Geo-physicists, p. 355–384.
Short, N., LeBlanc, A.-M., Sladen, W.E., Allard, M. and Mathon-Dufour, V. 2012: Seasonal surface displacement derivedfrom InSAR, Iqaluit, Nunavut; Geological Survey of Can-ada, Canadian Geoscience Map 66, scale 1:15 000.
Short, N., LeBlanc, A.-M., Sladen, W., Oldenborger, G. andMathon-Dufour, V. and Briso, B. (2014): RADARSAT-2 D-InSAR for ground displacement in permafrost terrain, vali-dation from Iqaluit Airport, Baffin Island, Canada; RemoteSensing of Environment, v 141, p. 40–51.
Wolfe, S., Stevens, C.W., Gaanderse, A.J. and Oldenborger, G.A.2014: Lithalsa distribution, morphology and landscape as-sociations in the Great Slave Lowland, Northwest Territo-ries, Canada; Geomorphology, v. 204, p. 302–313, URL<http://dx.doi.org/10.1016/j.geomorph.2013.08.014> [No-vember 13, 2013].
Summary of Activities 2013 137

138 Canada-Nunavut Geoscience Office