Embed Size (px)
Citation preview
Bowling Green State University Bowling Green State University
ScholarWorks@BGSU ScholarWorks@BGSU
Biological Sciences Faculty Publications Biological Sciences
9-10-2019
Metatranscriptomic Analyses of Diel Metabolic Functions During Metatranscriptomic Analyses of Diel Metabolic Functions During
a Microcystis Bloom in Western Lake Erie (United States) a Microcystis Bloom in Western Lake Erie (United States)
Emily J. Davenport Bowling Green State University
Michelle J. Neudeck Bowling Green State University
Paul G. Matson Bowling Green State University
George S. Bullerjahn Bowling Green State University
Timothy W. Davis Bowling Green State University
See next page for additional authors
Follow this and additional works at: https://scholarworks.bgsu.edu/bio_sci_pub
Part of the Biology Commons
Repository Citation Repository Citation Davenport, Emily J.; Neudeck, Michelle J.; Matson, Paul G.; Bullerjahn, George S.; Davis, Timothy W.; Wilhelm, Steven W.; Denney, Maddie K.; Krausfeldt, Lauren E.; Stough, Joshua M.; Meyer, Kevin A.; Dick, Gregory J.; Johengen, Thomas H.; Lindquist, Erika; Tringe, Susannah G.; and McKay, Robert Michael, "Metatranscriptomic Analyses of Diel Metabolic Functions During a Microcystis Bloom in Western Lake Erie (United States)" (2019). Biological Sciences Faculty Publications. 82. https://scholarworks.bgsu.edu/bio_sci_pub/82
This work is licensed under a Creative Commons Attribution 4.0 International License. This Article is brought to you for free and open access by the Biological Sciences at ScholarWorks@BGSU. It has been accepted for inclusion in Biological Sciences Faculty Publications by an authorized administrator of ScholarWorks@BGSU.

Author(s) Author(s) Emily J. Davenport, Michelle J. Neudeck, Paul G. Matson, George S. Bullerjahn, Timothy W. Davis, Steven W. Wilhelm, Maddie K. Denney, Lauren E. Krausfeldt, Joshua M. Stough, Kevin A. Meyer, Gregory J. Dick, Thomas H. Johengen, Erika Lindquist, Susannah G. Tringe, and Robert Michael McKay
This article is available at ScholarWorks@BGSU: https://scholarworks.bgsu.edu/bio_sci_pub/82
fmicb-10-02081 September 7, 2019 Time: 15:50 # 1
ORIGINAL RESEARCHpublished: 10 September 2019
doi: 10.3389/fmicb.2019.02081
Edited by:Petra M. Visser,
University of Amsterdam, Netherlands
Reviewed by:Maureen Coleman,
The University of Chicago,United States
Chenlin Hu,University of Houston, United States
*Correspondence:George S. Bullerjahn
†These authors have contributedequally to this work
Specialty section:This article was submitted to
Aquatic Microbiology,a section of the journal
Frontiers in Microbiology
Received: 16 April 2019Accepted: 23 August 2019
Published: 10 September 2019
Citation:Davenport EJ, Neudeck MJ,
Matson PG, Bullerjahn GS, Davis TW,Wilhelm SW, Denney MK,
Krausfeldt LE, Stough JMA,Meyer KA, Dick GJ, Johengen TH,
Lindquist E, Tringe SG andMcKay RML (2019)
Metatranscriptomic Analyses of DielMetabolic Functions During
a Microcystis Bloom in Western LakeErie (United States).
Front. Microbiol. 10:2081.doi: 10.3389/fmicb.2019.02081
Metatranscriptomic Analyses of DielMetabolic Functions During aMicrocystis Bloom in Western LakeErie (United States)Emily J. Davenport1,2†, Michelle J. Neudeck1†, Paul G. Matson1, George S. Bullerjahn1* ,Timothy W. Davis1, Steven W. Wilhelm3, Maddie K. Denney4, Lauren E. Krausfeldt3,Joshua M. A. Stough3, Kevin A. Meyer2,5, Gregory J. Dick5, Thomas H. Johengen2,Erika Lindquist6, Susannah G. Tringe6 and Robert Michael L. McKay1,7
1 Department of Biological Sciences, Bowling Green State University, Bowling Green, OH, United States, 2 CooperativeInstitute for Great Lakes Research (CIGLR), University of Michigan, Ann Arbor, MI, United States, 3 Departmentof Microbiology, The University of Tennessee, Knoxville, Knoxville, TN, United States, 4 Graduate School of Genome Scienceand Technology, The University of Tennessee, Knoxville, Knoxville, TN, United States, 5 Department of Earthand Environmental Sciences, University of Michigan, Ann Arbor, MI, United States, 6 U.S. Department of Energy JointGenome Institute, Walnut Creek, CA, United States, 7 Great Lakes Institute for Environmental Research, Universityof Windsor, Windsor, ON, Canada
This study examined diel shifts in metabolic functions of Microcystis spp. during a 48-hLagrangian survey of a toxin-producing cyanobacterial bloom in western Lake Erie inthe aftermath of the 2014 Toledo Water Crisis. Transcripts mapped to the genomes ofrecently sequenced lower Great Lakes Microcystis isolates showed distinct patternsof gene expression between samples collected across day (10:00 h, 16:00 h) andnight (22:00 h, 04:00 h). Daytime transcripts were enriched in functions related toPhotosystem II (e.g., psbA), nitrogen and phosphate acquisition, cell division (ftsHZ),heat shock response (dnaK, groEL), and uptake of inorganic carbon (rbc, bicA). Genestranscribed during nighttime included those involved in phycobilisome protein synthesisand Photosystem I core subunits. Hierarchical clustering and principal componentanalysis (PCA) showed a tightly clustered group of nighttime expressed genes, whereasdaytime transcripts were separated from each other over the 48-h duration. Lackof uniform clustering within the daytime transcripts suggested that the partitioningof gene expression in Microcystis is dependent on both circadian regulation andphysicochemical changes within the environment.
Keywords: Microcystis, metatranscriptomics, microcystin, cyanobacterial blooms, Lake Erie
INTRODUCTION
Cyanobacterial harmful algal blooms (cHABs), dominated primarily by Microcystis, have recurredannually in the open waters of western Lake Erie since the mid-1990s (Brittain et al., 2000; SteffenM.M. et al., 2014) with blooms increasing in severity and duration over the past decade (Michalaket al., 2013; Bullerjahn et al., 2016). Within a bloom, a subset of strains of Microcystis spp. arecapable of producing microcystins, which are known hepatotoxins and potential tumor promoters
Frontiers in Microbiology | www.frontiersin.org 1 September 2019 | Volume 10 | Article 2081
fmicb-10-02081 September 7, 2019 Time: 15:50 # 2
Davenport et al. Diel Gene Expression in a Microcystis Bloom
(Falconer, 1994; Fan et al., 2014). Consequently, within thewestern Lake Erie watershed, cHABs result in increased costsfor water treatment and are responsible for economic declinesrelated to tourism, property values, and recreational fisheries(Bingham et al., 2015; Wolf and Klaiber, 2017).
Microcystis spp. can dominate late summer phytoplanktoncommunities due to a variety of adaptive strategies. Cellsover-winter in the sediments where they can be recruited tosurface waters during the summer as light availability andtemperatures increase (Brunberg and Blomqvist, 2003; Rinta-Kanto et al., 2009; Kitchens et al., 2018). Microcystis can alsopromote and tolerate the formation of pH extremes that precludethe growth of competing eukaryotes (Krausfeldt et al., 2019).Buoyancy resulting from gas vesicles allows cells to control theirposition in the water column, thus shaping light and nutrientavailability (Reynolds et al., 1987; Brookes and Ganf, 2001).The genomic architecture of Microcystis aeruginosa is thoughtto be “plastic” due to horizontal gene transfer as well as theactivity of transposases and restriction modification enzymesencoded within its genome (Kaneko et al., 2007; Frangeulet al., 2008; Steffen M. et al., 2014; Meyer et al., 2017). Thesefunctions are presumed to generate genetic diversity withinthe cyanobacterial population via deletion, duplication and/oracquisition of genes from the endemic community into thegenome. Together, these mechanisms offer adaptive strategiesto maintain competitive dominance (Humbert et al., 2013).Microcystis spp. also possess a variety of genes and pathwaysto compete for light and nutrients, including uptake systemsfor various nitrogen and carbon species (Valladares et al.,2002; Badger and Price, 2003). Increasing temperatures arealso favorable for growth of M. aeruginosa, whose optimumgrowth temperature (>25◦C) is typically higher than that ofother phytoplankton species (Reynolds, 2006; Jöhnk et al.,2008). In many lakes, increasing temperatures consistent withclimate change will likely strengthen vertical stratification therebyreducing mixing and allowing phytoplankton growth at thesurface to remain undisturbed, promoting formation of surfaceblooms (Huisman and Hulot, 2005; Paerl and Huisman, 2008).
A critical adaptation of bloom-forming phytoplankton isthe regulation of processes according to diel light availability.Circadian oscillators are genetic regulators of expressionoperating at a period of about 24 h. The circadian “clock”functions as a regulator that anticipates daily environmentalchanges that can shape cell metabolism. Circadian rhythmsfunction as a constant, entrained by cycles of light/dark,independent of temperature effects (Bünning, 1973; Pittendrigh,1981; Johnson and Hastings, 1986; Sweeney, 2013). Thesefunctions were initially observed in eukaryotes and thought tooccur only within Eukarya (Konopka and Benzer, 1971), untiltheir discovery in cyanobacteria (Kondo et al., 1993; Lorne et al.,2000). The kaiABC gene cluster and its physiological outputswithin cyanobacteria have been shown to specifically control therhythmicity of cell functions (Ishiura et al., 1998; reviewed inWelkie et al., 2019). The photosynthetic nature of cyanobacteriapresumes the circadian pacemaker will initiate expression ofsome genes to anticipate dawn to maximize daytime functionssuch as photosynthetic light harvesting. Other physiological
functions have been shown to yield maximum expression atsubjective midday (Kucho et al., 2005). The cyanobacteria clockcontrols global gene expression by regulating the activity of allpromoters (Liu et al., 1995; Xu et al., 2003; Labiosa et al., 2006).
Multiple cellular functions within cyanobacteria are coupledto circadian rhythms, including nutrient acquisition andassimilation, amino acid uptake, respiration, carbohydratesynthesis, replication, and cell division (Chen et al., 1991; Krameret al., 1996; Golden et al., 1997; Ishiura et al., 1998). Whilefluctuating environmental conditions (light, temperature, pH,nutrient availability) may invoke stress responses, it is importantto understand the mechanisms and range of circadian controlthat may mask or overlay expression resulting from transientstress. Indeed, patterns of gene expression under changingconditions of light, temperature and nutrient starvation aredistinct from those under global circadian control. With respectto cHAB events, it is important to differentiate these two patterns(Labiosa et al., 2006; Penn et al., 2014). Additionally, diel patternsof expression can exist in cyanobacteria in the absence of acircadian clock (Holtzendorff et al., 2008). Whereas this studyalone cannot sort out what functions are regulated by KaiABC,this work, along with future studies, can begin to understand theinterplay of environmental cues and the circadian pacemaker.
This study queried expression of key metabolic functionsto understand the ecophysiology of a Microcystis spp. bloomover the course of diel cycles. Specifically, a metatranscriptomicapproach was undertaken to study temporal changes in themetabolic functions of an August 2014 Microcystis spp.-dominated bloom. Just 3 weeks prior, this event resulted in a“do not drink” order issued for Toledo, OH due to detection ofmicrocystins in the finished water supply above the 1 µg L−1
World Health Organization (WHO) drinking water advisory(Bullerjahn et al., 2016; Steffen et al., 2017). Metatranscriptomeanalyses paired with environmental metadata provided insightinto factors related to bloom success and toxicity, along witha better understanding of bloom metabolism throughout theday and night, particularly with regard to photosynthesis,nutrient assimilation and microcystin production. Overall,this information can help inform the development of newstrategies toward prediction of bloom toxigenicity and mitigationof bloom events.
MATERIALS AND METHODS
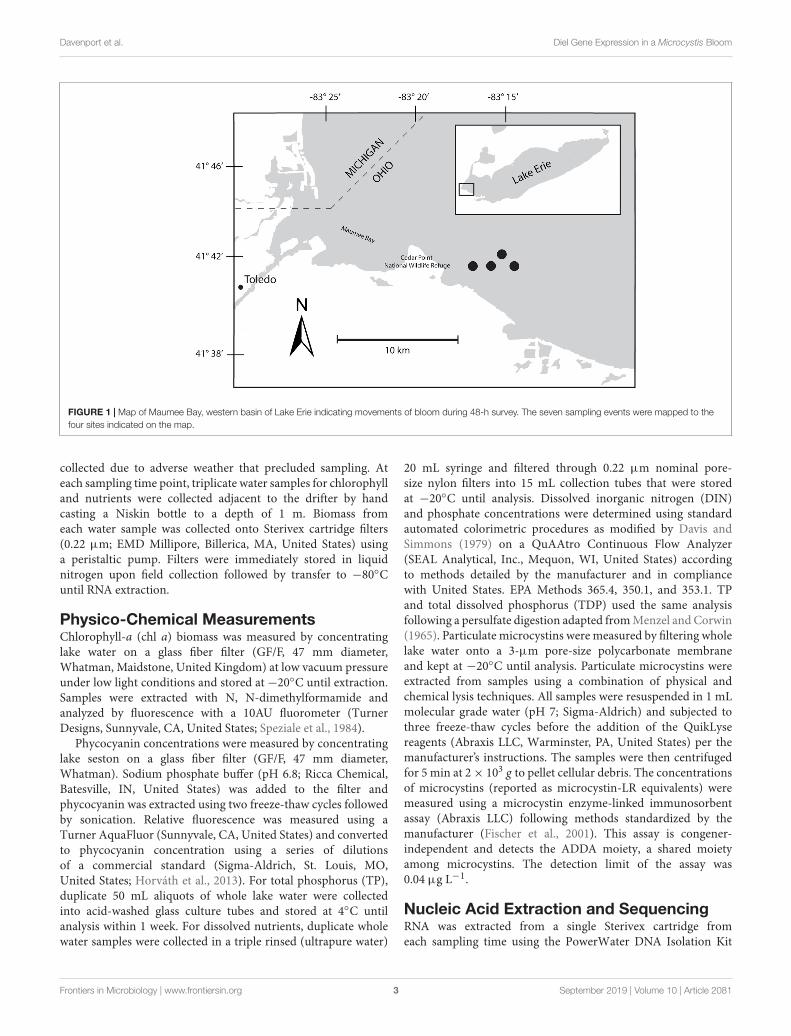
Sample CollectionA 48-h Lagrangian survey of the 2014 Microcystis bloom wasconducted in western Lake Erie in late August 2014. Our studywas designed to track the bloom over diel cycles using a drifterwith GPS capabilities deployed near the Toledo water intake.Over the course of the survey, the drifter moved roughly 2 kmthrough water depths varying from 10–15 m (Figure 1). Sampleswere collected at 6-h intervals beginning on August 26, at22:00 h, producing two sets of triplicate samples from 22:00 h(samples 1S, 5S), one set of triplicates at 04:00 h (2S), andtwo sets of triplicates at 10:00 h (3S, 6S), and 16:00 h (4S,7S). A sample for 04:00 h over the second diel cycle was not
Frontiers in Microbiology | www.frontiersin.org 2 September 2019 | Volume 10 | Article 2081
fmicb-10-02081 September 7, 2019 Time: 15:50 # 3
Davenport et al. Diel Gene Expression in a Microcystis Bloom
FIGURE 1 | Map of Maumee Bay, western basin of Lake Erie indicating movements of bloom during 48-h survey. The seven sampling events were mapped to thefour sites indicated on the map.
collected due to adverse weather that precluded sampling. Ateach sampling time point, triplicate water samples for chlorophylland nutrients were collected adjacent to the drifter by handcasting a Niskin bottle to a depth of 1 m. Biomass fromeach water sample was collected onto Sterivex cartridge filters(0.22 µm; EMD Millipore, Billerica, MA, United States) usinga peristaltic pump. Filters were immediately stored in liquidnitrogen upon field collection followed by transfer to −80◦Cuntil RNA extraction.
Physico-Chemical MeasurementsChlorophyll-a (chl a) biomass was measured by concentratinglake water on a glass fiber filter (GF/F, 47 mm diameter,Whatman, Maidstone, United Kingdom) at low vacuum pressureunder low light conditions and stored at −20◦C until extraction.Samples were extracted with N, N-dimethylformamide andanalyzed by fluorescence with a 10AU fluorometer (TurnerDesigns, Sunnyvale, CA, United States; Speziale et al., 1984).
Phycocyanin concentrations were measured by concentratinglake seston on a glass fiber filter (GF/F, 47 mm diameter,Whatman). Sodium phosphate buffer (pH 6.8; Ricca Chemical,Batesville, IN, United States) was added to the filter andphycocyanin was extracted using two freeze-thaw cycles followedby sonication. Relative fluorescence was measured using aTurner AquaFluor (Sunnyvale, CA, United States) and convertedto phycocyanin concentration using a series of dilutionsof a commercial standard (Sigma-Aldrich, St. Louis, MO,United States; Horváth et al., 2013). For total phosphorus (TP),duplicate 50 mL aliquots of whole lake water were collectedinto acid-washed glass culture tubes and stored at 4◦C untilanalysis within 1 week. For dissolved nutrients, duplicate wholewater samples were collected in a triple rinsed (ultrapure water)
20 mL syringe and filtered through 0.22 µm nominal pore-size nylon filters into 15 mL collection tubes that were storedat −20◦C until analysis. Dissolved inorganic nitrogen (DIN)and phosphate concentrations were determined using standardautomated colorimetric procedures as modified by Davis andSimmons (1979) on a QuAAtro Continuous Flow Analyzer(SEAL Analytical, Inc., Mequon, WI, United States) accordingto methods detailed by the manufacturer and in compliancewith United States. EPA Methods 365.4, 350.1, and 353.1. TPand total dissolved phosphorus (TDP) used the same analysisfollowing a persulfate digestion adapted from Menzel and Corwin(1965). Particulate microcystins were measured by filtering wholelake water onto a 3-µm pore-size polycarbonate membraneand kept at −20◦C until analysis. Particulate microcystins wereextracted from samples using a combination of physical andchemical lysis techniques. All samples were resuspended in 1 mLmolecular grade water (pH 7; Sigma-Aldrich) and subjected tothree freeze-thaw cycles before the addition of the QuikLysereagents (Abraxis LLC, Warminster, PA, United States) per themanufacturer’s instructions. The samples were then centrifugedfor 5 min at 2 × 10³ g to pellet cellular debris. The concentrationsof microcystins (reported as microcystin-LR equivalents) weremeasured using a microcystin enzyme-linked immunosorbentassay (Abraxis LLC) following methods standardized by themanufacturer (Fischer et al., 2001). This assay is congener-independent and detects the ADDA moiety, a shared moietyamong microcystins. The detection limit of the assay was0.04 µg L−1.
Nucleic Acid Extraction and SequencingRNA was extracted from a single Sterivex cartridge fromeach sampling time using the PowerWater DNA Isolation Kit
Frontiers in Microbiology | www.frontiersin.org 3 September 2019 | Volume 10 | Article 2081
fmicb-10-02081 September 7, 2019 Time: 15:50 # 4
Davenport et al. Diel Gene Expression in a Microcystis Bloom
for Sterivex (Qiagen, Carlsbad, CA, United States), modifiedfor RNA using manufacturer’s protocols. To improve RNAyield, Sterivex R©cartridges were vortexed for 5 min longer thanrecommended each time and all wash buffers were allowed tosit for 1 min before vacuum extraction through the bindingcolumn. DNase treatment was performed as recommended inthe protocol using the On-Spin Column DNase kit (QIAGEN).This protocol was optimized by allowing the DNase solution tosit for an extra 15 min than recommended. RNA was checkedfor DNA contamination by PCR with universal 16S primers (27Fand 1522R). Any additional DNase treatments required wereperformed using the Turbo DNase kit (Ambion, Austin, TX,United States). rRNA was removed from 1 µg of total RNAusing Ribo-Zero rRNA Removal Kit (Epicenter, Madison, WI,United States). Stranded cDNA libraries were generated using theTruSeq Stranded Total RNA LT kit (Illumina, Inc., San Diego,CA, United States). The rRNA depleted RNA was fragmented andreversed transcribed using random hexamers and Superscript IIreverse transcriptase (Invitrogen, Carlsbad, CA, United States)followed by second strand synthesis. The fragmented cDNAwas treated with end-pair, A-tailing, adapter ligation, and eightcycles of PCR. The prepared libraries were quantified using aKAPA Library Quantification kit (Kapa Biosystems, Wilmington,MA, United States) and run on a LightCycler 480 real-timePCR instrument (Roche Diagnostics Corp., Indianapolis, IN,United States). The quantified libraries were then multiplexedwith other libraries, and the pool of libraries was then preparedfor sequencing on the Illumina HiSeq sequencing platformutilizing a HiSeq Cluster kit, v4 (IlluminaTM), and Illumina’scBot instrument to generate a clustered flow cell for sequencing.Sequencing of the flow cell was performed on the IlluminaHiSeq2500 sequencer using a TruSeq SBS sequencing kit, v4,following a 2 × 150 indexed run recipe (Mavromatis et al., 2009).Metatranscriptomes obtained were accessed and downloadedthrough the Integrated Microbial Genomes platform (IMG)developed by U.S. DOE Joint Genome Institute (JGI) (Markowitzet al., 2012, 2014) and the JGI genome portals (Nordberget al., 2014). Raw unassembled metagenomic sequence data wereuploaded to the online server MG-RAST (Meyer et al., 2008) forassembly attribute data, phylogenetic, and functional analysis.
Bioinformatics and Statistical AnalysisAnalyses and visualization of data were performed using CLCGenomics Workbench v 12.0.2 (Qiagen CLC Bio). Sequenceswere imported utilizing the Illumina High-ThroughputSequencing Import function. Low-quality reads and failed readswere automatically removed. The reads were trimmed with aquality limit of 0.05 and an ambiguous base limit of 2. Automaticread-through adapter trimming was performed. RNA-SeqAnalysis was performed using the raw reads of the seven dieltranscriptomes against the following genomes: M. aeruginosaLE3 from Lake Erie (Brittain et al., 2000; Meyer et al., 2017),Synechococcus elongatus PCC 6301, Sulfurimonas denitrificansDSM 1251, Desulfovibrio magneticus RS-1, Anabaena cylindricaPCC 7122, Aphanizomenon flos-aquae NIES-81, Klebsiellapneumoniae 1158, and Burkholderia pseudomallei K96243,and an annotated genome of Planktothrix agardhii from
Lake Erie obtained from Greg Dick at the University ofMichigan. RNASeq parameters were: one reference sequenceper transcript, mismatch cost of 2, insertion cost of 3, deletioncost of 3, length fraction of 0.8, similarity fraction of 0.8. Dataoutput of expression values were calculated as TranscriptsPer Million mapped reads (TPM) through RNA-Seq functionto normalize within each sample and manually normalizedacross all samples with a ratio to the housekeeping genegyrB TPM.
Principal Component Analysis (PCA) was performed usingthe CLC Genomics Workbench (Qiagen CLC Bio) to assessrelationships between diel samples with regards to expression.TPM gene expression plots were created in R 3.5.1 (R CoreTeam, 2018) using the packages tidyr 0.8.2 (Wickham and Henry,2018) and ggplot2 v3.1.0 (Wickham, 2016). Raw sequences areavailable from the NCBI sequence read archive under SRP117911,SRP117914, SRP117915, SRP117922, SRP128942, SRP128945,and SRP128954.
RESULTS
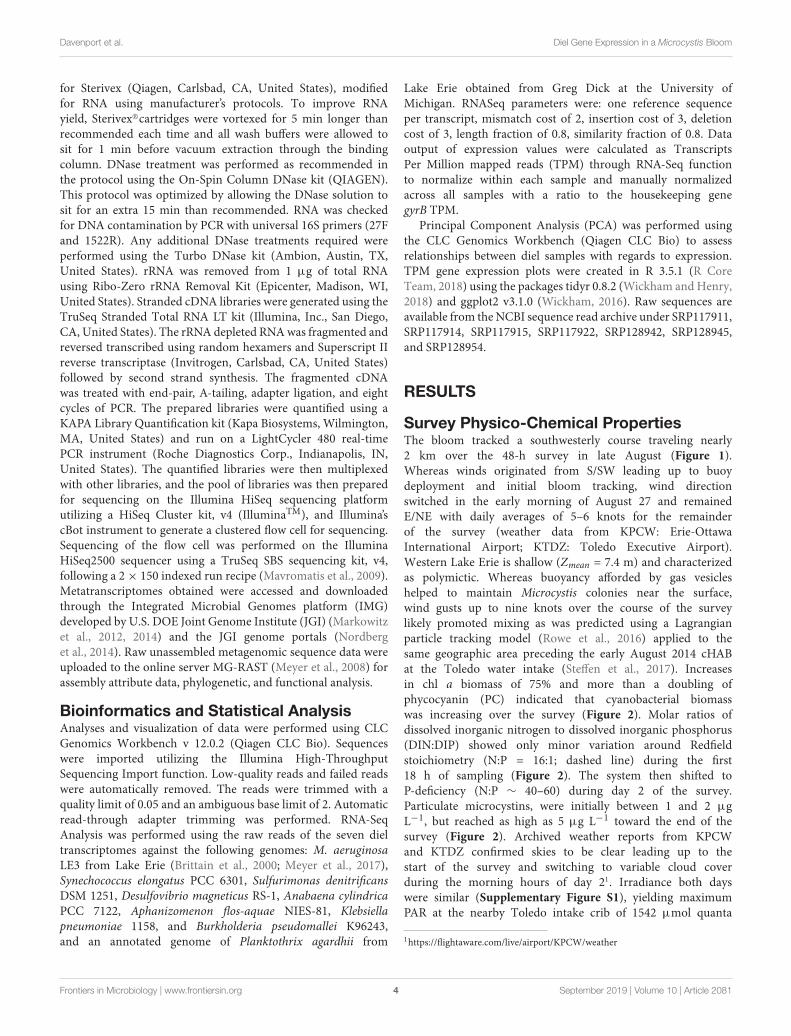
Survey Physico-Chemical PropertiesThe bloom tracked a southwesterly course traveling nearly2 km over the 48-h survey in late August (Figure 1).Whereas winds originated from S/SW leading up to buoydeployment and initial bloom tracking, wind directionswitched in the early morning of August 27 and remainedE/NE with daily averages of 5–6 knots for the remainderof the survey (weather data from KPCW: Erie-OttawaInternational Airport; KTDZ: Toledo Executive Airport).Western Lake Erie is shallow (Zmean = 7.4 m) and characterizedas polymictic. Whereas buoyancy afforded by gas vesicleshelped to maintain Microcystis colonies near the surface,wind gusts up to nine knots over the course of the surveylikely promoted mixing as was predicted using a Lagrangianparticle tracking model (Rowe et al., 2016) applied to thesame geographic area preceding the early August 2014 cHABat the Toledo water intake (Steffen et al., 2017). Increasesin chl a biomass of 75% and more than a doubling ofphycocyanin (PC) indicated that cyanobacterial biomasswas increasing over the survey (Figure 2). Molar ratios ofdissolved inorganic nitrogen to dissolved inorganic phosphorus(DIN:DIP) showed only minor variation around Redfieldstoichiometry (N:P = 16:1; dashed line) during the first18 h of sampling (Figure 2). The system then shifted toP-deficiency (N:P ∼ 40–60) during day 2 of the survey.Particulate microcystins, were initially between 1 and 2 µgL−1, but reached as high as 5 µg L−1 toward the end of thesurvey (Figure 2). Archived weather reports from KPCWand KTDZ confirmed skies to be clear leading up to thestart of the survey and switching to variable cloud coverduring the morning hours of day 21. Irradiance both dayswere similar (Supplementary Figure S1), yielding maximumPAR at the nearby Toledo intake crib of 1542 µmol quanta
1https://flightaware.com/live/airport/KPCW/weather
Frontiers in Microbiology | www.frontiersin.org 4 September 2019 | Volume 10 | Article 2081
fmicb-10-02081 September 7, 2019 Time: 15:50 # 5
Davenport et al. Diel Gene Expression in a Microcystis Bloom
FIGURE 2 | Physico-chemical water data over the course of the 48-h Lagrangian study. (A) Photopigment and microcystin toxin concentrations; (B) dissolvedinorganic nitrogen and phosphorus ratios.
m−2s−1 on August 27 and 1573 µmol quanta m−2s−1
on August 282.
Phylogenetic Classification ofTranscriptsSeven metatranscriptomes were produced from the WesternLake Erie water samples (1.97 Gbp assembled) with read countsranging from 109,124 to 570,660 per sample. rRNA accounted for∼1% of the assembled metatranscriptomes. Fifty seven percentof the mRNA was annotated as encoding known proteins, the
2http://lees.geo.msu.edu/research/sensor_net.html
remaining ∼40% encoded unknown proteins. Of the predictedproteins, ∼70% were assigned to functional categories. Less than5% of reads (per transcriptome) failed quality control tests.
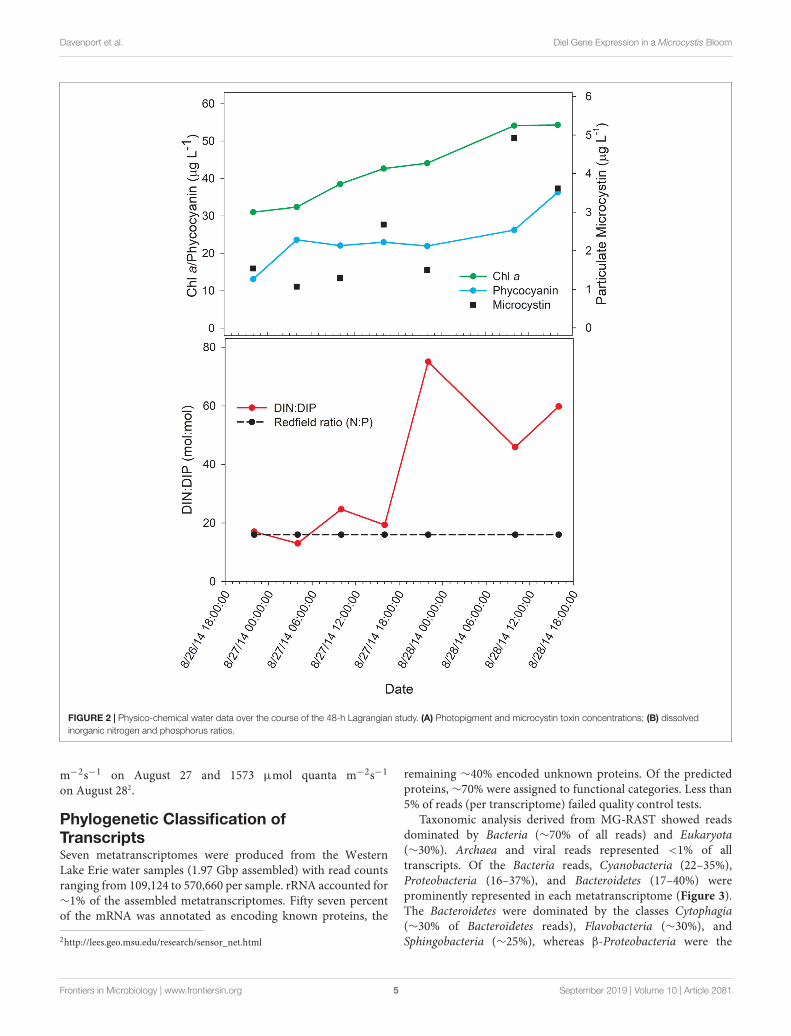
Taxonomic analysis derived from MG-RAST showed readsdominated by Bacteria (∼70% of all reads) and Eukaryota(∼30%). Archaea and viral reads represented <1% of alltranscripts. Of the Bacteria reads, Cyanobacteria (22–35%),Proteobacteria (16–37%), and Bacteroidetes (17–40%) wereprominently represented in each metatranscriptome (Figure 3).The Bacteroidetes were dominated by the classes Cytophagia(∼30% of Bacteroidetes reads), Flavobacteria (∼30%), andSphingobacteria (∼25%), whereas β-Proteobacteria were the
Frontiers in Microbiology | www.frontiersin.org 5 September 2019 | Volume 10 | Article 2081
fmicb-10-02081 September 7, 2019 Time: 15:50 # 6
Davenport et al. Diel Gene Expression in a Microcystis Bloom
FIGURE 3 | Phylogenetic breakdown of transcripts over the course of the 48-h sampling period – community composition by phyla. “Other” refers to bacterial readsthat could not be unambiguously assigned to a phylum.
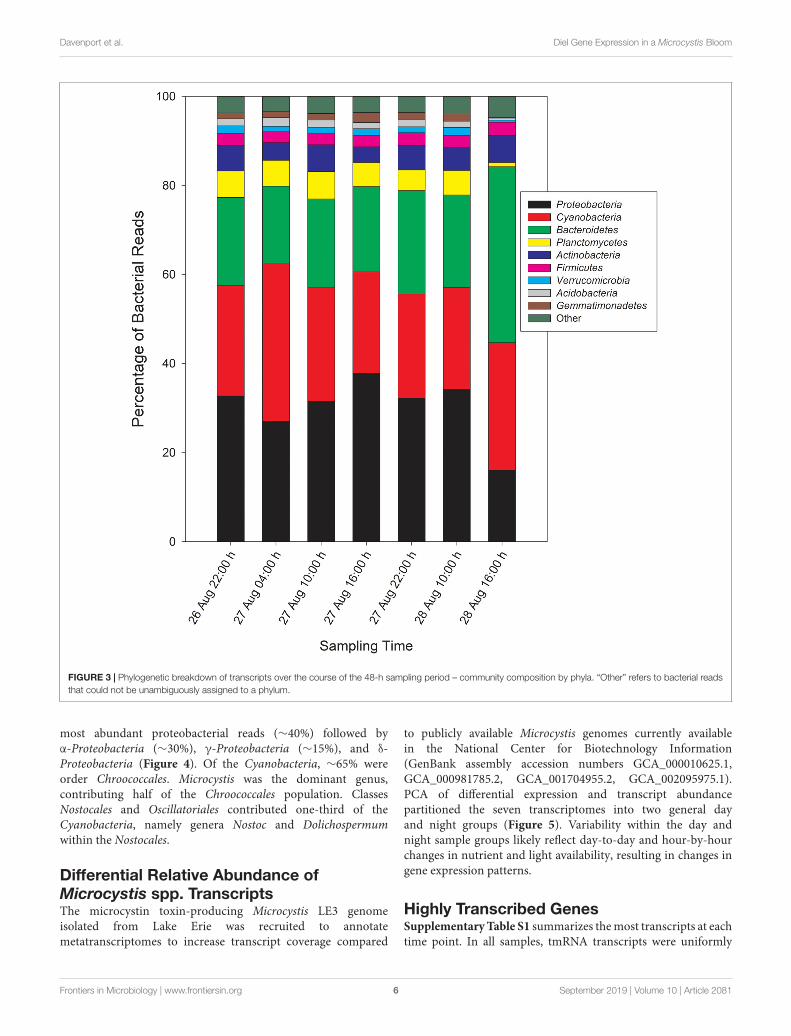
most abundant proteobacterial reads (∼40%) followed byα-Proteobacteria (∼30%), γ-Proteobacteria (∼15%), and δ-Proteobacteria (Figure 4). Of the Cyanobacteria, ∼65% wereorder Chroococcales. Microcystis was the dominant genus,contributing half of the Chroococcales population. ClassesNostocales and Oscillatoriales contributed one-third of theCyanobacteria, namely genera Nostoc and Dolichospermumwithin the Nostocales.
Differential Relative Abundance ofMicrocystis spp. TranscriptsThe microcystin toxin-producing Microcystis LE3 genomeisolated from Lake Erie was recruited to annotatemetatranscriptomes to increase transcript coverage compared
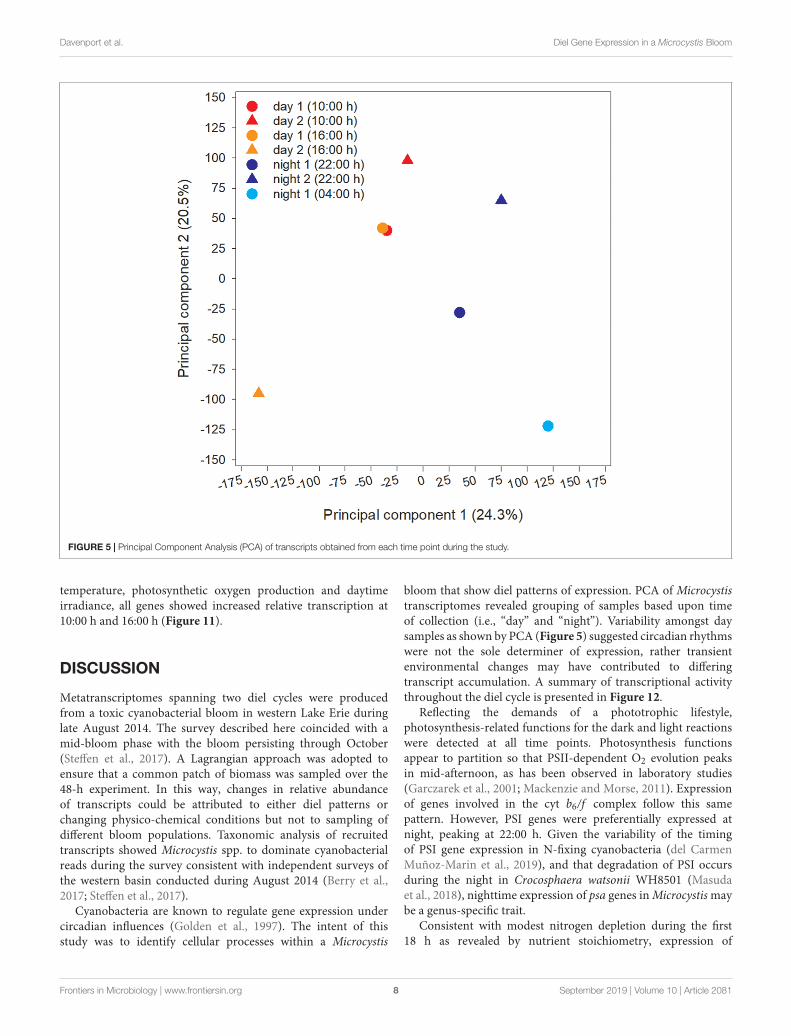
to publicly available Microcystis genomes currently availablein the National Center for Biotechnology Information(GenBank assembly accession numbers GCA_000010625.1,GCA_000981785.2, GCA_001704955.2, GCA_002095975.1).PCA of differential expression and transcript abundancepartitioned the seven transcriptomes into two general dayand night groups (Figure 5). Variability within the day andnight sample groups likely reflect day-to-day and hour-by-hourchanges in nutrient and light availability, resulting in changes ingene expression patterns.
Highly Transcribed GenesSupplementary Table S1 summarizes the most transcripts at eachtime point. In all samples, tmRNA transcripts were uniformly
Frontiers in Microbiology | www.frontiersin.org 6 September 2019 | Volume 10 | Article 2081
fmicb-10-02081 September 7, 2019 Time: 15:50 # 7
Davenport et al. Diel Gene Expression in a Microcystis Bloom
FIGURE 4 | Abundances of Proteobacteria (A) and Cyanobacteria (B) readsby order and Bacteroidetes reads (C) by class.
the most abundant, indicating active mechanisms were in placeensuring translational fidelity (Takada et al., 2002). Whereasmany of the highly transcribed genes encoded gene productsof unknown function, gas vesicle genes (gvp) were highlytranscribed at all time points, and high light inducible (hli)and psbA transcripts were abundant by day, reflecting theirrole in Photoprotection, turnover and repair of Photosystem II(Kulkarni and Golden, 1994; Hutin et al., 2003). Genes encodingHsp20 were highly transcribed by day and phycobilisometranscripts (cpcAB) were abundant in night samples.
Photosynthesis – Light ReactionsGene transcripts associated with antenna function, PhotosystemsI and II (PSI, PSII) and the cytochrome b6/f complex wereassessed and revealed that relative abundance of phycobilisome(cpc, apc) and PSI (psaA-L) transcripts compared to gyrB
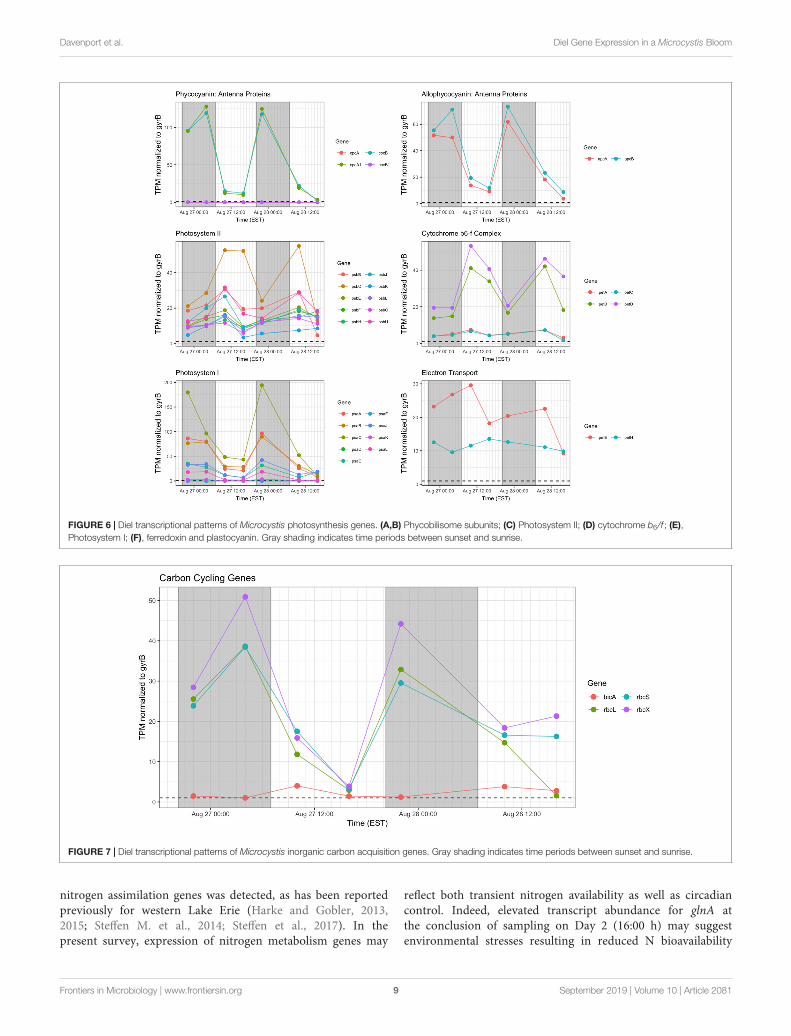
increased primarily at night (Figures 6A,B,E). Conversely,PSII (psb), b6/f complex (petA-D), ferredoxin and plastocyanin(petEFH) transcript abundance increased by day, yieldingmaximum relative abundance at 10:00 h (Figures 6C,D,F).psbA, encoding the PSII D1 protein, was analyzed separatelydue to its very high relative daytime expression due to highrates of DI protein turnover (Supplementary Table S1), andpsbA expression matched the daytime pattern of other PSII-associated genes.
Photosynthesis – Ci AssimilationGenes associated with Rubisco (rbcLSX) showed higher relativetranscript abundance at night (04:00 h) during the first day ofsampling and a pronounced minimum by the next afternoon(16:00 h), but during Day 2, the pattern was less distinct, asrelative transcript abundance proceeded throughout the daytimehours (Figure 7). bicA transcripts were detected at low levelsduring the day, but with an inconsistent pattern from Day 1 toDay 2 that may reflect variation in bicarbonate availability.
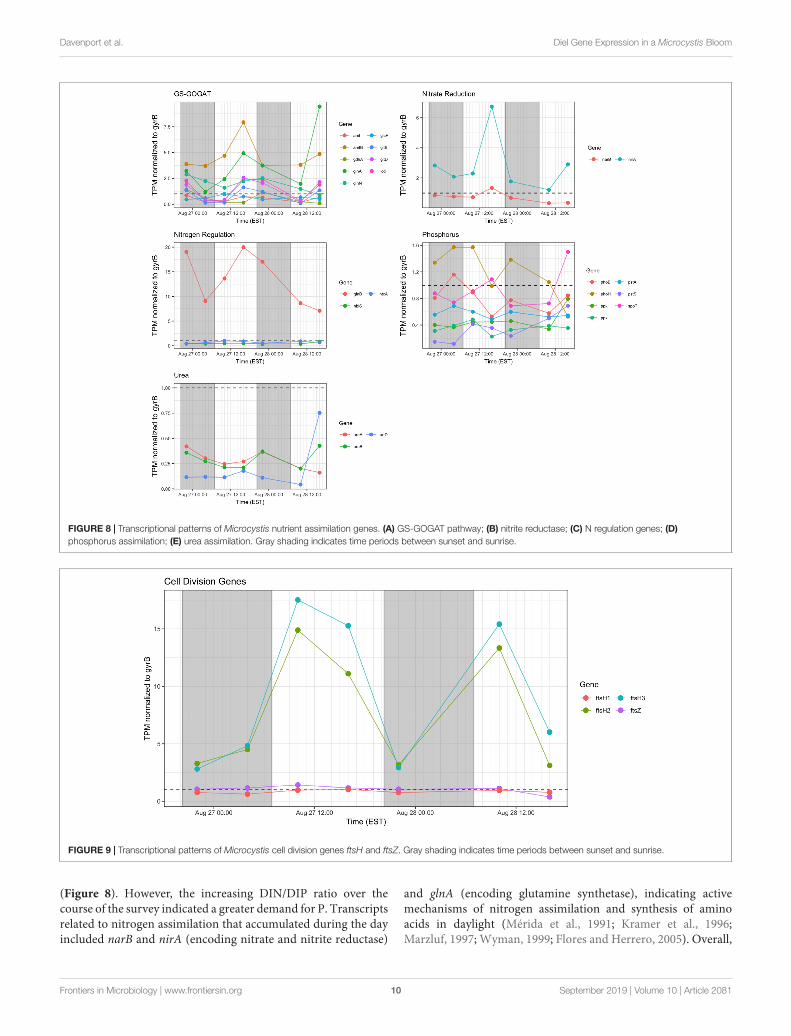
Nutrient AcquisitionIn general, transcription of nutrient acquisition functionswas more active during the daytime hours. Genes encodingfunctions associated with N acquisition and N-responsive generegulation yielded different patterns of transcript abundance.Whereas transcripts associated with the GS-GOGAT pathwayand ammonium uptake (amt, glnAN, glsE, gltBD, icd) hada peak relative abundance in the afternoon (16:00 h), ureatransporters and urease showed a more variable pattern andcomparatively low relative expression throughout the two dayperiod (Figures 8A,C,E). Relative transcript abundance for genesencoding nitrate and nitrite reduction also followed a daytimepattern, peaking at 16:00 h on Day 1 (Figure 8B). By contrast,transcripts detected associated with phosphorus acquisition anduptake (pho, pst) exhibited no clear diel pattern (Figure 8D).
Cell DivisionRelative abundance of transcripts encoding the septation ringprotein FtsZ and cell division function FtsH peak duringthe day on both days, indicating that cell division likelyfollowed later during the daytime hours (Figure 9). Proxymeasurements for bloom biomass suggested that the bloom wasexpanding at the time of the sampling (Figure 2), and thepattern of fts transcription reflects active growth of Microcystisduring this time.
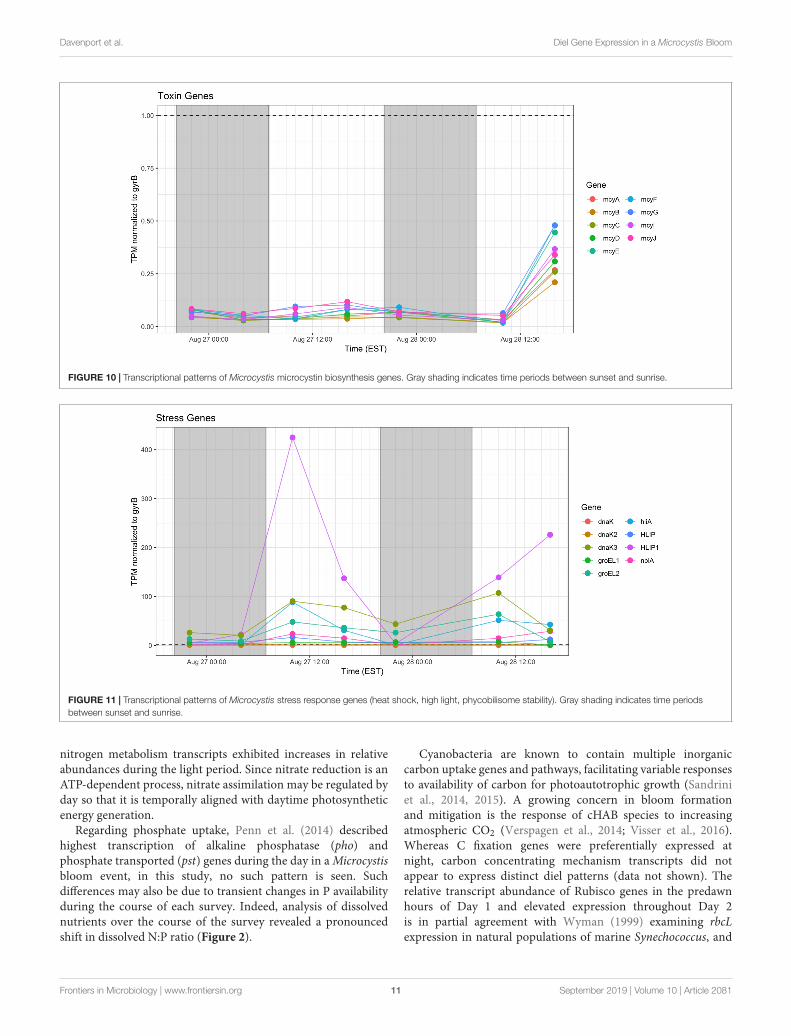
Microcystin Synthesis and StressResponsesRelative expression of the mcy genes was very low and waselevated only during the afternoon of Day 2. Microcystinmeasured during the course of the sampling show a pattern ofincreased toxin, trending toward highest concentrations duringmorning of the second day (Figure 10).
Stress response genes examined included those involved inheat shock (groEL, dnaK), phycobilisome stability (nblA) andhigh light stress (hliA). Unsurprisingly, given increased daytime
Frontiers in Microbiology | www.frontiersin.org 7 September 2019 | Volume 10 | Article 2081
fmicb-10-02081 September 7, 2019 Time: 15:50 # 8
Davenport et al. Diel Gene Expression in a Microcystis Bloom
FIGURE 5 | Principal Component Analysis (PCA) of transcripts obtained from each time point during the study.
temperature, photosynthetic oxygen production and daytimeirradiance, all genes showed increased relative transcription at10:00 h and 16:00 h (Figure 11).
DISCUSSION
Metatranscriptomes spanning two diel cycles were producedfrom a toxic cyanobacterial bloom in western Lake Erie duringlate August 2014. The survey described here coincided with amid-bloom phase with the bloom persisting through October(Steffen et al., 2017). A Lagrangian approach was adopted toensure that a common patch of biomass was sampled over the48-h experiment. In this way, changes in relative abundanceof transcripts could be attributed to either diel patterns orchanging physico-chemical conditions but not to sampling ofdifferent bloom populations. Taxonomic analysis of recruitedtranscripts showed Microcystis spp. to dominate cyanobacterialreads during the survey consistent with independent surveys ofthe western basin conducted during August 2014 (Berry et al.,2017; Steffen et al., 2017).
Cyanobacteria are known to regulate gene expression undercircadian influences (Golden et al., 1997). The intent of thisstudy was to identify cellular processes within a Microcystis
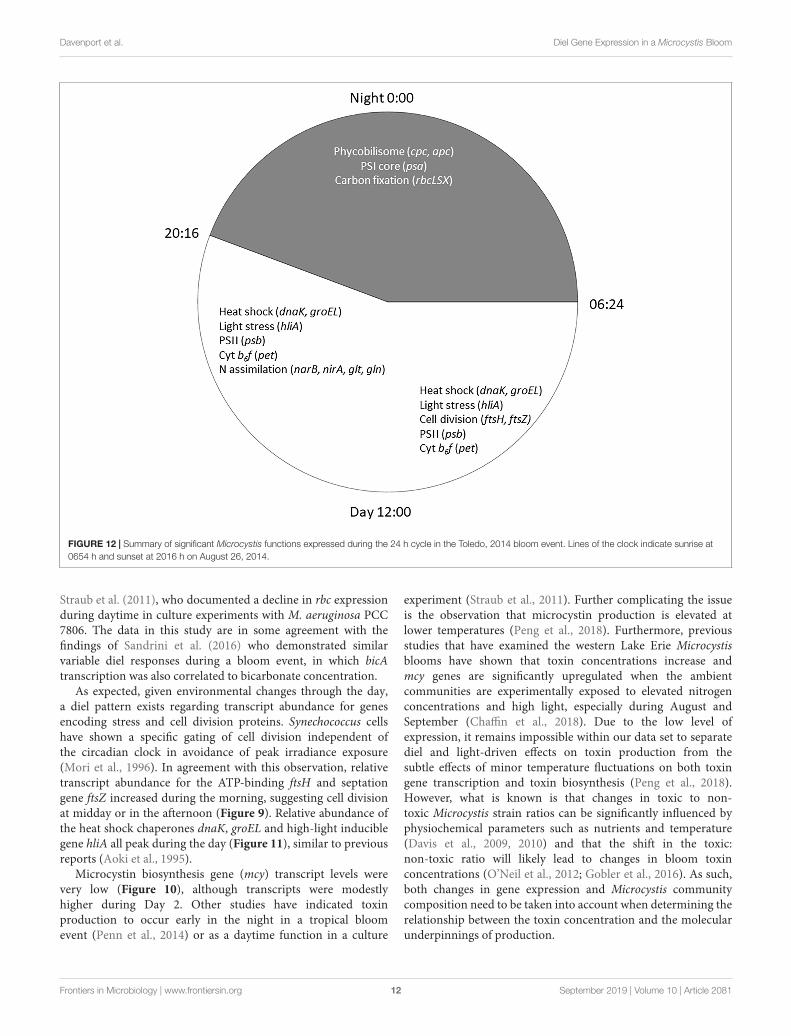
bloom that show diel patterns of expression. PCA of Microcystistranscriptomes revealed grouping of samples based upon timeof collection (i.e., “day” and “night”). Variability amongst daysamples as shown by PCA (Figure 5) suggested circadian rhythmswere not the sole determiner of expression, rather transientenvironmental changes may have contributed to differingtranscript accumulation. A summary of transcriptional activitythroughout the diel cycle is presented in Figure 12.
Reflecting the demands of a phototrophic lifestyle,photosynthesis-related functions for the dark and light reactionswere detected at all time points. Photosynthesis functionsappear to partition so that PSII-dependent O2 evolution peaksin mid-afternoon, as has been observed in laboratory studies(Garczarek et al., 2001; Mackenzie and Morse, 2011). Expressionof genes involved in the cyt b6/f complex follow this samepattern. However, PSI genes were preferentially expressed atnight, peaking at 22:00 h. Given the variability of the timingof PSI gene expression in N-fixing cyanobacteria (del CarmenMuñoz-Marin et al., 2019), and that degradation of PSI occursduring the night in Crocosphaera watsonii WH8501 (Masudaet al., 2018), nighttime expression of psa genes in Microcystis maybe a genus-specific trait.
Consistent with modest nitrogen depletion during the first18 h as revealed by nutrient stoichiometry, expression of
Frontiers in Microbiology | www.frontiersin.org 8 September 2019 | Volume 10 | Article 2081
fmicb-10-02081 September 7, 2019 Time: 15:50 # 9
Davenport et al. Diel Gene Expression in a Microcystis Bloom
FIGURE 6 | Diel transcriptional patterns of Microcystis photosynthesis genes. (A,B) Phycobilisome subunits; (C) Photosystem II; (D) cytochrome b6/f ; (E),Photosystem I; (F), ferredoxin and plastocyanin. Gray shading indicates time periods between sunset and sunrise.
FIGURE 7 | Diel transcriptional patterns of Microcystis inorganic carbon acquisition genes. Gray shading indicates time periods between sunset and sunrise.
nitrogen assimilation genes was detected, as has been reportedpreviously for western Lake Erie (Harke and Gobler, 2013,2015; Steffen M. et al., 2014; Steffen et al., 2017). In thepresent survey, expression of nitrogen metabolism genes may
reflect both transient nitrogen availability as well as circadiancontrol. Indeed, elevated transcript abundance for glnA atthe conclusion of sampling on Day 2 (16:00 h) may suggestenvironmental stresses resulting in reduced N bioavailability
Frontiers in Microbiology | www.frontiersin.org 9 September 2019 | Volume 10 | Article 2081
fmicb-10-02081 September 7, 2019 Time: 15:50 # 10
Davenport et al. Diel Gene Expression in a Microcystis Bloom
FIGURE 8 | Transcriptional patterns of Microcystis nutrient assimilation genes. (A) GS-GOGAT pathway; (B) nitrite reductase; (C) N regulation genes; (D)phosphorus assimilation; (E) urea assimilation. Gray shading indicates time periods between sunset and sunrise.
FIGURE 9 | Transcriptional patterns of Microcystis cell division genes ftsH and ftsZ. Gray shading indicates time periods between sunset and sunrise.
(Figure 8). However, the increasing DIN/DIP ratio over thecourse of the survey indicated a greater demand for P. Transcriptsrelated to nitrogen assimilation that accumulated during the dayincluded narB and nirA (encoding nitrate and nitrite reductase)
and glnA (encoding glutamine synthetase), indicating activemechanisms of nitrogen assimilation and synthesis of aminoacids in daylight (Mérida et al., 1991; Kramer et al., 1996;Marzluf, 1997; Wyman, 1999; Flores and Herrero, 2005). Overall,
Frontiers in Microbiology | www.frontiersin.org 10 September 2019 | Volume 10 | Article 2081
fmicb-10-02081 September 7, 2019 Time: 15:50 # 11
Davenport et al. Diel Gene Expression in a Microcystis Bloom
FIGURE 10 | Transcriptional patterns of Microcystis microcystin biosynthesis genes. Gray shading indicates time periods between sunset and sunrise.
FIGURE 11 | Transcriptional patterns of Microcystis stress response genes (heat shock, high light, phycobilisome stability). Gray shading indicates time periodsbetween sunset and sunrise.
nitrogen metabolism transcripts exhibited increases in relativeabundances during the light period. Since nitrate reduction is anATP-dependent process, nitrate assimilation may be regulated byday so that it is temporally aligned with daytime photosyntheticenergy generation.
Regarding phosphate uptake, Penn et al. (2014) describedhighest transcription of alkaline phosphatase (pho) andphosphate transported (pst) genes during the day in a Microcystisbloom event, in this study, no such pattern is seen. Suchdifferences may also be due to transient changes in P availabilityduring the course of each survey. Indeed, analysis of dissolvednutrients over the course of the survey revealed a pronouncedshift in dissolved N:P ratio (Figure 2).
Cyanobacteria are known to contain multiple inorganiccarbon uptake genes and pathways, facilitating variable responsesto availability of carbon for photoautotrophic growth (Sandriniet al., 2014, 2015). A growing concern in bloom formationand mitigation is the response of cHAB species to increasingatmospheric CO2 (Verspagen et al., 2014; Visser et al., 2016).Whereas C fixation genes were preferentially expressed atnight, carbon concentrating mechanism transcripts did notappear to express distinct diel patterns (data not shown). Therelative transcript abundance of Rubisco genes in the predawnhours of Day 1 and elevated expression throughout Day 2is in partial agreement with Wyman (1999) examining rbcLexpression in natural populations of marine Synechococcus, and
Frontiers in Microbiology | www.frontiersin.org 11 September 2019 | Volume 10 | Article 2081
fmicb-10-02081 September 7, 2019 Time: 15:50 # 12
Davenport et al. Diel Gene Expression in a Microcystis Bloom
FIGURE 12 | Summary of significant Microcystis functions expressed during the 24 h cycle in the Toledo, 2014 bloom event. Lines of the clock indicate sunrise at0654 h and sunset at 2016 h on August 26, 2014.
Straub et al. (2011), who documented a decline in rbc expressionduring daytime in culture experiments with M. aeruginosa PCC7806. The data in this study are in some agreement with thefindings of Sandrini et al. (2016) who demonstrated similarvariable diel responses during a bloom event, in which bicAtranscription was also correlated to bicarbonate concentration.
As expected, given environmental changes through the day,a diel pattern exists regarding transcript abundance for genesencoding stress and cell division proteins. Synechococcus cellshave shown a specific gating of cell division independent ofthe circadian clock in avoidance of peak irradiance exposure(Mori et al., 1996). In agreement with this observation, relativetranscript abundance for the ATP-binding ftsH and septationgene ftsZ increased during the morning, suggesting cell divisionat midday or in the afternoon (Figure 9). Relative abundance ofthe heat shock chaperones dnaK, groEL and high-light induciblegene hliA all peak during the day (Figure 11), similar to previousreports (Aoki et al., 1995).
Microcystin biosynthesis gene (mcy) transcript levels werevery low (Figure 10), although transcripts were modestlyhigher during Day 2. Other studies have indicated toxinproduction to occur early in the night in a tropical bloomevent (Penn et al., 2014) or as a daytime function in a culture
experiment (Straub et al., 2011). Further complicating the issueis the observation that microcystin production is elevated atlower temperatures (Peng et al., 2018). Furthermore, previousstudies that have examined the western Lake Erie Microcystisblooms have shown that toxin concentrations increase andmcy genes are significantly upregulated when the ambientcommunities are experimentally exposed to elevated nitrogenconcentrations and high light, especially during August andSeptember (Chaffin et al., 2018). Due to the low level ofexpression, it remains impossible within our data set to separatediel and light-driven effects on toxin production from thesubtle effects of minor temperature fluctuations on both toxingene transcription and toxin biosynthesis (Peng et al., 2018).However, what is known is that changes in toxic to non-toxic Microcystis strain ratios can be significantly influenced byphysiochemical parameters such as nutrients and temperature(Davis et al., 2009, 2010) and that the shift in the toxic:non-toxic ratio will likely lead to changes in bloom toxinconcentrations (O’Neil et al., 2012; Gobler et al., 2016). As such,both changes in gene expression and Microcystis communitycomposition need to be taken into account when determining therelationship between the toxin concentration and the molecularunderpinnings of production.
Frontiers in Microbiology | www.frontiersin.org 12 September 2019 | Volume 10 | Article 2081
fmicb-10-02081 September 7, 2019 Time: 15:50 # 13
Davenport et al. Diel Gene Expression in a Microcystis Bloom
Examining the relative transcript abundance for the genesanalyzed in the study reveals a marked increase in relativetranscript abundance for a few genes (e.g., rbcS, rbcX, glnA, mcyA-J) at the final time point (16:00 h on Day 2). This increaselikely indicated a change in environmental conditions on thesecond day. The nutrient profile shifted toward P deficiency onthe 28th (Figure 2), suggesting the onset of modest nutrientstress, but light stress was likely not a factor given the similarpeak irradiances measured at the Toledo water intake cribduring both days (Supplementary Figure S1). This documentedchange in gene expression remains unexplained, but since thesample passed QA/QC at JGI it was not due to changes intranscript composition due to rRNA contamination or RNAdegradation (data not shown). High abundance of viral readswere also not detected.
CONCLUSION
Lake Erie experiences annual cHAB events, and these eventswill continue as eutrophication intensifies (Watson et al., 1997;Michalak et al., 2013). In light of concerns over the safetyof water resources and human health, there is an urgentneed to elucidate the factors influencing cHAB formation,proliferation, and maintenance, to better inform prevention andmitigation strategies. Toward this goal, the present study used ametatranscriptomic approach to investigate metabolic functionof a Lake Erie Microcystis bloom over diel cycles. Lab studieshave found the genomes of Microcystis to be highly plastic andadaptable to the environment, increasing their competitive ability(Meyer et al., 2017). Previous investigations report the presenceof circadian regulation of gene expression in cyanobacteria(Kondo et al., 1993; Golden et al., 1997). The circadian clockhas been shown to enhance the fitness of the species within themicrobial community. Paired with a highly adaptive genome,Microcystis has the potential to be very successful. Our analysisindicates that Lake Erie Microcystis likely utilizes efficientorganization of gene expression to maintain productivity, suchas utilization of a variety of nutrient species throughout a dielcycle (CO2, bicarbonate, nitrate, ammonium), cell division and,if a toxic genotype, the production of microcystins. Our resultssuggest that although diel patterns are detectable, environmentalcues also influence regulation, as supported by PCA analysis.The next step of this analysis is to study the metabolism of theglobal microbial community. In doing so, those results pairedwith this analysis of Microcystis spp. will provide insights intofactors leading to the natural mitigation of a bloom, and howthe surrounding consortium of heterotrophs and phages interactand influence both cHAB success and decline. Indeed, a rolefor Microcystis phage infection was suggested in constrainingthis same bloom 3 weeks earlier in Lake Erie, yielding shifts inmicrocystin toxin from an intracellular particulate fraction tothe soluble phase (Steffen et al., 2017). Conversely, recent workinvokes the Black Queen Hypothesis (Morris et al., 2012) indemonstrating a role for catalase produced by bloom-associatedheterotrophs in protecting Microcystis from oxidative stress thuspromoting bloom success (Greg Dick, personal communication).
DATA AVAILABILITY
The datasets generated for this study can be accessed fromNCBI SRA, SRP117911, SRP117914, SRP117915, SRP117922,SRP128942, SRP128945, and SRP128954.
AUTHOR CONTRIBUTIONS
ED conducted the field sampling, initial analysis of the assembledreads, and wrote the Introduction and Materials and Methodssections. MN and PM analyzed the relative transcript abundanceat each diel timepoint. MD, LK, and JS isolated RNA andprocessed the metatrascriptomic data from JGI. KM, GD, TD,SW, and RM developed the Lagrangian sampling plan. GBhelped to devise the study, analyzed the metadata, and wrotethe Results and Discussion sections. TJ led the field samplingand provided all field metadata. ST and EL processed theRNAs for sequencing.
FUNDING
GB was supported by NOAA’s Ohio Sea Grant College Program,R/ER-104 (jointly with RMLM) and by funding from the NIH(1P01ES028939-01) and NSF (OCE-1840715) to the Great LakesCenter for Fresh Waters and Human Health, Bowling GreenState University. SW was supported by the National ScienceFoundation (IOS-1451528). The work conducted by the U.S.DOE Joint Genome Institute, a DOE Office of Science UserFacility, was supported by the Office of Science of the U.S. DOEunder Contract No. DE-AC02-05CH11231. GD and KM weresupported by grants from the University of Michigan Office forResearch MCubed program and the Erb Family Foundation madethrough the University of Michigan Water Center. Additionalfunding was provided to the Cooperative Institute for Great LakesResearch (CIGLR) through the NOAA Cooperative Agreementwith University of Michigan (NA17OAR4320152). This is CIGLRcontribution number 1147.
ACKNOWLEDGMENTS
We thank Taylor Tuttle for assistance with sampling. We thankthe captain and crew of the NOAA Great Lakes EnvironmentalResearch Laboratory for the research vessel used in this study.We would also like to thank Sunit Jain (Second Genome, SouthSan Francisco, CA, United States) for initial quality control andassembly of Microcystis genomes, and Paul Den Uyl for extractingDNAs from Microcystis cultures for sequencing.
SUPPLEMENTARY MATERIAL
The Supplementary Material for this article can be found onlineat: https://www.frontiersin.org/articles/10.3389/fmicb.2019.02081/full#supplementary-material
Frontiers in Microbiology | www.frontiersin.org 13 September 2019 | Volume 10 | Article 2081
fmicb-10-02081 September 7, 2019 Time: 15:50 # 14
Davenport et al. Diel Gene Expression in a Microcystis Bloom
REFERENCESAoki, S., Kondo, T., and Ishiura, M. (1995). Circadian expression of the dnaK
gene in the cyanobacterium Synechocystis sp. strain PCC 6803. J. Bacteriol. 177,5606–5611. doi: 10.1128/jb.177.19.5606-5611.1995
Badger, M., and Price, G. D. (2003). CO2 concentrating mechanisms incyanobacteria: molecular components, their diversity and evolution. J. Exp. Bot.54, 609–622. doi: 10.1093/jxb/erg076
Berry, M. A., Davis, T. W., Cory, R. M., Duhaime, M. B., Johengen, T. H., Kling,G. W., et al. (2017). Cyanobacterial harmful algal blooms are a biologicaldisturbance to western lake erie bacterial communities. Environ. Microbiol. 19,1149–1162. doi: 10.1111/1462-2920.13640
Bingham, M., Sinha, S. K., and Lupi, F. (2015). Economic Benefits of ReducingHarmful Algal Blooms in Lake Erie. Report No. 66. Gainesville, FL:Environmental Consulting & Technology, Inc.
Brittain, S. M., Wang, J., Babcock-Jackson, L., Carmichael, W. W., Rinehart, K. L.,and Culver, D. A. (2000). Isolation and characterization of microcystins, cyclicheptapeptide hepatotoxins from a lake erie strain of Microcystis aeruginosa.J. Great Lakes Res. 26, 241–249. doi: 10.1016/s0380-1330(00)70690-3
Brookes, J., and Ganf, G. (2001). Variations in the buoyancy response of Microcystisaeruginosa to nitrogen, phosphorus and light. J. Plankton Res. 23, 1399–1411.doi: 10.1093/plankt/23.12.1399
Brunberg, A. K., and Blomqvist, P. (2003). Recruitment of Microcystis(Cyanophyceae) from lake sediments: the importance of littoral inocula.J. Phycol. 39, 58–63. doi: 10.1046/j.1529-8817.2003.02059.x
Bullerjahn, G. S., McKay, R. M., Davis, T. W., Baker, D. B., Boyer, G. L., D’Anglada,L. V., et al. (2016). Global solutions to regional problems: collecting globalexpertise to address the problem of harmful cyanobacterial blooms. A lake eriecase study. Harmful Algae 54, 223–238. doi: 10.1016/j.hal.2016.01.003
Bünning, E. (1973). Physiological Clocks; Circadian Rhythms and BiologicalChronometry. London: English Universities Press, 258.
Chaffin, J. D., Davis, T. W., Smith, D. J., Baer, M. M., and Dick, G. J. (2018).Interactions between nitrogen form, loading rate and light intensity onMicrocystis and Planktothrix growth and microcystin production. HarmfulAlgae 73, 84–97. doi: 10.1016/j.hal.2018.02.001
Chen, T. H., Chen, T. L., Huang, L., and Huang, T. (1991). Circadian rhythm inamino acid uptake by Synechococcus RF-1. Plant Physiol. 97, 89–104.
Davis, C. O., and Simmons, M. S. (1979). Water Chemistry and Phytoplankton Fieldand Laboratory Procedures. Special Report No. 70. Ann Arbor, MI: Great LakesResearch Division, University of Michigan.
Davis, T. W., Berry, D. L., Boyer, G. L., and Gobler, C. J. (2009). The effects oftemperature and nutrients on the growth and dynamics of toxic and non-toxicstrains of Microcystis during cyanobacteria blooms. Harmful Algae 8, 715–725.doi: 10.1016/j.hal.2009.02.004
Davis, T. W., Harke, M. J., Marcoval, M. A., Goleski, J., Orano-Dawson, C., Berry,D. L., et al. (2010). Effects of nitrogenous compounds and phosphorus onthe growth of toxic and non-toxic strains of Microcystis during cyanobacterialblooms. Aquat. Microb. Ecol. 61, 149–162. doi: 10.3354/ame01445
del Carmen Muñoz-Marin, M., Shilova, I. N., Shi, T., Farnelid, H., Cabello, A. M.,and Zehr, J. P. (2019). The transcriptional cycle is suited to daytime N2 fixationin the unicellular cyanobacterium “Candidatus Atelocyanobacterium thalassa”(UCYN-A). MBio 10:e02495-e18. doi: 10.1128/mBio.02495-18
Falconer, I. R. (1994). “Health problems from exposure to cyanobacteria andproposed safety guidelines for drinking and recreational water,” in DetectionMethods for Cyanobacterial Toxins, eds G. A. Codd, T. M. Jefferies, C. W. Keevil,and P. Potter (Cambridge: Royal Society of Chemistry), 3–10. doi: 10.1533/9781845698164.1.3
Fan, H., Cai, Y., Xie, P., Xiao, W., Chen, J., Ji, W., et al. (2014). Microcystin-LRstabilizes c-myc protein by inhibiting protein phosphatase 2A in HEK293 cells.Toxicology 319, 69–74. doi: 10.1016/j.tox.2014.02.015
Fischer, W. J., Garthwaite, I., Miles, C. O., Ross, K. M., Aggen, J. B., Chamberlin,A. R., et al. (2001). Congener-independent immunoassay for microcystins andnodularins. Environ. Sci. Technol. 35, 4849–4856. doi: 10.1021/es011182f
Flores, E., and Herrero, A. (2005). Nitrogen assimilation and nitrogen controlin cyanobacteria. Biochem. Soc. Trans. 33, 164–167. doi: 10.1042/bst0330164
Frangeul, L., Quillardet, P., Castets, A. M., Humbert, J. F., Matthijs, H. C. P., Cortez,D., et al. (2008). Highly plastic genome of Microcystis aeruginosa PCC7806,
a ubiquitous toxic freshwater cyanobacterium. BMC Genomics 9:274. doi: 10.1186/1471-2164-9-274
Garczarek, L., Partensky, F., Irlbacher, H., Holtzendorff, J., Babin, M., Mary, I., et al.(2001). Differential expression of antenna and core genes in ProchlorococcusPCC 9511 (Oxyphotobacteria) grown under a modulated light–dark cycle.Environ. Microbiol. 3, 168–175. doi: 10.1046/j.1462-2920.2001.00173.x
Gobler, C. J., Burkholder, J. M., Davis, T. W., Harke, M. J., Johengen, T., Stow,C. A., et al. (2016). The dual role of nitrogen supply in controlling the growthand toxicity of cyanobacterial blooms. Harmful Algae 54, 87–97. doi: 10.1016/j.hal.2016.01.010
Golden, S. S., Ishiura, M., Johnson, C. H., and Kondo, T. (1997). Cyanobacterialcircadian rhythms. Ann. Rev. Plant Physiol. Plant Mol. Biol. 48, 327–354.
Harke, M. J., and Gobler, C. J. (2013). Global transcriptional responses of the toxiccyanobacterium, Microcystis aeruginosa, to nitrogen stress, phosphorus stress,and growth on organic matter. PLoS One 8:e69834. doi: 10.1371/journal.pone.0069834
Harke, M. J., and Gobler, C. J. (2015). Daily transcriptome changes reveal therole of nitrogen in controlling microcystin synthesis and nutrient transportin the toxic cyanobacterium, Microcystis aeruginosa. BMC Genomics 16:1068.doi: 10.1186/s12864-015-2275-9
Holtzendorff, J., Partensky, F., Mella, D., Lennon, J.-F., Hess, W. R., and Garczarek,L. (2008). Genome streamlining results in loss of robustness of the circadianclock in the marine cyanobacterium Prochlorococcus marinus PCC 9511. J. Biol.Rhyth. 23, 187–199. doi: 10.1177/0748730408316040
Horváth, H., Kovács, A. W., Riddick, C., and Présing, M. (2013). Extractionmethods for phycocyanin determination in freshwater filamentouscyanobacteria and their application in a shallow lake. Eur. J. Phycol. 48,278–286. doi: 10.1080/09670262.2013.821525
Huisman, J., and Hulot, F. D. (2005). “Population dynamics of harmfulcyanobacteria,” in Harmful Cyanobacteria, eds J. Huisman, H. C. P. Matthijis,and P. M. Visser (New York, NY: Springer), 143–176. doi: 10.1007/1-4020-3022-3_7
Humbert, J. F., Barbe, V., Latifi, A., Calteau, A., Coursin, T., Lajus, A., et al.(2013). A tribute to disorder in the genome of the bloom-forming freshwatercyanobacterium Microcystis aeruginosa. PLoS One 8:e70747. doi: 10.1371/journal.pone.0070747
Hutin, C., Nussaume, L., Moise, N., Moya, I., Kloppstech, K., and Havaux, M.(2003). Early light-induced proteins protect Arabidopsis from photooxidativestress. Proc. Natl. Acad. Sci. U.S.A. 100, 4921–4926. doi: 10.1073/pnas.0736939100
Ishiura, M., Kutsuna, S., Aoki, S., Iwasaki, H., Andersson, C., Tanabe, A., et al.(1998). Expression of a gene cluster kaiABC as a circadian feedback processin cyanobacteria. Science 281, 1519–1523. doi: 10.1126/science.281.5382.1519
Jöhnk, K. D., Huisman, J., Sharples, J., Sommeijer, B., Visser, P. M., and Stroom,J. M. (2008). Summer heat waves promote blooms of harmful cyanobacteria.Glob. Change Biol. 14, 495–512. doi: 10.1111/j.1365-2486.2007.01510.x
Johnson, C. H., and Hastings, J. W. (1986). The elusive mechanism of the circadianclock: the quest for the chemical basis of the biological clock is beginning toyield tantalizing clues. Am. Sci. 74, 29–37.
Kaneko, T., Nakajima, N., Okamota, S., Suzuki, I., Tanabe, Y., Tamaoki, M.,et al. (2007). Complete genomic structure of the bloom-forming toxiccyanobacterium Microcystis aeruginosa NIES-843. DNA Res. 14, 247–256. doi:10.1093/dnares/dsm026
Kitchens, C. M., Johengen, T. H., and Davis, T. W. (2018). Establishing spatialand temporal patterns in Microcystis sediment seed stock viability and theirrelationship to subsequent bloom development in western lake erie. PLoS One13:e0206821. doi: 10.1371/journal.pone.0206821
Kondo, T., Strayer, C., Kulkarni, R., Ishiura, W., Golden, S., and Johnson, C.(1993). Circadian rhythms in prokaryotes: luciferase as a reporter of circadiangene expression in cyanobacteria. Proc. Nat. Acad. Sci. U.S.A. 90, 5672–5676.doi: 10.1073/pnas.90.12.5672
Konopka, R., and Benzer, S. (1971). Clock mutants of Drosophila melanogaster.Proc. Nat. Acad. Sci. U.S.A. 68, 2112–2116. doi: 10.1073/pnas.68.9.2112
Kramer, J., Wyman, M., Zehr, J., and Capone, D. (1996). Diel variabilityin transcription of the structural gene for glutamine synthetase (glnA) innatural populations of the marine diazotrophic cyanobacterium Trichodesmiumthiebautii. FEMS Microbiol. Ecol. 21, 187–196. doi: 10.1016/s0168-6496(96)00055-4
Frontiers in Microbiology | www.frontiersin.org 14 September 2019 | Volume 10 | Article 2081
fmicb-10-02081 September 7, 2019 Time: 15:50 # 15
Davenport et al. Diel Gene Expression in a Microcystis Bloom
Krausfeldt, L. E., Farmer, A. T., Gonzalez, H. C., Zepernick, B. N., Campagna,S. R., and Wilhelm, S. W. (2019). Urea is both a carbon and nitrogen sourcefor Microcystis aeruginosa: tracking 13C incorporation at bloom pH conditions.Front. Microbiol. 10:1064. doi: 10.3389/fmicb.2019.01064
Kucho, K., Okamoto, K., Tsuchiya, Y., Nomura, S., Nango, M., Kanehisa, M.,et al. (2005). Global analysis of circadian expression in the cyanobacteriumSynechocystis sp. strain PCC 6803. J. Bacteriol. 187, 2190–2199. doi: 10.1128/jb.187.6.2190-2199.2005
Kulkarni, R. D., and Golden, S. S. (1994). Adaptation to high light intensity inSynechococcus sp. strain PCC 7942: regulation of three psbA genes and twoforms of the D1 protein. J. Bacteriol. 176, 959–965. doi: 10.1128/jb.176.4.959-965.1994
Labiosa, R., Arrigo, K., Tu, C., Bhaya, D., Bay, S., Grossman, A., et al. (2006).Examination of diel changes in global transcript accumulation in Synechocystis(Cyanobacteria). J. Phycol. 42, 622–636. doi: 10.1111/j.1529-8817.2006.00217.x
Liu, Y., Tsinoremas, N., Johnson, C. H., Lebedeva, N., Golden, S. S., Ishiura, M.,et al. (1995). Circadian orchestration of gene expression in cyanobacteria. GenesDev. 9, 1469–1478. doi: 10.1101/gad.9.12.1469
Lorne, J., Scheffer, J., Lee, A., Painter, M., and Miao, V. (2000). Genes controllingcircadian rhythm are widely distributed in cyanobacteria. FEMS Microbiol. Lett.189, 129–133. doi: 10.1016/s0378-1097(00)00237-8
Mackenzie, T. D., and Morse, D. (2011). Circadian photosynthetic reductant flowin the dinoflagellate Lingulodinium is limited by carbon availability. Plant CellEnviron. 34, 669–680. doi: 10.1111/j.1365-3040.2010.02271.x
Markowitz, V., Chen, I., Chu, K., Szeto, E., Palaniappan, K., Pillay, M., et al. (2014).IMG/M4 version of the integrated metagenome comparative analysis system.Nucl. Acids Res. 42, 568–573.
Markowitz, V., Chen, I., Palaniappan, K., Chu, K., Szeto, E., Grechkin, Y., et al.(2012). IMG: the integrated microbial genomes database and comparativeanalysis system. Nucl. Acids Res. 40, 115–122.
Marzluf, G. A. (1997). Genetic regulation of nitrogen metabolism in the fungi.Microbiol. Mol. Biol. Rev. 61, 17–32.
Masuda, T., Bernat, G., Beckova, M., Kotabova, E., Lawrenz, E., Lukes, M., et al.(2018). Diel regulation of photosynthetic activity in the unicellular diazotrophiccyanobacterium Crocosphaera watsonii WH8501. Environ. Microbiol. 20,546–560. doi: 10.1111/1462-2920.13963
Mavromatis, K., Ivanova, N. N., Chen, I. M. A., Szeto, E., Markowitz, V. M.,and Kyrpides, N. C. (2009). The DOE-JGI standard operating procedure forthe annotations of microbial genomes. Stand Genomics Sci. 1:63. doi: 10.4056/sigs.632
Menzel, D. W., and Corwin, N. (1965). The measurement of total phosphorusliberated in seawater based on the liberation of organically bound fractions bypersulfate oxidation. Limnol. Oceanogr. 10, 280–288.
Mérida, A., Candau, P., and Florencio, F. J. (1991). Regulation of glutaminesynthetase activity in the unicellular cyanobacterium Synechocystis sp. strainPCC 6803 by the nitrogen source: effect of ammonium. J. Bacteriol. 173,4095–4100. doi: 10.1128/jb.173.13.4095-4100.1991
Meyer, F., Paarmann, D., D’Souza, M., Olson, R., Glass, E. M., Kubal, M., et al.(2008). The metagenomics RAST server – a public resource for the automaticphylogenetic and functional analysis of metagenomes. BMC Bioinformatics9:386. doi: 10.1186/1471-2105-9-386
Meyer, K. A., Davis, T. W., Watson, S. B., Denef, V. J., Berry, M. A., and Dick, G. J.(2017). Genome sequences of lower Great Lakes Microcystis sp. reveal strain-specific genes that are present and expressed in western lake erie blooms. PLoSOne 12:e0183859. doi: 10.1371/journal.pone.0183859
Michalak, A. M., Anderson, E. J., Beletsky, D., Boland, S., Bosch, N. S., Bridgeman,T. B., et al. (2013). Record-setting algal bloom in lake erie caused by agriculturaland meteorological trends consistent with expected future conditions. Proc.Natl. Acad. Sci. U.S.A. 110, 6448–6452. doi: 10.1073/pnas.1216006110
Mori, T., Binder, B., and Johnson, C. H. (1996). Circadian gating of cell division incyanobacteria growing with average doubling times of less than 24 hours. Proc.Nat. Acad. Sci. U.S.A. 93, 10183–10188. doi: 10.1073/pnas.93.19.10183
Morris, J. J., Lenski, R. E., and Zinser, E. R. (2012). The black queen hypothesis:evolution of dependencies through adaptive gene loss. MBio 3:e00036-e12.doi: 10.1128/mBio.00036-12
Nordberg, H., Cantor, M., Dusheyko, S., Hua, S., Poliakov, A., and Shabalov, I.(2014). The genome portal of the department of energy joint genome institute:2014 updates. Nucl. Acids Res. 42, D26–D31. doi: 10.1093/nar/gkt1069
O’Neil, J. M., Davis, T. W., Burford, M. A., and Gobler, C. J. (2012). The rise ofharmful cyanobacteria blooms (CHABs): the potential roles of eutrophicationand climate change. Harmful Algae 14, 313–334. doi: 10.1016/j.hal.2011.10.027
Paerl, H., and Huisman, J. (2008). Blooms like it hot. Science 320, 57–58. doi:10.1126/science.1155398
Peng, G., Martin, R. M., Dearth, S. P., Sun, X., Boyer, G. L., Campagna, S. R.,et al. (2018). Seasonally relevant cool temperatures interact with N chemistryto increase microcystins produced in lab cultures of Microcystis aeruginosaNIES-843. Environ. Sci. Technol. 52, 4127–4136. doi: 10.1021/acs.est.7b06532
Penn, K., Wang, J., Fernando, S., and Thompson, J. (2014). Secondary metabolitegene expression and interplay of bacterial functions in a tropical freshwatercyanobacterial bloom. ISME J. 8, 1866–1878. doi: 10.1038/ismej.2014.27
Pittendrigh, C. S. (1981). Handbook of Behavioral Neurobiology: BiologicalRhythms, ed. J. Aschoff (New York, NY: Plenum Press), 57–80.
R Core Team (2018). R: A Language and Environment for Statistical Computing.Vienna: R Foundation for Statistical Computing.
Reynolds, C., Oliver, R., and Walsby, A. (1987). Cyanobacterial dominance: the roleof buoyancy regulation in dynamic lake environments. New Zealand J. Mar.Fresh. Res. 21, 379–390. doi: 10.1080/00288330.1987.9516234
Reynolds, C. S. (2006). Ecology of Phytoplankton. Cambridge: CambridgeUniversity Press, 55.
Rinta-Kanto, J. M., Saxton, M. A., DeBruyn, J. M., Smith, J. L., Marvin, C. H.,Krieger, K. A., et al. (2009). The diversity and distribution of toxigenicMicrocystis spp. in present day and archived pelagic and sediment samples fromlake erie. Harmful Algae 8, 385–394. doi: 10.1016/j.hal.2008.08.026
Rowe, M. D., Anderson, E. J., Wynne, T. T., Stumpf, R. P., Fanslow, D. L.,Kijanka, K., et al. (2016). Vertical distribution of buoyant Microcystis bloomsin a Lagrangian particle tracking model for short-term forecasts in lake erie.J. Geophys. Res. 121, 5296–5314. doi: 10.1002/2016jc011720
Sandrini, G., Jakupovic, D., Matthijs, H., and Huisman, J. (2015). Strains ofthe harmful cyanobacterium Microcystis aeruginosa differ in gene expressionand activity of inorganic carbon uptake systems at elevated CO2 levels. Appl.Environ. Microbiol. 81, 7730–7739. doi: 10.1128/AEM.02295-15
Sandrini, G., Matthijs, H., Verspagen, J., Muyzer, G., and Huisman, J. (2014).Genetic diversity of inorganic carbon uptake systems causes variation in CO2response of the cyanobacterium Microcystis. ISME J. 8, 589–600. doi: 10.1038/ismej.2013.179
Sandrini, G., Tann, R. P., Schuurmans, J. M., van Beusekom, S. A., Matthijs,H. C., and Huisman, J. (2016). Diel variation in gene expression of the CO2-concentrating mechanism during a harmful algal bloom. Front. Microbiol.7:551. doi: 10.3389/fmicb.2016.00551
Speziale, B. J., Schreiner, S. P., Giammatteo, P. A., and Schindler, J. E. (1984).Comparison of N,N-dimethyl-formamide, dimethylsulfoxide, and acetone forextraction of phytoplankton chlorophyll. Can. J. Fish. Aquat. Sci. 41, 1519–1522.doi: 10.1139/f84-187
Steffen, M., Dearth, S., Dill, B., Zhou, L., Larsen, K., Campagna, S., et al. (2014).Nutrient driven transcriptional changes that maintain metabolic homeostasisbut alter genome architecture in Microcystis. ISME J. 8, 2080–2092. doi: 10.1038/ismej.2014.78
Steffen, M. M., Belisle, B. S., Watson, S. B., Boyer, G. L., and Wilhelm, S. W. (2014).Status, causes and consequences of cyanobacterial blooms in lake erie. J. GreatLakes Res. 40, 215–225. doi: 10.1016/j.jglr.2013.12.012
Steffen, M. M., Davis, T. W., McKay, R. M., Bullerjahn, G. S., Krausfeldt, L. E.,Stough, J. M. A., et al. (2017). Ecophysiological examination of the lake erieMicrocystis bloom in 2014: linkages between biology and the water supplyshutdown of Toledo, Ohio. Environ. Sci. Technol. 20, 6745–6755. doi: 10.1021/acs.est.7b00856
Straub, C., Quillardet, P., Vergalli, J., Tandeau de Marsac, N., and Humbert, J. F.(2011). A day in the life of Microcystis aeruginosa strain PCC 7806 as revealedby a transcriptomic analysis. PLoS One 6:e16208. doi: 10.1371/journal.pone.0016208
Sweeney, B. M. (2013). Rhythmic Phenomena in Plants. Cambridge, MA: AcademicPress, 171.
Takada, K., Hanawa, K., Lee, S. G., Himeno, H., and Muto, A. (2002). The structureand function of tmRNA. Nucleic Acids Res. Suppl. 2, 65–66.
Valladares, A., Montesinos, M., Herrero, A., and Flores, E. (2002). An ABC-type,high affinity urea permease identified in cyanobacteria. Mol. Microbiol. 43,703–715. doi: 10.1046/j.1365-2958.2002.02778.x
Frontiers in Microbiology | www.frontiersin.org 15 September 2019 | Volume 10 | Article 2081
fmicb-10-02081 September 7, 2019 Time: 15:50 # 16
Davenport et al. Diel Gene Expression in a Microcystis Bloom
Verspagen, J., Van de Waal, D., Finke, J., Visser, P., Van Donk, E., and Huisman,J. (2014). Rising CO2 levels will intensify phytoplankton blooms in eutrophicand hypereutrophic lakes. PLoS One 9:e104325. doi: 10.1371/journal.pone.0104325
Visser, P. M., Verspagen, J. M. H., Sandrini, G., Stal, L. J., Matthijs, H. C. P.,and Davis, T. W. (2016). How rising CO2 and global warming may stimulateharmful cyanobacterial blooms. Harmful Algae 54, 145–159. doi: 10.1016/j.hal.2015.12.006
Watson, S. B., McCauley, E., and Downing, J. A. (1997). Patterns in phytoplanktontaxonomic composition across temperate lakes of differing nutrient status.Limnol. Oceanogr. 42, 487–495. doi: 10.4319/lo.1997.42.3.0487
Welkie, D. G., Rubin, B. E., Diamond, S., Hood, R. D., Savage, D. F., and Golden,S. S. (2019). A hard day’s night: cyanobacteria in diel cycles. Trends Microbiol.27, 231–242. doi: 10.1016/j.tim.2018.11.002
Wickham, H. (2016). ggplot2: Elegant Graphics for Data Analysis. New York, NY:Springer-Verlag.
Wickham, H., and Henry, L. (2018). tidyr: Easily Tidy Data with ‘Spread()’ and‘Gather()’ Functions. R Package Version 0.8.3.
Wolf, D., and Klaiber, H. A. (2017). Bloom and bust: toxic algae’s impact on nearbyproperty values. Ecol. Econ. 135, 209–221. doi: 10.1016/j.ecolecon.2016.12.007
Wyman, M. (1999). Diel rhythms in ribulose-1,5-bisphosphatecarboxylase/oxygenase and glutamine synthetase gene expression in anatural population of marine picoplanktonic cyanobacteria (Synechococcusspp.). Appl. Environ. Microbiol. 65, 3651–3659.
Xu, Y., Mori, T., and Johnson, C. H. (2003). Cyanobacterial circadian resonanceenergy transfer (BRET) system: application to interacting circadian clockproteins. Proc. Nat. Acad. Sci. U.S.A. 96, 151–156. doi: 10.1073/pnas.96.1.151
Conflict of Interest Statement: The authors declare that the research wasconducted in the absence of any commercial or financial relationships that couldbe construed as a potential conflict of interest.
Copyright © 2019 Davenport, Neudeck, Matson, Bullerjahn, Davis, Wilhelm,Denney, Krausfeldt, Stough, Meyer, Dick, Johengen, Lindquist, Tringe and McKay.This is an open-access article distributed under the terms of the Creative CommonsAttribution License (CC BY). The use, distribution or reproduction in other forumsis permitted, provided the original author(s) and the copyright owner(s) are creditedand that the original publication in this journal is cited, in accordance with acceptedacademic practice. No use, distribution or reproduction is permitted which does notcomply with these terms.
Frontiers in Microbiology | www.frontiersin.org 16 September 2019 | Volume 10 | Article 2081