Embed Size (px)
Citation preview
Diel signals in stream discharge – insights into watershed behavior and potential Impacts of climate change
Robert Cook, Ph.D., P.G. Keystone College Biological and Physical Sciences One College Green La Plume, PA 18440
Pennsylvania Sea Grant final report
January 1, 2016 - December 31, 2017
Table of Contents Executive Summary ........................................................................................................................ 1
1.0 Introduction ............................................................................................................................... 2
2.0 Background ............................................................................................................................... 2
3.0 Physical setting of the study area .............................................................................................. 3
4.0 Methods..................................................................................................................................... 8
4.1 Monitoring Points ................................................................................................................. 8
4.2 Rating curves ....................................................................................................................... 14
4.3 Characterization of flora ...................................................................................................... 14
4.4 Modeling diel fluctuations in stream flow ........................................................................... 14
4.5 Climate change impact modeling ........................................................................................ 14
5.0 Results and Discussion ........................................................................................................... 15
5.1 Data Description .................................................................................................................. 15
5.2 Potential Climate Change Impacts ...................................................................................... 33
5.3 Analytical model of diel fluctuations in stream flow .......................................................... 36
5.4 Discussion ............................................................................................................................ 40
6.0 Conclusion .............................................................................................................................. 42
7.0 Future Research ...................................................................................................................... 42
8.0 Citations .................................................................................................................................. 43
9.0 Appendix A: Metrics............................................................................................................... 45
10.0 Appendix B: Impact and/or Accomplishment Statement(s) ................................................. 46
11.0 Appendix C: Rating curves ................................................................................................... 48
1
Executive Summary
• This study examined the characteristics of daily water level fluctuations produced by evapotranspiration measured in riparian areas and within a stream (Buck Hill Creek).
• The goal was to understand how diel signal characteristics Buck Hill Creek relate to watershed characteristics and predict how the diel signal characteristics might be affected by changing climate.
• Our approach: o Water levels were recorded at 5-minute intervals at eight riparian stations and five
stream locations from spring to fall of 2016 and 2017 and a vegetation assessment was completed.
o A U.S. Geological Survey model was utilized to simulate the effects of future climate change on stream discharge.
o An analytical model was used to simulate modulation of dial signals in the stream. • Our findings:
o Diel fluctuations in water levels in Buck Hill Creek are produced by the superposition of diel fluctuations in baseflow from adjacent riparian areas and hillslopes.
o Diel signals discharged from bedrock areas exhibited variable but predominantly long lag times (difference between daily temperature maximum and daily water level minimum). During high to moderate flow conditions, those areas that exhibited long lag times were out of phase with and destructively interfered with the diel fluctuation in the stream.
o Diel signals from till or alluvial deposits exhibited lag times that were shortest during wet conditions and longest during low-flow conditions.
o Diel signals in baseflow from all locations during low-flow conditions were approximately in phase and constructively interfered to produce high amplitude fluctuations in the stream.
o Simulated future climatic changes indicated decreased stream discharge from April through October. The predicted changes may be accompanied by diel fluctuations in the stream with increased amplitudes and long lag times. Concomitant shifts in vegetation are likely to occur and may also affect evapotranspiration-driven diel signals.
o Observations and modeling results indicated that variability in the timing and amplitude of diel signals from baseflow were more important than modulation of dial signals within the stream.
• The results showed that monitoring diel signals is useful for assessing changes in watersheds and may be a valuable component for watershed monitoring programs.
2
1.0 Introduction
Climate models predict summer soil moisture decreases up to 6% in Pennsylvania by mid-century (The Pennsylvania State University, 2013). The stress soil moisture change places on vegetation will in part be related to rooting depth with the greatest stress on shallow vegetation (The Pennsylvania State University, 2013). Climate change is predicted to result in declining forest health and increasing invasive species better suited to the environment. Utilization of soil moisture and shallow groundwater by plants occurs during daylight hours and ceases at night. This pattern causes diel fluctuations in the hydraulic potential in groundwater and streams. The proposed study asks the question: Can the characteristics of diel fluctuations in groundwater levels and stream discharge be used for assessing ecosystem vulnerability to changing soil moisture and plant communities in response to climate change? The research question is directly related to the focus area of understanding ecosystem resilience and responses to climate change noted in the request for proposal. The goal of this project was to understand how diel signal characteristics in the headwaters of Buck Hill Creek relate to watershed characteristics and predict how the diel signal characteristics might be affected by changing climate.
2.0 Background
Natural diel variations in groundwater levels and stream discharge have been described from many settings (Dunford and Fletcher, 1947; Burt, 1979; Bren, 1997; Lundquist and Cayan, 2002; Wondzell and others, 2010; Graham and others, 2012). In most cases they are attributable to solar radiation driven changes in soil moisture and consequently changes in groundwater recharge or runoff. Evapotranspiration occurs primarily in the spring and summer months and produces a daytime drawdown in stored water. Its onset marks the beginning of spring from a hydrologic perspective. Melting of snow and ice, which occurs sporadically throughout fall, winter, and spring in the temperate climate of the study area, introduces water to storage or produces runoff. Evapotranspiration is of particular interest because it represents a linkage between the biosphere and hydrosphere. The shape of the diel signal produced by evapotranspiration typically exhibits a steep drawdown and a gradual recovery (Lundquist and Cayan, 2002). The initial perturbation of the groundwater level is modulated by soil moisture content (Moore and others, 2011) but is generally the inverse of the daily evapotranspiration which takes the form of a sharp-peaked sine curve (Czikowsky and Fitzjarrald, 2004; Wondzell and others, 2007). Recovery of groundwater levels after drawdown is controlled by the lateral inflow rate of groundwater and the short-term specific yield (Gribovszki and others, 2010). Understanding how the evapotranspiration signal is modified as it is transmitted through the groundwater and surfacewater system has the potential to elucidate watershed characteristics such as the depths, lengths, and velocities of flow paths (Bond, 2002; Loheide and others, 2005; Wondzell and others, 2007 and 2010; Barnard and others, 2010; Graham and others, 2012; Fonley and others, 2015). A diel signal in a stream is synoptic of watershed characteristics (geology, plant community, soils, topography, stream morphology, soil moisture, etc.). While geology, soils, topography, and stream morphology are
3
generally temporally stable, plant communities and soil moisture on the other hand are dynamic and vulnerable to climate change (as well as invasive species introduction and land use change).
3.0 Physical setting of the study area
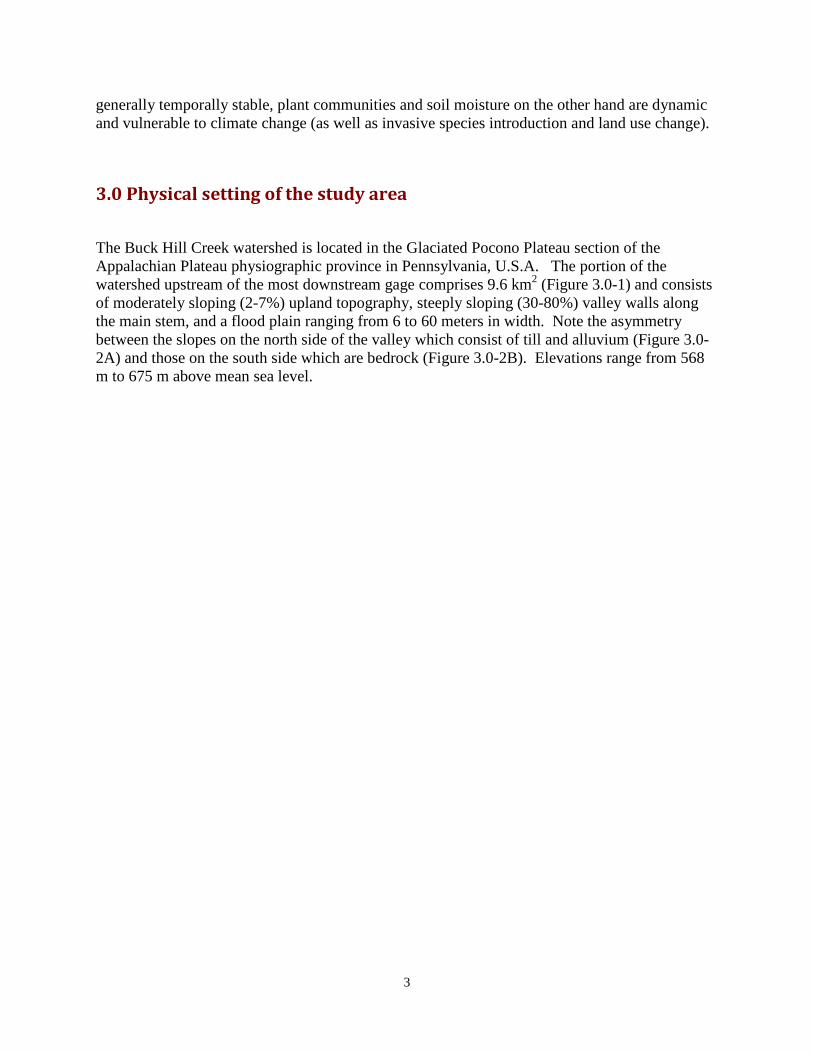
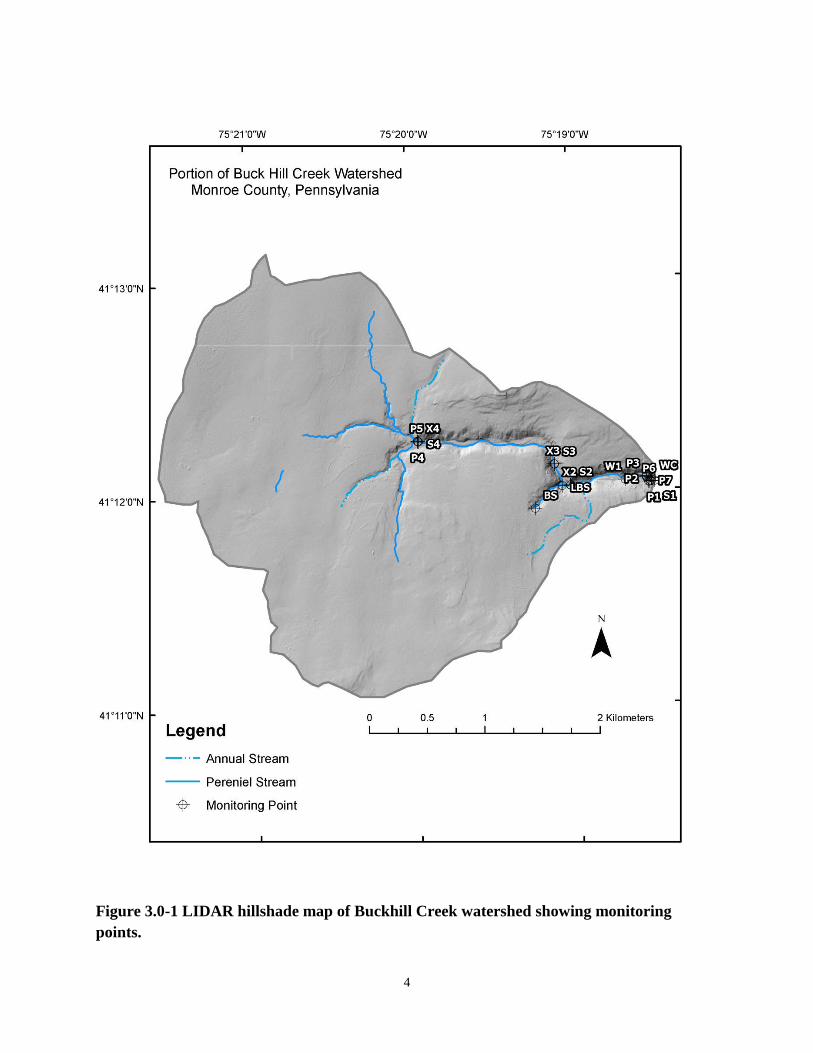
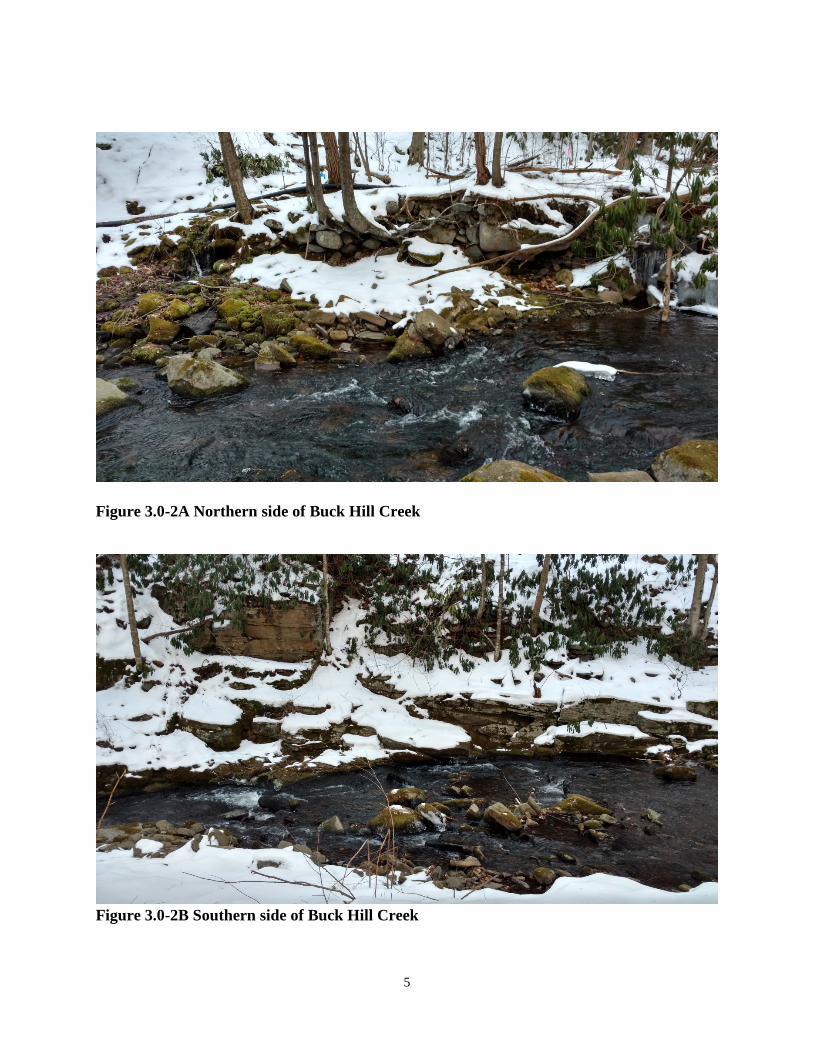
The Buck Hill Creek watershed is located in the Glaciated Pocono Plateau section of the Appalachian Plateau physiographic province in Pennsylvania, U.S.A. The portion of the watershed upstream of the most downstream gage comprises 9.6 km2 (Figure 3.0-1) and consists of moderately sloping (2-7%) upland topography, steeply sloping (30-80%) valley walls along the main stem, and a flood plain ranging from 6 to 60 meters in width. Note the asymmetry between the slopes on the north side of the valley which consist of till and alluvium (Figure 3.0-2A) and those on the south side which are bedrock (Figure 3.0-2B). Elevations range from 568 m to 675 m above mean sea level.
4
Figure 3.0-1 LIDAR hillshade map of Buckhill Creek watershed showing monitoring points.
5
Figure 3.0-2A Northern side of Buck Hill Creek
Figure 3.0-2B Southern side of Buck Hill Creek
6
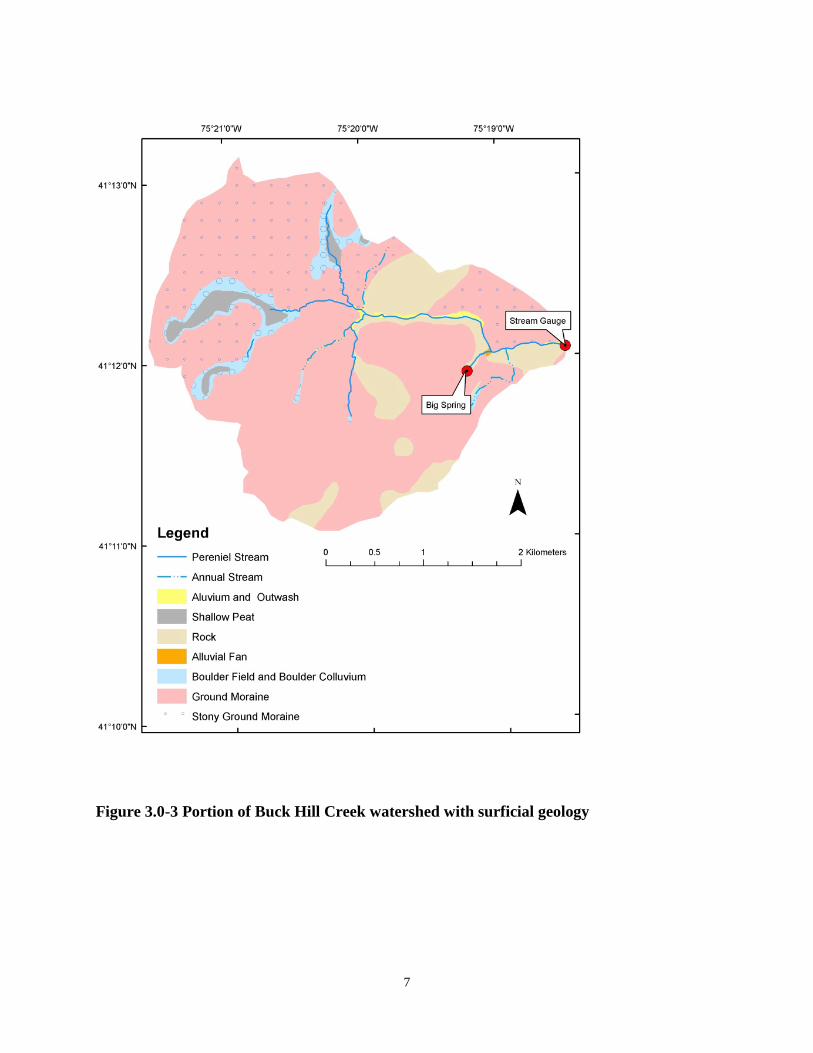
Mixed hardwood forest and mountain laurel cover 90% of the watershed. Hemlock stands are found in wetland areas comprising most of the remaining 10% and sparse residential development and few uncultivated fields are found in the western margins of the watershed. Soils are primarily coarse-loamy, mixed, active, mesic Typic Fragiudepts with saturated hydraulic conductivities of 3.8-5.5 x 10⁻⁶ m/s and water table depths of 60-69 cm (Soil Survey Staff, 2014). Parent material was coarse till derived from sandstone. Mapping by Sevon (1975) showed that most of the watershed is covered with stony to very stony ground moraine till (Figure 3.0-3). Boulder fields, boulder colluvium, and peat deposits are found in the headwater areas of tributary streams. Alluvial deposits ranging in width from approximately 6 m to 60 m are found along the axes of the narrow, steep-sided stream valleys. Portions of the watershed are devoid of or thinly covered with till. Post-glacial stream incision along the main stem of Buck Hill Creek appears to follow pre-glacial bedrock drainage and the western segment of the channel is bounded on both sides by bedrock valley walls. Along the eastern segment of the stream channel, the southern side of the channel lies against the bedrock valley wall while the northern wall of the valley is incised into till. Bedrock consists of fluvial deposits of conglomerate and sandstone with subordinate siltstones and shales occurring in fining-upward sequences which are part of the Upper Devonian Catskill Formation (Sevon, 1975). Bedrock structure (Sevon, 1975) consists of upright open folds with wavelengths of several hundred feet and axes that trend approximately east-northeast. A conjugate set of near-vertical bed-normal joints strike north and east-northeast. A weakly developed rock cleavage parallels fold axes.
7
Figure 3.0-3 Portion of Buck Hill Creek watershed with surficial geology

8
4.0 Methods
4.1 Monitoring Points
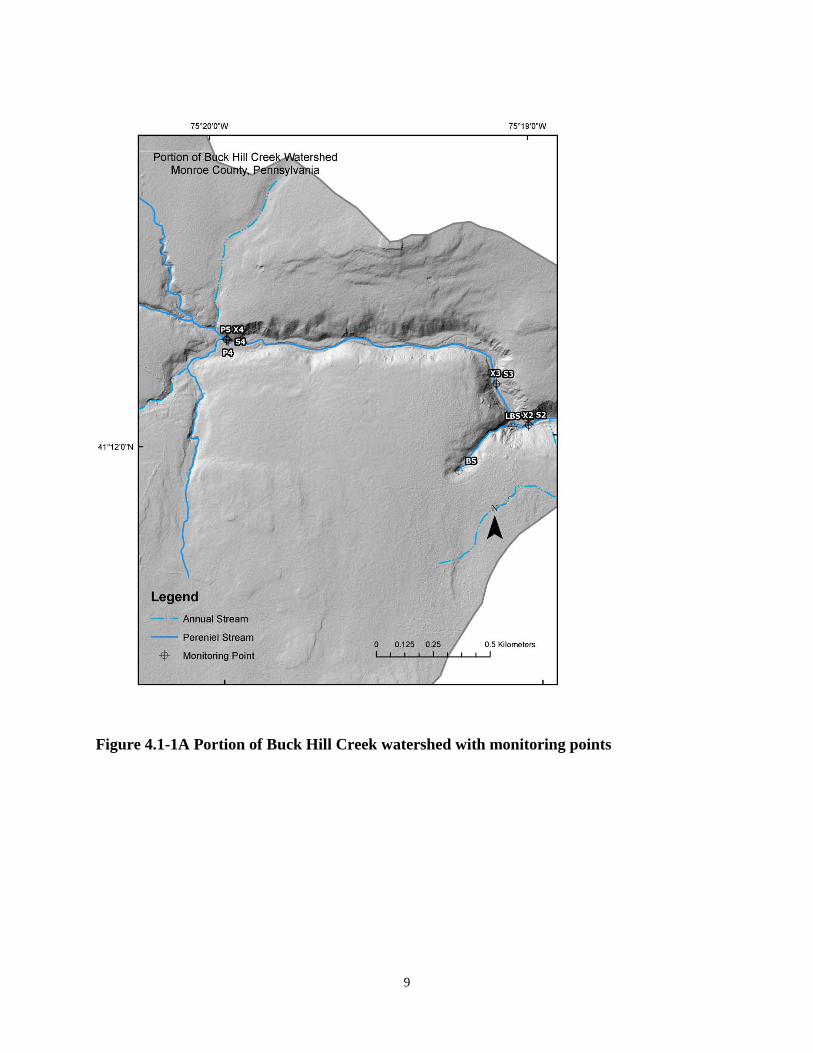
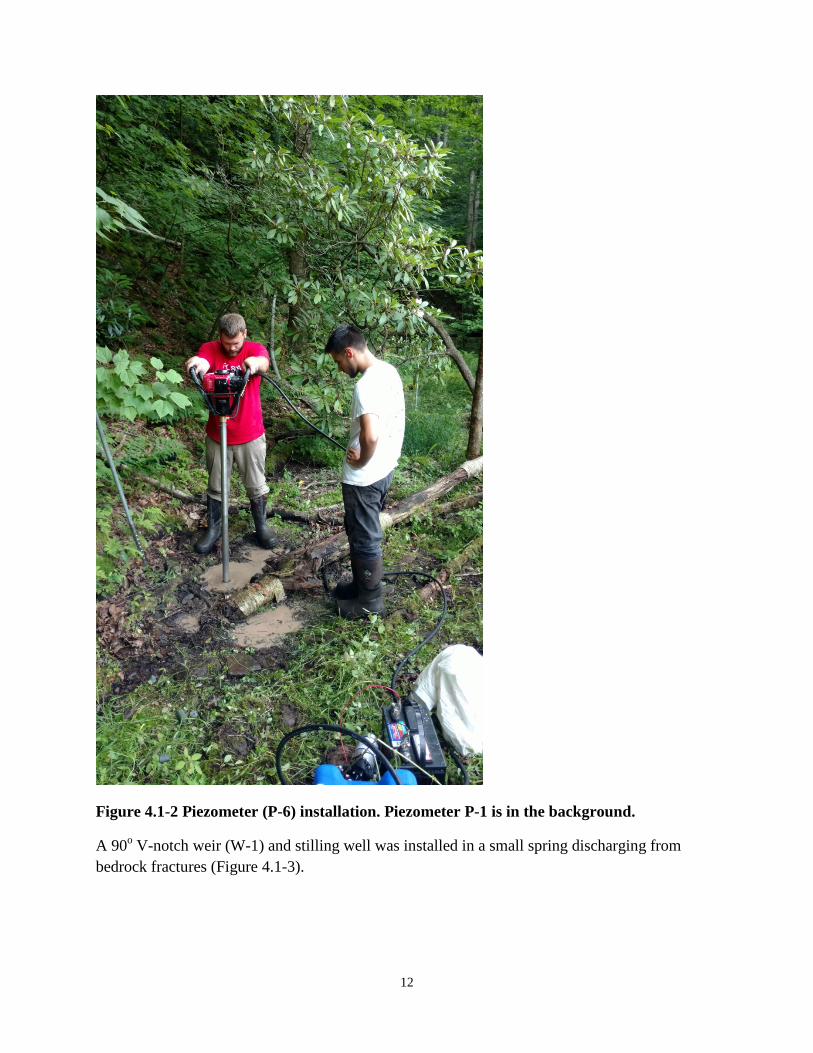
Seven shallow piezometers (P1-P7) were installed at three riparian zone locations (Figure 4.1-1A-C). The piezometers were constructed of 3/4-inch diameter galvanized pipe with Solinst® 1-ft piezometer points. A 25-mm gas-powered core drill was used to make a borehole (Figure 4.1-2) and the piezometer was inserted in the borehole. Sand was placed in the annular space around the piezometer point and the annular space at the surface was filled with bentonite. Slug tests were used to estimate the hydraulic conductivity at each piezometer. Piezometer elevations and the elevation of the adjacent stream were measured at two locations using a laser level. The elevations were referenced to an arbitrary datum at each location.
9
Figure 4.1-1A Portion of Buck Hill Creek watershed with monitoring points

10
Figure 4.1-1B Portion of Buck Hill Creek watershed with monitoring points
11
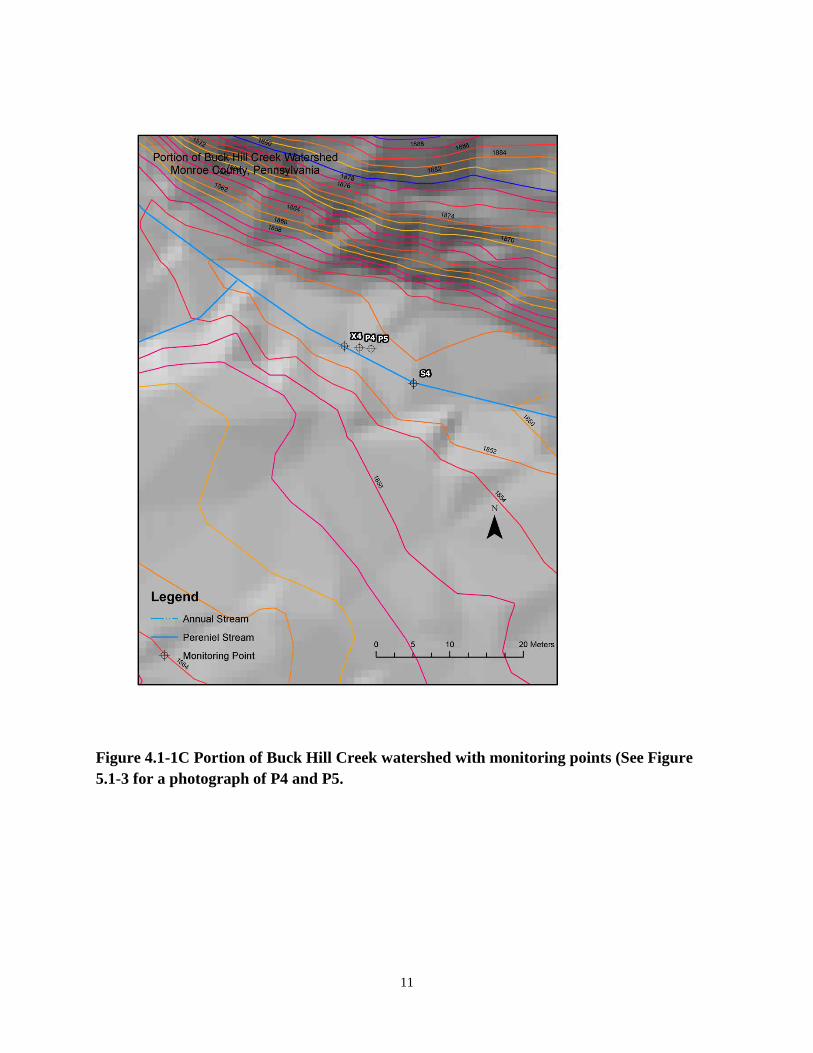
Figure 4.1-1C Portion of Buck Hill Creek watershed with monitoring points (See Figure 5.1-3 for a photograph of P4 and P5.
12
Figure 4.1-2 Piezometer (P-6) installation. Piezometer P-1 is in the background.
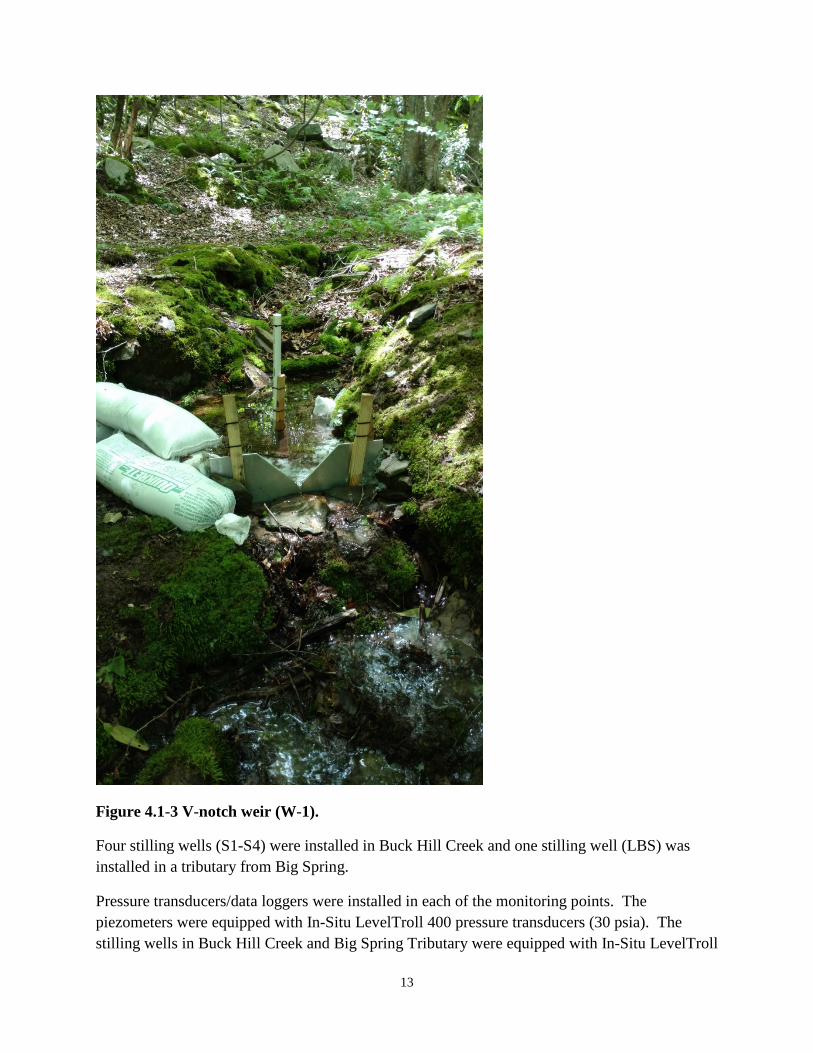
A 90o V-notch weir (W-1) and stilling well was installed in a small spring discharging from bedrock fractures (Figure 4.1-3).
13
Figure 4.1-3 V-notch weir (W-1).
Four stilling wells (S1-S4) were installed in Buck Hill Creek and one stilling well (LBS) was installed in a tributary from Big Spring.
Pressure transducers/data loggers were installed in each of the monitoring points. The piezometers were equipped with In-Situ LevelTroll 400 pressure transducers (30 psia). The stilling wells in Buck Hill Creek and Big Spring Tributary were equipped with In-Situ LevelTroll
14
700 pressure transducers (30 psia). The stilling well behind the weir was equipped with a Solinst Levelogger Model 3001 (10 m). Pressure transducer data were corrected for atmospheric pressure using barometric data from an In-Situ BaroTroll data logger. The barometer was placed in a pipe with an end cap and the pipe was inserted below the water table to buffer temperature fluctuations. A Solinst Barologger was hung from a nearby tree to record air temperature. All data loggers were synchronized and recorded data at 5-minute intervals.
4.2 Rating curves
Stream discharge was periodically measured at each stilling well location and stage-discharge and stage-velocity relations were developed. Linear regression of the weir stilling well data with periodic weir plate reading was used along with the weir equation to estimate spring discharge. Rating curves are attached as Appendix C.
4.3 Characterization of flora
A vegetation assessment and survey was conducted at monitoring locations P4/P5, P2/P3, W1, and LBS.
4.4 Modeling diel fluctuations in stream flow
Fonley and others (2015) developed a numerical model to explain roughly diurnal oscillations in discharge during low flow conditions in river networks. They modeled the oscillatory signal as a downstream attenuation and interference of oscillatory signals induced by evapotranspiration along the flow network. In their model, the effects of heterogeneity of baseflow velocities in the drainage area were ignored so that any differences in lag and amplitude of oscillations along a river network could be traced to different streamflow velocities within the network. We used this model as a starting point in an attempt to explain observed lags between evapotranspiration signals and streamflow signals in Buck Hill Creek. We attempted to match streamflow and piezometer data collected primarily from the low flow portions of 2016 in the Buck Hill Creek watershed. Data in the modeling came from monitoring points P-5, S-4, S-3, S-2, and S-1 (Figure 3.0-1). These data were analyzed using Matlab scripts in which we adapted the linear transport equation of Fonley and others (2015) as well as their equation describing baseflow to determine if the observed lags in Buck Hill Creek could be explained by downstream attenuation.
4.5 Climate change impact modeling
15
The U.S. Geological Survey’s water resources decision support tool for the Delaware River Basin (Williamson and others, 2015) and watershed specific information was used to estimate potential future changes in stream discharge. This tool incorporates a widely used runoff model with predicted future changes in temperature, precipitation, and evapotranspiration. Predicted changes in these parameters for the years 2030, 2060, and 2088 come from four general circulation models (GCMs) and two standard scenarios for future radiative forcing. The standard scenarios are referred to as representative concentration pathways (RCPs). The RCPs are based on different combinations of economic, technological, demographic, and biophysical assumptions. The RCP 4.5 scenario assumes climate stabilization by 2100 with an approximate atmospheric CO2-equivalent concentration of ~650 parts per million (ppm). The RCP 8.5 scenario assumes a continued rise in radiative forcing beyond 2100. The approximate atmospheric CO2-equivalent concentration at 2100 is 1370 ppm. These scenarios bracket two plausible futures.
5.0 Results and Discussion
5.1 Data Description
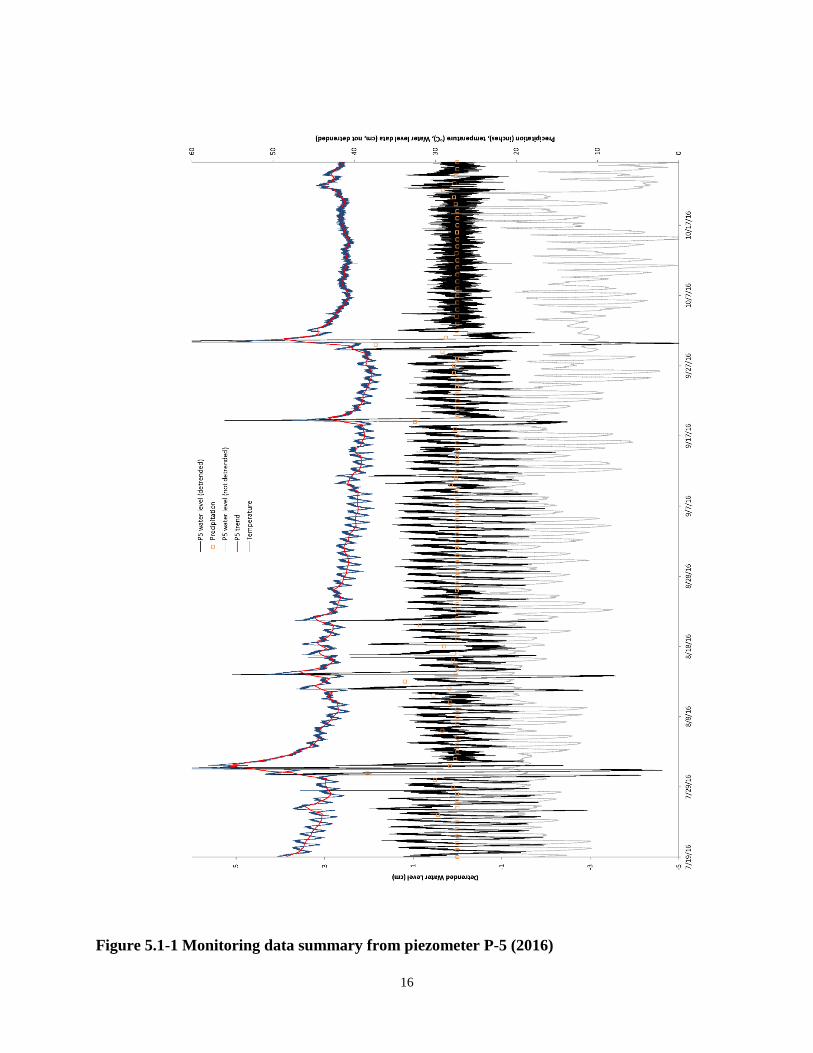
Figure 5.1-1 shows a plot of monitoring data from piezometer P-5 collected in 2016. The blue line is water elevation data that has been smoothed using a moving average method. The red line is a trend line calculated using seasonal decomposition with a period of 24 hours. The black line is the detrended water level data. The orange boxes show daily rainfall and the gray line is air temperature. Water level data from all monitoring points were detrended.
16
Figure 5.1-1 Monitoring data summary from piezometer P-5 (2016)
17
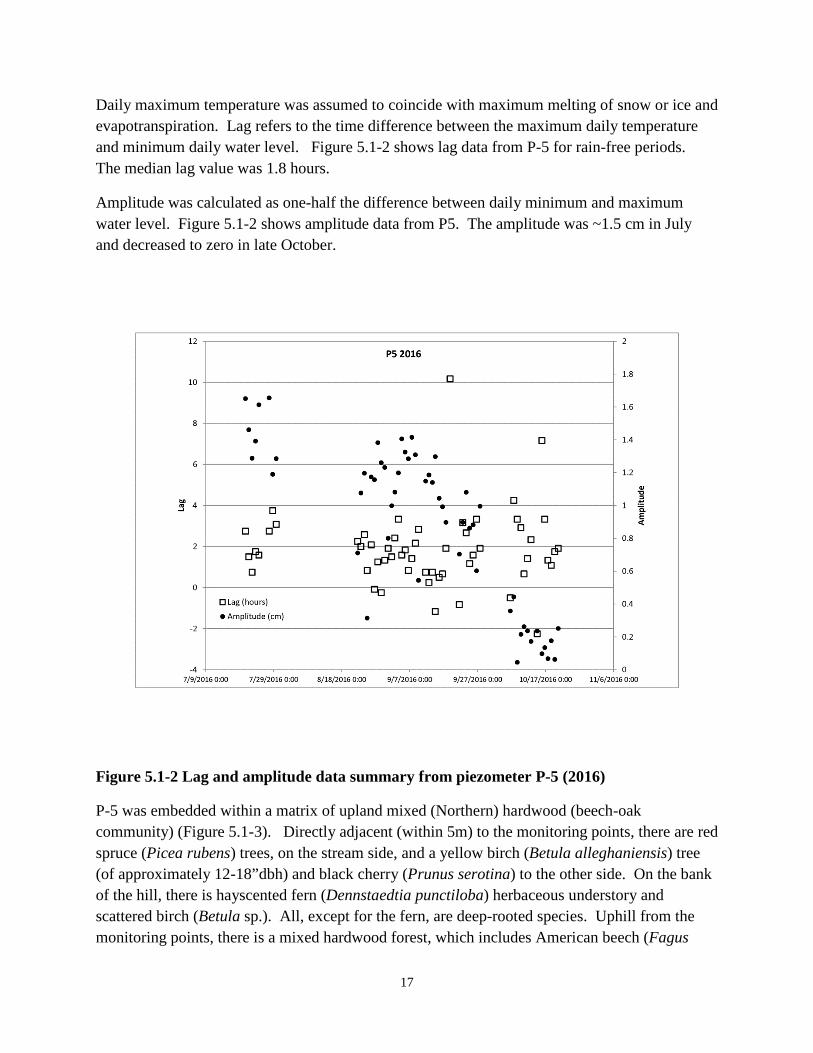
Daily maximum temperature was assumed to coincide with maximum melting of snow or ice and evapotranspiration. Lag refers to the time difference between the maximum daily temperature and minimum daily water level. Figure 5.1-2 shows lag data from P-5 for rain-free periods. The median lag value was 1.8 hours.
Amplitude was calculated as one-half the difference between daily minimum and maximum water level. Figure 5.1-2 shows amplitude data from P5. The amplitude was ~1.5 cm in July and decreased to zero in late October.
Figure 5.1-2 Lag and amplitude data summary from piezometer P-5 (2016)
P-5 was embedded within a matrix of upland mixed (Northern) hardwood (beech-oak community) (Figure 5.1-3). Directly adjacent (within 5m) to the monitoring points, there are red spruce (Picea rubens) trees, on the stream side, and a yellow birch (Betula alleghaniensis) tree (of approximately 12-18”dbh) and black cherry (Prunus serotina) to the other side. On the bank of the hill, there is hayscented fern (Dennstaedtia punctiloba) herbaceous understory and scattered birch (Betula sp.). All, except for the fern, are deep-rooted species. Uphill from the monitoring points, there is a mixed hardwood forest, which includes American beech (Fagus

18
grandifolia), yellow birch (Betula alleghaniensis), red maple (Acer rubrum), and striped maple (Acer pennsylvanicum). These are all deep-rooted species. In the riparian zone streambed floodplain, there is a shallow-rooted community of grasses and forbs, including orange jewelweed (Impatiens capensis), smartweed (Polygonum sp.), and sedges (Carex spp. - including Carex cf. crinita). On the opposite (west) side of the stream, there is an extensive stand of hemlock (Tsuga canadensis) dominant, which includes Rhododendron maximum and, downstream from the monitoring site, also includes individuals of red spruce (Picea rubens). Red maple (Acer rubrum) and yellow birch (Betula alleghaniensis) are at the streambank on that side as well.
19
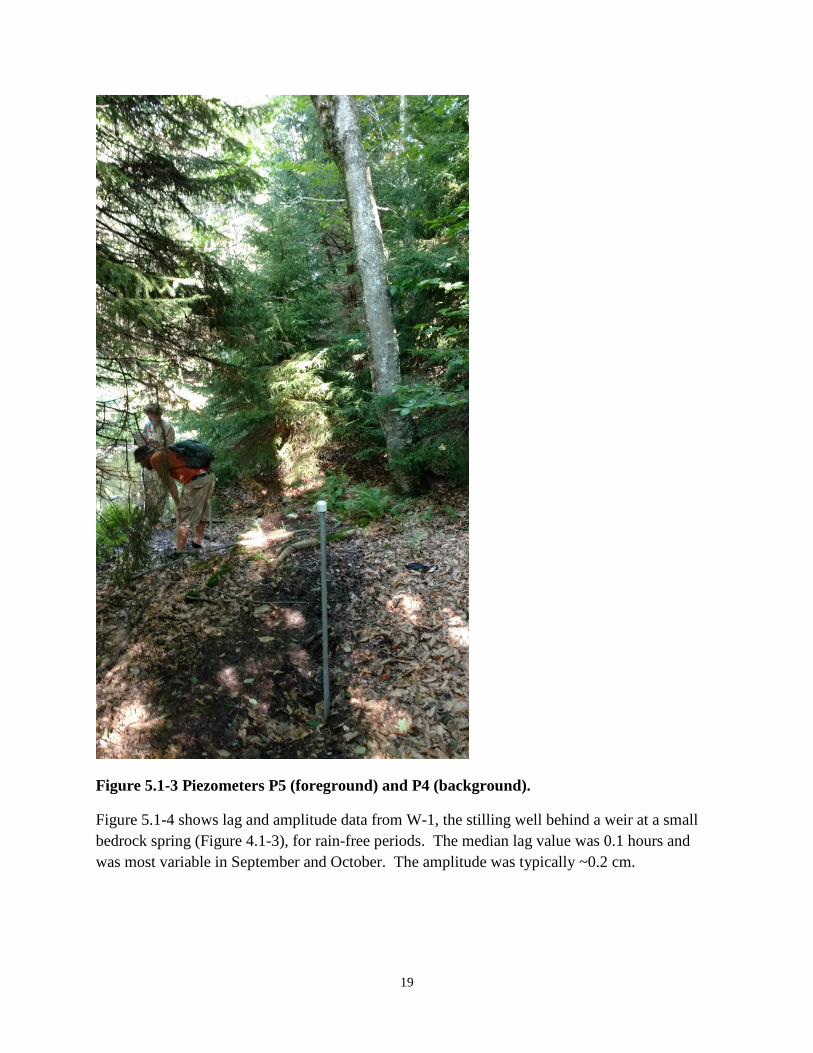
Figure 5.1-3 Piezometers P5 (foreground) and P4 (background).
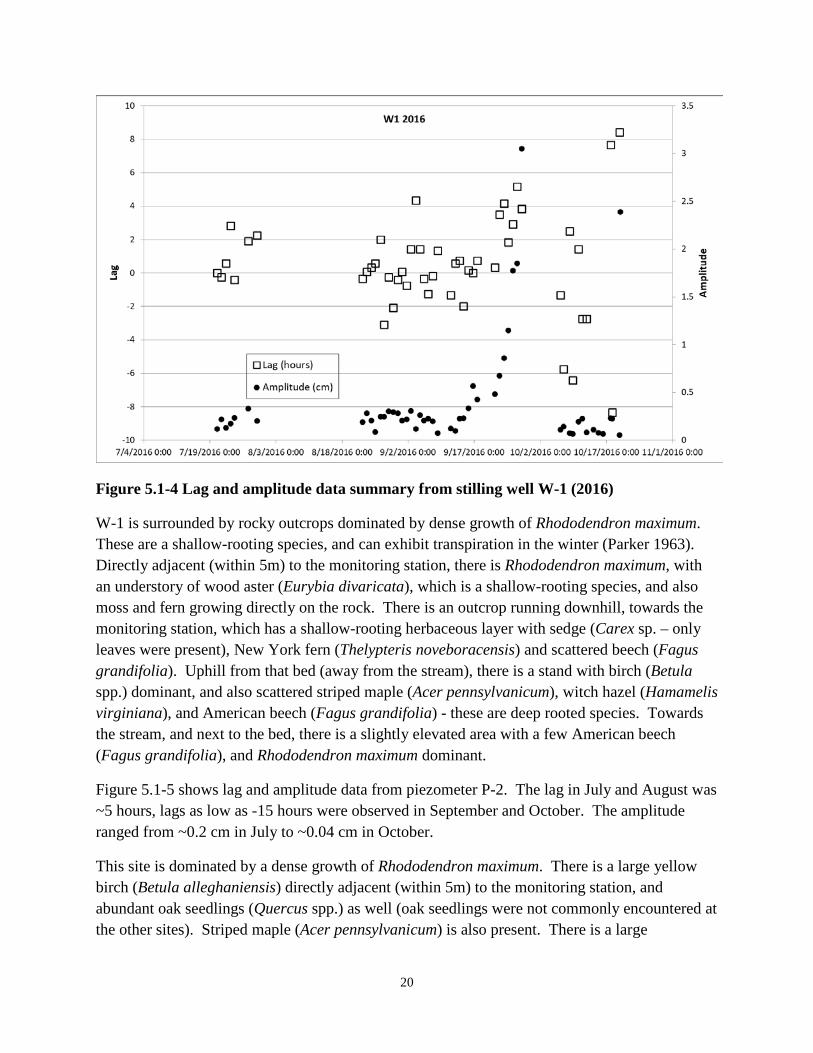
Figure 5.1-4 shows lag and amplitude data from W-1, the stilling well behind a weir at a small bedrock spring (Figure 4.1-3), for rain-free periods. The median lag value was 0.1 hours and was most variable in September and October. The amplitude was typically ~0.2 cm.
20
Figure 5.1-4 Lag and amplitude data summary from stilling well W-1 (2016)
W-1 is surrounded by rocky outcrops dominated by dense growth of Rhododendron maximum. These are a shallow-rooting species, and can exhibit transpiration in the winter (Parker 1963). Directly adjacent (within 5m) to the monitoring station, there is Rhododendron maximum, with an understory of wood aster (Eurybia divaricata), which is a shallow-rooting species, and also moss and fern growing directly on the rock. There is an outcrop running downhill, towards the monitoring station, which has a shallow-rooting herbaceous layer with sedge (Carex sp. – only leaves were present), New York fern (Thelypteris noveboracensis) and scattered beech (Fagus grandifolia). Uphill from that bed (away from the stream), there is a stand with birch (Betula spp.) dominant, and also scattered striped maple (Acer pennsylvanicum), witch hazel (Hamamelis virginiana), and American beech (Fagus grandifolia) - these are deep rooted species. Towards the stream, and next to the bed, there is a slightly elevated area with a few American beech (Fagus grandifolia), and Rhododendron maximum dominant.
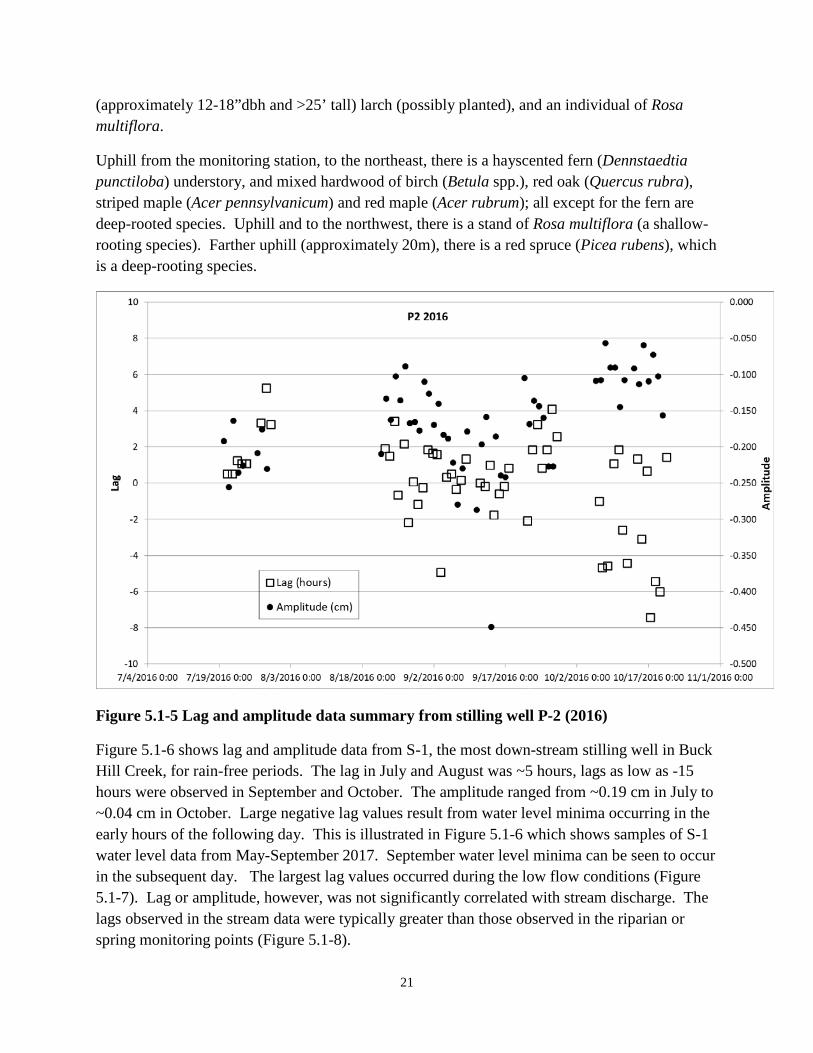
Figure 5.1-5 shows lag and amplitude data from piezometer P-2. The lag in July and August was ~5 hours, lags as low as -15 hours were observed in September and October. The amplitude ranged from ~0.2 cm in July to ~0.04 cm in October.
This site is dominated by a dense growth of Rhododendron maximum. There is a large yellow birch (Betula alleghaniensis) directly adjacent (within 5m) to the monitoring station, and abundant oak seedlings (Quercus spp.) as well (oak seedlings were not commonly encountered at the other sites). Striped maple (Acer pennsylvanicum) is also present. There is a large
21
(approximately 12-18”dbh and >25’ tall) larch (possibly planted), and an individual of Rosa multiflora.
Uphill from the monitoring station, to the northeast, there is a hayscented fern (Dennstaedtia punctiloba) understory, and mixed hardwood of birch (Betula spp.), red oak (Quercus rubra), striped maple (Acer pennsylvanicum) and red maple (Acer rubrum); all except for the fern are deep-rooted species. Uphill and to the northwest, there is a stand of Rosa multiflora (a shallow-rooting species). Farther uphill (approximately 20m), there is a red spruce (Picea rubens), which is a deep-rooting species.
Figure 5.1-5 Lag and amplitude data summary from stilling well P-2 (2016)
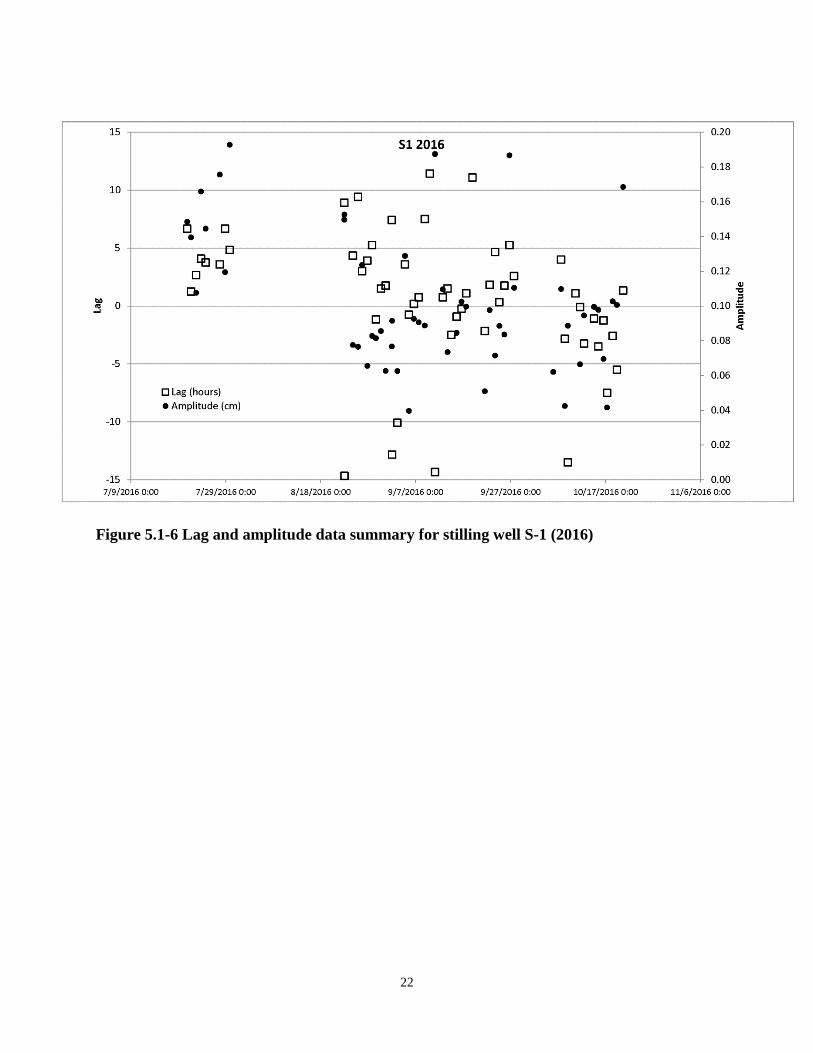
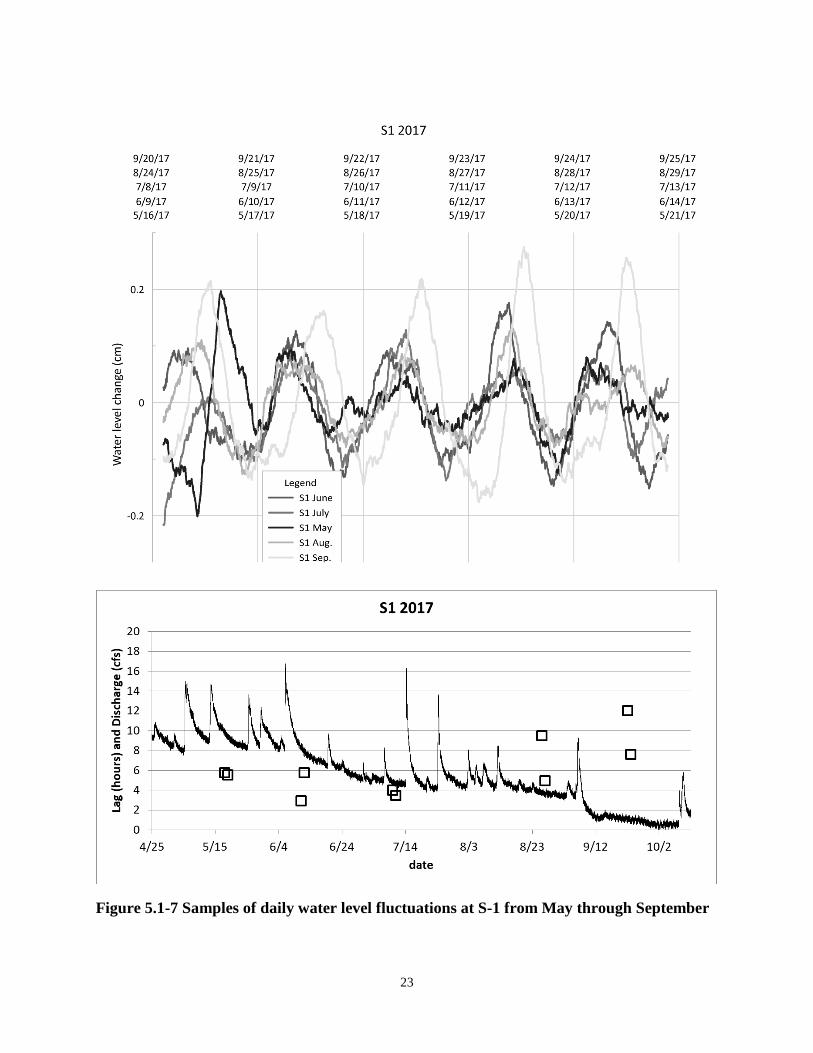
Figure 5.1-6 shows lag and amplitude data from S-1, the most down-stream stilling well in Buck Hill Creek, for rain-free periods. The lag in July and August was ~5 hours, lags as low as -15 hours were observed in September and October. The amplitude ranged from ~0.19 cm in July to ~0.04 cm in October. Large negative lag values result from water level minima occurring in the early hours of the following day. This is illustrated in Figure 5.1-6 which shows samples of S-1 water level data from May-September 2017. September water level minima can be seen to occur in the subsequent day. The largest lag values occurred during the low flow conditions (Figure 5.1-7). Lag or amplitude, however, was not significantly correlated with stream discharge. The lags observed in the stream data were typically greater than those observed in the riparian or spring monitoring points (Figure 5.1-8).
22
Figure 5.1-6 Lag and amplitude data summary for stilling well S-1 (2016)
23
Figure 5.1-7 Samples of daily water level fluctuations at S-1 from May through September
24
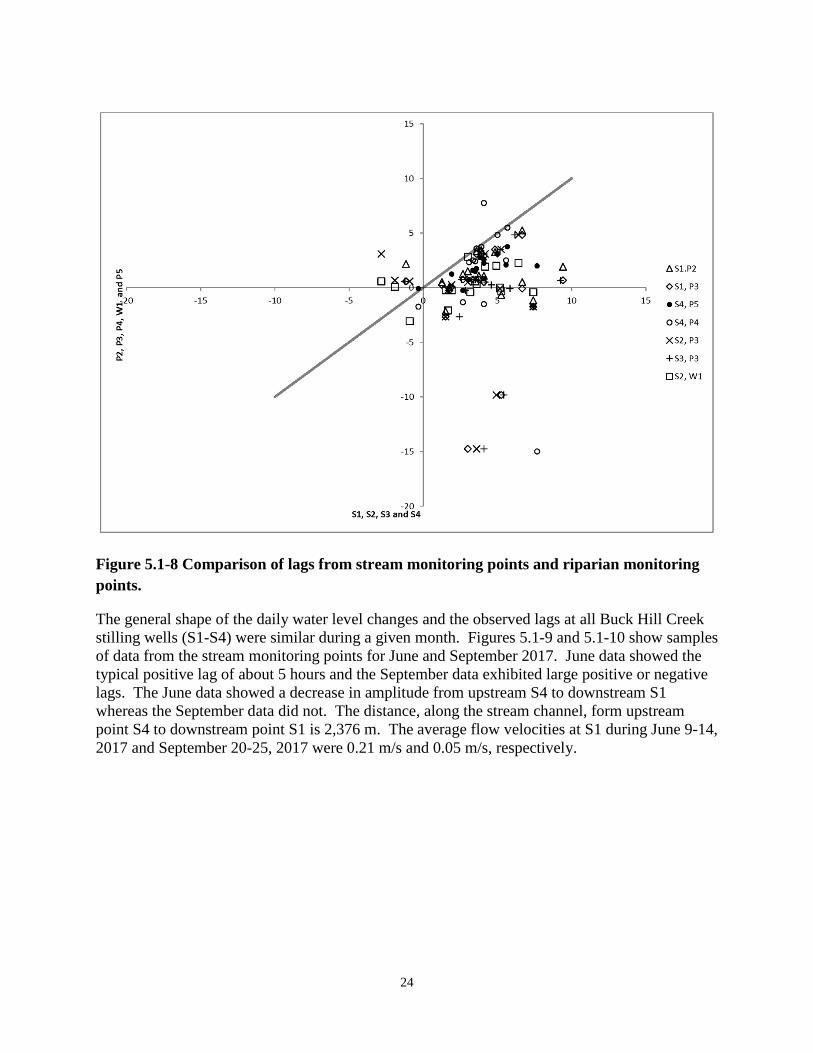
Figure 5.1-8 Comparison of lags from stream monitoring points and riparian monitoring points.
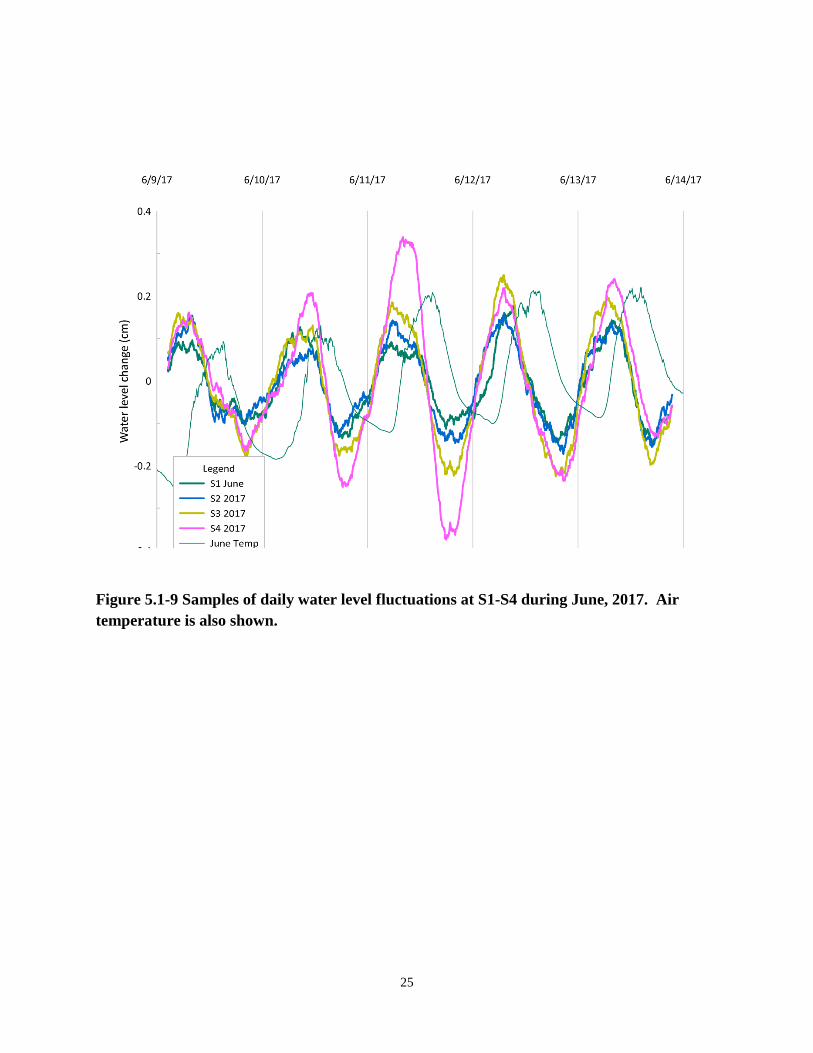
The general shape of the daily water level changes and the observed lags at all Buck Hill Creek stilling wells (S1-S4) were similar during a given month. Figures 5.1-9 and 5.1-10 show samples of data from the stream monitoring points for June and September 2017. June data showed the typical positive lag of about 5 hours and the September data exhibited large positive or negative lags. The June data showed a decrease in amplitude from upstream S4 to downstream S1 whereas the September data did not. The distance, along the stream channel, form upstream point S4 to downstream point S1 is 2,376 m. The average flow velocities at S1 during June 9-14, 2017 and September 20-25, 2017 were 0.21 m/s and 0.05 m/s, respectively.
25
Figure 5.1-9 Samples of daily water level fluctuations at S1-S4 during June, 2017. Air temperature is also shown.

26
Figure 5.1-10 Samples of daily water level fluctuations at S1-S4 during September, 2017. Air temperature is also shown.
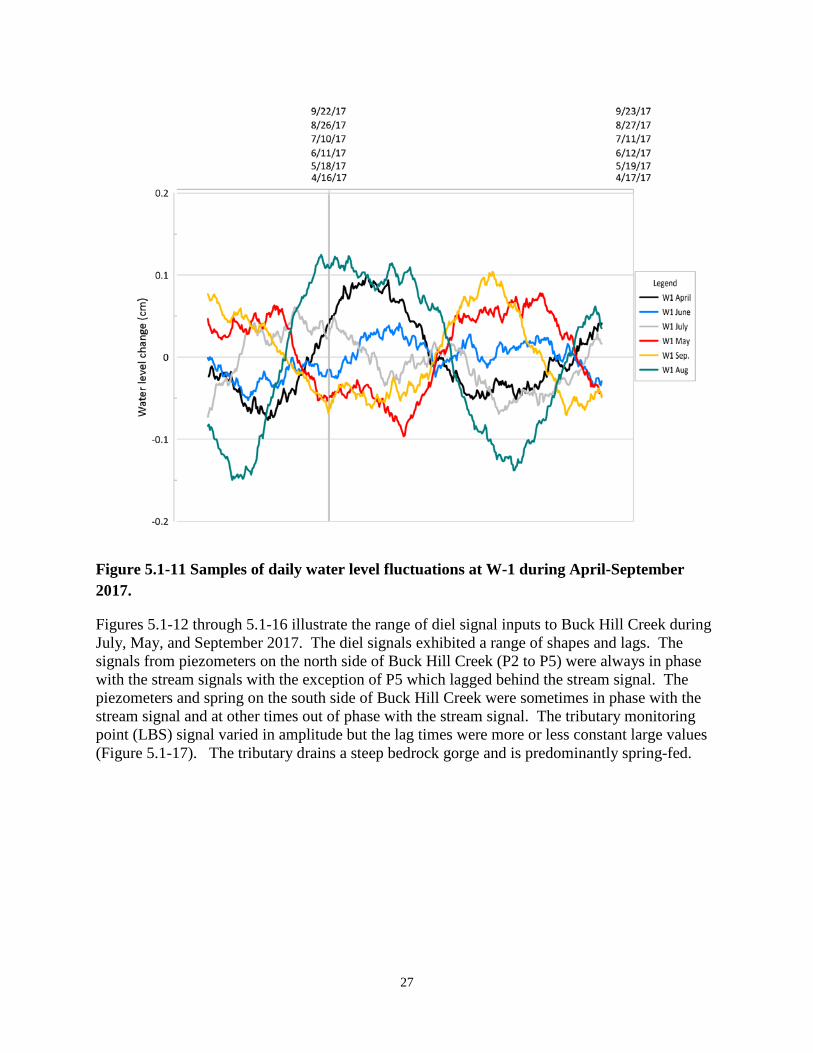
Figure 5.1-11 illustrates the variability in the diel signal at W-1 from April through September 2017. April, July, and August signals exhibited short lags. May and September signals exhibited long lag times. The lags were not correlated with spring discharge.
27
Figure 5.1-11 Samples of daily water level fluctuations at W-1 during April-September 2017.
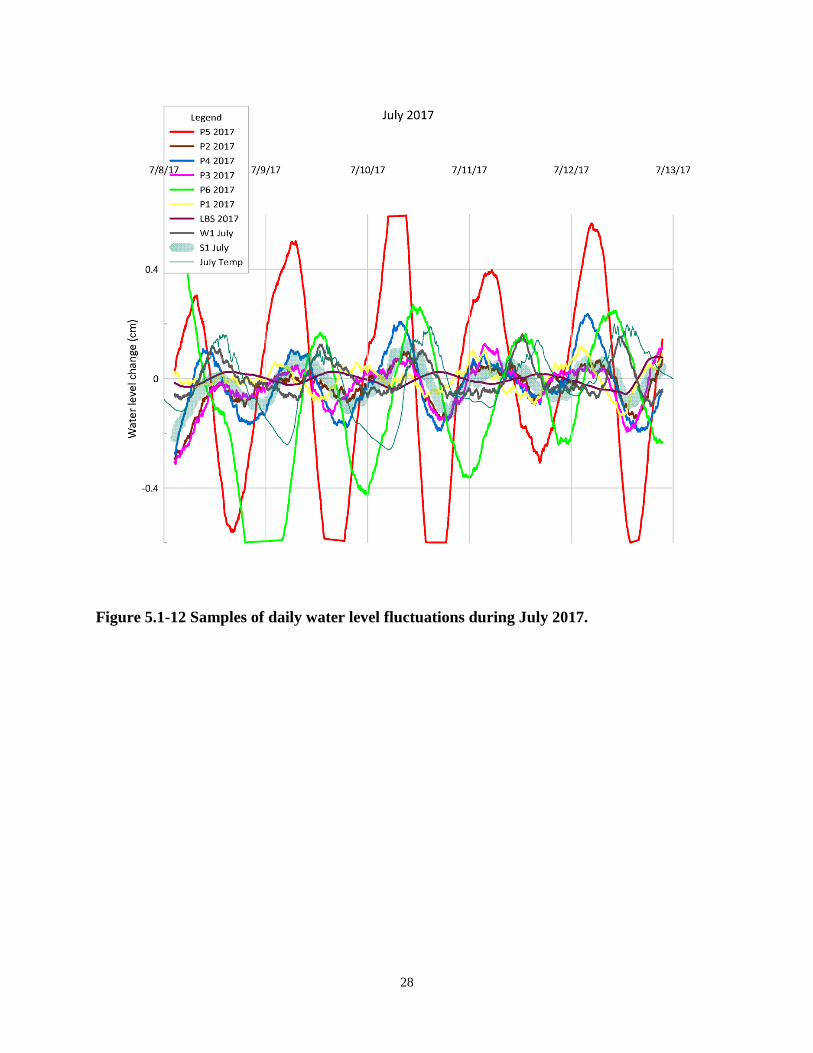
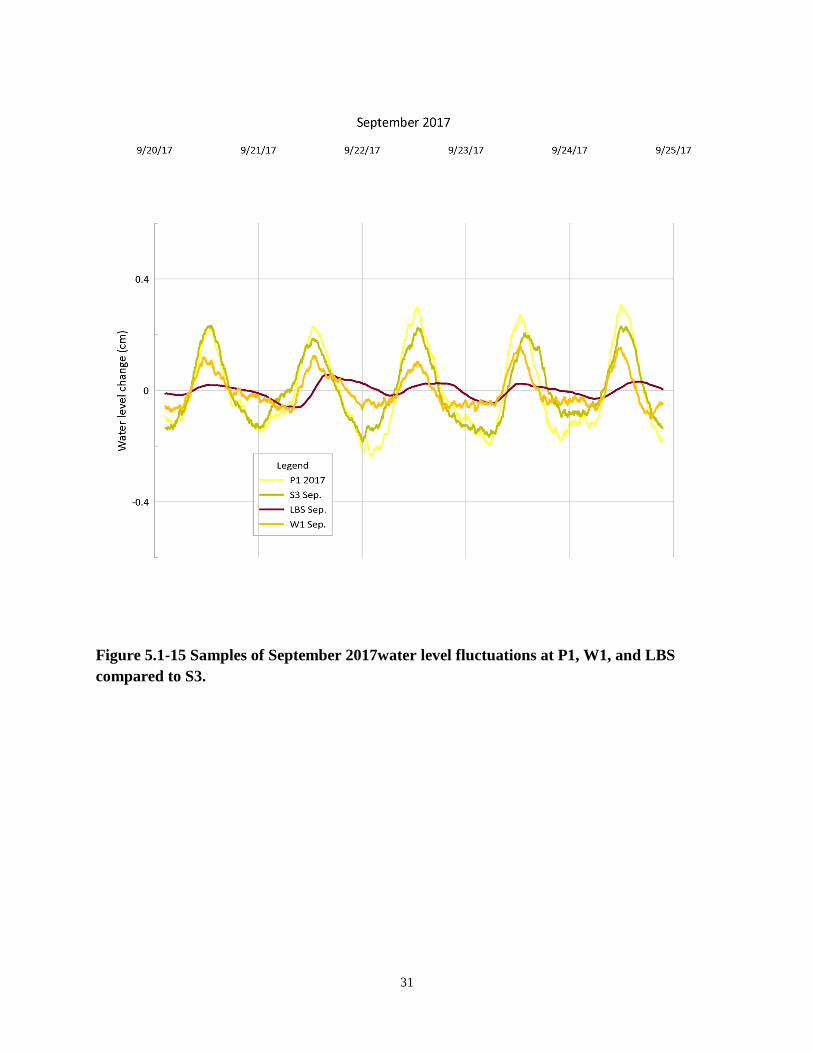
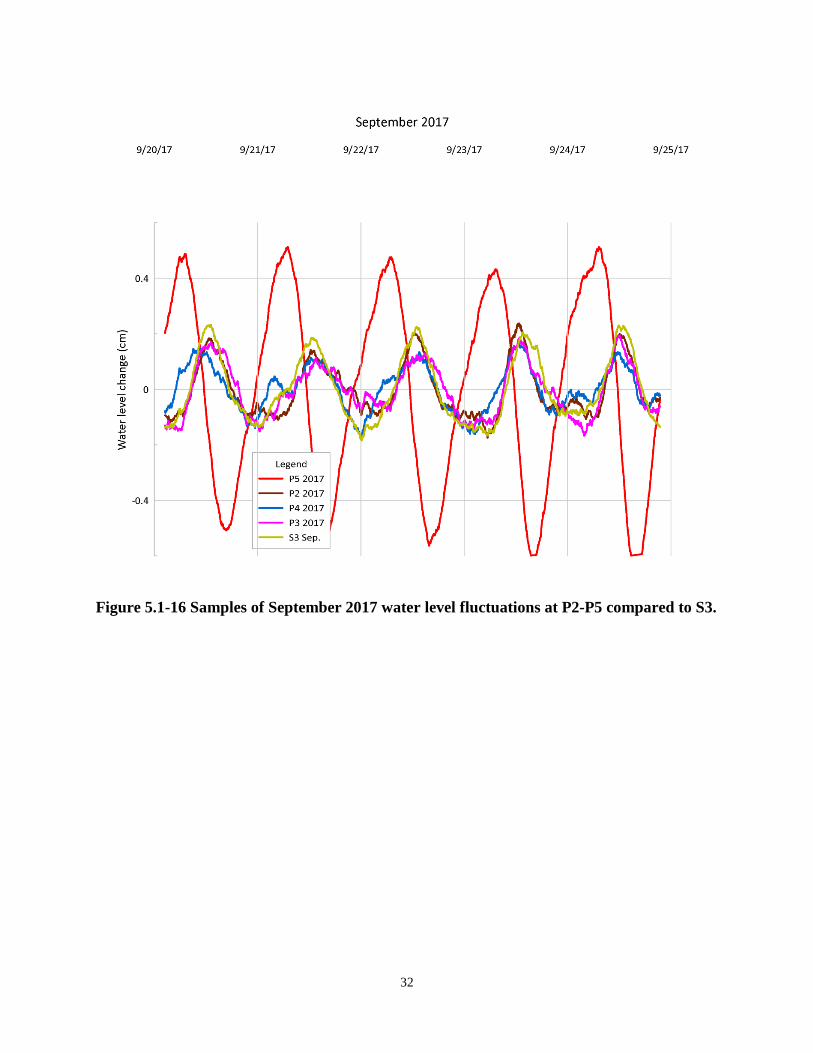
Figures 5.1-12 through 5.1-16 illustrate the range of diel signal inputs to Buck Hill Creek during July, May, and September 2017. The diel signals exhibited a range of shapes and lags. The signals from piezometers on the north side of Buck Hill Creek (P2 to P5) were always in phase with the stream signals with the exception of P5 which lagged behind the stream signal. The piezometers and spring on the south side of Buck Hill Creek were sometimes in phase with the stream signal and at other times out of phase with the stream signal. The tributary monitoring point (LBS) signal varied in amplitude but the lag times were more or less constant large values (Figure 5.1-17). The tributary drains a steep bedrock gorge and is predominantly spring-fed.
28
Figure 5.1-12 Samples of daily water level fluctuations during July 2017.
29
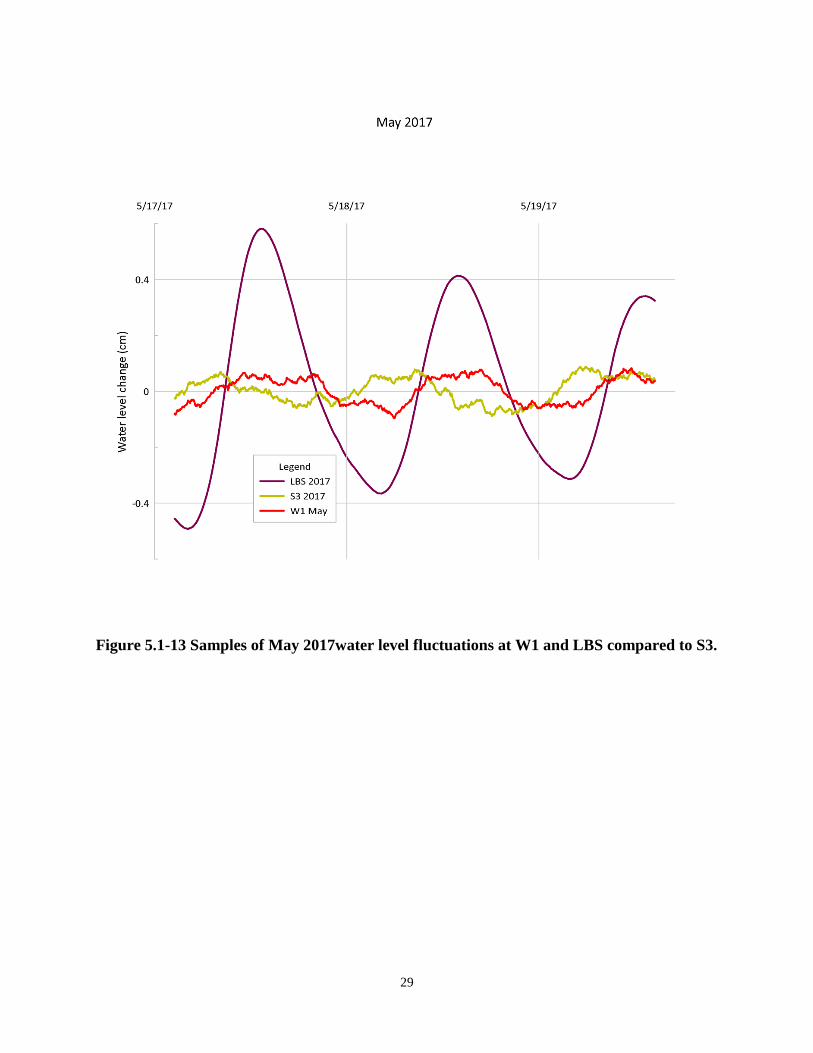
Figure 5.1-13 Samples of May 2017water level fluctuations at W1 and LBS compared to S3.
30
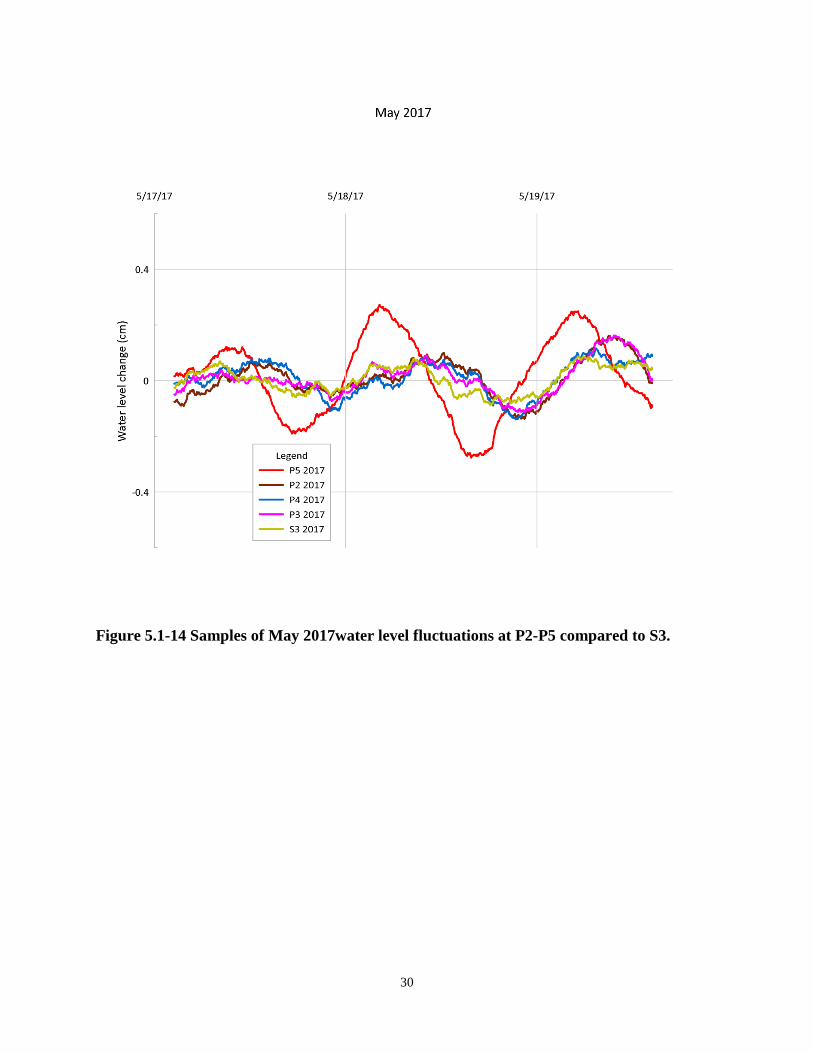
Figure 5.1-14 Samples of May 2017water level fluctuations at P2-P5 compared to S3.
31
Figure 5.1-15 Samples of September 2017water level fluctuations at P1, W1, and LBS compared to S3.
32
Figure 5.1-16 Samples of September 2017 water level fluctuations at P2-P5 compared to S3.

33
Figure 5.1-17 Samples of daily water level fluctuations at LBS during May-September 2017.
5.2 Potential Climate Change Impacts
The calculated average monthly discharges for Buck Hill Creek at monitoring point S-1 based on 24 model runs (parameter changes from 4 GCMs x 3 time periods (2030, 2060, and 2088) x 2 RCPs) are shown in Figure 5.2-1. The discharge data (in cfs) are plotted as the change in discharge relative to the 1982-2011 average. Figure 5.2-1 illustrates the range of predictions among models, scenarios, and times. Spring discharges will likely be affected proportionately.

34
Figure 5.2-1 – Predicted average monthly discharges for Buck Hill Creek based on temperature, precipitation, and evapotranspiration changes from four general circulation models for 2030, 2060, and 2088.
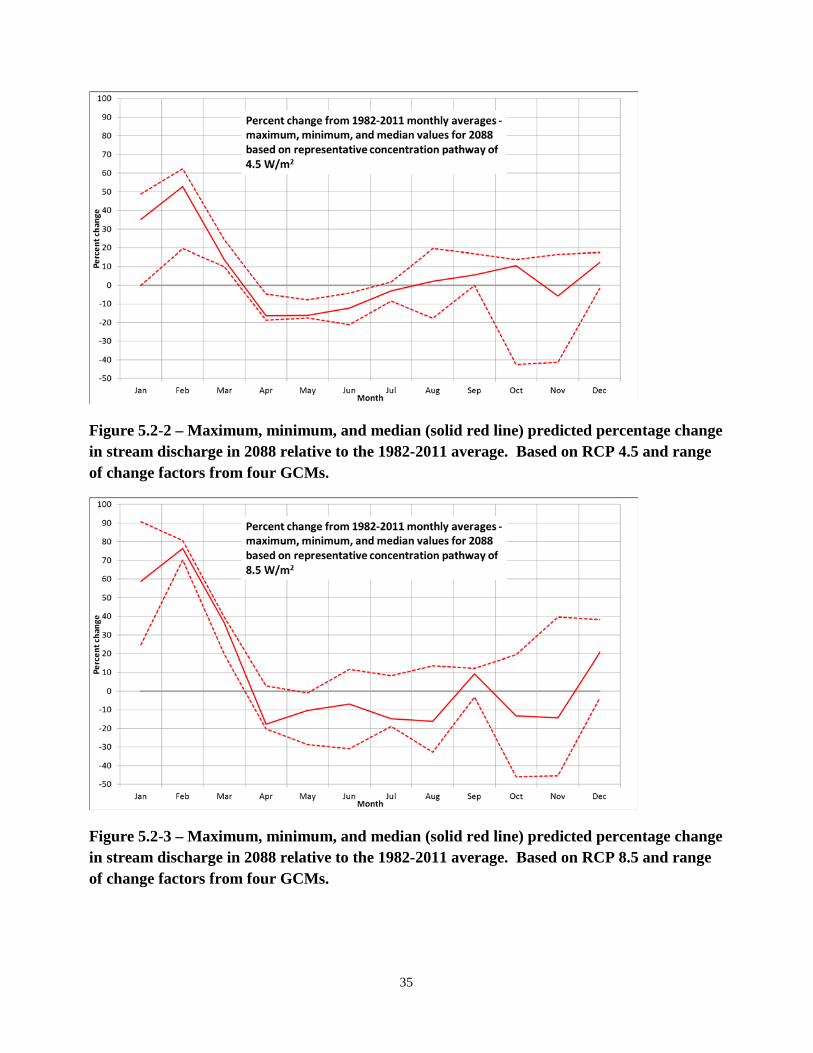
Figure 5.2-2 shows the minimum, maximum, and median percent change in monthly discharge from the 1982-2011 average for RCP 4.5 and change factors from all GCMs in 2088. Figure 5.2-3 is similar but shows percent change based on RCP 8.5. These results show increased mean monthly discharge during winter and early spring (December through March) ranging from 20% to 70%. Reductions in discharge of approximately 20% are indicated for April through August, October, and November. Extreme events such as flood and drought conditions and perhaps increased climate variability will likely be superimposed on these average discharges (IPCC, 2013).
35
Figure 5.2-2 – Maximum, minimum, and median (solid red line) predicted percentage change in stream discharge in 2088 relative to the 1982-2011 average. Based on RCP 4.5 and range of change factors from four GCMs.
Figure 5.2-3 – Maximum, minimum, and median (solid red line) predicted percentage change in stream discharge in 2088 relative to the 1982-2011 average. Based on RCP 8.5 and range of change factors from four GCMs.

36
5.3 Analytical model of diel fluctuations in stream flow
Fonley and others (2015) describe oscillatory runoff entering all segments of a river network and undergoing exponential decay in amplitude by the equation
𝑅𝑅(𝑡𝑡) = 𝐵𝐵𝑒𝑒−𝐴𝐴𝐴𝐴 + 𝐶𝐶𝑒𝑒−𝐴𝐴𝐴𝐴sin (2𝜋𝜋𝜋𝜋𝑡𝑡), (1)
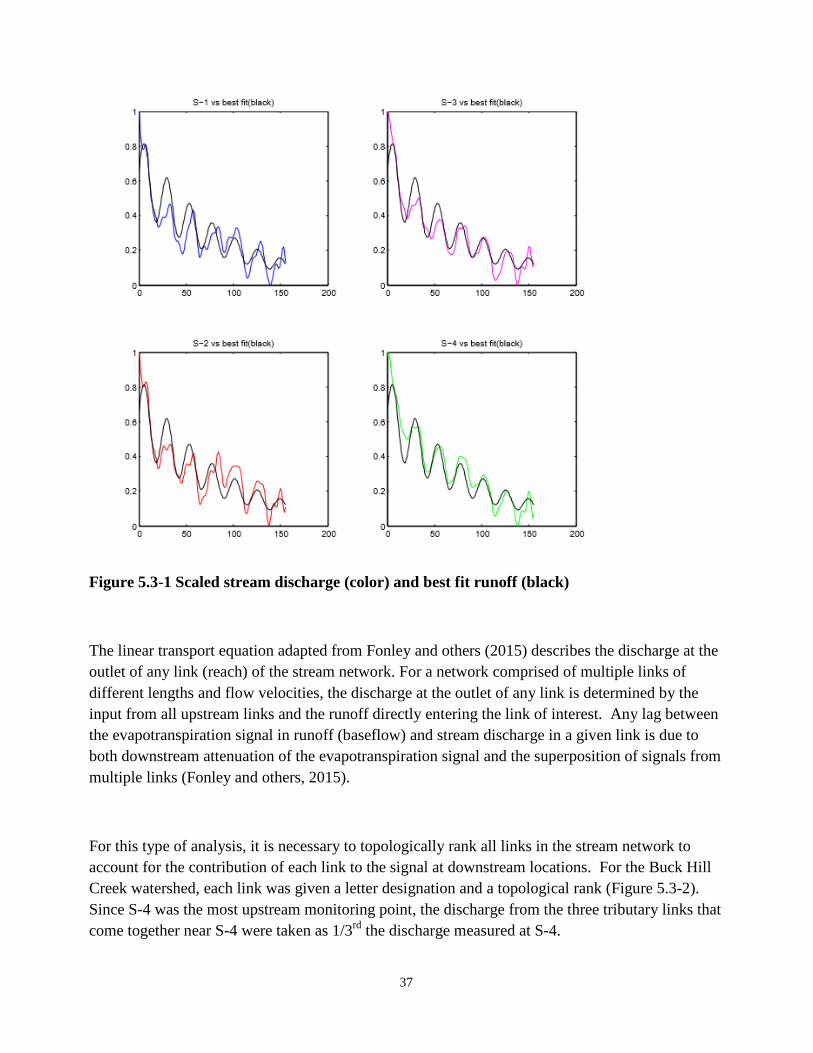
where A determines the rate of decay, B is the initial runoff value in liters s-1, C determines the amplitude of 24-hr variations and 𝜋𝜋 is set to 1 24⁄ hr-1. These parameters are assumed to be universal to the watershed. However, the only way to fit the Buck Hill Creek data from each monitoring point to the above equation was to have unique A, B, and C values for each link in the stream network. To avoid this difficulty and make the data more amenable to the methods in Fonley and others (2015), we took the average discharge of the monitoring points S-1 through S-4 and then used a genetic algorithm to adjust A, B, and C values until it arrived at a best fit. Each monitoring point was then plotted against equation 1 with these universal values of A, B, and C (Figure 5.3-1). The data for each monitoring point have been scaled from 0 to 1. The universal baseflow parameters derived from the genetic algorithm were A = 0.0114 B = 0.6574 and C = 0.2125.
37
Figure 5.3-1 Scaled stream discharge (color) and best fit runoff (black)
The linear transport equation adapted from Fonley and others (2015) describes the discharge at the outlet of any link (reach) of the stream network. For a network comprised of multiple links of different lengths and flow velocities, the discharge at the outlet of any link is determined by the input from all upstream links and the runoff directly entering the link of interest. Any lag between the evapotranspiration signal in runoff (baseflow) and stream discharge in a given link is due to both downstream attenuation of the evapotranspiration signal and the superposition of signals from multiple links (Fonley and others, 2015).
For this type of analysis, it is necessary to topologically rank all links in the stream network to account for the contribution of each link to the signal at downstream locations. For the Buck Hill Creek watershed, each link was given a letter designation and a topological rank (Figure 5.3-2). Since S-4 was the most upstream monitoring point, the discharge from the three tributary links that come together near S-4 were taken as 1/3rd the discharge measured at S-4.

38
Figure 5.3-2 Topological ranking of upstream portion of watershed
Figure 5.3-3 below shows the discharge data from S-4 divided by three (red circles) and a best fit (black line) using a genetic algorithm to fit equation 1 to these data. The resulting baseflow parameters for the links upstream of S-4 are A = 0.0044 B = 10.3 C = 1.03.

39
Figure 5.3-3 Estimated discharge upstream of S-4
We next looked for lags in the downstream monitoring points relative to S-4. We expected the lag to increase from S-4 to S-3 to S-2 to S-1 (in the downstream direction). Looking at nearly a week-long dry period in July, 2016, S-1 (the most downstream monitoring point) lags behind S-4 (the most upstream location) for only the last three cycles (Figure 5.3-4). At 80 - 90 hours the lag order is S-3: S-1: S-4 (tied) then S-2. At 100 – 110 hours the order is S-3: S-4: S-1: S-2. At 125 – 135 hours the order is S-4: S-1: S-3: S-2 and at > 150 hours the order is S-4: S-2: S-3: S-1.
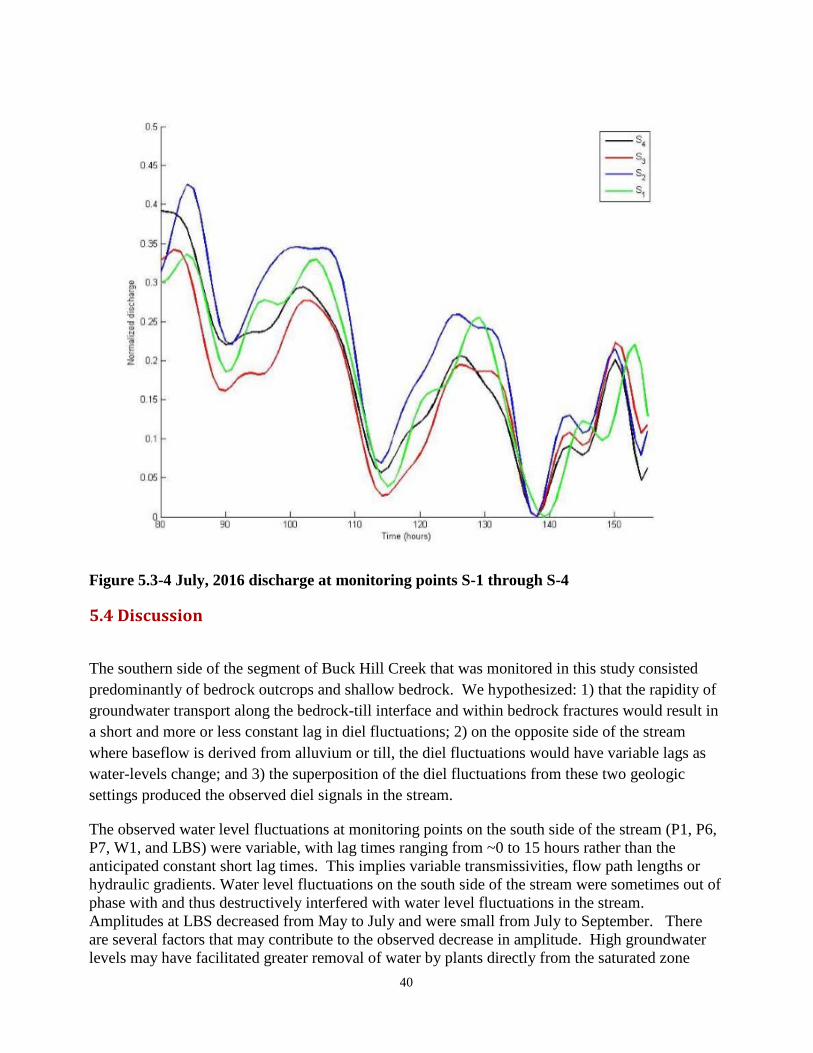
40
Figure 5.3-4 July, 2016 discharge at monitoring points S-1 through S-4
5.4 Discussion
The southern side of the segment of Buck Hill Creek that was monitored in this study consisted predominantly of bedrock outcrops and shallow bedrock. We hypothesized: 1) that the rapidity of groundwater transport along the bedrock-till interface and within bedrock fractures would result in a short and more or less constant lag in diel fluctuations; 2) on the opposite side of the stream where baseflow is derived from alluvium or till, the diel fluctuations would have variable lags as water-levels change; and 3) the superposition of the diel fluctuations from these two geologic settings produced the observed diel signals in the stream.
The observed water level fluctuations at monitoring points on the south side of the stream (P1, P6, P7, W1, and LBS) were variable, with lag times ranging from ~0 to 15 hours rather than the anticipated constant short lag times. This implies variable transmissivities, flow path lengths or hydraulic gradients. Water level fluctuations on the south side of the stream were sometimes out of phase with and thus destructively interfered with water level fluctuations in the stream. Amplitudes at LBS decreased from May to July and were small from July to September. There are several factors that may contribute to the observed decrease in amplitude. High groundwater levels may have facilitated greater removal of water by plants directly from the saturated zone
41
(Bond and others, 2002; Shah and others, 2007; Moore and others, 2011). Additionally, high groundwater levels may shorten the length of the flow path between transpiring vegetation and the discharge point which may increase amplitudes. Monitoring points P2, P3, P4, and P5 were located on the north side of the stream. Water levels at monitoring point P5 exhibited a short, constant lag and variable amplitudes. Water levels at this monitoring point probably reflect direct drawdown within a stand of spruce, birch, and cherry trees. Water level fluctuations at P2, P3, and P4 exhibited variable lags and were always nearly in phase with the stream signals. Townley (1995) showed that discharge from an aquifer subjected to a sinusoidal periodic forcing exhibited decreased amplitude (and increased lag) with the length of the flow path for a given aquifer storage and transmissivity. Factors that may produce the observed increased lag with decreased discharge include longer groundwater flow paths associated with lower discharge (Townley, 1995) and decreased groundwater gradients (Bren, 1997).
The lowest observed stream discharges were observed in September and October. The longest lags were observed at all monitoring locations during this time and all were approximately in phase. This constructive interference likely produced the larger amplitude fluctuation observed in the September stream data (Figure 5.1-7). Wondzell and others (2007) Fonley and others (2015) showed that in-stream process also impact lag and amplitude. In the present study, the similarity among diel signals in the stream monitoring points at any given time suggested that in-stream processes were not important.
These observations support the geologic dichotomy proposed in our initial hypothesis. The water level fluctuations observed on the bedrock-dominated south side of the stream, however, were more variable than hypothesized. Based on the long lag times observed at LBS and, during low-flow conditions at W-1, it appears that groundwater flow in bedrock was characterized by long flow paths or low transmissivities. This was contrary to our initial hypothesis.
The simulated future climatic conditions indicated reduced discharge during the period April to October. Our observations suggest that the predicted changes may be accompanied by diel fluctuations in the stream with increased amplitudes and long lag times.
The Buck Hill Creek watershed is not amenable to the analytical techniques outlined in Fonley and others, 2015. Factors that contribute to this include the fact that most of the monitoring locations all lie within a single link of the network. The distribution of monitoring points was not informed by the application of this modeling. Additional monitoring points in other links of the stream network would allow a more thorough analysis of how diel signals propagate throughout this stream network. Additionally, the period of record was rarely dry and when it was, discharge, as measured in the stream channel, actually decreased in the downstream direction in some locations. This decrease is likely attributable to the coarseness of the alluvium in some locations where the stream may have been losing flow to the water table. Lastly, the slopes on either side of the stream consist of bedrock on one side and till and alluvium on the other, which likely results in diel signals reaching the stream channel with very different amplitude and lag characteristics. The methods presented in Fonley and others, 2015 rely on the assumption that baseflow parameters are
42
universal to the entire stream network. This universality is clearly not the case for Buck Hill Creek.
There are extensive stands of hemlock in the watershed. Given potential impacts of Hemlock Woolly Adelgid (Adelges tsugae), this plant community could change drastically in upcoming decades, with associated impacts on hydrology, as this stand would presumably be replaced with early successional trees, such as birches (Betula spp.), with different transpiration regimes from hemlocks (Ford and Vose 2007; Daley et al 2007), with subsequent expected impact on groundwater recharge and stream baseflow and seasonal variability. Much of the watershed is underlain by glacial till, however till barrens plant communities (sensu Latham et al 1996) were not observed. To speculate - given that the etiology and maintenance of those till barrens communities is not well understood, in future climatic regimes, a shift in vegetation from the upland mixed-hardwood to till barrens shrub savannah community is a possibility; this would affect the water flow through these systems, thereby changing groundwater recharge and streamflow patterns.
6.0 Conclusion
Diel fluctuations in water levels in Buck Hill Creek are produced by the superposition of diel fluctuations in baseflow from adjacent riparian areas and hillslopes. Diel signals discharged from bedrock areas exhibited variable but predominantly long lag times. During high to moderate flow conditions, those areas that exhibited long lag times were out of phase with and destructively interfered with the diel fluctuation in the stream. Diel signals from till or alluvial deposits exhibited lag times that were shortest during wet conditions and longest during low-flow conditions. Diel signals in baseflow from all locations during low-flow conditions were approximately in phase and constructively interfered to produce the high amplitude fluctuations in the stream. Simulated future climatic changes indicated decreased stream discharge from April through October. The predicted changes may be accompanied by diel fluctuations in the stream with increased amplitudes and long lag times. Concomitant shifts in vegetation are likely to occur and may also affect evapotranspiration-driven diel signals.
7.0 Future Research
Future research objectives include:
1. Establishing a permanent, long term, monitoring at in-stream monitoring points S1-S4.
a. Monitoring stations will include vented pressure transducer equipped with telemetry.
43
b. Establishment of a weather station to record precipitation, temperature, and solar insolation.
c. Development of software for identification of optimum conditions for recording diel signals and the automated calculation of amplitude and lag.
2. Short-term monitoring of select geologic settings utilizing a high density of monitoring points to better understand diel signal transport and vegetation changes.
3. Examination of geochemical cycles relative to diel fluctuations in stream flow. 4. Develop a modeling approach that incorporates variable baseflow parameters.
8.0 Citations
Barnard, H.R., Graham, C.B., Van Verseveld, W.J., Brooks, J.R., Bond, B.J., and McDonnell, J.J., 2010, Mechanistic assessment of hillslope transpiration controls of diel subsurface flow: a steady-state irrigation approach: Ecohydrology, vol. 3, pp. 133-142.
Bond, B.J., Jones, J.A., Moore, G., Phillips, N., Post, D., and McDonnell, J.J., 2002, The zone of vegetation influence on baseflow revealed by diel patterns of streamflow and vegetation water use in a headwater basin: Hydrological Processes 16, 1671-1677.
Bren, L.J., 1997, Effects of slope vegetation removal on diurnal variations of a small mountain stream: Water Resources Research, vol. 33, no. 2, pp. 321-331.
Burt, T.P., 1979, Diurnal variations in stream discharge and throughflow during a period of low flow: Journal of Hydrology, vol. 41, pp. 291-301.
Czikowsky, M.J. and Fitzjarrald, D.R., 2004, Evidence of seasonal changes in evapotranspiration in eastern U.S. hydrological records: Journal of Hydrometeorology, vol. 5, pp. 974-988.
Daley, M.J., Phillips, N.G., Pettijohn, C., Hadley, J.L., 2007, Water use by eastern hemlock (Tsuga canadensis) and black birch (Betula lenta): implications of effects of the hemlock woolly adelgid. Canadian Journal of Forest Research, vol. 37 no. 10, pp. 2031-2040.
Dunford, E. G., and P. W. Fletcher, 1947, Effect of removal of stream-bank vegetation upon water yield, Eos Trans. AGU, 28, 105-110.
Fike, J., 2001, Terrestrial & Palustrine Plant Communities of Pennsylvania. Pennsylvania Natural Heritage Program
Fonley, M., Mantilla, R, Small, S.J., and Curtu, R., 2015, On the propagation of diel signals in river networks using analytical solutions of flow equations: Hydrol, Earth Syst. Sci. Discuss., vol. 12, pp. 8175-8220.
44
Ford, C.R., Vose, J.M., 2007, Tsuga canadensis (L.) Carr. mortality will impact hydrologic processes in southern Appalachian forest ecosystems: Ecological applications: vol. 17, no. 4 pp. 1156–1167.
Graham, C.B., Barnard, H.R., Kavanagh, K.L., and McNamara, J.P., 2012, Catchment scale controls the temporal connection of transpiration and diel fluctuations in streamflow: Hydrological Processes, DOI: 10.1002/hyp.9334, 16 p.
Gribovszki, Z., Szilagyi, J., and Kalicz, P., 2010, Diurnal fluctuations in shallow groundwater levels and streamflow rates and their interpretation – a review: Journal of Hydrology, No. 385, pp 371-383.
IPCC, 2013: Climate Change 2013: The Physical Science Basis. Contribution of Working Group I to the Fifth Assessment Report of the Intergovernmental Panel on Climate Change [Stocker, T.F., D. Qin, G.-K. Plattner, M. Tignor, S.K. Allen, J. Boschung, A. Nauels, Y. Xia, V. Bex and P.M. Midgley (eds.)]. Cambridge University Press, Cambridge, United Kingdom and New York, NY, USA, 1535 pp.(http://www.ipcc.ch/report/ar5/wg1/) Latham, R.E., Thompson, J.E., Riley, S.A., and Wibiralske, A.W., 1996, The Pocono Till Barrens: Shrub Savanna Persisting on Soils Favoring Forest: Bulletin of the Torrey Botanical Club, vol. 123, no. 4, pp. 330-349. Loheide, S.P., Butler, J.J., and Gorelick, S.M., 2005, Estimation of groundwater consumption by phreatophytes using diurnal water table fluctuations: A saturated-unsaturated flow assessment. Water Resources Research, vol, 41, W07030, 14 p. Lundquist, J.D. and Cayan, D.R., 2002, Seasonal and spatial patterns in diurnal cycles in streamflow in the western United States: Journal of Hydrometeorology, vol. 3, pp. 591-603.
Moore, G.W., Jones, J.A., and Bond, B.J., 2011, How soil moisture mediates the influence of transpiration on streamflow at hourly to interannual scales in a forested catchment: Hydrological Processes, vol. 25, issue 24, pp. 3701-3710.
Parker, J., 1963, Causes of the Winter Decline in Transpiration and Photosynthesis in Some Evergreens: Forest Science, vol. 9, no 2, pp. 158-166.
Pennsylvania State University, Oct. 2013, Pennsylvania climate impacts assessment update. PADEP document # 97037. Sevon, W.D., 1975, Geology and mineral resources of the Tobyhanna and Buck Hill Falls quadrangles, Monroe County, Pennsylvania: Commonwealth of Pennsylvania, Bureau of Topographic and Geologic Survey, Atlas 204ab.
Shah, N., Nachabe, M., and Ross, M., 2007, Extinction depth and evapotranspiration from ground water under selected land covers: Ground Water, vol. 45, no. 3, pp. 329-338.
45
Soil Survey Staff, Natural Resources Conservation Service, United States Department of Agriculture. Official Soil Series Descriptions. Available online. Accessed [8/8/2014].
Szilagyi, J., and Jozsa, J., 2013, MODIS-aided statewide net groundwater-recharge estimation in Nebraska: Groundwater, vol. 51, no. 5, pp. 735-744.
Townley, L.R., 1995, The response of aquifers to periodic forcing: Advances in Water Resources, vol. 18, no. 3, pp. 125-146.
Wondzell, S.M., Gooseff, M.N., and McGlynn, B.L., 2007, Flow velocity and the hydrologic behavior of streams during baseflow: Geophysical Research Letters, vol. 34, L24404, doi: 10.1029/2007GL031256
Wondzell, S.M., Gooseff, M.N., and McGlynn, B.L., 2010, An analysis of alternative conceptual models relating hyporeic exchange flow to diel fluctuations in discharge during baseflow recession: Hydrological Processes, vol. 24, pp. 686-694.
9.0 Appendix A: Metrics
• Undergraduate and Graduate Student Support
i. Matthew Lane – Research Assistant May, 2016-December 2016. B.S. in Geology and Environmental Resource Management, December 2016.
ii. John Ciccone - Research Assistant, May 2016-May 2017. B.S. in Geology and Environmental Resource Management, December 2016.
iii. Brady Butler – Research Assistant, March 2017 – December 2017, senior pursuing B.S. in Environmental Resource Management
iv. Courtney Reeves – Research Assistant, March 2017 – December 2017, senior pursuing B.S. in Geology
v. Dakota Valle – Research Assistant, March 2017 – December 2017, senior pursuing B.S. in Geology and Environmental Resource Management
• Faculty and Staff Support
i. Robert Cook, Ph.D., P.G., Professor of Geology, 0.25 FTE during 2016, 0.30 FTE during 2017.
ii. Joseph Janick, Ph.D., Assistant Professor of Geology 0.17 FTE during 2017
• Publications
i. none to date
• Volunteer Hours i. none
• Public and Professional Presentations and Attendees i. none to date
• Project Collaborators i. John Janick – vegetation assessment
ii. David Hewitt – vegetation assessment
10.0 Appendix B: Impact and/or Accomplishment Statement(s)
• Accomplishment Statement Diel signals in stream discharge - insights into watershed behavior and potential impacts of climate change Robert Cook and Joseph Janick, Biological and Physical Sciences, Keystone College, La Plume, Pennsylvania Just as one’s pulse is synoptic of one’s physical condition, daily water level fluctuations (diel signals) in streams are synoptic of watershed characteristics (geology, plant

community, soils, topography, stream morphology, climate, etc.) and useful for monitoring current and changing conditions.
This project examined the characteristics of evapotranspiration-driven diel signals in groundwater levels and stream discharge in a small watershed in northeastern Pennsylvania. The goal of this project was to understand how the characteristics of diel signals in the headwaters of Buck Hill Creek related to watershed characteristics and predict how the signal characteristics might be affected by changing climate. If the characteristics of diel signals in groundwater levels and stream discharge can be used for assessing ecosystem vulnerability to changing soil moisture and plant communities in response to climate change, the approach will be widely applicable. Water levels were recorded at 5-minute intervals at eight riparian stations and five stream locations from spring to fall of 2016 and 2017. The geologic settings of the monitoring points and the surrounding vegetation were characterized. The shapes and timing of diel signals extracted from the water level data collected from various settings and under differing stream discharge conditions were compared. Future changes in diel signals were inferred from the observed signals and predicted climatic changes in stream discharge. The results showed that monitoring diel signals is useful for assessing changes in watersheds and may be a valuable component for watershed monitoring programs.
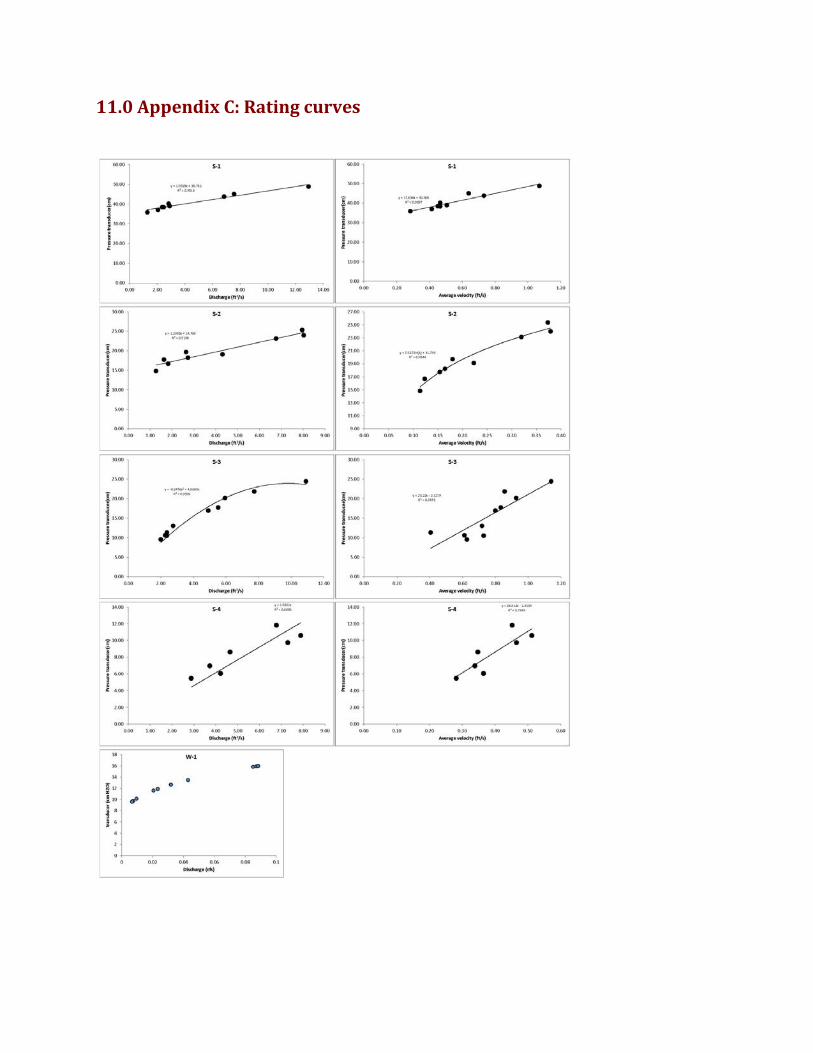
11.0 Appendix C: Rating curves