Embed Size (px)
Citation preview
ARTICLE IN PRESS
0967-0637/$ - see
doi:10.1016/j.ds
�Correspondifax: +1831 775
E-mail addre
Deep-Sea Research I 53 (2006) 561–573
www.elsevier.com/locate/dsr
Instruments and Methods
Diel nitrate cycles observed with in situ sensors predictmonthly and annual new production
Kenneth S. Johnson�, Luke J. Coletti, Francisco P. Chavez
Monterey Bay Aquarium Research Institute, 7700 Sandholdt Road, Moss Landing, CA 95039, USA
Received 12 May 2005; received in revised form 6 December 2005; accepted 15 December 2005
Available online 17 February 2006
Abstract
We report on a direct and autonomous measure of new production based on time series observations with ISUS nitrate
sensors deployed for several years on oceanographic moorings offshore of Monterey Bay, California. The amplitude of diel
cycles of surface nitrate is correlated with rates of primary production measured by 14C uptake. The drawdown of nitrate
averaged over a year is about 70% of the fixed nitrogen needed for biomass production. Phytoplankton biomass predicted
from the diel nitrate uptake and a fixed rate constant for nitrate loss (grazing and export) matched observations over the
annual cycle. New production rates determined with the moored sensors are highly correlated with nitrate concentration
and the intensity of upwelling. The implication is that arrays of moorings with chemical sensors can now be used to
estimate new production of biomass and ecosystem processes over multiple temporal and spatial scales.
r 2006 Elsevier Ltd. All rights reserved.
Keywords: Nitrates; Moorings; Primary production; Upwelling; Monterey bay; Nitrate sensor
1. Introduction
The quality and quantity of primary productiondetermines the fate of chemical elements and theoverall character of an ecosystem (Marra, 2002). Inthe ocean, the measurement of primary productionis problematic for several reasons. First, themeasurements are tedious and time consuming,requiring incubation of samples over several hoursto a day. Careful techniques are required, given thatcontamination inhibits photosynthesis (Fitzwater etal., 1982). Secondly, the standard 14C uptakemeasurement is ambiguous, giving a number that
front matter r 2006 Elsevier Ltd. All rights reserved
r.2005.12.004
ng author. Tel.: +1831 775 1985;
1620.
ss: [email protected] (K.S. Johnson).
is less than gross, but more than net photosynthesis(Marra, 2002). As a result, there are few long-termrecords of primary production and none withtemporal resolution that approaches daily overextended time periods.
The daily cycle of photosynthesis in the surfaceocean drives diel changes in the concentrations ofchemicals, including oxygen, inorganic carbon andparticulate organic carbon, that are consumed orproduced as plants grow and new biomass is created(Siegel et al., 1989; Chipman et al., 1993; De-grandpre et al., 1998). These cycles have not beenwidely used to determine primary productionbecause of: (1) the paucity of robust autonomoussensors, and (2) the difficulty in sustaining long-term chemical and biological sensor deployments inthe ocean. Nitrate is a particularly attractive
.

ARTICLE IN PRESSK.S. Johnson et al. / Deep-Sea Research I 53 (2006) 561–573562
element to focus on given that it is the primarysource of ‘‘new’’ nitrogen (sensu Dugdale andGoering, 1967) and nitrogen may be the limitingnutrient on a global scale. Photosynthetically drivenchanges in nitrate concentration have been observedover daily periods with shipboard measurements(Ryther et al., 1961; Eppley and Renger, 1988;Zhang et al., 2001). The ratio of C–N in phyto-plankton is constrained to a fairly narrow range(Falkowski, 2000) near the Redfield ratio (Redfieldet al., 1963) of 6.6:1, which links nitrate uptakedirectly to new production as defined by Dugdaleand Goering (1967). The seasonal depletion ofnitrate in the upper ocean has been used as anindicator of new production at high latitudes and inupwelling regions (Wong et al., 2002; Rubin, 2003).
Optical nitrate sensors (in situ ultraviolet spectro-photometers (ISUS)) have already been shown to becapable of long-term deployment in the ocean(Johnson and Coletti, 2002). Here we present datafrom ISUS nitrate sensors deployed on moorings at20 and 50 km offshore of Monterey Bay on thecentral California coast (Chavez et al., 1997).
Degrees West Longitud
122.8 122.4 122.0
Deg
rees
N L
atitu
de
36.4
36.8
100500
1000
M
M2
AñoNuevo
Fig. 1. Mooring locations (M1: 36.7471N, 122.0221W, 1200m depth an
Bay. Northern arrow shows the trajectory of upwelled water from its so
flow out of the Bay and the periodic recirculation during relaxation of
Monterey Bay is a region where the circulationand physical supply of nitrate are dominated byupwelling (Breaker and Broenkow, 1994; Penning-ton and Chavez, 2000). We use the diel cycles ofnitrate observed with the ISUS instruments tocalculate new production. We examine the varia-bility of new production over multiple years and theprocesses that regulate this variability in the off-shore California region.
2. Methods
Nitrate was measured at 1m depth using ISUSnitrate sensors (Johnson and Coletti, 2002) on theM1 (20 km offshore, 1200m depth) and M2 (50 kmoffshore, 1800m depth) moorings offshore ofMonterey Bay (Fig. 1). The mooring data, includingthe complete ultra-violet spectrum measured byISUS, are telemetered to shore hourly (Chavez etal., 1997). Nitrate concentrations are calculatedusing the measured light absorption spectrum from217 to 240 nm and a linear baseline estimate.Biofouling of the optics was inhibited with a copper
124 120 116
34
36
38
40
42
e
121.6
MossLanding
1
d M2: 36.6971N, 122.3781W, 1800m depth) offshore of Monterey
urce south of Point Ano Nuevo. Southern arrow shows the mean
upwelling favorable winds (not to scale). Depth contours in m.

ARTICLE IN PRESSK.S. Johnson et al. / Deep-Sea Research I 53 (2006) 561–573 563
and Nitex shield. Fouling of the instrument isdiagnosed quantitatively by examining the residualdifferences between the observed absorption spectraand the fitted model. Data are rejected when thestandard deviation of the absorbance residualsincreased to values greater than 0.005.
Observations were made on the M1 mooringfrom 22 February 2002 to 22 October 2004 andfrom 3 July 2002 to 11 December 2004 on the M2mooring. Deployments at M1 produced 640 days ofuseful data during the 973 days interval. There are578 days of data at M2 during the 892 days interval.The ISUS nitrate concentrations are accurate to72 mM (standard error of estimate for regressionversus bottle samples), while the precision of themeasurements determined from observations overday-long periods during quiescent conditions is70.15 mM (1SD). Long-term sensor drift mayresult in negative nitrate concentrations with valuesas low as �2 mM during periods when the realnitrate concentration is near zero. We have notcorrected the data for long-term drift and thenegative values do not affect any of the conclusionsreported here.
Spectral radiometers were placed at 10m depthon the mooring line and on the mooring tower. Themeasurements at 10min intervals were binned tohourly averages and chlorophyll concentrationswere estimated from the attenuation of sunlight at490 nm (Morel, 1988). The radiometers were pro-tected from fouling with a copper shutter (Chavez etal., 2000). Discrete water samples have beencollected near each mooring since 1989 at approxi-mately 3-week intervals (Pennington and Chavez,2000). These samples are analyzed for 14C primaryproduction (24-h incubations), nitrate and extractedchlorophyll.
3. Results and discussion
3.1. Annual variability
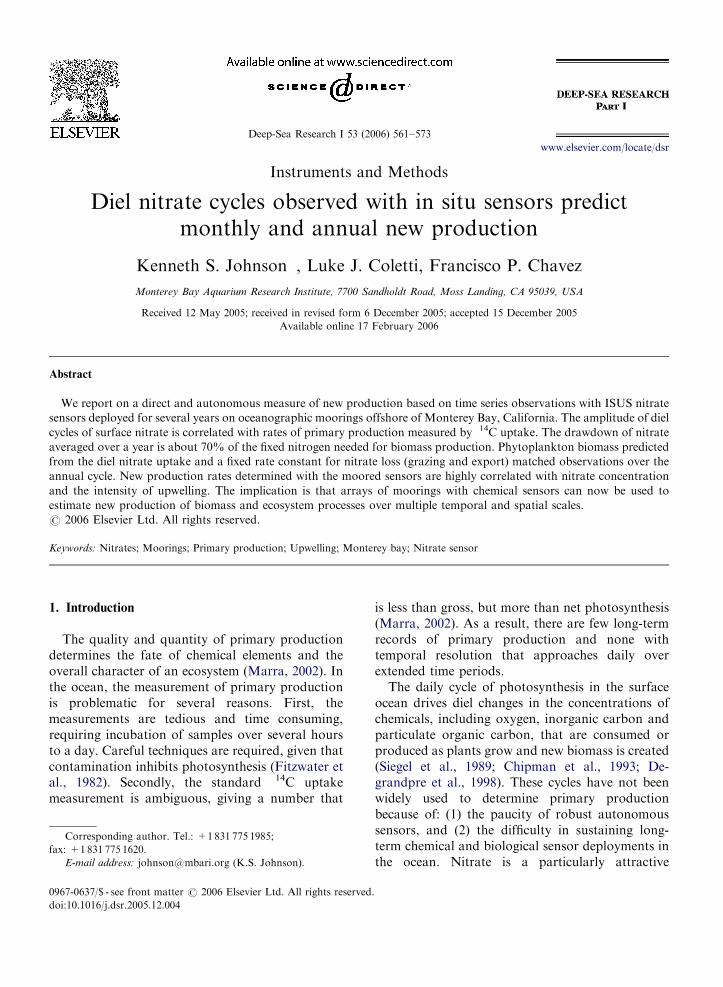
A year of wind, surface temperature, nitrate andchlorophyll data from M1 sensors are shown inFigs. 2(A)–(D). Gaps in the data sequence are dueto biofouling of optical surfaces and instrumentalfailures. In most cases, when these failures weredetected in the telemetered data, a visit to themooring was required to clean the optical surfacesor to replace the faulty instrument. Occasionally, anair bubble that formed on the optics would clearitself.
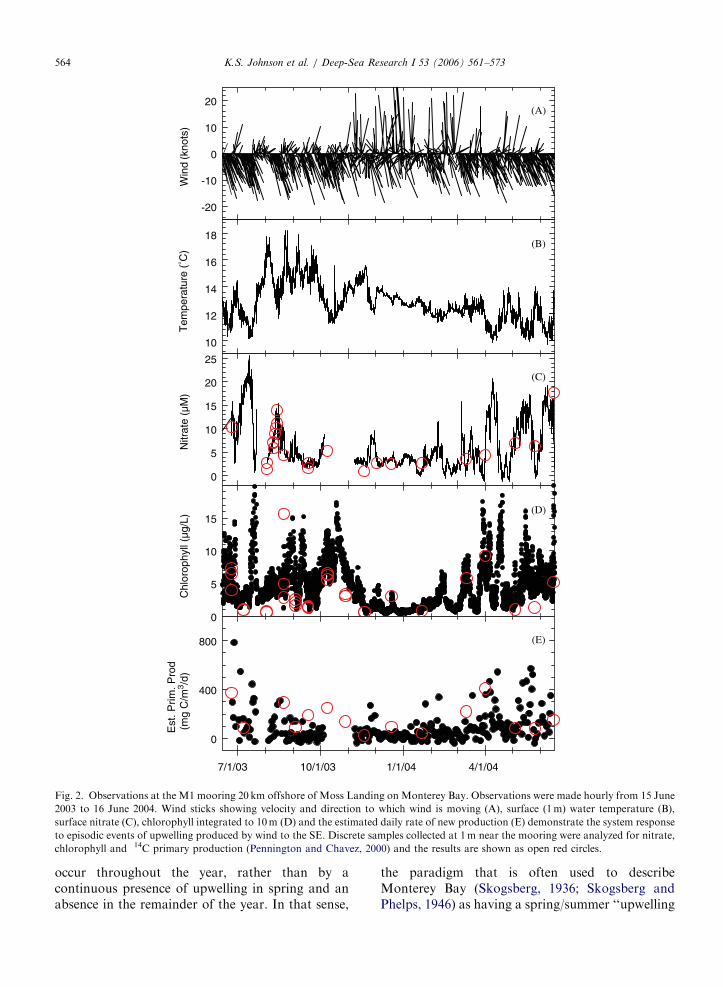
Measurements of nitrate and chlorophyll concen-tration made on discrete samples collected at0.5–1 km distance from the mooring are shown asred circles in Fig. 2(C) and (D). A Model IIregression line (Laws, 1997) was fitted to the pairedmooring ISUS and discrete sample nitrate datacollected near M1 over the past 2 years (Fig. 3). Itindicates no significant difference between in situmeasurements and conventional autoanalyzer mea-surements (NO3-ISUS ¼ 0.1[71.2]+0.98[70.16]�NO3-bottle, 95% CI). The standard error of theregression line is 72 mM, which is about theaccuracy limit of the instrument. Some of the scatteris undoubtedly also due to small-scale variability ofnitrate in surface waters (KJ, unpublished data).The precision of the data is much better than72 mM over 1 day. During periods with low nitrate,the standard deviation of all data collected on 1 daymay be as small as 70.15 mM.
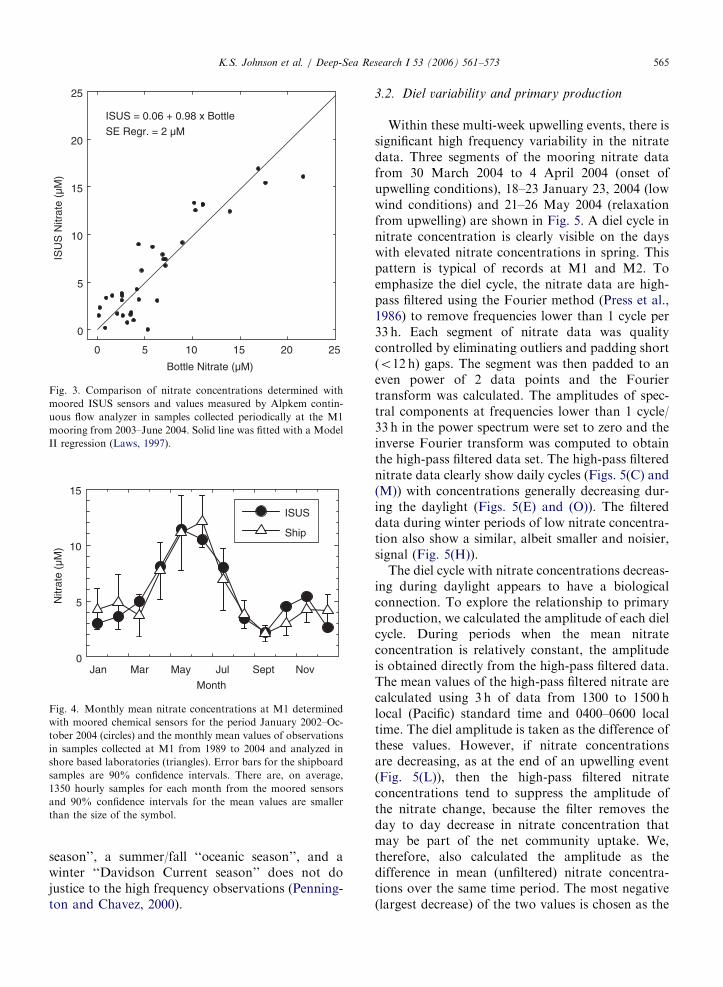
The classical picture of nutrient cycling at mid-latitudes is characterized by a winter maximum andsummer depletion (e.g. Harvey, 1928). The seasonalcycle differs in the Monterey Bay region because themajor signal is driven by upwelling and not by deepwinter mixing. Shipboard sampling in MontereyBay at near monthly intervals shows an annual cycleof nitrate that is characterized by a maximum in latespring (Pennington and Chavez, 2000), which is thetime of maximum upwelling (Fig. 4). Nitrate isdepleted to a concentration of a few micromolarduring the remainder of the year. This pattern isreproduced in the mooring measurements when thehourly data is binned to monthly averages (Fig. 4).However, the hourly data (Fig. 2) show a morecomplex pattern that is produced by episodes ofupwelling favorable wind that occur with a timescale of several days to several weeks (Service et al.,1998; Pennington and Chavez, 2000; Fitzwateret al., 2003). The interaction of wind and theEarth’s rotation during the episodic, southeasterlywinds results in net transport of surface waters awayfrom the coast and cold, nitrate-rich water comes tothe surface (Figs. 2(A)–(C)). These episodes ofupwelling are interspersed by reversals in winddirection that produce downwelling events withonshore transport of nutrient depleted, warm water.The upwelling/downwelling cycles produce a recordthat is dominated by variability over a time frame of1–2 weeks, rather than by a clear seasonal shift inconditions. The seasonality in the monthly meannutrient data (Fig. 4) is produced by a shift in thefrequency and duration of upwelling events that
ARTICLE IN PRESS
Tem
pera
ture
(° C
)
10
12
14
16
18
Nitr
ate
(µM
)
0
5
10
15
20
25
Chl
orop
hyll
(µg/
L)
0
5
10
15
Win
d (k
nots
)
-20
-10
0
10
20
7/1/03 10/1/03 1/1/04 4/1/04
Est
. Prim
. Pro
d (
mg
C/m
3 /d)
0
400
800
(A)
(B)
(C)
(D)
(E)
Fig. 2. Observations at the M1 mooring 20 km offshore of Moss Landing on Monterey Bay. Observations were made hourly from 15 June
2003 to 16 June 2004. Wind sticks showing velocity and direction to which wind is moving (A), surface (1m) water temperature (B),
surface nitrate (C), chlorophyll integrated to 10m (D) and the estimated daily rate of new production (E) demonstrate the system response
to episodic events of upwelling produced by wind to the SE. Discrete samples collected at 1m near the mooring were analyzed for nitrate,
chlorophyll and 14C primary production (Pennington and Chavez, 2000) and the results are shown as open red circles.
K.S. Johnson et al. / Deep-Sea Research I 53 (2006) 561–573564
occur throughout the year, rather than by acontinuous presence of upwelling in spring and anabsence in the remainder of the year. In that sense,
the paradigm that is often used to describeMonterey Bay (Skogsberg, 1936; Skogsberg andPhelps, 1946) as having a spring/summer ‘‘upwelling
ARTICLE IN PRESS
Bottle Nitrate (µM)
0 5 10 15 20 25
ISU
S N
itrat
e (µ
M)
0
5
10
15
20
25
ISUS = 0.06 + 0.98 x Bottle
SE Regr. = 2 µM
Fig. 3. Comparison of nitrate concentrations determined with
moored ISUS sensors and values measured by Alpkem contin-
uous flow analyzer in samples collected periodically at the M1
mooring from 2003–June 2004. Solid line was fitted with a Model
II regression (Laws, 1997).
Month
Jan Mar May Nov
Nitr
ate
(µM
)
0
5
10
15
ISUS
Ship
Jul Sept
Fig. 4. Monthly mean nitrate concentrations at M1 determined
with moored chemical sensors for the period January 2002–Oc-
tober 2004 (circles) and the monthly mean values of observations
in samples collected at M1 from 1989 to 2004 and analyzed in
shore based laboratories (triangles). Error bars for the shipboard
samples are 90% confidence intervals. There are, on average,
1350 hourly samples for each month from the moored sensors
and 90% confidence intervals for the mean values are smaller
than the size of the symbol.
K.S. Johnson et al. / Deep-Sea Research I 53 (2006) 561–573 565
season’’, a summer/fall ‘‘oceanic season’’, and awinter ‘‘Davidson Current season’’ does not dojustice to the high frequency observations (Penning-ton and Chavez, 2000).
3.2. Diel variability and primary production
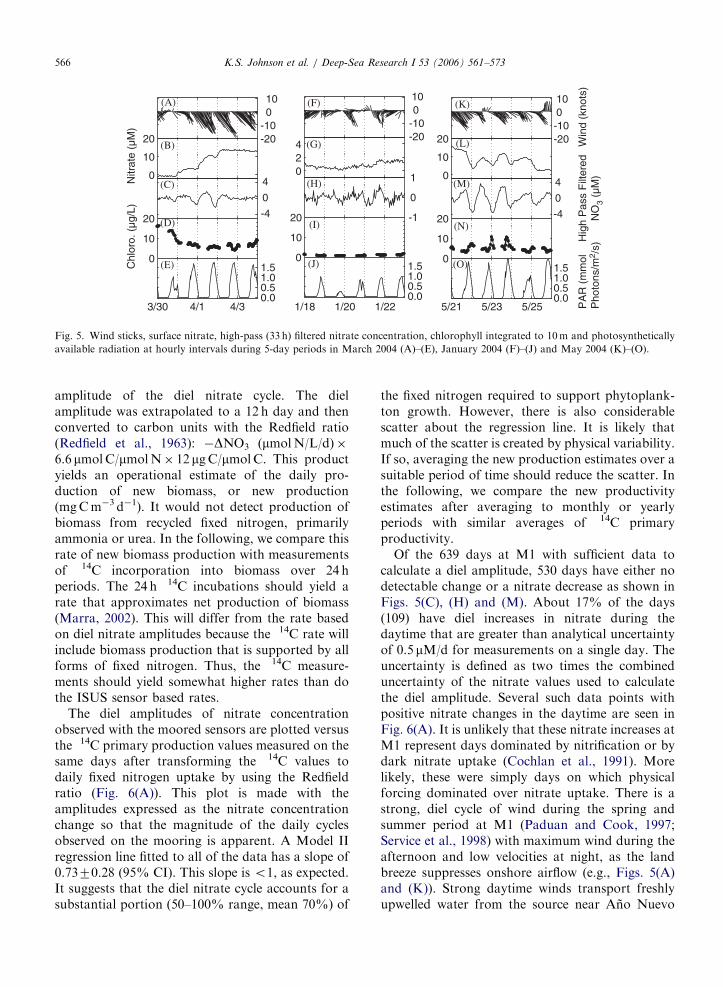
Within these multi-week upwelling events, there issignificant high frequency variability in the nitratedata. Three segments of the mooring nitrate datafrom 30 March 2004 to 4 April 2004 (onset ofupwelling conditions), 18–23 January 23, 2004 (lowwind conditions) and 21–26 May 2004 (relaxationfrom upwelling) are shown in Fig. 5. A diel cycle innitrate concentration is clearly visible on the dayswith elevated nitrate concentrations in spring. Thispattern is typical of records at M1 and M2. Toemphasize the diel cycle, the nitrate data are high-pass filtered using the Fourier method (Press et al.,1986) to remove frequencies lower than 1 cycle per33 h. Each segment of nitrate data was qualitycontrolled by eliminating outliers and padding short(o12 h) gaps. The segment was then padded to aneven power of 2 data points and the Fouriertransform was calculated. The amplitudes of spec-tral components at frequencies lower than 1 cycle/33 h in the power spectrum were set to zero and theinverse Fourier transform was computed to obtainthe high-pass filtered data set. The high-pass filterednitrate data clearly show daily cycles (Figs. 5(C) and(M)) with concentrations generally decreasing dur-ing the daylight (Figs. 5(E) and (O)). The filtereddata during winter periods of low nitrate concentra-tion also show a similar, albeit smaller and noisier,signal (Fig. 5(H)).
The diel cycle with nitrate concentrations decreas-ing during daylight appears to have a biologicalconnection. To explore the relationship to primaryproduction, we calculated the amplitude of each dielcycle. During periods when the mean nitrateconcentration is relatively constant, the amplitudeis obtained directly from the high-pass filtered data.The mean values of the high-pass filtered nitrate arecalculated using 3 h of data from 1300 to 1500 hlocal (Pacific) standard time and 0400–0600 localtime. The diel amplitude is taken as the difference ofthese values. However, if nitrate concentrationsare decreasing, as at the end of an upwelling event(Fig. 5(L)), then the high-pass filtered nitrateconcentrations tend to suppress the amplitude ofthe nitrate change, because the filter removes theday to day decrease in nitrate concentration thatmay be part of the net community uptake. We,therefore, also calculated the amplitude as thedifference in mean (unfiltered) nitrate concentra-tions over the same time period. The most negative(largest decrease) of the two values is chosen as the
ARTICLE IN PRESS
-1
0
1
-4
0
4Nitr
ate
(µM
)
0
10
20 -20-10010
Win
d (k
nots
)
-20-10010
-20-10010
Chl
oro.
(µg
/L)
0
10
20
3/30 4/1 4/30.00.51.01.5
(A)
(B)
(C)
(D)
(E)0
10
20
1/18 1/20 1/220.00.51.01.5
024
(F)
(G)
(H)
(I)
(J)
Hig
h P
ass
Filt
ered
NO
3 (µ
M)
-4
0
4
0
10
20
5/21 5/23 5/25 PA
R (
mm
olP
hoto
ns/m
2 /s)
0.00.51.01.5
0
10
20
(K)
(L)
(M)
(N)
(O)
Fig. 5. Wind sticks, surface nitrate, high-pass (33 h) filtered nitrate concentration, chlorophyll integrated to 10m and photosynthetically
available radiation at hourly intervals during 5-day periods in March 2004 (A)–(E), January 2004 (F)–(J) and May 2004 (K)–(O).
K.S. Johnson et al. / Deep-Sea Research I 53 (2006) 561–573566
amplitude of the diel nitrate cycle. The dielamplitude was extrapolated to a 12 h day and thenconverted to carbon units with the Redfield ratio(Redfield et al., 1963): �DNO3 (mmolN/L/d)�6.6 mmolC/mmolN� 12 mgC/mmolC. This productyields an operational estimate of the daily pro-duction of new biomass, or new production(mgCm�3 d�1). It would not detect production ofbiomass from recycled fixed nitrogen, primarilyammonia or urea. In the following, we compare thisrate of new biomass production with measurementsof 14C incorporation into biomass over 24 hperiods. The 24 h 14C incubations should yield arate that approximates net production of biomass(Marra, 2002). This will differ from the rate basedon diel nitrate amplitudes because the 14C rate willinclude biomass production that is supported by allforms of fixed nitrogen. Thus, the 14C measure-ments should yield somewhat higher rates than dothe ISUS sensor based rates.
The diel amplitudes of nitrate concentrationobserved with the moored sensors are plotted versusthe 14C primary production values measured on thesame days after transforming the 14C values todaily fixed nitrogen uptake by using the Redfieldratio (Fig. 6(A)). This plot is made with theamplitudes expressed as the nitrate concentrationchange so that the magnitude of the daily cyclesobserved on the mooring is apparent. A Model IIregression line fitted to all of the data has a slope of0.7370.28 (95% CI). This slope is o1, as expected.It suggests that the diel nitrate cycle accounts for asubstantial portion (50–100% range, mean 70%) of
the fixed nitrogen required to support phytoplank-ton growth. However, there is also considerablescatter about the regression line. It is likely thatmuch of the scatter is created by physical variability.If so, averaging the new production estimates over asuitable period of time should reduce the scatter. Inthe following, we compare the new productivityestimates after averaging to monthly or yearlyperiods with similar averages of 14C primaryproductivity.
Of the 639 days at M1 with sufficient data tocalculate a diel amplitude, 530 days have either nodetectable change or a nitrate decrease as shown inFigs. 5(C), (H) and (M). About 17% of the days(109) have diel increases in nitrate during thedaytime that are greater than analytical uncertaintyof 0.5 mM/d for measurements on a single day. Theuncertainty is defined as two times the combineduncertainty of the nitrate values used to calculatethe diel amplitude. Several such data points withpositive nitrate changes in the daytime are seen inFig. 6(A). It is unlikely that these nitrate increases atM1 represent days dominated by nitrification or bydark nitrate uptake (Cochlan et al., 1991). Morelikely, these were simply days on which physicalforcing dominated over nitrate uptake. There is astrong, diel cycle of wind during the spring andsummer period at M1 (Paduan and Cook, 1997;Service et al., 1998) with maximum wind during theafternoon and low velocities at night, as the landbreeze suppresses onshore airflow (e.g., Figs. 5(A)and (K)). Strong daytime winds transport freshlyupwelled water from the source near Ano Nuevo

ARTICLE IN PRESS
Prim. Prod. /12/6.6 (µmol N/L/d)
-10-8-6-4-20
∆Nitr
ate
(µm
ol/L
/d)
-10
-8
-6
-4
-2
0
Prim. Prod. (mg C/m3/d)
0 200 400 600 P
rim. P
rod.
(m
g C
/m3 /d
)
0
100
200
300
Month
Jan Mar May Jul Sep Nov
Month
Jan Mar May Jul Sep Nov0
100
200
300
(C)
M1
(D)
ISUS14-C
(A) Monthly Mean 14C (mg C/m3/d)
0 100 200 300
Mon
thly
Mea
n IS
US
New
Pro
duct
ion
(mg
C/m
3 /d)
0
100
200
300
M1M2
(B)
M1M2
M2
Fig. 6. Comparison of fixed nitrogen required to support daily primary production measured in 24-h incubations using 14C with the diel
amplitude of the high-pass filtered nitrate concentration. (A) Diel amplitude of nitrate plotted versus fixed nitrogen required to support14C primary production measured at M1 (closed circles) and M2 (open circles) moorings. Each comparison is for measurements made on a
single day. The Redfield ratio was used to convert 14C primary production to fixed nitrogen requirement. The solid line
(DNO3 ¼ �0.2[70.7]+0.72[70.3]�PP-N, 95%CI) is fitted by Model II regression. (B) Monthly mean values of new production
determined from all diel nitrate amplitudes measured from 2002 to 2004 are plotted versus monthly mean 14C primary production
determined from 1989 to 2004 at M1 (closed circles) and M2 (open circles). Solid line is a Model II regression (New
Production ¼ 5[710]+0.63[70.16] 14C Primary Production, 95% CI). (C) Monthly mean values of new production determined from
all diel nitrate amplitudes measured from 2002 to 2004 (solid circles) and from 14C primary production (open triangles) made from 1989
to 2004 at M1 versus month of year. Error bars are 90% confidence intervals for the data. Panel (D) is the same as (C) at the M2 mooring.
K.S. Johnson et al. / Deep-Sea Research I 53 (2006) 561–573 567
(Fig. 1) past the M1 mooring. If primary productionis low, then nitrate concentrations may increaseduring daytime as nutrient depleted water isreplaced by nutrient replete water. Low windvelocities at night can then lead to relaxation ofnutrient depleted water back to the mooring, asindicated by the shaded arrows in Fig. 1. This effectof the diel wind cycle is occasionally clear in surfacecurrents mapped with high frequency coastal radars(Paduan and Cook, 1997). M2 is much furtheroffshore, the diel variability in wind is much weakerand, as expected, there are fewer days with daytimenitrate increases. In the analyses reported here, thedays with daytime nitrate increases at M1 and M2
that are greater than the analytical uncertainty havebeen deleted. The impact of eliminating these days isdiscussed below.
Phytoplankton growth that is based on nitrate isnew production (Dugdale and Goering, 1967) andthe ratio of new production to primary productionbased on all forms of fixed nitrogen is the ‘‘f-ratio’’(Eppley and Peterson, 1979). F-ratios in MontereyBay (Kudela and Dugdale, 2000) are typically 40.5under conditions of high growth, consistent with theslope in Fig. 6(A). The f-ratio may decrease to near0.1 at times in Monterey Bay with lower primaryproduction (Bronk and Ward, 1999), as growth issupported by recycled ammonium ion. At such
ARTICLE IN PRESSK.S. Johnson et al. / Deep-Sea Research I 53 (2006) 561–573568
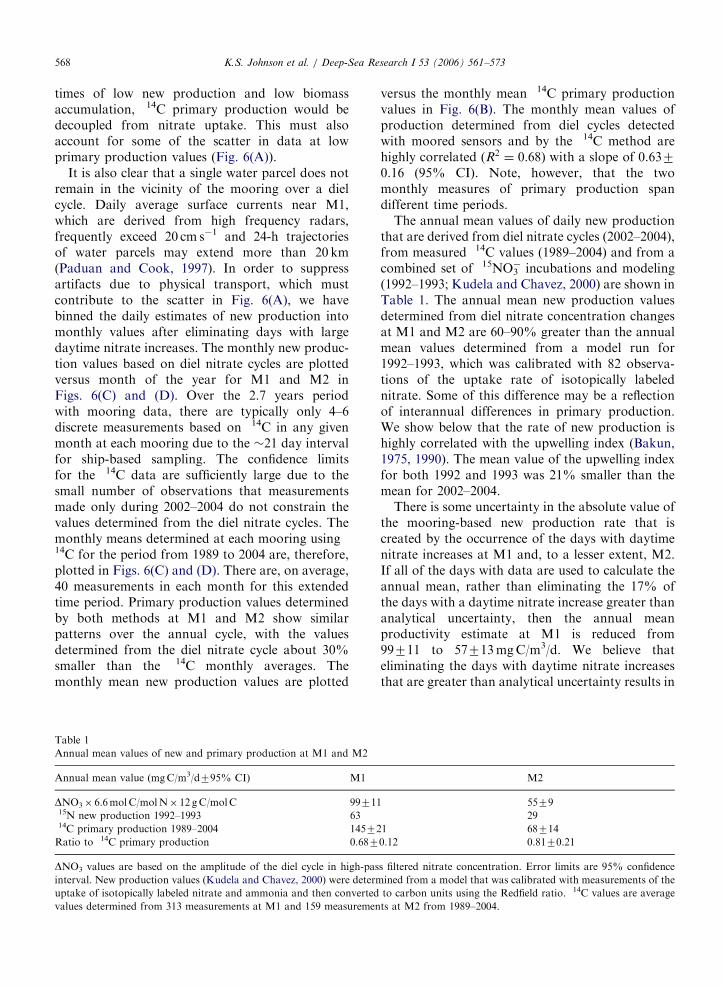
times of low new production and low biomassaccumulation, 14C primary production would bedecoupled from nitrate uptake. This must alsoaccount for some of the scatter in data at lowprimary production values (Fig. 6(A)).
It is also clear that a single water parcel does notremain in the vicinity of the mooring over a dielcycle. Daily average surface currents near M1,which are derived from high frequency radars,frequently exceed 20 cm s�1 and 24-h trajectoriesof water parcels may extend more than 20 km(Paduan and Cook, 1997). In order to suppressartifacts due to physical transport, which mustcontribute to the scatter in Fig. 6(A), we havebinned the daily estimates of new production intomonthly values after eliminating days with largedaytime nitrate increases. The monthly new produc-tion values based on diel nitrate cycles are plottedversus month of the year for M1 and M2 inFigs. 6(C) and (D). Over the 2.7 years periodwith mooring data, there are typically only 4–6discrete measurements based on 14C in any givenmonth at each mooring due to the �21 day intervalfor ship-based sampling. The confidence limitsfor the 14C data are sufficiently large due to thesmall number of observations that measurementsmade only during 2002–2004 do not constrain thevalues determined from the diel nitrate cycles. Themonthly means determined at each mooring using14C for the period from 1989 to 2004 are, therefore,plotted in Figs. 6(C) and (D). There are, on average,40 measurements in each month for this extendedtime period. Primary production values determinedby both methods at M1 and M2 show similarpatterns over the annual cycle, with the valuesdetermined from the diel nitrate cycle about 30%smaller than the 14C monthly averages. Themonthly mean new production values are plotted
Table 1
Annual mean values of new and primary production at M1 and M2
Annual mean value (mgC/m3/d795% CI) M1
DNO3� 6.6molC/molN� 12 gC/molC 9971115N new production 1992–1993 6314C primary production 1989–2004 14572
Ratio to 14C primary production 0.687
DNO3 values are based on the amplitude of the diel cycle in high-pas
interval. New production values (Kudela and Chavez, 2000) were determ
uptake of isotopically labeled nitrate and ammonia and then converted
values determined from 313 measurements at M1 and 159 measuremen
versus the monthly mean 14C primary productionvalues in Fig. 6(B). The monthly mean values ofproduction determined from diel cycles detectedwith moored sensors and by the 14C method arehighly correlated (R2 ¼ 0:68) with a slope of 0.6370.16 (95% CI). Note, however, that the twomonthly measures of primary production spandifferent time periods.
The annual mean values of daily new productionthat are derived from diel nitrate cycles (2002–2004),from measured 14C values (1989–2004) and from acombined set of 15NO3
� incubations and modeling(1992–1993; Kudela and Chavez, 2000) are shown inTable 1. The annual mean new production valuesdetermined from diel nitrate concentration changesat M1 and M2 are 60–90% greater than the annualmean values determined from a model run for1992–1993, which was calibrated with 82 observa-tions of the uptake rate of isotopically labelednitrate. Some of this difference may be a reflectionof interannual differences in primary production.We show below that the rate of new production ishighly correlated with the upwelling index (Bakun,1975, 1990). The mean value of the upwelling indexfor both 1992 and 1993 was 21% smaller than themean for 2002–2004.
There is some uncertainty in the absolute value ofthe mooring-based new production rate that iscreated by the occurrence of the days with daytimenitrate increases at M1 and, to a lesser extent, M2.If all of the days with data are used to calculate theannual mean, rather than eliminating the 17% ofthe days with a daytime nitrate increase greater thananalytical uncertainty, then the annual meanproductivity estimate at M1 is reduced from99711 to 57713mgC/m3/d. We believe thateliminating the days with daytime nitrate increasesthat are greater than analytical uncertainty results in
M2
5579
29
1 68714
0.12 0.8170.21
s filtered nitrate concentration. Error limits are 95% confidence
ined from a model that was calibrated with measurements of the
to carbon units using the Redfield ratio. 14C values are average
ts at M2 from 1989–2004.
ARTICLE IN PRESS
Nitrate (µM)0 5 10 15 20
Prim
. Pro
d. (
mg
C m
-3 d
-1)
0
100
200
300
M1 ISUSM2 ISUSM1 14-CM2 14-C
Fig. 7. Monthly mean primary production rates at the M1 and
M2 moorings plotted versus mean nitrate concentration. Values
of new primary production determined from the amplitude of the
diel nitrate cycle for all data in each month from February 2002
to June 2004 are shown as black circles (M1) and blue triangles
(M2). The nitrate amplitudes are converted to carbon units with
the Redfield ratio. Black and blue lines are Model II regressions
fitted to the M1 and M2 data, respectively. Primary production
data from 14C incubations determined from 1989 through spring
2004 and averaged by month of year are shown as open red
circles (M1) and open green triangles (M2). The October 2002
data point at M2, which is circled, shows the behavior that might
be expected if iron limitation is prevalent.
K.S. Johnson et al. / Deep-Sea Research I 53 (2006) 561–573 569
the more accurate estimate of new production.First, the diel variation in wind at M1 creates aplausible, physical mechanism for producing theincreases at M1. Second, the estimates of the f-ratioin Table 1, based on sensors at both the M1 and M2moorings, yield values of 0.68 and 0.81, respectively.Values derived from the slopes in Fig. 6(A) or (B)(0.73 and 0.63, respectively) are not significantlydifferent. These estimates suggest that some 70% ofthe annual primary production is based on nitrateuptake. The f-ratios are reduced by nearly two-foldif all of the diel cycles, including ones with a daytimenitrate increase, are used to calculate the annualnew production. Two-fold lower f-ratios wouldrequire a large amount of the primary productionto be based on ammonia, rather than nitrate.However, concentrations of ammonia in MontereyBay are generally o0.4 mM (Kudela and Dugdale,2000; FC, unpublished data). Ammonia cannotsupply the large amounts of fixed nitrogen thatare required to support large rates of primaryproduction (Fig. 6(A)). Large primary productionrates will require correspondingly large decreases inthe concentration of fixed nitrogen in the Bay andonly nitrate appears to be present in sufficientconcentration. Thus, we believe that primary pro-duction estimates calculated by eliminating thedays with daytime nitrate increase are the mostaccurate.
The daytime drawdown in nitrate concentrationwill underestimate new production if nitrate isresupplied to the euphotic zone during the day. Inthis case, the diel amplitude would represent the rateof new production minus the rate of resupply. Thismay be a significant issue in systems where verticaltransport processes dominate nutrient supply. Insuch systems, the daytime rate could be correctedfor resupply by estimating the resupply rate fromthe nighttime rate of increase. However, lateraladvection from the upwelling center at Point AnoNuevo (Fig. 1) dominates nitrate transport at thesurface in the region offshore of Monterey Bay.Our calculations presume that we can treat thistransport as a homogeneous water mass that flowsby the mooring and the daytime drawdown ofnitrate is due exclusively to primary production ofnew biomass. Of course, this cannot be entirelycorrect on a daily basis, but the monthly averages(e.g. Fig. 6(B)) reported here suggest that the errorsare small or must tend to cancel after we eliminatethe obvious exceptions when large daytime nitrateincreases occur.
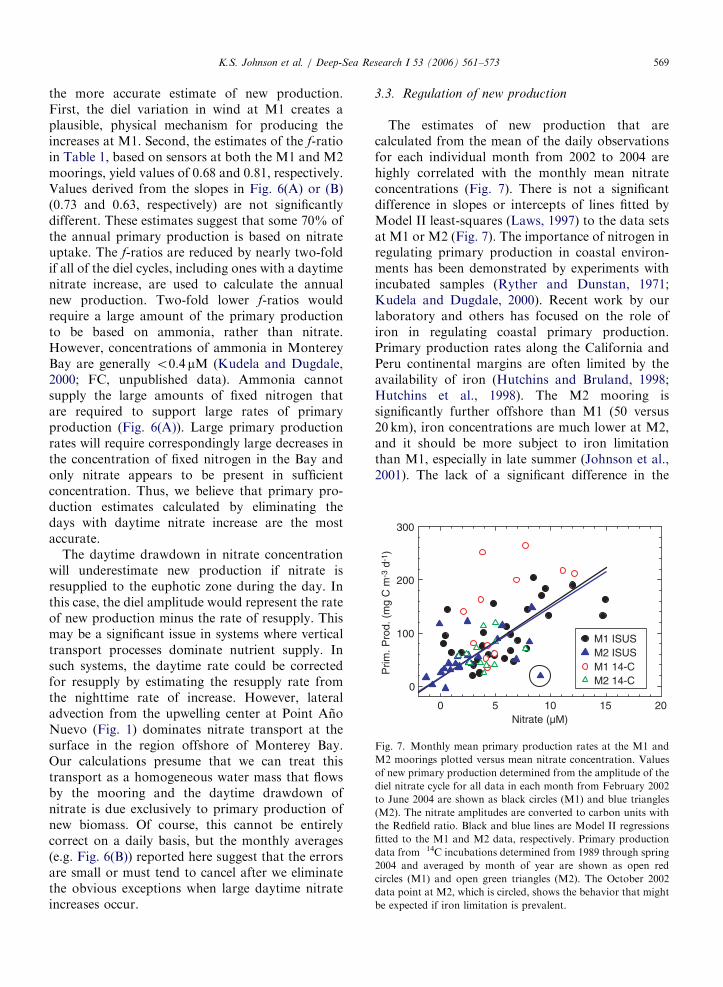
3.3. Regulation of new production
The estimates of new production that arecalculated from the mean of the daily observationsfor each individual month from 2002 to 2004 arehighly correlated with the monthly mean nitrateconcentrations (Fig. 7). There is not a significantdifference in slopes or intercepts of lines fitted byModel II least-squares (Laws, 1997) to the data setsat M1 or M2 (Fig. 7). The importance of nitrogen inregulating primary production in coastal environ-ments has been demonstrated by experiments withincubated samples (Ryther and Dunstan, 1971;Kudela and Dugdale, 2000). Recent work by ourlaboratory and others has focused on the role ofiron in regulating coastal primary production.Primary production rates along the California andPeru continental margins are often limited by theavailability of iron (Hutchins and Bruland, 1998;Hutchins et al., 1998). The M2 mooring issignificantly further offshore than M1 (50 versus20 km), iron concentrations are much lower at M2,and it should be more subject to iron limitationthan M1, especially in late summer (Johnson et al.,2001). The lack of a significant difference in the
ARTICLE IN PRESSK.S. Johnson et al. / Deep-Sea Research I 53 (2006) 561–573570
relationship between new production and nitrateconcentration at M1 and M2 suggests that decreasesin iron concentration at M2 do not act as the majorcontrol on primary production. Large-scale ironlimitation might also produce a significant numberof data points in Fig. 7 that deviated well below theleast-square trend lines due to high nitrate, lowproductivity conditions. Only one of the monthlyintervals with ISUS sensor data (October 2002 atM2, which is circled in Fig. 7) has the appearance offalling below the overall trend observed at M1 andM2. Lower annual new production values at M2occur because the average nitrate concentration issignificantly lower than at M1, not necessarilybecause of greater iron limitation. Iron limitation
1/1/02 7/1/02 1/1/03 7/1/0
New
Pro
d. (
mg
C m
-3 d
-1)
0
100
200
300
Upwelling Index
-100 0 100 200 300 400 500
Nitr
ate
(µM
)
0
5
10
15
20
(A) (B
(C)
Fig. 8. Relationship between nitrate, primary production and the rate
ISUS sensors for each month from 2002 to 2004 at the M1 (triangles) an
month at 361N, 1221W. The units for upwelling index are m3 of wa
production values at the M1 (triangles) and M2 (circles) moorings versu
index (crosses) and new primary production determined with ISUS sens
for M1 and M2 represent months where less than 8 days of mooring dat
were downloaded from the website http://www.pfel.noaa.gov.
may be more prevalent further to the south ofMonterey Bay, where the continental shelf isnarrower and iron concentrations are lower (Bru-land et al., 2001; Chase et al., 2005). Long-termdeployment of in situ nitrate sensors in thatregion would provide an interesting test of thesehypotheses.
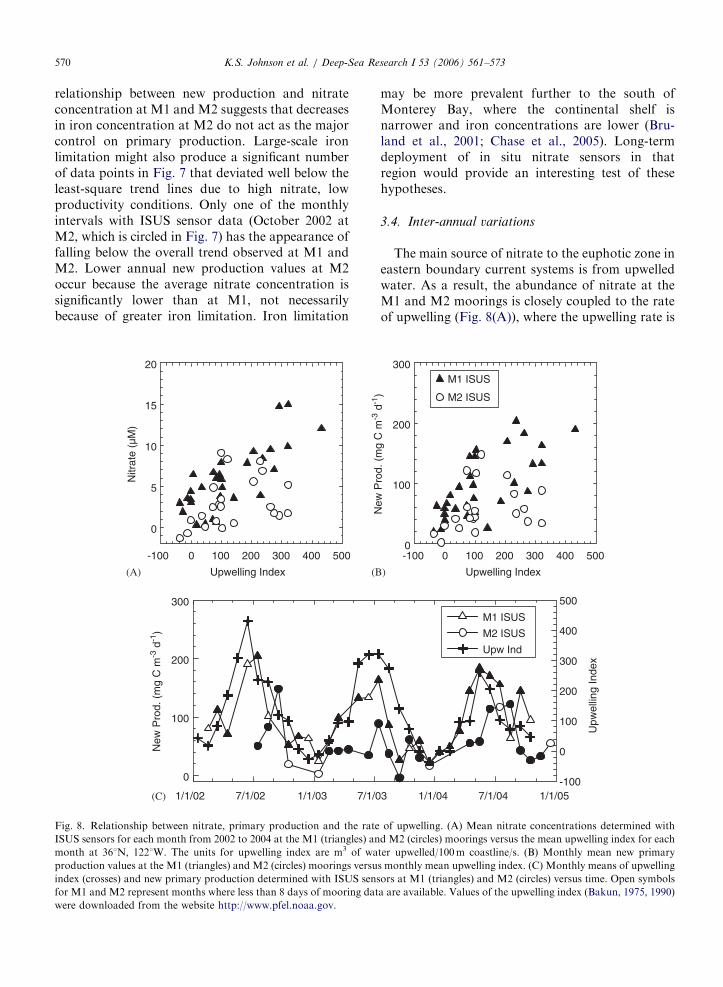
3.4. Inter-annual variations
The main source of nitrate to the euphotic zone ineastern boundary current systems is from upwelledwater. As a result, the abundance of nitrate at theM1 and M2 moorings is closely coupled to the rateof upwelling (Fig. 8(A)), where the upwelling rate is
3 1/1/04 7/1/04 1/1/05
Upw
ellin
g In
dex
-100
0
100
200
300
400
500
Upwelling Index
-100 0 100 200 300 400 500
New
Pro
d. (
mg
C m
-3 d
-1)
0
100
200
300M1 ISUS
M2 ISUS
M1 ISUS
M2 ISUS
Upw Ind
)
of upwelling. (A) Mean nitrate concentrations determined with
d M2 (circles) moorings versus the mean upwelling index for each
ter upwelled/100m coastline/s. (B) Monthly mean new primary
s monthly mean upwelling index. (C) Monthly means of upwelling
ors at M1 (triangles) and M2 (circles) versus time. Open symbols
a are available. Values of the upwelling index (Bakun, 1975, 1990)
ARTICLE IN PRESS
Date
7/03 10/03 1/04 4/04 7/04
Chl
orop
hyll
(µg/
L)
0
5
10
15
20
Radio.
GFF
Model
Radiometer Chloro (µg/L)
0 2 4 6 8
Mod
el C
hlor
o. (
µg/L
)
0
2
4
6
8
10
12
(A)
(B)
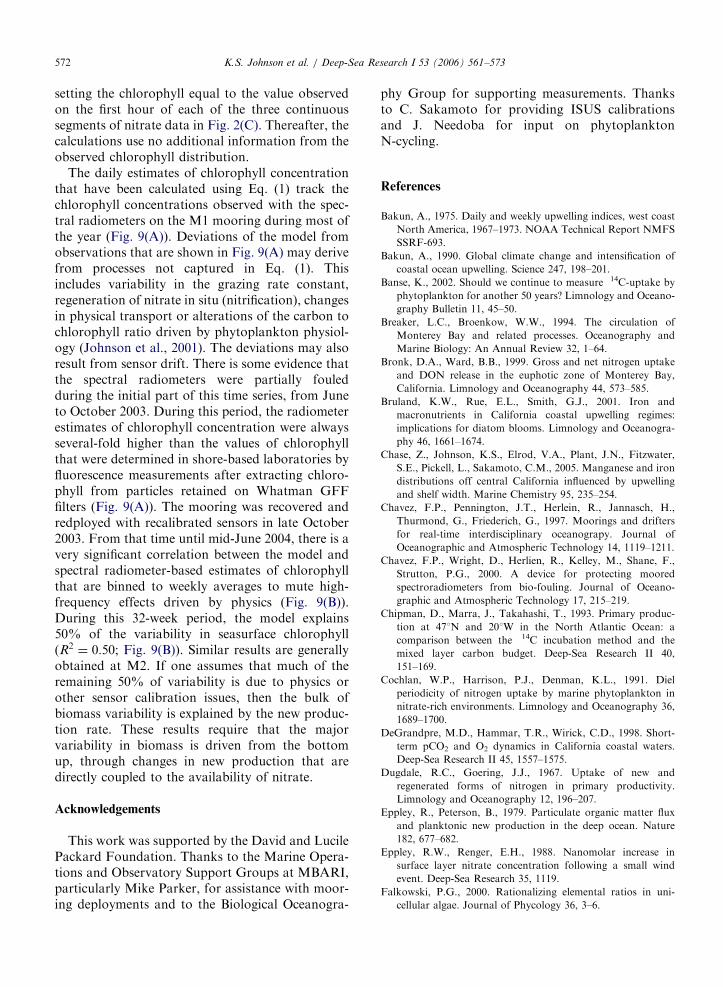
Fig. 9. Predicted values of biomass at the M1 mooring derived
from the diel cycles of nitrate. (A) The hourly mean values of
chlorophyll derived from the model (Eq. (1)) for the period from
15 June 2003 to 15 June 2004 are plotted versus time as the black
line. The green line gives in situ chlorophyll values calculated
from observations of light attenuation at 490 nm from the surface
to 10m at the mooring. Extracted chlorophyll values measured in
discrete samples collected at the mooring and filtered through
Whatman GFF filters are shown as red symbols. (B) The weekly
mean values of chlorophyll calculated from the model are plotted
versus the weekly mean values of chlorophyll calculated from
light attenuation at 490 nm for the period from 8 November 2003
to 14 June 2004. The solid line is the Model II regression
equation, Model Chl ¼ �0.4[71.4]+1.2[70.3]Radio Chl,
R2 ¼ 0:50.
K.S. Johnson et al. / Deep-Sea Research I 53 (2006) 561–573 571
reported as an upwelling index that is derived fromwind stress and coastline orientation (Bakun, 1975,1990). New production rates, which are correlatedwith nitrate concentration, are also linked to therate of upwelling (Fig. 8(B)). Inter-annual variationsin the rate of upwelling are the frequently seen. Asmentioned above, rates of upwelling in 1992 and1993 were 21% smaller than the annual means in2002–2004. Seasonal and interannual changes in thestrength and persistence of upwelling favorablewinds produce variations in monthly mean produc-tivity values for the same month in different years(Fig. 8(C)). It has been hypothesized that long-termwarming will lead to increased upwelling as landwarms faster than the sea (Bakun, 1990; Snyder etal., 2003). The results presented here demonstrate adirect means to estimate the impact of such futurechanges in climate on new production in the ocean.
3.5. New production-based model of biomass
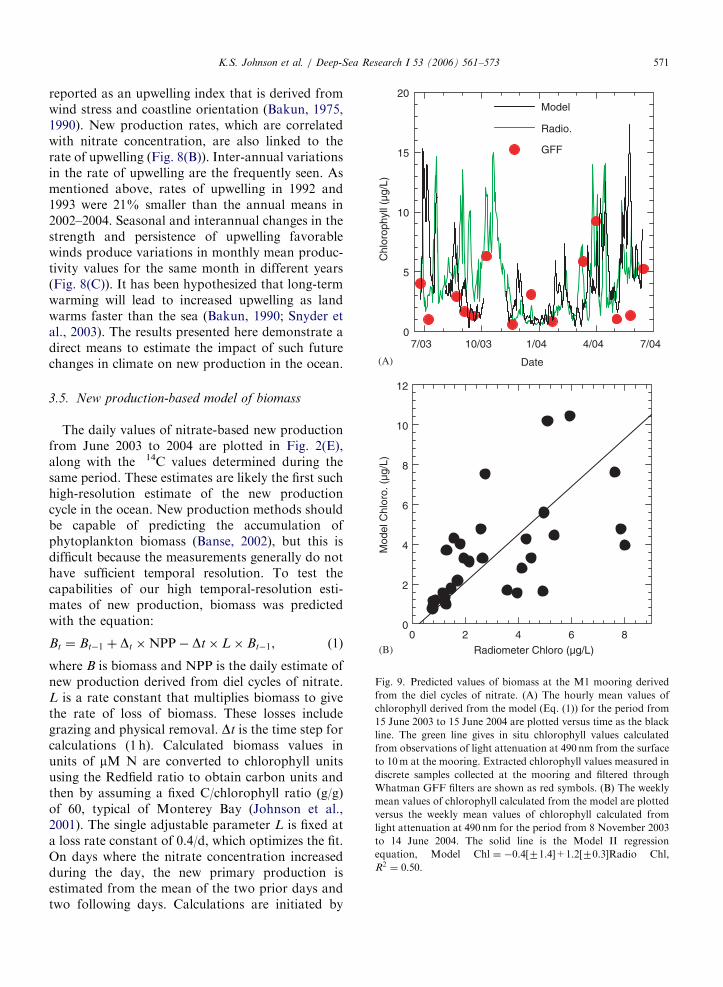
The daily values of nitrate-based new productionfrom June 2003 to 2004 are plotted in Fig. 2(E),along with the 14C values determined during thesame period. These estimates are likely the first suchhigh-resolution estimate of the new productioncycle in the ocean. New production methods shouldbe capable of predicting the accumulation ofphytoplankton biomass (Banse, 2002), but this isdifficult because the measurements generally do nothave sufficient temporal resolution. To test thecapabilities of our high temporal-resolution esti-mates of new production, biomass was predictedwith the equation:
Bt ¼ Bt�1 þ Dt �NPP� Dt� L� Bt�1, (1)
where B is biomass and NPP is the daily estimate ofnew production derived from diel cycles of nitrate.L is a rate constant that multiplies biomass to givethe rate of loss of biomass. These losses includegrazing and physical removal. Dt is the time step forcalculations (1 h). Calculated biomass values inunits of mM N are converted to chlorophyll unitsusing the Redfield ratio to obtain carbon units andthen by assuming a fixed C/chlorophyll ratio (g/g)of 60, typical of Monterey Bay (Johnson et al.,2001). The single adjustable parameter L is fixed ata loss rate constant of 0.4/d, which optimizes the fit.On days where the nitrate concentration increasedduring the day, the new primary production isestimated from the mean of the two prior days andtwo following days. Calculations are initiated by
ARTICLE IN PRESSK.S. Johnson et al. / Deep-Sea Research I 53 (2006) 561–573572
setting the chlorophyll equal to the value observedon the first hour of each of the three continuoussegments of nitrate data in Fig. 2(C). Thereafter, thecalculations use no additional information from theobserved chlorophyll distribution.
The daily estimates of chlorophyll concentrationthat have been calculated using Eq. (1) track thechlorophyll concentrations observed with the spec-tral radiometers on the M1 mooring during most ofthe year (Fig. 9(A)). Deviations of the model fromobservations that are shown in Fig. 9(A) may derivefrom processes not captured in Eq. (1). Thisincludes variability in the grazing rate constant,regeneration of nitrate in situ (nitrification), changesin physical transport or alterations of the carbon tochlorophyll ratio driven by phytoplankton physiol-ogy (Johnson et al., 2001). The deviations may alsoresult from sensor drift. There is some evidence thatthe spectral radiometers were partially fouledduring the initial part of this time series, from Juneto October 2003. During this period, the radiometerestimates of chlorophyll concentration were alwaysseveral-fold higher than the values of chlorophyllthat were determined in shore-based laboratories byfluorescence measurements after extracting chloro-phyll from particles retained on Whatman GFFfilters (Fig. 9(A)). The mooring was recovered andredployed with recalibrated sensors in late October2003. From that time until mid-June 2004, there is avery significant correlation between the model andspectral radiometer-based estimates of chlorophyllthat are binned to weekly averages to mute high-frequency effects driven by physics (Fig. 9(B)).During this 32-week period, the model explains50% of the variability in seasurface chlorophyll(R2 ¼ 0:50; Fig. 9(B)). Similar results are generallyobtained at M2. If one assumes that much of theremaining 50% of variability is due to physics orother sensor calibration issues, then the bulk ofbiomass variability is explained by the new produc-tion rate. These results require that the majorvariability in biomass is driven from the bottomup, through changes in new production that aredirectly coupled to the availability of nitrate.
Acknowledgements
This work was supported by the David and LucilePackard Foundation. Thanks to the Marine Opera-tions and Observatory Support Groups at MBARI,particularly Mike Parker, for assistance with moor-ing deployments and to the Biological Oceanogra-
phy Group for supporting measurements. Thanksto C. Sakamoto for providing ISUS calibrationsand J. Needoba for input on phytoplanktonN-cycling.
References
Bakun, A., 1975. Daily and weekly upwelling indices, west coast
North America, 1967–1973. NOAA Technical Report NMFS
SSRF-693.
Bakun, A., 1990. Global climate change and intensification of
coastal ocean upwelling. Science 247, 198–201.
Banse, K., 2002. Should we continue to measure 14C-uptake by
phytoplankton for another 50 years? Limnology and Oceano-
graphy Bulletin 11, 45–50.
Breaker, L.C., Broenkow, W.W., 1994. The circulation of
Monterey Bay and related processes. Oceanography and
Marine Biology: An Annual Review 32, 1–64.
Bronk, D.A., Ward, B.B., 1999. Gross and net nitrogen uptake
and DON release in the euphotic zone of Monterey Bay,
California. Limnology and Oceanography 44, 573–585.
Bruland, K.W., Rue, E.L., Smith, G.J., 2001. Iron and
macronutrients in California coastal upwelling regimes:
implications for diatom blooms. Limnology and Oceanogra-
phy 46, 1661–1674.
Chase, Z., Johnson, K.S., Elrod, V.A., Plant, J.N., Fitzwater,
S.E., Pickell, L., Sakamoto, C.M., 2005. Manganese and iron
distributions off central California influenced by upwelling
and shelf width. Marine Chemistry 95, 235–254.
Chavez, F.P., Pennington, J.T., Herlein, R., Jannasch, H.,
Thurmond, G., Friederich, G., 1997. Moorings and drifters
for real-time interdisciplinary oceanograpy. Journal of
Oceanographic and Atmospheric Technology 14, 1119–1211.
Chavez, F.P., Wright, D., Herlien, R., Kelley, M., Shane, F.,
Strutton, P.G., 2000. A device for protecting moored
spectroradiometers from bio-fouling. Journal of Oceano-
graphic and Atmospheric Technology 17, 215–219.
Chipman, D., Marra, J., Takahashi, T., 1993. Primary produc-
tion at 471N and 201W in the North Atlantic Ocean: a
comparison between the 14C incubation method and the
mixed layer carbon budget. Deep-Sea Research II 40,
151–169.
Cochlan, W.P., Harrison, P.J., Denman, K.L., 1991. Diel
periodicity of nitrogen uptake by marine phytoplankton in
nitrate-rich environments. Limnology and Oceanography 36,
1689–1700.
DeGrandpre, M.D., Hammar, T.R., Wirick, C.D., 1998. Short-
term pCO2 and O2 dynamics in California coastal waters.
Deep-Sea Research II 45, 1557–1575.
Dugdale, R.C., Goering, J.J., 1967. Uptake of new and
regenerated forms of nitrogen in primary productivity.
Limnology and Oceanography 12, 196–207.
Eppley, R., Peterson, B., 1979. Particulate organic matter flux
and planktonic new production in the deep ocean. Nature
182, 677–682.
Eppley, R.W., Renger, E.H., 1988. Nanomolar increase in
surface layer nitrate concentration following a small wind
event. Deep-Sea Research 35, 1119.
Falkowski, P.G., 2000. Rationalizing elemental ratios in uni-
cellular algae. Journal of Phycology 36, 3–6.
ARTICLE IN PRESSK.S. Johnson et al. / Deep-Sea Research I 53 (2006) 561–573 573
Fitzwater, S.E., Knauer, G.A., Martin, J.H., 1982. Metal
contamination and its effects on primary production mea-
surements. Limnology and Oceangraphy 27, 544–551.
Fitzwater, S.E., Johnson, K.S., Elrod, V.A., Ryan, J.P., Coletti,
L.J., Tanner, S.J., Gordon, R.M., Chavez, F.P., 2003. Iron,
nutrient and phytoplankton biomass relationships in upwelled
waters of the California coastal system. Continental Shelf
Research 23, 1523–1544.
Harvey, H.W., 1928. Biological Chemistry and Physics of Sea
Water. MacMillan, New York, 194pp.
Hutchins, D.A., Bruland, K.W., 1998. Iron-limited diatom
growth and Si:N uptake in a coastal upwelling regime.
Nature 393, 561–564.
Hutchins, D.A., DiTullio, G.R., Zhang, Y., Bruland, K.W., 1998.
An iron limitation mosaic in the California upwelling regime.
Limnology and Oceanography 43, 1037–1054.
Johnson, K.S., Coletti, L.J., 2002. In situ ultraviolet spectro-
photometry for high resolution and long term monitoring of
nitrate, bromide and bisulfide in the ocean. Deep-Sea
Research I 49, 1291–1305.
Johnson, K.S., Chavez, F.P., Elrod, V.A., Fitzwater, S.E.,
Pennington, J.T., Buck, K.R., Walz, P.M., 2001. The
annual cycle of iron and the biological response in central
California coastal waters. Geophysical Research Letters 28,
1247–1250.
Kudela, R.M., Chavez, F.P., 2000. Modeling the impact of the
1992 El Nino on new production in Monterey Bay,
California. Deep-Sea Research II 47, 1055–1076.
Kudela, R.M., Dugdale, R.C., 2000. Nutrient regulation of
phytoplankton productivity in Monterey Bay, California.
Deep-Sea Research II 47, 1023–1053.
Laws, E.A., 1997. Mathematical Methods for Oceanographers:
An Introduction. Wiley-Interscience, New York, 343pp.
Marra, J., 2002. In: Williams, P.J.le.B., Thomas, D.N., Reynolds,
C.S. (Eds.), Phytoplankton Productivity: Carbon Assimila-
tion in Marine and Freshwater Ecosystems. Blackwell,
London, pp. 78–108.
Morel, A., 1988. Optical modeling of the upper ocean in relation
to its biogenous matter content (case 1 water). Journal of
Geophysical Research 93, 10749–10768.
Paduan, J.D., Cook, M.S., 1997. Mapping surface currents in
Monterey Bay with CODAR-type HF radar. Oceanography
10, 49–52.
Pennington, J.T., Chavez, F.P., 2000. Seasonal fluctuations of
temperature, salinity, nitrate, chlorophyll and primary pro-
duction at station H3/M1 over 1989–1996 in Monterey Bay,
California. Deep-Sea Research II 47, 947–973.
Press, W.H., Flannery, B.P., Teukolsky, S.A., Vetterling, W.T.,
1986. Numerical Recipes: The Art of Scientific Computing.
Cambridge University Press, Cambridge, 818pp.
Redfield, A.C., Ketchum, B.H., Richards, F.A., 1963. In: Hill,
M.N. (Ed.), The Sea, vol. II. Interscience, New York,
pp. 26–77.
Rubin, S.I., 2003. Carbon and nutrient cycling in the upper water
column across the polar frontal zone and antarctic circumpo-
lar current along 170W. Global Biogeochemical Cycles 17,
1087.
Ryther, J.H., Dunstan, W.M., 1971. Nitrogen, phosphorus, and
eutrophication in the coastal marine environment. Science 17,
1008–1013.
Ryther, J.H., Menzel, D.W., Vacarro, R.F., 1961. Diurnal
variations in some chemical and biological properties of the
Sargasso Sea. Limnology and Oceanography 6, 149–153.
Service, S.K., Rice, J.A., Chavez, F.P., 1998. Relationship
between physical and biological variables during the upwel-
ling period in Monterey Bay, CA. Deep-Sea Research II 45,
1669–1685.
Siegel, D.A., Dickey, T.D., Washburn, L., Hamilton, M.K.,
Mitchell, B.G., 1989. Optical determination of particulate
abundance and production variations in the oligotrophic
ocean. Deep-Sea Research 36, 211–222.
Skogsberg, T., 1936. Hydrography of Monterey Bay, California.
Thermal conditions, 1929–1933. Transactions of the Amer-
ican Philosophical Society 29, 1–152.
Skogsberg, T., Phelps, A., 1946. Hydrography of Monterey Bay,
California. Thermal conditions, Part II, 1934–1937. Proceed-
ings of the American Philosophical Society 90, 350–386.
Snyder, M.A., Sloan, L.C., Diffenbaugh, N.S., Bell, J.L., 2003.
Future climate change and upwelling in the California
Current. Geophysical Research Letters 30, 1823.
Wong, C.S., Waser, N.A.D., Nojiri, Y., Whitney, F.A., Page,
J.S., Zeng, J., 2002. Seasonal cycles of nutrients and dissolved
inorganic carbon at high and mid latitudes in the North
Pacific Ocean during the Skaugran cruises: determination of
new production and nutrient uptake ratios. Deep-Sea
Research II 49, 5317–5338.
Zhang, J.-Z., Wanninkhof, R., Lee, K., 2001. Enhanced new
production observed from the diurnal cycle of nitrate in an
oligotrophic anticyclonic eddy. Geophysical Research Letters
28, 1579–1582.