Embed Size (px)
Citation preview

METALLURGICAL CHARACTERISTICS
OF HIGH STRENGTH STRUCTURAL MATERIALS
[Seventh Quarterly Report]
a

CONTENTS
Abstract ................. .. ...................Problem Status ............. ................... iiiAuthorization ............... ................... iii
INTRODUCTION ................. ................... I
TITANIUM ALLOYS ................ .................. 4
The Titanium Fracture ToughnessIndex Diagram ........... ............... 4
Heat-Treatment Studies ........ ........... 6
Alloy Development Studies ....... .......... 8
Electron Beam Welding ......... ............ 8
EXPLOSION BULGE TESTS OF 5Ni-Cr-Mo-VWF.. T)MENTS .................... ................... 9
,,iPLOSION BULGE TESTS OF EXPERIMENTALMARAGCT'G STEEL WELDMENT.S .... .......... .... . 15
LOW CYCLE FATIGUE CRACK PROPAGATION IN D6ACAND 433J HIGH STRENGTH STRUCTURAL STEELS ..... ... 19
Materials and Procedure .... ........... .. 20
Strain Range Effects .... .......... ... 21
Wet Fatigue ............. ............. 22
Compar.ative Fatigue Performance ....... ...... 23
Conclusions ............................... 25.
ALUMINUM ALLOYS ................ .................. 2b
Fracture Toughness Index Diagram ............. 26
Drop-weight Tear Test andExplosion Tear Test Results.......... . 27

CONTENTS
PLANE STRAIN FRACTURE TOUGHNESSTESTING OF TITANIUM ........ ............... .. 28
Materials and Procedure .... ........... ... 29
Test Results .......... ............... .. 29
Discussion .......... ................. .. 32
REFERENCES ..................... ................... 33

ABSTRACT
A progress report covering research studies in highstrength structural materials, conducted in the periodJanuary 1965 to April 1965, is presented. Fracturetoughness index diagrams are presented for titaniumand aluminum that define the expected yield strengthregion of high fracture toughness, requiring plasticoverloads for fracture propagation, and low fracturetoughness, requiring elastic stresses for fracturepropagation,and linear elastic fracture mechanicstechniques for determining elastic stress level re-quired for fracture. Results on heat treatment andalloy development studies are reported for severaltitanium alloys and drop-weight tear test results onsome commercially produced aluminum alloys are de-scribed. Results of plane strain fracturc toughnesstests on unalloyed titanium using single-edge-notchedand side-notched specimens are reported. Explosionbulge tests on a series of 5Ni-Cr-Mo-V and maragingsteel weldrrents are described in which the resultsappear encouraging. Low cycle fatigue crack propa-gation studies on D6AC and 4335 high strength steelsare described in which an acceleration of fatiguecrack growth rate was seen for each steel in a saltwater environment. The 4335 steel test results in-dicated a stress corrosicn cracking condition operat-ing in addition to the action of fatigue cracking.
PROBLEM STATUS
This is a progress report; work is continuing.
ALTHORIZATION
NRL Problem F01-17: Project SP-00405NR'L Problem N10-05; Projects SF 020-01-01-0724,
RR 007-01-46-5405. and 'W-041 (RO5-24A)NRL Problem MOl-18; Projects SF 020-01-05-0731,
RR 007-01-46-5420, WW-041 (RO5-24B) and MIPR Eng-Nav-65-12NRL Problem M03-01: Projects SF 020-01-01-0850 a'-d
gF 020-01-01-085:
N'.::~us -ia s'~r~.::eG T~iv 1~ I lcv

METALLURGICAL CHARACTERISTICS
OF HIGH STRENGTH STRUCTURAL MATERIALS
[Seventh Quarterly Report]
INTRODUCTION
This is the seventh status report covering the U.S. NavalResearch Laboratory Metallurgy Division's long-rangeprogram of determining the performance characteristics ofhigh strength materials. The program is primarily aimedat determining the fracture toughness characteristics ofthese materials, using standard and newly-developedlaboratory test methods, as well as establishii.o thesignificance of the laboratory tests for predictLnv theservice performance of the materials in large complexstructures. Although the program is aimed at Navy re-quirements, the information that is developed is pertinentto all structural uses of these high strength materials.Quenched and tempered (Q&T) steels, maraging steels,titanium alloys, and aluminum alloys are the principalhigh strength materials currently under investigation.
The fracture toughness index diagrams for titanium andaluminum have recently been modified to indicate the ex-pected yield strength regions of high fracture toughnessand low fracture toughness for optimized and nearly opti-mized materials. The yield strength range of low fracturetoughness indicateF the region where the linear elasticfracture mecbanic-, approach to fracture toughness deter-mination will be required. The explosion tear test, thedrop-weight tear test, and the yield strength rela*Jon-ships, which are the frame-work of the diagrams, indicatethe latest test results These include explosion tear anddrop-weight tear test results for the 7079, 6061, and5086 aluminum alloys.
The results of heat-treatment studies on the alloysTi-6A1-4Zr-2Mo and Ti-6A1-4Zr-2Sn-.5Mo-.5V are described.On the basis of the Charpy V test. these alloys have shownsome of the best continations of strength and toughness.Preliminary data concerning ingot and plate properties ofa high purity Ti-7A1-3Cb-2Sn al!oy made at NRL are pre-sented. The result3 of some initial plane strain fracturetoughness tests on high interstitial unalloyed titanium
II
i

are discussed in which t.ngle-edge-notched and side-notched specimens were used. The results indicate thatside-ixotching is helpful in detecting crack instability,but its usefulness beyond that in a practical sense isdependent upon the development of an a-'alytical methodfor treating the side-notched specimen.
Explosion bulge test results are reported for a seriesof 5Ni-Cr-Mo-V weldments and for weldments of experi-mental 12Ni-5Cr-3Mo grade maraging steel. The 5Ni-Cr-Mo-V weldments were made using stick electrodes and wereslightly overmatching, 133-136-ksi yield strength (YS)for the plate and 140-145-ksi YS for the weld metal.The general performance of these weldments in the explo-sion bulge test were good. The results with the 12Ni-5Xr-3Mo maraging steel weldments were also encouraging.In both cases, dpmonstration of duplication and repro-ducibility of results using weld ,.ire from large produc-tion heats will be required before any fabrication con-fidence can be established.
Low cycle fatigue crack propagation studies for D6AC and4335 high strength steels in salt water show a gross ac-celeration of fatigue crack growth rate at very low strainlevels for both steels compared to crack growth rate resultsobtained in air. A multiplicity of surface cracks formedradially from the fatigue crack front ii. the 4335 steelspecimens tested in salt water. The size and number ofthese cracks increased with increasing levels of appliedto.al strain range, indicating that for this materialthe high crack growth rate observed in salt water may bedue to the combined action of fatigue cracking and stresscorrosion cracking. A comparative summary of the low cyclefatigue performPance of some other widely used steels isalso presented.
NOTE
A summary report covering the material presented in theseven quarterly progress reports and other pertinent in-formaticn has been .ssucd separately as NRL Report 6300,
"Review of Concepts andStatus of Procedures for Fracture-Safe Designof Complex Welded Structures Involving Metals
of Low to Ultra-High Strength Levels".

Copies of this report are being forwarded to the distri-bution listing of the quarterly report series. The Abstractof NRL Report 6300 is provided below to indicate the cover-age of this special summary report
"ABSTRACT
"This report presents integrated analyses. and substan-tiating data on problems of metallurgical optimization andsolutions to fracture-safe design and fabrication of largewelded structures, utilizing high strength metals. Theapparent complexities of attaining practical engineeringuse of high strength metals derive primarily from lack ofappreciation of the close interrelationships that existbetween the intrinsic susceptibilitie; of these metals tovarious failure modes and the intrinsi- structuril mechanicsfeatures 9f the structures Metals of high intrinsic re-sistance to failure must be matched only to structures thatare exactly stress analyzable and thereby are restricted todesigns of the utmost attainable simplicity and to fabri-cation by techniques of utmost prcision. Such separationsare basic to the theme of this report and provide the"starting point" for analyses of the potentials of utiliz-ing various metals, within the range of metallurgicZllyattainable strength levels. The metallurgic"l problemsof optimizing the base metals, welds and heat-affectedzones have been complicated by the absence of parametric"frames of reference" required as bases of comparison.The absence of such broad-base guide lines arises from thefailure to evolve an adequate understanding of the signi-ficance of conventional engineering tests and from theprevious absence of definitive tests that provide assess-ment of failure mode sensitivities across the full spectrumof materials and attainable itrcngth levels. The develop-ment of such test procedures has been one of the principalaims of t',e investigations conducted by the authors andtheir associates. The spectrum view tha, has emergedclearly defines metals and specif1c strength ranges thatprovide for matching to applications involving conven-tional fabrication of complex structures as compared tothose that require exact design and fabrication. Thus.applications that may provide fracture-safe design basedon the use of simple engineering test methods may beseparated froi,: applications that require the exact mathe-mati.al analyses of fracture mechanics."

TITANIUM ALLOYS
(R.J. Goode, D.G. Howe, and R.W. Huber)
Fracture toughness studies of a spectrum of titanium d
alloys in the form of 1-in.-thick plates have providedthe only reliable means to date of referencing the frac-ture toughness characteristics of the full spectrum oftitanium alloys in thick sections. The reference diagramcharts have aided in the development of new alloys andmo'ification of existing alloys, through chemistry andprocessing, that exhibit improvements in toughness andstrength over what was obtainable several years ago.These studies have shown that the behavior of the mater-ial in a structural prototype element test, which incor-porates a flaw of f.e acuity normally found in large,complex, labricated structures, may be predicted fromthe performance of the material in a simple laboratorytest. The structural prototype element, the explosiontear test (ETT), and the laboratory fracture toughnesstest, the drop-weight tear test (DWTT), for titanium haveboth been described in earlier reports (1-4). The corrv-lation of the results of these two tests have providedthe necessary information for establishing meaningfulfracture toughness specifications for titanium alloysthat could not otherwise be evaluated validly by fracturemochanics tests.
THE TITANIUM FRACTURE TOUGHNESS INDEX DIAGRAM
The results of the fracture toughness studies of titaniumare presented in the fracture toughness index diagram(FTID) in Fig 1 This diagram has been up-dated topresent the latest information, however, it is consideredpreliminary in comparison to that evolved for steelswhich shows a "break out" of effects of metal processing.The fracture toughness, as measured by the DWTT, wasdetermined in the strong (RW) and weak (WR) directions (5).The optimum materials trend line (OMTL) indicates thehighest DWTT energy value obtained as a function of yieldstrength (YS) and establishes a "yardstick" for 1-in.-thick plate properties in alloy development and processing.The variety of alloys investigated are listed and codedfor reference. The large number of points for some ofthe alloys represents different heats, processing, andheat treatments investigated.
The EnT studies have established the approximate limitsof plastic strain required for propagation of fracture interms of DWTT energy. As shown in Fig. 1, DWTT energy inexcess of 1500-1700 ft-lb is required to avoid "flat breaking"
4

with extensive fracturing or shattering which is char-acteristic of fracture propagation under elastic loadingconditions. DWTT energies of 2000-2500 ft-lb indicatethat 1-2% plastic strain is assured in the ETT and 3-5%plastic strain is generally expected. Above 2500-ft-lbDWTT energy, higher plastic strains than the assured3-5% would be expected. The extension of these ETT per-formance limits to the OMTL defines the highest levelof yield strength that should be metallurgically attain-able for each.level of plastic strain. For example,1-2% would be the expected level of plastic strain at-tainable at approximately 135-ksi YS, while at about145-ksi YS and above only elastic strains would berequired to cause fracture propagation. The fact thatthe DWTT energy values for many of the alloys are notclose to the OMTL is indicative of either poor chemistry,high interstitial level, non-optimized processing or heattreatment, or a combination of these conditions. As statedin previous reports, it is expected that increasing platethickness will move the OMTh to lower levels of strength.Studies in this area are being initiated on 2-in. and3-in.-thick plates of several heat-treatable alloys.
The first results of studies on the plane strain fracturetoughness (K a) are reported elsewhere in this report.However, based upon the analysis developed for steelswhich is described in detail in Ref. 6, a projection canbe made as to the limits to which the fracture mechanicsapproach should produce valid fracture toughness andflaw size data for 1-inch titanium.using center or single-edge-notched fracture mechanics specimens.
The projection of the 1-2% plastic strain limit band at1500-1700 ft-lb DWTT energy to the OMTL indicates thatfor "optimized" titanium alloys of 1-in.-thickness thelinear elastic analysis criteria of plastic zone size canbe maintained on all materials exceeding about 140-ksi YSand that valid KIc values should be obtainable. Also,alloys above 140-ksi YS should be expected to propagatefractures at elastic load levels and these materials ahoulddefinitely be analyzed in fracture mechanics terms. Onthe basis of population density (the "two block" analysisdcscribed for steels, titaniuzp, and aluminum in Ref. 6),most materials between 120 and 140-ks 4 YS should also beexpected to propagate fractures at elastic stress l.els,unless the material has been metallurgically and process"optimized" to the highest attainable level of toughness.
5

Below 120-ksi YS, a wide variety of -lloys should he ex-pected to require large plastic overload for fracturepropagation and should not be analyzable by presentfracture mechanics procedures -- i.e., the fracturetoughness is too high for valid fracture mechanics testmeasurement.
HEAT-TREATMENT STUDIES
Heat-treatment studies on a number of titanium alloyshave been continued in order to develop information onthe stability of the alloys and to determine the heattreatments which will produce an optimum combination ofstrength and toughness.
The results of solution annealing and aging treatmentsfor the alloys Ti-6A1-4Zr-2Mo (T-55) and Ti-6A1-4Zr-2Sn-.5Mo-.5V (T-68) are shown in Tables 1 and 2 respectively.The treatment includes solution annealing at temperaturesbelow the beta transus for 1 hour in an argon atmospherefollowed by air cooling or water quenching. The specimenswere aged in most cases at 1100°F or 1200°F for 2 hoursin an argon atmosphere and water quenched or air cooled.
The variation of fracture toughness with heat treatmentwas determined by using the Charpy V (Cv) test. Thespecimens were tested at -80°F and +32 0 F in RW and WRorientations. The C, and tensile (0.313-in.-diam)specimens were prepared from "as-received" material priorto heat treating, and the tensile specimens were testedat a strain rate of 0.0O2-in./in./min, The standard0,2% offset was used in determining yield strength.
Figures 2 and 3 show the effects of variations in solutionannealing temperatures on the YS of the two alloys withaging treatments. Water quenching after ths solutionanneal resulted in considerably higher YS values overthat developed by air cooling. The highest YS level isobtained by solution annealing just below the beta transusfollowed by a water quench. In Fig. 3 the YS of T-68after water quenching at the 1850°F solution anneal tendsto vary according to the specimen's location in the heat-treating muffle The thermal profile in the muffle issuch that some of the specimens were at or slightly abovethe beta transus of the alloy. Metallography confirmedthat the corresponding decrease in YS was associated.riththe characteristic rapid grain growth during beta gra*nfzrmation.
6

Figures 4 and 5 are summaries of the C, energy and YSrelationships for the alloys Ti-6A1-4Zr-2Mo (T-55) andTi-6A1-4Zr-2Sn-.5Mo-.5V (T-68). The lines indicatethe optimum materials trend line for these materialsbased on the Cv test. Since the point above theselines at 145-ksi YS for T-68 is outside the normalscatter of data points and has not been confirmed byadditional testing, it was not considered in establish-ing the optimum line even though it may be valid.
Figure 6 shows the effect of selected heat treatmentson the C, energy of the alloys Ti-6A1-4Zr-2Mo (T-55)and Ti-6A1-4Zr-2Sn-.5Mo-.5V (T-68) in the 120-140-ksiYS range. The values illustrated and the heat treatmentswere taken from Tables 1 and 2 and represent the nearestapproach to an optimum condition for the alloys,
Table 3 shows the strength of tensile specimens takenfrom heat-treated drop-weight tear test (DWTT) pieces ofthe alloy Ti-6A1-2Mo (T-22). For comparison, the resultsof tensile strengths previously reported for this alloy(7) on specimens machined before beat treatment areincluded. As might be expected, the data show the pre-machined (small-size) specimens have somewhat higherstrengths than those taken from the 1-in.-thick heat-treated DWTT pieces. Sufficient material was not avail-able to obtain tensile specimens in the longitudinaldirection of the DWTT piece that was heat treated at1750*F for 1 hr in an argon atmosphere and air cooled.The aging treatment for this piece consisted of 1100°Ffor 2 hrs in an argon atmosphere followed by water quench-ing. Previous work has shown the tensile strengths aregenerally 3,000-4,0A0-psi higher in the longitudinaldirection for this particular material and one couldassume that the YS of this DWTT piece in the longitudinaldirection would be greater than the 118,800-psi YS in thetransverse direction, or approximately 122,000-psi.
Of all the alloys investigated to date in the heat-treatingstudies, the alloys Ti-8AI-IMo-IV (T-19), Ti-6fI-4Sn-1V(T-20), Ti-6A1-2Mo (T-22), Ti-6A1-4Zr-2Mo (T-55), andTi-6A1-4Zr-2Sn-.5Mo-.5V (T-68) have shown the best combina-tions of strength and toughness. Figure 7 shows the sum-mary of Cv energy and YS relationships of these alloys.The curves indicate the OMTL fcr the respective alloys.However, the weld and heat-affected-zone (HAZ) propertiesof some of these alloys may be difficult to optimize bothas to strength and fracture toughness.
7

ALLOY DEVELOPMENT STUDIES
A promising combination of strength and toughness proper-ties was reported for a Ti-7A1-2Cb-lTa-2.5Sn alloy byIXT Research Institute (8). Based on these findings, ahigh purity, low interstitial (approximately 0.04 oxygen)Ti-7AI-3Cb-2Sn alloy (T-76) was made using the consumableelectrode vacuum arc remelting technique. The metal wasvacuum cast into a 4-in. x 7-in. x length copper chillmold after melting in the NRL skull melting furnace. Theas-cast DWTT energy for a 1-in. section removed from thisbillet was 2808 ft-lb. Half of the remaining billet wasforged to a 1-1/4-in, slab and hot-rolled at 1650*F intoa 1-in.-thick plate. A portion of this plate was solutionannealed at 1925 0 F for 1/2-hr, air cooled, then aged 2 hraat 1100°F. The resultant properties after heat treatmentwere DWTT energy - 1723 ft-lb, 117-ksi UTS, 109-ksi YS,9% RA, and 17% Elong, Additional studies on this alloyare in progress.
Two a+8 titanium alloys - designed for the 130-150-ksi YSrange - were double vacuum arc melted into 9-in.-diam,120-lb ingots. These ingots are being forged into billetsat a commercial production facility at 2100°F and thebillets are then to be hot-rolled at 1750°F for 1-in. plate.
ELECTRON BEAM WELDING
The new laboratory facilities for conducting experimentaland developmental studies on electron beam welding tech-niques and procedures for titanium became available inFebruary 1965. A new 60-kv to 30 kw electron beam welderwith a 30-in. x 50-in. x 42-in. chamber has been installed.Voltage,power inputs, and travel speed parameters are beingestablished for a variety of titanium, steel, and aluminumalloy plates in various thicknesses. Simulated plate wel~sthrough 2-1/2-in. titanium have been made at 40-in./min.travel, and the depth-to-width ratio is greater than 15 to1. The fracture toughness properties of electron beamwelds in titanium alloys will be studied and compared tothe inert gas MIG type of welds.
8

EXPLOSION BULGE TESTS OF 5Ni-Cr-Mo-V WELDMENT6
(P.P. Puzak and K.B. Lloyd)
The previous (sixth) progress report (9) presented a generalreview of the extensive data provided by the United StatesSteel Corporation's development program under the Bureauof Ships IfY 130/150-ksi yield strength (YS) hull steel con-tract. The particular 5Ni-Cr-Mo-V alloy system developedin this program was designed to provide , steel withsecondary hardening characteris-ics such that with a givencarbon content, the YS developed by quenched and tempered(Q&T) heat treatment would essentially be the same fortempering treatments in the range of 100' to 1100*F.Several large-size (80-ton) production herts of the 5Ni-Cr-Mo-V steel have been produced, and test data hava shown theplate material to exhibit relatively high fracture toughnessfor YS levels within the HY 130/150-ksi range. It should benoted that the Cy properties reported by the United StatesSteel Corporation for 1-in. and 2-in. plates of early pro-duction heats were checked by NRL and found to be in closeagreement. By relatively minor chemical composition andheat-treatment (tempering temperatures) adjustments, Atshould be possible to produce high fracture toughness platesof this alloy composition to YS levels rrging from approxi-mately 130 to 150-ksi for thicknesses of 2-in. to 4-in., orfor possibly somewhat higher thicknesses.
The development of reliable filler metals for joining highstrength Q&T steels is a much more difficult metallurgicalproblem than is the case for the base plate. For largecomplex structures, the weld metal strength and toughnessmust be maintained without requiring full Q&T heat treat-ment after fabrication, and the weld must be crack-free.The welding parameters (low preheat and energy input)which are favorable for the development of high weld-metal strengths are invariably found to increase crackingsensitivity and decrease toughness. A summary of C, andYS relationships that have been reported by USS-Airco (10)for experimental welds is given in Fig. 8 for manual(covered) electrodes and in Fig. 9 for semiautomatic,inert gas shielded (MIG) welds. The shaded areas inFig. 9 represent the data band shown in Fig. 8 for thecovered electrodes. It can be seen that the developmentof MIG weld metals has substantially progressed to apoint where welds with yield strengths of 130 to 140-ksiand C, values of approximately 100 ft-lb at 30°F can be
9

can be produced under laboratory conditions. The coveredelectrode welds are characterized by considerably lowerC, values with a maximum value at 30'F of 45 ft-lb forthe best of the HY 140-ksi covered electrodes availableat this stage of development.
The previous progress report (9) had also presented theresults of explosion bulge testing of three of the 5Ni-Cr-Mo-V 1-in. steel plates welded with 140-ksi YS MIG weldmetal in the downhand, or horizontal, position. The platemetal yield strengths had been varied from 130 to 150-ksito permit investigation of the relative performance ofundermatching, matching, or overmatching weldments. Weldmetals with yield strengths overmatching that of the newalloy base plate (such as is presently employed for HY-80hulls) would require approximately 160-ksi minimum YSto overmatch the 150-ksi capabilities of the 5Ni-Cr-Mo-Vplate material. On the premise that suitably tough HY-140(but not HY 150 minimum) weld metals were available, orcould be developed within the time-frame of the USS-BuShipscontract for an HY 130-150-ksi hull weldment, a weldmentevaluation program ai~ued at providing a guaranteed HY 130-ksi minimum YS weldment has been initiated. Explosionbulge tests have now been conducted for additional samplesof a new production heat of 5Ni-Cr-Mo-V steel plate heattreated to the low end of the strength level range andwelded manually with the best of covered electrodes andMIG weld metals developed to date under the USS-BuShipscontract.
The current series of explosion bulge tests were con-ducted on plate specimens assembled by four sub-contractorsto the United States Steel Corporation: Airco, Arcos,Linde, and McKay. each using the new weld metal evolvedby the various companies for this application. Thewelding with covered electrodes produced by Airco, Arcos,and McKay from small laboratory heats of core wire hadbeen performed in the flat, or downhand, position. Otherspecimens had been manually welded by Airco and Lindewith a MIG, interrupted-arc, out-of-position (vertical-up)welding technique. The MIG filler wires comprised materialfrom a large (17-ton) air melt production heat for theAirco weldments and a small (i/2-ton) vacuum melt heatfor the Linde weldments. Each company had submitted a setof three I-in -thick. V gle V-joint preparation weldmentsmade with their respective weld metals. One of each setwas ground smooth, removing the weld crown, and gridded forfield (test-site) measurement of surface strain and thickness.
10

A second weldment of each company was tested "as-welded"with the weld crown, or reinforcement, intact. The thirdweldment of the set was modified at NRL by the additionof a crack-starter weld ir order to develop preliminaryinformation concerning the performance of these materialsin the presence of cracks. An extra MIG, interrupted-arcweldment wa6 supplied by Airco and was tested with theweld crown intart.
A summary of the mechanical properties data determinedby the United States Steel Corporation for the platesand new weld metals used for the current explosion bulgespecimens is given in Table 4. Plate metal propeArtieswere determined with specimens cut from test coupons.that were heat treated simultaneously with the platesthat were subsequently welded by the various sub-contractors.Weld metal properties were determined with specimens cutfrom an extended length of one of the bulge test weldmentsprepared by each sub-contractor. Generally, the resultsin Table 4 indicate that overmatching welds were producedin all cases, and that plate metal toughness (as shown byC, tests) is considerably higher than that of any of thefive weld metals under evaluation. The MIG weld metaltoughness (as shown by C. tests) are noted to be consider-ably higher than that of the covered electrode weld metals.The Linde MIG weld metal which has the highest C. valueat 30^r is also noted to be the lowest in YS (135-ksi) ofthe various weld metals.
The crack-starter modified weldments were tested first.Each specimen received two 7-lb Pentolite explosive chargeshots, at 15-in. stand-off distance and at 30OF testtemperature. The crack-starter weld on the weld crownintentionally introduces an early flaw into the test areaand provides for quick screening of samples that havetendencies for catastrophic propagation of the crack inweld, heat-affected-zone (HAZ), or fusion line. Thedevelopment (or ixtension), after one or two shots, offractures which extend into or through the hold-downregions of the crack-starter modified samples is indica-tive of low toughness and considered to be below accepta-bility levels.
Figures 10 and 11 present the appearance of the crack-starter modified weldments after completion of the tests.The first shot had produced relatively short fractures ineach specimen: the srcond shot extended these cracks as
11

illustrated. In general, the crack-starter test resultsshown in Figs. 10 and 11 are encouraging when one considersthe relatively high strengths of the plate and weld metals.Plate metal fractures and HAZ tearing are confined wellwithin the plastically deformed, bulge, region of thesamples. Dominant crack propagation in weld metal is ap-parent only in the Arcos (covered electrode) weldment,which is also characterized, Table 4, by the lowest C,values (33 ft-lb) of the various weld metals being investi-gated.
As described above, crack-starter modified bulge testsare terminated after completion of two shots. Conventionalbulge test procedures, however, require repetitive testingof the weldment by repeating the cycle of refrigeration,firing, and examination until failure occurs, or until thedevelopment - without visible failure - of a limiting bulgedepth (bulge limit established by BuShips for the serviceapplication involved). Bulge testing experience has shownthat a secondary apex-bulge (equivalent to localized necking)can be expected to develop in 1-in.-thick samples after thedevelopment of approximately 15 to 18% thickness reductionof the plate. Continued testing is not warranted forweldments that develop secondary bulge conditions withoutvisible failure.
Pertinent details of the explosion bulge tests of theas-welded (weld crown intact) samples are summarized inTable 5. Figure.. 12 and 13 illustrate the appearance ofthese samples after completion of the tests. Visiblefractures were not developed until after six shots in twoof the covered electrode weldments (McKay and Arcos) andin one of the MIG interrupted-arc, vertical-up weldments.In general, these fractures were relatively short and nosigns of brittleness were apparent. Additional testingof these samples had been discontinued because of visibleevidence of secondary bulging and comparatively high(17 to 19%) thickness reduction in the plate followingthe sixth shot, Table 5. Relatively high toughnesscharacteristics are also indicated by results obtainedwith the Airco covered electrode weldments and both ofthe MIG interrupted-arc weldments. The weld metal andtoe cracks which developed after the fourth shot on theAirco covered electrode weldment were extended only sligatlyby the application of the fifth shot. Similarly, the crackindications which developed after two shots on the MIGweldments were extended only slightly by two additional test
1,2

shots. The initial visible evidence of fractures in theseweldments may be related to inherent weld metal defectsand the stress concentration at the toe of the weld crown.
The weld crown on one weldment of each set was groundsmooth and a scribed grid on each was used to provideprecise points at which thickness reduction and surfacestrain measurements could be made. The curves derivedfrom the thickness reduction measurements made after eachshot in the covered electrode weldments are shown in Fig. 14.Generally, similar data were obtained for the MIG interruped-arc weldments. The weld metal thickness reduction is notedto be slightly less than that of the adjacent plate metal,and an approximately uniform reduction in thickness isdeveloped by each successive shot excepting the final shotapplied to the Airco weldment. It is apparent that themuch larger thickness reduction developed by the sixth shoton this plate is limited to the apex of the bulge and thisis considered to be indicative of secondary bulging.
The appearance of the ground-smooth samples of coveredelectrode weldments after completion of the bulge testsis shown in Fig. 15. A weld metal flaw in the McKayweldment that was not detected by radiographic or visualinspection prior to testing resulted in development of ashort, V-shaped tear across the width of the weld on thefirst shot. Application of a second shot resulted inmoderate extension of the initial crack into the baseplate as illustrated in Fig. 15. Longitudinal cracksdeveloped on the sixth shot at the edge of the welds,indicated by the arrows, on the other two smooth-groundweldments. Additional shots were not applied to thesesamples because they had developed a full-bulge and visualindications of secondary apex-bulge characteristics.
Bulge test conditions are generally less severe forweldments that are ground smooth than is the case forweldments with the weld crown intact. The stress concen-tration at the toe of the weld crown tends to promote thedevelopment of HAZ or fusion line cracks which propagateextensively in cases where brittle paths of fracture exist.This condition has not been evident in any of the previouslyillustrated weldments of the 5Ni-Cr-Mo-V steel that wereshown to develop longitudinal cracks at the toe of the weldcrown. The ground-smooth Airco -nd Linde MIG interrupted-arc weldments, however, developed longitudinal, through-the-plate ruptures after four and six shots respectively, asshown in fig. 16. In both of these samples, the longitudinal
i3

ruptures appear to have propagated predominantly in thefusion line of these single V-Joint preparation weldments.Both of these weldments had sustained extensive bulgingand thickness reduction of the plate prior to developingthe illustrated ruptures and additional testing was notwarranted. Metallographic examination of these and othersamples (being conducted by United States Steel Corporationpersonnel) and additional bulge tests are required toestablish whether, in fact, a preferential path of fractureis developed in weldments fabricated by the MIG interrupted-arc (vertical-up) welding technique.
Explosion bulge tests conducted to date for 5Ni-Cr-Mo-Valloy steel weldments have involved five different weldmetals (two MIG and three covered electrodes) as well asthree welding procedures. The welding procedures weremanual stick, manual MIG interrupted-arc (vertical-up),and& automatic MIG. These tests are considered of explora-tory nature. It should be recognized that BuShips quali-fication requires demonstration of Performance with sixor more 2-in.-thick weldments of a biven material (orprocedure) to be tested with weld crown intact. Explosionbulge tests conducted to date have involved only 1-in.-thick weldments and a very limited number of samples ofa given material. Results in general have been encouragingand the following tentative conclusions pertaining to the1-in.-thick tests reported herein appear to be warranted:
1. At a yield strength of 130 to 135-ksi, the5Ni-Cr-Mo-V plate material exhibits high fracture tough-ness as is evident by relatively short tears confined tothe plastically deformed regions of the crack-starter andbulge test plates. Further confirmation of the fracturetoughness of this steel has been provideo by drop-weighttear tests (DWTT) of another 1-in. steel plate (134-ksiYS) from the same heat of steel used for this wvldmentevaluation program - the DWTT energy for this plate wasover 5000 ft-lb.
2•. There appears to be no evidence in any of the1-in.-thick explosion bulge specimens tested to date oflow HAZ fracture toughness resulting from welding on this5Ni-Cr-Mo-V steel plate.
3. The initial exploratory test results with over-matching welds are encouraging, however, additional teststo determine suitability and reproducibility with productionlots of electrodes are reqdired to establish fabricationconfidence.
14

EXPLOSION BULGE TESTS OF
EXPERIMENTAL MARAGING STEEL WELDMENTS
[P.P. Puzak and K.B. Lloyd]
Among the new materials of interest for use in largewelded structures are the new maraging steels. Thesecomprise a variety of new steel compositions which arecapable of developing high strength levels by annealiagand aging treatments. The 12%Ni-5%Cr-3%ho grades repre-sent a comparatively recent development of this familyof steels. Depending upon heat treatment and combinedcontent levels of the hardening elements (Al and Ti),the 12-5-3 maraging steels exhibit yield strengthsranging from 150 to 215-ksi. Fracture toughness evalu-ations previously reported(2) for seven experimentalsmall (1/2 and 1-ton) mill heats of the 12-5-3 marag-ing alloys rolled to 1-in. plate indicated considerablyhigher fracture toughness properties than the 18%Ni-8%Co-3-5%Mo maraging alloys that are capable of develop-ing yield strengths in the range of 200-300-ksi. Platesof 1-in. to 2-in.-thickness of 180-ksi minimum yieldstrength {YS) and high fracture loughness properties(in excess of 50 ft-lb C. at 30 0 F) can be produced withthe 12Ni-5Cr-3Mo maraging steels.
The primary potential advantage of these new 12-5-3maraging steels lies in the possibilities that areprovided for welding fabrication of fracture tough160-180-ksi YS materials. In order to develop suchfabrication capabilities for the best of the conventionalquenched and tempered (Q&T) stecls, it is presentlynecessary to apply a full-cycle, Q&T, heat treatment tothe weldment. Without such full-cycle heaL treatment,the best of the available welds (not necessarily theplates) for Q&T steels are brittle. Weldments of themaraging steels also require a post-weld heat treatmentto develop strength and toughness in the weld metal andheat-affected-zone (HAZ). However, as contrasted withthe full-cycle, Q&T, heat treatment, the aging treatmentat approximately 900 F for maraging steels is compaxa-tively simple compared to the Q&T type heat treatments.For relatively small structures of simple de.,ign, con-ventional furnaces could be employed for maraging ofthe whole structure without concern for excessive shrink-age or sagging Cf the structure as would be the case forthe full-cycle, Q&T, heat treatment. For large structures.it may be feasible to accomplish maraging by local heat-ing of the weld joint area.
15

The initial development studies for weld metals necessaryto fabricate the new 12-5-3 maraging steels did not fullysucceed in matching plate metal properties. Weld depositssimilar in alloy composition to those of the plates werefound to develop properties (after aging) of lower strength(approximately 160-ksi YS) and toughness (approximately40 ft-lb C, at 30*F) than those of the 180-ksi YS plates.Continuing research efforts were aimed at developingfracture tough weld metals that equaled the YS and tough-Lýss of the 180-ksi minimum YS base plate to provideweldments with 100% joint efficiency. Recent weld metaldevelopments by the International Nickel Company (INCO)revealed that certain filler wire compositions of the18-8-3 type (not disclosed) were compatible with thel2Ni-Cr-Mo maraging steel plate. With the new filler wire,weld metal properties (after aging) were stated to be ap-proximately equivalent to those of the 12-5-3 plate at180-ksi minimum YS. A cooperative investigation involvinga limited number of explosion bulge tests was undertakento assess the we]dment performance of these welds in a180-ksi YS maraging steel.
To expedite preparation of the bulge test samples, itwas necessary to use weld wire produced by vycor-extractiontechniques from several small laboratory heats of the newalloy. The wire was prepared and used by INCO ResearchLaboratory personnel to TIG (tungsten inert gas) weld1-in.-thick plates (NRL #H-7) rolled from an air melt heatof the 180-ksi YS grade of the 12-5-3 maraging steel. Thesample was furnace-aged after welding and tested by NRL.After completion of the bulge test, chemical analysisof the weld deposit revealed the conihined average composi-tion of the hardening elements (Ti and Al) to be belowthe desired aim level necessary to insure the developmentof 180-ksi YS in the weld deposit. Plates (NRL #H-8)rolled from a CEVM (consumable-electrode-vacuum melt)heat of Lhe 12-5-3 maraging steel were used for a secondweldment. Although sivilar techniques were employed toproduce the TIG weld wire, the laboratory melts wereadjusted in composition to compensate for the anticipatedloss in Ti and Al contents during vycor-extraction.
Property data jointly established by the cooperatinglaboratories for plate and weld metal in the maragingsteel bulge test specimens are summarized in Table 6.It should be noted that tension test results with speci-mens oriented transverse to the weld may not be fully
16

representative of weld metal values that might be obtainedwith all weld metal tension specimens. However, analysisof the data given in Table 6 indicates the weld of thefirst bulge test specimen to be an undermatching (i.e.,weld metal YS lower than plate metal YS) weldment. Con-firmation of an undermatching weldment condition is pro-vided by the tension test specimen failure in the weldmetal and the significantly lower weld metal hardnessvalues (34/36 Rc) compared to those (43/44 Rc) of theplate in the first maraging steel bulge test specimen.From a similar analysis of the data for the second bulgetest specimen, the 176-ksi YS indicated in Table 6 (withtension specimen failure in the HAZ) is considered to belower than the true value for the second weld metal (#WMA-2).The weld metal hardness values (42/43 Rc) were slightlyhig' •r than those of the plate (41/42 Rc). It is estimatedthat an equal or slightly ovvrmatching weld was producedwith the YS of the weld being slightly higher than the179-ksi measured for the plated.
The explosion bulge tests were conducted at 30°F using7-lb Pentolite charges and 15-in, standoff. Past explosionbulge test experience has indicated that, if the weld crownis not grund smooth, the strain concentration at the toeof undermatching.welds tends to promote complete separa-tion of the bulge test specimens on the first or secondshot. Both of the maraging steel bulge test specimenswere tested with the weld crown intact. The bulge testperformance of the undermatching weldmeat was similarto that of other undermatching welds; after the first shot,a 1-1/4-in.-long tear was visible at the toe of the weldcruwn, Fig. 17, top. The depth of bulge was approximately1-inch, Fig. 17, bottom, and a surface strain of approxi-matel:y 2% in the plate metal adjacent to the weld wasmeasured after the first shot. A second shot resulted incomplete separation of this bulge test specimen as shownin Fig. 18.
Similar test conditions to those described above wereemployed for the second !naraging steel weldment. Followingthe second shot, two small toe-cracks, each approximately2-in.-long, were visible at the apex of the bulge alongthe toe of the weld crown. A 1-1/2-in.-bulge depth,3-.1/25 weld metal surface strain, and 4-1/2% surface strainin the plate mnetal adjacent to the weld, were measuredafter the second shot. Application of a third shot tothis specimen resulted in only short extensions of theoriginal toe-cracks, Fig. 19. Normal bulge test procedures
17

would have resulted in termination of this test after thethird shot, but observing the short extensions and ap-parently shallow depth of the toe-cracks after the thirdshot, it was decided to apply a fourth shot to this speci-men. Following this shot, the weldment toe-cracks wereextended to 4-1/2 to 5-in. in length, and several short(1/4-in.) cracks in the weld metal were visible at weld-ripple positions, Fig. 20, top. None of the cracks hadpenetrated through the thickness of the weldment and abulge depth of 2-5/8-in. was measured, Fig. 20, bottom.Further testing of this weldment was discontinued topermit cutting of test specimen blanks from non-deformedhold-down regions of the bulge sample.
The specific maraging heat treatments applied to thebulge test specimens were based upon exploratory labora-tory (INCO) results of tension and Charpy V (C,) testsof the different plate and weld materials. The specimensremoved from the hold-down regions of the bulge test ýsamples reflect the properties developed by the respec-tive aging heat treatments noted in Table 6. In addition,CV and tension test results were obtained for the twoplate materials in the conventional maraging condition(3 hours at 900'F). A comparison of these data withthose of other 1-in.-thick stpels is provided by illus-trating the C, values of the maraging steel plates andweld metals as a function of the yield strengths of thetest materials, Fig. 21. The curves in this illustrationdepict the OMTL (optimum materials trend line) for char-acteristic groups relating to processing variables(melting practice and/or crossrolling) of the steelsstudied to date (9). From the data shown in Fig. 21,it is apparent that both the air melt (#H-7) and CEVM(#H-8) plates developed yield strengths in excess of180-ksi when aged for 3 hours at 900'F. For this agingtreatment, the C, values exceed 50 ft-lb for the CEVMplate and 40 ft-lb for the air melt plate. The C, valuesof 50 and 41 ft-lb illustrated for the new filler wiresare considered promising in view of the reiatively highyield strengths (approximately 167 and 18C0-ksi respective-ly) for the weld metals involved.
On a single test basis of experimental materials, itis not warranted to draw general conclusions. However,explosion bulge test results for the second sample witha non-matching alloy filler wire in the new 12Ni-Cr-Mo,180-ksi YS grade of maraging steel may be consideredpromising. Comparatively high toughness was demonstrated
18

by this 1-in.-thick plate welduent which showed the capa-bility of developing additional local plastic deformationwith only small extensions of the toe-line cracks formedduring the previous explosion tests of the bulge sample.It should also be recognized that the weld wires used inthis exploratory investigation of maraging steel weldmentscomprised material from small experimental laboratory heats.More extensive evaluations of the potentials of the 12-5-3maraging steels for high strength weldment fabrication areplanned for future investigations. It must still bedemonstrated that similar results can be duplicated orexceeded with weld wires produced from large-scale pro-duction heats before further conclusions can be drawnconcerning the suitability of using the new alloy fillerwire in the welding of 12-5-3 maraging steel plates forgeneral applications in welded structures,
LOW CYCLE FATIGUE CRACK PROPAGATION
117 D6AC AND 4335 HIGH STRENGTH STRUCTURAL STEELS
[T.W. Crooker, R.E. Morey, and E.A, Lange]
The safe and dependable application of modern high strengthmaterials to large cyclically loaded structures, such aspressure vessels and submersible vehicles, requires animproved knowledge of slow crack propagation from low cyclefatigue. Small flaws and cracks invariably are formedduring fabrication and manufacture of a large weldedstructure, despite the use of the best available process-ing and inspection techniques. Since fabrication flawsare unavoidable, the only practical recourse is to providedesign criteria for preventing the growth of such cracksto a critical size from repeated service loads.
The aim oP this investigation is to define and evaluatethe factors which control the growth of cracks under lowcycle fatigue conditions. The results of the currentphase of this investigation are based on studies of crackpropagation in center-notched plate bend specimens loadedin cattilever fashion. Preliminary evaluations of thelow cycle fatigue characteristics of a wide variety ofmateri~ls including normalized and quenched and tempered(Q&T) steels, Ni-Cu Monel alloys, a 2024 aluminum alloy,and titanium alloys, have been made (2,7,9,11-15).Briefly, it has been observed that for a specific environ-ment and strain ratio, the growth rate of a low cycle
19

fatigue crack is dependent uipon applied total (elastic plusplastic) strain range, as expressed by the relationshipdL/dN - C(ET)m where L - total crack length, N = cyclesof loading, cT = total strain range, m = exponent, andC = constant.
This relationship remains valid in the presence of meanstrains other than zero and in the presence of aqueouscorrosive environments for most materials. However, ithas been observed that both of these factors affect crackgrowth rate. Mean strain can either acceierate or retardcrack growth tate, depending upon whether it is tensileor compressive. Corrosive environments tend to acceleratecrack growth rate, depending upon such factors as corrosionresistance, stress corrosion cracking, and hydrogen em-brittlement.
MATERIALS AND PROCEDURE
The materials tested for this report are two conventionalhigh strength steels, D6Ac (code G85) and 4335 (code G98).Chemical compositions and tensile properties of thesematerials are shown in Tables.7 and 8.
Specimens of both materials were finish machined beforethey were given the following heot treatment. For D6ACsteel specimens: the material was austenitized in ahydrogen atmosphere for 1 hour at 1625*F, quenched in oilfor 15 minutes at 400*F, and then cooled in air. Temperingwas 1 hour at 400OF followed by air cooling. Specimenswere then double tempered at 1025 0 F for 2 hours and aircooled after each temper period. For 4335 steel specimens:the material was austenitized in a hydrogen atmosphere for1 hour at 1625 0 F, followed by quenching to below 100OFin oil. A double temper of 2+2 hours at 600OF was givenwith an air cool following each temper period.
The two materials, D6AC and 4335, were chosen for studybecause of their wide application as high strength materialsfor structures having highly refined desigins. Knowledgeof the growth rate of fatigue cracks in these matei alsis important to the safe applIcation of these materialsto other, less highly refined, structures; since thesematerials permit the propagation of fast fractures throughelastically loaded regions from small flaws.
The experimental procedure employed for this series oftests is the same as that described in the references.
-O

Experimental data are based on the observed macroscopicgrotth of fatigue cracks acixss the surface of center-notched plate bend specimens. These specimens are canti-.lever loaded under full-reverse cycling in both air and3.5% salt water environmenus. Constant total strainrange loading conditions are maintained by adjustingdeflection, and the corresponding crack growth rate ismeasured. Nominal surface strains are measured withelectrical resistance strain gages. The strain range-deflection characteristics of these materials in theplate bend specimens are shown in Fig. 22.
Each specimen is suc.°essively tested at a specific totalstrain range value for an interval of several hundredto several thousand cycles, until the crack growth ratecan be establisheu accurately, and then this procedureis repeated at a h-gher strain level. With this procedure,a series of crack growth rate versus total strain rangedata points are obtained from each specimen. For testsconducted under a salt water environment, a corrosioncell is positioned cn the specimen, allowing the saltwater solution te flow over the fatigue crack from areservoir during testing.
STRAIN RANGE EFFECTS
Fatiguc grack growth rate versus applied total strain rangedata for D6AC and 4335 steels in an air environment areshown plotted on a log-log scale in Fig. 23. These twomaterials were heat treated to essentially the same yieldstrength (YS) levels, and therefore they exhibited nearlyidentical proportional limits in the plate bend specimen.The total strain range (tension plus compression) at theproportional limits was 16,000 microinches/inch as indi-cated on Fig. 23. The basic resistance of a material tothe growth of fatigue cracks is most visible on a strainrange basis, and this will be discussed first. The com-parison of a variety of materials for structural applica-tions is more appropriately conducted relative to YS or,in our case, the proportional limit.
Low cycle fatigue crack propagation in these two materialsis characterized by high sensitivity to applied strain,as indicated by the steep slope of the curves, Fig. 23,and the development of very rapid crack growth rates(i.e., dL > 1000 microinches) under elastic loading.
Scycie

Unlike previous materials tested, crack growth rates inthese two materials over the range of strain valuesexamined do not follow a single exponential relationshipwith respect to applied total strain range. Instead,the relationships assume a steeper slope above appliedstrain values near 50% of the proportional limit. Thisphenomena of increastbgsensitivity to applied strain athigh elastic strain levels has been observed in highstrength steels by other investigators (14) and is yetto be fully explained.
It sihould be reportel that fast fracture was not initiatedin the plate bend specimens of either steel even withsurface crack lengths of 1.3-in. and tensile strains of6,800 microinches/inch corresponding to a stress levelof 204,000 psi.
WET FATIGUE
D6AC and 4335 steel fatigue specimens were also testedin a 3.5% salt water environment. The results of thesetests are shown 6n a log-log plot of fatigue crackgrowth rate versus applied total strain range in Fig. 24.The plots of similar data taken in air are shown indashed lincs for comparison.
As might be expected, the introduction of a salt waterenvironment results in a gross acceleration of fatiguecrack growth rates (i.e., more than an order of magnitude),even at very low strain levels below 25% of the propor-tioj•mL limit. However, a comparison of the two curvesreveals that these two steels did not react to theaqueous environment in the same manner. Although 4335exhibited slightly more crack propagation resistance thanD6AC in air, as indicated by the locus of its data pointsfalling to the right of D6AC, it was more severely affectedby the salt water environment. During testing under saltwater, the 4335 steel was observed to form a multitude ofsurface cracks which propagated radially from the fatiguecrack front. The size and number of these cracks increasedwith increasing levels of applied total strain range.The existence of these cracks strongly suggests the pos-sibility that the very rapid crack growth measured in4335 steel under salt water occurred as a result of thesimultaneous action of fatigue cracking and stresscorrosion cracking.
22

The D6AC steel did not exhibit such secondary surface cracks.Nevertheless, its fatigue performance was severely affectedby the presence of the salt water environment. SinceQ&T steels of this YS level are suspect of cracking in even"pure" water environments (15), these results are notsurprising. However, when compared with the wet fatigueperformance of lower YS materials (7,9,12,13), these dataserve to point out the very difficult problems which canexist in the application of D6AC and 4335 steels in a waterenvironment at design stresses demanded of high performancestructures.
COMPARATIVE FATIGUE PERFORMANCE
A comparative summary of the low cycle fatigue performanceof six popular structural steels is given in Fig. 25.This log-log plot shows the fatigue crack growth rateversus the ratio of applied total strain range to pro-portional limit strain range for each material in an airenvironment. The materials plotted are as follows:A201B (48-ksi YS), HY-80 (88-ksi YS), T-1 (107-ksi YS),Q&T 150 (HY-80 composition)(157-ksi YS), 4335 (215-ksi YS),and D6AC (212-ksi YS).
Fig. 25 clearly illustrates several important points whichare fundamental and must be considered in the applicationof high strength steels to large cyclically-loaded struc-tures. First, it is apparent that resistance to slowfatigue crack growth under localized plastic strain con-ditions decreases rapidly with increasing yield strength.As YS levels exceed 150-ksi, fatigue crack growth ratesincrease rapidly, at nominal elastic strain levels belowthe proportional limits which are normally considered fordesign criteria.
In addition, the sensitivity of crack growth rates tochanges in applied strain levels, such as might be experi-enced by accidental overloads, increases with YS. Fatiguecrack growth rates in low strength pearlitic, carbon steel,A201B, have been found to be proportional to the thirdpower of total strain range; whereas crack growth rat'esin D6AC loaded to 50% of the proportional limit or higherincrease as a function of the sixth power of the totalstrain range.
These points are summarized in Figs. 26 and 27. In Fig. 26,the fatigue crack growth rate at the proportional limitstrain range is plotted against YS. This plot illustrates
23

the fact that as yield strengths are raised beyond 150-ksi,the problem of fatigue crack growth at high elastic strainsinvolves a new order of magnitude in structural designdifficulty.
For designs based on the low cycle fatigue range (i.e.,less than 100,000 cycles), nominal stresses will be highand the major portion of the life of the structure willbe dependent upon the first small extension of a flawwhere the growth does not significantly affect the localstrain pattern. After the flaw has grown sufficientlyto influence the local strain level, crack growth raridlyaccelerates and life is soon terminated. This effect isreadily apparent in fatigue tests conducted on a constantload basis. Unfortunately, most laboratory fatigue testsconducted at constant load do not include the effect offlaws and the life observed is predominantly that forcrack initiation and the crack growth period is minimal.
For the case of large structures where small flaws areexpected and a safe life period depends upon slow exten-sion of a crack by fatigue, knowledge of the relativeperformance of various materials on a YS basis is veryuseful. Such comparisons can be made from the relation-ship shown in Fig. 27, where the allowable relativeloading for various steels can be compared for a lowlife or a high life.
Because crack growth rates correlate well with totalstrain and strains may extend into the plastic region,the relative load variable in Fig. 27 is expressed aspercentage of proportional limit strain range. It turnsout that the lateral restrain condition in the platebend specimen provides the conditions where the propor-tional limit strain corresponds essentially to the YSof high strength metals as determined in the conventionalaxially-loaded, smooth, cylindrical specimen. If one ismore accustomed to thinking in terms of stress ratherthan strain, the ordinate in Fig. 27 may be consideredas"allowable percentage of yield strength".
An important observation from the 10 KC fatigue lifecurves in Fig. 27 is that they approach each other withincreasing YS. Thus for high strength metals, only asmall increase in relative stress level can decrý*asefatigue life from a high level to a low level which em-phasizes the conclusion that consideration of designingfor finite life using high strength materials requires
24

an exact knowledge of stresses and precise control ofthe loading conditions in service. In fact, above 200-ksiYS, there does not appear to be a prudent safe life periodin the low cycle range for large complex structures (in-volving regions of complex geometry) where life dependsupon the slow growth of fatigue cracks. In fact, at YSlevels of 150-ksi, careful engineering judgment is re-quired if finite lives between 10,000 cycles and 100,000cycles are to be considered for large structures. Al-though the comparison of the fatigue characteristics ofmaterials in Fig. 27 does not include many importantconsiderations concerning stress state and environment,it does provide the "caution light" when increasingstructural performance is projected simply by substitutinga material with a higher YS and maintaining, or even, asis frequently the case, increasing the nominal relativedesign stress. The relationships in Fig. 27 readilyshow why low cycle fatigue was not a problem with ola,conventional carbon steels, but they also show that lowcycle fatigue becomes a rapidly increasing problem withthe use of high strength materials.
CONCLUSIONS
1. The D6AC and 4335 steels tested at a 210-ksiYS level were found to possess significantly lowerresistance to low cycle fatigue crack growth in an airenvironment compared to that for lower strength steels.These high strength steels were found to develop rapidfatigue cracking under nominal elastic loading, and exhibitextremely rapid fatigue crack propagation rates at posi-tions of localized plastic strain.
2. The introduction of a 3.5% salt water environ-memt grossly accelerates crack growth rates in both steels.The 4335 steel was affected to a greater extent and showedvisible evidence of extensive stress corrosion cracking.
3. In comparing the low cycle fatigue crack propa-gation characteristics of structural steels possessingYS levels from 50 to 210-ksi, it is concluded that theproblem of low cycle fatigue life in materials such asD6AC and 4335 at a 210-ksi YS level greatly exceeds thedesign problem of the currently-used lower strengthmaterials for application in large welded structures.
25

ALUMINUM ALLOYS
ER.W. Judy, Jr., and R.J. Goode]
The fracture toughness studies on the spectrum of alum-inui7 alloys were initiated at a later date than thosefor steels and titanium. To- date, a very preliminaryfracture toughness index diagram (FTID) for aluminumhas been developed, based on drop-weight tear test (DWTT),explosion tear test (ETT), and yieid strength (YS) cor-relations. This diagram, which has been modified to shownew data, is shown in Fig. 28 along with the alloys andtempers studied (indicated next to the data points).
FRACTURL TOUGHNESS INDEX DIAGRAM
The fracture toughnesE propertie of tne various alloysas measured by the DWIr were determinec in the strong(RW) and weak (WR) orientations (5) and, as indicated bythe data points, considerable anisotropy is noted for allbut the highent.strength -'loys. The optimum materialstrend line (OMT,!) is show for the strong direction andindicates the highest leveL of attainable fracture tough-ness for any given level of strength. The ETT performancecorrelation with DWTT ene:gy delineates plastic overloadcapabilities for materiel: exceeding 200-300 ft-lb DWTTenergy. MaterialF havy Jg DWTT energies below 200-300 ft-lbdevelop and propagate -st-running fractures throughelastic stress fields: this is characterized in the ETTby generally flat breaking, accompanied with either ex-tensive fracturing or shattering. Above 300 ft-lb DWTTenergy, plastic overload capability of the material isdemonstrated in the ETT by the development of variouslevels of plastic strain corresponding to increasingvalues of DWTT energy. The impingement of the elasticto plastic strain overload capability dividing zone of,,WTT energy (hatched band) with the OMTL indicates thatat 60 to 80-ksi YS most materials should be expected topropagate fractures at elastic stress levels. Between50 to 60-ksi YS range, optimized alloys if well cross-rolled may exceed this low level of fracture resistance.Below 50-ksi YS, a wide range of alloys that would requirehigh plastic -verloads for fracture propagatio;A should bereadily attainable. However, it must be pointed out thatthis high plastic overload capability is also accompaniedby a relatively low intrinsic energy absorption in fracturepropagation compared to steels and titanium. This isevident from the low DWTT energy values indexing plastic
)o

strain requirements for fracture propagation in thealuminum FTID. Where large regions of a structure aresubjected to plastic over--oads, an engineering judg-ment must be made to determine if fracture safety isactually attained or if rupture is possible over alarge area. For most structures where plastic over-loads are confined to local geometric points that arestress indeterminate, the general engineering caseanalysis can be applied, that is, separation betweenthe fracture-safe (plastic strain required for fracturepropagation) and potentially fracture-propagating(fracture propagation at elastic stres levels) alloys.
DROP-WEIGHT TEAR TEST AND EXPLOSIONTEAR TEST RFSLrLTS
Six DWTT specimens of 7079-T6 alloy - three each in theRW and WR orientation - were tested in the 5000 ft-lbpendulum machine. The DWTT energy indicated in thesetests were very low, as could be expected from the highYS (-68,000 psi)(2) of this alloy. Each of the WRspecimens absorbed 111 Ft-lb; two of the RW specimensabsorbed 397 ft-lb, and the third absorbed 339 ft-lb,An interesting feature of these tests was the appearanceof the fracture -,faces of the specimens All of thespecimens had the appearance of delamination (Fig. 29).The fracture sur-aces of tVe RW specimens, which weremore severely dela-minated, were characterized by deepcracks and steps perpendicular to the fracture surface.The steps and possibly the cracks were probably formeCoy shear failure, or failure of large sheetlike precipi-tated films which are responsible for the high strengthof the material.
Several ETT tests were conducted on 6061-T651 all-y(DWTT 750 ft-lb). In previous tests, this alloy hasbeen tested extensively to e.,tabiish the m,,A•:um amountof plastic strain which co)uld be coi-related wi-h 750 ft-lbDWTT A specimen which had been p-eviously tested (Ref. 9.Fig. 14) was loaded a second time to approxima' *ly thesame plastic strain level (7 3%) Tne flaw in the secondtest was the i0-in, flaw which developed in the first •estof this specimen. The result of tl second test was thecomplete fracturing of the specimen at one end (Fig. o0).Another 6061-T651 specimen was loaded t, 8.2% plasticstrain with the resulting fracture extending a tot.i of11-in. (Fig. 31); this result indicates that thL 6061-T651alloy has the capability to withstand plastic straiii proo-ably in excess of 9T without fracturing A 2024-,4
2 -,

specimen (DWTT 367 ft-lb) fractured completely whentested with load conditions that would have resultedin a 3.7% strain level (Fig. 32), indicating that thespecific allowable strain level for this alloy is lessthan this value.
Specimens of 5086-H112 (DWTT 2026 ft-lb) were tested inthe ETT with a very short fracture resulting from loadingto 8.3% plastic strain (Fig. 33). The fracture extendedinto the plate material 3/4-in. at one end of the brittleweld flaw and barely extended into the plate material atthe other' end.
e PANE STRAIN FRACTURE TOUGHNESS
TESTING OF TITANIUM
[C.N. Freed and R.J. Goode]
All practical engineering structures contain flaws orcracks which develop either during the forming or fabri-cation operaticas; such flaws are not always detected byiiispection, or they may develop in service under conditionsof low cycle fatigue. Therefore, to preclude catastrophicfailure resulting from the presence of flaws, one of twoconditions must be known at all times: 1. - the struc-tural material is of sifficient fracture toughness so thatthe presence of these flaws will not trigger unstablecrack propagation under the specific elastic or plasticloading conditions, i.e., material must undergo somedegree of plastic straining with resultant minimal crackextension, Gr 2. - the exact level of stress (load plusresidual) at critical sections of the structure and cor-responding critical flaw sizes must riot only be known, butit qmjst also be assured that the flaws will be detectedprior to and during service before they can ever reachcritical size, Condition 2 becomes more important asrequirements dictate the use of ultrahigh strength metalswhere small flaws can initiate failure at low levels ofelastic strain.
The stress field at a crack tip may be defined by a singleparameter, K, the stress intensity factor. The parameteris a function of the applied stress and the crack geometry.Determination of the plane-strain fracture toughness, KIc,as a material property will provide a measure of the re-sistance of a crack to unstable propagation under anapplied stress as well as define the critical crack sizefor the material
28

MATERIALS AND PROCEDURE
The purpose of this investigation is to define thestrength limitations of the practical application offracture mechanics in determining valid fracture tough-ness numbers for the best (optimized) of the high andultrahigh strength steels, titanium, and aluminum alloys.4owever, in this initial effort unalloyed titanium (T-17)was investigated, using single-edge.-notched and side-notched specimens, since it was available in quantityand was known to be low in fracture toughness. Thismaterial had a yield strength (YS) of 83-ksi, ultimatetensile strength (UTS) of ll-ksi, 600 ft-lb drop-weight tear test (DWTT) energy, Charpy V (C.) notchenergy of 15 ft-lb at room temperature, and uniformthrough-thickness properties. The low DWTT energy vaueinitially indicated that the plane strain fracture tough-ness (KIc) of this material should not be difficult tidetermine. It should be mentioned that these frapturetoughness properties are considerably below what wouldbe expected for an optimized alloy at this level ofstrength, but it does represent what would generally beexpected of titanium alloys of above 140-ksi YS.
The effect of side-notching was also investigated. Itwas believed that the side-notch would constrain theplastic zone at the tip of the crack. This would allow1. - smaller specimens to be used in order to obtainvalid KIc values, and 2. - fracture mechanics numbersto be determined for materials of lower strength andhigher toughness. Although an analytical analysis isnot available for computing KI from side-notched speci-mens; an empirical -method has Been evolved. As the re-sults show, the use of the test data to provide validKIj results at a temperature of interest hinges upon thedevelopment of an analytical method for the side-notchedspecimen.
TEST RESULTS
Before initiating the study. it was deemed necessary toascertain the optimum specimen dimensions to provide validresults. In conjunction with Dr. J. Krafft (MechanicsDivision, U.S. Naval Research Laboratory), tests were madeto determine the relationship between the size of theplastic zone at the tip of the crack and the geometry ofthe edge-notched specimen. It soon became ubvious that

for titanium with a low strength-to-toughness ratio theplastic zone would be so large as to necessitate speci-mens exceeding one inch in thickness at room temperature.As it was not desirable to test specimens over 1-in.-thick at the beginning of the study, the technique ofside-notching was investigated.
The compressive stress-strain curve for 0.2% offsetand the strain hardening exponent at temperatures between-320*F and 70*F was determined for T-17 with the use ofcompression plugs by Dr. Krafft. Using the techniquesdescribed in Ref. 1C, the KIc values were calculated anda KIc versus test temperature curve was established.This curve is shown in Fig. 34. Two different size speci-mens were used in this study; these, are shown in Fig. 35.
After machining and notching the specimens, a 0.01-in.-deep fatigue crack was introduced at the root of thenotch. Plane strain conditions were established at tem-peratures of -24 0 F and below with these single-edge-notched specimens; "pop-in" or sharp changes in slope(crack initiation) was discernible on the load-deforma-tion curve. The KI values calculated for these tem-peratures were considered valid and, as seen in Fig. 34,define the same curve already established from thestrain-hardening data. However, at the temperatures of9°F and 60 0 F, crack instibility could not be determinedfrom the load-deformation curve and KIc values could notbe calculated. The reason for this is explained by thelower curve ir Fig. 34 which shows that the plastic zoneradius (ryP• increases rapidly with temperature. Inorder to maintain the plane-strain condition in the speci-men, ry must not exceed 0.25-in. for the l-in.-thickspecimen. An excessive plastic zone size will result inplastic flow at the root of the notch before fractureinitiation and, consequently, no sharp demarcation orstress release is seen on the load-deformation curve.
A side-notched, l-in.-thick specimen (Fig. 35) wastested at 60OF to determine if the constraint of theplastic zone by the side notch would be s'fficient tomaintain plane-strain conditions. The Kic value for this
* The plastic zone radius, ry - (Kic/ 6 ys)2 1/2ff. As bothKic and yield stress are temperature dependent, plasticzone size also varies with temperature.
30

specimen fell below that determined for the smooth specimensat --20OF and -40 0 F. This lower KIc value is understandablesince the plastic zone even for the side-notched specimenwas greater than one-fourth of the plate thickness. Thevalue of the side notch may be seen in the load-deflectioncurves of Fig. 36. In curve "a", KIc calculated usingmaximum load would be excessively high, and a criticalflaw size based on this number would be larger than theactual flaw size. In curve "b", the KIc is 9% low, andthe size of a critical flaw based on this KIc might be con-sidered on the conservative side. Thus, for cases in whichthe specimen thickness is less than 4ry, a lower Kic willbe obtained from side-notched specimens. This means thatside-notching can be utilized to constrain ry for toughermaterials than can be dealt with by conventional single-edge-notched specimens, A way of handling the added con-straint of the plastic zone will have to be incorporatedinto whatever fracture mechanics analysis tecbniques aredeveloped for calculating a valid KIc from this typespecimen.
Small side-notched specimens were tested over a temperaturerange of -320OF to 75 0 F to determine the effect of thethickness of the unbroken ligament (Fig. 35) on the KIcvalues obtained Although the unbroken ligament was variedfrom 20 to 70% of the total specimen thickness, no signi-ficant difference was found in the KIc values at any tem-perature The technique for calculating KIc for side-notched specimens is described in Ref. 17.
The test results revealed that the plane strain fracturetoughness values were valid over the temperature range of-3200F to -180 0 F. Above -1800F, the KIc values departedfrom the curve established with the 1-in.-thick specimensand the strain-hardening exponent, and became more or lessconstant, Fig. 34. Here again ry exceeded one-quarter ofthe specimen thickness criteria (0.0625") although crackinstabiiity was detectable. Thus, it appears that side-notching do2s not change the specimen thickness requirementeven though it does extend the range of temperature atwhich crack instability can be determined.
The effect of orientation on Kjc is shown in Fig. 37 forT-17. The upper curve, which is the same one shown inFig. 34, is the RW (transverse fracture direction andthe lower, the WR (longitudinal fracture direction) withrespect to rolling direction (5) Here it can readily be

seen that anisotropy is important and must be taken intoaccount in measuring plane strain fracture toughness.The side-notched 1-in.-thick specimen provided an accuratemeasure of KI up to +10*F. This is evident in that thevalues determined from -75*F to +10*F using the side-
nbtbhed specimens increase in a linear manner with ap-proximately the same slope as the specimens broken atlower temperatures which were not side-notched. Again,at 60OF the KIc determination for the WR specimen islower even though crack instability was observed sincery exceeded one-quarter of the specimen thickness.
DISCUSSION
At the beginning of this study, it was considered thatthe room temperature plane strain fracture toughnesscould be determined for titanium material with as lowa DWTT energy as T-17 possessed. However, this has notbeen the case with T-17; the 600 ft-lb DWTT energy cor-responds to the DWTT energy of an optimized (deducedfrom OMTL curve) titanium alloy of about 150-ksi YS atthe same 1-in. thickness. Limited data developed to dateat the 150-ksi YS level for optimized material indicatesthat the ductility of the high strength alloy may be asmuch as 50% lower than the ductility of unalloyed titan-ium at 83-ksi, 10% elongation versus 25% elongation,respectively. Whether this, or some other materialproperty, has any bearing upon the difficulties encoun-tered with T-17 is not known at this time. Work cur-rently in progress on "optimized" or "nearly optimized"alloys ranging in strength from about 110-ksi YS to180-ksi YS indicates that a measure of crack instabilityis detectable at room temperature over most of this rangeif side-notching is used. However, if the KIc calculatedfrom side-notched specimens is found to be low (when theplastic zone radius is greater than one-quarter the thick-ness of the specimen), the usefulness of side-notchingwill be seriously impaired. Therefore, the developmentof an analytical means for treating side-notched speci-mens is imperative. It must be remembered that foroptimized materials having a level of fracture toughnesswhich requires side-notching techniques for KI, determin-ations, plastic straining will probably occur In thepresence of reasonably sized flaws. FoL" these materials,simpler and less expensive tests are available to measurefracture toughness, and KIc values per se would be ofacademic interest.
32

REFERENCES
1. Puzak, Lloyd, Lange, Goode Huber. Dahlberg. andBeachem. "Metallurgical Characteristics of HighStrength Structural Materials (First QuarterlyReport) ," NRL Memorandum Report 1438, June 30,1963
2. Goode, Huber, Howe, Judy, Crooker, Morey, Lange,Puzak, and Lloyd, "Metallurgical Characteristicsof High Strength Structural Materials (FourthQuarterly Report)," NRL Report 6137, June 1964
3. Pellini, W.S., and Puzak, P.P., "Factors thatDetermine the Applicability of High StrengthQuenched and Tempered Steels to Submarine HullConstruction," NRL Report 5892, December 5, 1962
4. Huber, R.W., and Goode, R.J., "Fracture ToughnessTests for Titanium Allcy Plate and Forgings,"NRL Report 6228, April 21, 1965
5. ASTM Materials and Research Standards, Vol. 1,No. 5, May 1961
6. Pellini, W.S., Goode, R.J., Puzak, P.P., Lange,E.A., and Huber. R.W., "Review of Concepts andStatus of Procedures for Fracture-Safe Design ofComplex Welded Structures Involving Metals of Lowto Ultra-High Strength Levels," NRL Report 6300,June 1965
7. Crooker, Morey, Lange, Judy, Freed, Goode, Puzak,Lloyd, Huber, Howe, and Pellini, "MetallurgicalCharacteristics of High Strength Structural Mater-ials (Fifth Quirterly Report)," NRL Report 6196,September 1964
8. "Grain Size Control in Ti-7A1-2Cb-lTa Type Alloys,"ITT Research Institute, Final Report, ContractN600 (61533) 59850
9. Pellini. Goode, Huber, Howe, Judy, Puzak, Lloyd,Lange, beFelice. Crooker, Morey, Chapin, andMcGeady, "Metallurgical Characteristics of HighStrength Structural Materials (Sixth QuarterlyReport)," NRL Report 6258, December 1964
10. Dorshu, K.E., and Lesnewich, A., "Development of aFiller Metal for a High Toughness Alloy Plate Steelwith a Minimum Yield Strength of 140 KSI," AirReduction Sales Co. Murray Hill, N.J.
33

11. Puzak, Lloyd, Goode, Huber, Howe, Crooker, Lange,and Pellini, "Metallurgical Characteristics ofHigh Strength Structural Materials (Third QuarterlyReport)'," NRL Report 6086, January 1964
12. Crooker, Morey, and Lange, "Low Cycle Fatigue CrackPropagation Characteristics of Monel 400 and MonelK-500 Alloys," NRL Report 6218 (publication pending)
13. Crooker, Morey, and Lange, "R6port of NRL Progress,"June 1964, pp. 30-33
14. Carman, C.M., Katlin, I.M., and Paris, P.C., "LowCycle Fatigue Properties of High Strength SolidPropellant Rocket Motor Materials," Fourth MaragingSteel Project Review, Air Force Materials Laboratory,Dayton, Ohio, June 164
15. Hanna, G.L., Troianu, A.R., and Steigerwald, E.A.,"A Mechanism for the Embrittliment of High-StrengthSteels by Aqueous Environments," ASM TRANS QUARTERLY,September 1964
16. Krafft, J.M., "Correlation ol Plane Strain CrackToughness with Strain Hardening Characteristics of aLow, a Medium, and a High Strength Steel," Appliet3Materials Research, pp. 88-101, April 1964
17. Freed, C.N., and Krafft, J.M., "Effect of SideNotching on Measurements of Plane Strain FractureToughness." Presented to the Committee on FractureTesting of High Strength Metallic Materials,Washington, D.C., May 12, 1965.
34

Table ITest Data for Solution Annealing and Aging Treatments
on the Alloy Ti-W-4&i-2bo (T-55) 69( transus = 1840'F ? 15 F)
ILonigitudinal (RW) Transverse (WR) -C.-notch Impact Cv-notcb Impact .2% Offset R
Solution Heat Treatment Aging Heat Treatment I Energy (ft-lb) Energy (ft-lb) YS TS Elong. RA.. . .(k )id (k ) (%) (%)
-80-F f 3 2 OF -80 1 .eo3:2ýF
As received condition 18.5 25.5 18.5 26.5 121.4(L) 125.0(L) 10.7 29.5111.8(T) 131.0(T) 9.3 29.4
1800°F-I Hr.-W.Q. 15.0 23.0 17.0 16.0
1800"F-1 Hr,-W.Q. 1100-F-2 Hr.-A.C. 13.5 11.5 13.0 12.0 152.2(L) 168.0(L) 4.3 8.2160.!(T) 174.2(T) 4.3 7.5
1800°F-I Hr.-W.Q. 1200'F-2 Hr.-A.C. 12.0 15.5 13.0 16.5 150.9(L) 162.9(L) 5.0 12.4150.5(T) 163.0(T) 5.0 10.6
1750-F-1 Hr.-W.Q. 21.5 22.0 17.5 21.5 116.6(L) 148.2(L) 10.0 14.9118.6(T) 148.2(T) 9.3 21.2
1750°F-1 Hr.-W.Q. 1100-F-2 Hi-.-A.C. 14.0 17.5 15.5 20.0 138.7(L) 156.8(L) 4.3 8.2153.8(T) 169.0(T) 5.7 14 2
1750°F-I Hr.-W.Q. 1200'F-2 Hr.-A.C. 21.0 27.5 20.0 26.5 134.2(L) 148.2(L) 4.3 9.V141.0(T) 153.8(T) 7.1 19.4
1700•i-1 Hr.-W.Q. 21.0 26.5 21.0 26.5 99.1(L) 136.4(L) 12.1 25.2118.6(T) 145.9(T) 12.1 23.5
1700-F-I Hr.-W.Q. IlOOeF-2 Hr.-A.C. 15.5 20.0 15.0 19.5 134.4(L) 149.5(L) 5.7 14.2132.4(T) 148.2(T) 5.0 13.6
1700'F-1 Hr.-W.Q. 1200 0 F-2 Hr.-A.C. 22.5 27.0 20.0 26.5 130.9(L) 144.3(L) 7.9 16.5135.5(T) 146.9 M) 10.7 26.2
1650"F-I Hr.-W.Q. 19.5 29.5 22.0 30.5 106.4(L) 137.3(L) -.. 7 28.5106.1(T) 141.6(T) 10.7 29.5
1650-F-1 HL-.-Q. 1100°F-2 Hr.-A.C. 16.5 23.0 17.5 23.0 127.0(L) 140.1(L) 6.4 14.1131.9(T) 141.4(T) 9.3 17.1
1650--F-I Hr.-W.Q. 1200"F-2 Hr.-A.C. 20.5 30.0 24.0 28.0 12o.BtL) 138.3(L) 9.3 24.0127.5(T) 134.7(T) 8.6 18.8
1800'F-1 Hr.-A.C. 25.0 41.0 28.0 39.5
1800"F-I Hr.-A.C. 1100*F-2 Hr.-W.Q. 25.0 36.0 23.0 30.5 120.6(L) 131.8(L) 7.9 24.5124.1(T) 136.4(T) 10.0 19.5
1800*F-I Hr.-A.C. 1200*F-2 hr.-W.Q. 27.0 40.0 33.5 3.8.5 119.61L) 131.4(L) 9.3 24-5125.8(T) 133.7(T) 10.0 21.7
1750'F-I H-.-A.C. 27.0 34.5 28.0 37.5 116.04L) 133.OtL) 12.1 30.8116.4(•T) 132.0(T) 11.4 24.7
1750"F-1 Hr.-A.C. 1100'F-2 Hr.-W.Q. 23.0 32.5 26.5 37.5 118 2(L) 132.4(L) 10.0 24 0122.9(T) 134.4(T) 10.7 26.7
1750"F-1 Hr.-A.C. 1200'F-2 Hr.-W.Q. 24.5 32.0 24.5 37.5 118.2(L) 128.5(L) 9.3 31.1121.9(T') 131-8(T) 10.7 262
1700*F-I Hr.-A.C. 25.0 34 0 31,5 36.0 110.4(L) 131.3iL) 12-1 30 8114.5(T' 130 S(T) 11 4 34.6
1700*F-I Hr.-AC. 1100'F-2 Hr. -W.Q 27.0 34.0 26.0 305 115 I(L) 1286iýtL) 11 4 28.5119 6(T) 129 •iT) 10.7 36.4
1;0"'F-1 Hr -A C. 1200'F-I Hr -W.Q. 25.5 360 230 32 0 219 ML) 134 •tL) 10 7 31 6i11.9(T) 13! 1,T) 1 7 31 1
PT, Transr ersc d:r.l~ofn t~wR
35

Table 2Test Data for Solution Annealing and Aging Treatments
on the Alloy Ti-6Al-4Zn-2Sri-.5Mo-.5V (T-68) (0 transus = 1865 0 F , 15'F)
Longitudinal (RW) Transverse (WR) !C,-nOtcb Impact C,-notcb L-npact .2% OffsetSUTS Flong. 1RA
Solution Heat Treating Aging Heat Treatment Energy (ft-lb) Energy (ft-lb) YS TTi) (ks) (%)
-80-F ,32°F -80°F +320 F
AM received 20.0 18.0 113.5(L) 121.1(L) 10.7 30.0124.0(T) 130.2(T) 10.7 28.4
18507F-1 Hr.-W.Q. I 18.5 24.5 20.0 26.0 122.7(L) 150.9(1.) 8.4 08.8i 124.8(T) 154.2(T) 8.4 11.2
1850°F-1 Hr.-W.Q. 11000F-2 Hr.-A.C. 20.0 19.0 14.5 19.0 140.9(L) 155.8(L) 7.7 13.7139.5(T) 153.5(T) 4.3 6.9
1850"F-1 Hr.-W.Q. 1200°F-2 Mr,.-A.C. 16.0 22.5 16.5 1v.0 137.9(L) 150.2(L) 5.7 8.2137.9(T) 150.5(T) 5.7 9.3
1800 0F-I Hr.-W.Q. 21.5 29.5 27.0 A9.0
1800"F-I Hr.-W.Q. 1100'F-2 Hr.-A.C. 21.0 29.0 24.5 35.5 141.0(L) 152.5(L) 7.9 14.9S44.9(T) 156.5(T) 7.1 12.3
1800"F-I HEr.-W.Q. 1200"F-2 Hr.-A.C. 20.5 28.5 23.0 30.5 131.1(L) 141.0(L) 7.1 23.5137.8(T) 147.8(T) 6.4 18.8
1750'F-1 H- -W.Q. 23.0 30.0 27.0 35.0 119.9(L) 141.6(L) 7.9 25.2124.7(T) 144.3(T) 7.9 25.01750'F-1 Hr.-W.Q. 1100°F-2 Hr.-A.C. 20.5 28.5 24.5 30.0 128.6(L) 137.9(L) 5.7 15.4134.1(T) 137.7(T) 7.9 15.9
1750'F-1 Hr.-W.Q 1200*F-2 Hr.-A.C. 22.0 26.5 26.0 34.0 127.0(L) 136.6(L) 6.4 23.5132.2(T) 142.0(T) 7.9 22.8
1700°F-I Hr.-W.Q. 22.5 27.5 23.0 37.5 109.9(L) 124.7(L) 9.3 32.6120.2(T) 133.4(T) 13.7 32.7
1700'F-I Hr.-W.Q. 11000F-2 Hdr.-A.C. 22.5 32.0 22.5 29.5 128,0(L) 135.3(L) 10.0 23.5132.1(T) 140.3(T) 9.3 22.3
1700°F-1 Hr.-W.Q. 1200"F-2 Hr.-A.C. 21.0 28.5 26.5 32.5 120.4(L) 126.3(L) 9.3 28.0120.9(T) 127.1(T) 9.3 29.0
1850;F-1 Hr.-A.C. 23.0 36.0 : 5 30.5 118.4(L) 130.6(L) 10.0 22.9120.0(T) 132.0(T) 10.0 20.2
1850-F-1 Hr.-A.C. 1100'F-2 Hr.-W.Q. 26.5 30.5 25.5 29.0 121.2(L) 131.2(L) 10.0 26.4121.7(T) 131.3(T) 10.0 25.2
1850 F-I Hr.-A.C. 1200'F-2 Hr.-W.Q. 23.0 33.0 24.5 34.0 121.7(L) 131.6(L) 9.3 24.1122.7(T) 132.3(T) 10.7 24.1
1800"F-1 Hr.-A.C. 31.0 34.5 27.0 45.5
1800*F-I Hr.-A.C. 1100"F-2 Hr.-W.Q. 30.0 37.5 26.5 38.0 119.4(L) 126.0(L) 9.3 26.5120.0(T) 131.0(T) 9.3 30.6
1800'F-I Hr.-AC. 1200'F-2 Hr.-W.Q. 23.0 33.0 27.0 45.5 113 7(L) 121.7(LW 10.7 23.5119.4(T) 127.6(T) 10.0 30.0
1750*F-1 Hr.-A.C. 25.5 37.5 28.0 35.0 108.0ý L) 124.5(L) 10.7 29.5110.4MT) 131.O(T) 10.7 30.0
1750"F-I Hr.-A.C. 1100"F-2 Hr.-W.Q. 25.0 38.5 27.0 44.5 108.1(L) 117.O(L) 10.7 43.9
11B.0(T) 127.3(T) 11.4 34.91750'F-1 Hr.-A.C. 1200F-2 Hr.-W.Q. 37.5 27.0 36.5 118.0(L) 126.7(L) 10 28.5
119.0(T) 128.0(T) 13.7 30.1
1700" F-1 Hr. -A C. 28.0 36.0 25.0 30.0 1;. 41L) 123.86L) 12.1 348107.0jT 1 19.9(T) 10 7 41.4
1700"F-I Hr.-A C. 1 1JU*F-2 Hr.-W Q 24.5 32.5 27.0 37.5 116.9vl, 127. IiLI 10.0 21.2
124 01) 132.3(T) 12 1 2521700*F-I Hr.-A.C. 1200'F-2 Hr.-W.Q. 23.5 30.0 23.5 37.5 11, 5iL) 125.2iL) 10.0 Is c
117.6iT) 124.6,T) 10.0 7 .3
(Ti Tranverse dire,-ir, (WRi
3o

ýk44 owIL D 4 L4L4
U) 0 0 0 0 0 0 0 0 0 0 0 000 00 00 00 00 00LMO mO mo) 0 W 0 tfo infOt- - E- V-4 -V-4 - V- -4 -V- r-
CO)0
~~CO)bO C4
0 a
coE r-41C
C6C.: 0& C cl Cý Lf , ''Cq p
C CC' CJiCýC C'JC' c,-i m L w C;J"
0- HeJe eJ-4 E"~ H-
V4 M- r-4 V-4 - -4 CV "4 w4 .- 4 C- - ý
"" " W n C mJqmC S 1
co o' 00 . U:ý M, c 6U: C- - C 9r
>J¶ -4. "' C.J C14 W- N -4"004 V- W4 4
, I II I II I
HH H -H H Hf71
"d -4

0
CV) Lfl Lfl N
00C) ) 0
in to cvn Iu14
oo w~0 Ii
Q)jE4 in EL;0Ln c
4)., E' ý! 1' CqC
sd 04 '. IO
in t
o -;mq.Id 0o IVP0 -.4"
I eL
4) ;: I
1. :.4
L4 S-4 -4~ 0> 12> >1
0. u 00P.4

78 c"4C Cý1 01 V4 -
0 0J
L4O
14 C0 0>0
E'0 ~ 0~ VO aU
1.4 4 L4 flU
0~-
u~~~ znU 1 W0U r
1. to1 r cdQC4 'r a) C46
c 0~ -
- .l
5.F4 4-
V-44-.
-, I .,14~ el
C-Z * -

r-~-S 0r
> > ~0 0% w 0o 0 .C
2A I (d .-. S r. - o U0 C6 0 CL 0 C6CD
LL O E-
0 w '
cc .0. * o
g~ -- Mt-Aino VLO L1 In uLe)
w _ _ _ _ - - _ _ _ a_ -w :4c~* F4
00Q
- -e U-4 I
0, 0
0' Vo 0m e
co C'4. Co 06 Co ico c
CUo CIDC 00 co~CL
- -- v
~n -440

co P-
a) Q)
144 v)
00 0
eq cW II cq
Coc CO O
P4, .- k ~ o C
Q) CO e0 n 0
0d Oi 0* U,
41

(S81 -I J) A90I3N3 A AdHVH3 :10 39KV8 140, 0
0 41' I>
>t
~uU
all, VJ J~
~~4I
"d41
ZF wz
"r4 0IL A k N .
H ~8
o :>V
424

16C.AGED 1100 F - 2 MRS - AC
AGED 12OO*F -2 HRS-ACAGED IIO0F -2 MRS-WO
10 AGED i2OOF - 2 HRS- WO
0 LONGITUDINAL DIRECTION (RW)
A TRANSVERSE DIRECTION (WR)
_140WATER QUENCHED AFTER
SOLUTION ANNEAL
411 --
I10-
I I I I I11650 1700 1750 1AFE
SOLUTION ANNEALING TEMPERATURE (OF) FOR I HOUR
Fig. 2 - Effects of variations in solution annealingtemperatures on the yield strength of the alloyTi-6A1-4Zr-2Mo (T-55) with aging treatment
IS AGED I 100 F - 2 MRS AC
AGED 1200 F -2 MRS -AC
AGED IIOO*F-2HRS-WQ
AGED 1200 F- 2 MRS- WOI50 O 0 LONGITUDINAL DIRECTION (RW)
A , TRANSVERSE DIRECTION (WR)
140WATER QUENCHED AFTER • . .-..
SOLUTION ANNEAL
I,-4,Z 130 -
II0 AIR COOLED AFTERSOLUTION ANNEAL
I-
1700 1A50 1800 A850
SOLUTION ANNEALING TEMPERATURE (OF) FOR I HOUI4
Fig. 3 - Effects of variations in solution anneal-ing temperatures on the yield strength of thealloy Ti-6A1-4Zr-2Sn-.5Mo-.5V (T-68) withaging treatment
43

60
0 • LONGITUDINAL DIRECTION (RW)A • TRANSVERSE DIRECTION (WR)
50
@ 40
00Ua 0 0
wIA 2-30
0
010--
010
0 I I I I I I I110 115 120 125 130 135 140 145 150 155 160
YIELD STRENGTH (KSI)
Fig. 4 - Summary of Charpy V energy and yield strengthrelationships for the alloy Ti-6A1-4Zr-ZMo (T-55)
60
0 • LONGITUDINAL DIRECTION (RWA • TRANSVERSE DIRECTION (WR)
50- o •oo o
00
0 Ao o oAA 00
!lO 15 10 1 0 10 I0 5 10 15 5 5 6
0
0.0w
0110 115 120 125 130 135 140 145 150 155 160
YIELD STRENGTH (KSI)
Fig. 5 - Summary of Charpy V energy and yield strengthrelationships for the alloy Ti-6A1-4Zr--Sn-.5Mo-.5V (T-68)
44

TENSILE (YIELD STRENGTH)
D LONGITUDINAL TRANSVERSESPECIMEN U SPECIMEN
ISO5 CHAPPY (C,( * +32-F
RW SPECIMEN WA SPECIMEN so5
140 - -4
p I- 40S
130 I - 35
30~
1I20 -2U )
* ~20
1010
0I8W*F- I A-AC 170F-IMA-WO 1650*F-IMRW H8W-II-W0 1 800E-INRRWO 100FI1-QI00*F11 AC.I200F-2HRS-Wg C200*F-2HRS-AC 1200*F-214RS-AC I iOOE- 21~SAC '200F-2NR5 AC 1100F-2HRS-1W0
TI-6AI-4Zr-2Mo (T-55) 4- -TI-6AI 4Zr-ZS4- 5Mo- SV IT -S)
Fig. 6 - Effect of heat treatments on the Charpy V-notch energy of the alloys Ti-6Al-4Zr-2Mo (T-55)and Ti-6A1-4Zr-2Sn- .5Mo- .5V (T-68) in the 120-145-ksi yieldi strength range
0-J
0--
o-,
110 115 120 125 IS0 355 140 145 ISO 155 ISO
YIELD STRENGTH CR51)
Fig. 7 -Summary of Charpy V energy and yieldstrength relationships for several titanium alloys
45

140
COVERED ELECTRODES
120
100-
C %C %Mn %Si %Ni %Cr %Mo %v
.04 1.86 .27 1.74 .94 47o7 F28 T6 55, F5 2 73LL 80 P. M I 2000.
(. Z-7XX-,IC ,'d 600zSO()
0040 0°40- 00 AA-XXX
30"F
201
0 1 180 100 120 140 160 180 200
YIELD STRENGTH (KSI)
Fig. 8 - Charpy V and yield strength values developed withexperimental covered stick welding electrodes
46

140
MIG WELD METALS
120 ,9xxx
I5XXGOOF
%C %Mn %S1 %Ni %cr %M0 %LV100 05 130 22 155 .11 .33
II 205 43 293 F47 o0 79_o %Cu %P %S %Ti
.05 .003 .Okt .015±
1- 80 d .5 6 .i,5 1,5LLU*PH 8 I. 225"F
0o 0 080OFLLJ 60 f -0°Z0
14XX
40-60OF COVERED ELECTRODES
20-4o I o I o
80 100 120 140 160 180 200YIELD STRENGTH (KSI)
Fig. 9 - Charpy V and yield strength values de-".loped withexperimental MIG welding; data zones far stick electrodesfrom Fig. 1 added for comparison
47

Fig. 10 -Crack-starter explosion bulge tests of 140-ksi yieldstrength covered stick electrode welds after two 7-lb Pentoliteshots: upper left, Airco plate; uipper righlt, McKay plates;lower, Arcos plate
48

A_
Fig. I - Crack-starter ýxplosion bulgetests of MIG interrupted-arc verticalwelds after two 7-lb Pentolite shots:upper, Airco plate- lcwer, Linde plate
4Q

Fig. 1Z - As-welded explosion b'Jwgc tests of 140-ksi yield strengthwelds: upper left, AircD f-vered stick electrode after 5 sýiots. upperright, McKay covered stick electrode after t shots; lower left, ArcoFcovered stick electrode after 6 shots, and lower riiht, Airco .MIGinterrupted-arc (vertical-uD) weld after t shot,:

"IP
Fi~a,. 13 - As- eUcco,_ bu1c e ~sts o., 1 3:, ar.:1 140-1 si v eied st t-
MUG ,-t:er rupted-arc- (%-rcai-u: wc. I s : -Žpe r, A'%!rco plate a!~ 4ý stlow.ve r I, I n .e plIa te aftc

EXPLOSION BULGE TEST-THICKNESS REDUCTION
20 - WELD,
AIRCO24-
20-
16-
8- 6 SHOTS
H
Z20 -ARCOS ZWL0
:)1-W.cr 06
0*5SW
z 8
4SOT4~ 3SHOTS
1HI SHOTS
4 3 2 WEL 2 3HO4
DISTANCE (IN)
Fig. 14 -Pl;,*e and weld metal thickness reduction;explosion bulge t. e s t in g of 140-ksi yield strengthweld metals
5 2

Fig. 15 - Weld crown ground-off explosion bulge tests of 140-ksi yieldstrength covered stick electrode welds: upper left, Airco plate after 6shots; upper right, McKay plate after 2 shots: and lower, Arcos plateafter 6 shots

! 46
Fig. 16 - Weld crown ground-off explosion bulge tests of 135 and 140-ksi
yield strength MIG interrupted-arc (vertical-up) welds: upper, Airco plate
after 4 shots; lower, Linde plate after 6 shots
54

Fig. 17 - Explosion bulge test plate No. 1, 167-ksi yield strength TIG weldmetal in lOZ-ksi yield strength 12-5-3 maraging steel: top, toe-crack afterfirst 7-lb Pentolite shot; bottom, side view showing deformation
5 5

Fig. 18 - Plate of Fig. 17, after two 7-lb Pentolite shot;bottom, side view showing deformation

Fig. 10 Explosion bulge test plate No. Z, matching TIG weld metalin~ 180-ksi yield strengt 1-5-3 rnaraging steel: top, toe-cracks atedge of w,.eld a-fte r three 7-lb P e nt oli t e shozs; bottom, side viewshowing deformation

Fig. 20 - Plate of Fig. 19 after fh:urth 7-lb shot: top, enlarged viev. of
weld cracks; bottom, side view of bulg.e
58

100\ I00 12-5-3 MARAGING STEEL
0WELDMENTSAGED AFTER WELDING
"(/, BULGE#I-I8HR 825 0 F•SBULGE#2- 6HR 950°F
80-
__2 H8 PLATE 4g-- 60 -- WELD-BULGE#*1 0 BULGE'#2/,K
(25F/IHR) (950 F /6 HR )A
:> H8 PLATE0 -/. (900 o F/ 3 HR)
"/ WEL D-BULGE *2
0L '"0< ' (9500 F/6HR)
0 ""• "•0/..,, A -H7 PLATE
ro40-0rO 0 •F• ., •O"o- (900 OF/ 3HR)
"0 J _
140 160 180 200YIELD STRENGTH (KSI)
Fig. 21 - Charpy V energy as a func:ion of ).leid streng•h for maragin4 gsteel plates and TIG weld rrmetals in relation to previous data for 1 -in.-thick plates
5Q

20 $000- 1 1 I I
PLATE BEND FATIGUE SPECIMENSD6AC AND 4335 STEELS
18,000- FULL-REVERSE BENDIAG CYCLE
PROPORTIONALLIMIT
16,000 - LT*
14,000-
zU)w 12,000 TOTAL STRAN RANGE
z51 '10,000
0z
z 8000ý-
cr
6000K
4000
2000-
PLA3riC STRAIN RANGE
00 0O1 02 03 04 0.5 06 0.7
DEFLECTION AMPLITUDE OINCHES)
Fig. 22 - Strain range-deflection characteristics of D6AC and 4335s:eel plate bend fatigue specimens in full-reverse loading cycle. Theproportional limit point of 5000 microinches/inch plas,-ic strain rangeis nearly identical for both materials.
60

HIGH STRENGTH 0 a T STEELSiPLATE BEND FATIGUE TESTFULL-REVERSE LOADING CYCLEF AIR ENVIRONMENT
L.Jp
XT
4 r
I
I Z
,0,
2 --
U Uzz
100'
g£
44 2.9
i -.
00,U 4 ' - .- 0- ,
U\ 2
Fig. 23 - Log-log plot of fatigue crack gr-,. e.h rite vsapplied total strain rang~e data in full- r!-.--,e rae bendingfor M6AC and 4335 stecIs in xn, air envi: onment
61
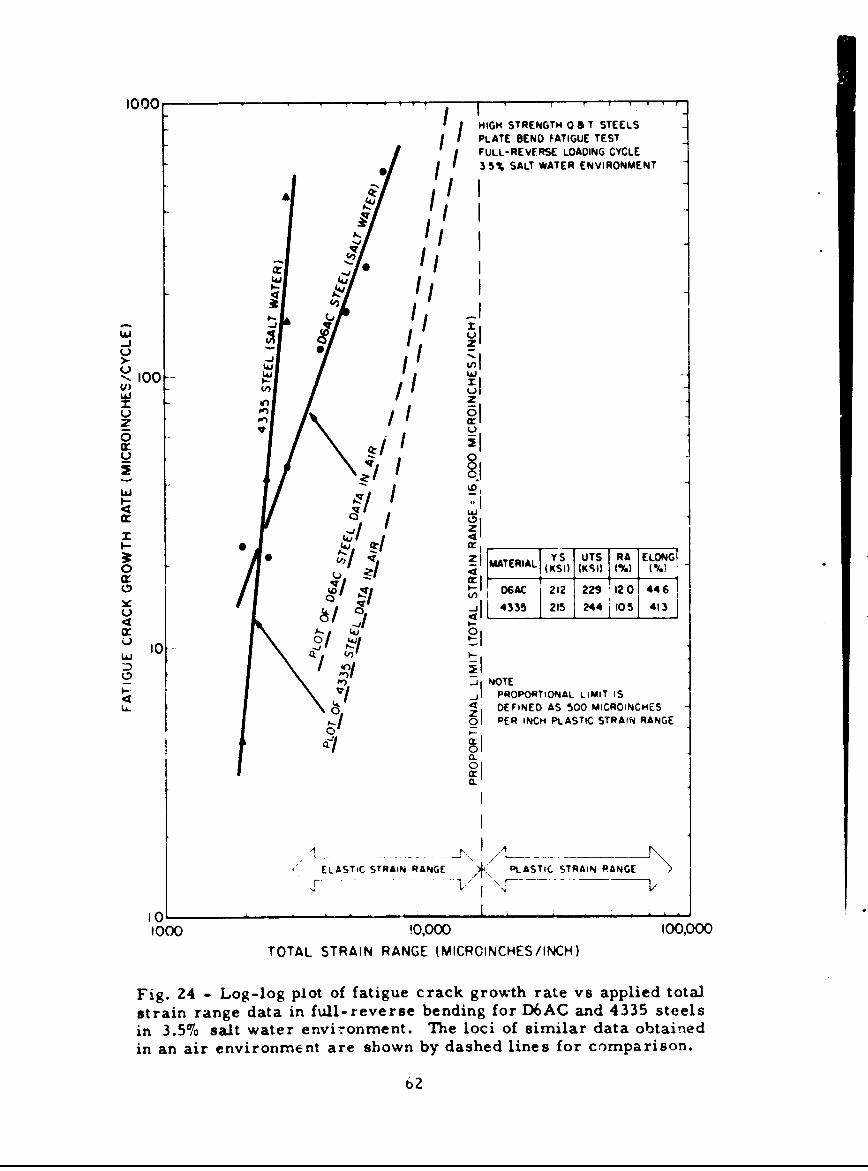
1000 . I ' 1 1 1 T "
I I HIGH STRENGTH 0 S T STEELSI I PLATE SEND FATIGUE TEST
F FULL-REVERSE LOADING CYCLES5% SALT WATER ENVIRONMENT
'4. II
i "II
wi -
Cr.,
"-J I0U I','
JI Ln
zz 4, i/ ir0C c
Iz III
"I1
I u• D6AC 212 229 12 0 446
-Ij 43 215 244 105 413
o I0
NOTEPROPORTIONAL LIMIT IS
L& DEFINED AS 500 MICROINCHES
0I PER INCH PLASTIC STRAIN RANGE
0.
"ELASTIC STRAIN RANGE _ PLASTIC STRAIN RANGE
I0 i --. , __- •
10~1000 10,000 100,000
TOTAL STRAIN RANGE (MICROINCHES/INCH)
Fig. 24 - Log-log plot of fatigue crack growth rate vs applied totalstrain range data in full-reverse bending for D6AC and 4335 steelsin 3.5% salt water environment. The loci of similar data obtainedin an air environment are shown by dashed lines for comparison.
62
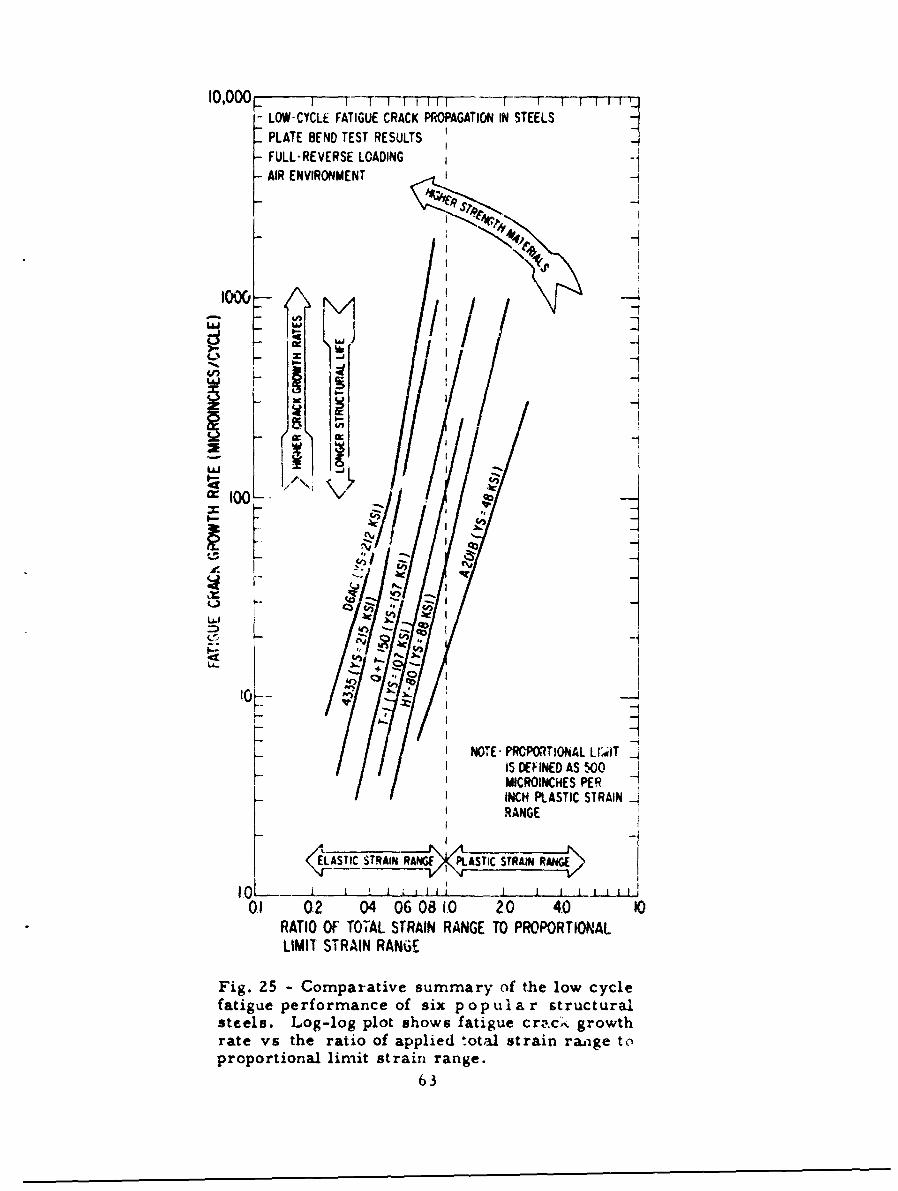
10,000 k I -r-r -r- T-- - I I I I 4
- LOW-CYCLE FATIGUE CRACK PROPAGATION IN STEELS
PLATE BEND TEST RESULTS -
AIR ENVIRONMENT -
N A
I q=9
C- 4
1IS I
- - -- 1
ValW11;
I c
I NOTE- PROPORTIONAL LlIITIIS DIEF1D AS '500I MICROINCHES PER
INCH PLASTIC STRAIN 2JRANGE
Sý ýT:CýTRAIN ýRANE ,PL ASýTIC STRAINdRAG
0.1 02 0406081.0 20 40RATIO OF TOTAL STRAIN RANGE TO PROPORTIONALLIMIT STRAIN RANGE
Fig. 25 - Comparative summary of the low cycle
fatigue performance of six popular structuralsteels. Log-log plot shows fatigue crac . growthrate vs the ratio of applied total strain range toproportional limit strain range.
63
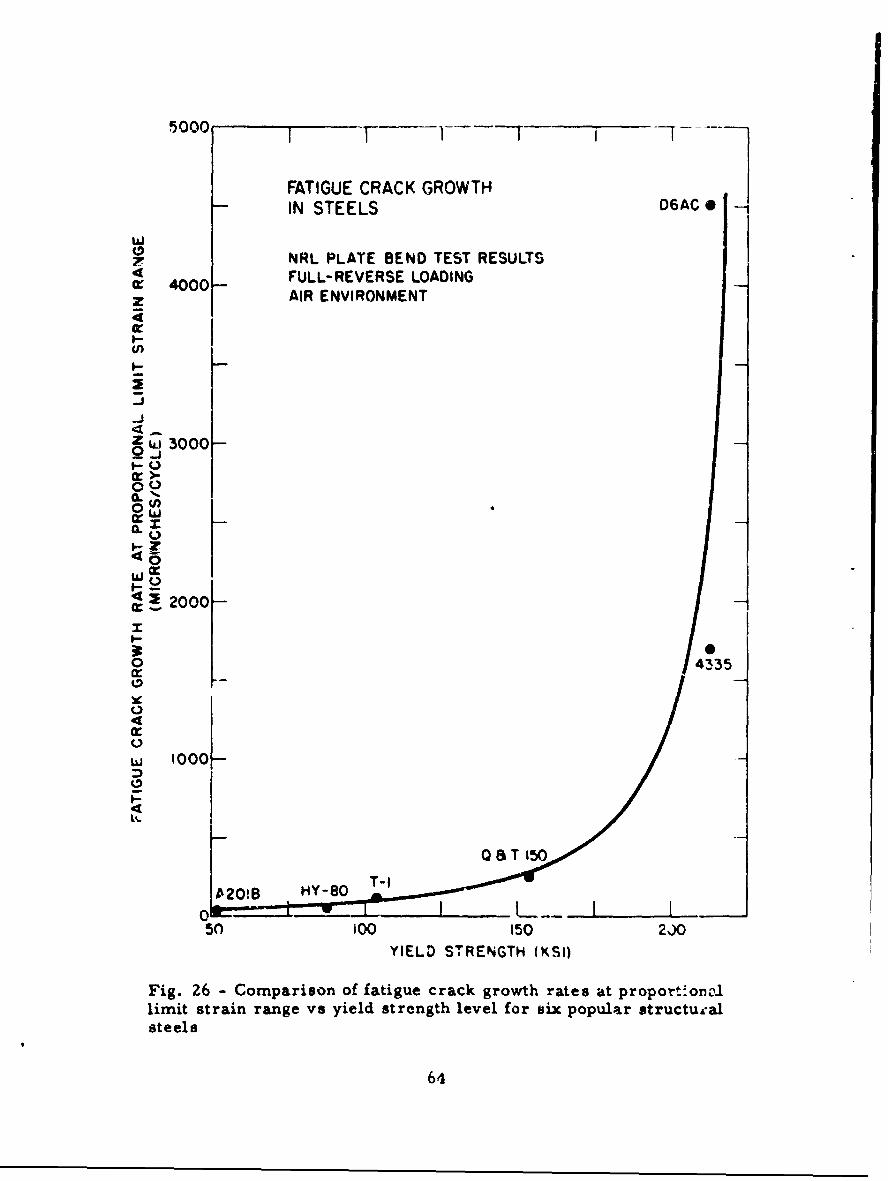
5000 I TC1 - -7 T
FATIGUE CRACK GROWTHIN STEELS O6AC -
7 NRL PLATE BEND TEST RESULTSFULL-REVERSE LOADINGQ 4000- AIR ENVIRONMENT
2
7-
_-
_j
SW 3000_
I0
00
455
W
!2000
W 1OOO -- TI
0~ Ok T 150
00
50 0OO 150 2-O
YIELD STsRENGTH (KSI)
Fig. 26 - Comparison of fatigue crack growth rates at proporti'on.-limit strain range ve yield strength level for six popu~lar structur-alsteels
64

200 1 I 1
FATIGUE CRACK GROWTH
180 A201B IN STEELS
NRL PLATE BEND TEST RESULTS
FULL-REVERSE LOADINGS6 AiR ENVIRONMENTz 160-
4
z
- 140
z,-J
-_ 120 HY-BO 0
0 CRACK GROWTH RATE = 10- IN/CYCLE(I-INCH CRACK IN 10,000 CYCLES
a. 100 0
o 0a:za. E,
LA. 44o A2OIB 0"' 8 0 90 ekT 150 • -
z A HY-80
WW0' 60U)3
CL T-IAo w
A 8 T 150 O6AC
0 4 43 35 A
,.~j CRACK GROWTH RATE. 1 0-5 IN/CYCLE
<[(I-INCH CRACK IN 100,000 CYCLES) A
20 -D6AC
50 100 150 200YIELD STRENGTH (KS/C
Fig. 27 - Comparison of allowable percentage of proportionallimit strain range for finite fatigue life (C0,000 and C00,000
cycles) vs yield strength level for sixpopular tructural steels
65

-0
0
zS0 U)
-JJ 0
U) 0
uj z
0.0 /
L)
P
i%j / o j
000,CD E
fnz X
to D1- w
-0 C
-0fe4)
A
ZDZ
&~ W 4-
m I
ccc~-a> 0
0 00
(SU1-i.) ASW3N3 8V31I H0I3M dOUG
66
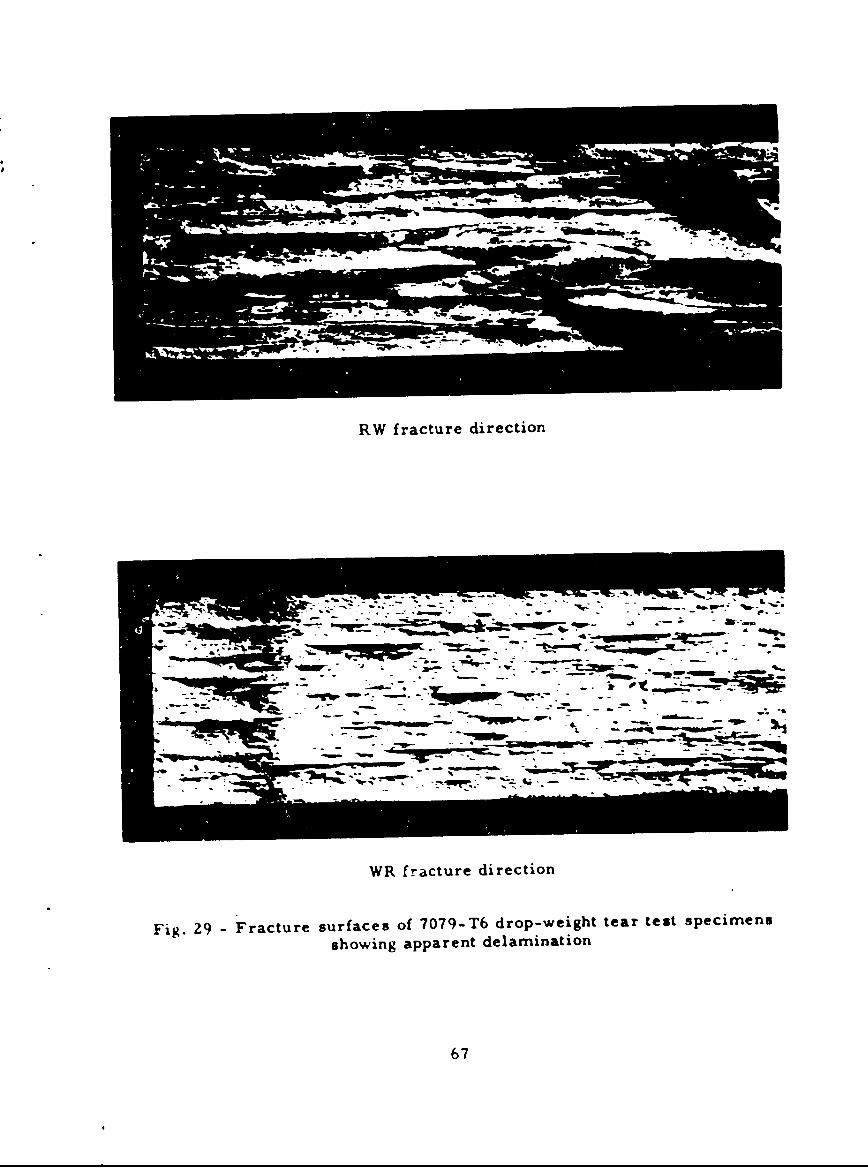
RW fracture direction
WR fracture direction
Fig. 29 -Fracture surfaces of 7079-T6 drop-weight tear test specimensshowing apparent delamination
67

a uP-4 54
04-'
%n 0
'0V
'0%
'0
"DEu
68'

o
0-1v -44
0
665
.0
0.004J
054
ola
a4
69

4 rV
Fig. 3Z - Explosion tear plate of 2024-T4 loaded to 3.7%~ plastic strain
70

rn
04
k 0710
34 a
• -34
0.-4
•o0
3 4
4134
0
45
S
?!0

200-COMPRESSIVE YIELDSTRENGTH (0.2 %)
1;;50 0z
_10 ipwWS- 9
~8O +-- O,- 0 -- C,,eo + -,, Z
70
60 -0.300
b KU ICC
x a 50o/. 0o
~40 -0.200
U, U
Ox 0 1.5-INCH WIDE SIDE 0.0IaJ•. 11.3 / NOTCHED SPECIMEN -- .
As 4.5-INCH WIDE SMOOTH A 0.125SIDE NOTCHED SPECIMEN
-0.100 Cry +z STRAIN-HARDENING
EXPONENT 0N
SUBSCRIPT 2 PERCENT OF UUNBROKEN LIGAMENT IN 1,-SIDE -POTCHED SPECIMENT
0.050-300 -200 -100 0 100
TESTING TEMPERATURE (OF)
Fig. 34 - Correlation of KIc with testing temperature for 1 .S-in.and 4.5-in.-wide specimens of unalloyed titanium
72

12" -
4w n 50"
O 50!4M*wZ 60.002"THRU TWO HOLES
(0) FULL THICKNESS I-INCH EDGE NOTCHED SPECIMEN
0.375" t. DIATHRU TWOA'" IO s7
I 0707
"0 UNBROKEN LIGAMENT
~ -I. 500-
(b) QUARTER-INCH 'rHICK EDGE (C) SIDE-NOTCHED SPECIMENNOTCHED SPECIMEN
Fig. 35 - Dimension of specimens used in this report
-3

122-
T-I7 RWI-INCH THICK SMOOTH SPECIMEN
280 F /N
100/
/o]
50- T- 17 RW
I-INCH THICK SIDE-NOTCHED SPECIMEN
50 PER CENT UNBROKEN LIGAMENT30- 600 F
0-// 0.
0 a
DEFLECTION
Fig. 36 - Typical load-deflection curves for smouth and side-groovedsingle-edge-rnotched specimens
74

(PACE 76 BLANK)
-200O
�- z
(0 X0W~IOO 0co o
c 80 U 0xZ
0 90-
M 008 1-W 8O +
50 O 5=z0 60-
Os
1-40+ xSTRAIN-HARDENING EXPONENT
z4 0 s 1.5-INCH WIDE SIDE-NOTCHED SPECIMEN (RW)-J0.
S=4.5-INCH WIDE RW SPECIMEN
* :4.5-INCH WR SPECIMEN
* =4.5-INCH WR SIDE-NOTCHED SPECIMEN
SUBSCRIPT= PERCENT UNBROKEN LIGAMENTFOR SIDE-NOTCHED SPECIMEN
I I L _ __ I i L I i I _ _
-300 -200 -O00 0 100TESTING TEMPERATURE (OF)
Fig. 37 - Correlation of Kjc with test temperature for analloyedtitanium tested in the RW and WR directions
75