Embed Size (px)
Citation preview
METALLURGICAL PRODUCTION OF HIGH PURITY SILICON
Anders Schei Elkem a/s, R&D Center N-4620 VAGSBYGD, Norway
Metallurgical silicon can be purified to extremely high purity.
B p c Ca Al Other metals
ppmw II
Present
< 1 < 1 < 50 ( ?)
< 10 < 10 < 10
Potential
< 1 < 1 < 1 < 10 < 0.1 < 0.001
The process consists of several steps: Selection and purification of raw materials, carbothermic reduction of silica, ladle treatment, casting, crushing, leaching and remelting. The leaching step is crucial for high purity, and the obtainable purity is determined during th~ solidification before leaching. The most difficult spe6ifications to fuHil are tbe low contents of boron, phosphorus and carbon. Boron and phosphorus can be excluded from the raw materials, but the carbothermic reduction will unavoidably saturate the silicon with carbon at high temperature. During cooling carbon will precipitate as silicon carbide crystals, which will be difficult to remove completely.
The cost of this silicon will depend strongly on the scale of production. It is as yet premature to give exact figures, but with a scale of some thousand tons per year, the cost will be only a few times the cost of ordinary metallurgical silicon.
INFACON 86 PROCEEDINGS 389
INTRODUCTION
Metallurgical silicon has a purity of 98-99 per cent. A typical chemical composition may be the following (weight basis):
Fe 0.1 0.4 per cent Al 0.1 0.4 Ca 0. 05 0.20 p 0.002 - 0.010 B 0.001 0.005 c 0.01 0.10
Some metallurgical silicon is purified further through gaseous silicon compounds into a semiconductor grade with contents lower than parts per billion for most impurities.
In the last fifteen years there has been a considerable interest in making qualities between ordinary metallurgical silicon and semiconductor silicon. The expected main application for this silicon has been in photovoltaic cells, but also other applications are interesting. The various applications will request different specifications, and several qualities are expected.
This paper will describe a metallurgical process for production of silicon containing as low as 10 parts per million of metallic impurities and potentially even less.
SURVEY OF THE CARBOTHERMIC PROCESS
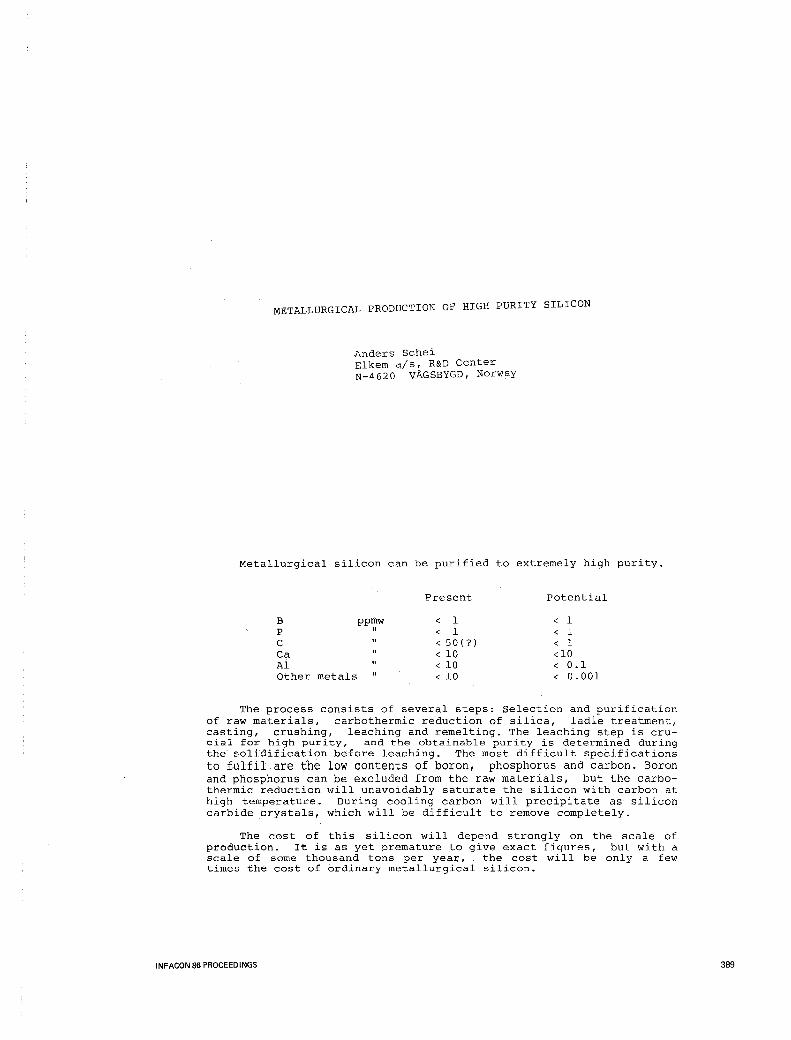
A complete carbothermic route to high purity silicon is sketched in Figure 1. The smelting step has an overall reaction
The detailed reaction mechanism is, however, more complex. The recovery of the impurities is high, and one can as a first approximation assume that all the impurities in the raw materials will be recovered in the silicon.
Sio 2 + 2 C = Si + 2 CO (1)
Pure raw materials _ .............................. ..-----...
LADLE TREATMENT
SMELTING
CASTING
• CRUSHING w
6b ~
Figure 1.
A Silicon grains
Ac~ J
ILEACHINGI
t
• Silicon lumps
[]REMELTING PURIFICATION
!
Ingots of desired size
Survey of the c·arbothermic route to high purity metallurgical silicon
METALLURGICAL PRODUCTION OF HIGH PURITY SILICON
The molten silicon from the smelting furnace can be purified in the ladle. Separate impurity phases, as silicates and silicon carbide, will partly stick to the lining of the ladle, and some can be removed in a filtering step. Impurities (Me) dissolved in the molten silicon can be attacked by a purifying agent (X):
Si(alloy) + n X = SiXn ( 2)
mMe(alloy) + SiXn = Si(alloy) + mMeXn/m (3)
This exchange type of reaction limits the possibilities of ladle purification to elements less noble than silicon, that is in practice to aluminium and calcium. Important impurities like iron and titanium cannot be removed significantly. A thorough discussion of the refining of molten silicon has recently been given by Tuset (1).
The molten silicon is cast and crushed to lumps, which are leached in acids. If the silicon contains sufficient calcium (or other suitable elements) , the lumps will disintegrate to millimeter-sized silicon grains, while most of the impurities are dissolved.
In this process the leaching step is crucial for obtaining down to 10 ppmw content of the metallic impurities. Alternatively one could have started with extremely pure or purified raw materials, but a smelting furnace operation adding only 10 ppmw metallic impurities, will probably be rather difficult and more expensive than leaching. The remainder of the paper will be a discussion of the leaching step, where the aim is to establish the potential of the process.
THE LEACHING STEP
The Elkem leaching process
Elkem has developed a modification of the general leaching process that makes it suitable for production of high purity silicon (2-4). The process is a development of the Silgrain process, which has been in industrial operation in Elkem for several years (5,6). Silicon containing a few per cent calcium is cast, cooled slowly and then crushed into lumps around 5 cm in size. The lumps are 'treated with an aqueous mixture of hydrochloric acid with ferric chloride and disintegrate giving fairly pure silicon crystals of a size below 2 mm. These crystals are then further purified with hydrofluoric acid in combination with some oxidizing agent.
Chemical interpretation of the leaching
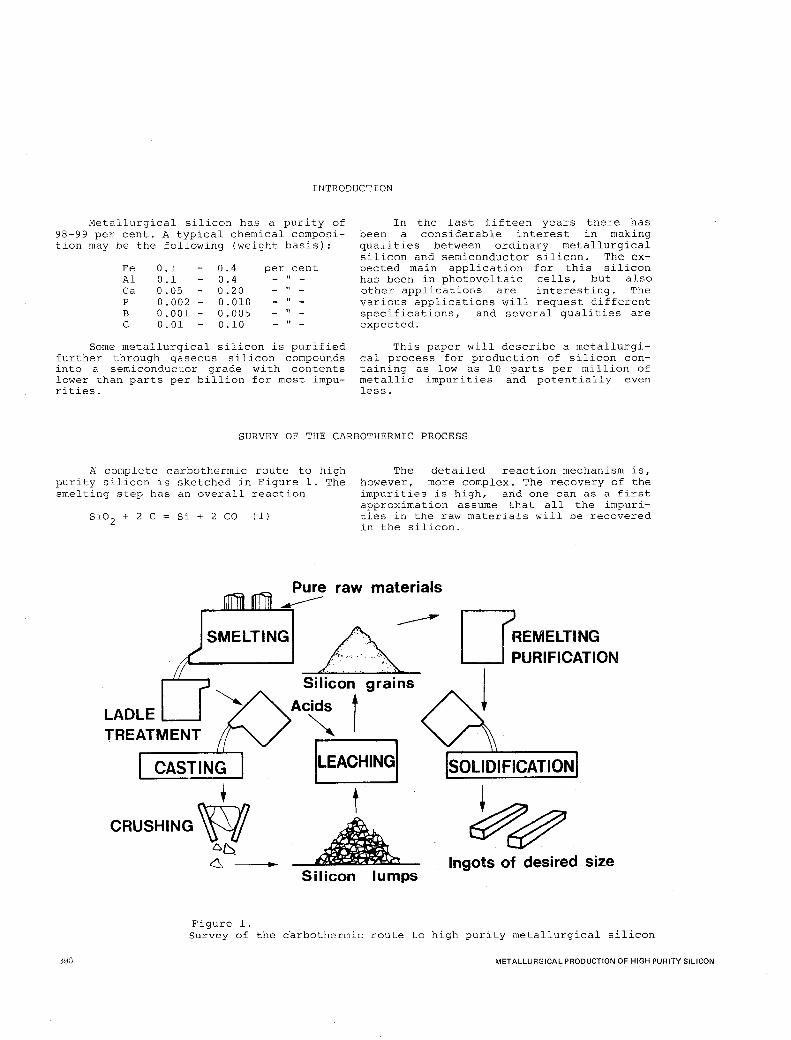
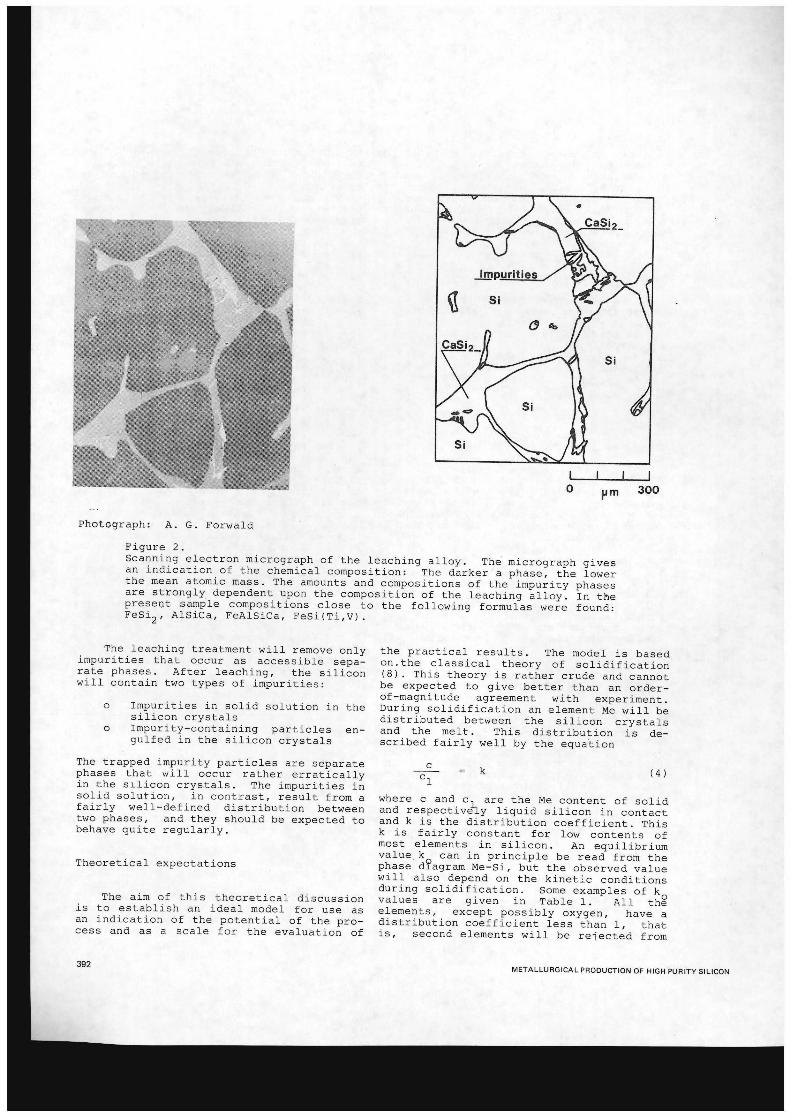
The leaching can be understood from the microstructure of the leaching alloy. A scanning electron micrograph is shown in Figure 2. Fairly large silicon crystals are separated by the phase calcium disilicide, CaSi 2. Other impurities are concentrated as small grains within the calcium dipsilicide phase.
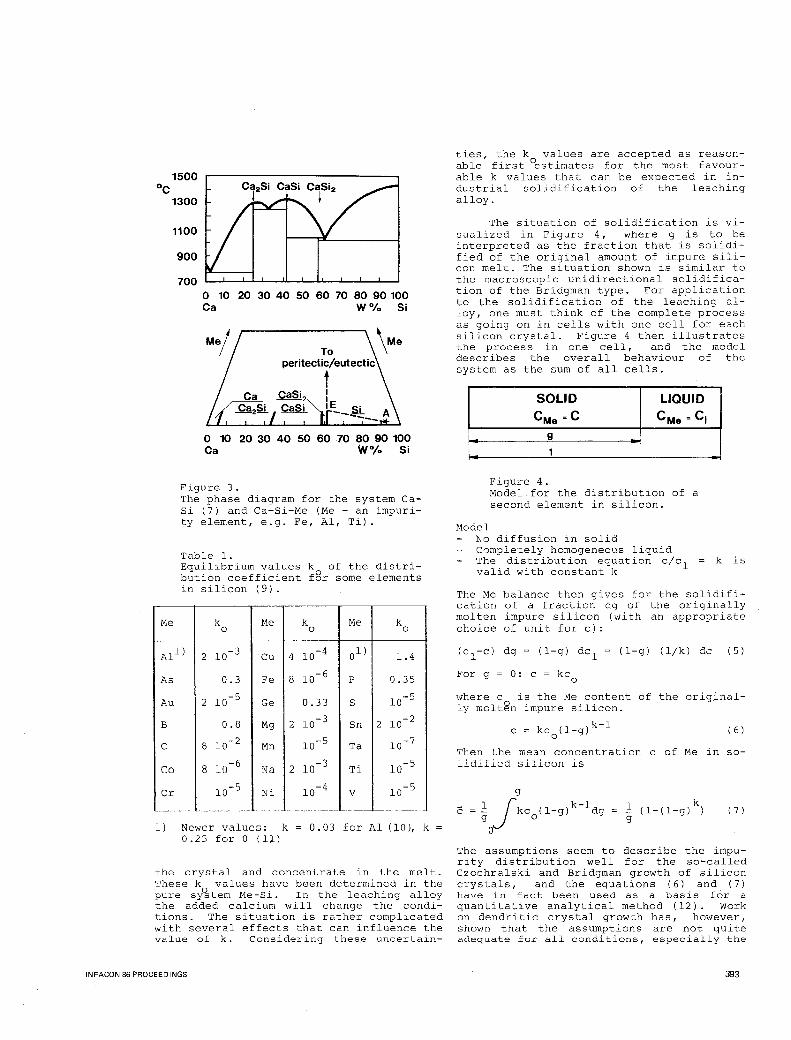
This structure should be expected from the phase diagrams of the systems Ca-Si and Ca-Si-Me (Figure 3). When an alloy A of silicon, calcium and a small amount of a third element Me is cooled, fairly pure silicon .crystals are precipitated, and the composition of the melt changes along the crystallization path AE. At E the phase calcium disilicide starts precipitating eutectically together with the silicon phase, and with further cooling more solid preci-
INFACON 86 PROCEEDINGS
pitates until the alloy is completely solidified at a eutectic or peritectic point. In a technical process Me is replaced by a mixture of several elements, corresponding to a multicomponent phase diagram. The behaviour will still be analogous to the simpler three component system di.3cussed above, and the type of alloy structure shown in Figure 2 will be formed. A condition for this crystallization sequence is a sufficiently high calcium content in the leaching alloy. Then all the impurity phases will occur within the calcium disilicide phase.
When the alloy is treated with hydrochloric acid and ferric chloride, the calcium disilicide reacts and swells. The lumps of calcium-containing silicon break up exposing new surfaces of calcium disilicide for attack. This leaves free, fairly pure silicon crystals and a fine-grained silicon-containing substance that is easily removed by washing. Some small impurity crystals attached to the surface of the silicon grains, are removed by hydrofluoric acid treatment.
The leaching is based upon the fact that silicon is insoluble in acids, while the impurity phases are soluble. The insolubility of silicon must have kinetic reasons, since a thermochemical calculation indicates that silicon should be readily soluble:
Si + 2 H20
6G 0 (298K)
Si02 (s) + 2 H2
-310 kJ
The impurity phases dissolve irreversibly. This is important from a practical point of view, since rather impure chemicals can be used for leaching.
391
0 pm 300
Photograph: A. G. Forwald
Figure 2. Scanning electron micrograph o{ the leaching alloy. Th~ micrograph gives an indication of the chemical composition: The darker a phase, the lower the mean atomic mass. The amounts and compositions of the impurity phases are strongly dependent upon the composition of the leaching alloy. In the present sample compositions close to the following f ormulas were found : FeSi2 , AlSiCa, FeAlSiCa, FeSi(Ti,V).
The leaching treatment will remove only impurities that occur as accessible separate phases. After leaching, the silicon will conta i n two types of imp urities:
o Impurities in solid solution in the silicon crystals
o Impurity-containing particles engulfed in the sil i con crystals
The trapped impurity particles are separate phases that will occur rather erratical l y in the silicon crystals. The impur ities i n solid solution, in contrast, result from a fairly we l l-defined distribution between two phases, and they should be expected to behave quite regular l y.
Theoretical e xpectations
The aim o f this theoretical discussion i s t o establish an ideal model for use as an indication of the potential of the process and as a s cale for the evaluation of
392
the practical results. The model is based on. the classica l theory of solidification (8) . This theory is rather crude and cannot be expected to give better than an orderof-magnitude agreement with experiment. During solidification an element Me will be distributed between the silicon crystals and the melt. This distribution is de scr i bed fairly well by the equation
k ( 4)
where c and c are the Me content of solid and respective\y liquid silicon in contact and k is the distribution coefficient. This k i s fair l y constant for low contents of most elements i n silicon . An equilibrium va l ue k can in principle be read from the phase d~agram Me-Si, but the observed value will also depend on the kinetic conditions during solidification. Some examples of k values are given in Table 1. All thg e l ements, except possibly oxygen, have a distribution coefficient less than 1 , that is , second e l ements wil l be reiected from
META LLU RG ICA L PRODUCTIO N OF HI GH PU RITY SILICON
1500 oc
1300
1100
Me
900
700 0 10 20 30 40 50 60 70 80 90 100 Ca W 0/o Si
0 10 20 30 40 50 60 70 80 90 100 Ca W0/o Si
Figure 3. The phase diagram for the system Casi (7) and Ca-Si-Me (Me - an impurity element, e.g. Fe, Al, Ti).
Table 1. Equilibrium values k of the distribution coefficient f8r some elements in silicon (9).
k Me k Me k 0 0 0
All) 2 10-3 Cu 4 10-4 01) 1.4
As 0.3 Fe
Au 2 10- 5 Ge
B 0.8 Mg
c 8 10-2 Mn
Co 8 10- 6 Na
Cr 10-5 Ni
1) Newer values: k 0.25 for 0 (ll)
8 10- 6 p 0.35
0.33 s 10- 5
2 10-3 Sn 2 10-2
10-5 Ta 10-7
2 10-3 Ti 10- 5
10-4 v 10-5
0. 03 for Al ( 10 ), k
the crystal and concentrate in the melt. These k values have been determined in the pure syC§tem Me-Si. In the leaching alloy the added calcium will change the conditions. The situation is rather complicated with several effects that can influence the value of k. Considering these uncertain-
INFACON 86 PROCEEDINGS
ties, the k values are accepted as reasonable first 0estimates for the most favourable k values that can be expected in industrial solidification of the leaching alloy.
The situation of solidification is visualized in Figure 4, where g is to be interpreted as the fraction that is solidified of the original amount of impure silicon melt. The situation shown is similar to the macroscopic unidirectional solidification of the Bridgman type. For application to the solidification of the leaching alloy, one must think of the complete process as going on in cells with one cell for each silicon crystal. Figure 4 then illustrates the process in one cell, and the model describes the overall behaviour of the system as the sum of all cells.
Model
SOLID LIQUID CMe .C CMe = c,
g
1
Figure 4. Model for the distribution of a second element in silicon.
No diffusion in solid C'Jmpletely homogeneous liquid The distribution equation c/c 1 valid with constant k
-
k is
The Me balance then gives for the solidification of a fraction dg of the originally molten impure silicon (with an appropriate choice of unit for c):
(1-g) (l/k) de (5)
For g = 0: c = kc0
where c is the Me content of the originally molt2n impure silicon.
k-1 c = kc0
(1-g) (6)
Then the mean concentration c of Me in solidified silicon is
g
c = ! jkc (1-g)k-ldg g 0
0
( 7)
The assumptions seem to describe the impurity distribution well for the so-called Czochralski and Bridgman growth of silicon crystals, and the equations ( 6) and ( 7) have in fact been used as a basis for a quantitative analytical method (12). Work on dendritic crystal growth has, however, shown that the assumptions are not quite adequate for all conditions, especially the
393
assumption claiming no diffusion in the solid has been found to be erroneous (13).
For the leaching process it is reasonable to assume that all the silicon crystallized before the coprecipitation of calcium disilicide is recovered, while the remainder of the alloy is lost during leaching. With low Me content, the Ca-Si phase diagram describes the amounts of silicon crystals fairly well (Figure 3). The eutectic calcium content is 39 weight per cent, and if the overall calcium content of the leaching alloy is x weight per cent, the lever rule gives the recovery R of silicon crystals
R x (1-R) · (39-x)
R l - 0.0256 x ( 8)
Here the recovery is defined as
R weight of crystals recovered
total weight of leaching alloy
For the solidification of the leaching alloy, R is equal to g in the solidification equations (6) and (7) just before the start of eutectic crystallization. The mean concentration of the impurity Me can then be calculated when the content of calcium is known.
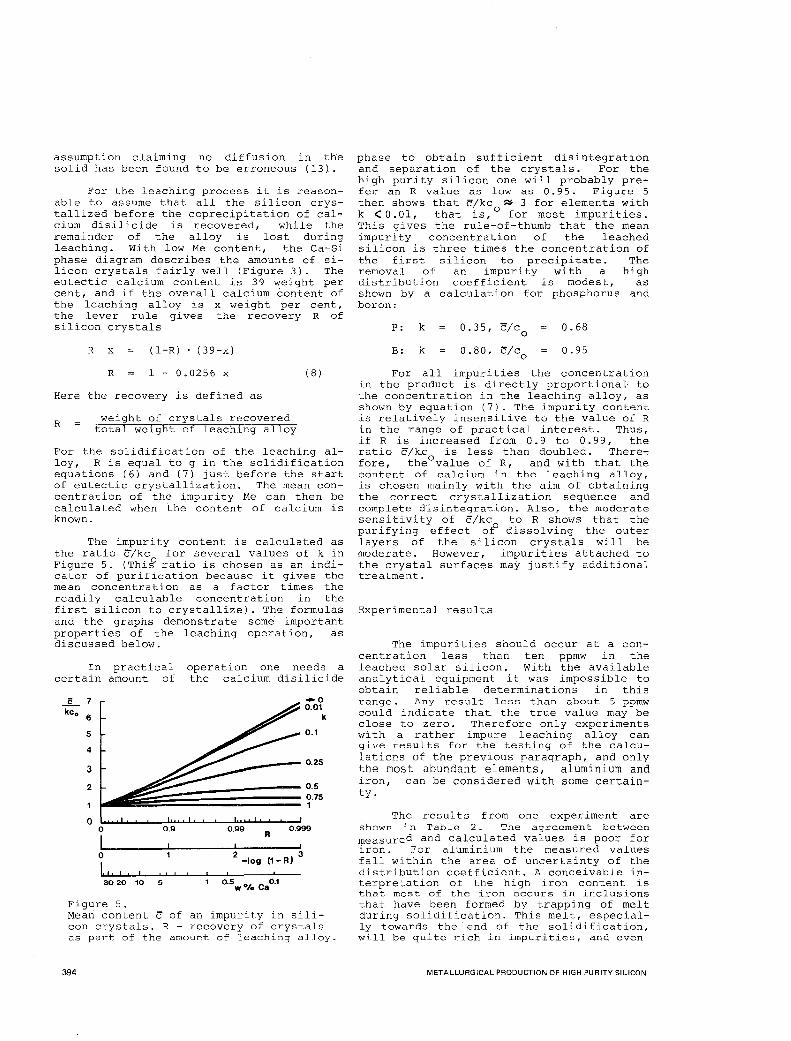
The impurity content is calculated as the ratio c/kc for several values of k in Figure 5. (Thi~ ratio is chosen as an indicator of purification because it gives the mean concentration as a factor times the readily calculable concentration in the first silicon to crystallize). The formulas and the graphs demonstrate some important properties of the leaching operation, as discussed below.
In practical certain amount of
....L 7
kc 0 6
5
4
3
2
0
0
I.., I I I I
30 20 10 5
Figure 5.
operation one needs a the calcium disilicide
R
2 -log (1- R)
3
0.5 w O/o Ca 0.1
Mean content c of an impurity in silicon crystals. R - recovery of crystals as part of the amount of leaching alloy.
394
phase to obtain sufficient disintegration and separation of the crystals. For the high purity silicon one will probably prefer an R value as low as 0. 95. Figure 5 then shows that c/kc ~ 3 for elements with k <0.01, that is, 0 for most impurities. This gives the rule-of-thumb that the mean impurity concentration of the leached silicon is three times the concentration of the first silicon to precipitate. The removal of an impurity with a high distribution coefficient is modest, as shown by a calculation for phosphorus and boron:
P: k
B: k
0.35, c/co
o.80, c/c0
0.68
0.95
For all impurities the concentration in the product is directly proportional to the concentration in the leaching alloy, as shown by equation (7). The impurity content is relatively insensitive to the value of R in the range of practical interest. Thus, if R is increased from 0.9 to 0.99, the ratio c/~ is less than doubled. Therefore, the0 value of R, and with that the content of calcium in the leaching alloy, is chosen mainly with the aim of obtaining the correct crystallization sequence and complete disintegration. Also, the moderate sensitivity of c/kc to R shows that the purifying effect of' dissolving the outer layers of the silicon crystals will be moderate. However, impurities attached to the crystal surfaces may justify additional treatment.
Experimental results
The impurities should occur at a concentration less than ten ppmw in the leached solar silicon. With the available analytical equipment it was impossible to obtain reliable determinations in this range. Any result less than about 5 ppmw could indicate that the true value may be close to zero. Therefore only experiments with a rather impure leaching alloy can give results for the testing of the calculations of the previous paragraph, and only the most abundant elements, aluminium and iron, can be considered with some certainty.
The results from one experiment are shown in Table 2. The agreement between measured and calculated values is poor for iron. For aluminium the measured values fall within the area of uncertainty of the distribution coefficient. A conceivable interpretation of the high iron content is that most of the iron occurs in inclusions that have been formed by trapping of melt during solidification. This melt, especially towards the end of the solidification, will be quite rich in impurities, and even
METALLURGICAL PRODUCTION OF HIGH PURITY SILICON
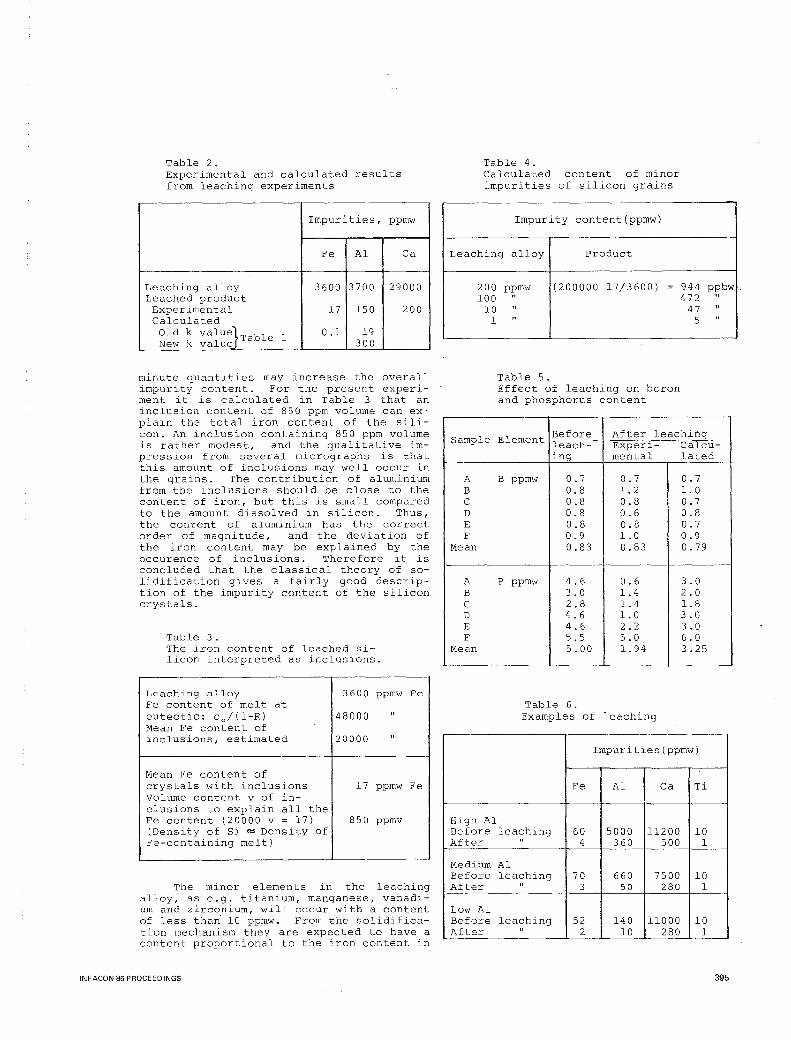
Table 2. Experimental and calculated results from leaching experiments
Impurities, ppmw
Fe Al Ca
Leaching alloy 3600 3700 29000 Leached product Experimental 17 150 200 Calculated
Old k valu~1Table 1 0.1 19 New k value 300
~.
minute quantities may increase the overall impurity content. For the present experiment it is calculated in Table 3 that an inclusion content of 850 ppm volume can explain the total iron content of the silicon. An inclusion containing 850 ppm volume is rather modest, and the qualitative impression from several micrographs is that this amount of inclusions may well occur in the grains. The contribution of aluminium from the inclusions should be close to the content of iron, but this is small compared to the amount dissolved in silicon. Thus, the content of aluminium has the correct_ order of magnitude, and the deviation of the iron content may be explained by the occurence of inclusions. 'l'herefore it is concluded that the classical theory of solidification gives a fairly good description of the impurity content of the silicon crystals.
Table 3. The iron content of leached silicon interpreted as inclusions.
Leaching alloy 3600 ppmw Fe content of melt at eutectic: c 0 /(l-R) 48000 " Mean Fe content of inclusions, estimated 20000 "
Mean Fe content of crystals with inclusions 17 ppmw Volume content v of in-cl us ions to explain all the Fe content (20000 v = 17) 850 ppmv (Density of Si "" Density of Fe-containing melt)
Fe
Fe
The minor elements in the leaching alloy, as e.g. titanium, manganese, vanadium and zirconium, will occur with a content of less than 10 ppmw. From the solidification mechanism they are expected to have a content proportional to the iron content in
INFACON 86 PROCEEDINGS
Table 4. Calculated content of minor impurities of silicon grains
Impurity content(ppmw)
Leaching alloy Product
200 100
10 1
ppmw (200000 17/3600) = " " "
Table 5. Effect of leaching on boron and phosphorus content
944 ppbw 472 "
47 " 5 "
Sample Element Before After leaching leach- Experi- Calcu-ing mental lated
A B ppmw 0.7 0.7 0.7 B 0.8 1. 2 1. 0 c 0.8 0.8 0.7 D 0.8 0.6 0.8 E 0.8 0.8 0.7 F 0.9 1. 0 0.9
Mean 0.83 0.83 0.79
A p ppmw 4. 6 0.6 3. 0 B 3. 0 1.4 2.0 c 2. 8 1.4 1.8 D 4. 6 1. 0 3. 0 E 4. 6 2. 2 3. 0 F 5.5 5.0 6.0
Mean 5.00 1. 94 3.25
Table 6. Examples of leaching
Impurities(ppmw)
Fe Al Ca Ti
High Al Before leaching 60 5000 11200 10 After " 4 360 500 1
Medium Al Before leaching 70 660 7500 10 After " 3 50 280 1
Low Al Before leaching 52 140 11000 10 After " 2 10 280 1
395
396
the inclusions. The overall contents of these elements are calculated in Table 4. Because of the inclusions it is impossible to reach the low potential. content of the minor elements.
The effect of leaching on the content of boron and phosphorus is shown in Table 5. The phosphorus removal seems to be slightly better than calculated. That may not be significant, as the range of results is close to the limit of detection of the analytical method. But a higher than calcu-
lated phosphorus removal should not be surprising, since calcium has a strong affinity for phosphorus and might influence the distribution between the two phases.
Some additional results are given in Table 6. The aluminium content is changed by a factor of slightly below 0.1. According to the rule-of-thumb discussed above, one should expect a factor 3 k = 0.09 when the newer value k = 0.03 is used. The results are close to the expectation.
CALCIUM AND CARBON
Calcium and carbon are added voluntarily during the process, but they are impurities in the final product and have to be removed as far as possible. Calcium has a retrograde solubility in silicon with a maximum calcinm content of 100 ppmw ( 14). The mean concentration of calcium dissolved in the crystal should be less than 100 ppmw, but inclusions can increase this amount strongly. The calcium content may be reduced by remelting the crystals and e.g. treating the melt with chlorine, maybe to about 10 ppmw.
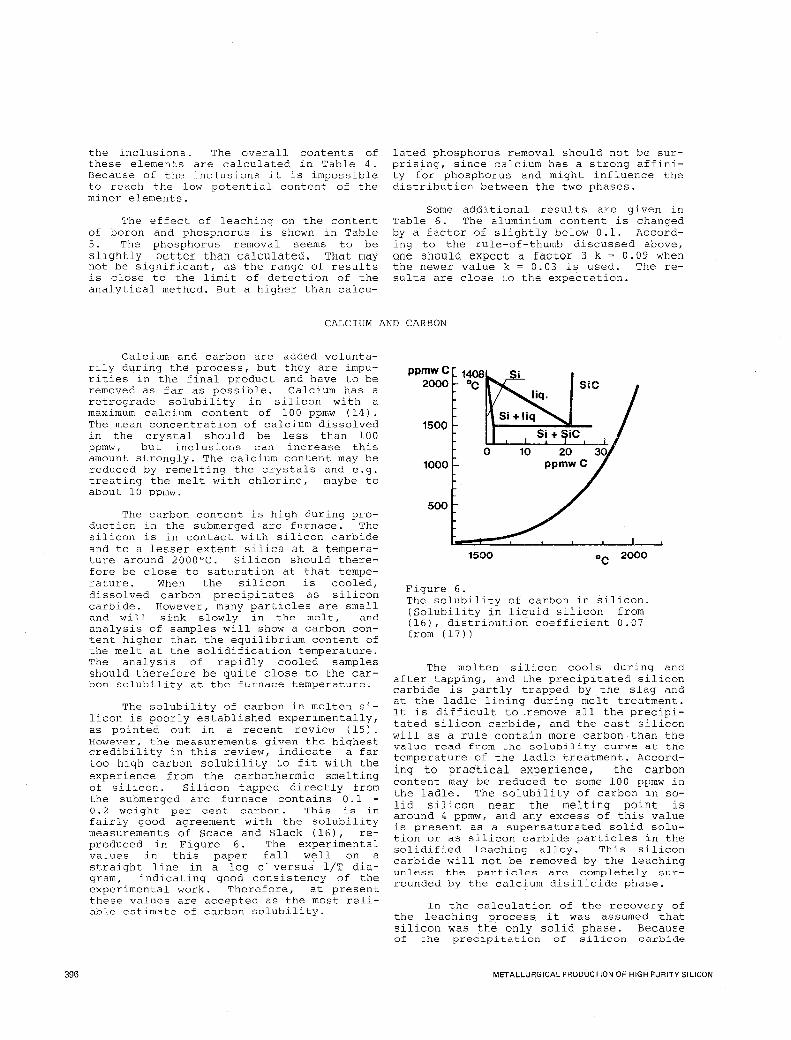
The carbon content is high during production in the submerged arc furnace. The silicon is in contact with silicon carbide and to a lesser extent silica at a temperature around 2000°C. Silicon should therefore be close to saturation at that temperature. When the silicon is cooled, dissolved carbon precipitates as silicon carbide. However, many particles are small and will sink slowly in the melt, and analysis of samples will show a carbon content higher than the equilibrium content of the melt at the solidification temperature. The analysis of rapidly cooled samples should therefore be quite close to the carbon solubility at the furnace temperature.
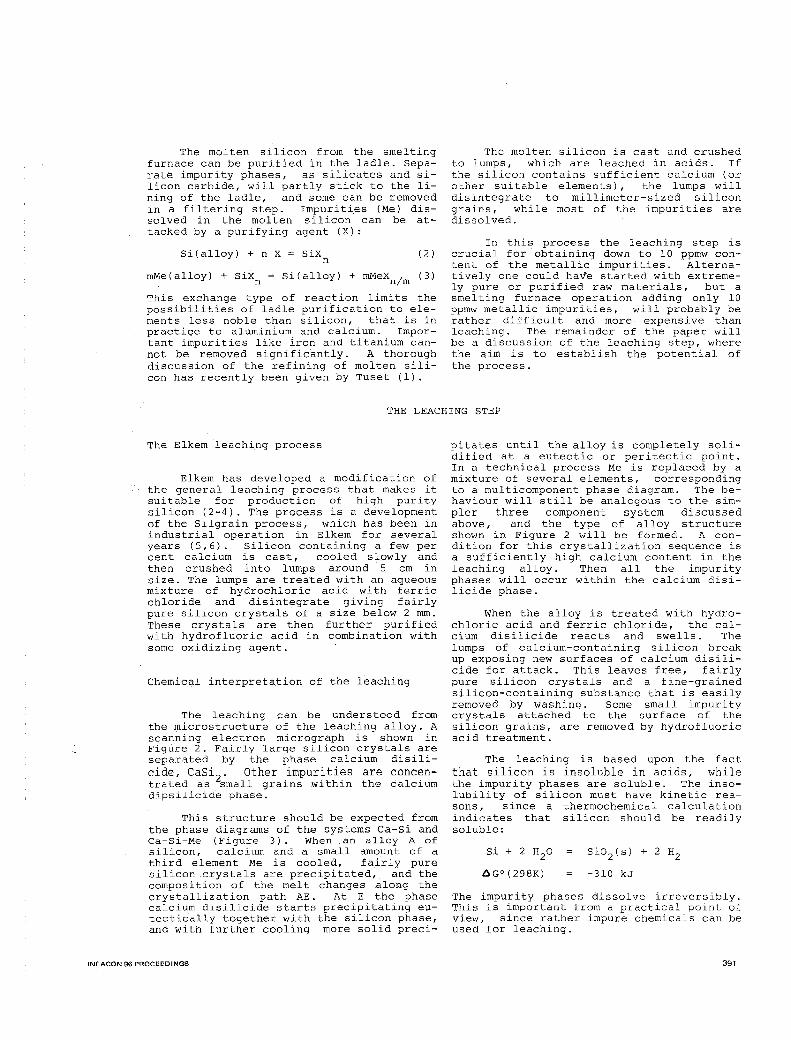
The solubility of carbon in molten silicon is poorly established experimentally, as pointed out in a recent review ( 15) . However, the measurements given the highest credibility in this review, indicate a far too high carbon solubility to fit with the experience from the carbothermic smelting of silicon. Silicon tapped directly from the submerged arc furnace contains 0. 1 0. 2 weight per cent carbon. This is in fairly good agreement with the solubility measurements of Scace and Slack (16), reproduced in Figure 6. The experimental values in this paper fall well on a straight line in a log c· versus' l/T diagram, indicating good consistency of the experimental work. Therefore, at present these values are accepted as the most reliable estimate of carbon solubility.
ppmwC 2000
1500
1000
500
Figure 6.
1500 oc 2000
The solubility of carbon in silicon. (Solubility in liquid silicon from (16), distribution coefficient 0.07 from ( 17))
The molten silicon cools during and after tapping, and the precipitated silicon carbide is partly trapped by the slag nnd at the ladle lining during melt treatment. It is difficult to -remove all the precipitated silicon carbide, and the cast silicon will as a rule contain more carbon than the value read from the solubility curve at the temperature of the ladle treatment. According to practical experience, the carbon content may be reduced to some 100 ppmw in the ladle. The solubility of carbon in solid silicon near the melting point is around 4 ppmw, and any excess of this value is present as a supersaturated solid solution or as silicon carbide particles in the solidified leaching alloy. This silicon carbide will not be removed by the leaching unless the particles are completely surrounded by the calcium disilicide phase.
In the calculation of the recovery of the leaching process it was assumed that silicon was the only solid phase. Because of the precipitation of silicon carbide
METALLURGICAL PRODUCTION OF HIGH PURITY SILICON
during the entire solidification, sumption is not strictly true.
this as- amount of carbon is so low that the calcuBut the lation is not invalidated.
GENERALIZATION OF THE LEACHING
The leaching seems to be fairly ef fecti ve in making a very pure metallurgical silicon. Then it could be asked if the method can be generalized for other ferroalloys. In principle it is possible if the elements of the final product are concentrated in separate phases that are much less soluble than the impurity-containing phases. However, this condition is not fulfilled for most ferroalloys.
For high-silicon ferrosilicon the two main phases are Si and FeSi2 . Here FeSi2 is more slowly soluble than the other impurity phases, and a mixture of Si and Fesi 2 can be purified. Unfor~unately, FeSi2 has some solubility of other elements, and the purification by leaching is less efficient than the purification of silicon. Still it may be useful for high purity ferrosilicon for some special applications.
POTENTIAL OF THE PROCESS
As shown above it is possible to estimate the final purity of the product fairly well from a simple theory of the distribution of the impurities during crystallization. Very low impurity contents can be .obtained. In principle the product may be improved further by remelting and releaching several times. According to the calculations above, this can give extremely low impurity contents. Exceptions are boron, phosphorus and aluminium, which all have unfavourable distribution coefficients, and calcium, which is added in each remelting. In practical operation, however, the remelting will add impurities, and a steady state will be reached where addition balances removal. More work is necessary to evaluate this possibility.
An important contribution to the overall impurity is melt inclusions in the crystals during solidification. The calculated contents of most metals show strong improvements when the inclusions are avoided. An impurity in a class by itself is calcium, which results from the use of calcium as auxiliary element in each step. In principle calcium could be left out, at least in the last of repeated leachings, but then it would be necessary to grind the leaching alloy finely. This would complicate the aftertreatment of the leached grains, and small, slowly dissolving impurity particles would not be washed away easily.
An estimate of the attainable impurity levels is given in Table 7.
The purity of the product is determined during the solidification. This purity may not be obtained because of poor leaching, but ·the potential for purity is set when the alloy is solidified. The leaching process is thus really a purif ication by crystallization with a purifying efficiency similar to the unidirectional solidification technique, and these two
INFACON 86 PROCEEDINGS
Table 7. Anticipated impurity contents of high purity silicon produced by leaching
Impurities (ppmw)
Elements Present Without Repeated technique inclusions leachings
B 1 1 1 p
1) 1 1 1 Ca 10 10 10_3 Al 10 1 10 Metals except
10-3 10- 6 Ca and Al 10 c 50 (?) 5 1
1) Remelting and calcium removal, untreated grains would contain 100 ppmw Ca without inclusions.
techniques are to be compared. In unidirectional solidification at most a few hundred kilograms can be treated in each batch, and the crystallization parameters are very critical. One has to use a rather low cooling rate to avoid constitutional supercooling, which will seriously decrease the efficiency of the.purification. The separation of the pure and the impure fractions requires time-consuming manual work. For the leaching process, in contrast, even rather crude cooling gi'!es fairly good leaching results, and both the solidification and the leaching can be adapted to large scale automated operation.
The cost of the silicon will depend strongly on the scale of the production, especially for the carbothermic step. The cost of the leaching alloy will drop rapidly with the scale up to a few thousand tons per year, and then flatten out. The cost of
397
the leaching procedure will be less dependent on the scale. It is premature to give exact cost information before the specifi-
cations of the product and the details of the procedure have been fixed.
ACKNOWLEDGEMENT
The author acknowledges the support and valuable advice from several persons in Exxon Research and Engineering Company and in Elkem a/s during a joint project on low cost silicon for solar cells. Especially he will mention Dr. L.P. Hunt for extensive work on raw materials, Dr. J.P. Dismukes
and Dr. P.S. Ravishankar for informative discussions on crystallization, K. Larsen for experimental work on submerged arc furnace operation with high purity raw materials and G. Halvorsen for experimental data on leaching of calcium-containing silicon alloys.
REFERENCES
1. J.Kr. Tuset "Principles of silicon refining" in Refining and Alloying of Liquid Aluminium and Ferro-Alloys, Editors T.A. Engh, s. Lyng, and H.A. 0ye, Aluminium-Verlag Dusseldorf, 1985, pp.49-69.
2 G. Halvorsen "Method for production of pure silicon" US Pat. 4,539,194 (1985), priority 1983.
3. A. Schei "High purity silicon production" in Refining and Alloying of Liquid Aluminium and Ferro-Alloys, T.A. Engh, S. Lyng, and H.A. 0ye, Aluminium-Verlag Dusseldorf, 1985, pp. 71-89.
4. A. Schei "A metallurgical route to solar grade silicon", paper presented at Jet Propulsion Laboratory's Flat-Plate Solar Array Workshop: Low-cost polysilicon for terrestrial photovoltaic solar cell applications, Las Vegas, October 28-30, 1985 (In preparation;
5. H. Aas and J.A. Kolflaath "Continuous extraction process for refining technical-grade silicon and ferro-silicon" Norwegian Patent 122241, priority 1970.
6. H. Aas "The Silgrain process. Silicon metal from 90 % ferrosilicon", TMS' Paper Selection A71-47, TMS-AIME, 1971.
7. E. Schurmann, H. Litterscheid, and P. Funders "Investigation of the melting equilibria of the phase diagram calcium-silicon" Arch. Eisenhiittenwes. 45 (6) (1974) pp. 367-371.
8. B. Chal~ers "Principles of solidification" Robert E. Krieger Publ. Co.1977, reprint of original edition 1964.
9. D. Morvan, J. Amouroux, and G. Revel "Mise ou point d'une technique de fusion de zone sous p+asma appliquee a la preparation du silicium photovoltaique" Revue Phys.Appl. 15 (1980) pp. 1229-1238.
10. R.H. Hopkins, J.R. Davies, A. Rohatgi, R.B. Campbell, P.D. Blais, P. RaiChoudbury, and R.E. Stapleton "Effects of impurities on processing on silicon solar cells" Report DOE/JPL-954331-80/9, Westinghouse R&D Center, 1980.
11. W. Lin and D.W. Hill "Oxygen segregation in Czochralski silicon growth" J. Appl. Phys. 54 (1983) No. 2, pp. 1082-1085.
12. L.P. Hunt, R.W. Francis, and J.P. Dismukes, "Boron and phosphorus determination in low resistivity solar-grade silicon", J. Electrochem. Soc. 131 (8) (1984) pp. 1888-1891.
13. D.H. Kirkwood "Microsegregation", ~at. Science and Eng. 65 (1984) ppf. 101-109.
14. H. Sigmund "Solubilities of magnesium and calcium in silicon" J. Electrochem. Soc. 129 (1982) pp. 230-234.
15. R.W. Olesinski and G.J. Abbaschian "The C-Si (carbon-silicon) system" Bull. Alloy Phase Diagr. 5 (1984) pp. 486-489.
16. R.I.Scace and G.A.Slack "Solubility of carbon in silicon and germanium" J. Chem. Phys. 30 (1959) pp. 1551-1555.
17. T. Nozaki, Y. Yatsurugi, and N. Akiyama "Concentration and behaviour of ~arbon in semiconductor silicon" J. Electrochem. Soc. 117 (1970) r;p. 15 66-1568.
398 METALLURGICAL PRODUCTION OF HIGH PURITY SILICON