Embed Size (px)
Citation preview

Merton Residents Survey 2008/09Draft Presentation
Presented byTNS Social
September 2008
Merton Residents Survey 2008/09
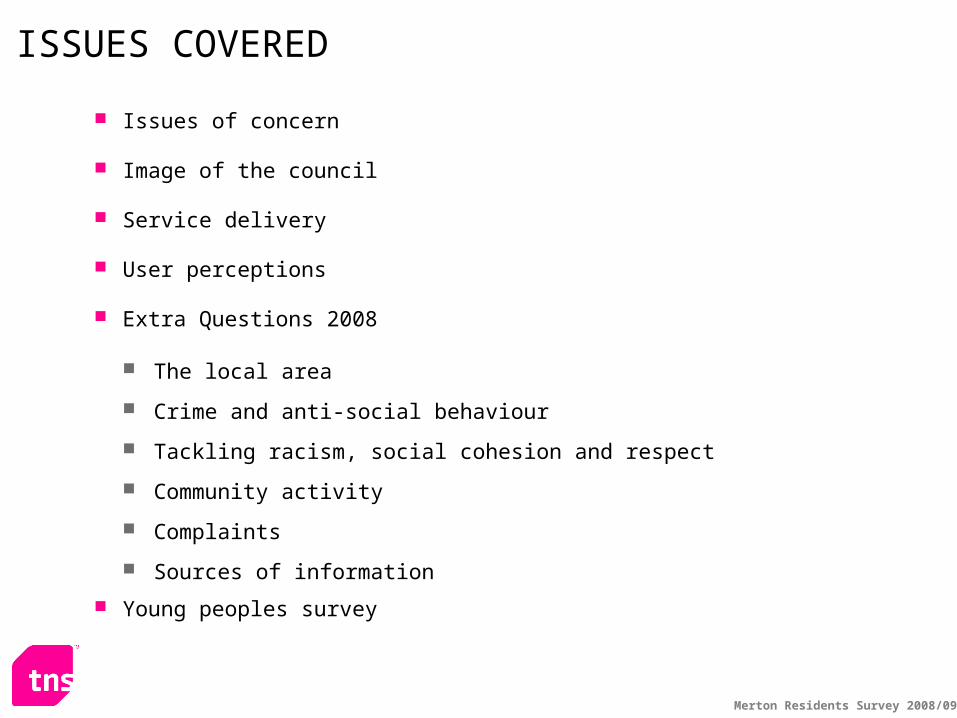
Issues of concern
Image of the council
Service delivery
User perceptions
Extra Questions 2008
The local area
Crime and anti-social behaviour
Tackling racism, social cohesion and respect
Community activity
Complaints
Sources of information
Young peoples survey
ISSUES COVERED
Merton Residents Survey 2008/09
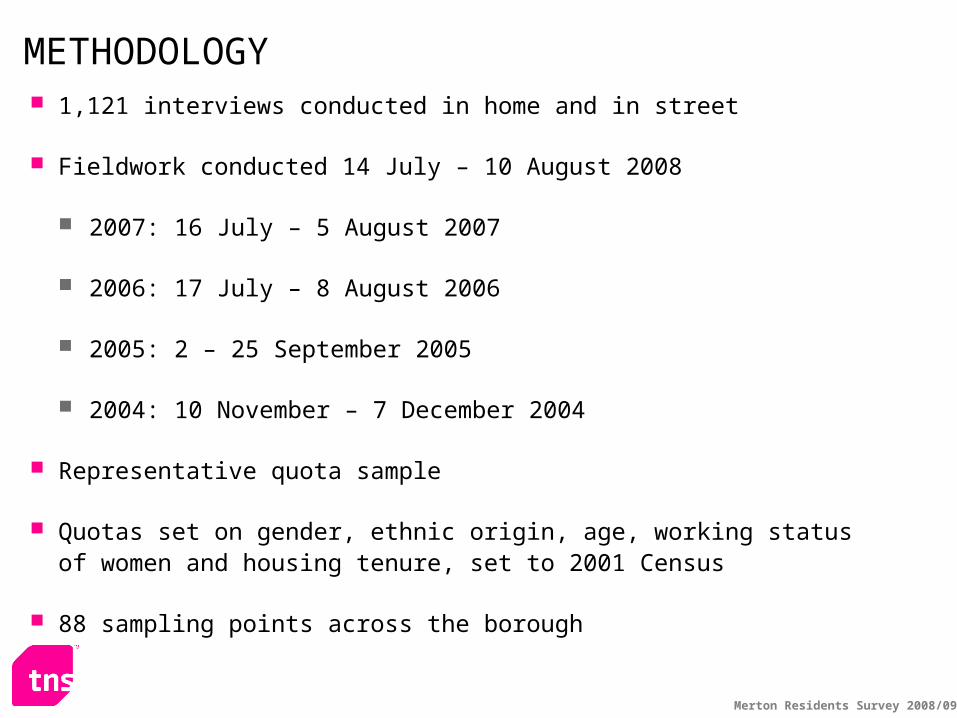
1,121 interviews conducted in home and in street
Fieldwork conducted 14 July – 10 August 2008
2007: 16 July – 5 August 2007
2006: 17 July – 8 August 2006
2005: 2 – 25 September 2005
2004: 10 November – 7 December 2004
Representative quota sample
Quotas set on gender, ethnic origin, age, working status of women and housing tenure, set to 2001 Census
88 sampling points across the borough
METHODOLOGY
Merton Residents Survey 2008/09
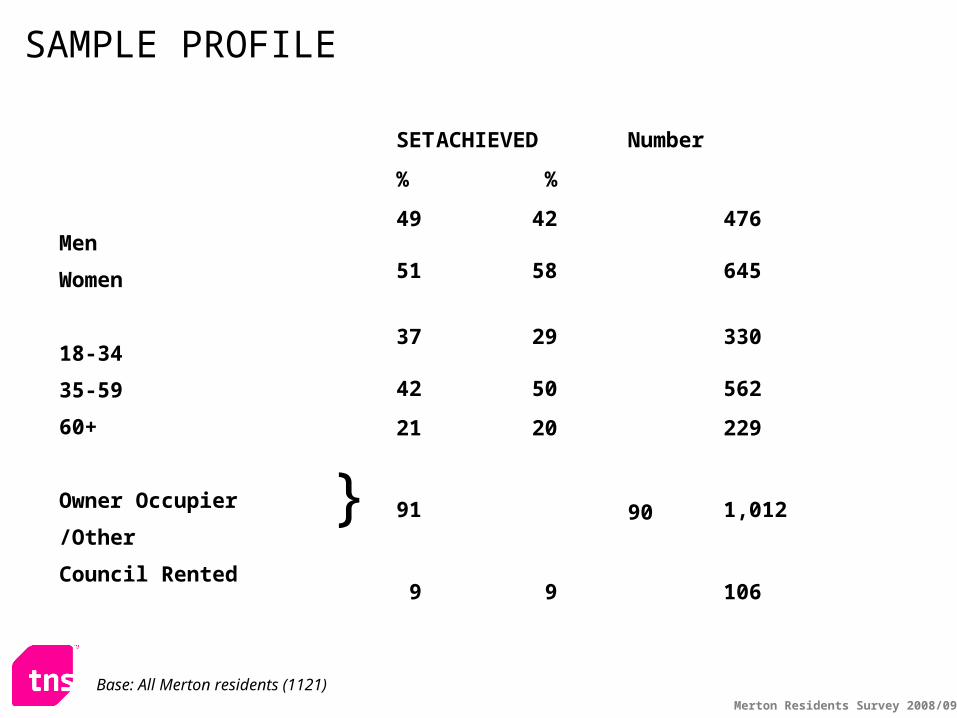
Men
Women
18-34
35-59
60+
Owner Occupier
/Other
Council Rented
SET ACHIEVED Number
% %
49 42 476
51 58 645
37 29 330
42 50 562
21 20 229
91 1,01290
9 9 106
}
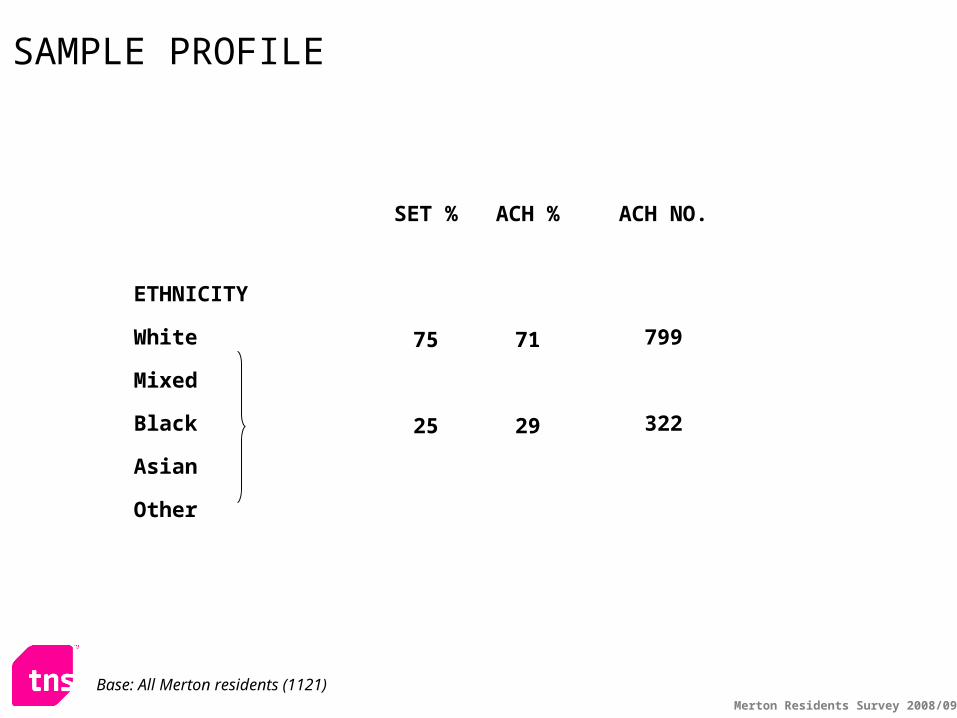
SAMPLE PROFILE
Base: All Merton residents (1121)
Merton Residents Survey 2008/09
SET % ACH % ACH NO.
ETHNICITY
White 75 71 799
Mixed
Black 25 29 322
Asian
Other
SAMPLE PROFILE
Base: All Merton residents (1121)

Areas of Personal Concern
Merton Residents Survey 2008/09
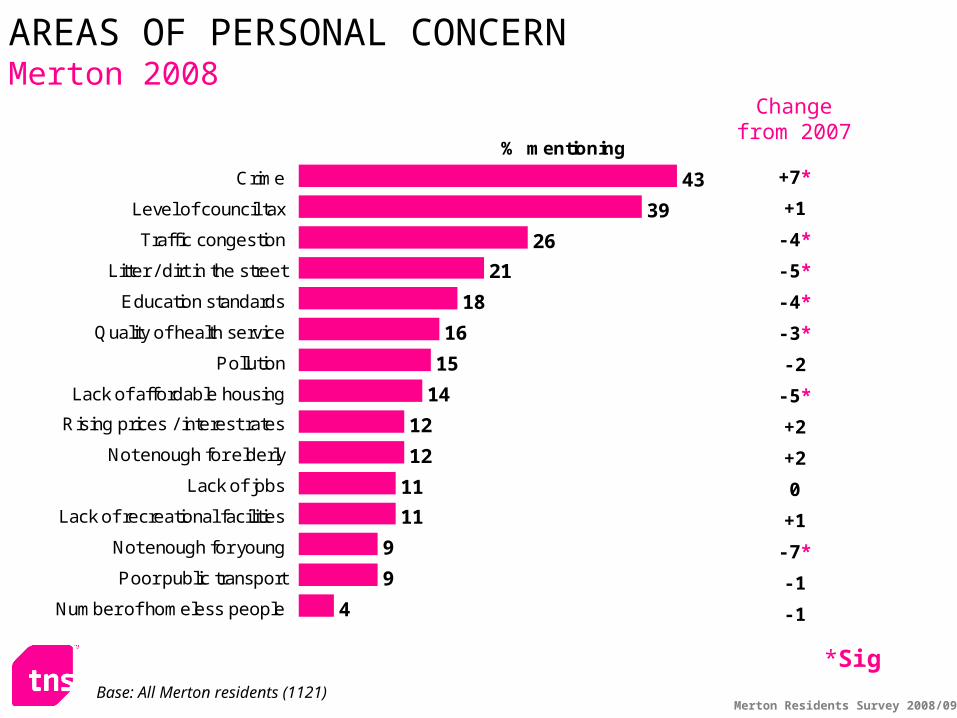
43
39
26
21
18
16
15
14
12
12
11
11
9
9
4
Crime
Level of council tax
Traffic congestion
Litter / dirt in the street
Education standards
Quality of health service
Pollution
Lack of affordable housing
Rising prices / interest rates
Not enough for elderly
Lack of jobs
Lack of recreational facilities
Not enough for young
Poor public transport
Number of homeless people
% mentioning
Base: All Merton residents (1121)
Change from 2007
*Sig
+7*
+1
-4*
-5*
-4*
-3*
-2
-5*
+2
+2
0
+1
-7*
-1
-1
AREAS OF PERSONAL CONCERNMerton 2008
Merton Residents Survey 2008/09
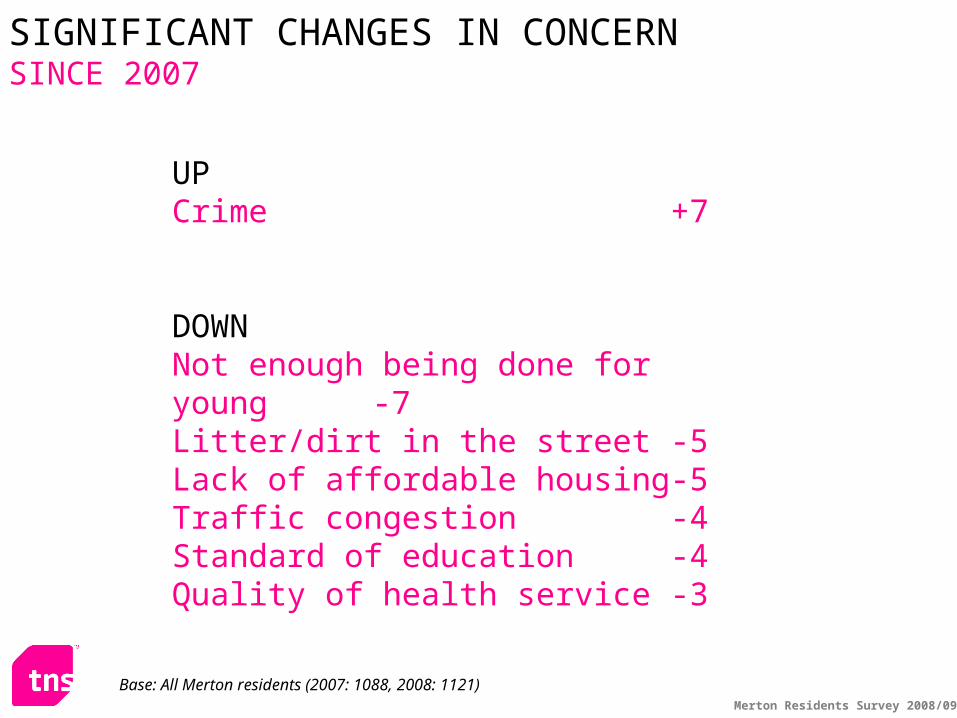
UPCrime +7
DOWNNot enough being done for young -7Litter/dirt in the street -5Lack of affordable housing -5Traffic congestion -4Standard of education -4Quality of health service -3
SIGNIFICANT CHANGES IN CONCERN SINCE 2007
Base: All Merton residents (2007: 1088, 2008: 1121)
Merton Residents Survey 2008/09
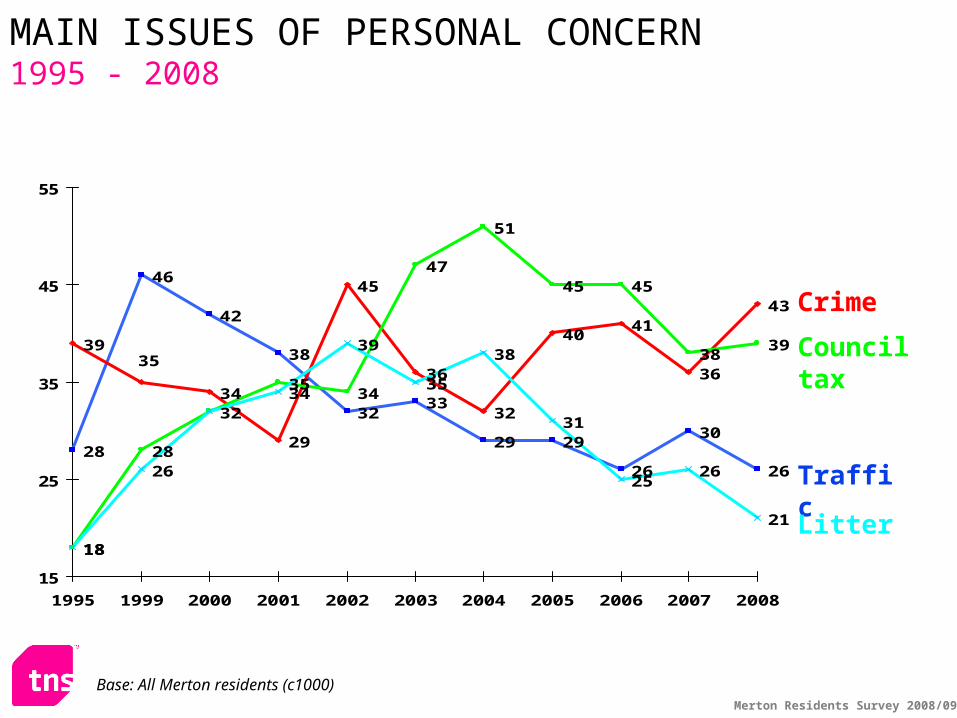
MAIN ISSUES OF PERSONAL CONCERN 1995 - 2008
28
46
42
38
3233
29 29
26
30
26
39
34
29
45
36
32
4041
36
43
18
28
3534
47
51
45 45
3839
26
35
38
31
2526
21
3539
34
18
32
15
25
35
45
55
1995 1999 2000 2001 2002 2003 2004 2005 2006 2007 2008
Traffic
Crime
Council tax
Litter
Base: All Merton residents (c1000)
Merton Residents Survey 2008/09
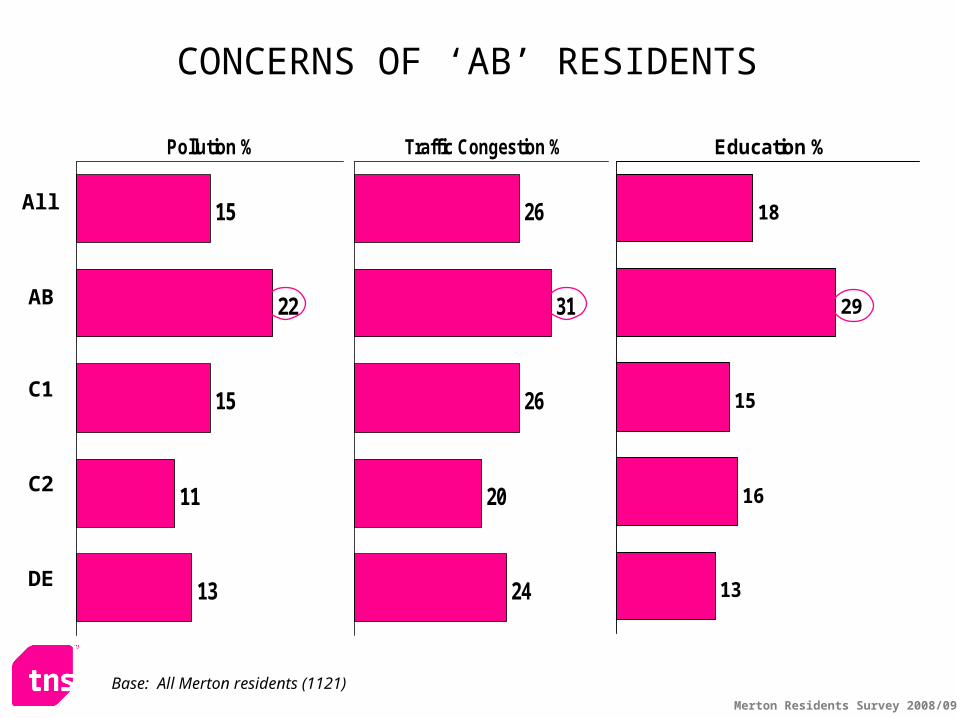
15
22
15
11
13
Pollution %
All
AB
C1
C2
DE
26
31
26
20
24
Traffic Congestion %
Base: All Merton residents (1121)
CONCERNS OF ‘AB’ RESIDENTS
18
29
15
16
13
Education %
Merton Residents Survey 2008/09
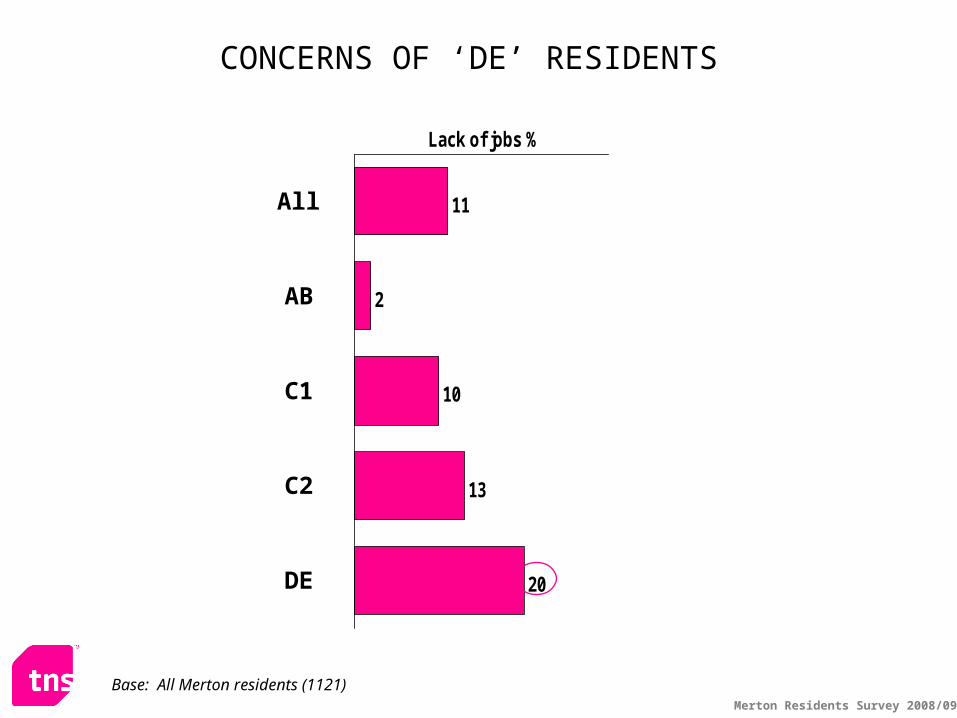
CONCERNS OF ‘DE’ RESIDENTS
All
AB
C1
C2
DE
11
2
10
13
20
Lack of jobs %
Base: All Merton residents (1121)

Image of the council
Merton Residents Survey 2008/09
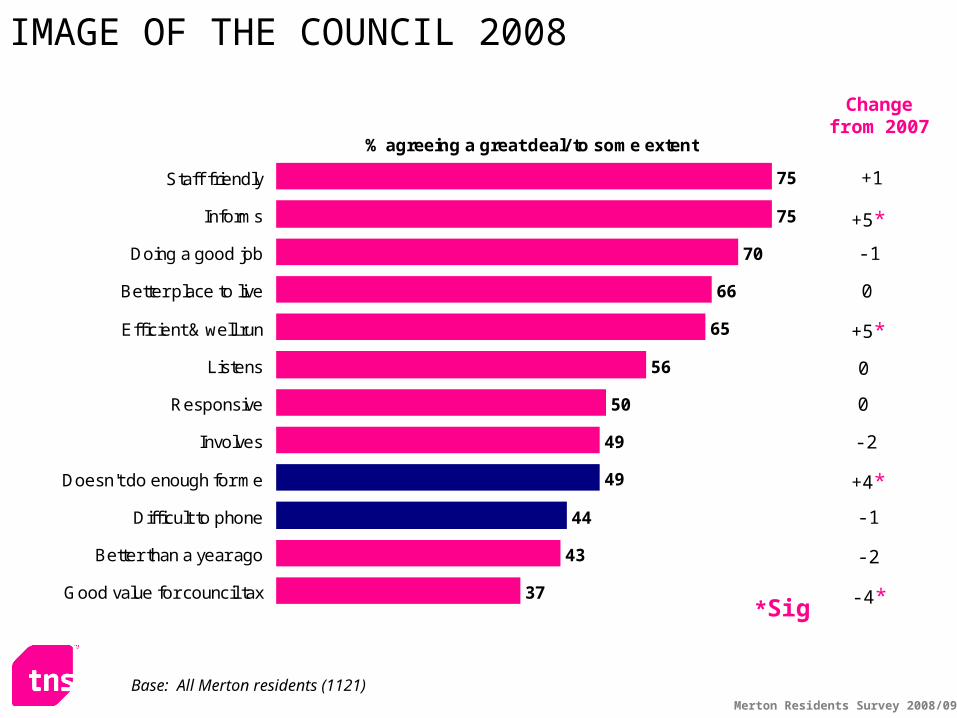
75
70
66
65
56
50
49
49
44
43
37
75Staff friendly
Informs
Doing a good job
Better place to live
Efficient & well run
Listens
Responsive
Involves
Doesn't do enough for me
Difficult to phone
Better than a year ago
Good value for council tax
% agreeing a great deal/ to some extent
Changefrom 2007
*Sig
+1
+5*
0
+5*
0
0
+4*
-1
-4*
Base: All Merton residents (1121)
-1
IMAGE OF THE COUNCIL 2008
-2
-2
Merton Residents Survey 2008/09
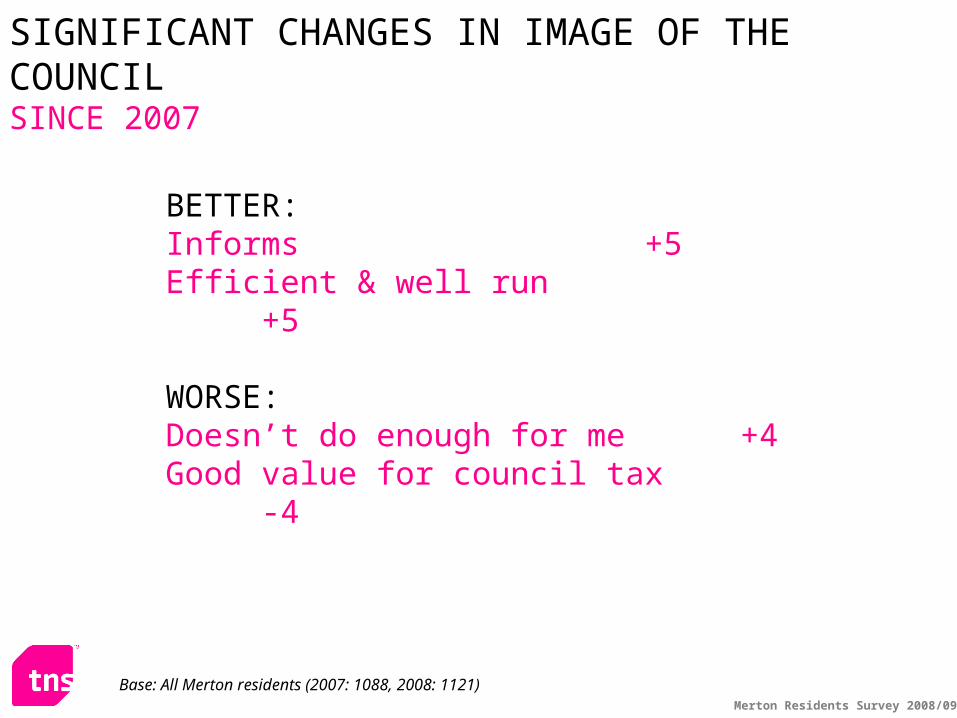
BETTER:Informs +5Efficient & well run +5
WORSE:Doesn’t do enough for me +4Good value for council tax -4
SIGNIFICANT CHANGES IN IMAGE OF THE COUNCILSINCE 2007
Base: All Merton residents (2007: 1088, 2008: 1121)
Merton Residents Survey 2008/09
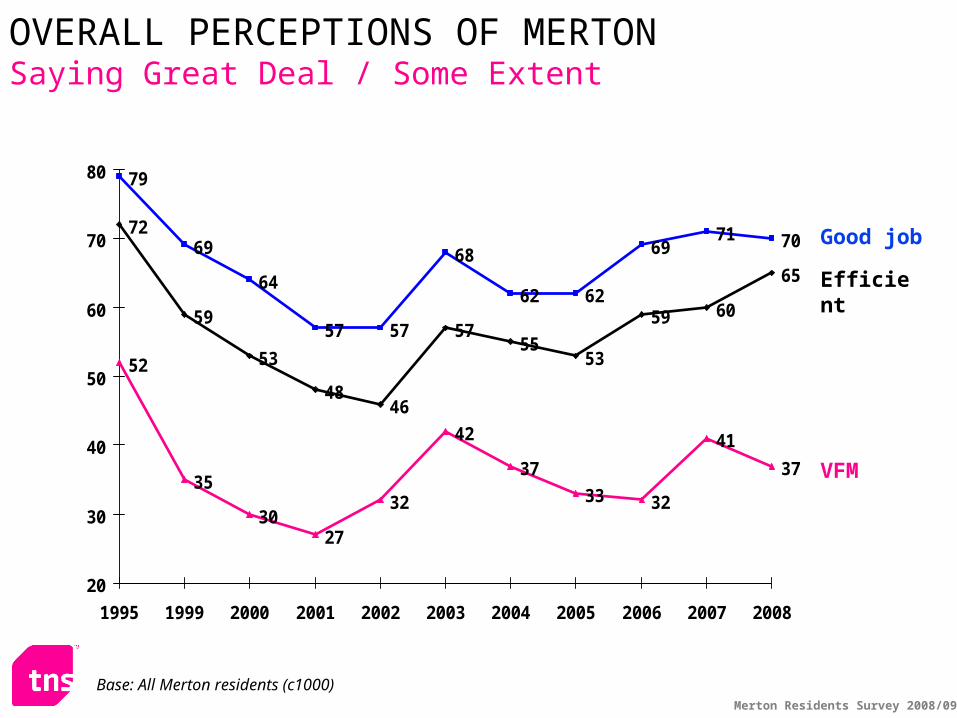
79
69
64
57 57
68
62 62
6971 70
72
59
53
4846
5755
53
59 60
65
52
35
3027
32
42
37
33 32
41
37
20
30
40
50
60
70
80
1995 1999 2000 2001 2002 2003 2004 2005 2006 2007 2008
Good job
Efficient
OVERALL PERCEPTIONS OF MERTON Saying Great Deal / Some Extent
VFM
Base: All Merton residents (c1000)
Merton Residents Survey 2008/09
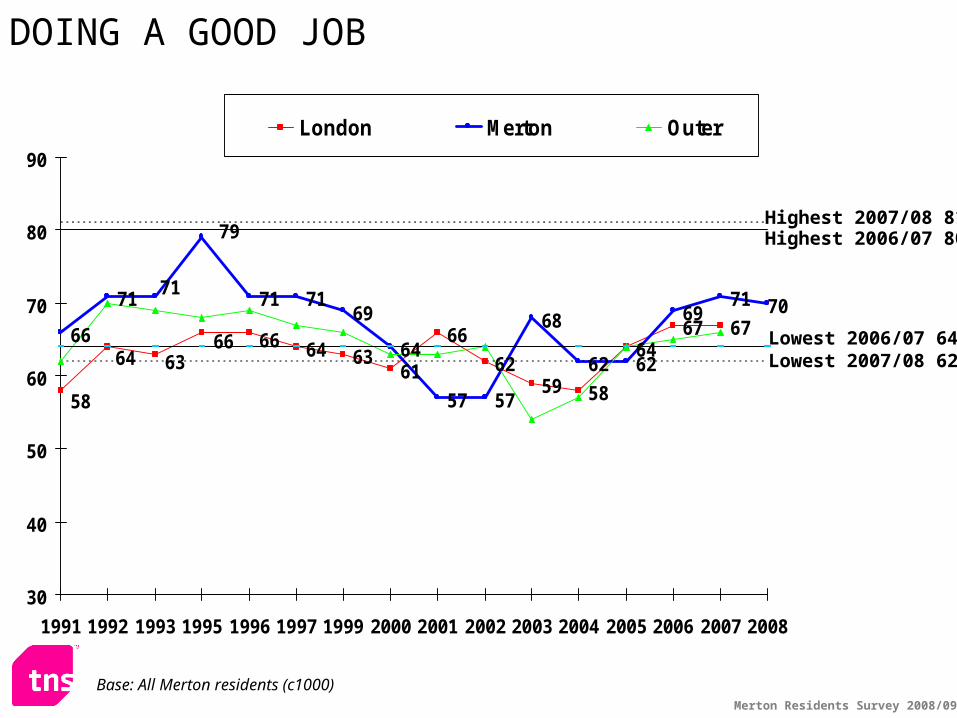
64 6361
66
6259 58
6467 6766
71 71 7169
64
57 57
68
62 62
6971 70
666663
58
64
71
79
30
40
50
60
70
80
90
1991 1992 1993 1995 1996 1997 1999 2000 2001 2002 2003 2004 2005 2006 2007 2008
London Merton Outer
DOING A GOOD JOB
Highest 2007/08 81Highest 2006/07 80
Lowest 2007/08 62Lowest 2006/07 64
Base: All Merton residents (c1000)
Merton Residents Survey 2008/09
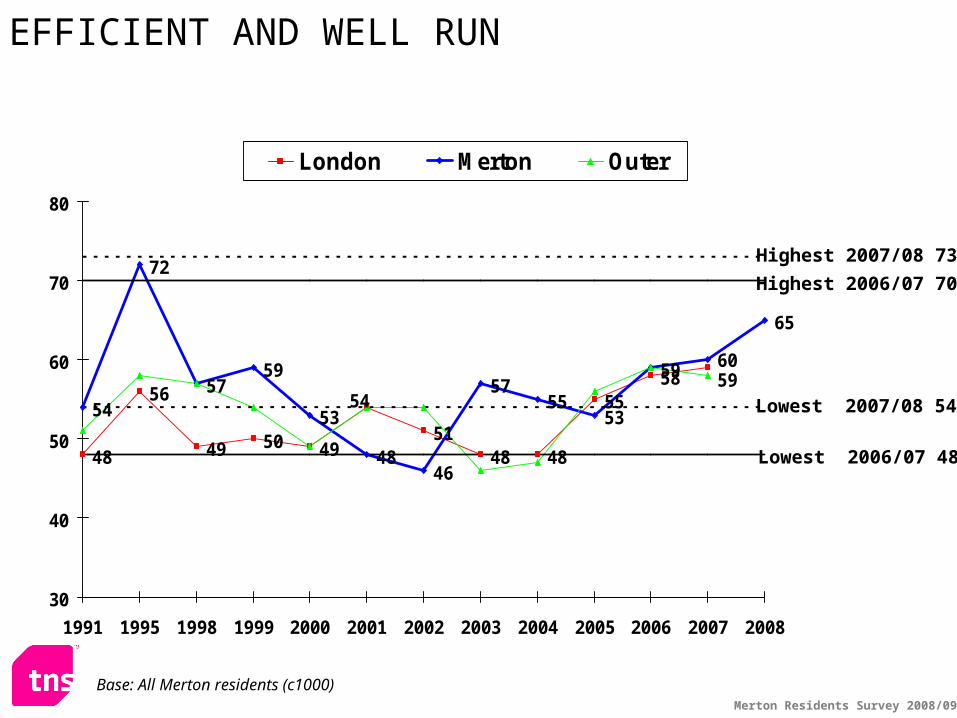
48
56
49 50 4951
48 48
5558
54
72
5759
53
4846
5755
53
59
65
5954
60
30
40
50
60
70
80
1991 1995 1998 1999 2000 2001 2002 2003 2004 2005 2006 2007 2008
London Merton Outer
EFFICIENT AND WELL RUN
Highest 2006/07 70
Lowest 2007/08 54
Highest 2007/08 73
Base: All Merton residents (c1000)
Lowest 2006/07 48
Merton Residents Survey 2007/08
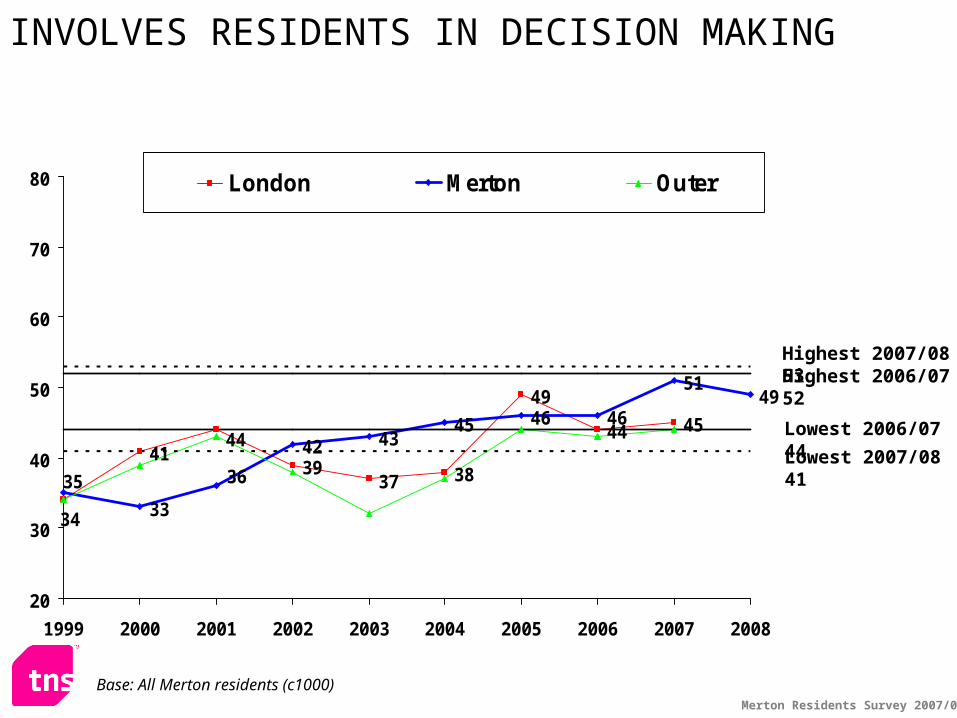
4139
37 38
49
44 45
33
42 4345 46 46
5149
34
44
35 36
20
30
40
50
60
70
80
1999 2000 2001 2002 2003 2004 2005 2006 2007 2008
London Merton Outer
INVOLVES RESIDENTS IN DECISION MAKING
Lowest 2006/07 44
Highest 2006/07 52Highest 2007/08 53
Lowest 2007/08 41
Base: All Merton residents (c1000)
Merton Residents Survey 2008/09
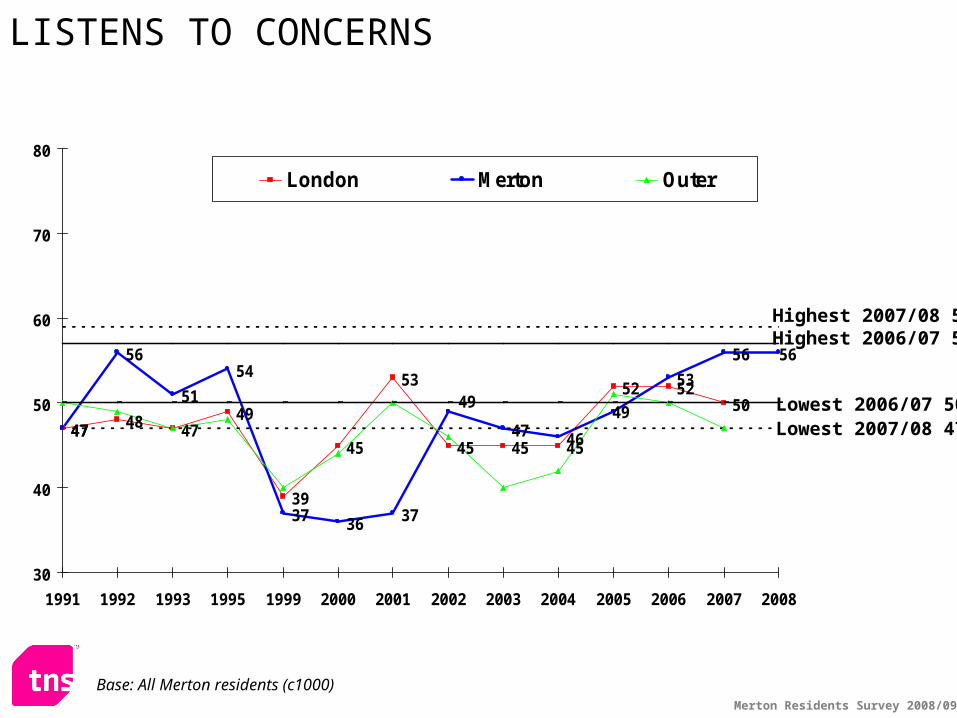
47 48 4749
39
45
53
45 45 45
52 5250
47
56
51
54
37 36 37
47 46
53
56 56
4949
30
40
50
60
70
80
1991 1992 1993 1995 1999 2000 2001 2002 2003 2004 2005 2006 2007 2008
London Merton Outer
LISTENS TO CONCERNS
Lowest 2007/08 47
Highest 2007/08 59Highest 2006/07 57
Base: All Merton residents (c1000)
Lowest 2006/07 50
Merton Residents Survey 2008/09
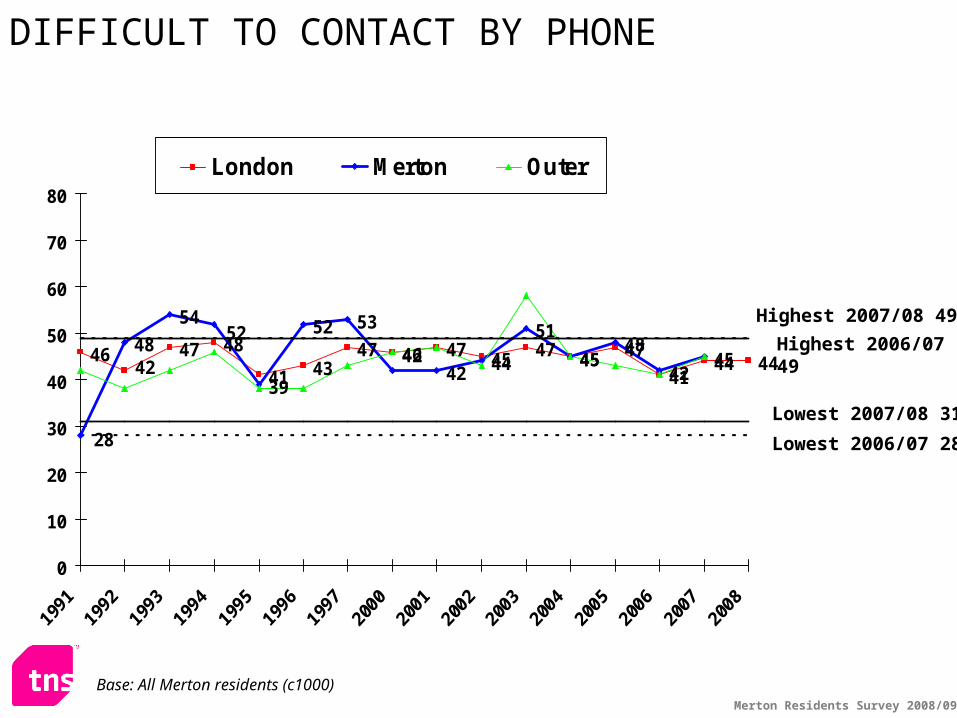
47 48
41 4347 46 47 45 47 45 47
4144 44
48
54
39
52 53
42 44
51
4548
424542
4652
28
42
0
10
20
30
40
50
60
70
80London Merton Outer
DIFFICULT TO CONTACT BY PHONE
Highest 2007/08 49
Lowest 2007/08 31
Highest 2006/07 49
Base: All Merton residents (c1000)
Lowest 2006/07 28

Merton Residents Survey 2008/09
33
38
45
4138
41
45 45 44
33
49
38 3835
4345
41
45 46
50 50
39
35
20
30
40
50
60
70
80
1991 1995 1999 2000 2001 2002 2003 2004 2005 2006 2007 2008
London Merton Outer
RESPONDS QUICKLY WHEN ASKED
Highest 2007/08 57
Lowest 2007/08 46Lowest 2006/07 45
Highest 2006/07 54
Base: All Merton residents (c1000)

Merton Residents Survey 2008/09
53
61
51
5658 57
69 68
6461
50
61
56
62
66
70
75
58
63
52
56
69
52
30
40
50
60
70
80
1991 1995 1999 2000 2001 2002 2003 2004 2005 2006 2007 2008
London Merton Outer
KEEPS RESIDENTS INFORMED
Highest 2007/08 74
Highest 2006/07 71
Lowest 2006/07 62Lowest 2007/08 64
Base: All Merton residents (c1000)
Merton Residents Survey 2008/09
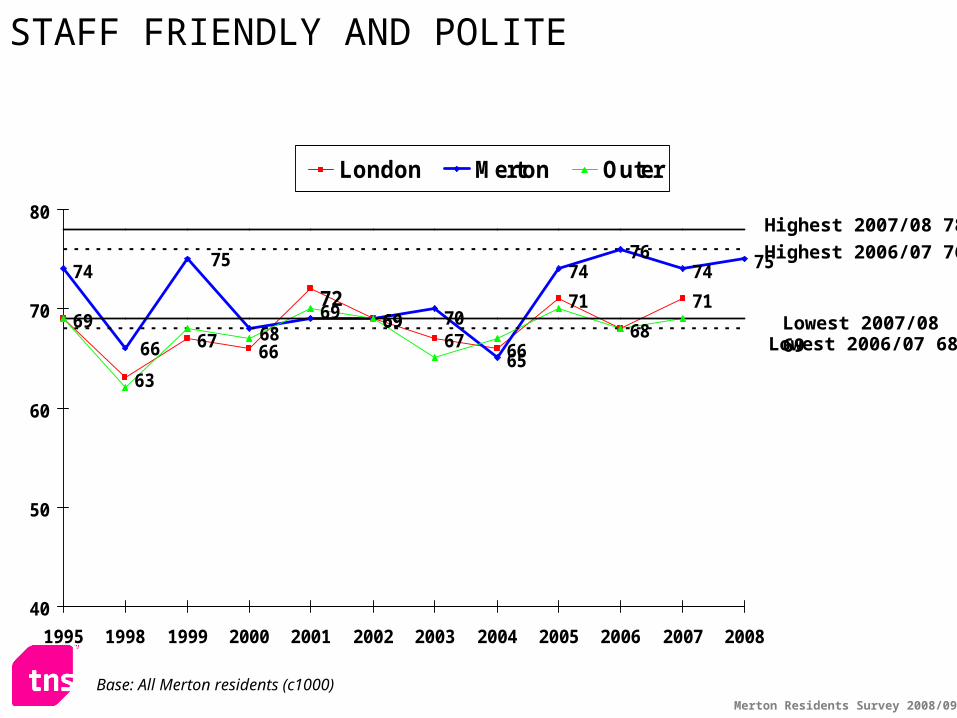
69
63
6769
67 66
71
68
71
74
69
65
7476
74 75
66
7270
6668
75
69
40
50
60
70
80
1995 1998 1999 2000 2001 2002 2003 2004 2005 2006 2007 2008
London Merton Outer
STAFF FRIENDLY AND POLITE
Highest 2007/08 78
Lowest 2007/08 69Lowest 2006/07 68
Highest 2006/07 76
Base: All Merton residents (c1000)
Merton Residents Survey 2008/09
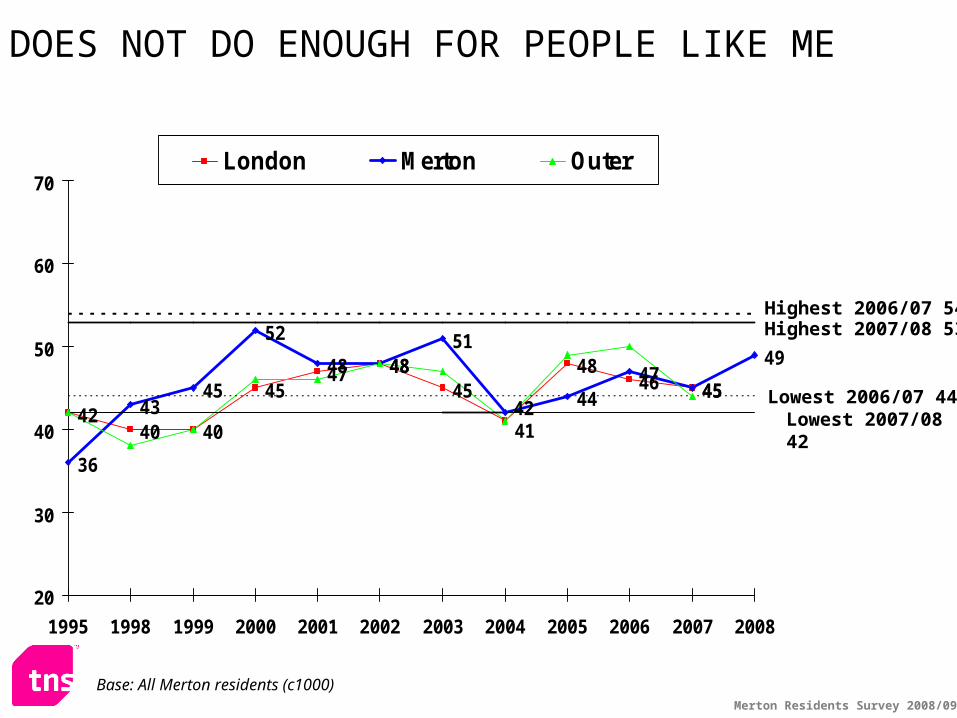
4240 40
4547 48
4548
46 45
36
4345
52
48 4851
4447
45
49
4142
20
30
40
50
60
70
1995 1998 1999 2000 2001 2002 2003 2004 2005 2006 2007 2008
London Merton Outer
DOES NOT DO ENOUGH FOR PEOPLE LIKE ME
Lowest 2007/08 42Lowest 2006/07 44
Highest 2006/07 54Highest 2007/08 53
Base: All Merton residents (c1000)
Merton Residents Survey 2008/09
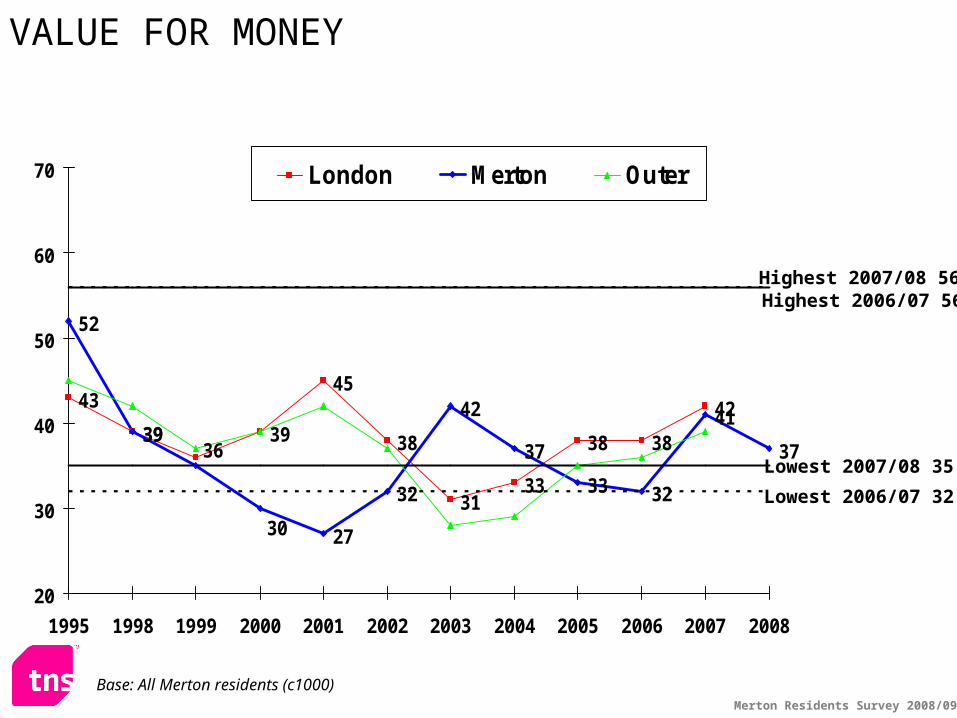
43
39 39
45
38
3133
38 38
42
52
27
32
42
37
33 32
41
3736
30
39
20
30
40
50
60
70
1995 1998 1999 2000 2001 2002 2003 2004 2005 2006 2007 2008
London Merton Outer
VALUE FOR MONEY
Highest 2006/07 56
Lowest 2006/07 32
Lowest 2007/08 35
Highest 2007/08 56
Base: All Merton residents (c1000)
Merton Residents Survey 2008/09
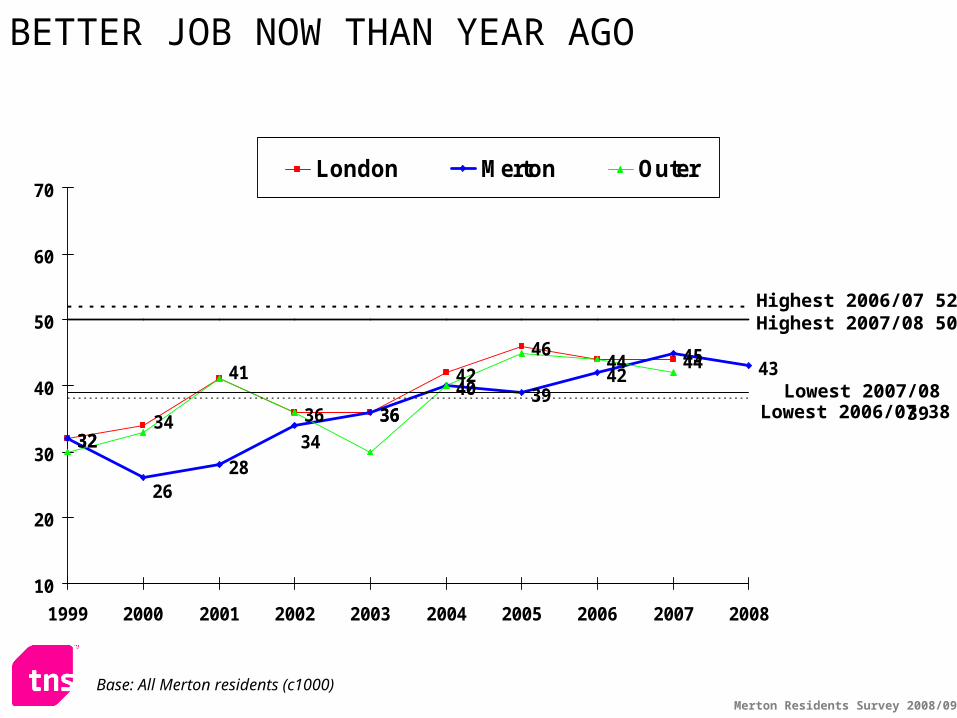
3236 36
42
4644 44
3236
40 3942
454341
3434
2826
10
20
30
40
50
60
70
1999 2000 2001 2002 2003 2004 2005 2006 2007 2008
London Merton Outer
BETTER JOB NOW THAN YEAR AGO
Highest 2006/07 52
Lowest 2006/07 38 Lowest 2007/08 39
Highest 2007/08 50
Base: All Merton residents (c1000)
Merton Residents Survey 2008/09
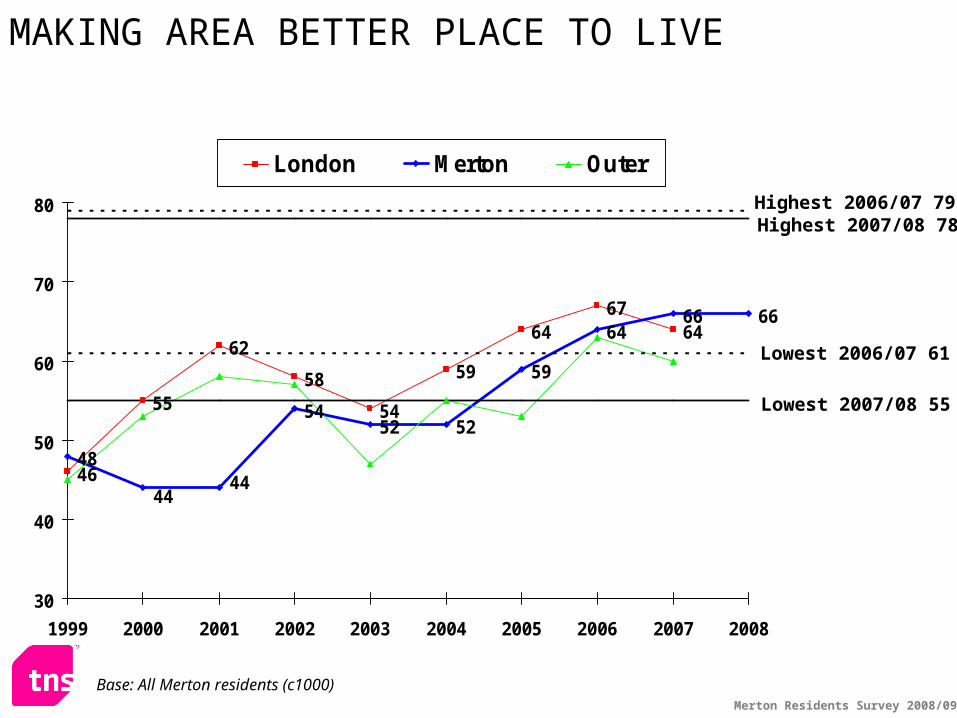
46
55
62
58
54
59
6467
64
48
5452 52
59
6466 66
4444
30
40
50
60
70
80
1999 2000 2001 2002 2003 2004 2005 2006 2007 2008
London Merton Outer
MAKING AREA BETTER PLACE TO LIVE
Highest 2007/08 78
Lowest 2007/08 55
Lowest 2006/07 61
Highest 2006/07 79
Base: All Merton residents (c1000)

Service DeliveryService Delivery
Merton Residents Survey 2008/09Base: All respondents (1121)
78
1210
715
68
1615
261817
732
56
1316
23564
9
6969
66656463
6060
5853
4239
363332
2827
2522212120
1414
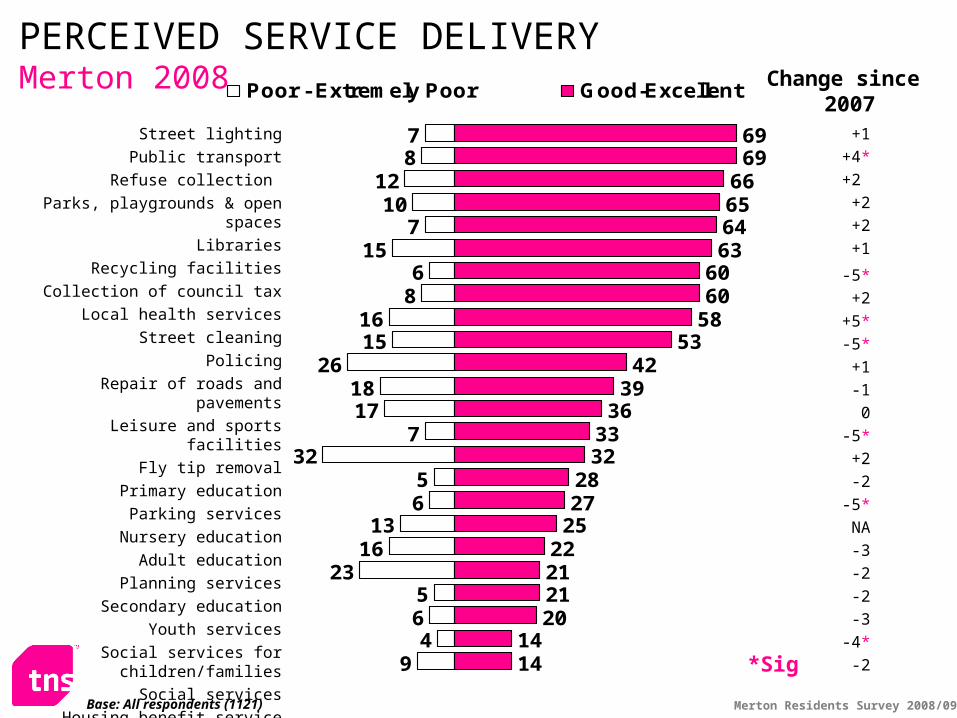
Poor - Extremely Poor Good-Excellent
PERCEIVED SERVICE DELIVERY Merton 2008
Street lighting
Public transport
Refuse collection
Parks, playgrounds & open spaces
Libraries
Recycling facilities
Collection of council tax
Local health services
Street cleaning
Policing
Repair of roads and pavements
Leisure and sports facilities
Fly tip removal
Primary education
Parking services
Nursery education
Adult education
Planning services
Secondary education
Youth services
Social services for children/families
Social services
Housing benefit service
Council housing
Change since 2007
+1
+4*
+2
+2
+2
+1
-5*
+2
+5*
-5*
+1
-1
0
-5*
+2
-2
-5*
NA
-3
-2
-2
-3
-4*
-2*Sig
Merton Residents Survey 2008/09
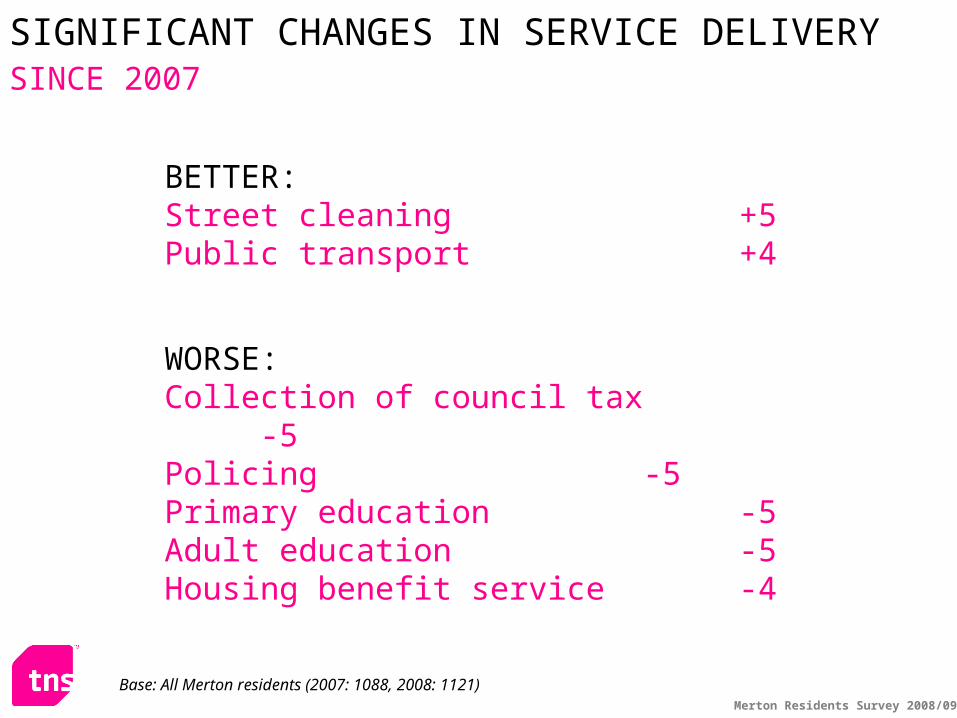
BETTER:Street cleaning +5Public transport +4
WORSE:
Collection of council tax -5Policing -5Primary education -5Adult education -5Housing benefit service -4
SIGNIFICANT CHANGES IN SERVICE DELIVERYSINCE 2007
Base: All Merton residents (2007: 1088, 2008: 1121)
Merton Residents Survey 2008/09
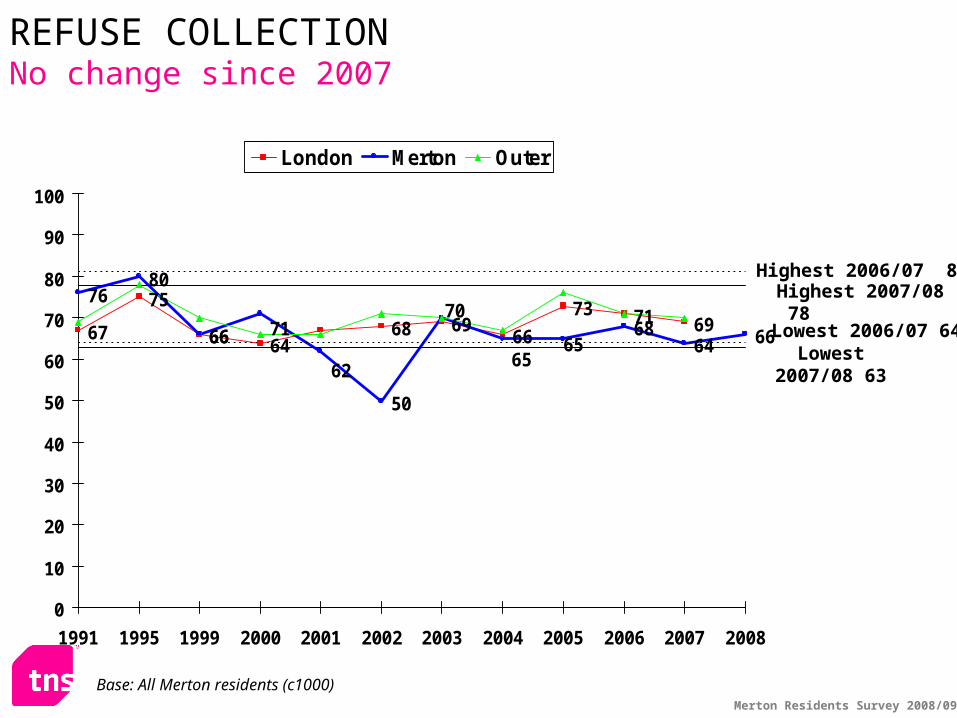
67
75
66 6468 69
73 71 69
7680
66
50
6864 6666
62
71
6565
70
0
10
20
30
40
50
60
70
80
90
100
1991 1995 1999 2000 2001 2002 2003 2004 2005 2006 2007 2008
London Merton Outer
REFUSE COLLECTIONNo change since 2007
Highest 2007/08 78Lowest 2006/07 64
Lowest 2007/08 63
Highest 2006/07 81
Base: All Merton residents (c1000)
Merton Residents Survey 2008/09
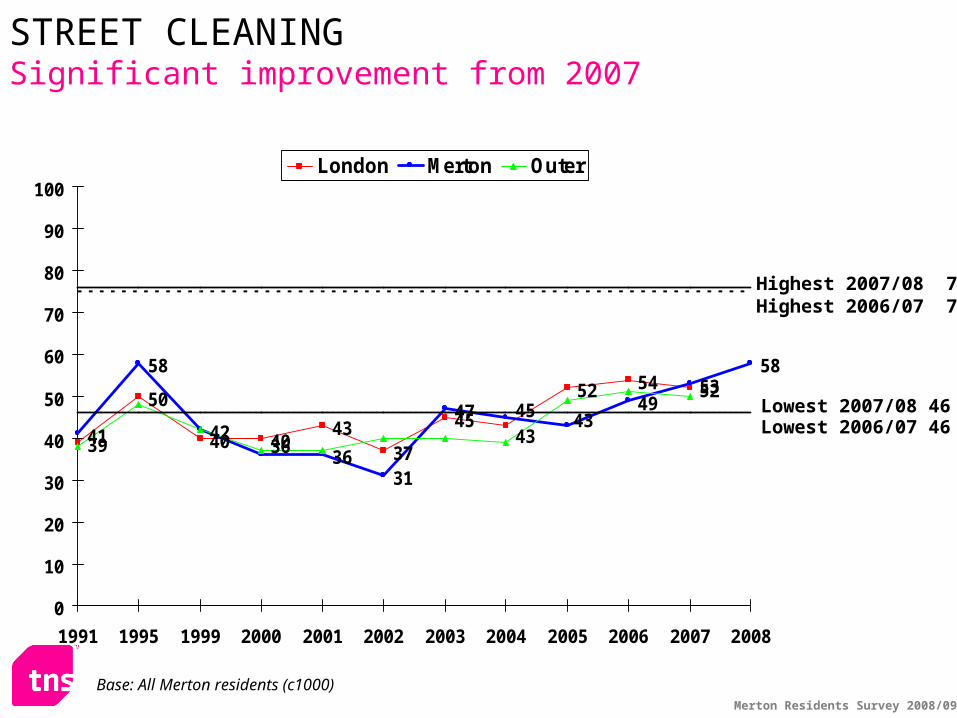
39
50
40 4043
37
45
52 54 52
41
58
4236
31
47 4953
58
4345
3643
0
10
20
30
40
50
60
70
80
90
100
1991 1995 1999 2000 2001 2002 2003 2004 2005 2006 2007 2008
London Merton Outer
STREET CLEANINGSignificant improvement from 2007
Highest 2006/07 75
Lowest 2006/07 46
Highest 2007/08 76
Lowest 2007/08 46
Base: All Merton residents (c1000)
Merton Residents Survey 2008/09
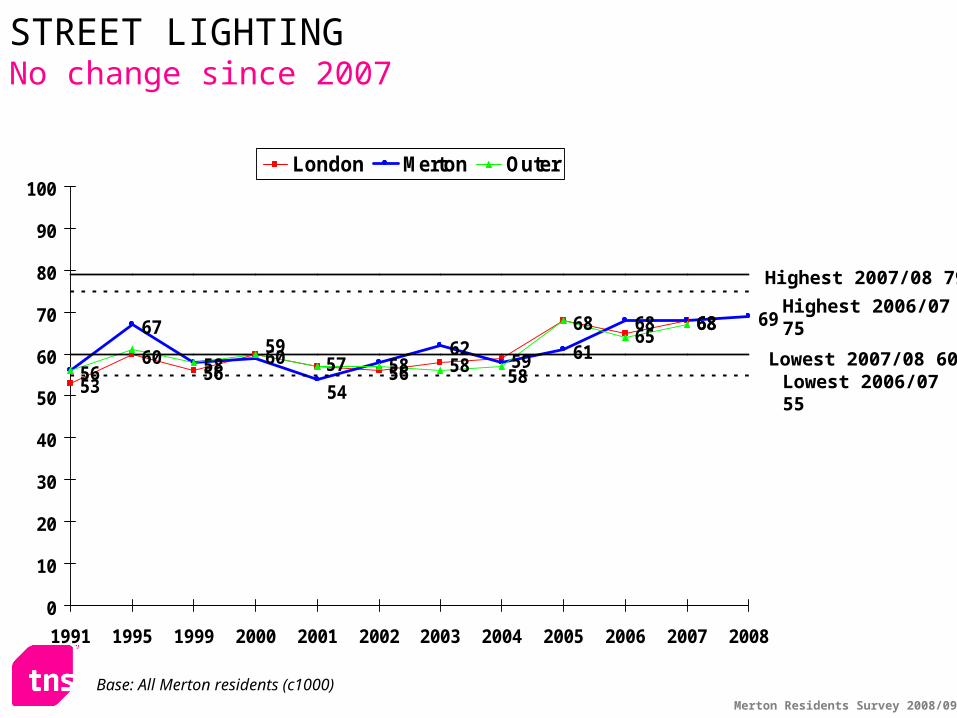
53
60 6056 58 59
6865
68
56
67
58 5862 61
68 68 69
5756 5854
59
0
10
20
30
40
50
60
70
80
90
100
1991 1995 1999 2000 2001 2002 2003 2004 2005 2006 2007 2008
London Merton Outer
STREET LIGHTINGNo change since 2007
Highest 2006/07 75
Lowest 2006/07 55
Highest 2007/08 79
Lowest 2007/08 60
Base: All Merton residents (c1000)
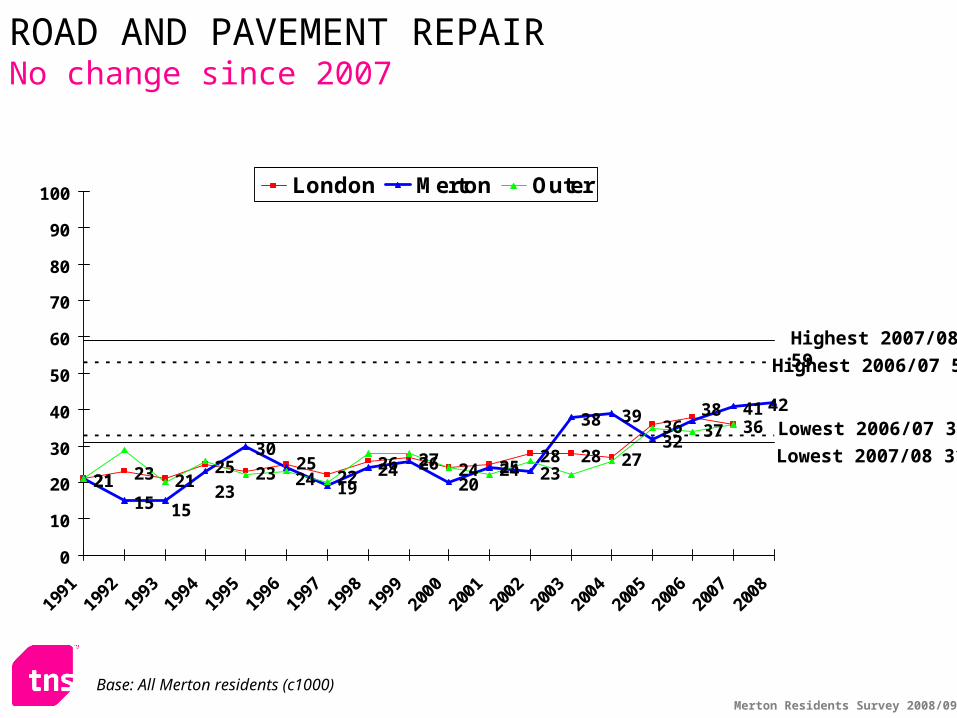
Merton Residents Survey 2008/09
ROAD AND PAVEMENT REPAIRNo change since 2007
Highest 2007/08 59
Lowest 2006/07 33
Highest 2006/07 53
Lowest 2007/08 31
Base: All Merton residents (c1000)
21 23 2125 23 22
26 2724 25
28 28 27
36 36
2115
30
1924 26
2024 23
38 39
32
41 4238
25
37
1523
24
0
10
20
30
40
50
60
70
80
90
100 London Merton Outer
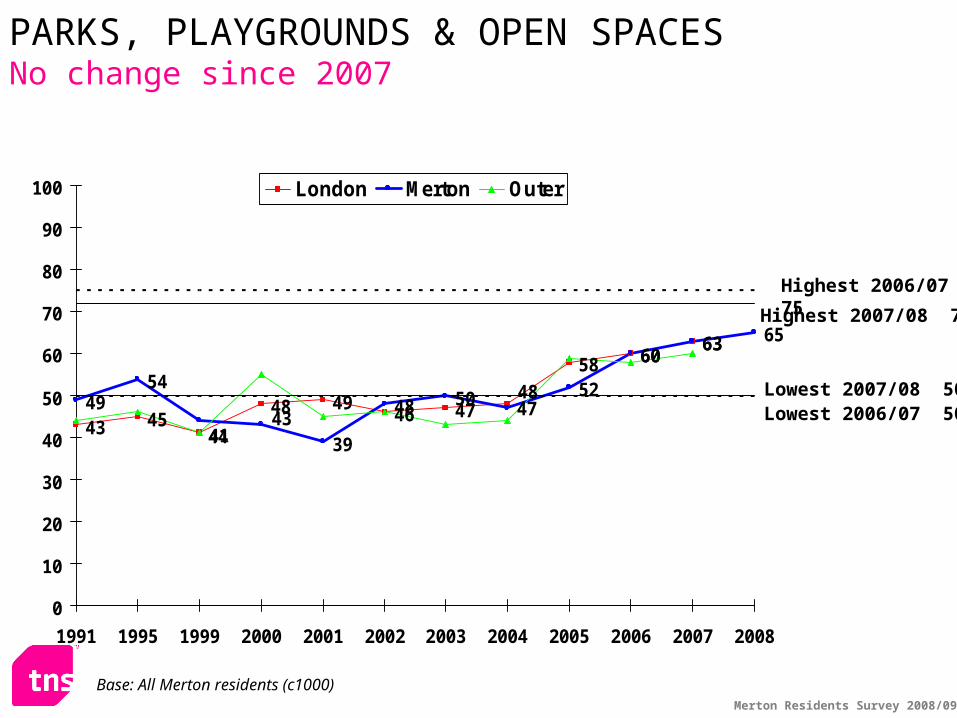
Merton Residents Survey 2008/09
43 4541
48 4946 47
58 6063
4954
39
48 50 52
6063 65
484743
44
0
10
20
30
40
50
60
70
80
90
100
1991 1995 1999 2000 2001 2002 2003 2004 2005 2006 2007 2008
London Merton Outer
PARKS, PLAYGROUNDS & OPEN SPACESNo change since 2007
Highest 2007/08 72
Lowest 2006/07 50
Highest 2006/07 75
Lowest 2007/08 50
Base: All Merton residents (c1000)
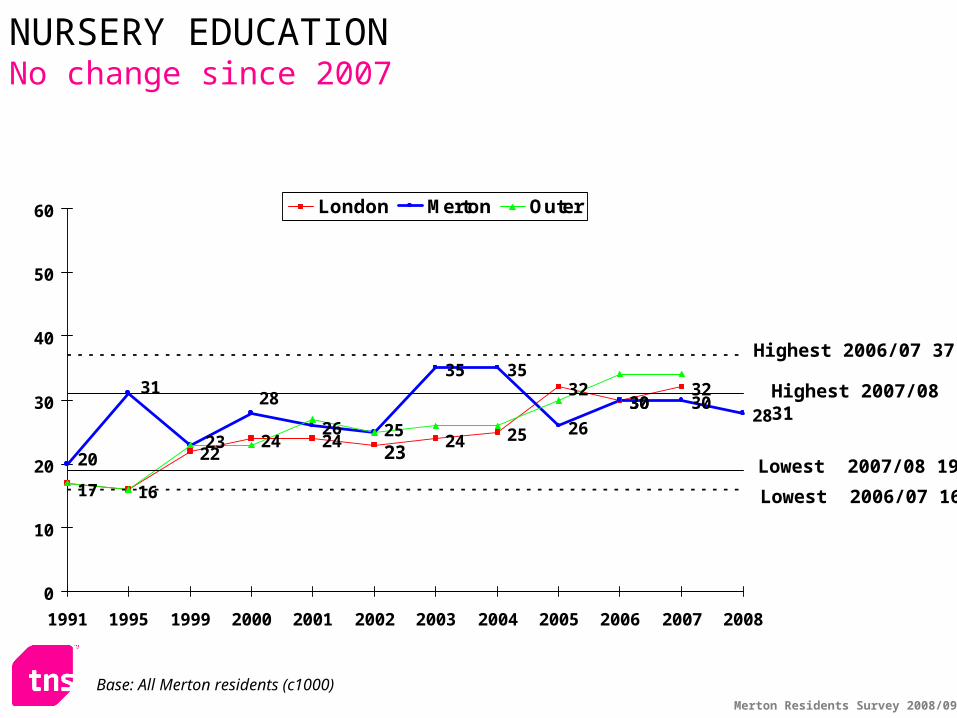
Merton Residents Survey 2008/09
16
2224 24 24 25
3230
32
26
35 35
26
30 3028
17
23
28
2023
31
25
0
10
20
30
40
50
60
1991 1995 1999 2000 2001 2002 2003 2004 2005 2006 2007 2008
London Merton Outer
NURSERY EDUCATIONNo change since 2007
Highest 2007/08 31
Lowest 2007/08 19
Lowest 2006/07 16
Highest 2006/07 37
Base: All Merton residents (c1000)
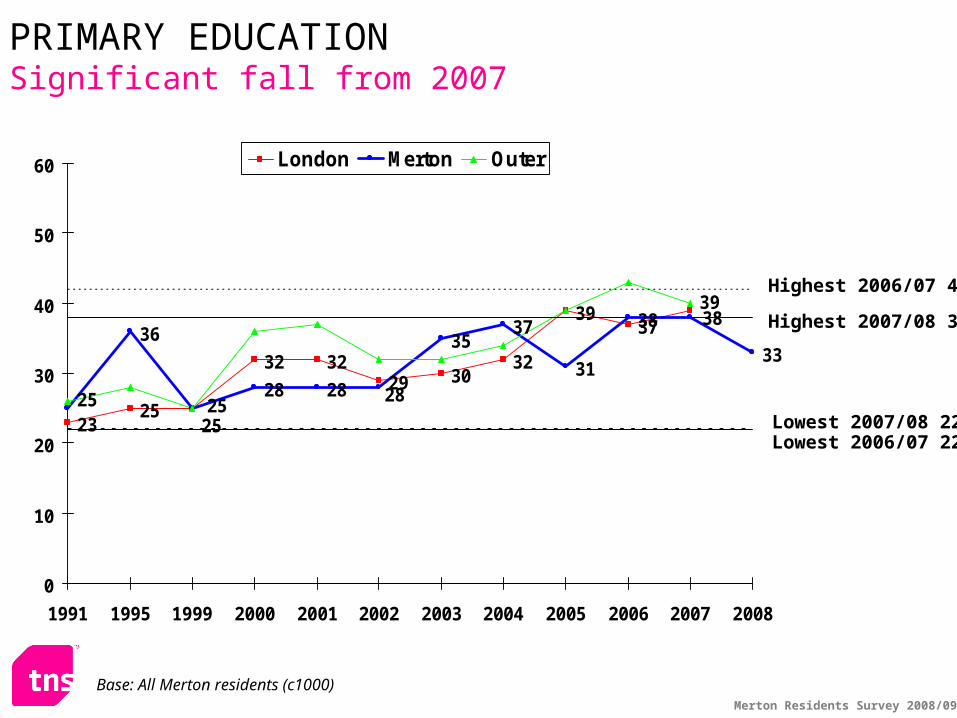
Merton Residents Survey 2008/09
2325
32 3229 30
32
3937
28
3537
31
38
33
39
25
38
2825 28
36
25
0
10
20
30
40
50
60
1991 1995 1999 2000 2001 2002 2003 2004 2005 2006 2007 2008
London Merton Outer
PRIMARY EDUCATIONSignificant fall from 2007
Highest 2006/07 42
Lowest 2007/08 22Lowest 2006/07 22
Highest 2007/08 38
Base: All Merton residents (c1000)
Merton Residents Survey 2008/09
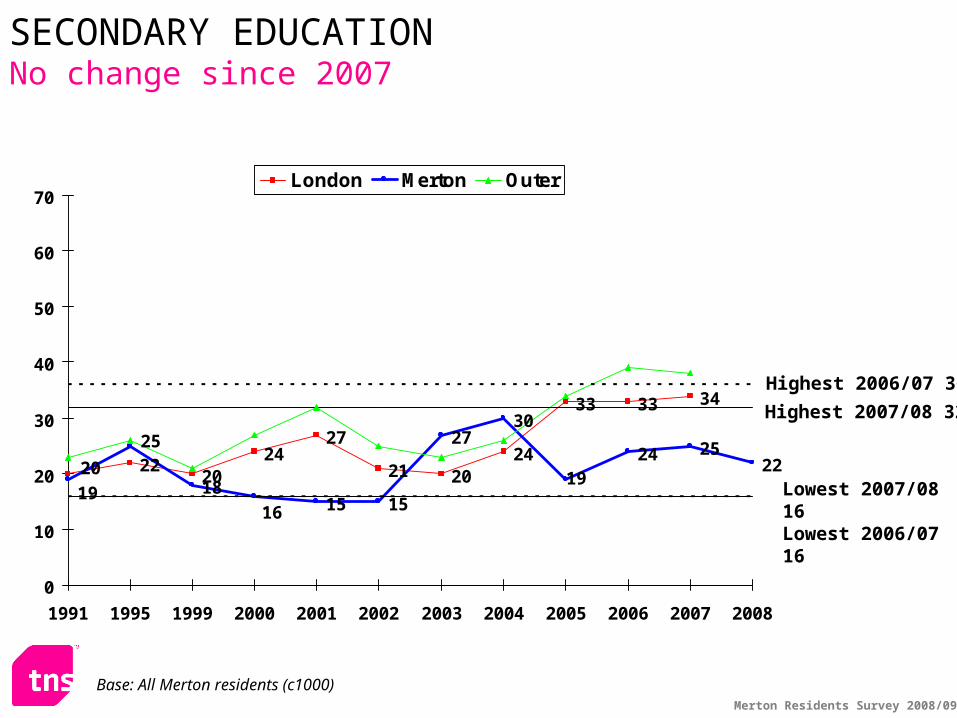
2220
2427
21 2024
33 33 34
1815 15
2730
24 252220
25
1916
19
0
10
20
30
40
50
60
70
1991 1995 1999 2000 2001 2002 2003 2004 2005 2006 2007 2008
London Merton Outer
SECONDARY EDUCATIONNo change since 2007
Highest 2006/07 36
Lowest 2007/08 16Lowest 2006/07 16
Highest 2007/08 32
Base: All Merton residents (c1000)
Merton Residents Survey 2008/09
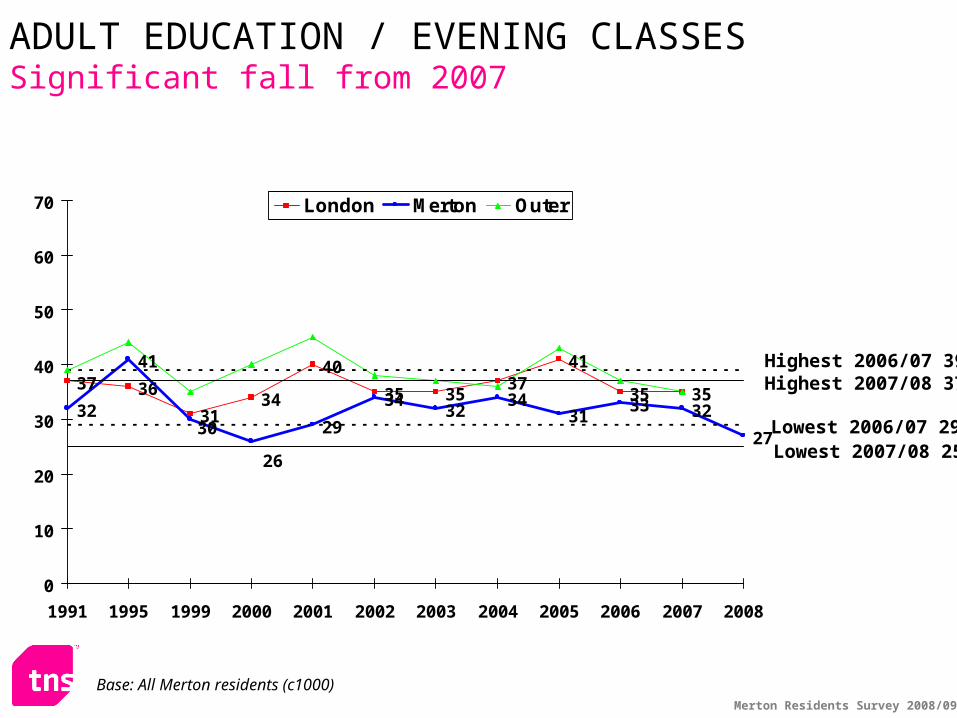
37 36
3134
40
35 3537
41
35 3532
41
29
3432
3431
33 32
2726
30
0
10
20
30
40
50
60
70
1991 1995 1999 2000 2001 2002 2003 2004 2005 2006 2007 2008
London Merton Outer
ADULT EDUCATION / EVENING CLASSESSignificant fall from 2007
Highest 2007/08 37Highest 2006/07 39
Lowest 2006/07 29 Lowest 2007/08 25
Base: All Merton residents (c1000)
Merton Residents Survey 2008/09
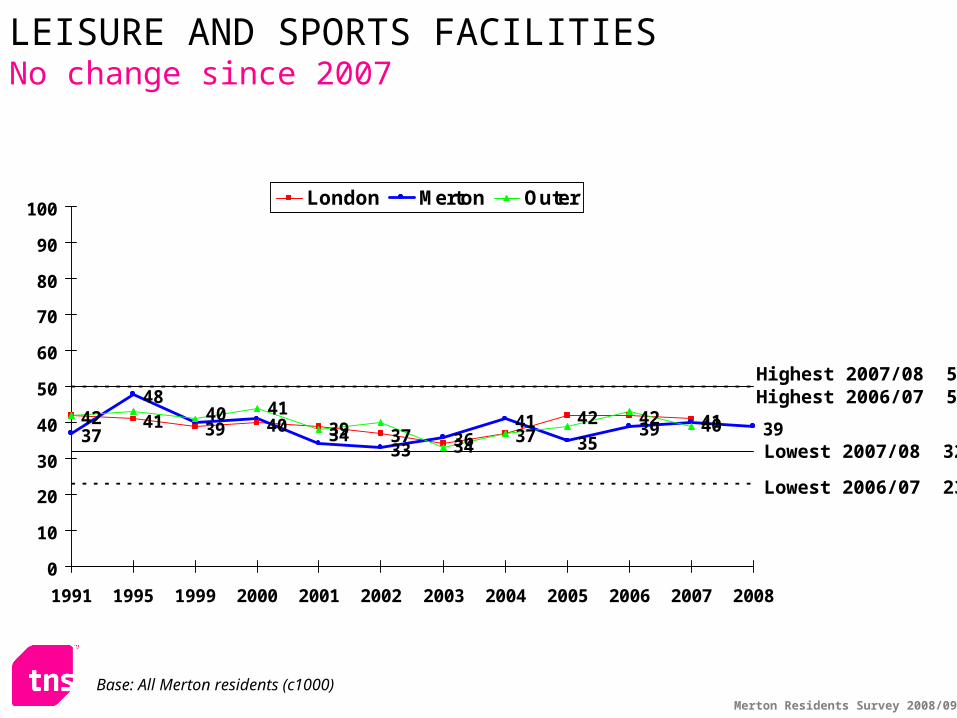
42 41 39 40 39 3734
3742 42 41
37
48
3336
4135
39 40 3934
4140
0
10
20
30
40
50
60
70
80
90
100
1991 1995 1999 2000 2001 2002 2003 2004 2005 2006 2007 2008
London Merton Outer
LEISURE AND SPORTS FACILITIESNo change since 2007
Highest 2007/08 50
Lowest 2006/07 23
Lowest 2007/08 32
Highest 2006/07 50
Base: All Merton residents (c1000)

Merton Residents Survey 2008/09
59 5855
59 5855 56
63 64
70 71
5355
52 53
6062
64
6157
49
5657
20
30
40
50
60
70
80
90
1991 1995 1999 2000 2001 2002 2003 2004 2005 2006 2007 2008
London Merton Outer
LIBRARIESNo change since 2007
Highest 2006/07 68
Lowest 2006/07 54
Lowest 2007/08 50
Highest 2007/08 68
Base: All Merton residents (c1000)

Merton Residents Survey 2008/09
1316
1214 14 14 16
19 1821
9
18 19
1012
16 1417
1215 17
14
13
0
10
20
30
40
50
60
70
1991 1995 1999 2000 2001 2002 2003 2004 2005 2006 2007 2008
London Merton Outer
COUNCIL HOUSINGNo change since 2007
Highest 2006/07 26
Lowest 2007/08 12
Highest 2007/08 25
Lowest 2006/07 12
Base: All Merton residents (c1000)
Merton Residents Survey 2008/09
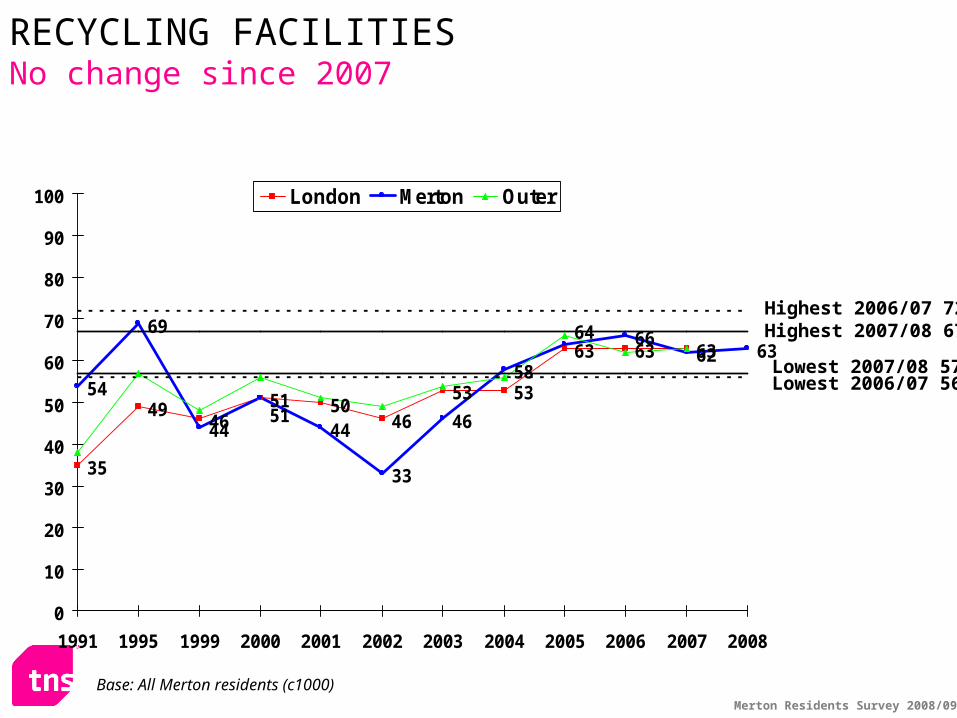
35
4651 50
46
53 53
63 63 63
54
69
44 44
33
46
58
6662 63
49
64
51
0
10
20
30
40
50
60
70
80
90
100
1991 1995 1999 2000 2001 2002 2003 2004 2005 2006 2007 2008
London Merton Outer
RECYCLING FACILITIESNo change since 2007
Highest 2006/07 72
Lowest 2006/07 56
Highest 2007/08 67
Lowest 2007/08 57
Base: All Merton residents (c1000)
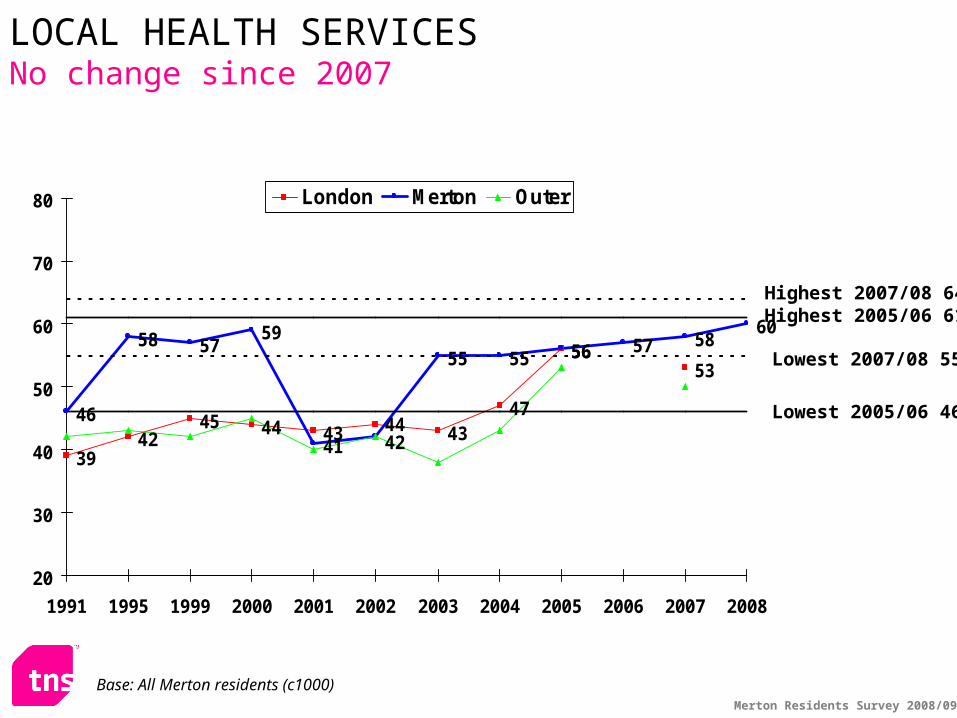
Merton Residents Survey 2008/09
3942
45 44 43 4347
5653
46
58 5759
41
55 55 56 57 5860
4442
20
30
40
50
60
70
80
1991 1995 1999 2000 2001 2002 2003 2004 2005 2006 2007 2008
London Merton Outer
LOCAL HEALTH SERVICESNo change since 2007
Highest 2005/06 61Highest 2007/08 64
Lowest 2007/08 55
Lowest 2005/06 46
Base: All Merton residents (c1000)
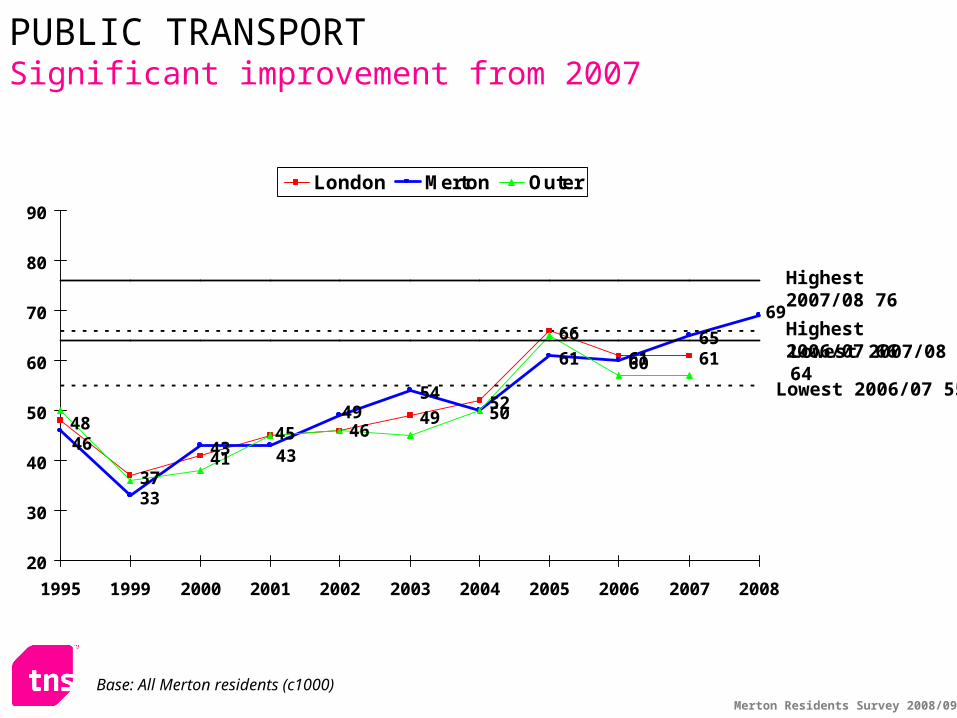
Merton Residents Survey 2008/09
48
3741
4952
66
61 61
33
43
5450
61 60
65
45 46
69
49
4346
20
30
40
50
60
70
80
90
1995 1999 2000 2001 2002 2003 2004 2005 2006 2007 2008
London Merton Outer
PUBLIC TRANSPORTSignificant improvement from 2007
Highest 2006/07 66
Highest 2007/08 76
Lowest 2006/07 55
Lowest 2007/08 64
Base: All Merton residents (c1000)
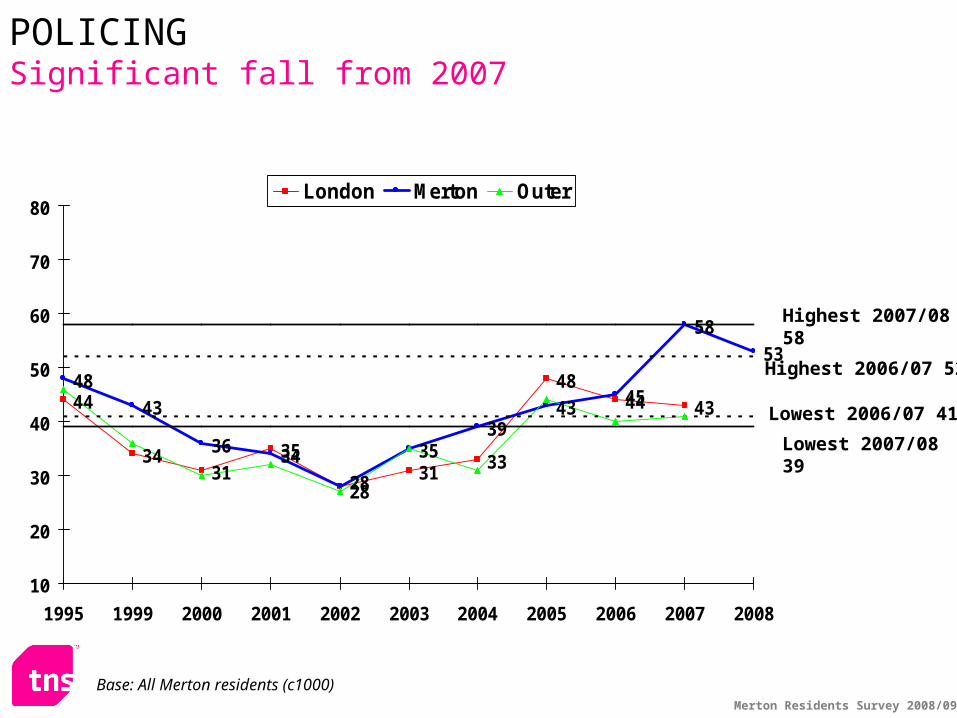
Merton Residents Survey 2008/09
44
3431
3531
33
4844 43
48
43
36 34 3539
4345
58
53
2828
10
20
30
40
50
60
70
80
1995 1999 2000 2001 2002 2003 2004 2005 2006 2007 2008
London Merton Outer
POLICINGSignificant fall from 2007
Highest 2007/08 58
Highest 2006/07 52
Lowest 2006/07 41
Lowest 2007/08 39
Base: All Merton residents (c1000)
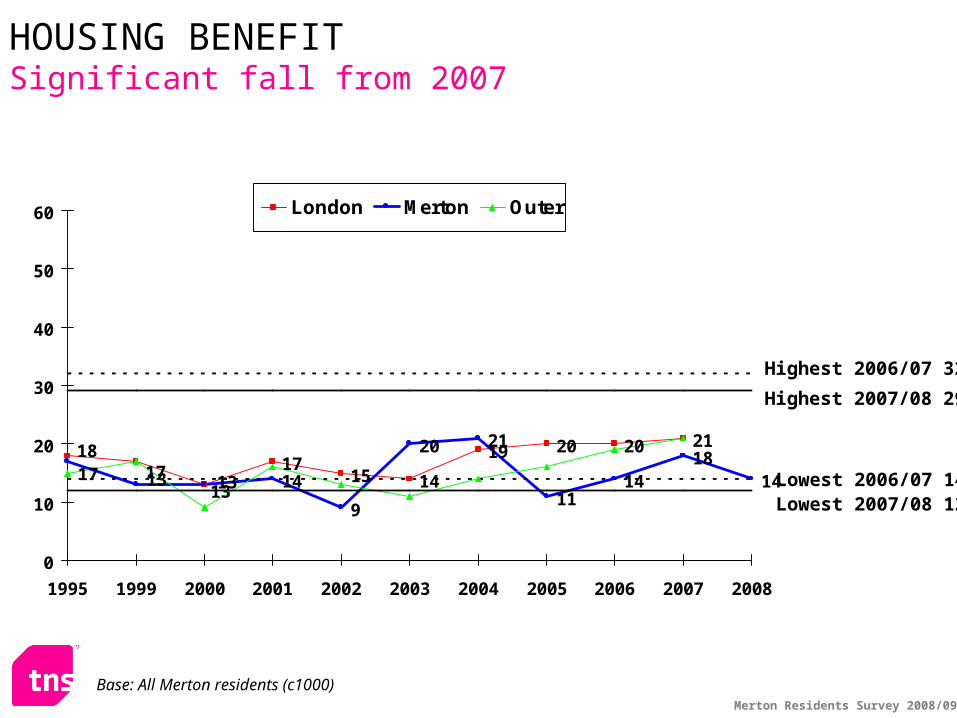
Merton Residents Survey 2008/09
1715 14
19 20 20 21
9
20 21
1114
1814
1817
131313
17 14
0
10
20
30
40
50
60
1995 1999 2000 2001 2002 2003 2004 2005 2006 2007 2008
London Merton Outer
HOUSING BENEFITSignificant fall from 2007
Highest 2006/07 32
Lowest 2006/07 14
Highest 2007/08 29
Lowest 2007/08 12
Base: All Merton residents (c1000)
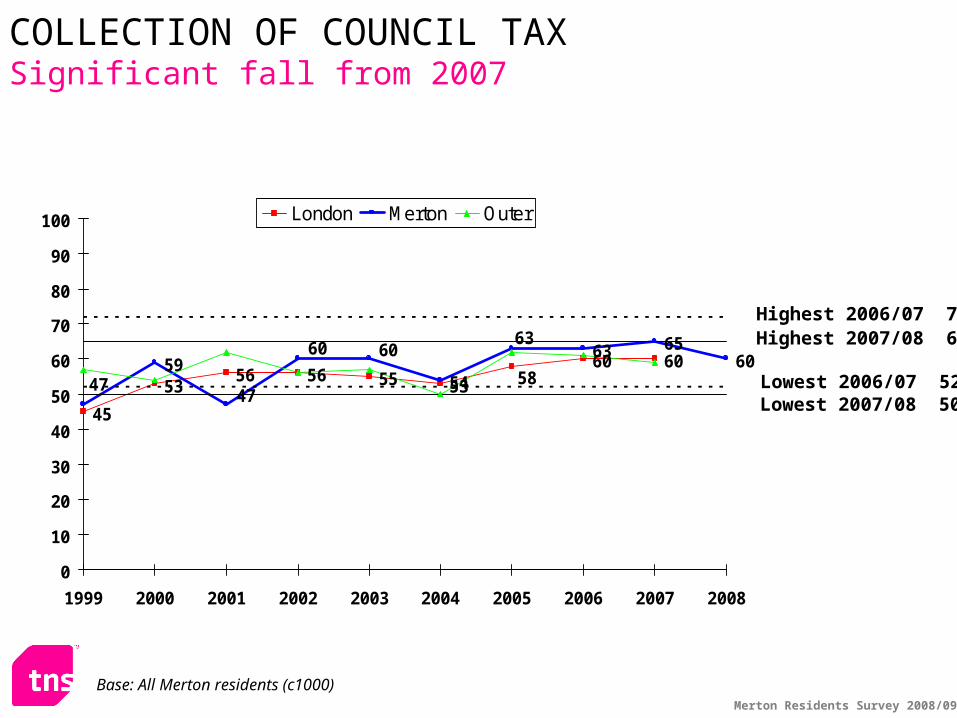
Merton Residents Survey 2008/09
45
5356 56 55 53
60 605954
63 6560
5847
636060
47
0
10
20
30
40
50
60
70
80
90
100
1999 2000 2001 2002 2003 2004 2005 2006 2007 2008
London Merton Outer
COLLECTION OF COUNCIL TAXSignificant fall from 2007
Highest 2007/08 65
Lowest 2006/07 52Lowest 2007/08 50
Highest 2006/07 72
Base: All Merton residents (c1000)
Merton Residents Survey 2008/09
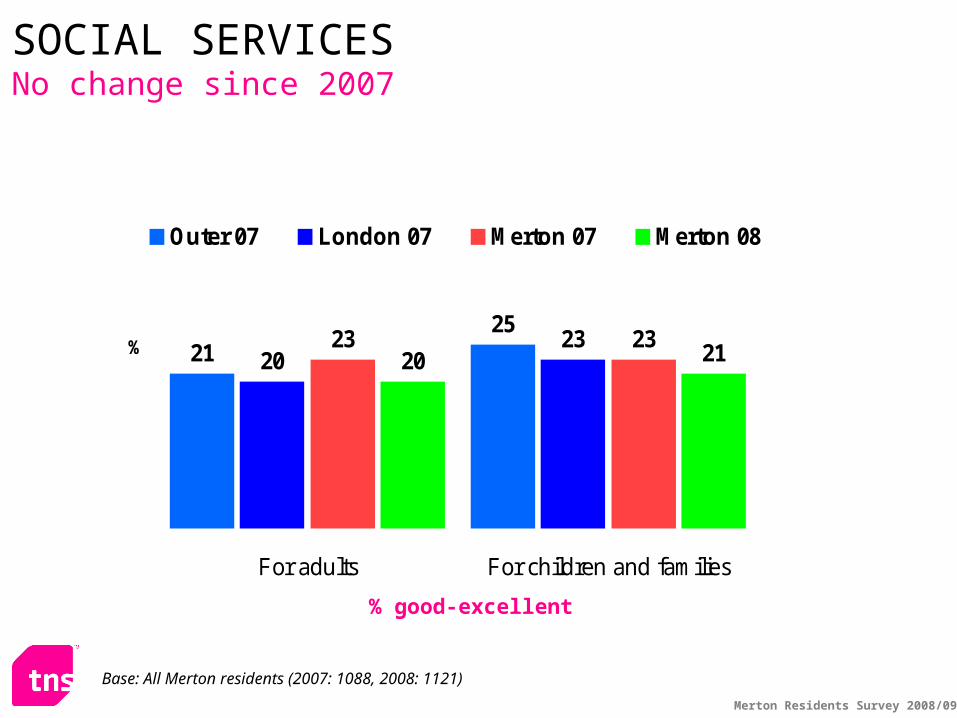
SOCIAL SERVICESNo change since 2007
2125
202323 23
20 21
For adults For children and families
%
Outer 07 London 07 Merton 07 Merton 08
% good-excellent
Base: All Merton residents (2007: 1088, 2008: 1121)
Merton Residents Survey 2008/09
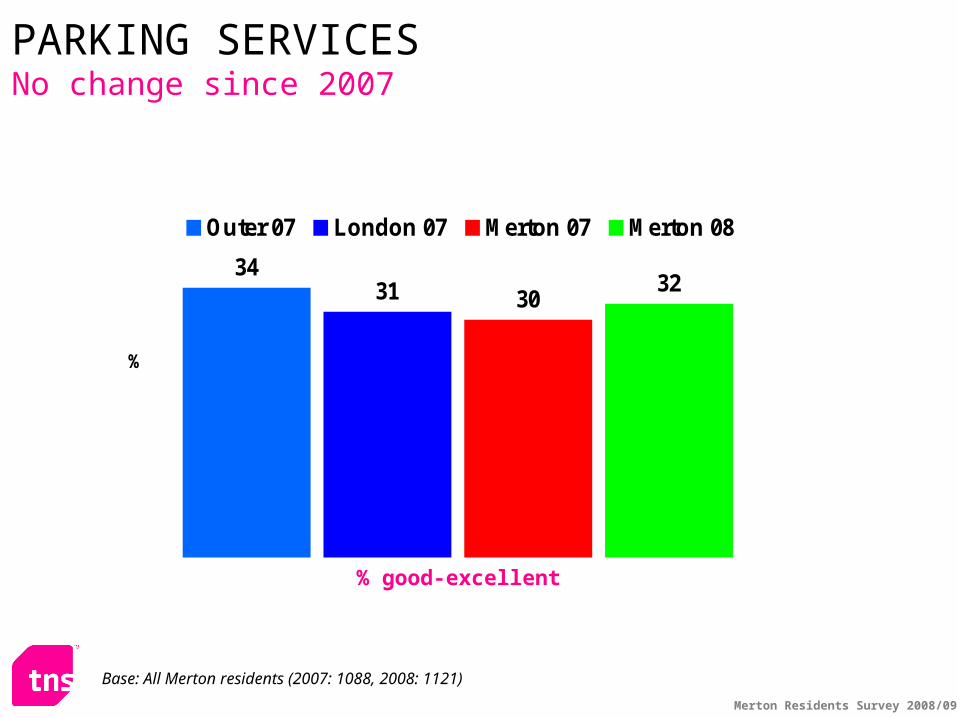
PARKING SERVICESNo change since 2007
3431 30
32
%
Outer 07 London 07 Merton 07 Merton 08
% good-excellent
Base: All Merton residents (2007: 1088, 2008: 1121)

User trendsUser trends
Merton Residents Survey 2008/09
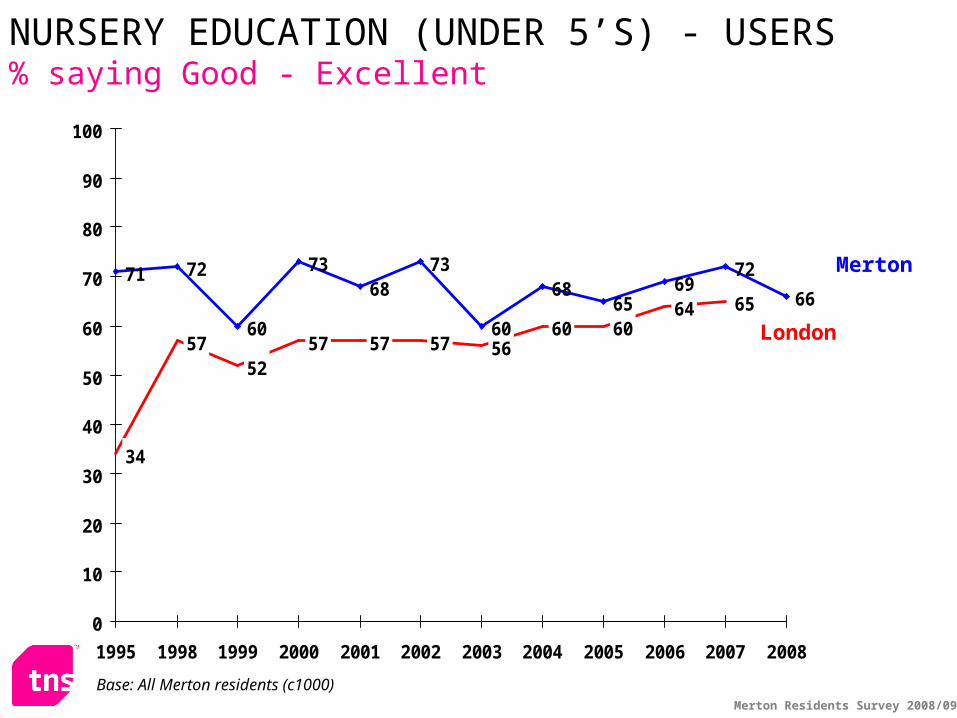
34
5752
57 57 5660 60
64 65
71 72
60
7368
73
60
6865
6972
66
57
0
10
20
30
40
50
60
70
80
90
100
1995 1998 1999 2000 2001 2002 2003 2004 2005 2006 2007 2008
London
Merton
NURSERY EDUCATION (UNDER 5’S) - USERS% saying Good - Excellent
Base: All Merton residents (c1000)
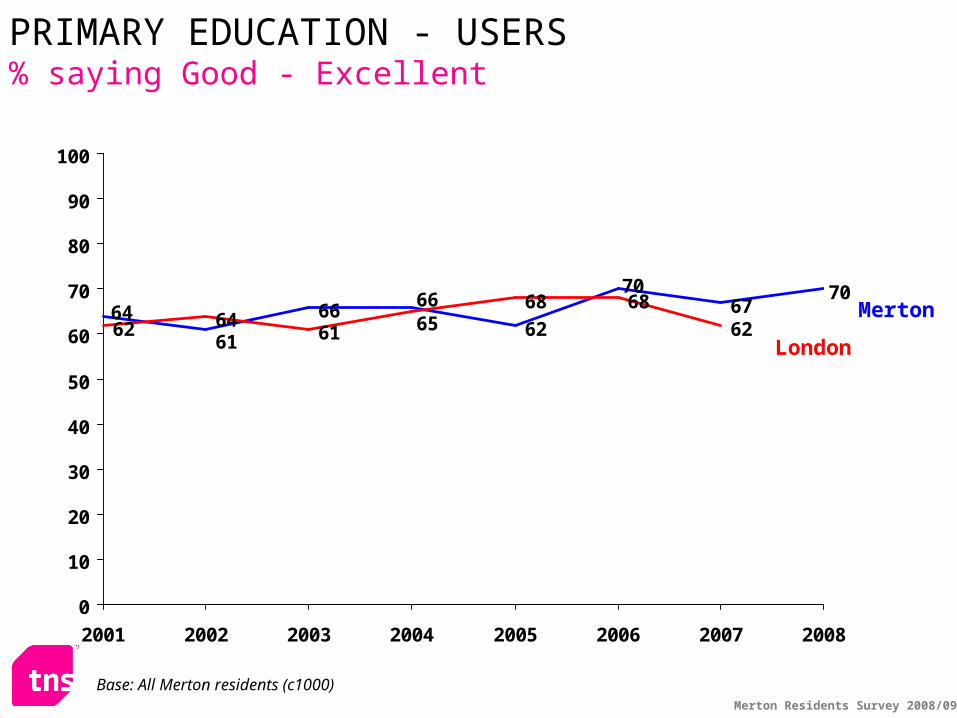
Merton Residents Survey 2008/09
6662
6770
62 6461
68 68
62
7066
61
6465
0
10
20
30
40
50
60
70
80
90
100
2001 2002 2003 2004 2005 2006 2007 2008
London
Merton
PRIMARY EDUCATION - USERS% saying Good - Excellent
Base: All Merton residents (c1000)
Merton Residents Survey 2008/09
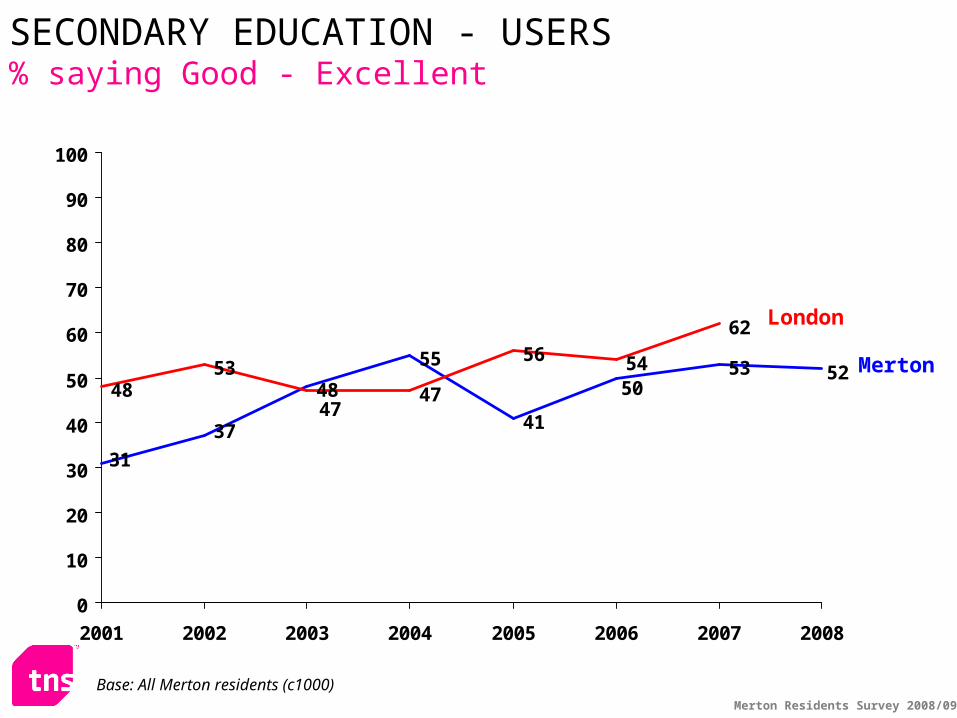
48
55
41
53 5248
5347
56 54
62
50
37
31
47
0
10
20
30
40
50
60
70
80
90
100
2001 2002 2003 2004 2005 2006 2007 2008
London
Merton
SECONDARY EDUCATION - USERS% saying Good - Excellent
Base: All Merton residents (c1000)
Merton Residents Survey 2008/09
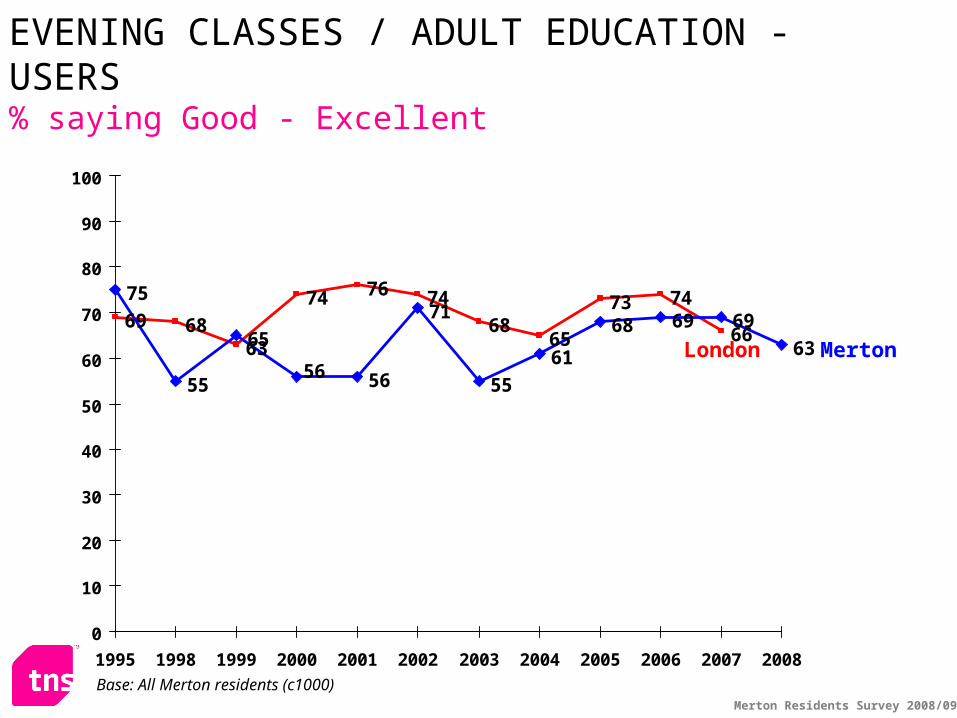
69 6863
74 76 74
6865
73 74
66
75
55
65
56
71
55
61
68 69 69
6356
0
10
20
30
40
50
60
70
80
90
100
1995 1998 1999 2000 2001 2002 2003 2004 2005 2006 2007 2008
London Merton
EVENING CLASSES / ADULT EDUCATION - USERS% saying Good - Excellent
Base: All Merton residents (c1000)
Merton Residents Survey 2008/09
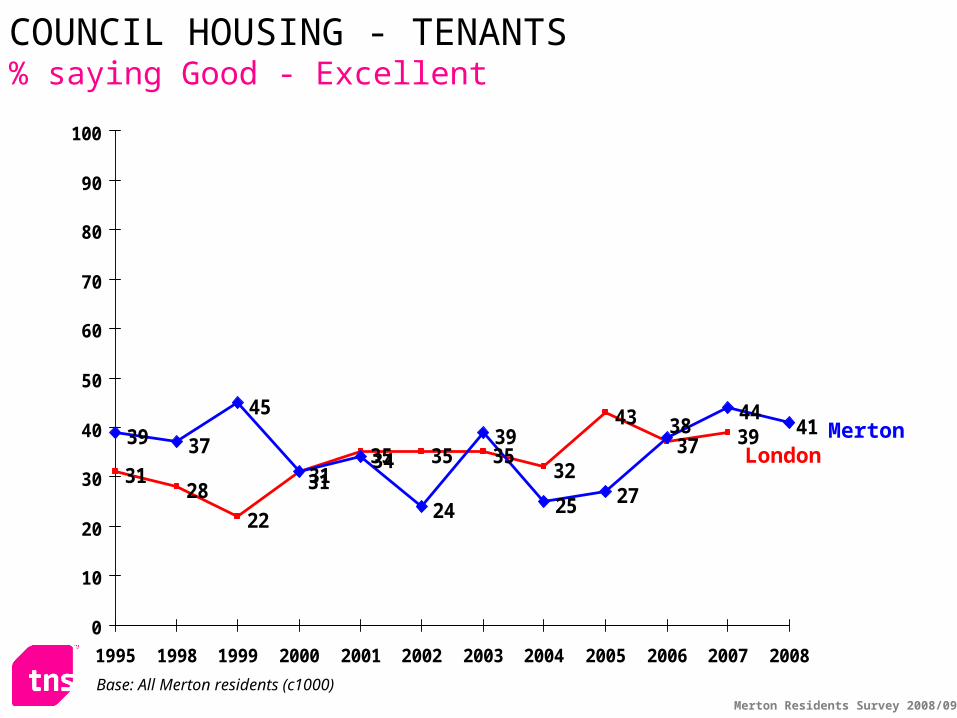
3128
22
3135 35 35
32
4337 3939 37
45
34
24
39
25 27
444138
31
0
10
20
30
40
50
60
70
80
90
100
1995 1998 1999 2000 2001 2002 2003 2004 2005 2006 2007 2008
LondonMerton
COUNCIL HOUSING - TENANTS% saying Good - Excellent
Base: All Merton residents (c1000)
Merton Residents Survey 2008/09
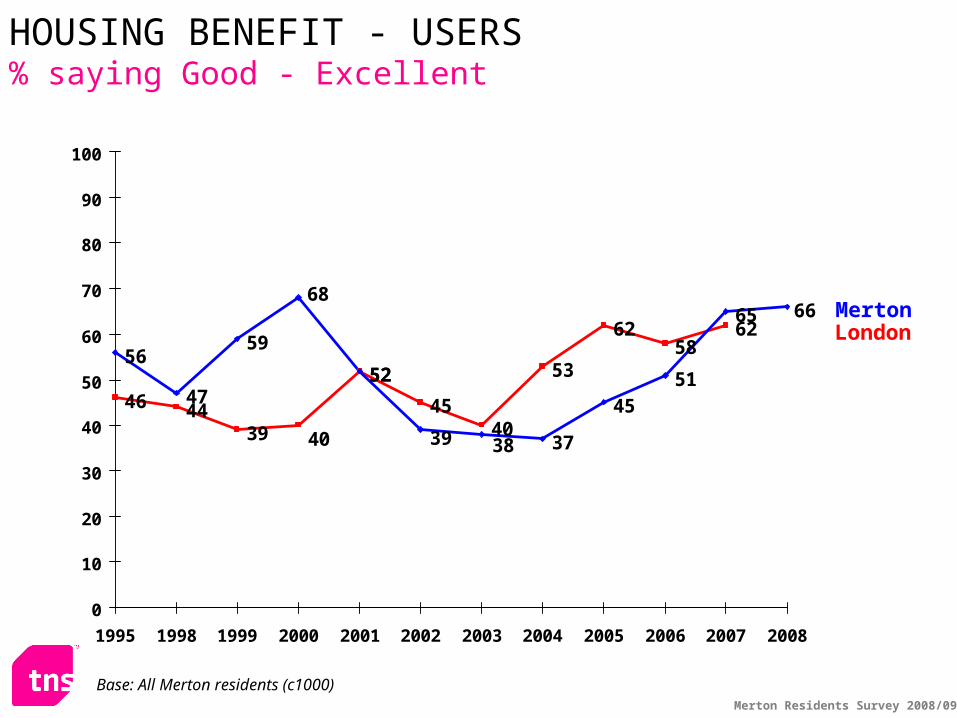
46 4439
52
4540
53
6258
62
56
47
59
52
37
4551
65 66
40 3839
68
0
10
20
30
40
50
60
70
80
90
100
1995 1998 1999 2000 2001 2002 2003 2004 2005 2006 2007 2008
LondonMerton
HOUSING BENEFIT - USERS% saying Good - Excellent
Base: All Merton residents (c1000)
Merton Residents Survey 2008/09
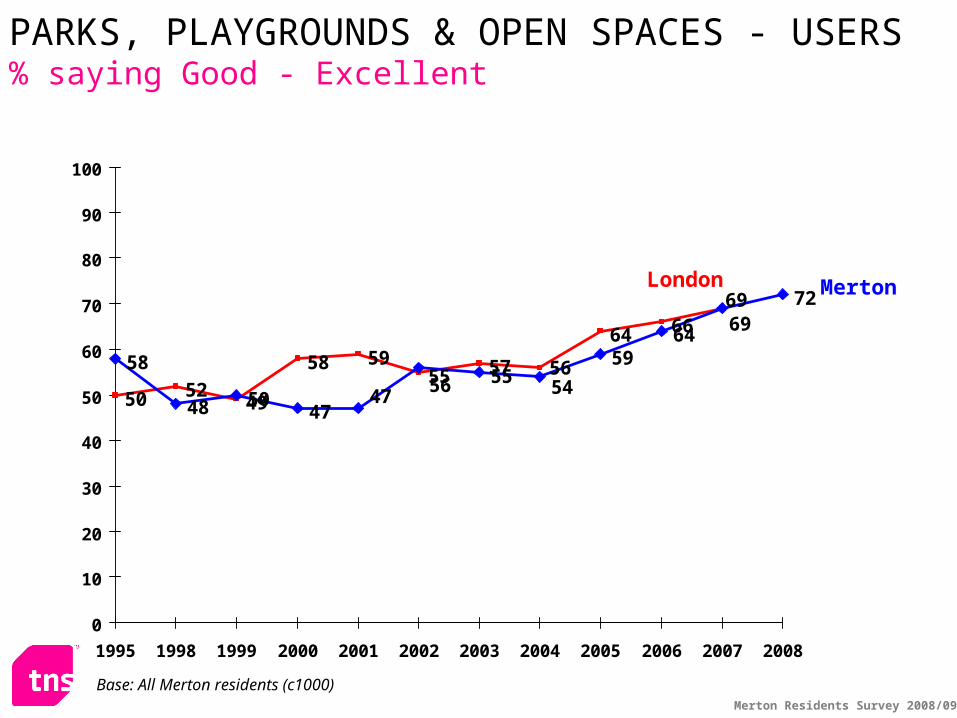
50 5249
58 5955 57
64 66
58
48 5047
5559
64
7269
56
69
544756
0
10
20
30
40
50
60
70
80
90
100
1995 1998 1999 2000 2001 2002 2003 2004 2005 2006 2007 2008
London Merton
PARKS, PLAYGROUNDS & OPEN SPACES - USERS% saying Good - Excellent
Base: All Merton residents (c1000)

Merton Residents Survey 2008/09
7066 66
73 72 72 72 7477
8079
60
68
62 63 61
6771
787675
7076
0
10
20
30
40
50
60
70
80
90
100
1995 1998 1999 2000 2001 2002 2003 2004 2005 2006 2007 2008
London
Merton
LIBRARIES - USERS% saying Good - Excellent
Base: All Merton residents (c1000)
Merton Residents Survey 2008/09
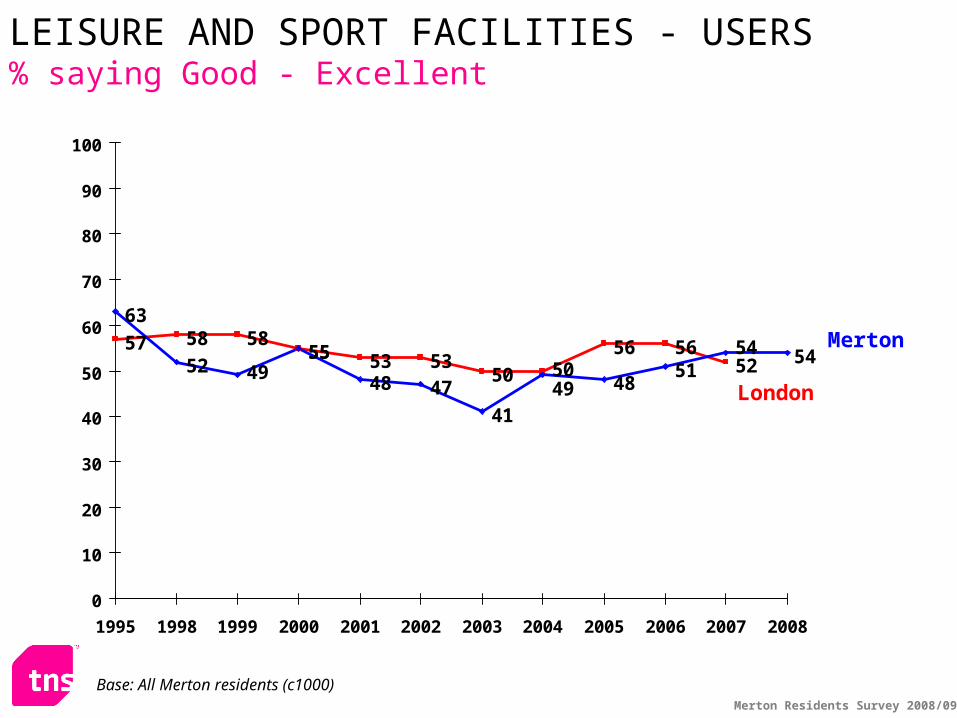
57 58 5855 53 53
50
56 5652
63
5255
48 47
41
4851
5450
54
4949
0
10
20
30
40
50
60
70
80
90
100
1995 1998 1999 2000 2001 2002 2003 2004 2005 2006 2007 2008
London
Merton
LEISURE AND SPORT FACILITIES - USERS% saying Good - Excellent
Base: All Merton residents (c1000)
Merton Residents Survey 2008/09
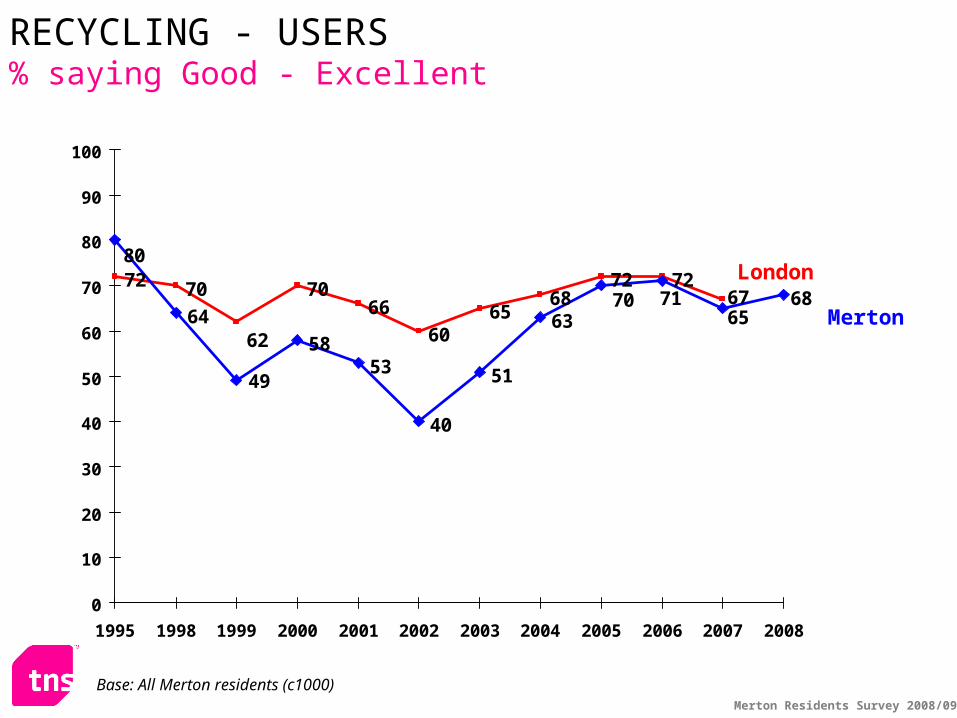
72 70 7066
6065
6872 72
64
5853
40
51
636867
62
70 7165
80
49
0
10
20
30
40
50
60
70
80
90
100
1995 1998 1999 2000 2001 2002 2003 2004 2005 2006 2007 2008
London
Merton
RECYCLING - USERS% saying Good - Excellent
Base: All Merton residents (c1000)

Merton Residents Survey 2008/09
Social Services – USERSSignificant fall for children & families from 2007
47 4741
62
36
48
For adults For children and families
%London 07
Merton 07
Merton 08
% good-excellent
Base: All Merton residents (c1000)
Merton Residents Survey 2008/09
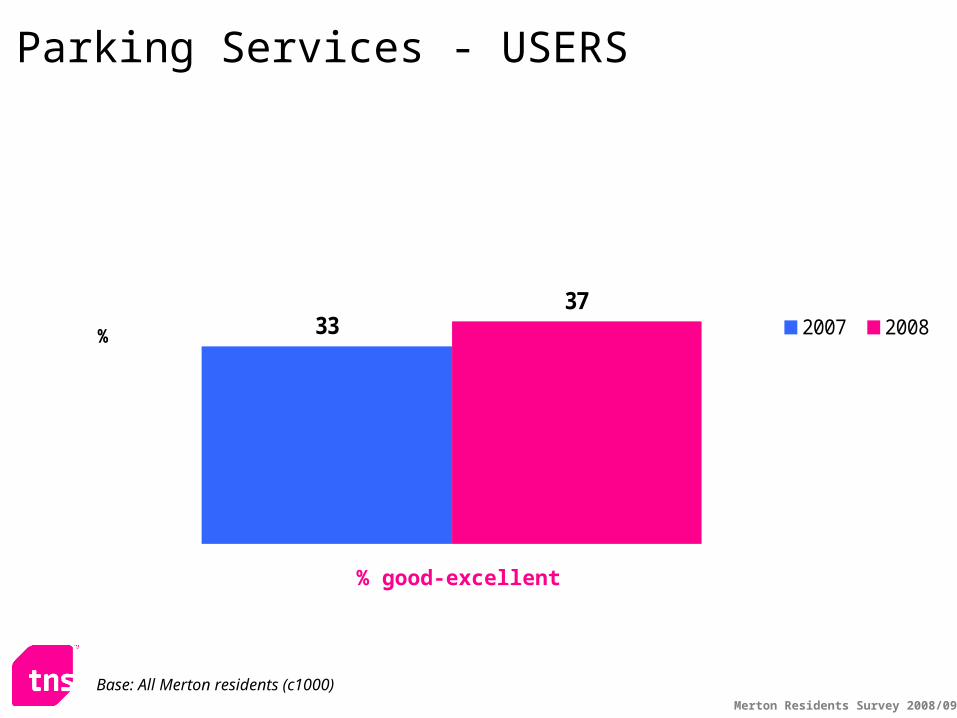
Parking Services - USERS
3337
% 2007 2008
% good-excellent
Base: All Merton residents (c1000)
Merton Residents Survey 2008/09
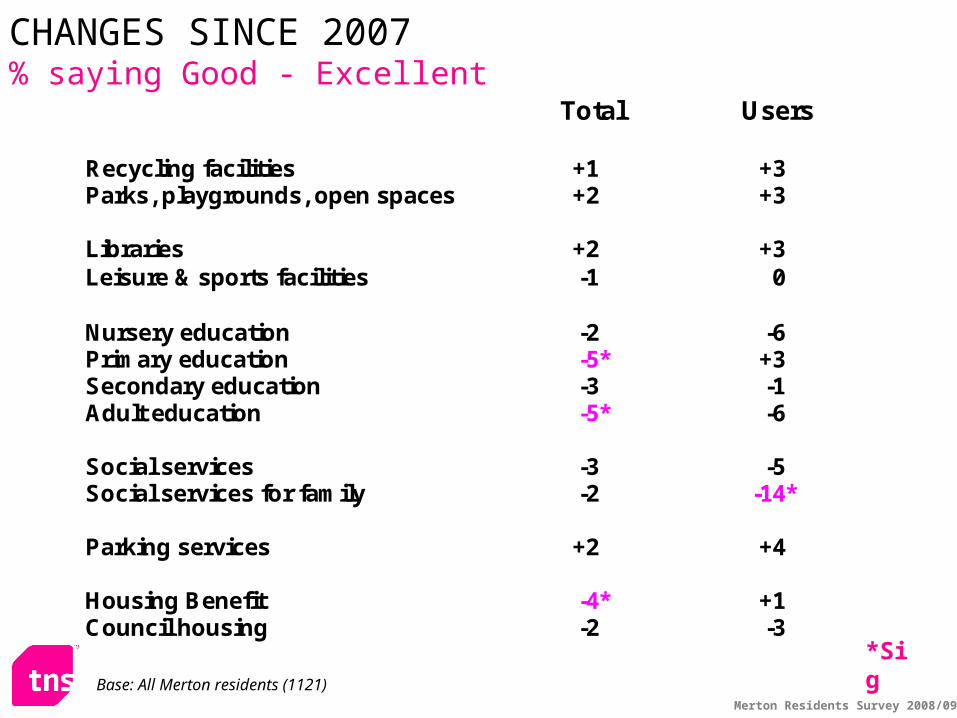
Total
Users
Recycling facilities +1 +3 Parks, playgrounds, open spaces +2 +3 Libraries +2 +3 Leisure & sports facilities -1 0 Nursery education -2 -6 Primary education -5* +3 Secondary education -3 -1 Adult education -5* -6 Social services -3 -5 Social services for family -2 -14* Parking services +2 +4 Housing Benefit -4* +1 Council housing -2 -3
*Sig
CHANGES SINCE 2007% saying Good - Excellent
Base: All Merton residents (1121)

Merton Extra QuestionsMerton Extra Questions

The local area
Merton Residents Survey 2008/09
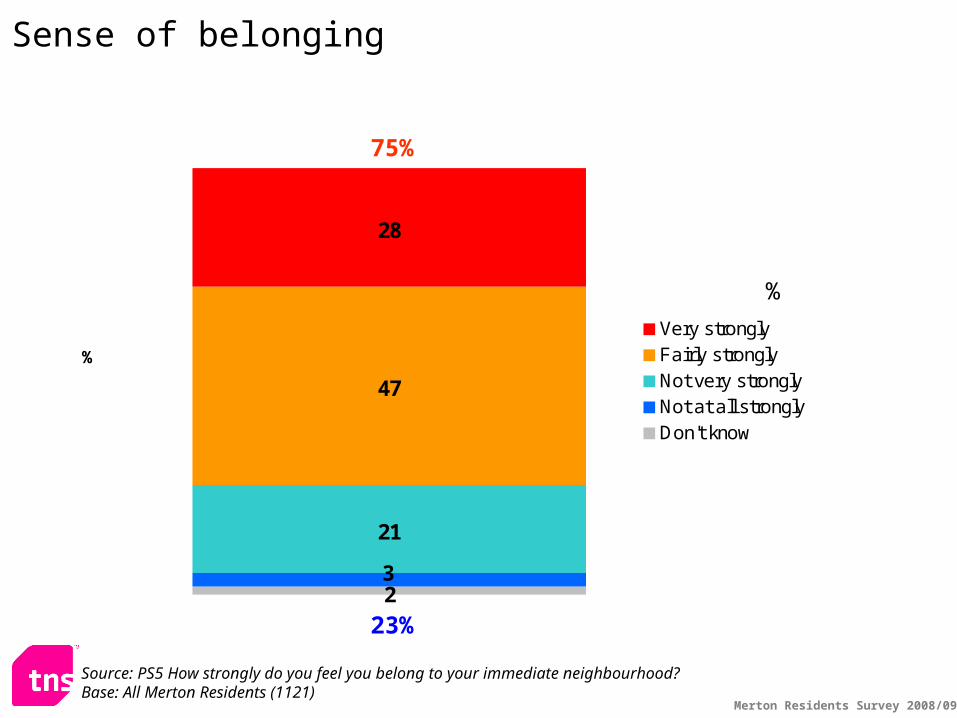
Sense of belonging
21
47
28
23
%
Very stronglyFairly stronglyNot very stronglyNot at all stronglyDon't know
Source: PS5 How strongly do you feel you belong to your immediate neighbourhood?Base: All Merton Residents (1121)
%
75%
23%
Merton Residents Survey 2008/09
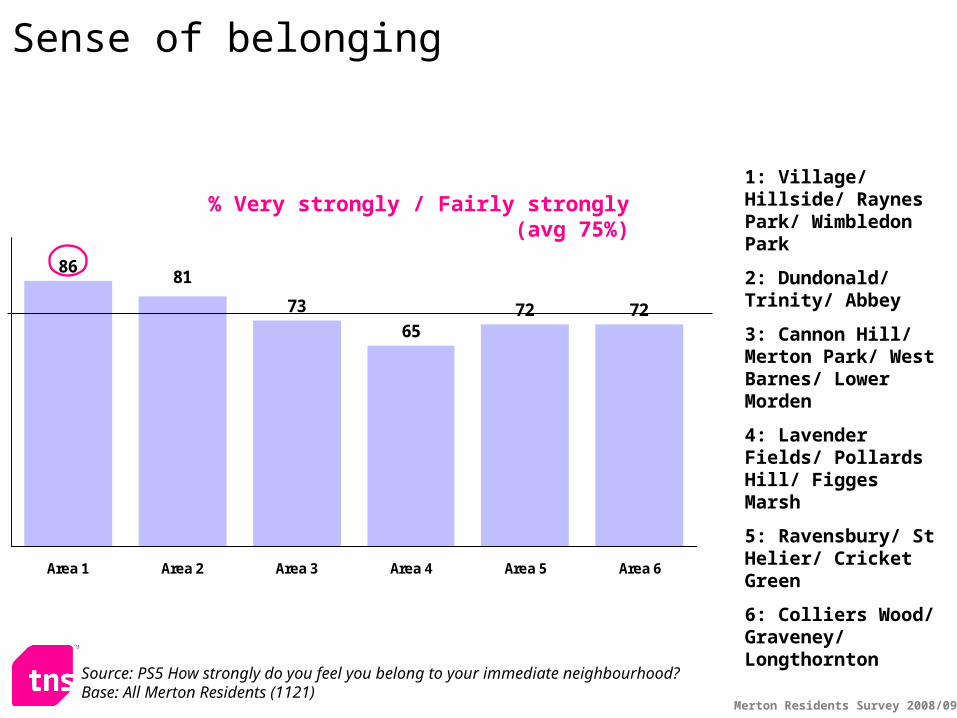
86
73
6572 72
81
Area 1 Area 2 Area 3 Area 4 Area 5 Area 6
% Very strongly / Fairly strongly (avg 75%)1: Village/ Hillside/ Raynes Park/ Wimbledon Park
2: Dundonald/ Trinity/ Abbey
3: Cannon Hill/ Merton Park/ West Barnes/ Lower Morden
4: Lavender Fields/ Pollards Hill/ Figges Marsh
5: Ravensbury/ St Helier/ Cricket Green
6: Colliers Wood/ Graveney/ Longthornton
Sense of belonging
Source: PS5 How strongly do you feel you belong to your immediate neighbourhood?Base: All Merton Residents (1121)
Merton Residents Survey 2008/09
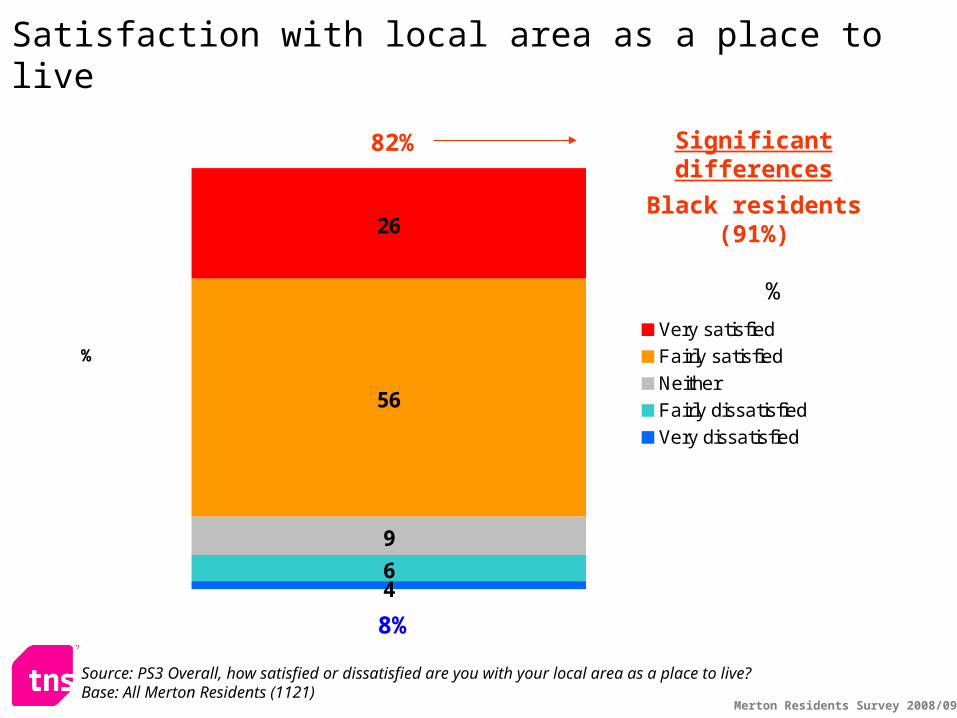
Satisfaction with local area as a place to live
6
9
56
26
4
%Very satisfied
Fairly satisfied
Neither
Fairly dissatisfied
Very dissatisfied
%
82%
8%
Source: PS3 Overall, how satisfied or dissatisfied are you with your local area as a place to live?Base: All Merton Residents (1121)
Significant differences
Black residents (91%)
Merton Residents Survey 2008/09
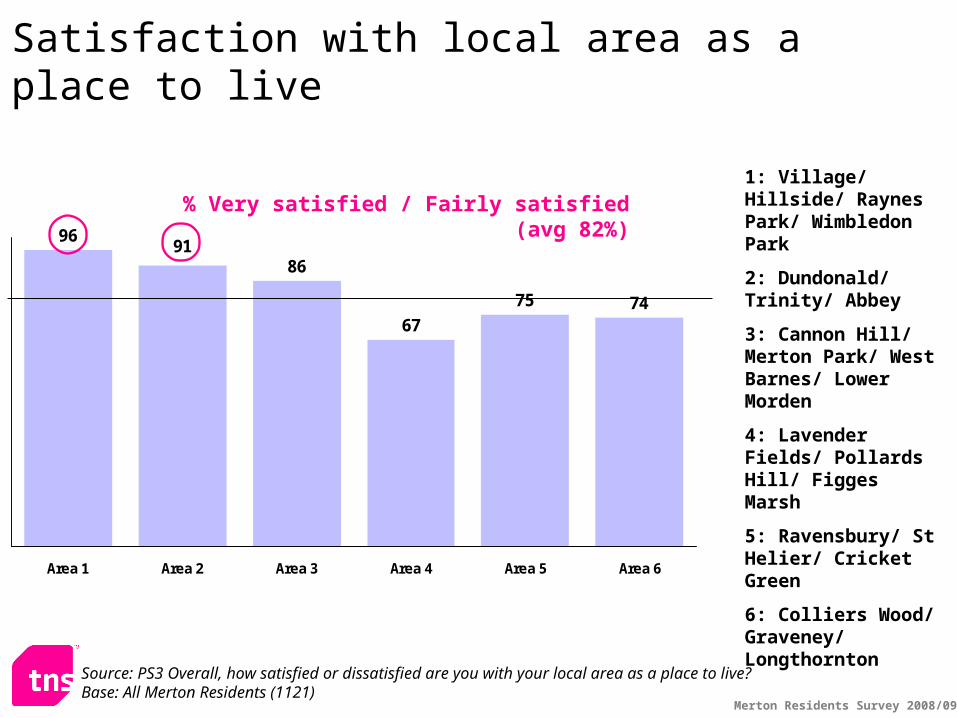
96
86
67
75 74
91
Area 1 Area 2 Area 3 Area 4 Area 5 Area 6
% Very satisfied / Fairly satisfied (avg 82%)1: Village/ Hillside/ Raynes Park/ Wimbledon Park
2: Dundonald/ Trinity/ Abbey
3: Cannon Hill/ Merton Park/ West Barnes/ Lower Morden
4: Lavender Fields/ Pollards Hill/ Figges Marsh
5: Ravensbury/ St Helier/ Cricket Green
6: Colliers Wood/ Graveney/ Longthornton
Satisfaction with local area as a place to live
Source: PS3 Overall, how satisfied or dissatisfied are you with your local area as a place to live?Base: All Merton Residents (1121)
Merton Residents Survey 2008/09
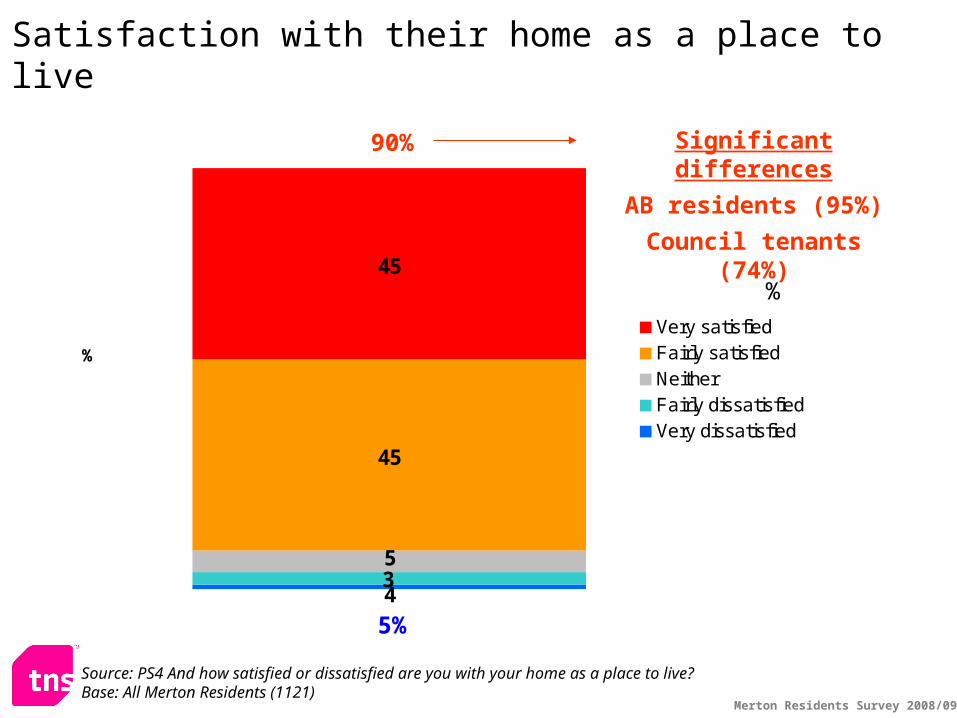
Satisfaction with their home as a place to live
45
45
435
%
Very satisfiedFairly satisfiedNeitherFairly dissatisfiedVery dissatisfied
%
90%
5%
Source: PS4 And how satisfied or dissatisfied are you with your home as a place to live?Base: All Merton Residents (1121)
Significant differences
AB residents (95%)
Council tenants (74%)
Merton Residents Survey 2008/09
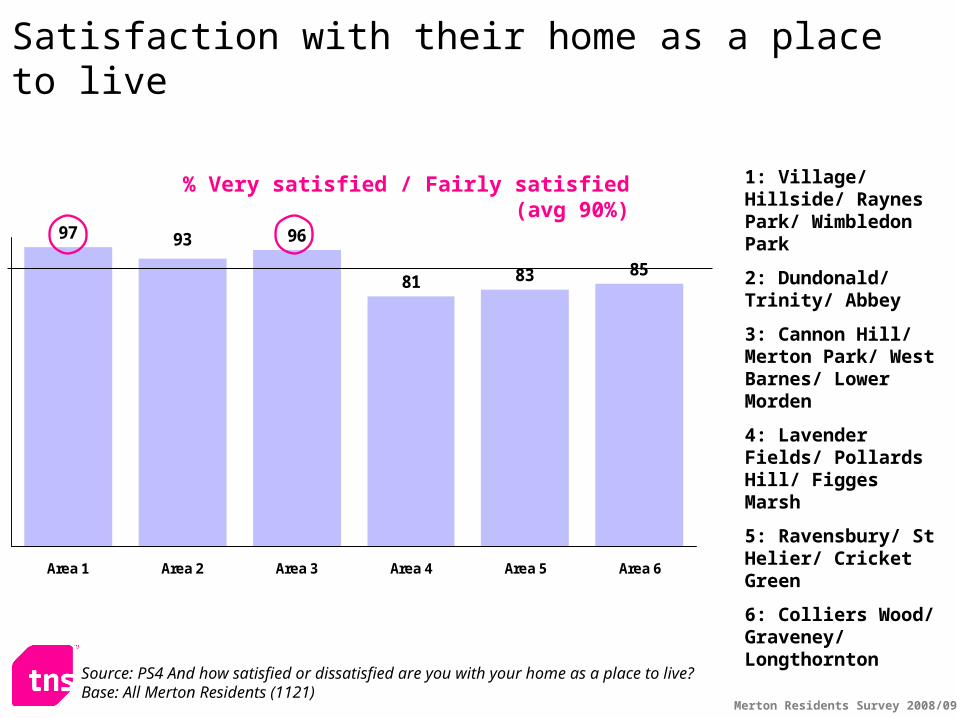
97 96
81 83 85
93
Area 1 Area 2 Area 3 Area 4 Area 5 Area 6
% Very satisfied / Fairly satisfied (avg 90%) 1: Village/ Hillside/ Raynes Park/ Wimbledon Park
2: Dundonald/ Trinity/ Abbey
3: Cannon Hill/ Merton Park/ West Barnes/ Lower Morden
4: Lavender Fields/ Pollards Hill/ Figges Marsh
5: Ravensbury/ St Helier/ Cricket Green
6: Colliers Wood/ Graveney/ Longthornton
Satisfaction with their home as a place to live
Source: PS4 And how satisfied or dissatisfied are you with your home as a place to live?Base: All Merton Residents (1121)
Merton Residents Survey 2008/09
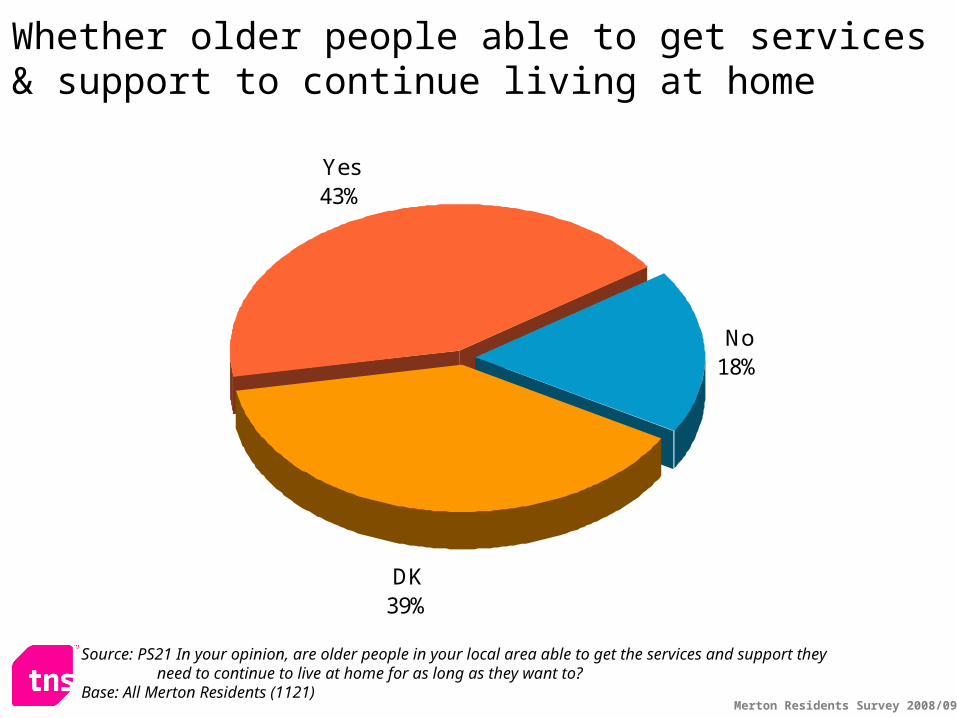
Yes43%
No18%
DK39%
Whether older people able to get services & support to continue living at home
Source: PS21 In your opinion, are older people in your local area able to get the services and support they need to continue to live at home for as long as they want to?
Base: All Merton Residents (1121)
Merton Residents Survey 2008/09
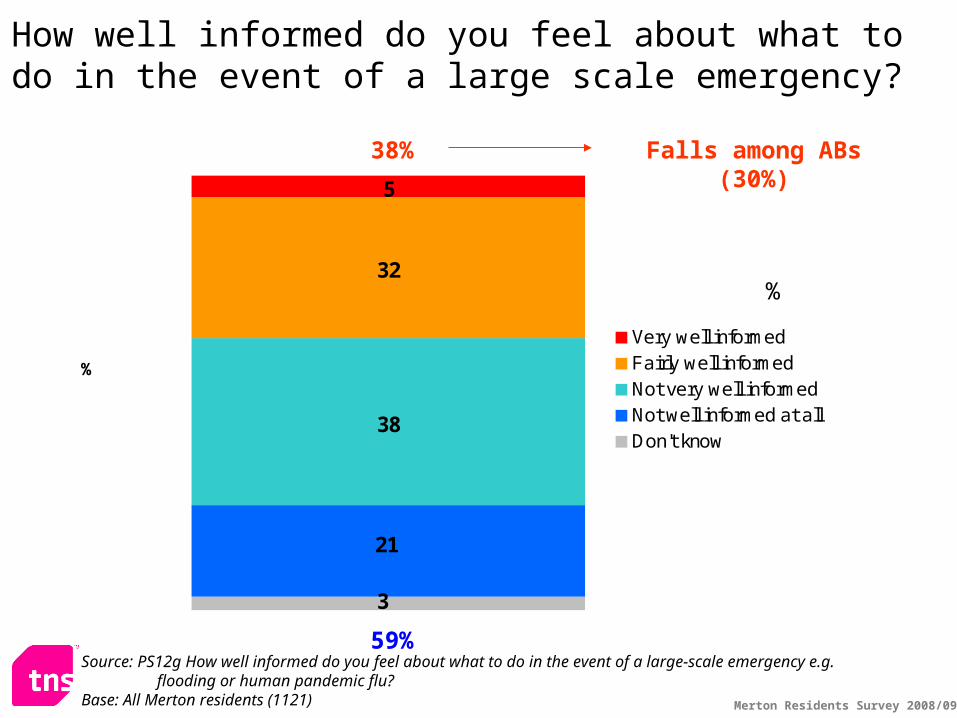
How well informed do you feel about what to do in the event of a large scale emergency?
38
32
5
3
21
%
Very well informedFairly well informedNot very well informedNot well informed at allDon't know
%
38%
59%
Falls among ABs (30%)
Source: PS12g How well informed do you feel about what to do in the event of a large-scale emergency e.g. flooding or human pandemic flu?
Base: All Merton residents (1121)

Crime and anti-social behaviour
Merton Residents Survey 2008/09
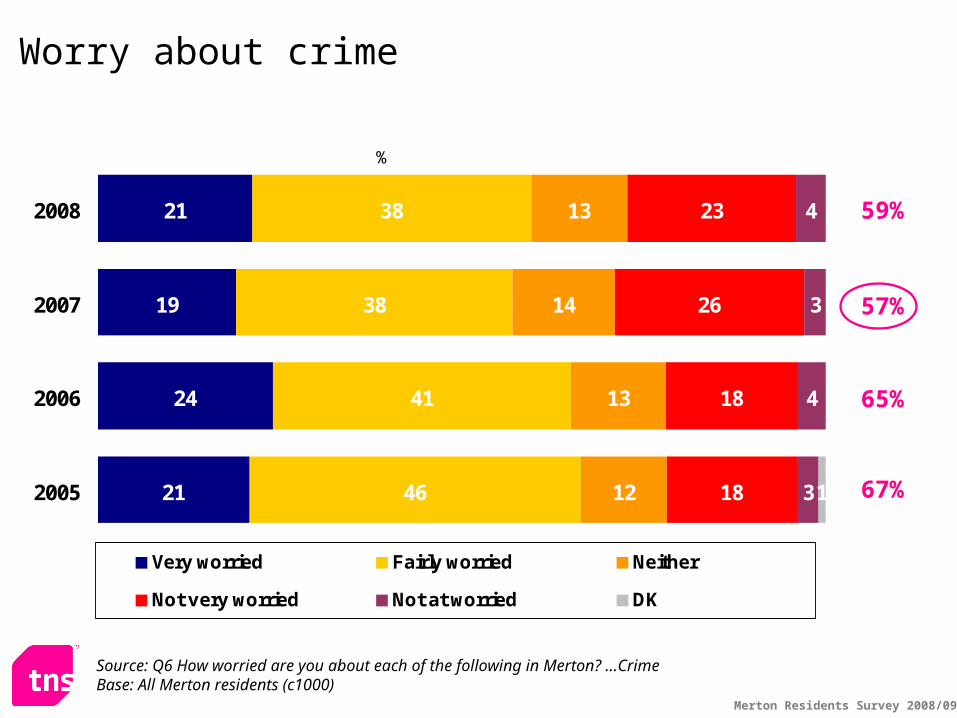
Worry about crime
21
19
24
21
38
38
41
46
13
14
13
12
23
26
18
18
3
4
31
42008
2007
2006
2005
%
Very worried Fairly worried Neither
Not very worried Not at worried DK
57%
65%
67%
Source: Q6 How worried are you about each of the following in Merton? …CrimeBase: All Merton residents (c1000)
59%
Merton Residents Survey 2008/09
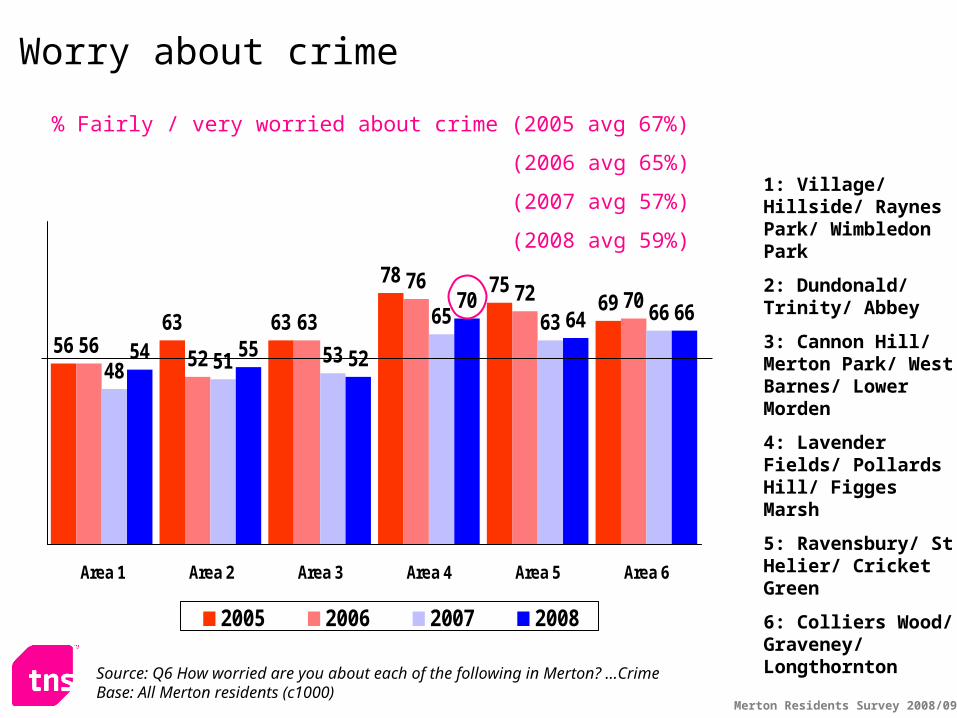
5663 63
78 7569
5652
63
76 72 70
48 51 53
65 63 66
54 55 52
7064 66
Area 1 Area 2 Area 3 Area 4 Area 5 Area 6
2005 2006 2007 2008
1: Village/ Hillside/ Raynes Park/ Wimbledon Park
2: Dundonald/ Trinity/ Abbey
3: Cannon Hill/ Merton Park/ West Barnes/ Lower Morden
4: Lavender Fields/ Pollards Hill/ Figges Marsh
5: Ravensbury/ St Helier/ Cricket Green
6: Colliers Wood/ Graveney/ Longthornton
% Fairly / very worried about crime (2005 avg 67%)
(2006 avg 65%)
(2007 avg 57%)
(2008 avg 59%)
Worry about crime
Source: Q6 How worried are you about each of the following in Merton? …CrimeBase: All Merton residents (c1000)

Merton Residents Survey 2008/09
21
20
26
21
38
42
40
45
14
12
11
11
23
25
19
18
2
4
3
1
1
1
1
32008
2007
2006
2005
%
Very worried Fairly worried Neither
Not very worried Not at worried DK
61%
65%
66%
Worry about anti-social behaviour
Source: Q6 How worried are you about each of the following in Merton? …Anti-social behaviourBase: All Merton residents (c1000)
59%

Merton Residents Survey 2008/09
5967
62
73 7365
54 54
6975 73
67
51
63
53
67 6571
5357 56
6762 62
Area 1 Area 2 Area 3 Area 4 Area 5 Area 6
2005 2006 2007 2008
% Fairly / very worried about anti-social behaviour (2005 avg 66%)
(2006 avg 65%)
(2007 avg 61%)
(2008 avg 59%)
1: Village/ Hillside/ Raynes Park/ Wimbledon Park
2: Dundonald/ Trinity/ Abbey
3: Cannon Hill/ Merton Park/ West Barnes/ Lower Morden
4: Lavender Fields/ Pollards Hill/ Figges Marsh
5: Ravensbury/ St Helier/ Cricket Green
6: Colliers Wood/ Graveney/ Longthornton
Worry about anti-social behaviour
Source: Q6 How worried are you about each of the following in Merton? …Anti-social behaviourBase: All Merton residents (c1000)

Merton Residents Survey 2008/09
15
14
18
16
23
22
27
27
18
18
18
15
30
32
24
28
6
10
8
6
8
3
5
82008
2007
2006
2005
%
Very worried Fairly worried Neither
Not very worried Not at worried DK
36%
45%
43%
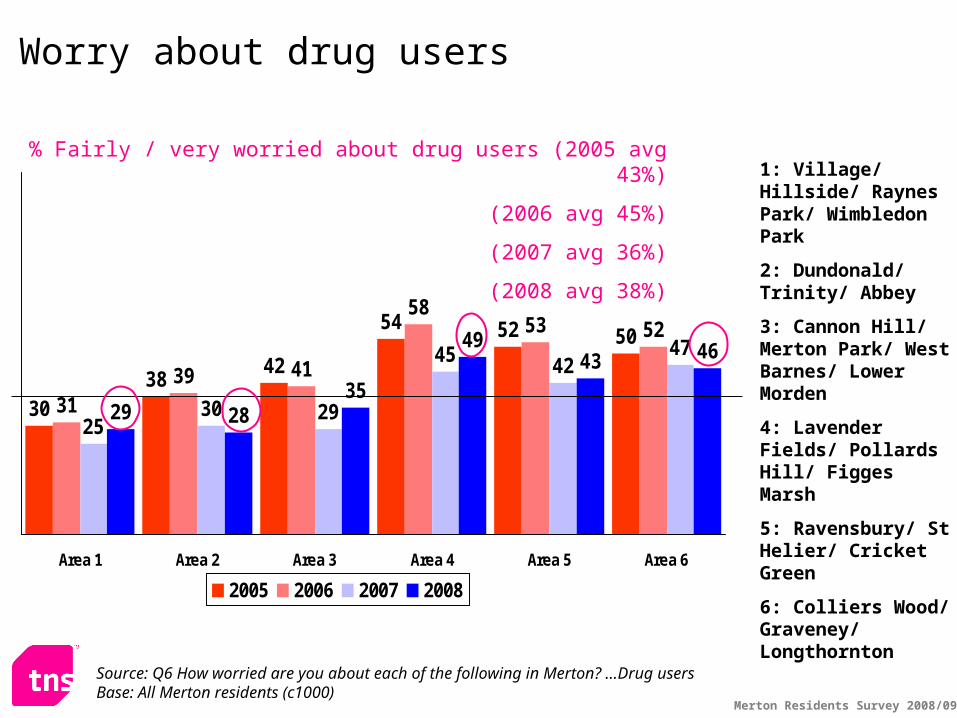
Worry about drug users
Source: Q6 How worried are you about each of the following in Merton? …Drug usersBase: All Merton residents (c1000)
38%
Merton Residents Survey 2008/09
3038
42
54 52 50
3139 41
5853 52
2530 29
45 4247
29 2835
4943 46
Area 1 Area 2 Area 3 Area 4 Area 5 Area 6
2005 2006 2007 2008
% Fairly / very worried about drug users (2005 avg 43%)
(2006 avg 45%)
(2007 avg 36%)
(2008 avg 38%)
1: Village/ Hillside/ Raynes Park/ Wimbledon Park
2: Dundonald/ Trinity/ Abbey
3: Cannon Hill/ Merton Park/ West Barnes/ Lower Morden
4: Lavender Fields/ Pollards Hill/ Figges Marsh
5: Ravensbury/ St Helier/ Cricket Green
6: Colliers Wood/ Graveney/ Longthornton
Source: Q6 How worried are you about each of the following in Merton? …Drug usersBase: All Merton residents (c1000)
Worry about drug users
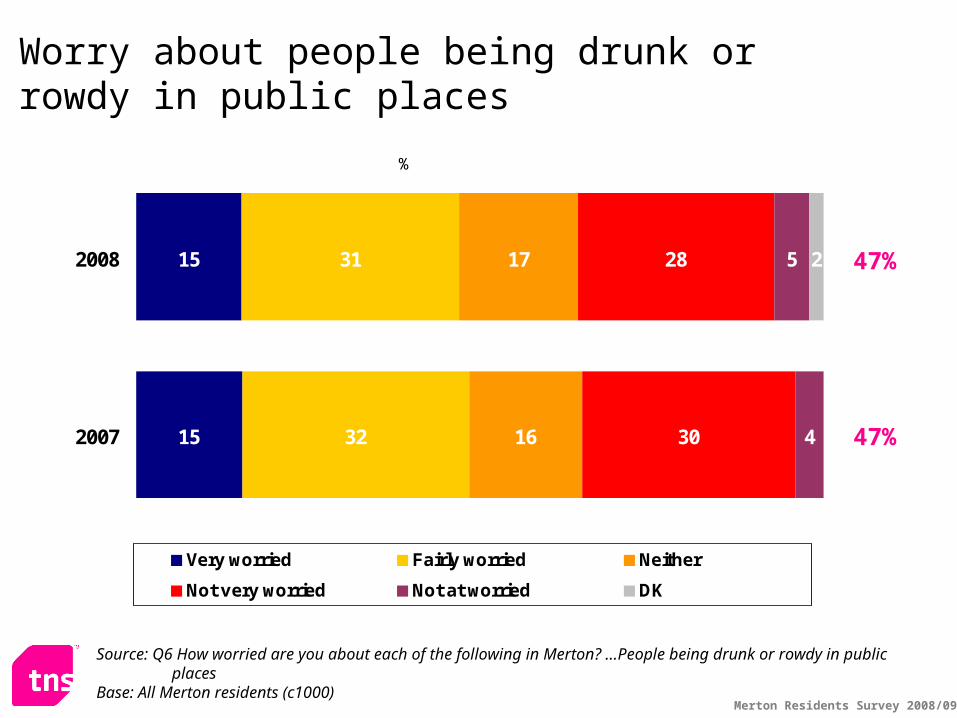
Merton Residents Survey 2008/09
15
15
31
32
17
16
28
30 4
252008
2007
%
Very worried Fairly worried Neither
Not very worried Not at worried DK
47%
Worry about people being drunk or rowdy in public places
Source: Q6 How worried are you about each of the following in Merton? …People being drunk or rowdy in public places
Base: All Merton residents (c1000)
47%
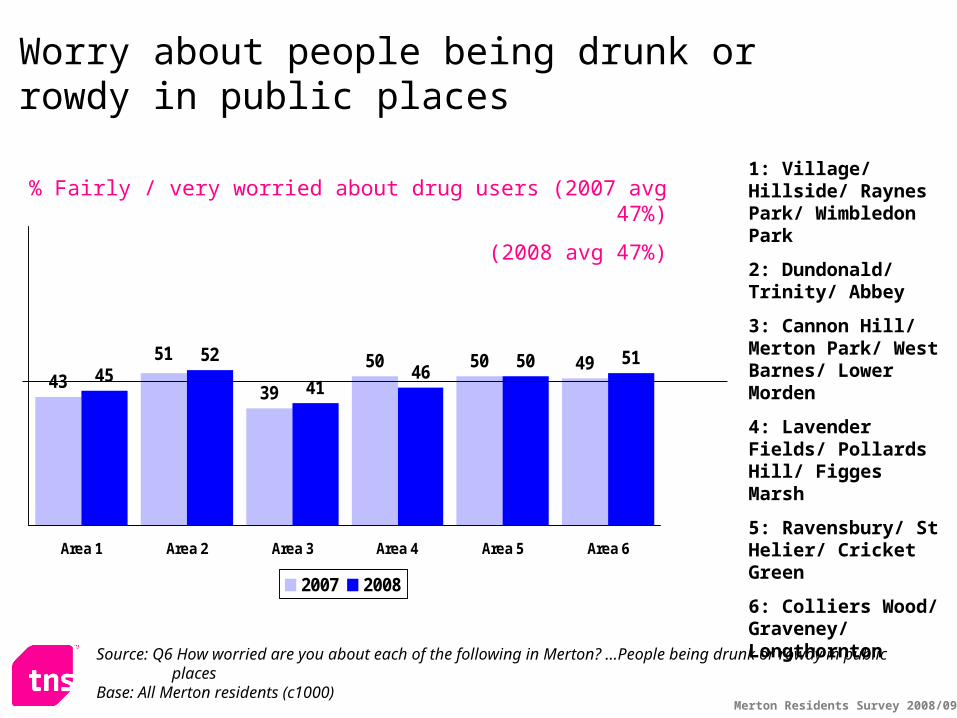
Merton Residents Survey 2008/09
4339
50 50 4945
52
4146
50 5151
Area 1 Area 2 Area 3 Area 4 Area 5 Area 6
2007 2008
1: Village/ Hillside/ Raynes Park/ Wimbledon Park
2: Dundonald/ Trinity/ Abbey
3: Cannon Hill/ Merton Park/ West Barnes/ Lower Morden
4: Lavender Fields/ Pollards Hill/ Figges Marsh
5: Ravensbury/ St Helier/ Cricket Green
6: Colliers Wood/ Graveney/ Longthornton
Source: Q6 How worried are you about each of the following in Merton? …People being drunk or rowdy in public places
Base: All Merton residents (c1000)
Worry about people being drunk or rowdy in public places
% Fairly / very worried about drug users (2007 avg 47%)
(2008 avg 47%)

Merton Residents Survey 2008/09
Whether the police and local public services are dealing with anti-social behaviour and crime in their local area
9
23
54
7
52
%
Strongly agreeTend to agreeNeitherTend to disagreeStrongly disagreeDon't know
Source: PS26 It is the responsibility of the police and local public services to work in partnership to deal with anti-social behaviour and crime in your local area. So how much would you agree or disagree that the police and local public services are successfully dealing with these issues?
Base: All Merton residents (1121)
%
61%
11%
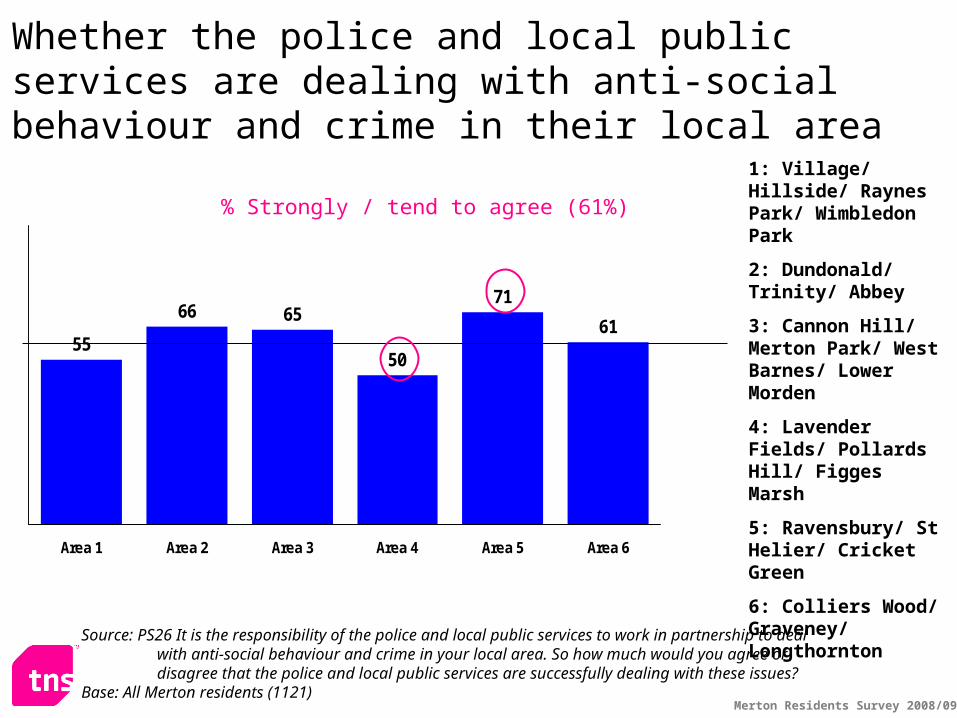
Merton Residents Survey 2008/09
55
66 65
50
71
61
Area 1 Area 2 Area 3 Area 4 Area 5 Area 6
1: Village/ Hillside/ Raynes Park/ Wimbledon Park
2: Dundonald/ Trinity/ Abbey
3: Cannon Hill/ Merton Park/ West Barnes/ Lower Morden
4: Lavender Fields/ Pollards Hill/ Figges Marsh
5: Ravensbury/ St Helier/ Cricket Green
6: Colliers Wood/ Graveney/ Longthornton
% Strongly / tend to agree (61%)
Source: PS26 It is the responsibility of the police and local public services to work in partnership to deal with anti-social behaviour and crime in your local area. So how much would you agree or disagree that the police and local public services are successfully dealing with these issues?
Base: All Merton residents (1121)
Whether the police and local public services are dealing with anti-social behaviour and crime in their local area
Merton Residents Survey 2008/09
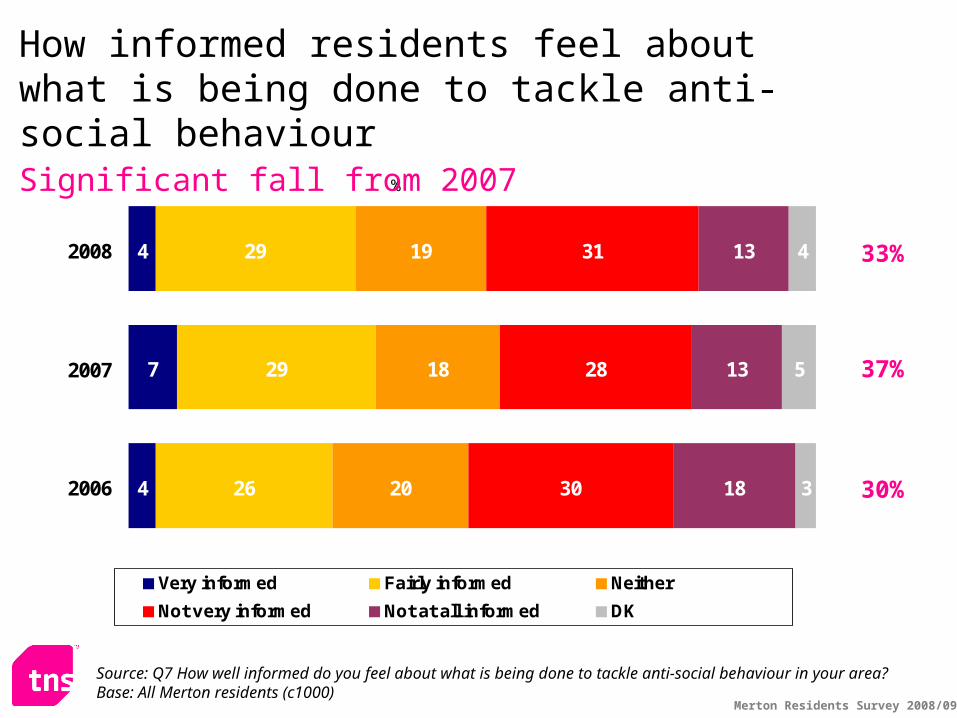
4
7
4
29
29
26
19
18
20
31
28
30
13
18
4
5
3
132008
2007
2006
%
Very informed Fairly informed Neither
Not very informed Not at all informed DK
37%
30%
How informed residents feel about what is being done to tackle anti-social behaviourSignificant fall from 2007
Source: Q7 How well informed do you feel about what is being done to tackle anti-social behaviour in your area?Base: All Merton residents (c1000)
33%
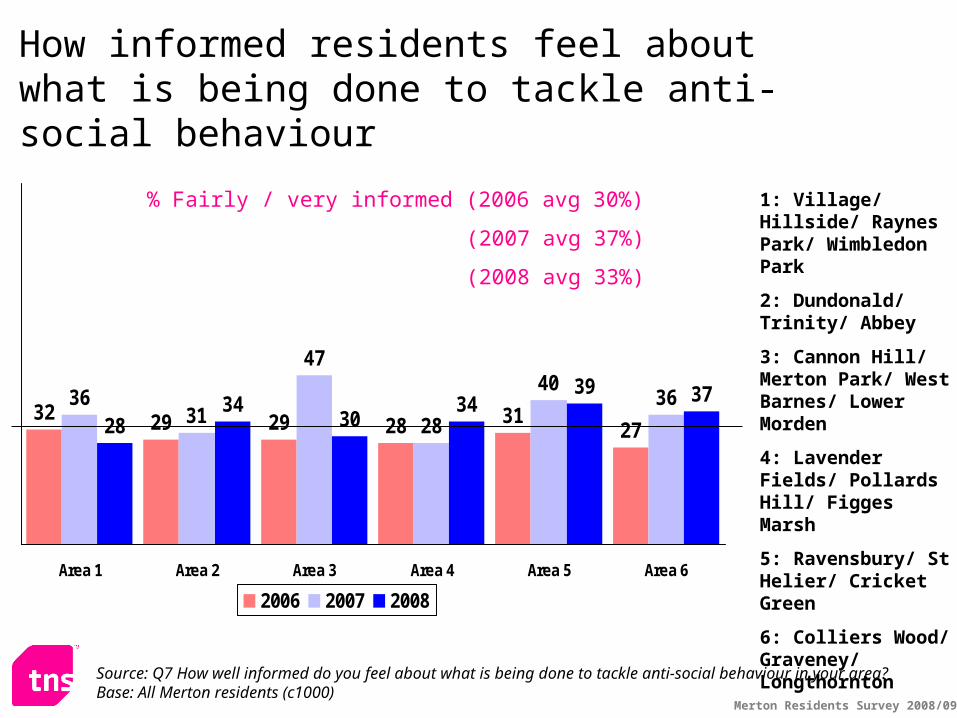
Merton Residents Survey 2008/09
32 29 29 28 3127
3631
47
28
4036
2834
3034
39 37
Area 1 Area 2 Area 3 Area 4 Area 5 Area 6
2006 2007 2008
% Fairly / very informed (2006 avg 30%)
(2007 avg 37%)
(2008 avg 33%)
1: Village/ Hillside/ Raynes Park/ Wimbledon Park
2: Dundonald/ Trinity/ Abbey
3: Cannon Hill/ Merton Park/ West Barnes/ Lower Morden
4: Lavender Fields/ Pollards Hill/ Figges Marsh
5: Ravensbury/ St Helier/ Cricket Green
6: Colliers Wood/ Graveney/ Longthornton
Source: Q7 How well informed do you feel about what is being done to tackle anti-social behaviour in your area?Base: All Merton residents (c1000)
How informed residents feel about what is being done to tackle anti-social behaviour

Tackling racism, social cohesion and respect
Merton Residents Survey 2007/08
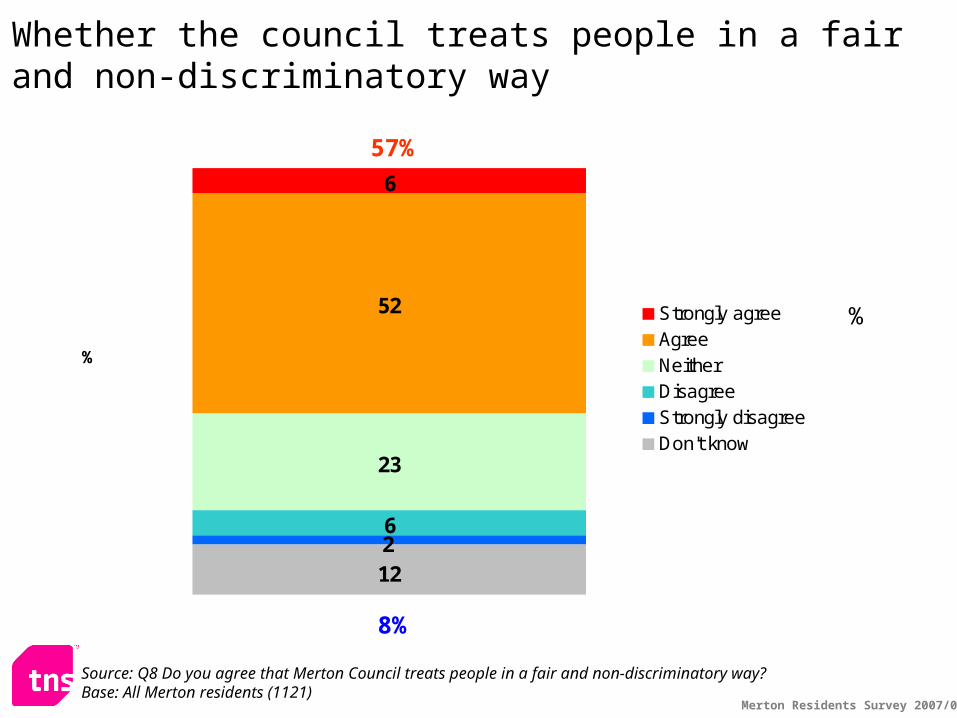
Whether the council treats people in a fair and non-discriminatory way
6
23
52
6
122
%
Strongly agreeAgreeNeitherDisagreeStrongly disagreeDon't know
Source: Q8 Do you agree that Merton Council treats people in a fair and non-discriminatory way?Base: All Merton residents (1121)
%
57%
8%
Merton Residents Survey 2007/08
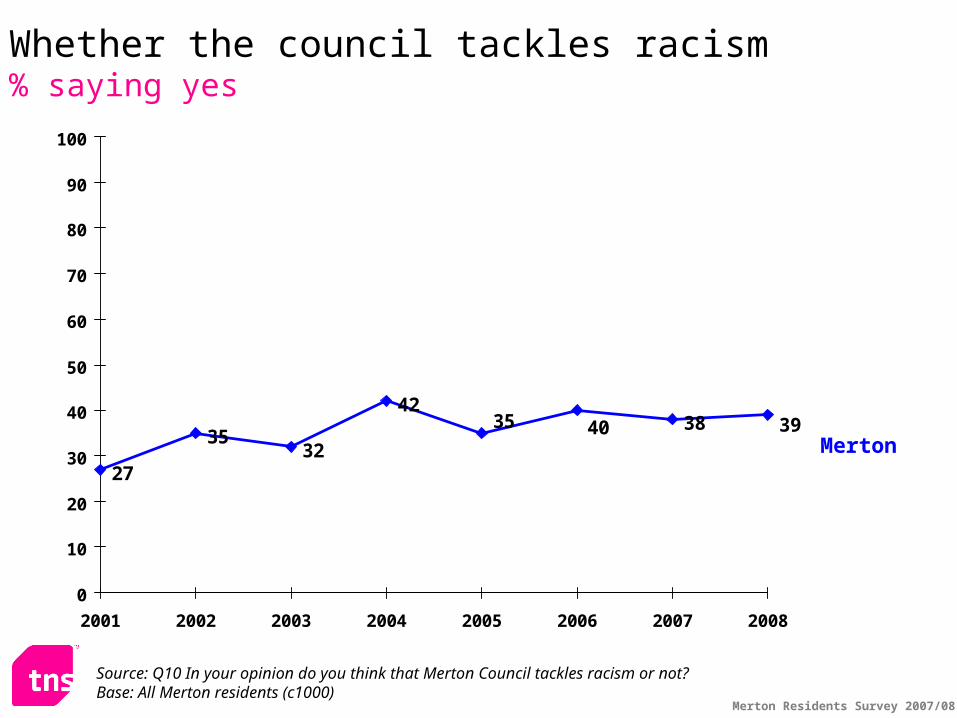
27
3532
4238 3935 40
0
10
20
30
40
50
60
70
80
90
100
2001 2002 2003 2004 2005 2006 2007 2008
Merton
Whether the council tackles racism% saying yes
Source: Q10 In your opinion do you think that Merton Council tackles racism or not?Base: All Merton residents (c1000)
Merton Residents Survey 2007/08
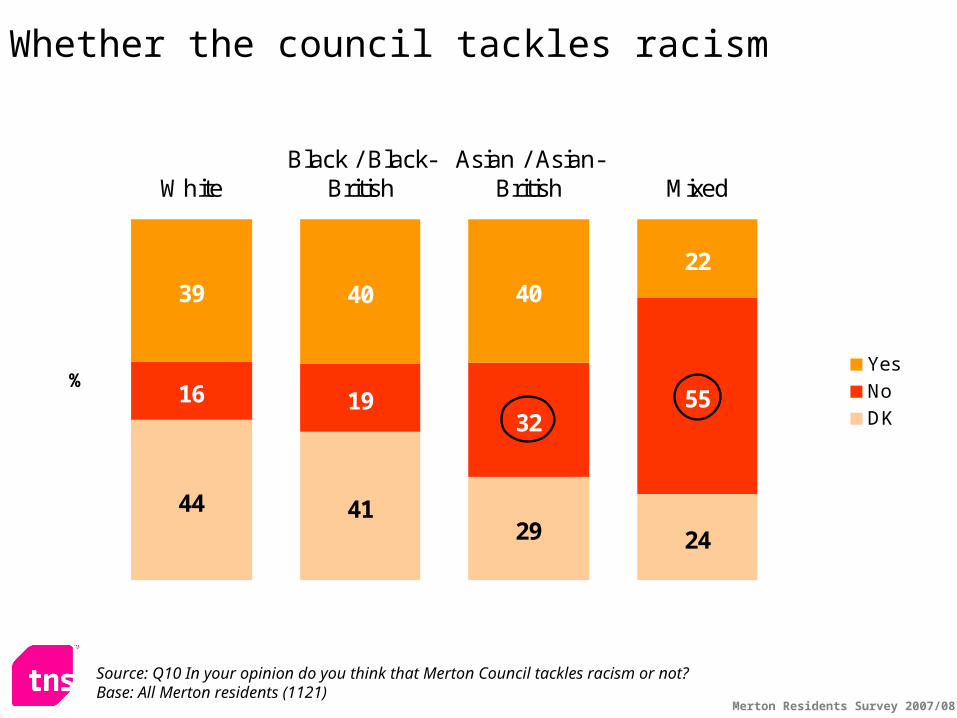
44 4129 24
16 1932
55
39 40 4022
WhiteBlack / Black-
BritishAsian / Asian-
British Mixed
%Yes
No
DK
Source: Q10 In your opinion do you think that Merton Council tackles racism or not?Base: All Merton residents (1121)
Whether the council tackles racism
Merton Residents Survey 2007/08
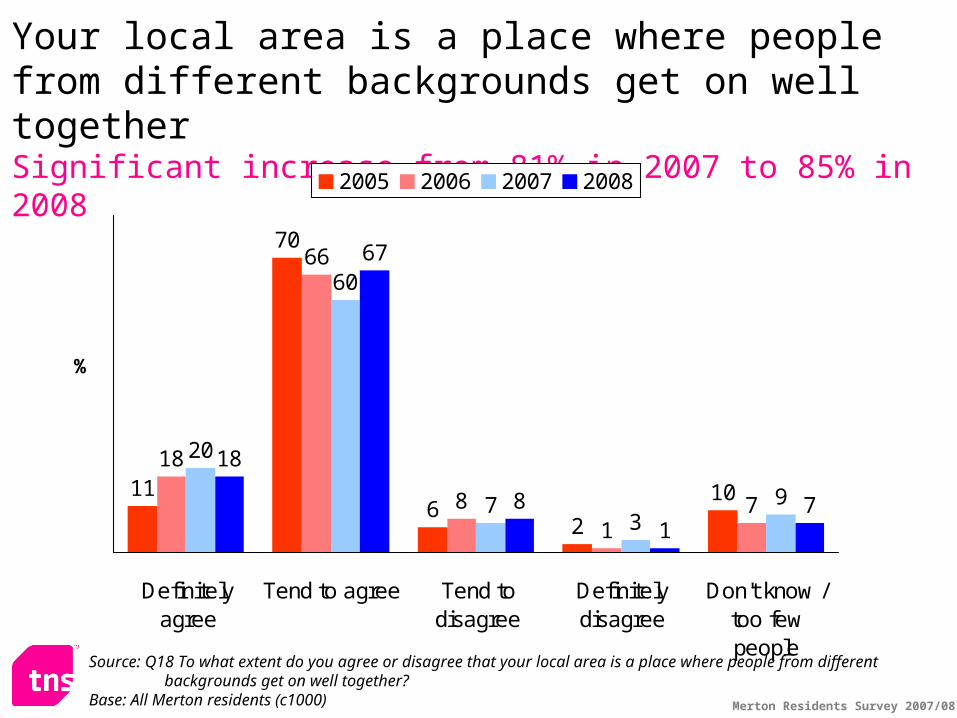
Your local area is a place where people from different backgrounds get on well togetherSignificant increase from 81% in 2007 to 85% in 2008
11
70
62
10
18
66
81
7
20
60
73
9
18
67
81
7
Definitelyagree
Tend to agree Tend todisagree
Definitelydisagree
Don't know /too fewpeople
%
2005 2006 2007 2008
Source: Q18 To what extent do you agree or disagree that your local area is a place where people from different backgrounds get on well together?
Base: All Merton residents (c1000)

Merton Residents Survey 2007/08
Your local area is a place where people from different backgrounds get on well together By ethnicity
2 17
66 72 6575
18 13 199
7 61 27 12 7
WhiteBlack / Black-
BritishAsian / Asian-
British Mixed
%Definitely agree
Tend to agree
Tend to disagree
Definitely disagree
DK / too few people
Source: Q18 To what extent do you agree or disagree that your local area is a place where people from different backgrounds get on well together?
Base: All Merton residents (1121)
85% 86% 85% 83%
Merton Residents Survey 2008/09
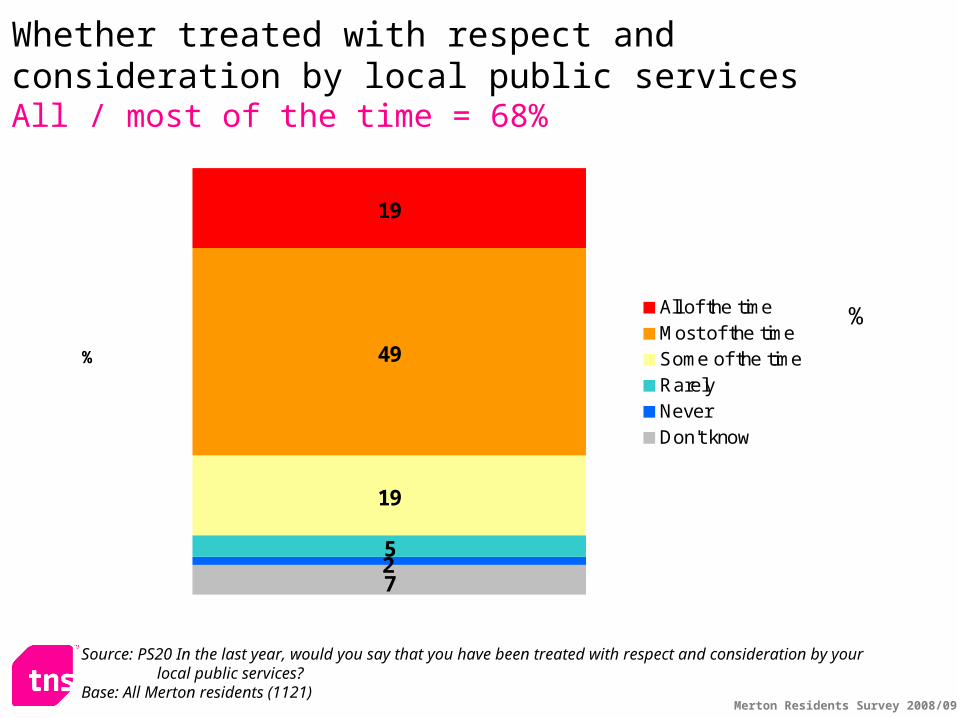
Whether treated with respect and consideration by local public servicesAll / most of the time = 68%
5
19
49
19
72
%
All of the timeMost of the timeSome of the timeRarelyNeverDon't know
Source: PS20 In the last year, would you say that you have been treated with respect and consideration by your local public services?
Base: All Merton residents (1121)
%
Merton Residents Survey 2008/09
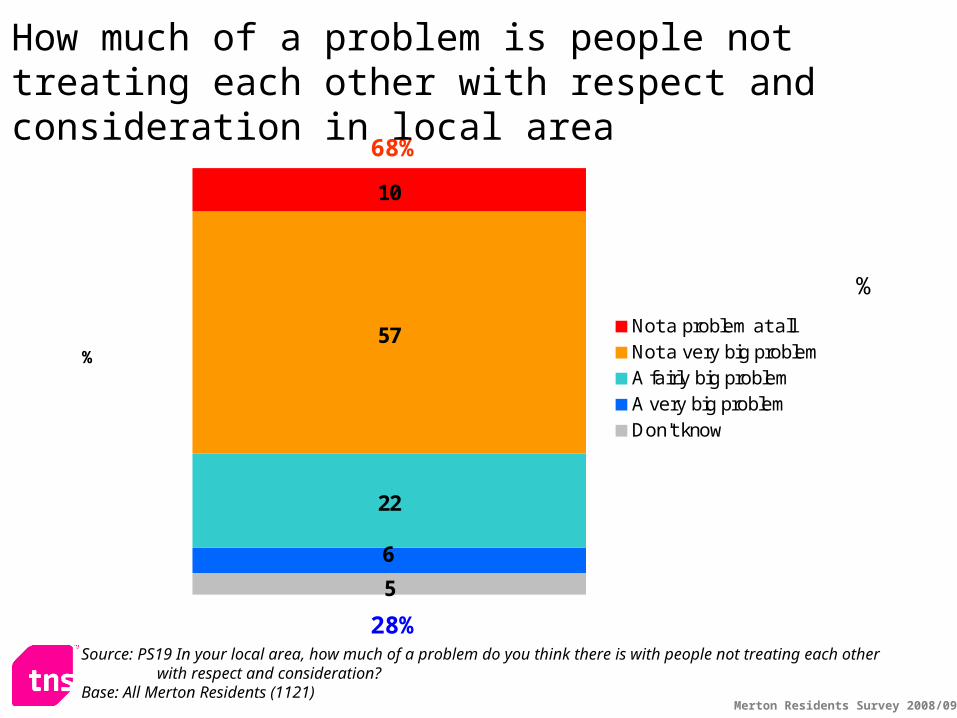
22
57
10
5
6
%
Not a problem at allNot a very big problemA fairly big problemA very big problemDon't know
Source: PS19 In your local area, how much of a problem do you think there is with people not treating each other with respect and consideration?
Base: All Merton Residents (1121)
%
68%
28%
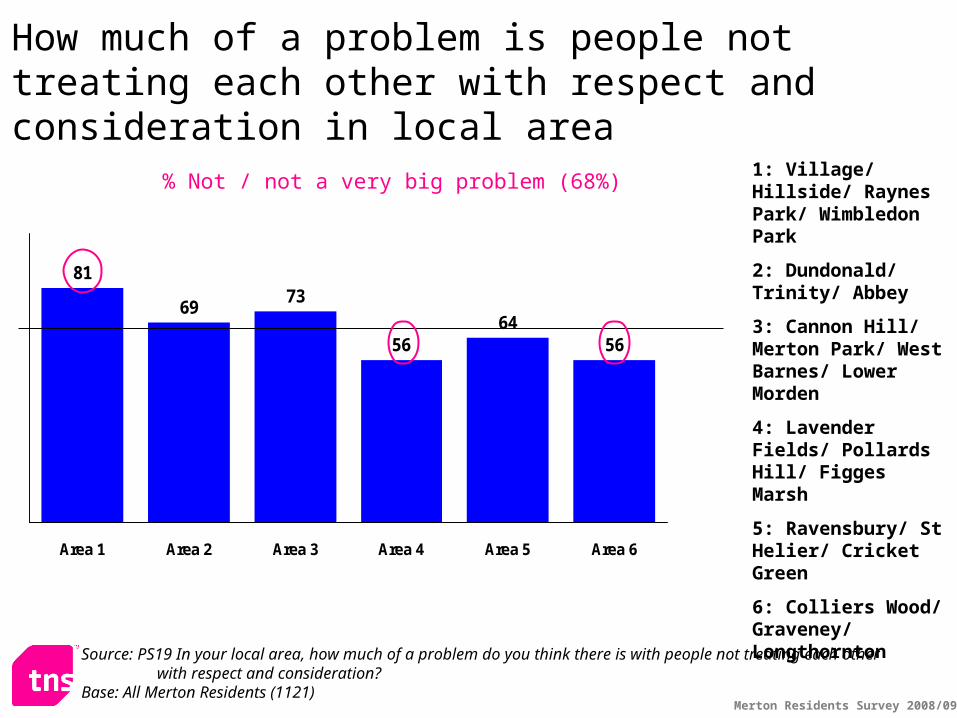
How much of a problem is people not treating each other with respect and consideration in local area
Merton Residents Survey 2008/09
81
6973
5664
56
Area 1 Area 2 Area 3 Area 4 Area 5 Area 6
% Not / not a very big problem (68%)1: Village/ Hillside/ Raynes Park/ Wimbledon Park
2: Dundonald/ Trinity/ Abbey
3: Cannon Hill/ Merton Park/ West Barnes/ Lower Morden
4: Lavender Fields/ Pollards Hill/ Figges Marsh
5: Ravensbury/ St Helier/ Cricket Green
6: Colliers Wood/ Graveney/ Longthornton
Source: PS19 In your local area, how much of a problem do you think there is with people not treating each other with respect and consideration?
Base: All Merton Residents (1121)
How much of a problem is people not treating each other with respect and consideration in local area

Community activity
Merton Residents Survey 2008/09
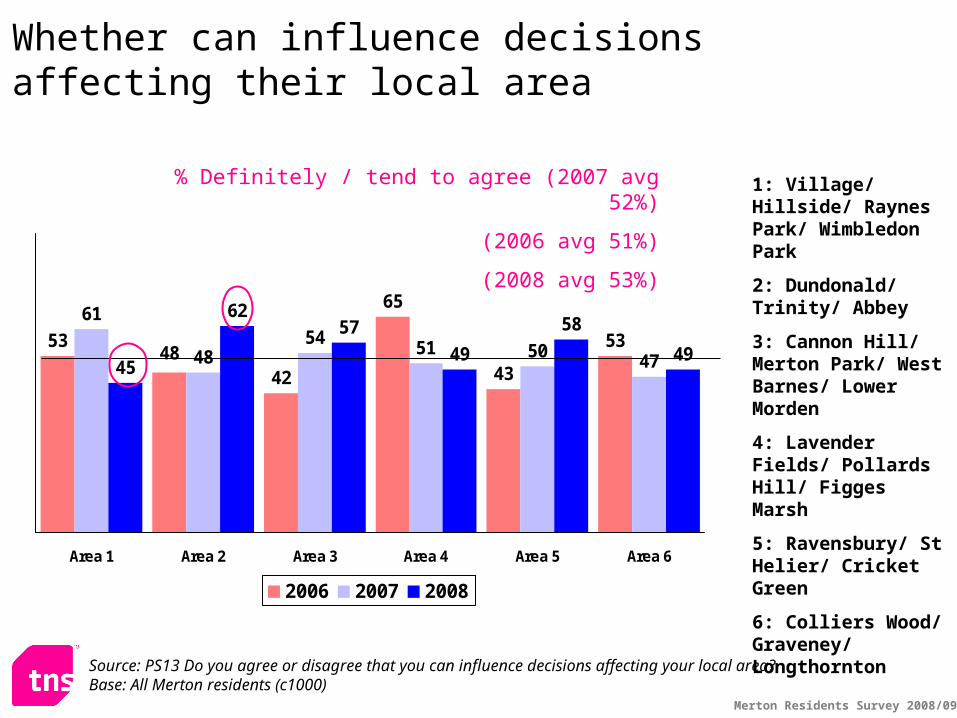
Whether can influence decisions affecting their local area
53
42
65
43
53
61
4854 51 50 4745
6257
49
58
4948
Area 1 Area 2 Area 3 Area 4 Area 5 Area 6
2006 2007 2008
1: Village/ Hillside/ Raynes Park/ Wimbledon Park
2: Dundonald/ Trinity/ Abbey
3: Cannon Hill/ Merton Park/ West Barnes/ Lower Morden
4: Lavender Fields/ Pollards Hill/ Figges Marsh
5: Ravensbury/ St Helier/ Cricket Green
6: Colliers Wood/ Graveney/ Longthornton
% Definitely / tend to agree (2007 avg 52%)
(2006 avg 51%)
(2008 avg 53%)
Source: PS13 Do you agree or disagree that you can influence decisions affecting your local area?Base: All Merton residents (c1000)
Merton Residents Survey 2008/09
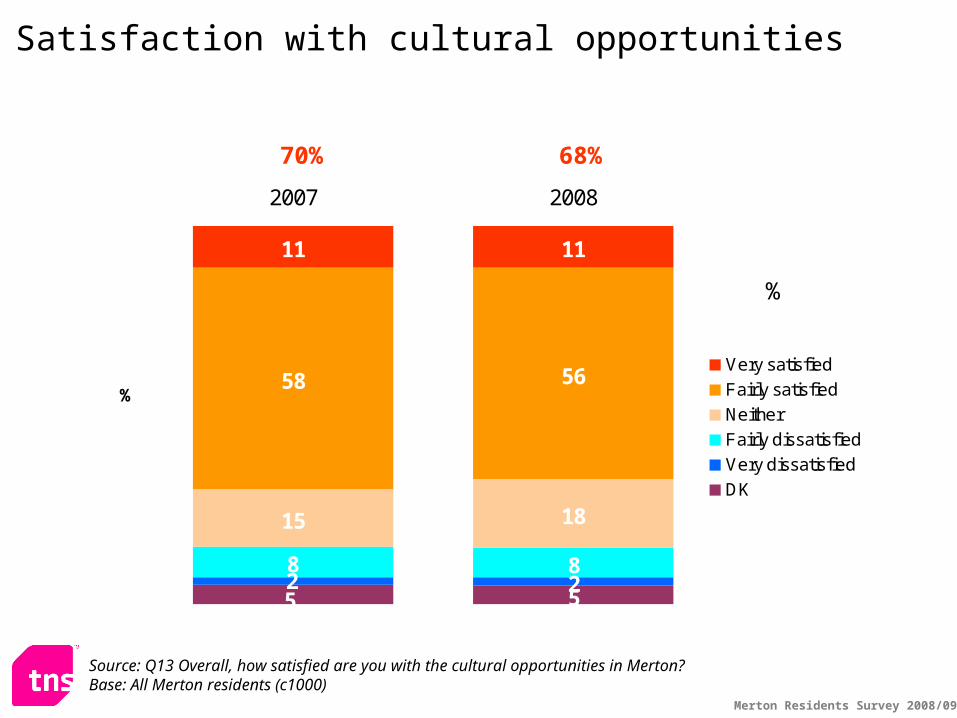
Satisfaction with cultural opportunities
528
15 18
58 56
11 11
528
2007 2008
%
Very satisfied
Fairly satisfied
Neither
Fairly dissatisfied
Very dissatisfied
DK
%
70%
Source: Q13 Overall, how satisfied are you with the cultural opportunities in Merton?Base: All Merton residents (c1000)
68%

Merton Residents Survey 2008/09
78 77
6169 67
75
59
71
59
726765
Area 1 Area 2 Area 3 Area 4 Area 5 Area 6
2007 2008
% Very / fairly satisfied (2007 avg 70%)
(2008 avg 68%)
1: Village/ Hillside/ Raynes Park/ Wimbledon Park
2: Dundonald/ Trinity/ Abbey
3: Cannon Hill/ Merton Park/ West Barnes/ Lower Morden
4: Lavender Fields/ Pollards Hill/ Figges Marsh
5: Ravensbury/ St Helier/ Cricket Green
6: Colliers Wood/ Graveney/ Longthornton
Source: Q13 Overall, how satisfied are you with the cultural opportunities in Merton?Base: All Merton residents (c1000)
Satisfaction with cultural opportunities
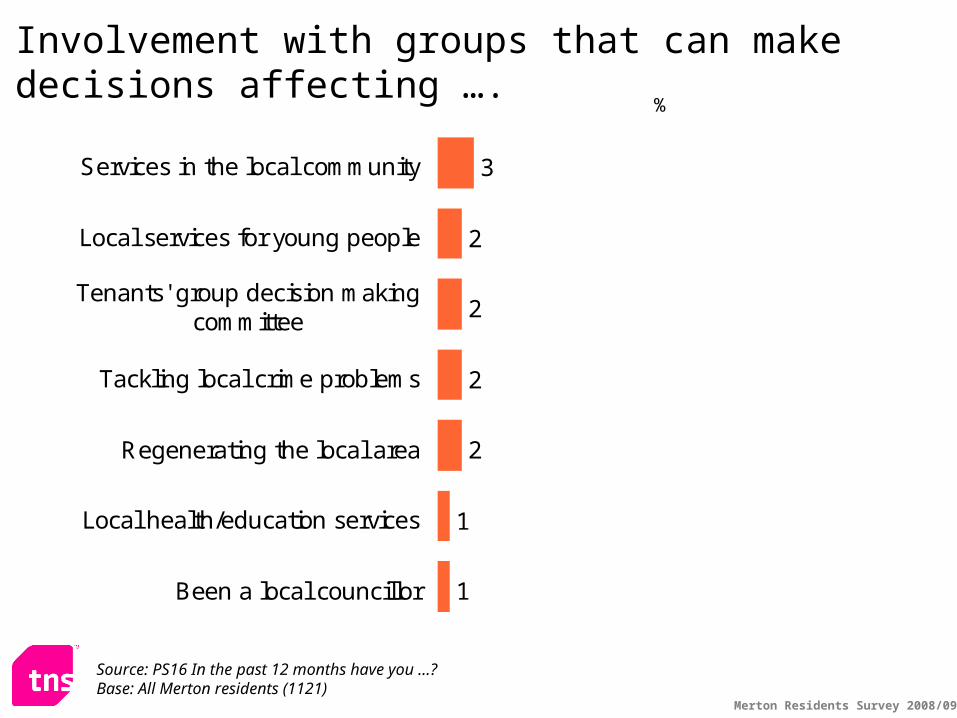
Merton Residents Survey 2008/09
3
2
2
2
2
1
1
Services in the local community
Local services for young people
Tenants' group decision makingcommittee
Tackling local crime problems
Regenerating the local area
Local health/education services
Been a local councillor
%
Source: PS16 In the past 12 months have you …?Base: All Merton residents (1121)
Involvement with groups that can make decisions affecting ….

Complaints
Merton Residents Survey 2008/09
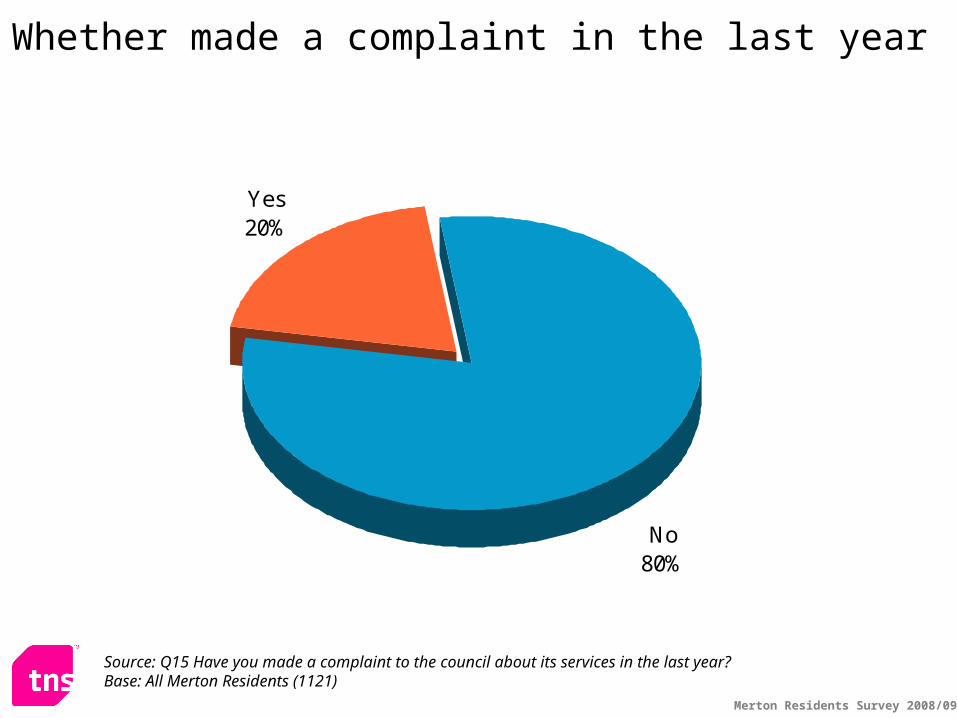
Yes20%
No80%
Whether made a complaint in the last year
Source: Q15 Have you made a complaint to the council about its services in the last year?Base: All Merton Residents (1121)
Merton Residents Survey 2008/09
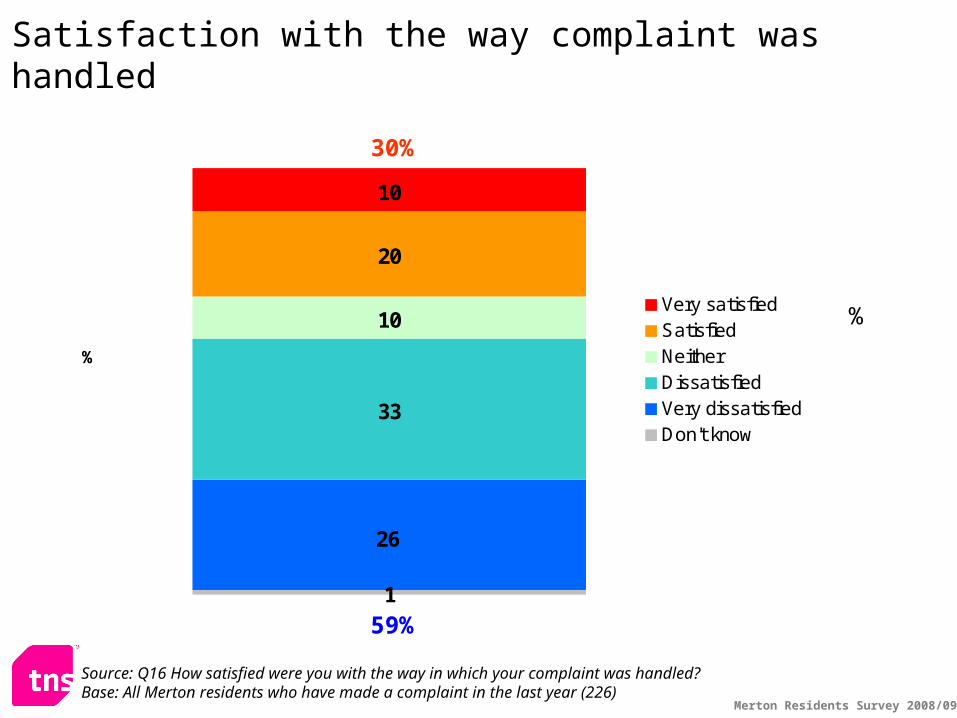
Satisfaction with the way complaint was handled
33
10
20
10
1
26
%
Very satisfiedSatisfiedNeitherDissatisfiedVery dissatisfiedDon't know
Source: Q16 How satisfied were you with the way in which your complaint was handled?Base: All Merton residents who have made a complaint in the last year (226)
%
30%
59%

Sources of information
Merton Residents Survey 2008/09
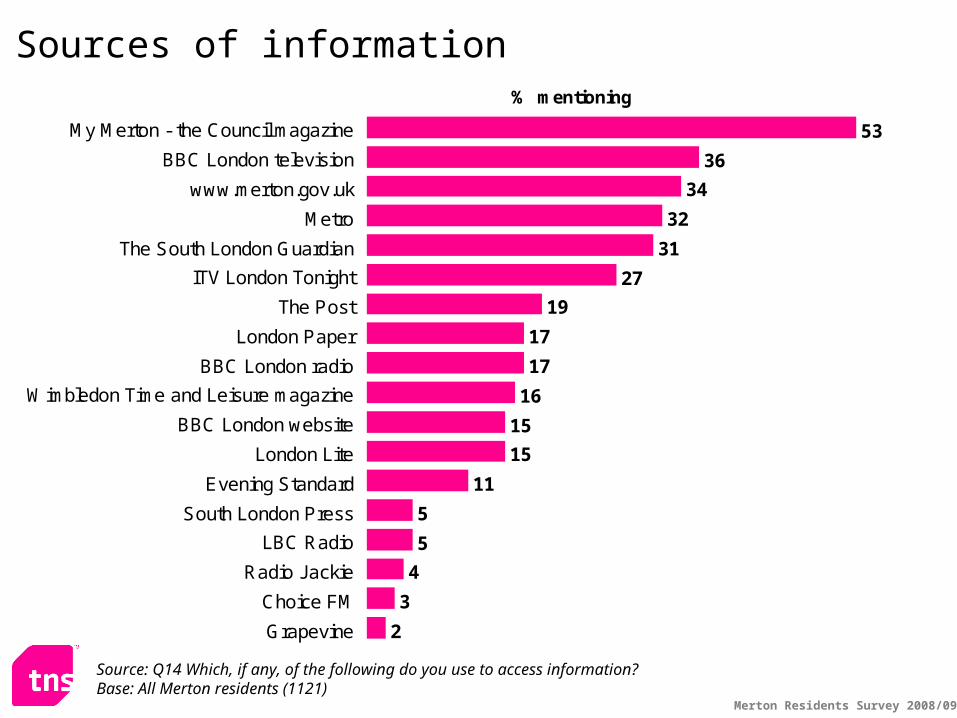
Sources of information
53
36
34
32
31
27
19
17
17
16
15
15
11
5
5
4
3
2
My Merton - the Council magazine
BBC London television
www.merton.gov.uk
Metro
The South London Guardian
ITV London Tonight
The Post
London Paper
BBC London radio
Wimbledon Time and Leisure magazine
BBC London website
London Lite
Evening Standard
South London Press
LBC Radio
Radio Jackie
Choice FM
Grapevine
% mentioning
Source: Q14 Which, if any, of the following do you use to access information?Base: All Merton residents (1121)

Young Persons Survey

Merton Residents Survey 2008/09
54
35
30
24
23
21
19
17
16
14
12
13
10
46
36
43
19
21
19
22
18
18
18
13
11
11
46
28
31
24
32
20
23
16
13
17
15
9
12
45
34
35
26
29
13
30
18
13
16
18
8
Crime
Bad behaviour
Bullying
Litter
Not enough done for youth
Pollution
Drug use / pushers
Education
Traffic
Public transport
Lack of recreational facilities
Lack of jobs
Health
2008200720062005
Areas of personal concern – Young peopleSignificant fall for bullying from 2007
Base: All Merton residents 11-17yrs (2008: 257, 2007: 260, 2006: 245)
%
Merton Residents Survey 2008/09
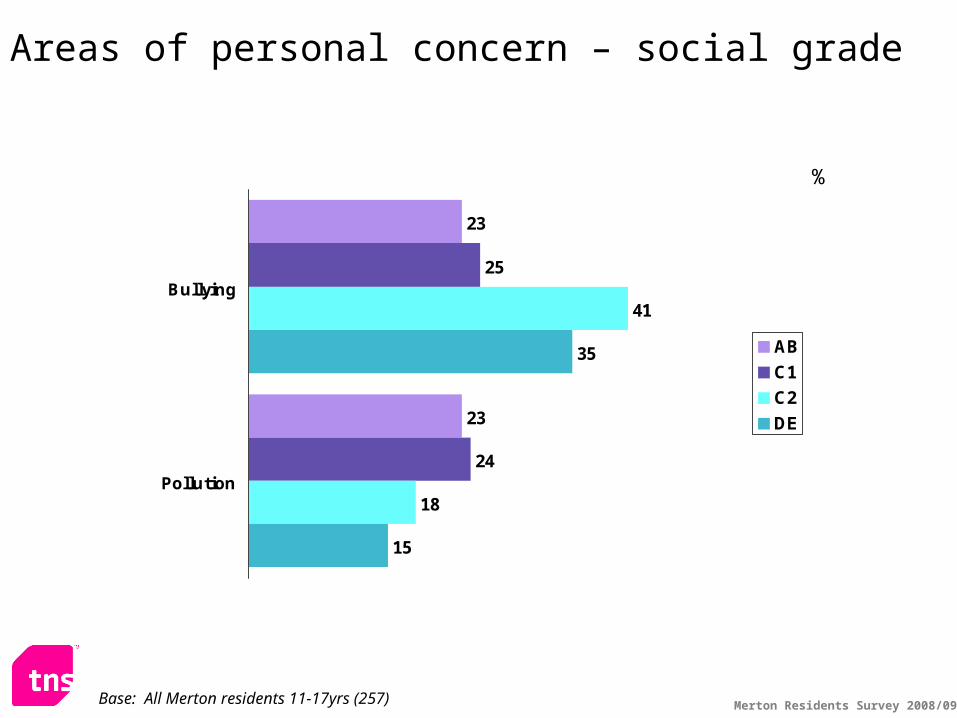
Areas of personal concern – social grade
Base: All Merton residents 11-17yrs (257)
%
23
23
25
24
41
18
35
15
Bullying
Pollution
AB
C1
C2
DE
Merton Residents Survey 2008/09
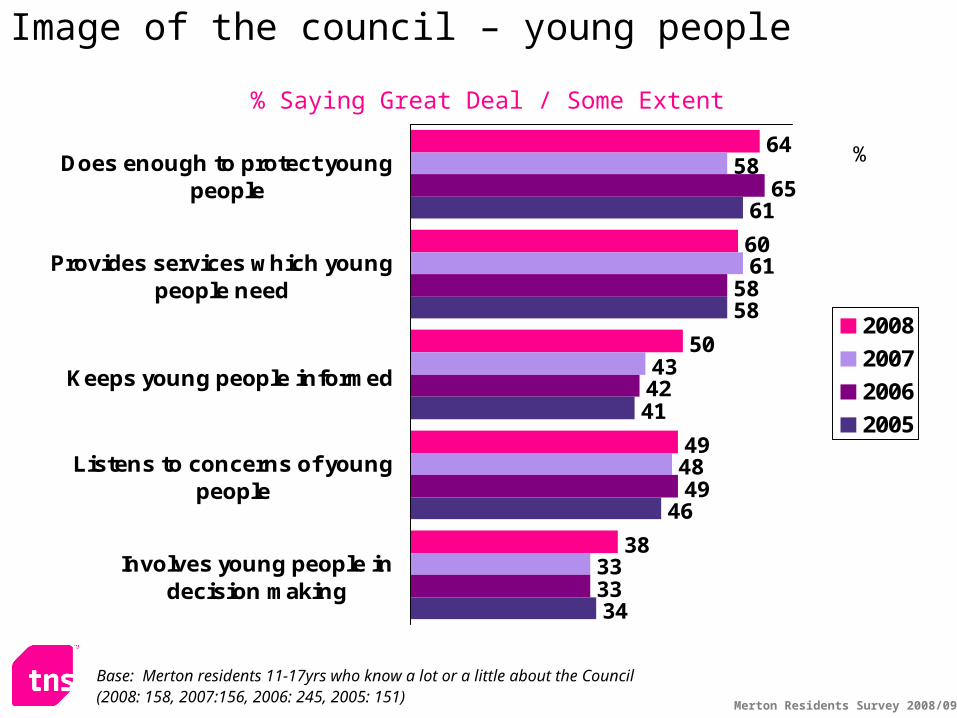
Image of the council – young people
% Saying Great Deal / Some Extent
64
60
50
49
38
58
61
43
48
33
65
58
42
49
33
61
58
41
46
34
Does enough to protect youngpeople
Provides services which youngpeople need
Keeps young people informed
Listens to concerns of youngpeople
Involves young people indecision making
2008
2007
2006
2005
Base: Merton residents 11-17yrs who know a lot or a little about the Council (2008: 158, 2007:156, 2006: 245, 2005: 151)
%

Merton Residents Survey 2008/09
Perceived service delivery – Young people
10
7
5
9
9
12
14
15
18
4
19
15
24
11
6
72
72
63
63
62
58
56
56
55
54
50
42
41
39
27
Poor - Extremely Poor Good-Excellent
Difference from 2007
Primary schools
The police
Libraries
Public transport
Parks, playgrounds and open spaces
Local health services
Recycling facilities
Secondary schools
Leisure / sports facilities
Repair of roads/pavements/cycle paths
Street cleaning
Sixth form colleges
Arts and culture
Activities for young people
Social services for children and families
Base: All Merton residents 11-17yrs (2008: 257, 2007: 260, 2006: 245)
0
+3
-4
-2
-1
0
-2
-1
-1
-4
-1
-7
-2
-3
-9**Sig
Merton Residents Survey 2008/09
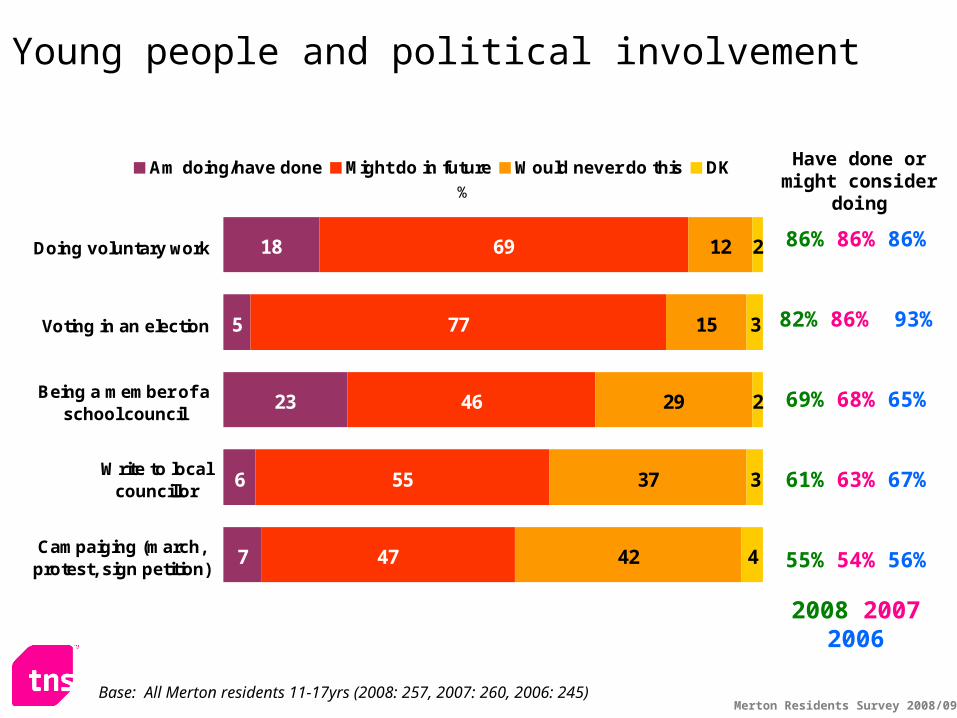
Young people and political involvement
5
23
6
7
69
77
46
55
47
12
15
29
37
42
2
3
2
3
4
18Doing voluntary work
Voting in an election
Being a member of aschool council
Write to localcouncillor
Campaiging (march,protest, sign petition)
%Am doing/have done Might do in future Would never do this DK
86% 86% 86%
82% 86% 93%
69% 68% 65%
61% 63% 67%
55% 54% 56%
2008 2007 2006
Have done or might consider doing
Base: All Merton residents 11-17yrs (2008: 257, 2007: 260, 2006: 245)

Merton Residents Survey 2008/09
Out of school activities attended82% engage in at least one activity
40
17 1915
9
26
40
1720
12
6 4
43
34
25
18 17
116 4
53
41
23 22
138
5 52
Librariesand parks
Sports / gym After-schoolclub
Drama /Dance /Music
Youth club Scout /adventure /cadet grps
Breakfastclub
Other
2005 2006 2007 2008
%
Base: All Merton residents 11-17yrs (2008: 257, 2007: 260, 2006: 245)
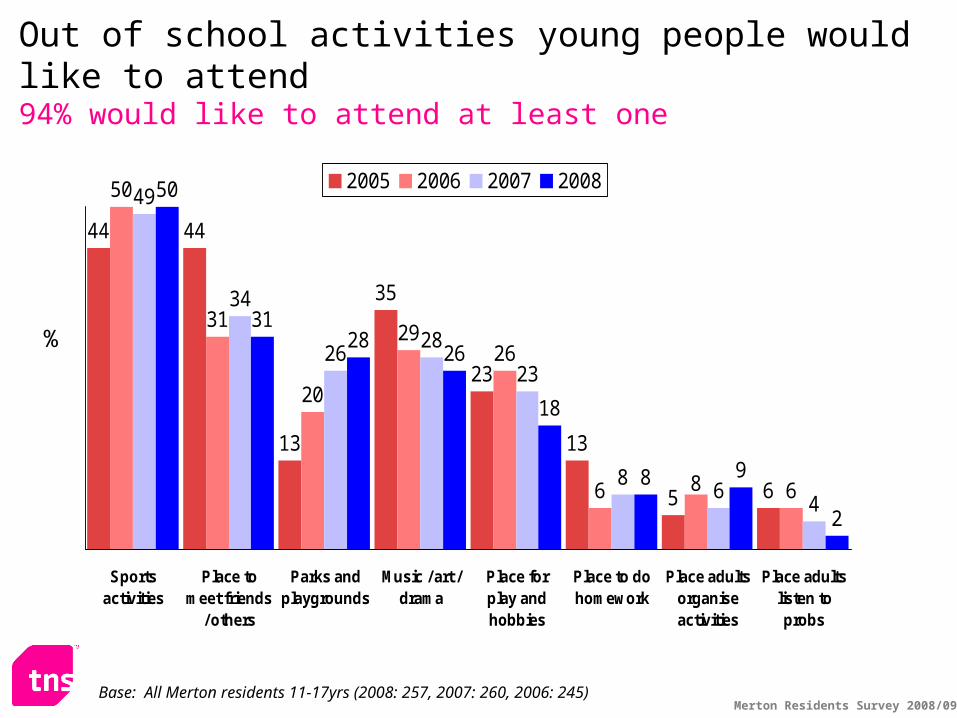
Merton Residents Survey 2008/09
Out of school activities young people would like to attend94% would like to attend at least one
%
44 44
13
35
23
13
5 6
50
31
20
2926
6 6
49
34
2628
23
86
4
50
3128
26
18
8 9
2
8
Sportsactivities
Place tomeet friends
/ others
Parks andplaygrounds
Music / art /drama
Place forplay andhobbies
Place to dohomework
Place adultsorganiseactivities
Place adultslisten toprobs
2005 2006 2007 2008
Base: All Merton residents 11-17yrs (2008: 257, 2007: 260, 2006: 245)
Merton Residents Survey 2008/09
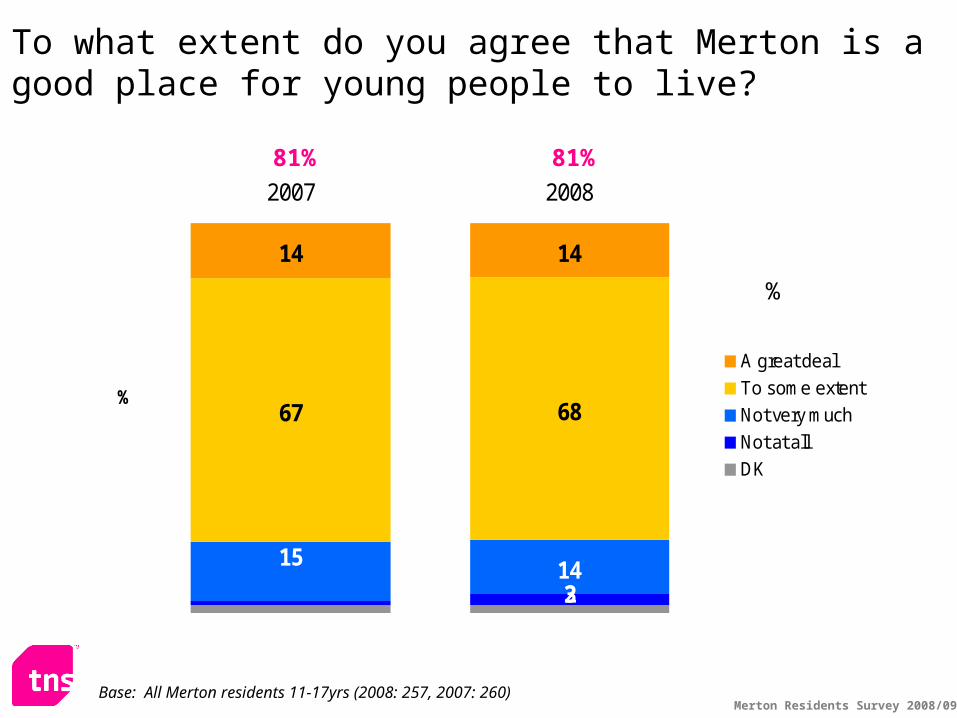
To what extent do you agree that Merton is a good place for young people to live?
2314
67 68
14 14
15
2007 2008
%
A great deal
To some extent
Not very much
Not at all
DK
%
81%
Base: All Merton residents 11-17yrs (2008: 257, 2007: 260)
81%
Merton Residents Survey 2008/09
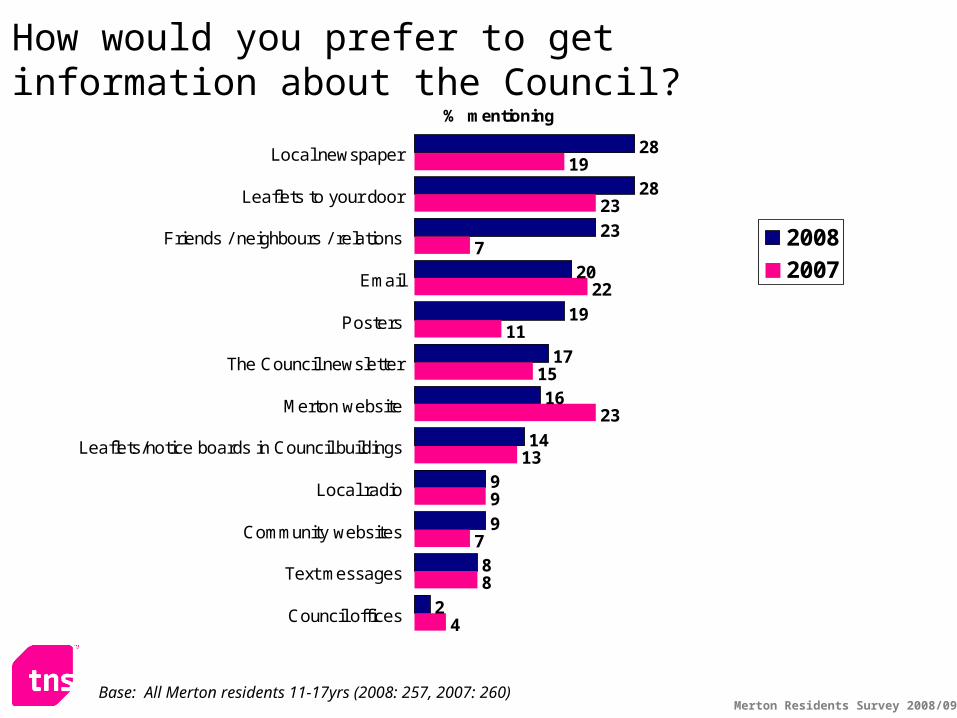
How would you prefer to get information about the Council?
28
28
23
20
19
17
16
14
9
9
8
2
19
23
7
22
11
15
23
13
9
7
8
4
Local newspaper
Leaflets to your door
Friends / neighbours / relations
Posters
The Council newsletter
Merton website
Leaflets/notice boards in Council buildings
Local radio
Community websites
Text messages
Council offices
% mentioning
2008
2007
Base: All Merton residents 11-17yrs (2008: 257, 2007: 260)
Merton Residents Survey 2008/09
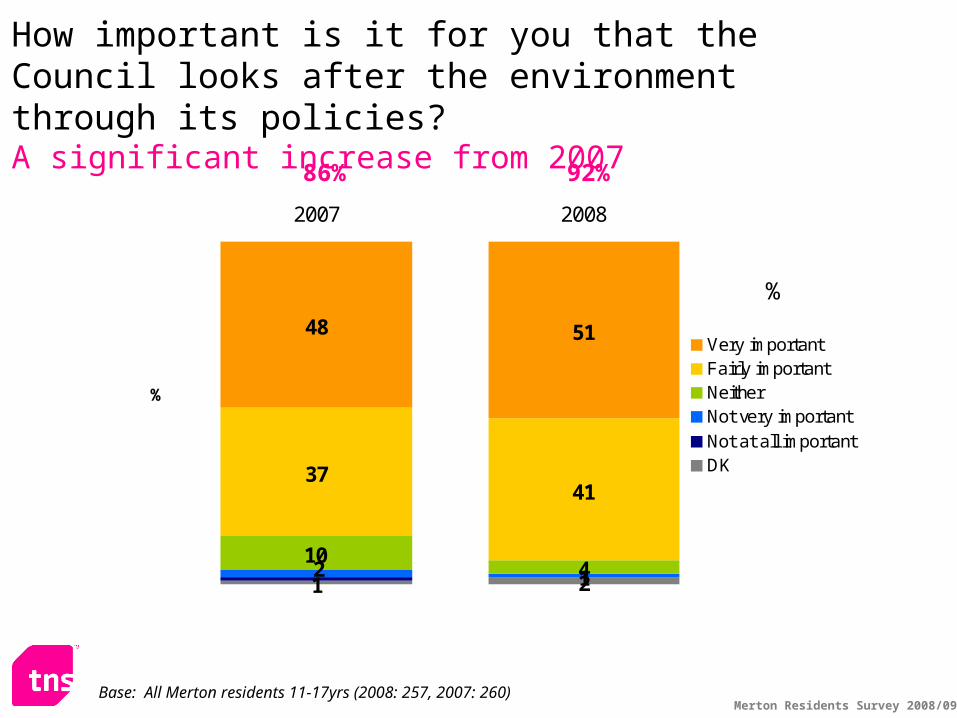
How important is it for you that the Council looks after the environment through its policies?A significant increase from 2007
%
86%
1 214
3741
51
210
48
2007 2008
%
Very importantFairly importantNeitherNot very important
Not at all importantDK
Base: All Merton residents 11-17yrs (2008: 257, 2007: 260)
92%
Merton Residents Survey 2008/09Draft Presentation
Presented byTNS Social
September 2008