Embed Size (px)
Citation preview
Mentoring by Geographic Area in the State of Michigan:
A Report on Wave V of the Mentor Michigan Census
November 2007
Prepared by: Kahle Research Solutions Inc.
www.KahleResearch.com

Table of Contents
Introduction .......................................................................................................................................................1 Objectives .........................................................................................................................................................1 Geographic Breakdown.....................................................................................................................................2 The Mentoring Funnel .......................................................................................................................................3 Overview ..........................................................................................................................................................4 Mentoring Organizations ........................................................................................................................4 Active Mentors and Youth Served ..........................................................................................................4 Mentor / Youth Matches .........................................................................................................................6 Funnel Measures...............................................................................................................................................7 Inquiries and Applications.......................................................................................................................7 Mentoring Intensity and Duration............................................................................................................9 Program Type.......................................................................................................................................10 Screening .............................................................................................................................................11 Demographic Profile........................................................................................................................................12 Mentors ................................................................................................................................................12 Youth Served........................................................................................................................................13 Waiting List Demographic Profiles...................................................................................................................14 Site of Organization and Mentoring Type........................................................................................................15 Mentoring Capacity .........................................................................................................................................16 Mentoring Program Budgets ...........................................................................................................................17 Organization Characteristics ...........................................................................................................................18 Mission .................................................................................................................................................18 Mentoring Program Duration ................................................................................................................18 Awareness and Use of MM Quality Programs Standards for Youth Mentoring ...............................................19 Most Difficult Program Standards to Meet.......................................................................................................20 Satisfaction with Mentor Michigan...................................................................................................................22 Involvement with Mentor Michigan ..................................................................................................................22 Appendix (Supporting Tables).................................................................................................................. A1-A15

Mentoring by Geographic Area in the State of Michigan – MMC Wave V
Kahle Research Solutions Inc. Page 1
Introduction This report contains data from Wave V of the Mentor Michigan Census (MMC). The MMC is a periodic, on-line survey of organizations operating mentoring programs in the State of Michigan. The various waves of the MMC and the time periods they cover are shown in the table below:
Wave Dates Data was Collected Time Period Survey Covered
Wave I Fall 2004 1/1/04 – 8/31/04 Wave II March 2004 1/1/04 – 12/31/04
1/1/05 – 2/28/05 Wave III October 2005 1/1/05 – 8/31/05 Wave IV September & October 2006 9/1/05 – 8/31/06 Wave V September and October 2007 9/1/06 – 8/31/07
Objectives This special report focuses on results of the MMC Wave V broken down by geographic area. Overall, the primary purpose of the MMC is to understand the scope and nature of mentoring and mentoring organizations in Michigan. Specifically, there are three key objectives: 1. Identify, count, describe, and track mentoring organizations, programs, mentors, and the children served. 2. Understand program components, processes, resources, and needs. 3. Encourage and support program evaluation. In Wave V of the MMC, there was also a focus on understanding mentoring organizations’ changes in capacity as well as their experiences with AmeriCorps and AmeriCorps*VISTA members. Separate reports on the Capacity Changes, AmeriCorps and AmeriCorps*VISTA members, and the overall Scope and Nature of Mentoring in Michigan are posted on the Mentor Michigan web site. Similarly, reports and presentations from previous waves of the Census, can be found at www.michigan.gov/mentormichigan. Any questions regarding the data presented in these reports or the methods used to collect and analyze these data should be directed to Robert W. Kahle, Ph.D., at [email protected].
Mentoring by Geographic Area in the State of Michigan – MMC Wave V
Kahle Research Solutions Inc. Page 2
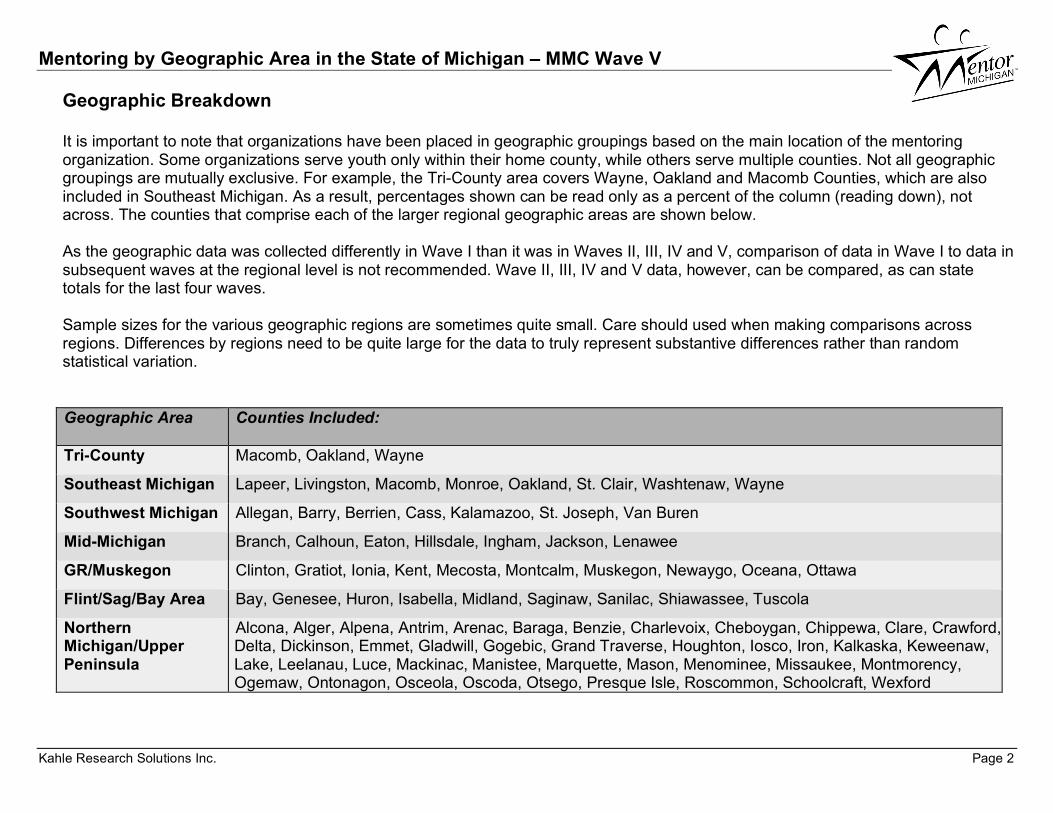
Geographic Breakdown It is important to note that organizations have been placed in geographic groupings based on the main location of the mentoring organization. Some organizations serve youth only within their home county, while others serve multiple counties. Not all geographic groupings are mutually exclusive. For example, the Tri-County area covers Wayne, Oakland and Macomb Counties, which are also included in Southeast Michigan. As a result, percentages shown can be read only as a percent of the column (reading down), not across. The counties that comprise each of the larger regional geographic areas are shown below.
As the geographic data was collected differently in Wave I than it was in Waves II, III, IV and V, comparison of data in Wave I to data in subsequent waves at the regional level is not recommended. Wave II, III, IV and V data, however, can be compared, as can state totals for the last four waves.
Sample sizes for the various geographic regions are sometimes quite small. Care should used when making comparisons across regions. Differences by regions need to be quite large for the data to truly represent substantive differences rather than random statistical variation.
Geographic Area Counties Included:
Tri-County Macomb, Oakland, Wayne
Southeast Michigan Lapeer, Livingston, Macomb, Monroe, Oakland, St. Clair, Washtenaw, Wayne
Southwest Michigan Allegan, Barry, Berrien, Cass, Kalamazoo, St. Joseph, Van Buren
Mid-Michigan Branch, Calhoun, Eaton, Hillsdale, Ingham, Jackson, Lenawee
GR/Muskegon Clinton, Gratiot, Ionia, Kent, Mecosta, Montcalm, Muskegon, Newaygo, Oceana, Ottawa
Flint/Sag/Bay Area Bay, Genesee, Huron, Isabella, Midland, Saginaw, Sanilac, Shiawassee, Tuscola
Northern Michigan/Upper Peninsula
Alcona, Alger, Alpena, Antrim, Arenac, Baraga, Benzie, Charlevoix, Cheboygan, Chippewa, Clare, Crawford, Delta, Dickinson, Emmet, Gladwill, Gogebic, Grand Traverse, Houghton, Iosco, Iron, Kalkaska, Keweenaw, Lake, Leelanau, Luce, Mackinac, Manistee, Marquette, Mason, Menominee, Missaukee, Montmorency, Ogemaw, Ontonagon, Osceola, Oscoda, Otsego, Presque Isle, Roscommon, Schoolcraft, Wexford

Mentoring by Geographic Area in the State of Michigan – MMC Wave V
Kahle Research Solutions Inc. Page 3
Inquiries and Applications
Screening, Matching and Training
Mentoring Duration
and Intensity
The Mentoring Funnel
The MMC uses the mentoring funnel as a conceptual framework, identifying key steps in the recruitment and mentoring process to be measured, including number of inquires from potential mentors, number of written applications, background checking processes, training process, number and type of mentoring matches, and duration and intensity. Questions developed based on this funnel are repeated in each wave of the MMC, providing a means of tracking specific measurements from year to year. Refer to Table 1 in the Appendix for a summary of the funnel measure questions broken down by geographic area.
V

Mentoring by Geographic Area in the State of Michigan – MMC Wave V
Kahle Research Solutions Inc. Page 4
Overview Mentoring Organizations o Southeast Michigan reports the largest number of mentoring organizations in any geographic area. Fifty of the 136 that
responded to the Wave V survey serve clients in Southeast Michigan, and among those, 39 are within the Tri-County area (Wayne, Oakland and Macomb). The geographic areas and number of organizations responding within each are:
Question Wave V
Total Tri-
County SE MI SW MI Mid-
Mich GR / Musk
Flint/Sag/ Bay Area
Northern/ UP
Number of Mentoring Organizations 136 39 50 13 16 23 16 18
Active Mentors and Youth Served o Wave V of the census documents 20,603 active mentors, the largest number of mentors ever counted in the state of Michigan.
Organizations serving Grand Rapids/Muskegon account for nearly half of those, with a total of 8,920.
o Northern Michigan/Upper Peninsula and Mid-Michigan organizations report the smallest percentage (8%) of active mentors in the state. They account for 1,686 and 1,655 respectively.
o Consistent with the large number of mentors, the Grand Rapids/Muskegon area also serves more youth (9,832) than any other
geographic area (the state-wide total is 28,393).
o Northern Michigan/Upper Peninsula and Mid-Michigan organizations report the smallest percentages (9% and 7%) of youth served. They account for 2,418 and 2,121 respectively.
o Refer to the pie charts below for additional geographic data on both active mentors and youth served.

Mentoring by Geographic Area in the State of Michigan – MMC Wave V
Kahle Research Solutions Inc. Page 5
Wave V Active Mentors by Geographic Area
**SE MI
3,518
17%
Northern/ UP
1,686
8%
Flint/Sag/ Bay Area
2,690
13%
SW MI
2,134
10%
Mid-Mich
1,655
8%
GR / Musk
8,920
44%
Wave V Youth Served by Geographic Area
Mid-Mich
2,121
7%
SW MI
2,701
10%
GR / Musk
9,832
34%
Flint/Sag/ Bay Area
5,298
19%
Northern/ UP
2,418
9% **SE MI
6,023
21%
**NOTE: In the charts above, the Tri-County area is included in the totals for Southeast Michigan (The tri-county accounts for 2,848 mentors and 5,247 youth served).

Mentoring by Geographic Area in the State of Michigan – MMC Wave V
Kahle Research Solutions Inc. Page 6
Mentor / Youth Matches
o Measuring another way illustrates that the number of mentoring relationships in Michigan is growing. The table below shows that 51% of mentoring organizations throughout the state report an increase in the last year while only 15% (the lowest ever measured) report a decrease in number of children matched. Among those organizations reporting an increase, in aggregate,the number matched with a mentor has increased by 3,910 since one year ago. Among those reporting a decrease, the aggregate number of matches is down 1,078. This yields a net change of 2,832 matches since August 31, 2006.
o This net change (increase) is present in every geographic area. The Flint/Saginaw/Bay Area leads the state, with 64% of
organizations reporting a match increase and only 4% reporting a decrease since last year, resulting in a net increase of 1,142 matches.
Question Wave V
Total Tri-
County SE MI SW MI Mid-Mich GR /
Musk Flint/Sag/ Bay Area
Northern/ UP
Number of Mentoring Organizations 136 39 50 13 16 23 16 18
Total number of matches
Percent of organizations reporting an increase 51% 40% 44% 45% 38% 69% 64% 53% Percent of organizations reporting a decrease 15% 20% 18% 20% 17% 10% 4% 21% Percent of organizations reporting no change 24% 33% 33% 20% 21% 14% 25% 18%
Don’t Know 9% 7% 5% 15% 25% 7% 7% 9% Increased # 3,910 555 713 650 230 951 1,147 219
Decreased # 1,078 292 355 262 144 128 5 184 Net Change # 2,832 263 358 388 86 823 1,142 35

Mentoring by Geographic Area in the State of Michigan – MMC Wave V
Kahle Research Solutions Inc. Page 7
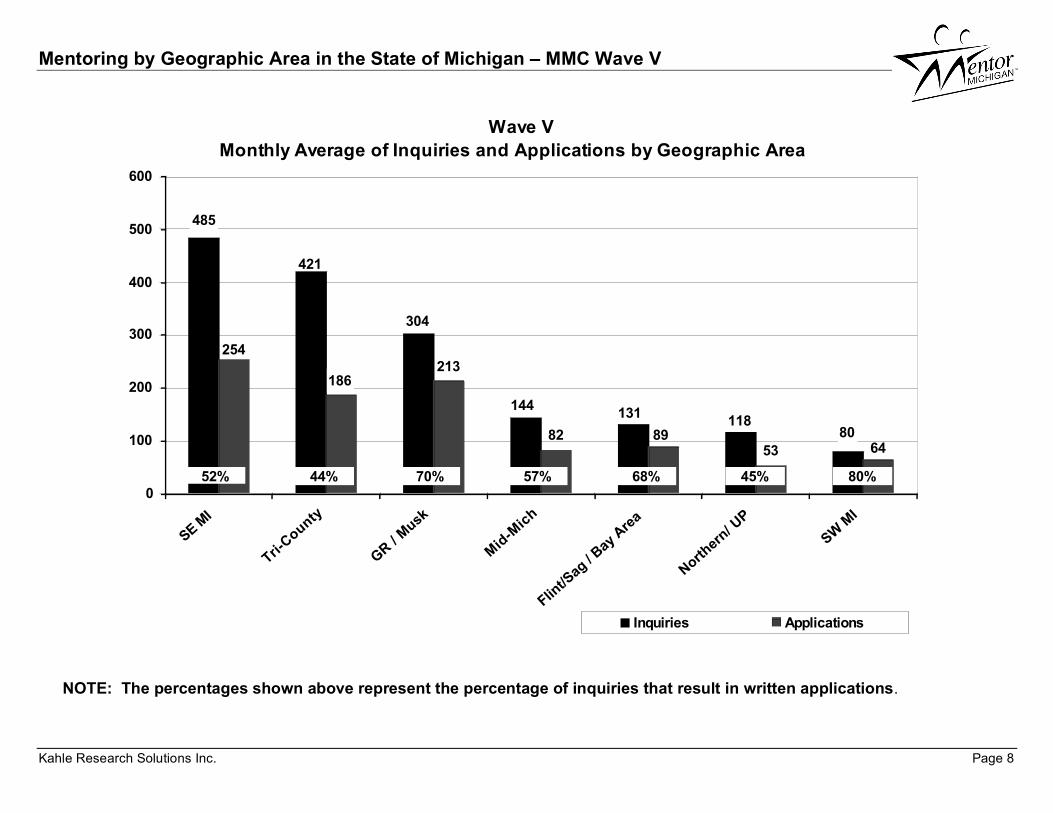
Funnel Measures Inquiries and Applications o State-wide, organizations report receiving more than 15,000 inquiries compared to about 17,000 inquiries that were counted
during Wave IV. Yet, more of these are serious inquiries, as more than 9,000 written applications were received this year, compared to 8,000 last year.
o Looking at monthly averages (see the chart on next page), state-wide organizations report receiving an average of 1,260
inquiries each month. These averages vary widely across geographic areas, with a high of 485 inquiries per month in Southeast Michigan (421 of those in the Tri-County area), compared to a low of 80 inquires per month in Southwest Michigan. Written applications average 755 per month state-wide, with Grand Rapids/Muskegon reporting the highest monthly average of 213 and Northern Michigan/Upper Peninsula reporting only 53 per month.
o In addition to looking at raw numbers, it is important to note the ratio of inquiries to written applications. While the numbers of
inquiries and applications is small (80 and 64 respectively) in Southwest Michigan, recruitment efforts there seem effective as 80% of their inquiries result in applications. The geographic area closest to this success is Grand Rapids/Muskegon, with 70% of their inquiries resulting in applications.
o Recruitment seems least effective in the Tri-County area, where only 44% of inquiries result in written applications.
Mentoring by Geographic Area in the State of Michigan – MMC Wave V
Kahle Research Solutions Inc. Page 8
Wave V
Monthly Average of Inquiries and Applications by Geographic Area
213
8253
118
485
421
304
144131
80
186
89
254
64
0
100
200
300
400
500
600
SE MI
Tri-C
ounty
GR /
Musk
Mid
-Mic
h
Flint/S
ag /
Bay
Are
a
Nort
hern/ U
P
SW M
I
Inquiries Applications
52% 44% 70% 57% 68% 45% 80%
NOTE: The percentages shown above represent the percentage of inquiries that result in written applications.
Mentoring by Geographic Area in the State of Michigan – MMC Wave V
Kahle Research Solutions Inc. Page 9
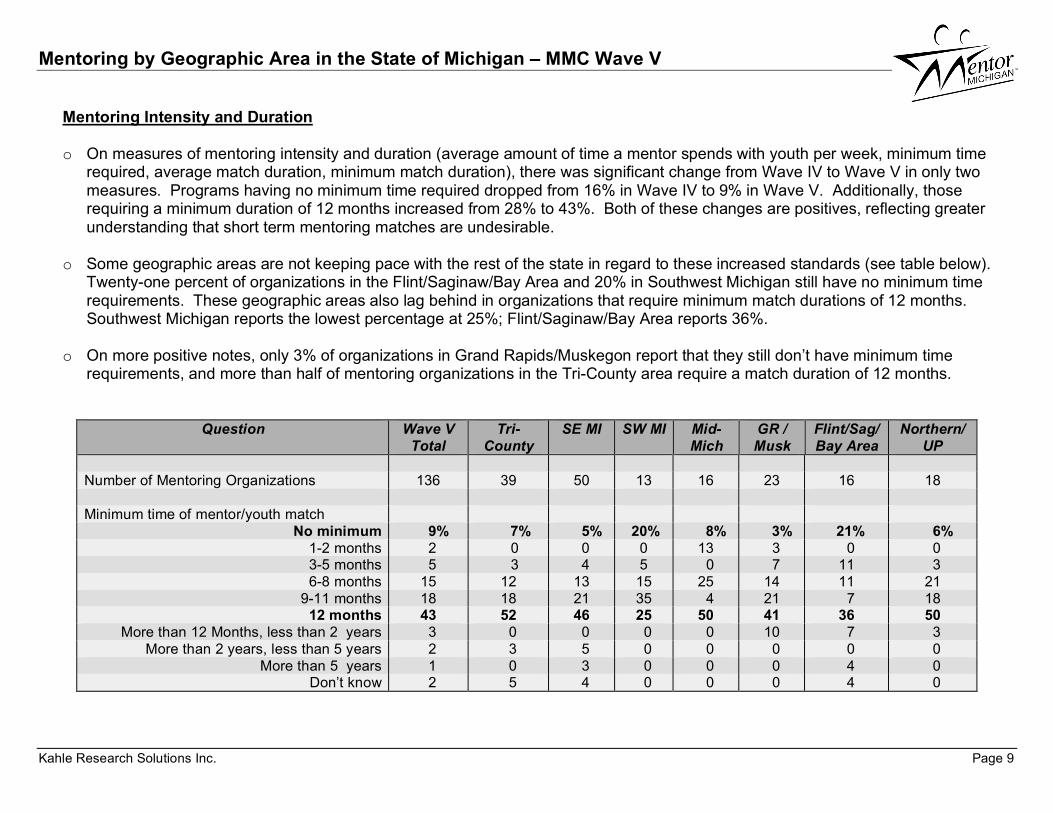
Mentoring Intensity and Duration o On measures of mentoring intensity and duration (average amount of time a mentor spends with youth per week, minimum time
required, average match duration, minimum match duration), there was significant change from Wave IV to Wave V in only two measures. Programs having no minimum time required dropped from 16% in Wave IV to 9% in Wave V. Additionally, those requiring a minimum duration of 12 months increased from 28% to 43%. Both of these changes are positives, reflecting greater understanding that short term mentoring matches are undesirable.
o Some geographic areas are not keeping pace with the rest of the state in regard to these increased standards (see table below).
Twenty-one percent of organizations in the Flint/Saginaw/Bay Area and 20% in Southwest Michigan still have no minimum time requirements. These geographic areas also lag behind in organizations that require minimum match durations of 12 months. Southwest Michigan reports the lowest percentage at 25%; Flint/Saginaw/Bay Area reports 36%.
o On more positive notes, only 3% of organizations in Grand Rapids/Muskegon report that they still don’t have minimum time
requirements, and more than half of mentoring organizations in the Tri-County area require a match duration of 12 months.
Question Wave V
Total Tri-
County SE MI SW MI Mid-
Mich GR / Musk
Flint/Sag/ Bay Area
Northern/ UP
Number of Mentoring Organizations 136 39 50 13 16 23 16 18 Minimum time of mentor/youth match
No minimum 9% 7% 5% 20% 8% 3% 21% 6% 1-2 months 2 0 0 0 13 3 0 0 3-5 months 5 3 4 5 0 7 11 3 6-8 months 15 12 13 15 25 14 11 21
9-11 months 18 18 21 35 4 21 7 18 12 months 43 52 46 25 50 41 36 50
More than 12 Months, less than 2 years 3 0 0 0 0 10 7 3 More than 2 years, less than 5 years 2 3 5 0 0 0 0 0
More than 5 years 1 0 3 0 0 0 4 0 Don’t know 2 5 4 0 0 0 4 0

Mentoring by Geographic Area in the State of Michigan – MMC Wave V
Kahle Research Solutions Inc. Page 10
Program Type o Of the 213 mentoring programs in Michigan, 53% are reported to be community-based and 36% are school-based programs.
Likewise, community-based programs outnumber school-based programs in every geographic area, although the split is more even in Southeast Michigan (49% to 44%) and the Tri-County area (48% to 47%).
o The biggest disparity in program types is in Southwest Michigan, where 65% of programs are community-based; 25% school-
based.
o Programs defined as “Other”, which account for 11% of the total, are not defined.
Question Wave V
Total Tri-
County SE MI SW MI Mid-Mich GR /
Musk Flint/Sag/ Bay Area
Northern/ UP
Number of Mentoring Programs Served by Orgs. 213 60 78 20 24 29 28 34
Number of School-based programs 77 28 34 5 7 11 9 11
Percentage 36% 47% 44% 25% 29% 38% 32% 32% Number Community-based programs 112 29 38 13 11 17 14 19
Percentage 53% 48% 49% 65% 46% 59% 50% 56%
Number of “Other” programs 24 3 6 2 6 1 5 4 Percentage 11% 5% 8% 10% 25% 3% 18% 12%

Mentoring by Geographic Area in the State of Michigan – MMC Wave V
Kahle Research Solutions Inc. Page 11
Screening o The use of screening methods has increased slightly since Wave IV, with 80% of organizations state-wide using state criminal
background checks. The Flint/Saginaw/Bay Area leads the state with 96% of organizations reporting that they use this screening method, followed closely by Southwest Michigan (95%) and Grand Rapids Muskegon (93%).
o The number of organizations that do not use any of the screening methods has dropped from 5% in Wave IV to 3% in Wave V.
However, a disproportionate percentage (13%) of organizations not using screening methods can be found in Mid-Michigan.
Question Wave V Total
Tri-County
SE MI SW MI Mid-Mich
GR / Musk
Flint/Sag/ Bay Area
Northern/ UP
Number of Mentoring Organizations 136 39 50 13 16 23 16 18
Background Check - [M.R.]
State Criminal Background Check 80% 63% 69% 95% 71% 93% 96% 76% Federal Criminal Background Check 33 42 41 40 33 45 14 15
Sex Offender Registry 69 58 60 90 54 93 61 71 Child Abuse Registry 45 52 49 40 38 55 43 38 Drive record/license 51 45 53 30 58 59 50 50
Personal character reference 81 73 77 85 71 93 75 91 Employment reference 29 30 35 35 13 38 29 15
Written application 85 75 79 95 75 86 89 94 Personal interview 85 75 79 95 79 83 79 100
Home visit 13 12 10 5 4 10 32 18 Home Assessment 11 10 8 10 8 10 29 9 Fingerprint Check 15 28 24 0 17 24 0 3
None of the above 3 3 3 0 13 0 4 0
Mentoring by Geographic Area in the State of Michigan – MMC Wave V
Kahle Research Solutions Inc. Page 12
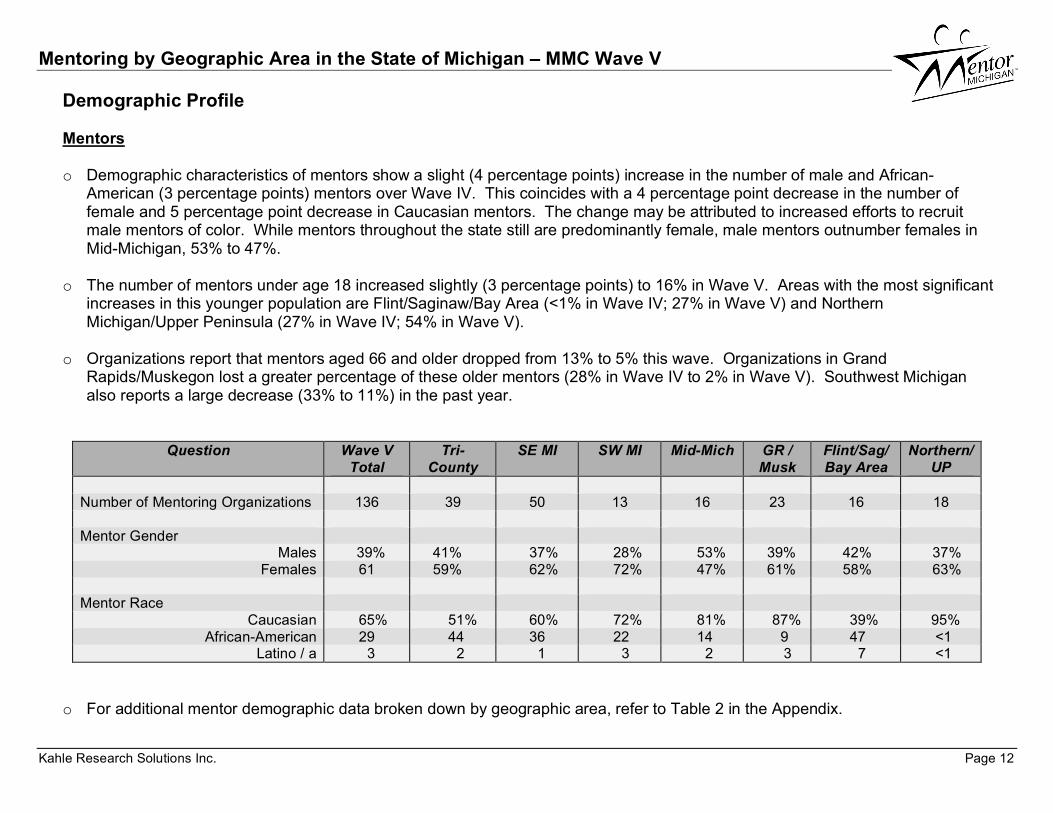
Demographic Profile Mentors o Demographic characteristics of mentors show a slight (4 percentage points) increase in the number of male and African-
American (3 percentage points) mentors over Wave IV. This coincides with a 4 percentage point decrease in the number of female and 5 percentage point decrease in Caucasian mentors. The change may be attributed to increased efforts to recruit male mentors of color. While mentors throughout the state still are predominantly female, male mentors outnumber females in Mid-Michigan, 53% to 47%.
o The number of mentors under age 18 increased slightly (3 percentage points) to 16% in Wave V. Areas with the most significant
increases in this younger population are Flint/Saginaw/Bay Area (<1% in Wave IV; 27% in Wave V) and Northern Michigan/Upper Peninsula (27% in Wave IV; 54% in Wave V).
o Organizations report that mentors aged 66 and older dropped from 13% to 5% this wave. Organizations in Grand
Rapids/Muskegon lost a greater percentage of these older mentors (28% in Wave IV to 2% in Wave V). Southwest Michigan also reports a large decrease (33% to 11%) in the past year.
Question Wave V Total
Tri-County
SE MI SW MI Mid-Mich GR / Musk
Flint/Sag/ Bay Area
Northern/ UP
Number of Mentoring Organizations 136 39 50 13 16 23 16 18 Mentor Gender
Males 39% 41% 37% 28% 53% 39% 42% 37% Females 61 59% 62% 72% 47% 61% 58% 63%
Mentor Race
Caucasian 65% 51% 60% 72% 81% 87% 39% 95% African-American 29 44 36 22 14 9 47 <1
Latino / a 3 2 1 3 2 3 7 <1
o For additional mentor demographic data broken down by geographic area, refer to Table 2 in the Appendix.
Mentoring by Geographic Area in the State of Michigan – MMC Wave V
Kahle Research Solutions Inc. Page 13
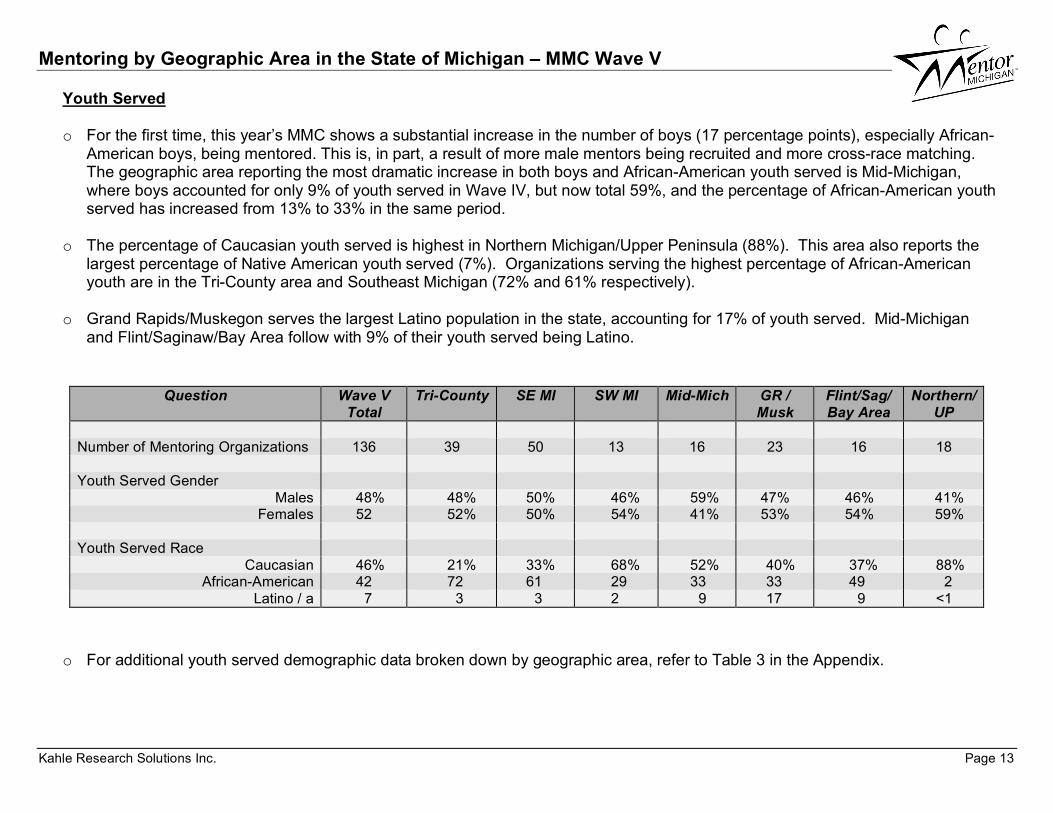
Youth Served o For the first time, this year’s MMC shows a substantial increase in the number of boys (17 percentage points), especially African-
American boys, being mentored. This is, in part, a result of more male mentors being recruited and more cross-race matching. The geographic area reporting the most dramatic increase in both boys and African-American youth served is Mid-Michigan, where boys accounted for only 9% of youth served in Wave IV, but now total 59%, and the percentage of African-American youth served has increased from 13% to 33% in the same period.
o The percentage of Caucasian youth served is highest in Northern Michigan/Upper Peninsula (88%). This area also reports the
largest percentage of Native American youth served (7%). Organizations serving the highest percentage of African-American youth are in the Tri-County area and Southeast Michigan (72% and 61% respectively).
o Grand Rapids/Muskegon serves the largest Latino population in the state, accounting for 17% of youth served. Mid-Michigan
and Flint/Saginaw/Bay Area follow with 9% of their youth served being Latino.
Question Wave V
Total Tri-County SE MI SW MI Mid-Mich GR /
Musk Flint/Sag/ Bay Area
Northern/ UP
Number of Mentoring Organizations 136 39 50 13 16 23 16 18 Youth Served Gender
Males 48% 48% 50% 46% 59% 47% 46% 41% Females 52 52% 50% 54% 41% 53% 54% 59%
Youth Served Race
Caucasian 46% 21% 33% 68% 52% 40% 37% 88% African-American 42 72 61 29 33 33 49 2
Latino / a 7 3 3 2 9 17 9 <1 o For additional youth served demographic data broken down by geographic area, refer to Table 3 in the Appendix.

Mentoring by Geographic Area in the State of Michigan – MMC Wave V
Kahle Research Solutions Inc. Page 14
Waiting List Demographic Profiles o According to Wave V data, there are nearly 3,500 hundred children on waiting lists to be matched with a mentor. Mid-Michigan
leads the state with the largest number of children waiting (933), followed by 688 in Southeast Michigan, 654 of whom are in the Tri-County area. Organizations in Northern Michigan/Upper Peninsula have the smallest waiting lists with 229 youth.
o Furthermore, there are more than 1,800 mentors on state waiting lists to be matched with a child. Again, Mid-Michigan leads the
state with 461 mentors waiting, followed by 379 in Southeast Michigan, with 281 of those in the Tri-County area.
o Many organizations in Mid-Michigan do not maintain gender or race information. About half of the mentors and slightly less than half of the youth on their waiting lists have no race or gender listed.
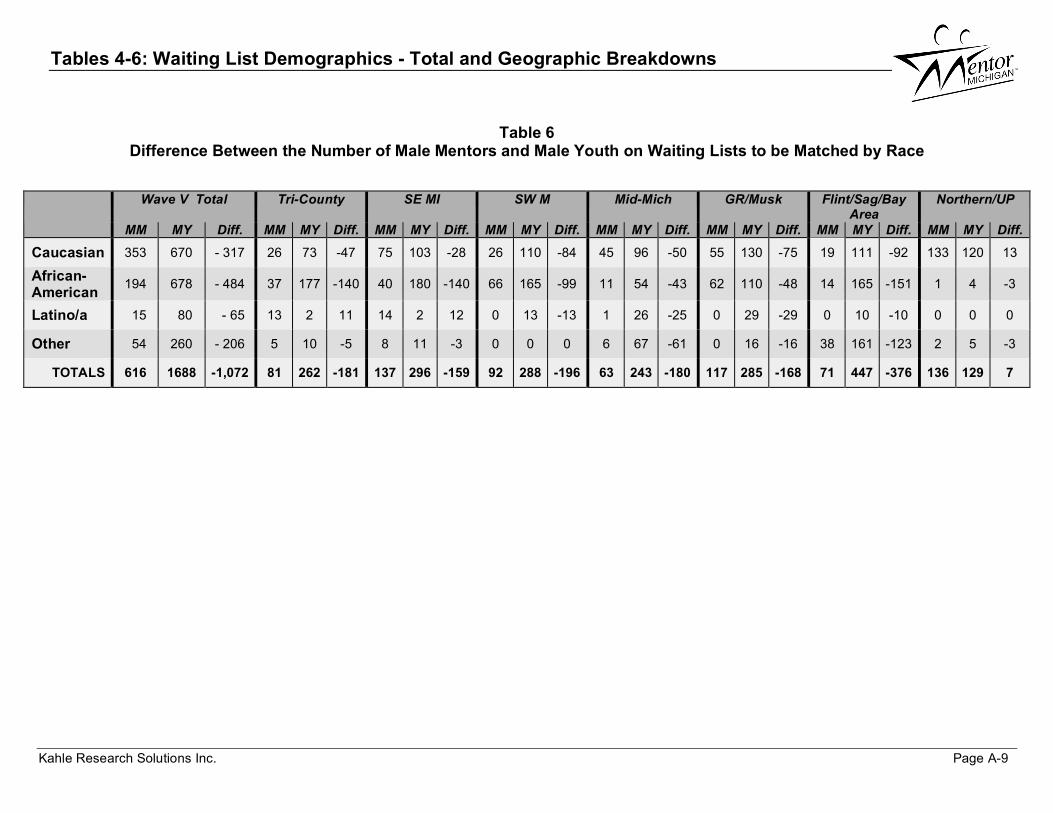
o Assuming same gender matching, more than 1,000 male mentors need to be recruited to befriend boys currently on waiting lists
in the state, more than half of these men of color. Organizations in Flint/Saginaw/Bay Area have the greatest discrepancy between the number of male mentors and male youth on waiting lists. There, 71 male mentors are waiting to be matched with 447 male youth.
o Only in Northern Michigan/Upper Peninsula are there more male mentors (136) than male youth (129) on waiting lists.
Geographic disparities within the region and a lack of cross-organization coordination are possible hypotheses for having a waiting list when the numbers indicate no lack of mentors.
o For full waiting list demographic data broken down by geographic area, refer to Tables 4 – 6 in the Appendix.

Mentoring by Geographic Area in the State of Michigan – MMC Wave V
Kahle Research Solutions Inc. Page 15
Site of Organization and Mentoring Type o One to one mentoring is still by far the most common form practiced in Michigan (66%), with comparatively less group (16%) and
peer (6%) mentoring. This holds true through each geographic breakdown, with Grand Rapids/Muskegon reporting the greatest use of one to one mentoring (81%) and Flint/Saginaw/Bay Area reporting the lowest (38%). (See Table 7 in the Appendix.)
o The use of team mentoring has dropped in Wave V (12%) compared to 23% in Wave IV. This drop is most pronounced in Mid-
Michigan (from 76% in Wave IV to only 9% in Wave V). Despite the state-wide drop, a couple of areas report an increase in team mentoring from last wave. Southwest Michigan has gone from 2% in Wave IV to 21% in Wave V, and Flint/Saginaw/Bay Area organizations report that 30% of their mentoring is team-based now, compared to only 2% in Wave IV.
o In Michigan, 66% of mentoring organizations are housed within non-profits. This is true across all geographic areas of the state.
Schools are the second most common type of mentoring organizations (15% state-wide), with the highest percentage of those (22%) serving Grand Rapids/Muskegon.
Question Wave V
Total Tri-County SE MI SW MI Mid-
Mich GR / Musk
Flint/Sag/ Bay Area
Northern/ UP
Number of Mentoring Organizations 136 39 50 13 16 23 16 18 Site of Organization
Nonprofit 66% 62% 62% 77% 81% 65% 50% 72% School 15 13 12 15 13 22 13 17
Government 6 5 6 0 0 4 19 6 Faith-based organization 4 10 10 0 0 4 0 0
Higher Education Institute 4 5 6 8 0 4 6 0 Business 1 0 0 0 6 0 0 0
Other 4 5 4 0 0 0 13 6 Mentoring Type
One to One 66% 57% 59% 77% 73% 81% 38% 51% Group 16 20 21 2 13 12 32 9
Peer 6 11 10 <1 5 1 0 34 Team 12 11 9 21 9 4 30 6
E-mentoring <1 <1 <1 0 0 1 0 0
Mentoring by Geographic Area in the State of Michigan – MMC Wave V
Kahle Research Solutions Inc. Page 16
Mentoring Capacity
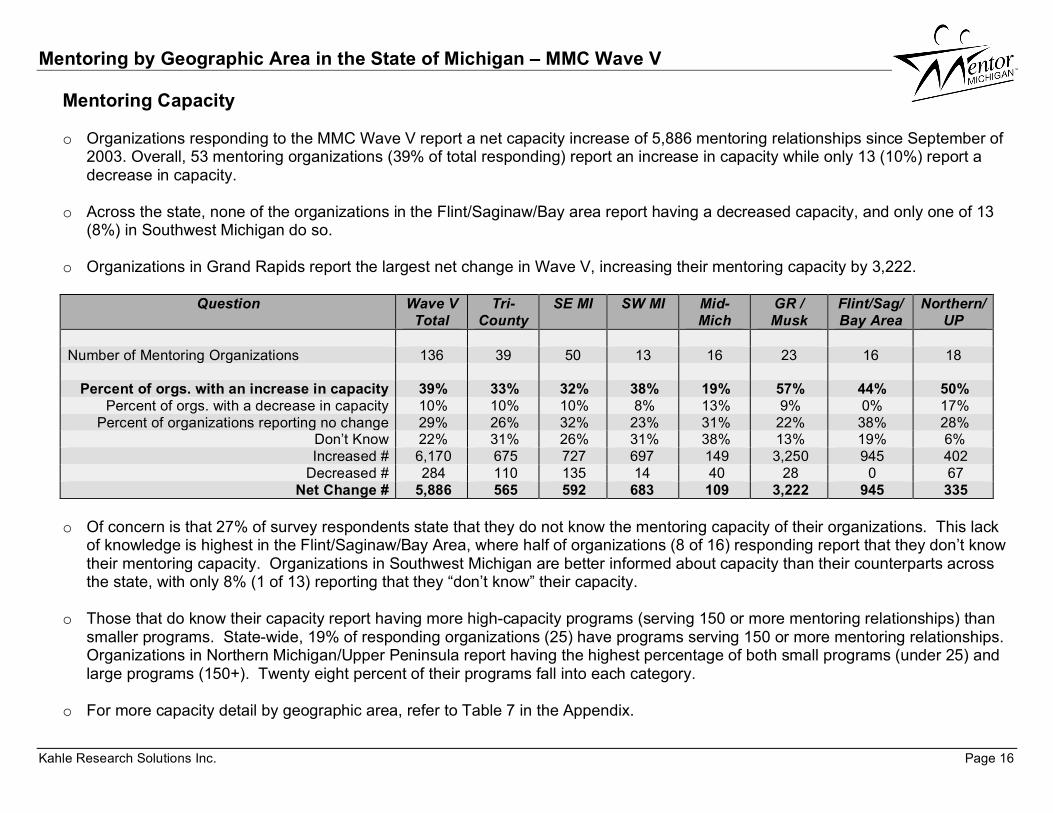
o Organizations responding to the MMC Wave V report a net capacity increase of 5,886 mentoring relationships since September of 2003. Overall, 53 mentoring organizations (39% of total responding) report an increase in capacity while only 13 (10%) report a decrease in capacity.
o Across the state, none of the organizations in the Flint/Saginaw/Bay area report having a decreased capacity, and only one of 13
(8%) in Southwest Michigan do so.
o Organizations in Grand Rapids report the largest net change in Wave V, increasing their mentoring capacity by 3,222.
Question Wave V Total
Tri-County
SE MI SW MI Mid-Mich
GR / Musk
Flint/Sag/ Bay Area
Northern/ UP
Number of Mentoring Organizations 136 39 50 13 16 23 16 18
Percent of orgs. with an increase in capacity 39% 33% 32% 38% 19% 57% 44% 50% Percent of orgs. with a decrease in capacity 10% 10% 10% 8% 13% 9% 0% 17%
Percent of organizations reporting no change 29% 26% 32% 23% 31% 22% 38% 28% Don’t Know 22% 31% 26% 31% 38% 13% 19% 6% Increased # 6,170 675 727 697 149 3,250 945 402
Decreased # 284 110 135 14 40 28 0 67 Net Change # 5,886 565 592 683 109 3,222 945 335
o Of concern is that 27% of survey respondents state that they do not know the mentoring capacity of their organizations. This lack
of knowledge is highest in the Flint/Saginaw/Bay Area, where half of organizations (8 of 16) responding report that they don’t know their mentoring capacity. Organizations in Southwest Michigan are better informed about capacity than their counterparts across the state, with only 8% (1 of 13) reporting that they “don’t know” their capacity.
o Those that do know their capacity report having more high-capacity programs (serving 150 or more mentoring relationships) than
smaller programs. State-wide, 19% of responding organizations (25) have programs serving 150 or more mentoring relationships. Organizations in Northern Michigan/Upper Peninsula report having the highest percentage of both small programs (under 25) and large programs (150+). Twenty eight percent of their programs fall into each category.
o For more capacity detail by geographic area, refer to Table 7 in the Appendix.
Mentoring by Geographic Area in the State of Michigan – MMC Wave V
Kahle Research Solutions Inc. Page 17
Mentoring Program Budgets
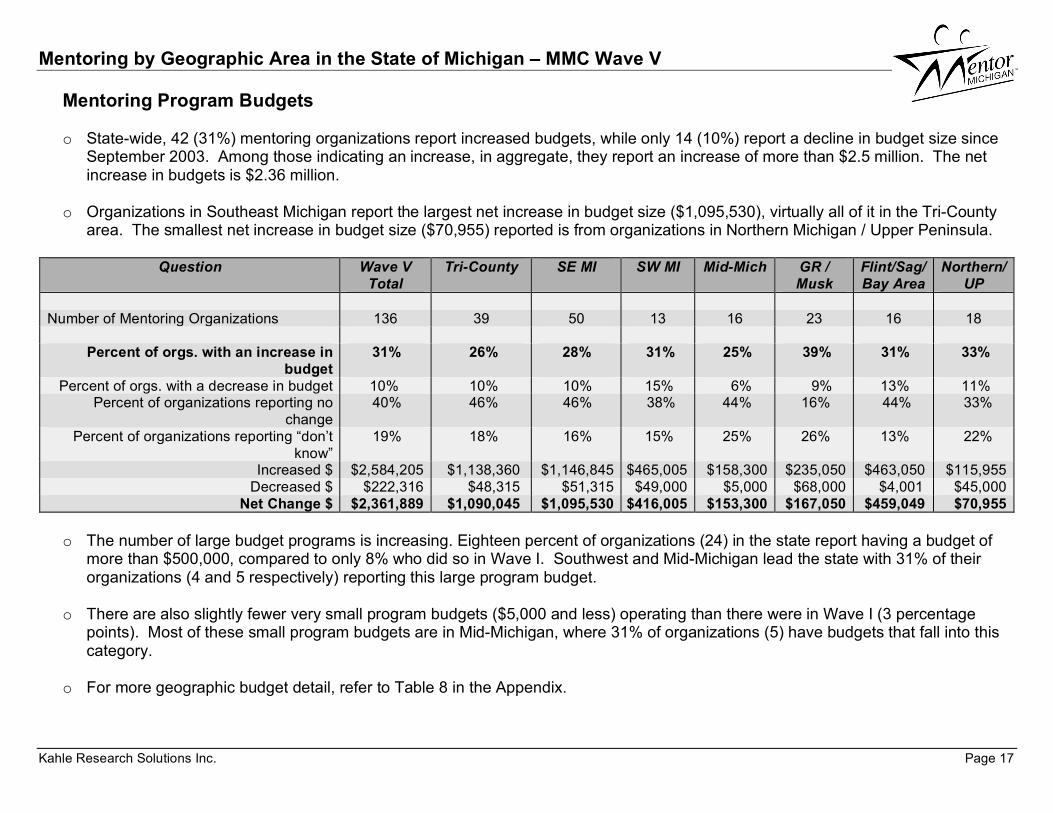
o State-wide, 42 (31%) mentoring organizations report increased budgets, while only 14 (10%) report a decline in budget size since September 2003. Among those indicating an increase, in aggregate, they report an increase of more than $2.5 million. The net increase in budgets is $2.36 million.
o Organizations in Southeast Michigan report the largest net increase in budget size ($1,095,530), virtually all of it in the Tri-County
area. The smallest net increase in budget size ($70,955) reported is from organizations in Northern Michigan / Upper Peninsula.
Question Wave V Total
Tri-County SE MI SW MI Mid-Mich GR / Musk
Flint/Sag/ Bay Area
Northern/ UP
Number of Mentoring Organizations 136 39 50 13 16 23 16 18
Percent of orgs. with an increase in budget
31% 26% 28% 31% 25% 39% 31% 33%
Percent of orgs. with a decrease in budget 10% 10% 10% 15% 6% 9% 13% 11% Percent of organizations reporting no
change 40% 46% 46% 38% 44% 16% 44% 33%
Percent of organizations reporting “don’t know”
19% 18% 16% 15% 25% 26% 13% 22%
Increased $ $2,584,205 $1,138,360 $1,146,845 $465,005 $158,300 $235,050 $463,050 $115,955 Decreased $ $222,316 $48,315 $51,315 $49,000 $5,000 $68,000 $4,001 $45,000
Net Change $ $2,361,889 $1,090,045 $1,095,530 $416,005 $153,300 $167,050 $459,049 $70,955
o The number of large budget programs is increasing. Eighteen percent of organizations (24) in the state report having a budget of more than $500,000, compared to only 8% who did so in Wave I. Southwest and Mid-Michigan lead the state with 31% of their organizations (4 and 5 respectively) reporting this large program budget.
o There are also slightly fewer very small program budgets ($5,000 and less) operating than there were in Wave I (3 percentage
points). Most of these small program budgets are in Mid-Michigan, where 31% of organizations (5) have budgets that fall into this category.
o For more geographic budget detail, refer to Table 8 in the Appendix.
Mentoring by Geographic Area in the State of Michigan – MMC Wave V
Kahle Research Solutions Inc. Page 18
Organizational Characteristics
Mission o Ninety seven percent of organizations report that they have a mission statement, a slight increase (3 percentage points) from Wave
I.
o Forty-four percent of organizations (60) report that mentoring programs are one of several areas of focus for them (up from 36% in Wave I), rather than their primary focus. Organizations in Southwest Michigan report this level of program focus (62%) more than any other area.
o Organizations whose primary focus is mentoring account for 36% of reporting organizations (down from 40% in Wave I). In the
Flint/Saginaw/Bay Area and Northern Michigan/Upper Peninsula geographic areas, half of their organizations identify mentoring as their primary purpose.
Mentoring Program Duration
o More than half of the reporting organizations in the state have been operating mentoring programs for five years or more, and 40%, or a total of 54, have been doing so for more than 10 years. This compares to Wave I, when 44% of organizations reported operating programs for that length of time.
o Organizations operating new mentoring programs (1 year or less) account for 7% of the total mentoring programs. On average,
Michigan’s mentoring organizations are slightly more experienced than they were in September 2003.
o Southwest Michigan leads the state in programs with longevity. Sixty-two percent of organizations (8) in this area have been operating mentoring programs for more than 10 years.
o In Northern Michigan /UP, there is new growth in mentoring programs. Twenty-two percent of organizations there report that their
mentoring programs are new.

Mentoring by Geographic Area in the State of Michigan – MMC Wave V
Kahle Research Solutions Inc. Page 19
Awareness and Use of MM’s Quality Program Standards for Youth Mentoring o State-wide 79% of organizations report being aware of the Quality Programs Standards for Youth Mentoring. Awareness is
highest in Grand Rapids/Muskegon (91%), the Tri-County area (85%) and Northern Michigan/Upper Peninsula (83%). Organizations in Flint/Saginaw/Bay Area report the lowest level of awareness (56%).
o Sixty-nine percent of Michigan mentoring programs have used the Self-Assessment tool, and 93% of those who have used it
report that it helped identify areas of improvement. Use of the tool is highest in Grand Rapids/Muskegon, where 81% report using it and 94% report that it helped. While a smaller percentage of organizations in Southwest Michigan, Mid-Michigan, and Flint/Saginaw/Bay Area have used the tool (40%, 50%, and 56% respectively), they have enjoyed the most success with it. One hundred percent of those organizations report that using the tool helped to identify areas of improvement.
o Those who do not use the self-assessment tool most often cite lack of time, lack of awareness, or use of other tools and standards
as reasons for not using the one developed by Mentor Michigan. In addition, a few indicate that the tool does not apply to their organization.
o For more detail on awareness across geographic areas, see Table 9 in the Appendix. For more detail on organizations’ reasons
for not using the self-assessment tool state-wide, see the report, “Scope and Nature of Mentoring in Michigan”, available at www.michigan.gov/mentormichigan
Mentoring by Geographic Area in the State of Michigan – MMC Wave V
Kahle Research Solutions Inc. Page 20
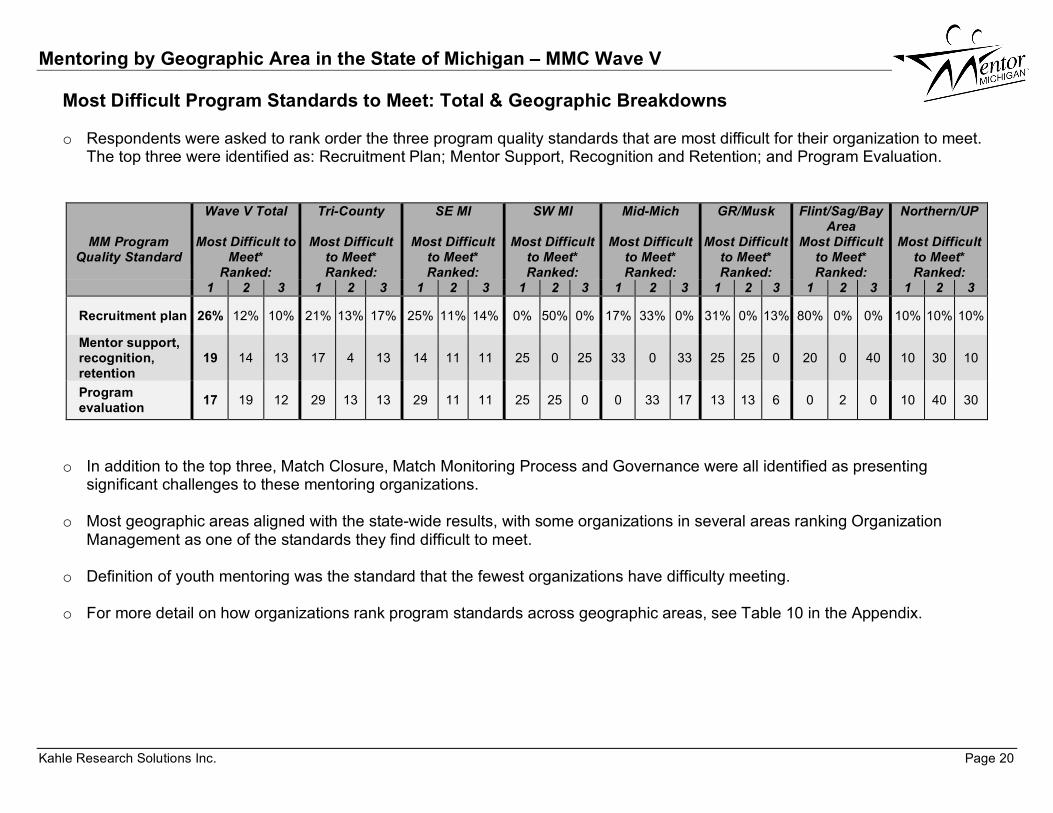
Most Difficult Program Standards to Meet: Total & Geographic Breakdowns o Respondents were asked to rank order the three program quality standards that are most difficult for their organization to meet.
The top three were identified as: Recruitment Plan; Mentor Support, Recognition and Retention; and Program Evaluation.
MM Program Quality Standard
Wave V Total
Most Difficult to Meet*
Ranked:
Tri-County
Most Difficult to Meet* Ranked:
SE MI
Most Difficult to Meet* Ranked:
SW MI
Most Difficult to Meet* Ranked:
Mid-Mich
Most Difficult to Meet* Ranked:
GR/Musk
Most Difficult to Meet* Ranked:
Flint/Sag/Bay Area
Most Difficult to Meet* Ranked:
Northern/UP
Most Difficult to Meet* Ranked:
1 2 3 1 2 3 1 2 3 1 2 3 1 2 3 1 2 3 1 2 3 1 2 3
Recruitment plan 26% 12% 10% 21% 13% 17% 25% 11% 14% 0% 50% 0% 17% 33% 0% 31% 0% 13% 80% 0% 0% 10% 10% 10%
Mentor support, recognition, retention
19 14 13 17 4 13 14 11 11 25 0 25 33 0 33 25 25 0 20 0 40 10 30 10
Program evaluation 17 19 12 29 13 13 29 11 11 25 25 0 0 33 17 13 13 6 0 2 0 10 40 30
o In addition to the top three, Match Closure, Match Monitoring Process and Governance were all identified as presenting significant challenges to these mentoring organizations.
o Most geographic areas aligned with the state-wide results, with some organizations in several areas ranking Organization
Management as one of the standards they find difficult to meet.
o Definition of youth mentoring was the standard that the fewest organizations have difficulty meeting.
o For more detail on how organizations rank program standards across geographic areas, see Table 10 in the Appendix.

Mentoring by Geographic Area in the State of Michigan – MMC Wave V
Kahle Research Solutions Inc. Page 21
Reasons the Standards are Difficult to Meet / Support Needed o In general, organizations note that lack of staff, lack of time, and lack of funding are all impediments to their success in meeting the
standards. An increase in any one of these three areas could assist these organizations in doing so.
“The biggest obstacle is time and second money - which relate because if there was more funding for the program then the coordinator would have more time to recruit, monitor and do match closure. Our Mentor Coordinator only works part time and we have over 150 mentors (both adult and peer). Without further funding it is questionable how long this can continue.”
o Consistent with past research, a lack of mentors, especially males, is a critical impediment for these mentoring organizations.
“Because of the (lack of) male mentors, recruitment is always something we have to work on.” o For some organizations, the uniqueness of their program makes meeting some of the standards a challenge.
“It is all a function of our program design being school-based, and not the standard. Our kids just drop out of school unexpectedly, so it is difficult to have the proper closure with the school-based relationship. Because we are school-based during the work day and our kids have very diverse career interests, it is difficult to stick to our matching policy at times.”
o Organizations also express a need for partnerships to provide guidance from Mentor Michigan and any other organization with
expertise to offer.
“We need a partnership with researchers from a university who are expert at mentoring programs, relationships, et al.” o For more detail on the challenges organizations state-wide face attempting to meet the standards, see the report, “Scope and
Nature of Mentoring in Michigan”, available at www.michigan.gov/mentormichigan
Mentoring by Geographic Area in the State of Michigan – MMC Wave V
Kahle Research Solutions Inc. Page 22
Satisfaction with Mentor Michigan o Satisfaction with Mentor Michigan is high among survey respondents. Eighty-five percent of respondents indicate that they are
“very” or “somewhat” satisfied with its work. Satisfaction is highest in Grand Rapids/Muskegon (91%) and Southeast Michigan (90%).
o Dissatisfaction with Mentor Michigan, while small, is expressed in most geographic areas, ranging from a low of 3% in the Tri-
County area to a high of 8% in Southwest Michigan. Grand Rapids/Muskegon is the only area that does not express any dissatisfaction with Mentor Michigan.
o Likewise, most areas have a small percentage of organizations that are not aware of the work of Mentor Michigan. Southwest
Michigan leads in this category with 8%.
o For more detail on satisfaction with Mentor Michigan across geographic areas, see Table 11 in the Appendix.
Involvement with Mentor Michigan
o Ninety six percent of the mentoring organizations reporting they have used at least one of Mentor Michigan’s Services in Wave V. State-wide organizations cite the MM website, email “listserv”, presentations by the First Gentleman, and training at the top of the list of the services used. One hundred percent of organizations in Mid-Michigan and Northern Michigan/Upper Peninsula report having visited the MM website, the only category to reach 100%.
o Thirty-one percent of organizations in the state report using the National Mentoring Tool-kit, yet only 6% of those in Mid-Michigan
report doing so.
o Organizations in Flint/Saginaw/Bay Area do not seem to be taking advantage of MM services fully. While 4% of organizations state-wide report that they have not used any of the listed MM services, 19% of those in this geographic area indicate they have not.
o For more detail on involvement with Mentor Michigan across geographic areas, see Table 12 in the Appendix.

Appendix
Geographic Tables
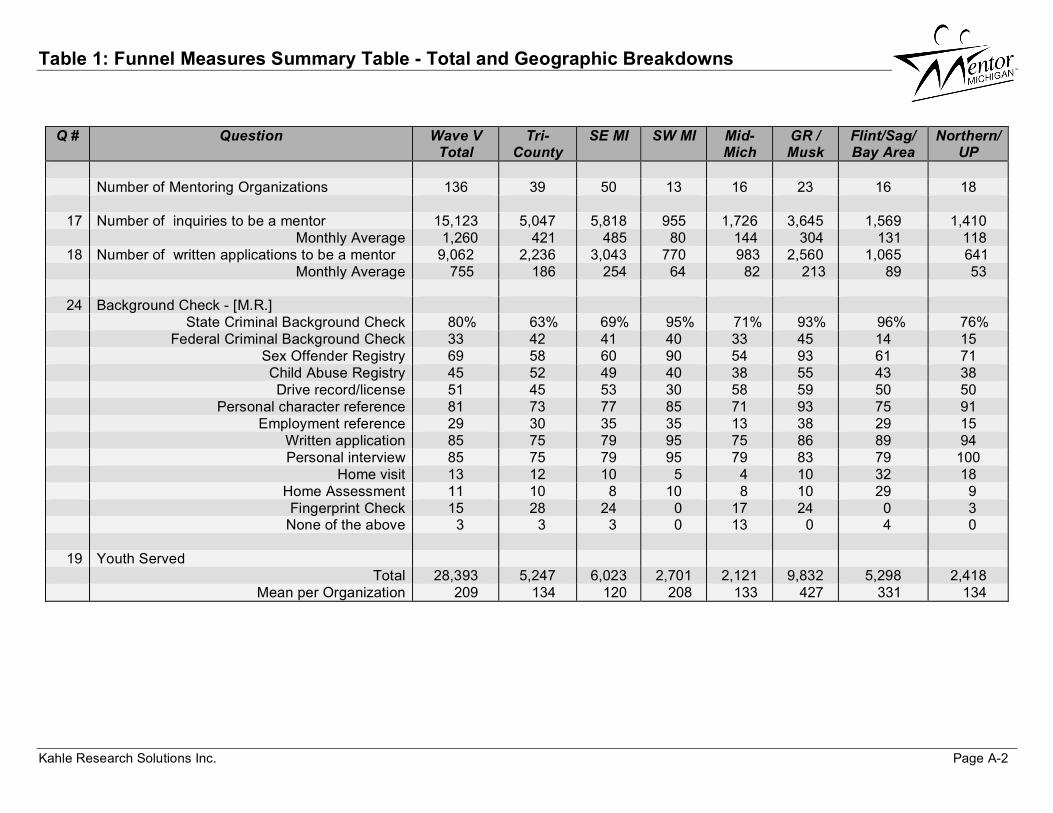
Table 1: Funnel Measures Summary Table - Total and Geographic Breakdowns
Kahle Research Solutions Inc. Page A-2
Q #
Question Wave V Total
Tri-County
SE MI SW MI Mid-Mich
GR / Musk
Flint/Sag/ Bay Area
Northern/ UP
Number of Mentoring Organizations 136 39 50 13 16 23 16 18
17 Number of inquiries to be a mentor 15,123 5,047 5,818 955 1,726 3,645 1,569 1,410 Monthly Average 1,260 421 485 80 144 304 131 118
18 Number of written applications to be a mentor 9,062 2,236 3,043 770 983 2,560 1,065 641 Monthly Average 755 186 254 64 82 213 89 53
24 Background Check - [M.R.] State Criminal Background Check 80% 63% 69% 95% 71% 93% 96% 76% Federal Criminal Background Check 33 42 41 40 33 45 14 15 Sex Offender Registry 69 58 60 90 54 93 61 71 Child Abuse Registry 45 52 49 40 38 55 43 38 Drive record/license 51 45 53 30 58 59 50 50 Personal character reference 81 73 77 85 71 93 75 91 Employment reference 29 30 35 35 13 38 29 15 Written application 85 75 79 95 75 86 89 94 Personal interview 85 75 79 95 79 83 79 100 Home visit 13 12 10 5 4 10 32 18 Home Assessment 11 10 8 10 8 10 29 9 Fingerprint Check 15 28 24 0 17 24 0 3 None of the above 3 3 3 0 13 0 4 0
19 Youth Served Total 28,393 5,247 6,023 2,701 2,121 9,832 5,298 2,418 Mean per Organization 209 134 120 208 133 427 331 134

Table 1: Funnel Measures Summary Table - Total and Geographic Breakdowns
Kahle Research Solutions Inc. Page A-3
Q #
Question Wave V Total
Tri-County
SE MI SW MI Mid-Mich
GR / Musk
Flint/Sag/ Bay Area
Northern/ UP
23 Total number of matches
Percent of organizations reporting an increase 51% 40% 44% 45% 38% 69% 64% 53% Percent of organizations reporting a decrease 15% 20% 18% 20% 17% 10% 4% 21% Percent of organizations reporting no change 24% 33% 33% 20% 21% 14% 25% 18% Don’t Know 9% 7% 5% 15% 25% 7% 7% 9% Increased # 3,910 555 713 650 230 951 1,147 219 Decreased # 1,078 292 355 262 144 128 5 184 Net Change # 2,832 263 358 388 86 823 1,142 35 22 Active mentors 20,603 2,848 3,518 2,134 1,655 8,920 2,690 1,686 37 Mentors currently on waiting list 1,827 281 379 187 481 263 243 274 38 Youth currently on waiting list 3,407 654 688 414 933 527 616 229 26 Minimum time of mentor/youth match No minimum 9% 7% 5% 20% 8% 3% 21% 6% 1-2 months 2 0 0 0 13 3 0 0 3-5 months 5 3 4 5 0 7 11 3 6-8 months 15 12 13 15 25 14 11 21 9-11 months 18 18 21 35 4 21 7 18 12 months 43 52 46 25 50 41 36 50 More than 12 Months, less than 2 years 3 0 0 0 0 10 7 3 More than 2 years, less than 5 years 2 3 5 0 0 0 0 0 More than 5 years 1 0 3 0 0 0 4 0 Don’t know 2 5 4 0 0 0 4 0

Table 1: Funnel Measures Summary Table - Total and Geographic Breakdowns
Kahle Research Solutions Inc. Page A-4
Q # Question Wave V Total
Tri-County
SE MI SW MI Mid-Mich
GR / Musk
Flint/Sag/ Bay Area
Northern/ UP
27 Average time for mentor/youth match
No minimum 5% 8% 6% 0% 4% 0% 18% 0% 1 – 2 months 2 2 1 0 8 3 0 3 3 – 5 months 3 3 4 5 8 0 0 0 6 – 8 months 16 10 12 20 13 24 14 24 9 – 11 months 19 28 28 15 17 7 14 15 12 months 21 25 22 0 25 21 25 24 More than 12 months, less than 2 years 15 8 10 20 8 21 21 18 More than 2 years, less than 5 years 10 7 6 30 0 17 4 15 More than 5 years 2 0 3 5 0 0 4 0 Don’t know 7 8 8 5 17 7 0 3
28 Minimum time per week for mentor/youth match No minimum 14% 27% 21% 10% 13% 10% 18% 3% 30 minutes / week 8 10 10 10 0 10 0 12 1 hour / week 48 35 40 60 50 38 57 62 2 hours / week 15 12 14 5 25 28 7 9 3 hours / week 4 3 3 0 0 10 4 6 4 hours / week 4 2 4 10 4 0 7 3 5 hours / week 0 0 0 0 4 0 0 0 6 hours / week 0 2 1 0 0 0 0 0 More than 6 hours / week 4 3 3 5 4 3 7 3 Don’t know 2 7 5 0 0 0 0 3
25 Number of hours in-person training for mentors None 6% 3% 6% 5% 13% 3% 11% 0% Less than 1 hour 8 3 3 25 13 14 4 6 1 – 2 hours 30 27 27 25 29 24 39 35 2 – 4 hours 22 28 26 20 29 21 7 24 4 – 6 hours 11 8 8 10 13 14 18 12 6 – 8 hours 7 8 6 5 0 10 0 15 9 or more hours 15 18 22 10 4 14 21 9 Don’t know 1 3 3 0 0 0 0 0
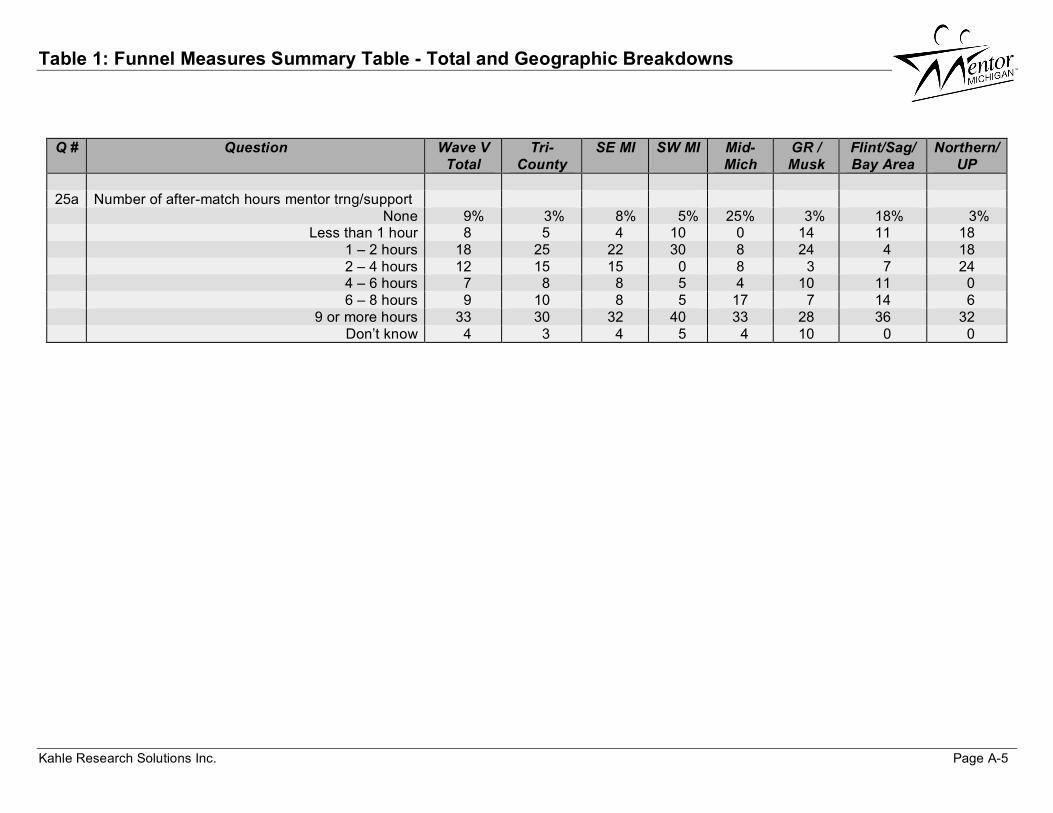
Table 1: Funnel Measures Summary Table - Total and Geographic Breakdowns
Kahle Research Solutions Inc. Page A-5
Q # Question Wave V Total
Tri-County
SE MI SW MI Mid-Mich
GR / Musk
Flint/Sag/ Bay Area
Northern/ UP
25a Number of after-match hours mentor trng/support
None 9% 3% 8% 5% 25% 3% 18% 3% Less than 1 hour 8 5 4 10 0 14 11 18 1 – 2 hours 18 25 22 30 8 24 4 18 2 – 4 hours 12 15 15 0 8 3 7 24 4 – 6 hours 7 8 8 5 4 10 11 0 6 – 8 hours 9 10 8 5 17 7 14 6 9 or more hours 33 30 32 40 33 28 36 32 Don’t know 4 3 4 5 4 10 0 0
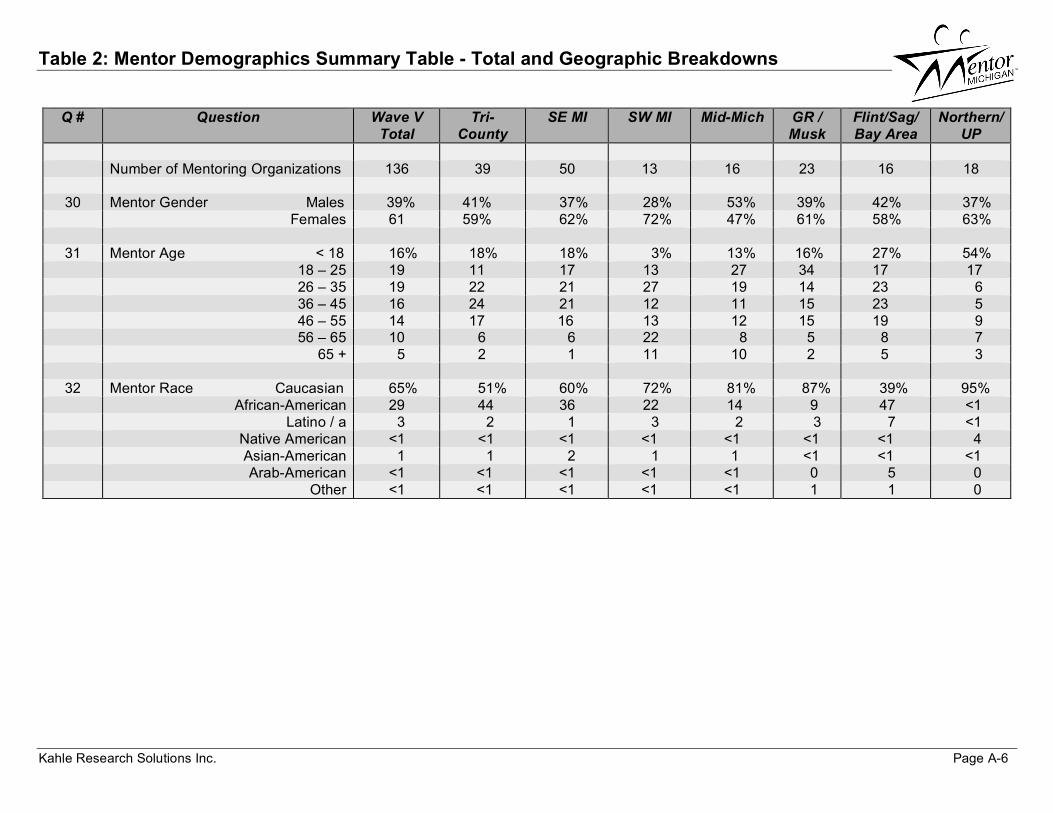
Table 2: Mentor Demographics Summary Table - Total and Geographic Breakdowns
Kahle Research Solutions Inc. Page A-6
Q #
Question Wave V Total
Tri-County
SE MI SW MI Mid-Mich GR / Musk
Flint/Sag/ Bay Area
Northern/ UP
Number of Mentoring Organizations 136 39 50 13 16 23 16 18
30 Mentor Gender Males 39% 41% 37% 28% 53% 39% 42% 37% Females 61 59% 62% 72% 47% 61% 58% 63%
31 Mentor Age < 18 16% 18% 18% 3% 13% 16% 27% 54% 18 – 25 19 11 17 13 27 34 17 17 26 – 35 19 22 21 27 19 14 23 6 36 – 45 16 24 21 12 11 15 23 5 46 – 55 14 17 16 13 12 15 19 9 56 – 65 10 6 6 22 8 5 8 7 65 + 5 2 1 11 10 2 5 3
32 Mentor Race Caucasian 65% 51% 60% 72% 81% 87% 39% 95% African-American 29 44 36 22 14 9 47 <1 Latino / a 3 2 1 3 2 3 7 <1 Native American <1 <1 <1 <1 <1 <1 <1 4 Asian-American 1 1 2 1 1 <1 <1 <1 Arab-American <1 <1 <1 <1 <1 0 5 0 Other <1 <1 <1 <1 <1 1 1 0
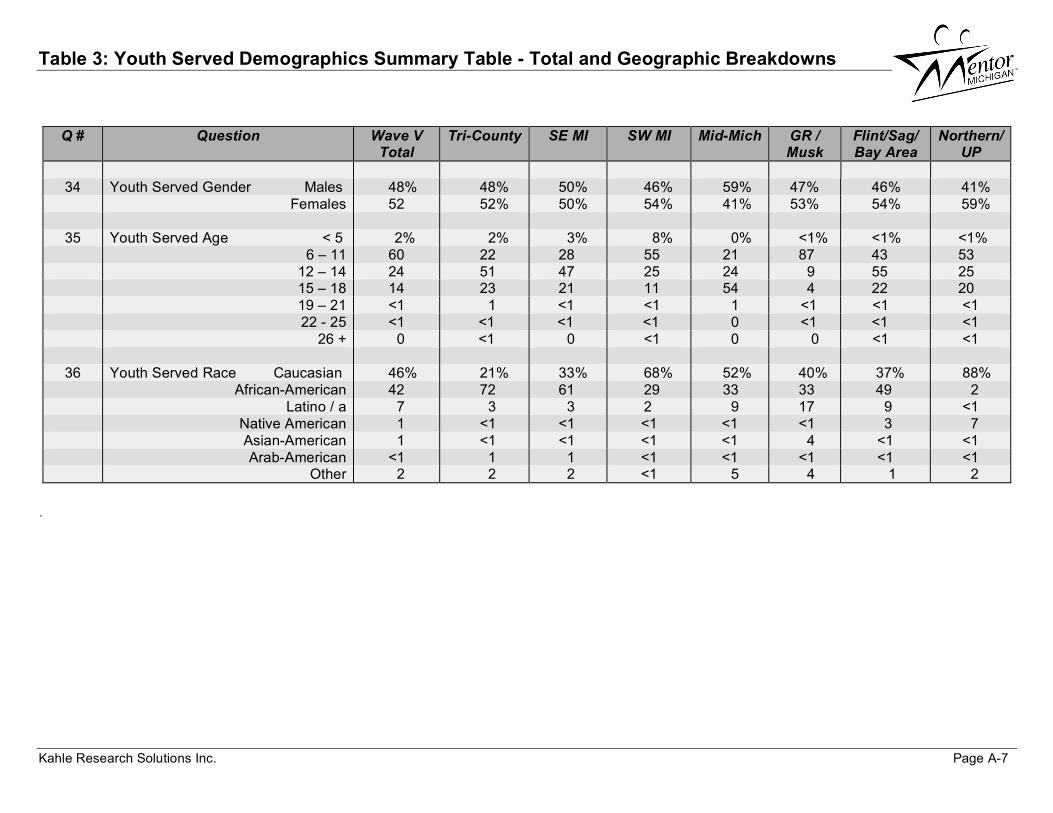
Table 3: Youth Served Demographics Summary Table - Total and Geographic Breakdowns
Kahle Research Solutions Inc. Page A-7
Q #
Question Wave V Total
Tri-County SE MI SW MI Mid-Mich GR / Musk
Flint/Sag/ Bay Area
Northern/ UP
34 Youth Served Gender Males 48% 48% 50% 46% 59% 47% 46% 41%
Females 52 52% 50% 54% 41% 53% 54% 59%
35 Youth Served Age < 5 2% 2% 3% 8% 0% <1% <1% <1% 6 – 11 60 22 28 55 21 87 43 53 12 – 14 24 51 47 25 24 9 55 25 15 – 18 14 23 21 11 54 4 22 20 19 – 21 <1 1 <1 <1 1 <1 <1 <1 22 - 25 <1 <1 <1 <1 0 <1 <1 <1 26 + 0 <1 0 <1 0 0 <1 <1
36 Youth Served Race Caucasian 46% 21% 33% 68% 52% 40% 37% 88% African-American 42 72 61 29 33 33 49 2 Latino / a 7 3 3 2 9 17 9 <1 Native American 1 <1 <1 <1 <1 <1 3 7 Asian-American 1 <1 <1 <1 <1 4 <1 <1 Arab-American <1 1 1 <1 <1 <1 <1 <1 Other 2 2 2 <1 5 4 1 2
.

Tables 4-6: Waiting List Demographics - Total and Geographic Breakdowns
Kahle Research Solutions Inc. Page A-8
Table 4 Number of Youth on Waiting Lists to be matched by Gender and Race
Wave V Total Tri-County SE MI SW M Mid-Mich GR/Musk Flint/Sag/Bay
Area Northern/UP
M F Total M F Total M F Total M F Total M F Total M F Total M F Total M F Total
Caucasian 670 355 1025 73 51 124 103 51 154 110 30 140 96 60 156 130 94 224 111 36 147 120 84 204
African-American 678 440 1118 177 115 292 180 115 295 165 87 252 54 63 117 110 85 195 165 88 253 4 2 6
Latino/a 80 55 135 2 2 4 2 2 4 13 9 22 26 15 41 29 25 54 10 4 14 0 0 0
Other 260 103 363 10 8 18 11 8 19 0 0 0 67 39 106 16 13 29 161 41 202 5 2 7
No race / ethnicity data
766 216 216 0 513 25 0 12
TOTALS 1,688 953 3,407 262 176 654 296 176 688 288 126 414 243 177 933 285 217 527 447 169 616 129 88 229
Table 5 Number of Mentors on Waiting Lists to be matched by Gender and Race
Wave V Total Tri-County SE MI SW M Mid-Mich GR/Musk Flint/Sag/Bay
Area Northern/UP
M F Total M F Total M F Total M F Total M F Total M F Total M F Total M F Total
Caucasian 353 518 871 26 55 81 75 92 167 26 41 67 45 144 189 55 57 112 19 58 77 133 126 259
African-American 194 286 480 37 81 118 40 84 124 66 54 120 11 28 39 62 80 142 14 38 52 1 2 3
Latino/a 15 28 43 13 19 32 14 19 33 0 0 0 1 6 7 0 1 1 0 2 2 0 0 0
Other 54 86 140 5 6 11 8 8 16 0 0 0 6 10 16 0 5 5 38 62 100 2 1 3
No race / ethnicity data
293 39 39 0 230 3 12 9
TOTALS 616 918 1,827 81 161 281 137 203 379 92 95 187 63 188 461 117 143 263 71 160 243 136 129 274
Tables 4-6: Waiting List Demographics - Total and Geographic Breakdowns
Kahle Research Solutions Inc. Page A-9
Table 6 Difference Between the Number of Male Mentors and Male Youth on Waiting Lists to be Matched by Race
Wave V Total Tri-County SE MI SW M Mid-Mich GR/Musk Flint/Sag/Bay Area
Northern/UP
MM MY Diff. MM MY Diff. MM MY Diff. MM MY Diff. MM MY Diff. MM MY Diff. MM MY Diff. MM MY Diff.
Caucasian 353 670 - 317 26 73 -47 75 103 -28 26 110 -84 45 96 -50 55 130 -75 19 111 -92 133 120 13
African-American 194 678 - 484 37 177 -140 40 180 -140 66 165 -99 11 54 -43 62 110 -48 14 165 -151 1 4 -3
Latino/a 15 80 - 65 13 2 11 14 2 12 0 13 -13 1 26 -25 0 29 -29 0 10 -10 0 0 0
Other 54 260 - 206 5 10 -5 8 11 -3 0 0 0 6 67 -61 0 16 -16 38 161 -123 2 5 -3
TOTALS 616 1688 -1,072 81 262 -181 137 296 -159 92 288 -196 63 243 -180 117 285 -168 71 447 -376 136 129 7
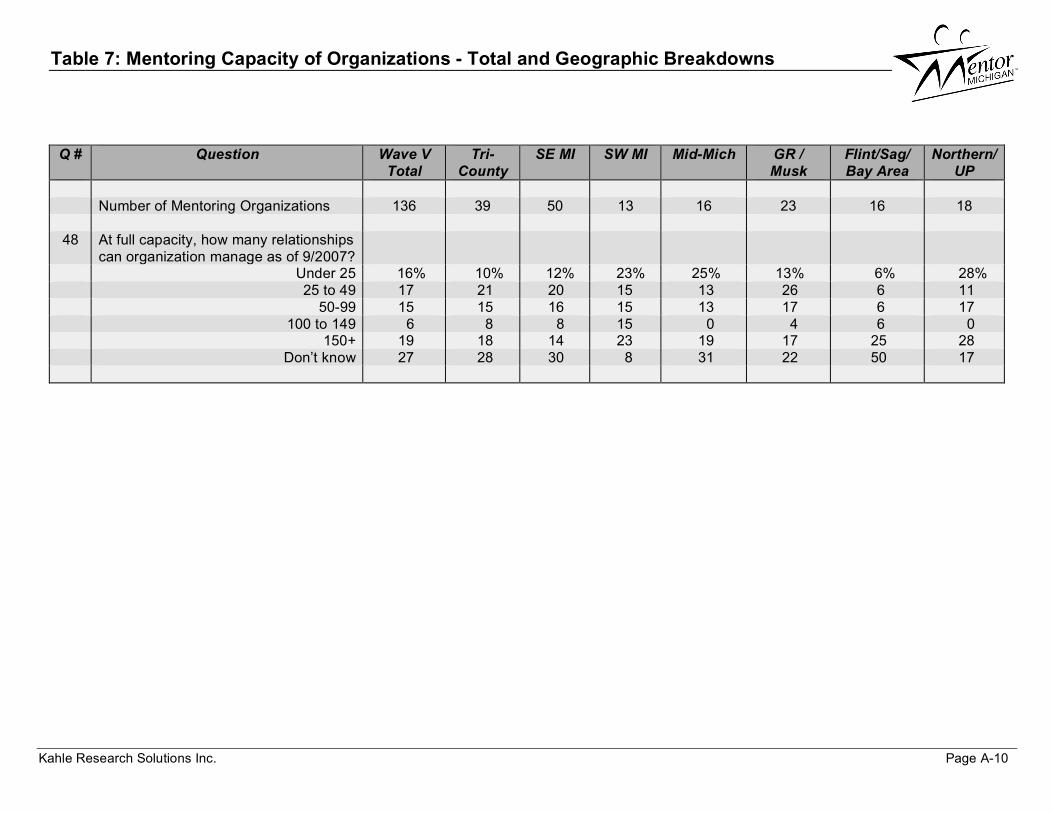
Table 7: Mentoring Capacity of Organizations - Total and Geographic Breakdowns
Kahle Research Solutions Inc. Page A-10
Q #
Question Wave V Total
Tri-County
SE MI SW MI Mid-Mich GR / Musk
Flint/Sag/ Bay Area
Northern/ UP
Number of Mentoring Organizations 136 39 50 13 16 23 16 18
48 At full capacity, how many relationships can organization manage as of 9/2007?
Under 25 16% 10% 12% 23% 25% 13% 6% 28% 25 to 49 17 21 20 15 13 26 6 11 50-99 15 15 16 15 13 17 6 17 100 to 149 6 8 8 15 0 4 6 0 150+ 19 18 14 23 19 17 25 28 Don’t know 27 28 30 8 31 22 50 17
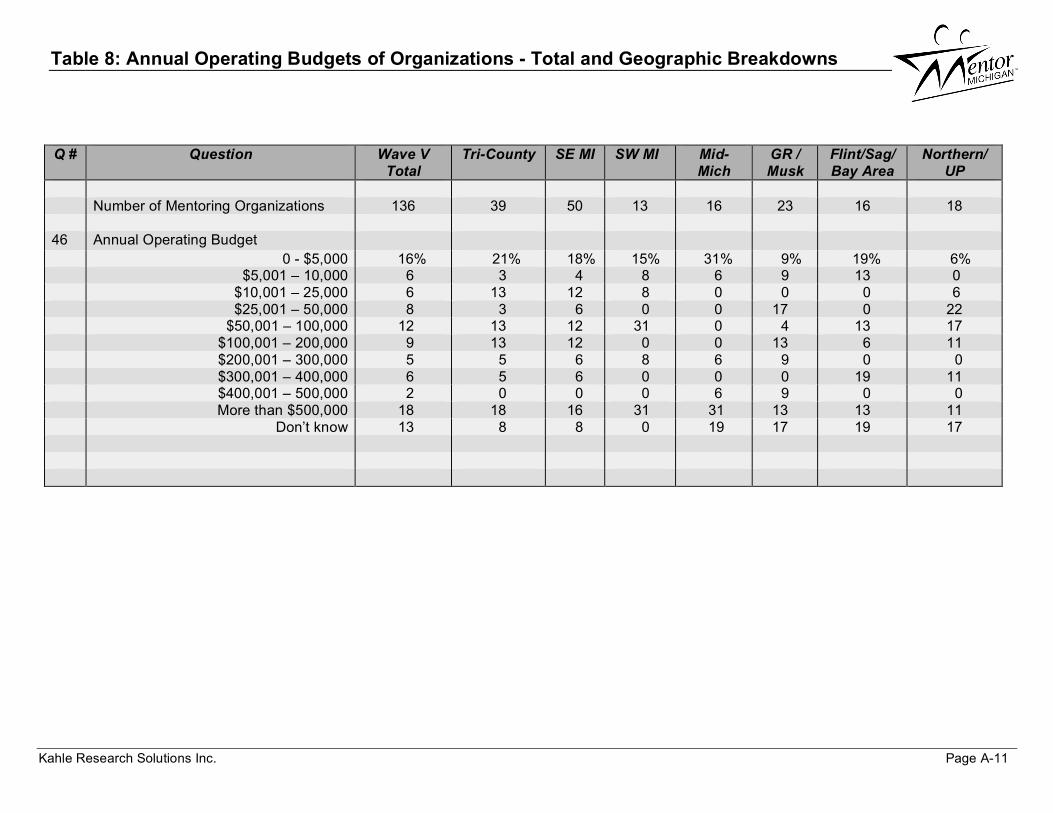
Table 8: Annual Operating Budgets of Organizations - Total and Geographic Breakdowns
Kahle Research Solutions Inc. Page A-11
Q #
Question Wave V Total
Tri-County SE MI SW MI Mid-Mich
GR / Musk
Flint/Sag/ Bay Area
Northern/ UP
Number of Mentoring Organizations 136 39 50 13 16 23 16 18 46 Annual Operating Budget 0 - $5,000 16% 21% 18% 15% 31% 9% 19% 6% $5,001 – 10,000 6 3 4 8 6 9 13 0 $10,001 – 25,000 6 13 12 8 0 0 0 6 $25,001 – 50,000 8 3 6 0 0 17 0 22 $50,001 – 100,000 12 13 12 31 0 4 13 17 $100,001 – 200,000 9 13 12 0 0 13 6 11 $200,001 – 300,000 5 5 6 8 6 9 0 0 $300,001 – 400,000 6 5 6 0 0 0 19 11 $400,001 – 500,000 2 0 0 0 6 9 0 0 More than $500,000 18 18 16 31 31 13 13 11 Don’t know 13 8 8 0 19 17 19 17

Table 9: MM’s Quality Program Standards for Youth Mentoring - Total & Geographic Breakdowns
Kahle Research Solutions Inc. Page A-12
Q #
Question Wave V Total
Tri-County
SE MI SW MI Mid-Mich GR / Musk Flint/Sag/ Bay Area
Northern/ UP
Number of Mentoring Organizations 136 39 50 13 16 23 16 18
53 Aware of MM Quality Program Standards? Yes 79% 85% 82% 77% 75% 91% 56% 83% No 15 10 12 8 25 9 44 6 Don’t Know 5 5 6 15 0 0 0 11
54 Org. used the MM Quality Program Standards Self-Assessment tool?
Yes 69% 79% 76% 40% 50% 81% 56% 73% No 21 15 20 30 25 14 33 20 Don’t Know 10 6 5 30 25 5 11 7
55 Did using the tool help identify areas to improve?
Yes 93% 92% 90% 100% 100% 94% 100% 91% No 4 4 3 0 0 6 0 9 Don’t Know 3 4 6 0 0 0 0 0

Table 10: Most Difficult Program Standards to Meet: Total & Geographic Breakdowns
Kahle Research Solutions Inc. Page A-13
MM Program Quality Standard
Wave V Total
Most Difficult to Meet*
Ranked:
Tri-County
Most Difficult to Meet* Ranked:
SE MI
Most Difficult to Meet* Ranked:
SW MI
Most Difficult to Meet* Ranked:
Mid-Mich
Most Difficult to Meet* Ranked:
GR/Musk
Most Difficult to Meet* Ranked:
Flint/Sag/Bay Area
Most Difficult to Meet* Ranked:
Northern/UP
Most Difficult to Meet* Ranked:
1 2 3 1 2 3 1 2 3 1 2 3 1 2 3 1 2 3 1 2 3 1 2 3
Recruitment plan 26% 12% 10% 21% 13% 17% 25% 11% 14% 0% 50% 0% 17% 33% 0% 31% 0% 13% 80% 0% 0% 10% 10% 10%
Mentor support, recognition, retention
19 14 13 17 4 13 14 11 11 25 0 25 33 0 33 25 25 0 20 0 40 10 30 10
Program evaluation 17 19 12 29 13 13 29 11 11 25 25 0 0 33 17 13 13 6 0 2 0 10 40 30
Match closure 12 14 10 4 25 8 7 25 7 25 0 25 0 0 17 13 13 19 0 20 0 30 0 0
Match monitoring process 7 9 10 4 13 0 4 11 4 0 0 25 33 17 0 6 0 19 0 40 40 10 0 0
Orientation & training 6 3 7 8 4 8 7 4 7 0 0 0 17 17 17 0 0 13 0 0 0 10 0 0
Eligibility screening 4 3 6 8 4 0 7 4 4 0 0 0 0 0 0 0 6 6 0 0 0 10 0 20
Governance 4 6 16 0 0 21 0 4 18 0 25 25 0 0 0 13 13 25 0 0 0 10 0 10
Organization Management 3 14 10 4 17 8 4 14 11 25 0 0 0 0 17 0 25 0 0 20 20 0 10 20
Definition of youth mentoring 1 -- 1 4 -- 4 4 -- 4 0 -- 0 0 -- 0 0 -- 0 0 -- 0 0 -- 0
Matching strategy -- 6 4 -- 8 8 -- 7 11 -- 0 0 -- 0 0 -- 6 0 -- 0 0 -- 10 0
*Organizations were asked to rank the MM Program Quality Standard that they found most difficult to meet. Results above show the standards, with figures indicating the percentage of organizations who ranked it the most difficult, the second most difficult, and the third most difficult to meet.

Table 11: Satisfaction with Mentor Michigan - Total and Geographic Breakdowns
Kahle Research Solutions Inc. Page A-14
Q #
Question Wave V Total
Tri-County
SE MI SW MI Mid-Mich GR / Musk
Flint/Sag/ Bay Area
Northern/ UP
Number of Mentoring Organizations 136 39 50 13 16 23 16 18
59 How satisfied are you with MM? % Very – 4 49% 72% 60% 31% 44% 43% 31% 56% % Somewhat – 3 36 21 30 38 44 48 38 28 % Not very – 2 4 3 4 0 6 0 6 6 % Not at all – 1 1 0 0 8 0 0 0 0 % Not aware of MM work 3 3 2 8 0 4 6 0 % Don’t Know 8 3 4 15 6 4 19 11
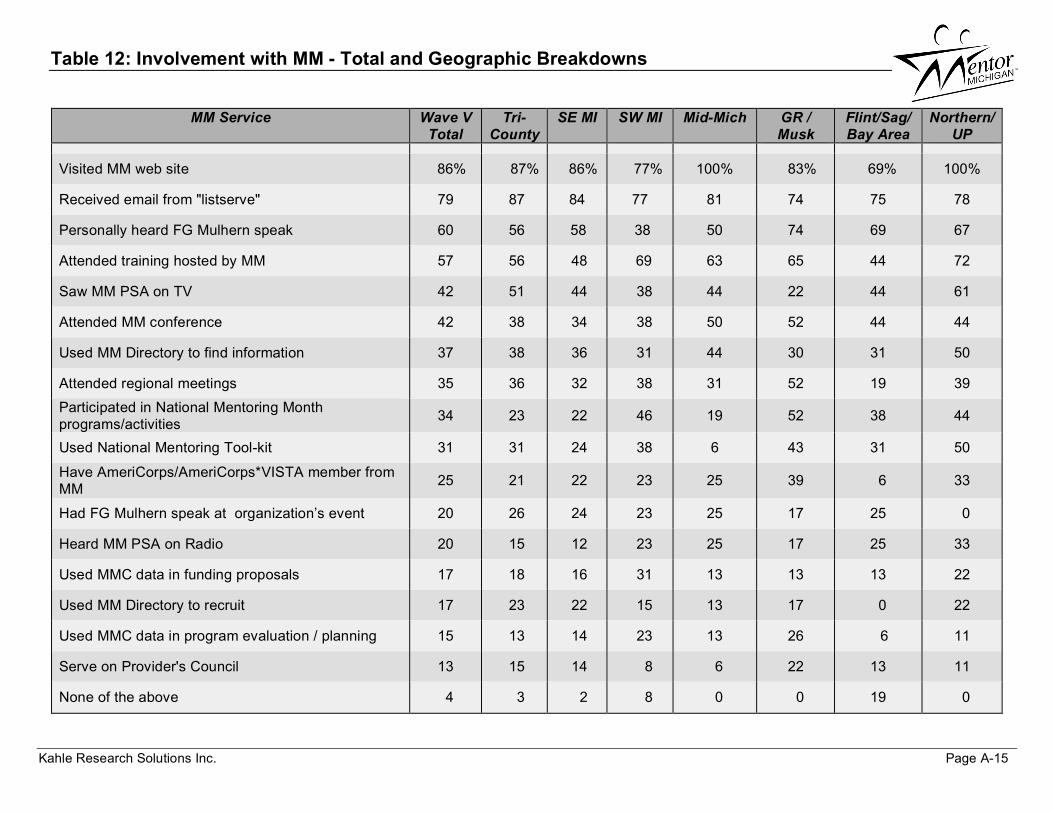
Table 12: Involvement with MM - Total and Geographic Breakdowns
Kahle Research Solutions Inc. Page A-15
MM Service Wave V Total
Tri-County
SE MI SW MI Mid-Mich GR / Musk
Flint/Sag/ Bay Area
Northern/ UP
Visited MM web site 86% 87% 86% 77% 100% 83% 69% 100%
Received email from "listserve" 79 87 84 77 81 74 75 78
Personally heard FG Mulhern speak 60 56 58 38 50 74 69 67
Attended training hosted by MM 57 56 48 69 63 65 44 72
Saw MM PSA on TV 42 51 44 38 44 22 44 61
Attended MM conference 42 38 34 38 50 52 44 44
Used MM Directory to find information 37 38 36 31 44 30 31 50
Attended regional meetings 35 36 32 38 31 52 19 39
Participated in National Mentoring Month programs/activities 34 23 22 46 19 52 38 44
Used National Mentoring Tool-kit 31 31 24 38 6 43 31 50
Have AmeriCorps/AmeriCorps*VISTA member from MM 25 21 22 23 25 39 6 33
Had FG Mulhern speak at organization’s event 20 26 24 23 25 17 25 0
Heard MM PSA on Radio 20 15 12 23 25 17 25 33
Used MMC data in funding proposals 17 18 16 31 13 13 13 22
Used MM Directory to recruit 17 23 22 15 13 17 0 22
Used MMC data in program evaluation / planning 15 13 14 23 13 26 6 11
Serve on Provider's Council 13 15 14 8 6 22 13 11
None of the above 4 3 2 8 0 0 19 0