Embed Size (px)
Citation preview
The Scope and Nature of Mentoring in Michigan:
A Report on Wave VIII of the
Mentor Michigan Census
January 2011
Prepared by:
Kahle Research Solutions Inc. www.KahleResearch.com
Table of Contents
Introduction ................................................................................................................................1 The Mentoring Funnel .................................................................................................................3 Executive Summary ....................................................................................................................4
Section I: Mentoring Organizations, Programs, Youth Served and Active Mentors ....................7 Mentoring Organizations and Programs ........................................................................8 Youth Served and Active Mentors .................................................................................8 Youth Served and Active Mentors by Program Type .....................................................9 Youth Served with Special Needs ............................................................................... 11 Returning Mentors vs. New Recruits ........................................................................... 12 Returning Mentors vs. New Recruits by Program Type ............................................... 14 Section II: Mentor Inquiries and Applications, Mentor Screening, Training and Support ........ 15 Inquiries and Applications ........................................................................................... 16 Mentor Screening ........................................................................................................ 17 Mentor Training and Support ....................................................................................... 19 Training Content .......................................................................................................... 21 Section III: Mentoring Types, Intensity and Duration ................................................................ 22 Types of Mentoring ...................................................................................................... 23 Types of Mentoring by Program Type ......................................................................... 24 Use of Troubleshooting Techniques by Mentoring Programs ...................................... 26 Match Intensity and Duration ....................................................................................... 27 Section IV: Youth Outcomes Targeted by Mentoring Programs ............................................... 31 Section V: Program Evaluation ................................................................................................. 36 Evidence of Effectiveness ........................................................................................... 38 Challenges in Documenting Program Outcomes ........................................................ 41 Section VI: Demographics ........................................................................................................ 45 Demographics of Mentors and Youth Served .............................................................. 46 Demographics of Mentors and Youth on Waiting Lists ................................................ 48 Section VII: Satisfaction with Mentor Michigan ......................................................................... 50 Overall Satisfaction ..................................................................................................... 51 Mentor Michigan Webinars: Participation and Satisfaction .......................................... 52 Estimated Participation in Regional Training ............................................................... 53 Information Needs from Mentor Michigan ................................................................... 54 Appendices ............................................................................................................................... 55 Appendix A: Funnel Measures Summary Table Totals by Waves III-VIII .................... 56 Appendix B: Wording Changes for Mentor Training, Support, Intensity and Duration Questions ................................................................................................ 60 Appendix C: Background, Objectives and Method ...................................................... 61
List of Exhibits
Exhibit Title Page
1 Number of Active Mentors and Youth Served .................................................................8 2 Youth Served and Active Mentors by Total and Program Type ......................................9 3 Youth Served and Active Mentors Breakdown of “All Others” Category ....................... 10 4 Youth Served with Special Needs ................................................................................ 11 5 Returning Mentors vs. New Recruits ............................................................................ 12 6 Returning Mentors and New Recruits Wave VII vs. VIII................................................ 13 7 Returning Mentors vs. New Recruits by Program Type ................................................ 14 8 Average Number of Monthly Mentor Inquiries and Written Applications ....................... 16 9 Screening Procedures Used by Mentoring Programs ................................................... 18 10 Mean Hours Spent on Mentor Training and Support from Programs ............................ 19 11 Mean Hours Spent on Mentor Training and Support by Program Type ........................ 19 12 Pre- and Post-Match Training and Support for Mentors ............................................... 20 13 Training as Part of the Screening Process .................................................................. 21 14 Use of Evidence-based Training Materials ................................................................... 21 15 Mentoring Types Practiced: Wave VII vs. Wave VIII .................................................... 23 16 Types of Mentoring by Total and Program Type ........................................................... 25 17 Does Program Include Trouble-Shooting to Address Problems with Mentors? ............ 26 18 Mentoring Intensity ....................................................................................................... 27 19 Average Match Duration ............................................................................................... 27 20 Intensity and Match Duration by Total and Program Type ............................................ 28 21 Minimum and Average Duration of Matches ................................................................. 29 22 Minimum Hours and Meetings of Matches .................................................................... 30 23 Summary of Youth Outcomes Targeted by Mentoring Programs ................................. 32 24 Youth Outcomes Targeted by Mentoring Programs by Total and Program Type ......... 34 25 Program Evaluation by Total and Program Type .......................................................... 37 26 Method of Evaluation by Total and Program Type ........................................................ 37 27 Demographics of Mentors ............................................................................................. 46 28 Demographics of Youth Served .................................................................................... 47 29 Gender of Youth and Mentors on Waiting Lists ............................................................ 48 30 Race of Youth and Mentors on Waiting Lists ................................................................ 49 31 Satisfaction with Mentor Michigan ................................................................................ 51 32 Past Participation in Mentor Michigan’s Free Webinars................................................ 52 33 Satisfaction with Mentor Michigan’s Free Webinars ..................................................... 52 34 Estimated Participation in Mentor Michigan’s Free or Low Cost Regional Training ...... 53 35 Information Needs of Mentoring Organizations ............................................................ 54 B-1 Wording Changes for Mentor Training, Support, Intensity and Duration Questions ..... 60 C-1 Participation Statistics Waves I through VIII of the Mentor Michigan Census ............... 61 C-2 Areas of Focus for Each Wave of the Mentor Michigan Census ................................... 62 C-3 Wording Changes for Types of Mentoring………………………………………………….63
The Scope and Nature of Mentoring in Michigan
Kahle Research Solutions Page 1 February 2011
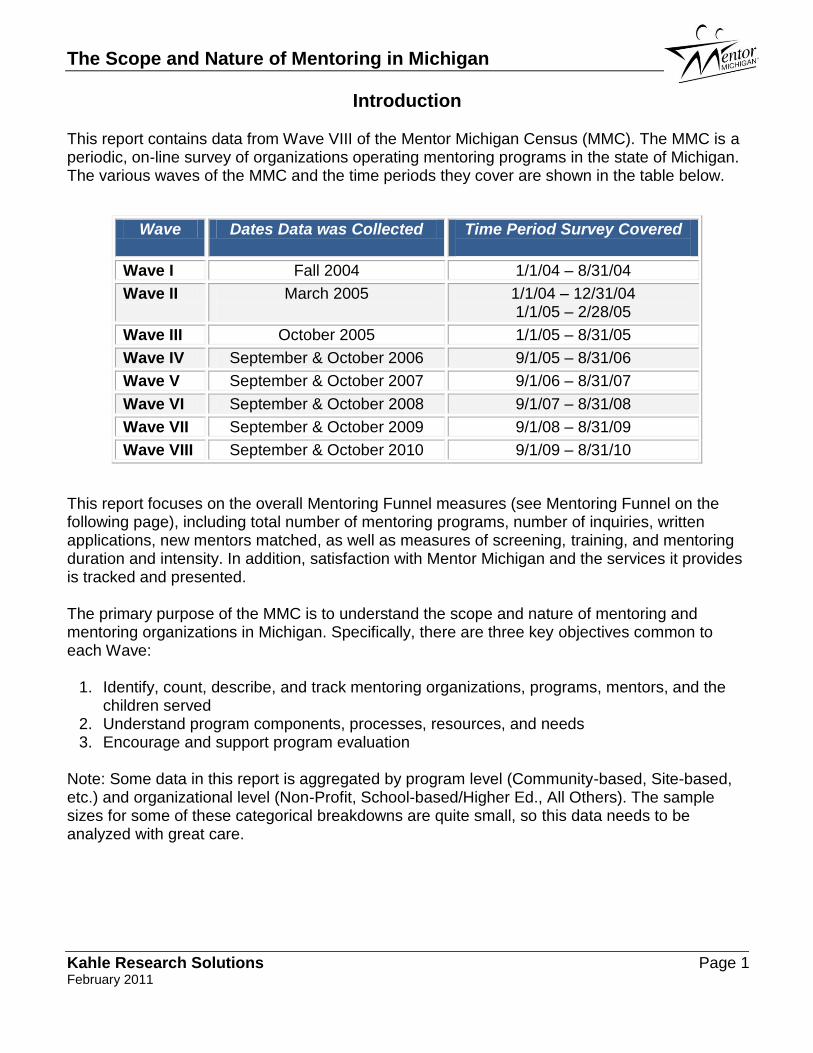
Introduction This report contains data from Wave VIII of the Mentor Michigan Census (MMC). The MMC is a periodic, on-line survey of organizations operating mentoring programs in the state of Michigan. The various waves of the MMC and the time periods they cover are shown in the table below.
Wave Dates Data was Collected Time Period Survey Covered
Wave I Fall 2004 1/1/04 – 8/31/04
Wave II March 2005
1/1/04 – 12/31/04 1/1/05 – 2/28/05
Wave III October 2005 1/1/05 – 8/31/05
Wave IV September & October 2006 9/1/05 – 8/31/06
Wave V September & October 2007 9/1/06 – 8/31/07
Wave VI September & October 2008 9/1/07 – 8/31/08
Wave VII September & October 2009 9/1/08 – 8/31/09
Wave VIII September & October 2010 9/1/09 – 8/31/10
This report focuses on the overall Mentoring Funnel measures (see Mentoring Funnel on the following page), including total number of mentoring programs, number of inquiries, written applications, new mentors matched, as well as measures of screening, training, and mentoring duration and intensity. In addition, satisfaction with Mentor Michigan and the services it provides is tracked and presented. The primary purpose of the MMC is to understand the scope and nature of mentoring and mentoring organizations in Michigan. Specifically, there are three key objectives common to each Wave:
1. Identify, count, describe, and track mentoring organizations, programs, mentors, and the children served
2. Understand program components, processes, resources, and needs 3. Encourage and support program evaluation
Note: Some data in this report is aggregated by program level (Community-based, Site-based, etc.) and organizational level (Non-Profit, School-based/Higher Ed., All Others). The sample sizes for some of these categorical breakdowns are quite small, so this data needs to be analyzed with great care.
The Scope and Nature of Mentoring in Michigan
Kahle Research Solutions Page 2 February 2011
Each year, additional topics are requested by Mentor Michigan and its’ Providers Council for inclusion in the Census. Wave VIII special request data includes reports on the following topics: 1. Self-Reported Adherence to the Mentor Michigan Quality Program Standards for Youth
Mentoring 2. Social Media Use by Mentoring Organizations 3. Mentoring Capacity, Economic and Human Resources of Youth Mentoring Organizations 4. Experience and Needs of Mentoring Organizations’ Executive Directors
Reports on these topics, along with a report that analyzes the funnel measures by geographic region, and a brief Executive Summary, will be posted on the Mentor Michigan web site. Similarly, reports and presentations from previous waves of the MMC can be found at www.mentormichigan.org. Mentor Michigan and Kahle Research Solutions wishes to thank David Dubois, Ph.D of the University of Illinois at Chicago, for his review and suggestions regarding the content of the Wave VIII survey. Questions regarding data presented in these reports or methodology used can be directed to Robert W. Kahle, Ph.D, at [email protected].
The Scope and Nature of Mentoring in Michigan
Kahle Research Solutions Page 3 February 2011
Inquiries and Applications
Screening, Matching
and Training
Mentoring Duration
and
Intensity
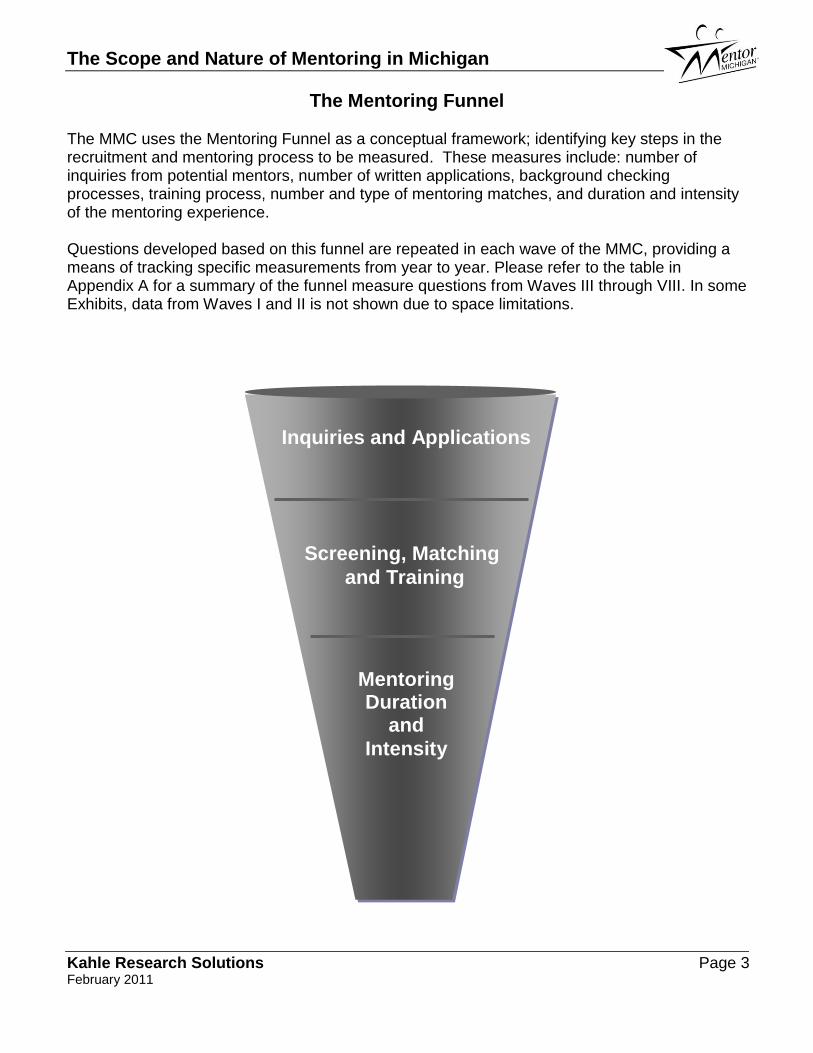
The Mentoring Funnel The MMC uses the Mentoring Funnel as a conceptual framework; identifying key steps in the recruitment and mentoring process to be measured. These measures include: number of inquiries from potential mentors, number of written applications, background checking processes, training process, number and type of mentoring matches, and duration and intensity of the mentoring experience. Questions developed based on this funnel are repeated in each wave of the MMC, providing a means of tracking specific measurements from year to year. Please refer to the table in Appendix A for a summary of the funnel measure questions from Waves III through VIII. In some Exhibits, data from Waves I and II is not shown due to space limitations.
The Scope and Nature of Mentoring in Michigan
Kahle Research Solutions Page 4 February 2011
Executive Summary
The Scope and Nature of Mentoring in Michigan
Kahle Research Solutions Page 5 February 2011
Executive Summary
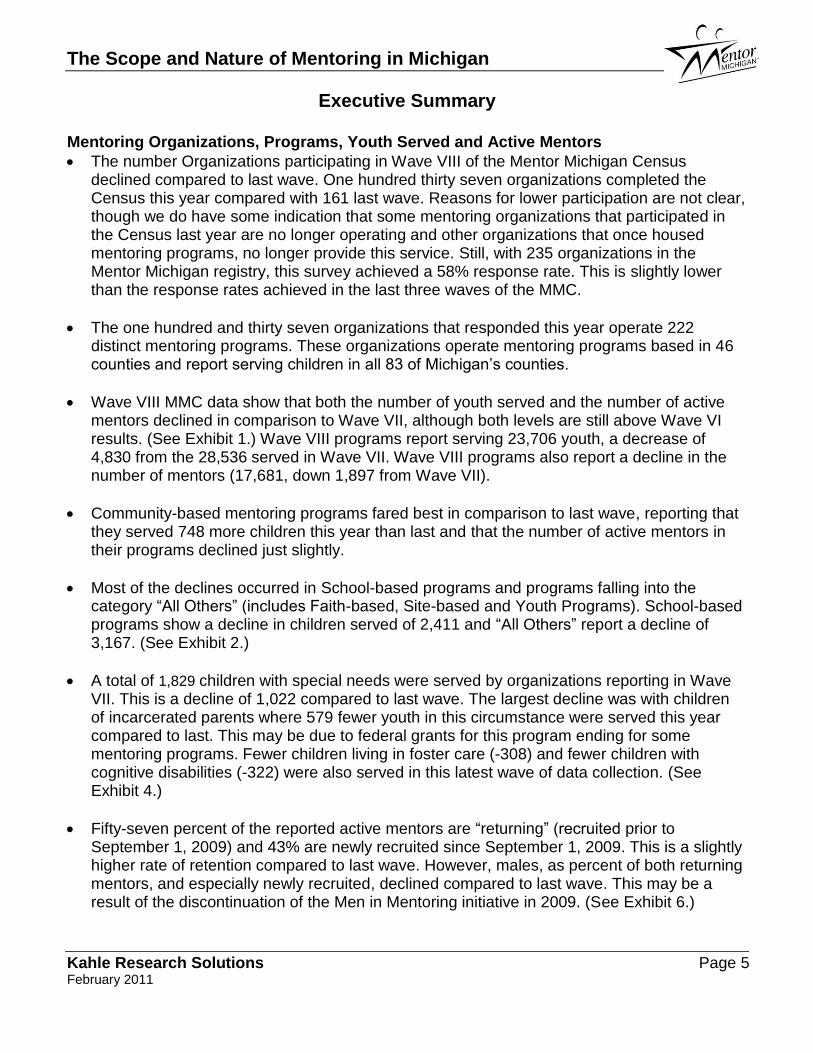
Mentoring Organizations, Programs, Youth Served and Active Mentors
The number Organizations participating in Wave VIII of the Mentor Michigan Census declined compared to last wave. One hundred thirty seven organizations completed the Census this year compared with 161 last wave. Reasons for lower participation are not clear, though we do have some indication that some mentoring organizations that participated in the Census last year are no longer operating and other organizations that once housed mentoring programs, no longer provide this service. Still, with 235 organizations in the Mentor Michigan registry, this survey achieved a 58% response rate. This is slightly lower than the response rates achieved in the last three waves of the MMC.
The one hundred and thirty seven organizations that responded this year operate 222 distinct mentoring programs. These organizations operate mentoring programs based in 46 counties and report serving children in all 83 of Michigan’s counties.
Wave VIII MMC data show that both the number of youth served and the number of active mentors declined in comparison to Wave VII, although both levels are still above Wave VI results. (See Exhibit 1.) Wave VIII programs report serving 23,706 youth, a decrease of 4,830 from the 28,536 served in Wave VII. Wave VIII programs also report a decline in the number of mentors (17,681, down 1,897 from Wave VII).
Community-based mentoring programs fared best in comparison to last wave, reporting that they served 748 more children this year than last and that the number of active mentors in their programs declined just slightly.
Most of the declines occurred in School-based programs and programs falling into the category “All Others” (includes Faith-based, Site-based and Youth Programs). School-based programs show a decline in children served of 2,411 and “All Others” report a decline of 3,167. (See Exhibit 2.)
A total of 1,829 children with special needs were served by organizations reporting in Wave VII. This is a decline of 1,022 compared to last wave. The largest decline was with children of incarcerated parents where 579 fewer youth in this circumstance were served this year compared to last. This may be due to federal grants for this program ending for some mentoring programs. Fewer children living in foster care (-308) and fewer children with cognitive disabilities (-322) were also served in this latest wave of data collection. (See Exhibit 4.)
Fifty-seven percent of the reported active mentors are “returning” (recruited prior to September 1, 2009) and 43% are newly recruited since September 1, 2009. This is a slightly higher rate of retention compared to last wave. However, males, as percent of both returning mentors, and especially newly recruited, declined compared to last wave. This may be a result of the discontinuation of the Men in Mentoring initiative in 2009. (See Exhibit 6.)
The Scope and Nature of Mentoring in Michigan
Kahle Research Solutions Page 6 February 2011
Inquiries, Applications; Mentor Screening Training and Support
Programs report receiving 14,629 inquiries and 9,330 written applications in Wave VIII. While this reflects a decrease in the number of inquiries and applications since Wave VII (-1,856 and -446 respectively), the percentage of serious inquiries, as defined by the proportion of inquires that led to written applications, is up five percentage points from Wave VII. Sixty-four percent of mentor inquiries resulted in written applications for Wave VIII, in comparison to 59% in Wave VII. (See Exhibit 6.)
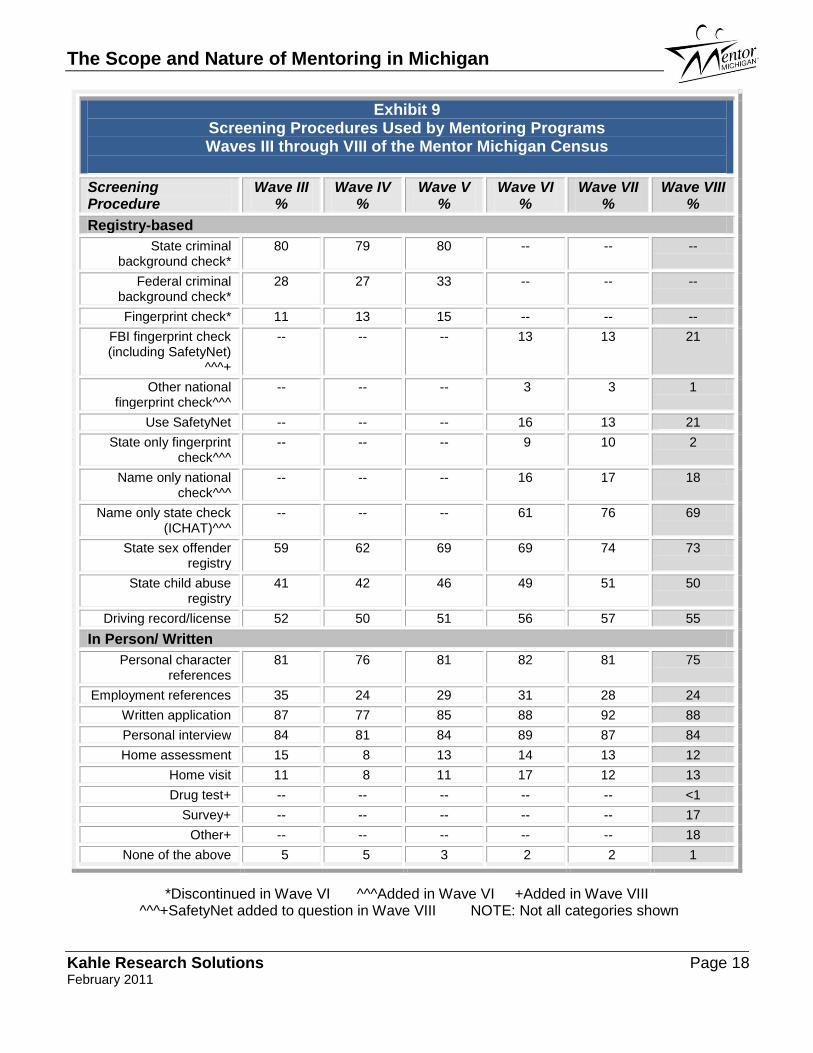
The State Sex Offender Registry (73%) and ICHAT (69%) are still the registry-based screening procedures most frequently used by mentoring programs, although use of ICHAT shows the largest decline since Wave VII (seven percentage points). Use of the State Sex Offender Registry is down by just one percentage point. (See Exhibit 9.)
FBI fingerprint checks and SafetyNet are used by 21% of Wave VIII participants. This represents an eight percentage point increase in the use of each of these high quality screening procedures over Wave VII levels. (See Exhibit 9.)
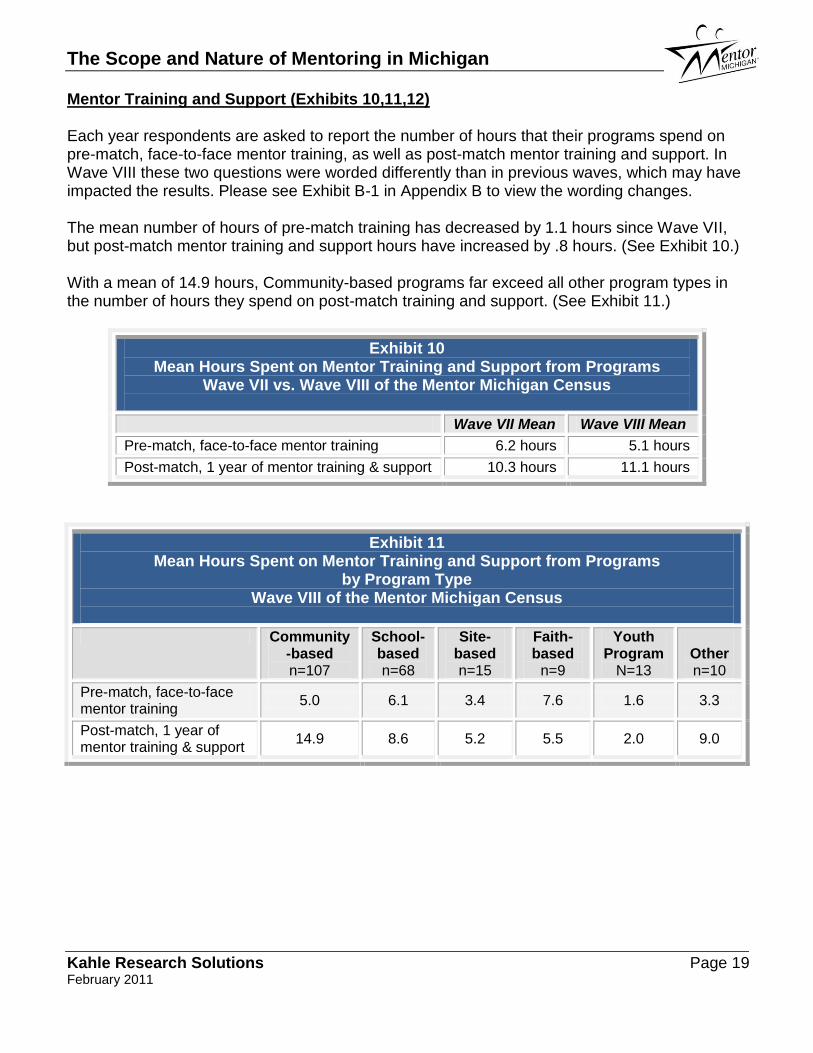
Each year respondents are asked to report the number of hours that their programs spend on pre-match, face-to-face mentor training, as well as post-match mentor training and support. In Wave VIII these two questions were worded differently than in previous waves, which may have impacted the results. Please see Exhibit B-1 in Appendix B to view the wording changes.
The mean number of hours of pre-match training has decreased by 1.1 hours since Wave VII, but post-match mentor training and support hours have increased by .8 hours. (See Exhibit 10.) With a mean of 14.9 hours, Community-based programs far exceed all other program types in the number of hours they spend on post-match training and support. (See Exhibit 11.)
Mentoring Types, Intensity and Duration
One adult mentoring one youth is the still the dominant form of mentoring in the state. Seventy three percent of all mentoring relationships counted in the Census report this type of mentoring. Group, peer and team mentoring all reflect less than 10% of the mentoring relationships accounted for this wave.
Mentoring intensity (time each week match spends together) remained steady this wave compared to last wave, yet mentoring duration declined slightly. School-based programs operating shorter programs can account for most of the duration decline. (See Exhibits 18 and 19.)
Youth Outcomes Targeted By Mentoring Programs
The vast majority of programs (95%) can identify specific outcomes they seek to achieve through mentoring. Positive Youth Development is the most commonly cited targeted outcome (92%). The second most commonly cited (82%) is better relationships with adults (non parents/caregivers). (See Exhibits 23 and 24.)
The Scope and Nature of Mentoring in Michigan
Kahle Research Solutions Page 7 February 2011
Section I:
Mentoring Organizations, Programs, Youth Served and
Active Mentors
The Scope and Nature of Mentoring in Michigan
Kahle Research Solutions Page 8 February 2011
9,10810,546
11,767
16,38218,232
17,051
19,57817,681
16,574
27,090
20,294
28,283
25,883
22,916
28,536
23,706
0
5,000
10,000
15,000
20,000
25,000
30,000
Wave I Wave II Wave III Wave IV Wave V Wave VI Wave VII Wave VIII
Active Mentors Youth Served
Section I: Mentoring Organizations, Programs, Youth Served and Active Mentors
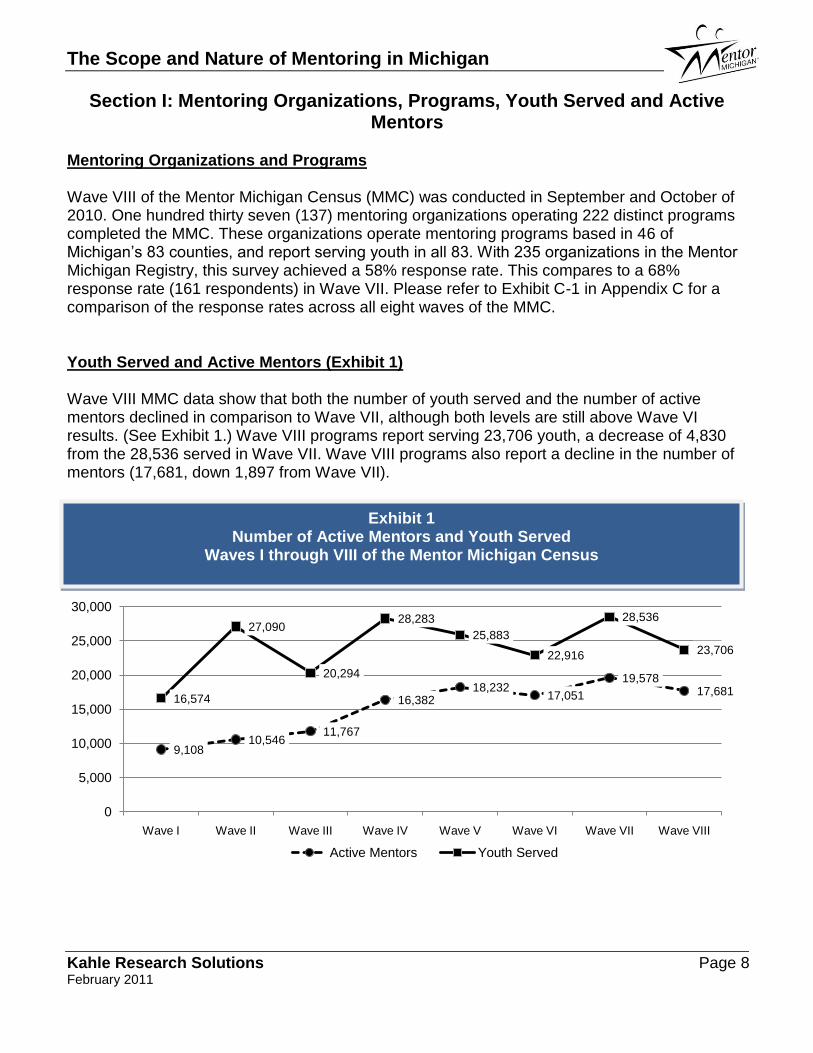
Mentoring Organizations and Programs Wave VIII of the Mentor Michigan Census (MMC) was conducted in September and October of 2010. One hundred thirty seven (137) mentoring organizations operating 222 distinct programs completed the MMC. These organizations operate mentoring programs based in 46 of Michigan’s 83 counties, and report serving youth in all 83. With 235 organizations in the Mentor Michigan Registry, this survey achieved a 58% response rate. This compares to a 68% response rate (161 respondents) in Wave VII. Please refer to Exhibit C-1 in Appendix C for a comparison of the response rates across all eight waves of the MMC. Youth Served and Active Mentors (Exhibit 1) Wave VIII MMC data show that both the number of youth served and the number of active mentors declined in comparison to Wave VII, although both levels are still above Wave VI results. (See Exhibit 1.) Wave VIII programs report serving 23,706 youth, a decrease of 4,830 from the 28,536 served in Wave VII. Wave VIII programs also report a decline in the number of mentors (17,681, down 1,897 from Wave VII).
Exhibit 1 Number of Active Mentors and Youth Served
Waves I through VIII of the Mentor Michigan Census
The Scope and Nature of Mentoring in Michigan
Kahle Research Solutions Page 9 February 2011
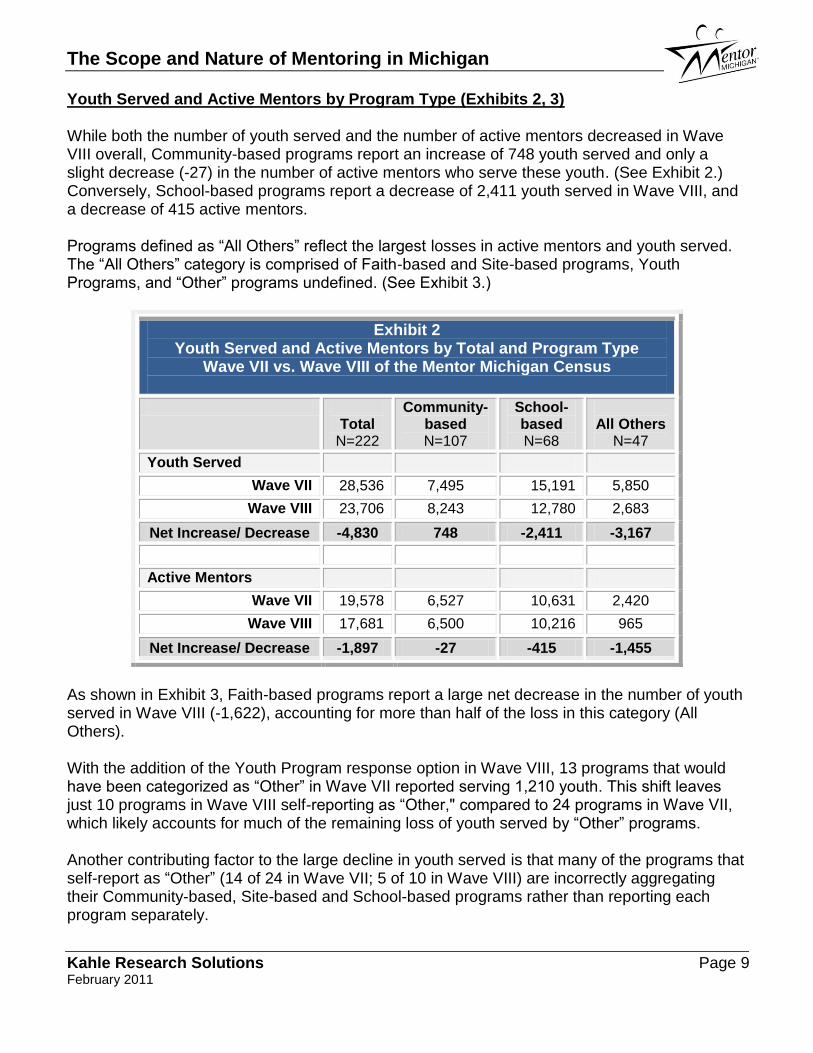
Youth Served and Active Mentors by Program Type (Exhibits 2, 3) While both the number of youth served and the number of active mentors decreased in Wave VIII overall, Community-based programs report an increase of 748 youth served and only a slight decrease (-27) in the number of active mentors who serve these youth. (See Exhibit 2.) Conversely, School-based programs report a decrease of 2,411 youth served in Wave VIII, and a decrease of 415 active mentors. Programs defined as “All Others” reflect the largest losses in active mentors and youth served. The “All Others” category is comprised of Faith-based and Site-based programs, Youth Programs, and “Other” programs undefined. (See Exhibit 3.)
Exhibit 2 Youth Served and Active Mentors by Total and Program Type
Wave VII vs. Wave VIII of the Mentor Michigan Census
Total
N=222
Community-based N=107
School- based N=68
All Others
N=47
Youth Served
Wave VII 28,536 7,495 15,191 5,850
Wave VIII 23,706 8,243 12,780 2,683
Net Increase/ Decrease -4,830 748 -2,411 -3,167
Active Mentors
Wave VII 19,578 6,527 10,631 2,420
Wave VIII 17,681 6,500 10,216 965
Net Increase/ Decrease -1,897 -27 -415 -1,455
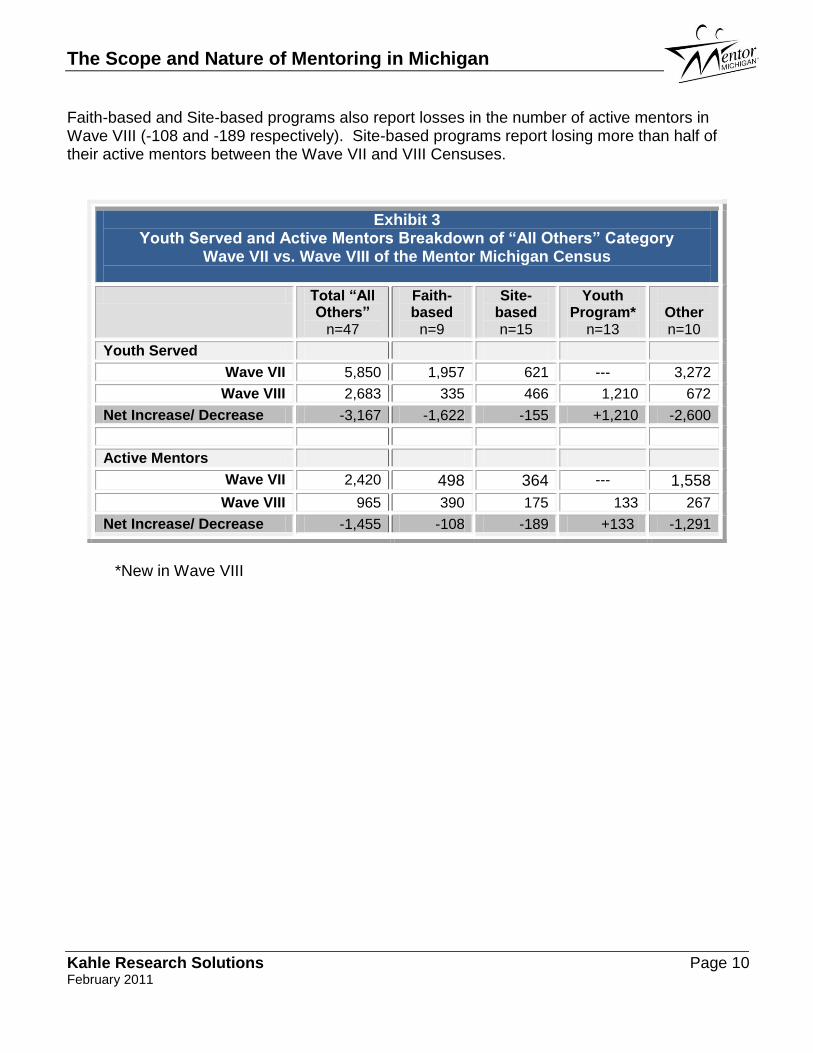
As shown in Exhibit 3, Faith-based programs report a large net decrease in the number of youth served in Wave VIII (-1,622), accounting for more than half of the loss in this category (All Others). With the addition of the Youth Program response option in Wave VIII, 13 programs that would have been categorized as “Other” in Wave VII reported serving 1,210 youth. This shift leaves just 10 programs in Wave VIII self-reporting as “Other," compared to 24 programs in Wave VII, which likely accounts for much of the remaining loss of youth served by “Other” programs. Another contributing factor to the large decline in youth served is that many of the programs that self-report as “Other” (14 of 24 in Wave VII; 5 of 10 in Wave VIII) are incorrectly aggregating their Community-based, Site-based and School-based programs rather than reporting each program separately.
The Scope and Nature of Mentoring in Michigan
Kahle Research Solutions Page 10 February 2011
Faith-based and Site-based programs also report losses in the number of active mentors in Wave VIII (-108 and -189 respectively). Site-based programs report losing more than half of their active mentors between the Wave VII and VIII Censuses.
Exhibit 3 Youth Served and Active Mentors Breakdown of “All Others” Category
Wave VII vs. Wave VIII of the Mentor Michigan Census
Total “All Others”
n=47
Faith-based
n=9
Site-based n=15
Youth Program*
n=13
Other n=10
Youth Served
Wave VII 5,850 1,957 621 --- 3,272
Wave VIII 2,683 335 466 1,210 672
Net Increase/ Decrease -3,167 -1,622 -155 +1,210 -2,600
Active Mentors
Wave VII 2,420 498 364 --- 1,558
Wave VIII 965 390 175 133 267
Net Increase/ Decrease -1,455 -108 -189 +133 -1,291
*New in Wave VIII
The Scope and Nature of Mentoring in Michigan
Kahle Research Solutions Page 11 February 2011
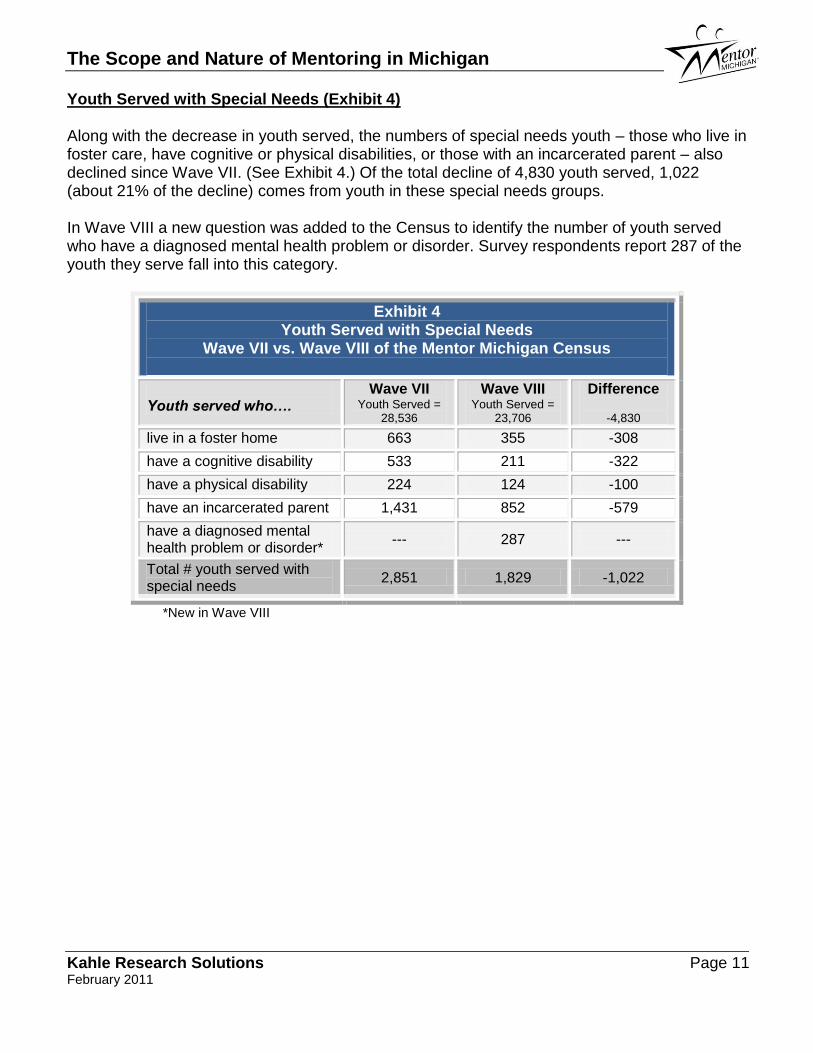
Youth Served with Special Needs (Exhibit 4) Along with the decrease in youth served, the numbers of special needs youth – those who live in foster care, have cognitive or physical disabilities, or those with an incarcerated parent – also declined since Wave VII. (See Exhibit 4.) Of the total decline of 4,830 youth served, 1,022 (about 21% of the decline) comes from youth in these special needs groups. In Wave VIII a new question was added to the Census to identify the number of youth served who have a diagnosed mental health problem or disorder. Survey respondents report 287 of the youth they serve fall into this category.
Exhibit 4 Youth Served with Special Needs
Wave VII vs. Wave VIII of the Mentor Michigan Census
Youth served who….
Wave VII Youth Served =
28,536
Wave VIII Youth Served =
23,706
Difference
-4,830
live in a foster home 663 355 -308
have a cognitive disability 533 211 -322
have a physical disability 224 124 -100
have an incarcerated parent 1,431 852 -579
have a diagnosed mental health problem or disorder*
--- 287 ---
Total # youth served with special needs
2,851 1,829 -1,022
*New in Wave VIII
The Scope and Nature of Mentoring in Michigan
Kahle Research Solutions Page 12 February 2011
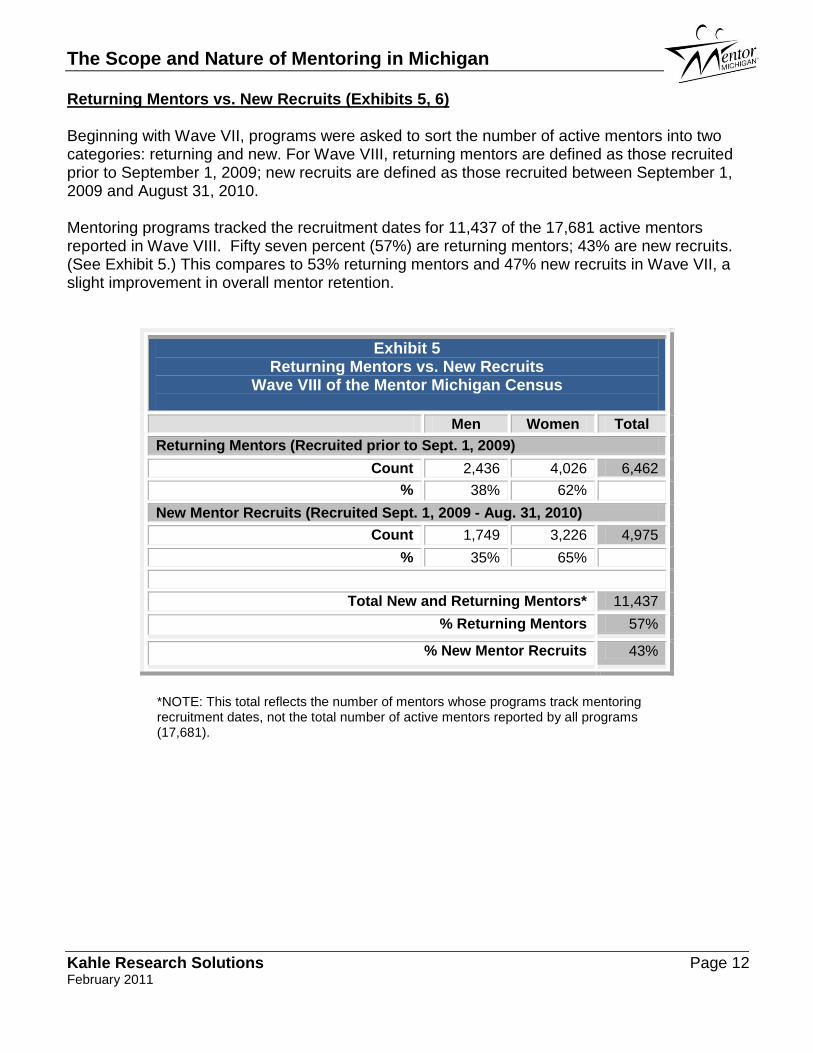
Returning Mentors vs. New Recruits (Exhibits 5, 6) Beginning with Wave VII, programs were asked to sort the number of active mentors into two categories: returning and new. For Wave VIII, returning mentors are defined as those recruited prior to September 1, 2009; new recruits are defined as those recruited between September 1, 2009 and August 31, 2010. Mentoring programs tracked the recruitment dates for 11,437 of the 17,681 active mentors reported in Wave VIII. Fifty seven percent (57%) are returning mentors; 43% are new recruits. (See Exhibit 5.) This compares to 53% returning mentors and 47% new recruits in Wave VII, a slight improvement in overall mentor retention.
Exhibit 5 Returning Mentors vs. New Recruits
Wave VIII of the Mentor Michigan Census
Men Women Total
Returning Mentors (Recruited prior to Sept. 1, 2009)
Count 2,436 4,026 6,462
% 38% 62%
New Mentor Recruits (Recruited Sept. 1, 2009 - Aug. 31, 2010)
Count 1,749 3,226 4,975
% 35% 65%
Total New and Returning Mentors* 11,437
% Returning Mentors 57%
% New Mentor Recruits 43%
*NOTE: This total reflects the number of mentors whose programs track mentoring recruitment dates, not the total number of active mentors reported by all programs (17,681).
The Scope and Nature of Mentoring in Michigan
Kahle Research Solutions Page 13 February 2011
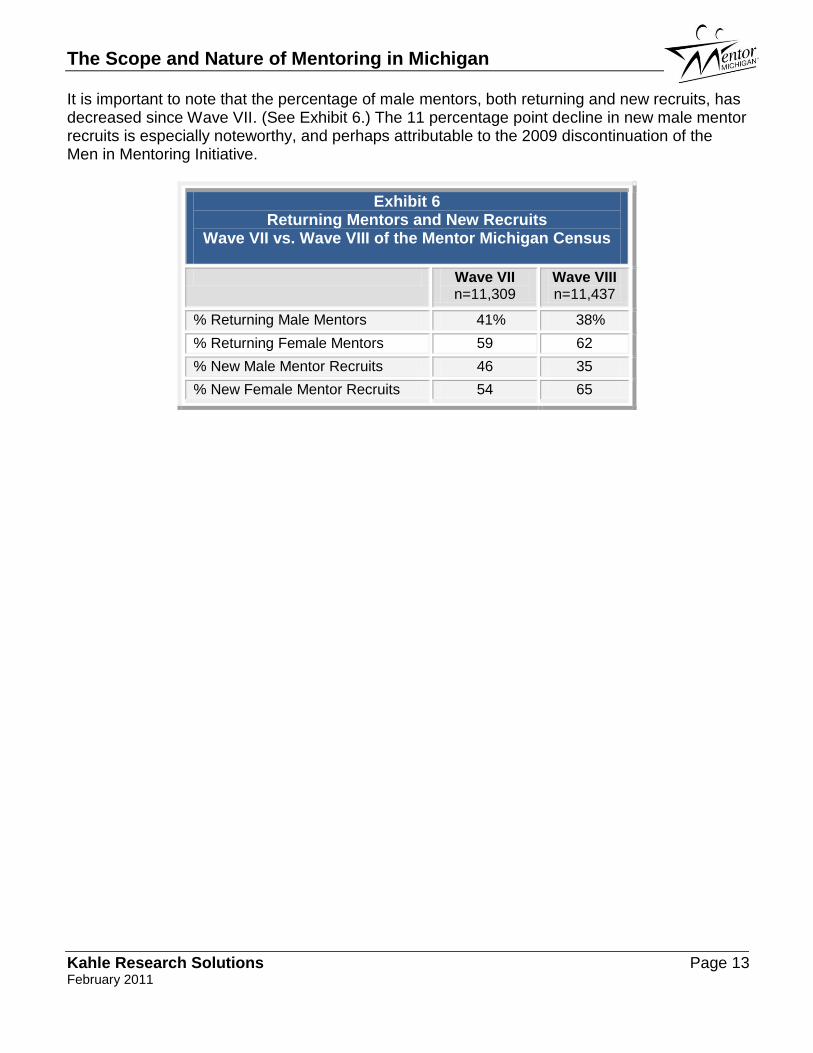
It is important to note that the percentage of male mentors, both returning and new recruits, has decreased since Wave VII. (See Exhibit 6.) The 11 percentage point decline in new male mentor recruits is especially noteworthy, and perhaps attributable to the 2009 discontinuation of the Men in Mentoring Initiative.
Exhibit 6 Returning Mentors and New Recruits
Wave VII vs. Wave VIII of the Mentor Michigan Census
Wave VII n=11,309
Wave VIII n=11,437
% Returning Male Mentors 41% 38%
% Returning Female Mentors 59 62
% New Male Mentor Recruits 46 35
% New Female Mentor Recruits 54 65
The Scope and Nature of Mentoring in Michigan
Kahle Research Solutions Page 14 February 2011
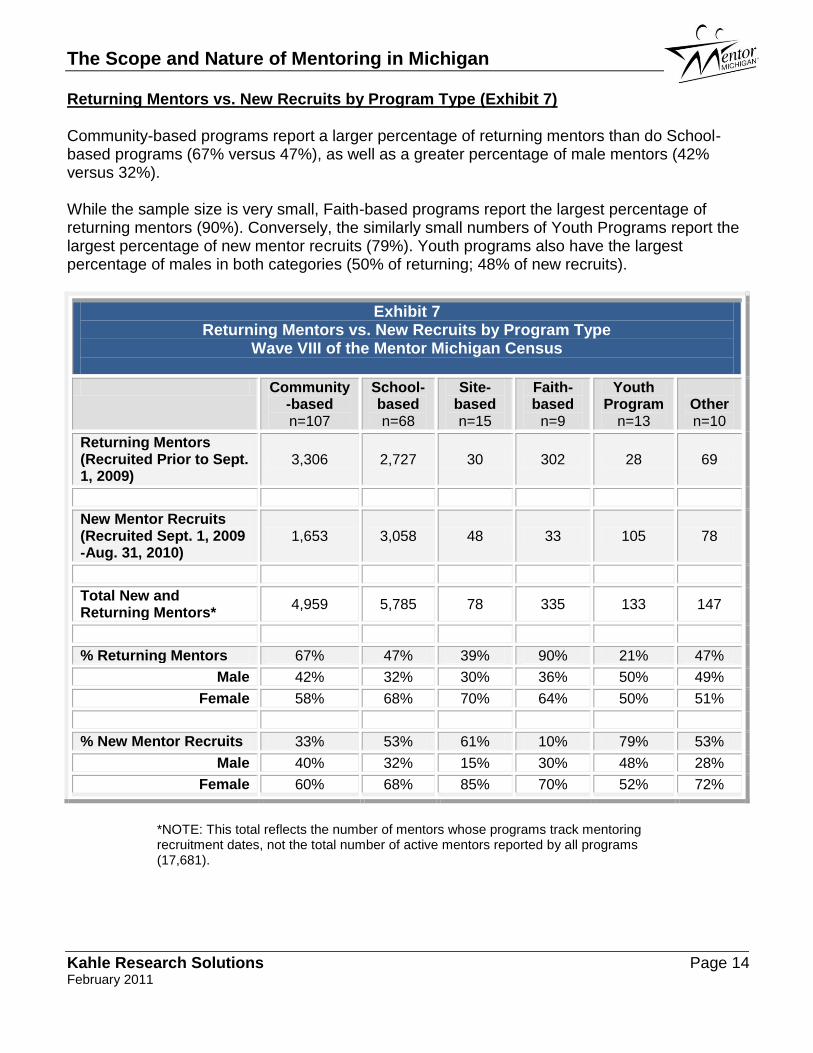
Returning Mentors vs. New Recruits by Program Type (Exhibit 7) Community-based programs report a larger percentage of returning mentors than do School-based programs (67% versus 47%), as well as a greater percentage of male mentors (42% versus 32%). While the sample size is very small, Faith-based programs report the largest percentage of returning mentors (90%). Conversely, the similarly small numbers of Youth Programs report the largest percentage of new mentor recruits (79%). Youth programs also have the largest percentage of males in both categories (50% of returning; 48% of new recruits).
Exhibit 7 Returning Mentors vs. New Recruits by Program Type
Wave VIII of the Mentor Michigan Census
Community-based n=107
School- based n=68
Site-based n=15
Faith-based
n=9
Youth Program
n=13
Other n=10
Returning Mentors (Recruited Prior to Sept. 1, 2009)
3,306 2,727 30 302 28 69
New Mentor Recruits (Recruited Sept. 1, 2009 -Aug. 31, 2010)
1,653 3,058 48 33 105 78
Total New and Returning Mentors*
4,959 5,785 78 335 133 147
% Returning Mentors 67% 47% 39% 90% 21% 47%
Male 42% 32% 30% 36% 50% 49%
Female 58% 68% 70% 64% 50% 51%
% New Mentor Recruits 33% 53% 61% 10% 79% 53%
Male 40% 32% 15% 30% 48% 28%
Female 60% 68% 85% 70% 52% 72%
*NOTE: This total reflects the number of mentors whose programs track mentoring recruitment dates, not the total number of active mentors reported by all programs (17,681).
The Scope and Nature of Mentoring in Michigan
Kahle Research Solutions Page 15 February 2011
Section II:
Mentor Inquiries and Applications; Mentor Screening, Training and
Support
The Scope and Nature of Mentoring in Michigan
Kahle Research Solutions Page 16 February 2011
0
200
400
600
800
1,000
1,200
1,400
1,600
Wave III: 1/1/05-8/31/05
Wave IV: 9/1/05-8/31/06
Wave V: 9/1/06-8/31/07
Wave VI: 9/1/07-8/31/08
Wave VII: 9/1/08-8/31/09
Wave VIII: 9/1/09-8/31/10
1,023
1,460
1,115 1,130
1,374
1,219
746666 658
746 815 777
Inquiries Applications
Section II: Mentor Inquiries and Applications; Mentor Screening, Training and Support
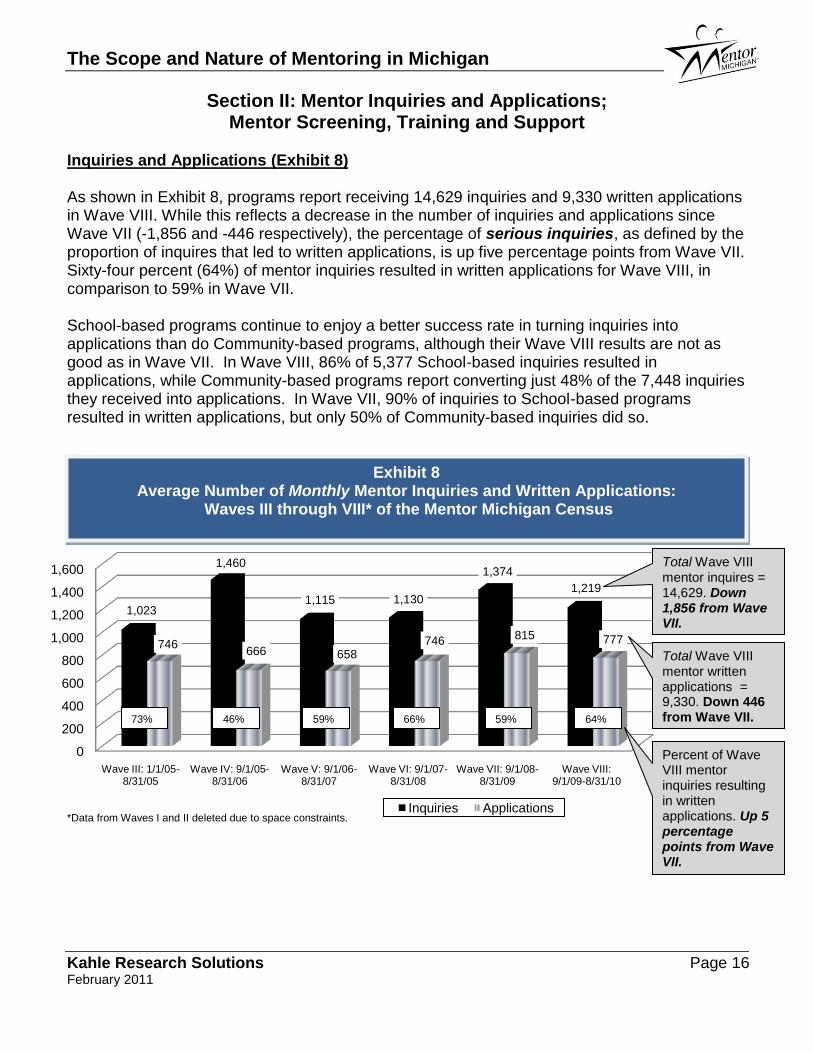
Inquiries and Applications (Exhibit 8) As shown in Exhibit 8, programs report receiving 14,629 inquiries and 9,330 written applications in Wave VIII. While this reflects a decrease in the number of inquiries and applications since Wave VII (-1,856 and -446 respectively), the percentage of serious inquiries, as defined by the proportion of inquires that led to written applications, is up five percentage points from Wave VII. Sixty-four percent (64%) of mentor inquiries resulted in written applications for Wave VIII, in comparison to 59% in Wave VII. School-based programs continue to enjoy a better success rate in turning inquiries into applications than do Community-based programs, although their Wave VIII results are not as good as in Wave VII. In Wave VIII, 86% of 5,377 School-based inquiries resulted in applications, while Community-based programs report converting just 48% of the 7,448 inquiries they received into applications. In Wave VII, 90% of inquiries to School-based programs resulted in written applications, but only 50% of Community-based inquiries did so. *Data from Waves I and II deleted due to space constraints.
Exhibit 8 Average Number of Monthly Mentor Inquiries and Written Applications:
Waves III through VIII* of the Mentor Michigan Census
Total Wave VIII mentor inquires = 14,629. Down 1,856 from Wave VII.
Total Wave VIII mentor written applications = 9,330. Down 446 from Wave VII.
73% 46% 59% 64% 59% 66%
Percent of Wave VIII mentor inquiries resulting in written applications. Up 5 percentage points from Wave VII.
The Scope and Nature of Mentoring in Michigan
Kahle Research Solutions Page 17 February 2011
Mentor Screening (Exhibit 9) The State Sex Offender Registry (73%) and ICHAT (69%) are still the registry-based screening procedures most frequently used by mentoring programs, although use of ICHAT shows the largest decline since Wave VII (seven percentage points). Use of the State Sex Offender Registry is down by just one percentage point. (See Exhibit 9.) FBI fingerprint checks and SafetyNet are used by 21% of Wave VIII participants. This represents an eight percentage point increase (8%) in the use of these high quality screening procedures over Wave VII levels. The use of in-person/written screening procedures declined in most categories, with only home visits showing a very slight one percent (1%) increase. In Wave VIII mentoring programs were asked about three new screening procedures: drug tests, surveys, and “other” mentor screening procedures. Eighteen percent (18%) of these programs report using “other” procedures, and 17% report using surveys to screen their mentors. Interestingly, less than 1% use drug tests to screen potential mentors. The “other” procedures defined by these reporting programs include a number of background checks conducted by schools, colleges, local police, and various courts (county, probate, district and circuit). “National Sex Offender” registry, “FIA clearance”, Offender Tracking Information System (OTIS) and Child Protective Services (CPS) are also listed, as is a future start date for using ICHAT. Three programs report that they use Big Brothers Big Sisters to conduct their screening; two check social media sites Facebook and MySpace; and the generic “training session” is listed twice as a screening tool. Finally, one program reports using spousal interviews during the screening of potential mentors. Still, 1% of participating programs indicate they perform “none of the above” types of screening of potential mentors, down from a high of 5% in Waves III and IV.
The Scope and Nature of Mentoring in Michigan
Kahle Research Solutions Page 18 February 2011
Exhibit 9 Screening Procedures Used by Mentoring Programs Waves III through VIII of the Mentor Michigan Census
Screening Procedure
Wave III %
Wave IV %
Wave V %
Wave VI %
Wave VII %
Wave VIII %
Registry-based
State criminal background check*
80 79 80 -- -- --
Federal criminal background check*
28 27 33 -- -- --
Fingerprint check* 11 13 15 -- -- --
FBI fingerprint check (including SafetyNet)
^^^+
-- -- -- 13 13 21
Other national fingerprint check^^^
-- -- -- 3 3 1
Use SafetyNet -- -- -- 16 13 21
State only fingerprint check^^^
-- -- -- 9 10 2
Name only national check^^^
-- -- -- 16 17 18
Name only state check (ICHAT)^^^
-- -- -- 61 76 69
State sex offender registry
59 62 69 69 74 73
State child abuse registry
41 42 46 49 51 50
Driving record/license 52 50 51 56 57 55
In Person/ Written
Personal character references
81 76 81 82 81 75
Employment references 35 24 29 31 28 24
Written application 87 77 85 88 92 88
Personal interview 84 81 84 89 87 84
Home assessment 15 8 13 14 13 12
Home visit 11 8 11 17 12 13
Drug test+ -- -- -- -- -- <1
Survey+ -- -- -- -- -- 17
Other+ -- -- -- -- -- 18
None of the above 5 5 3 2 2 1
*Discontinued in Wave VI ^^^Added in Wave VI +Added in Wave VIII ^^^+SafetyNet added to question in Wave VIII NOTE: Not all categories shown
The Scope and Nature of Mentoring in Michigan
Kahle Research Solutions Page 19 February 2011
Mentor Training and Support (Exhibits 10,11,12) Each year respondents are asked to report the number of hours that their programs spend on pre-match, face-to-face mentor training, as well as post-match mentor training and support. In Wave VIII these two questions were worded differently than in previous waves, which may have impacted the results. Please see Exhibit B-1 in Appendix B to view the wording changes. The mean number of hours of pre-match training has decreased by 1.1 hours since Wave VII, but post-match mentor training and support hours have increased by .8 hours. (See Exhibit 10.) With a mean of 14.9 hours, Community-based programs far exceed all other program types in the number of hours they spend on post-match training and support. (See Exhibit 11.)
Exhibit 10 Mean Hours Spent on Mentor Training and Support from Programs
Wave VII vs. Wave VIII of the Mentor Michigan Census
Wave VII Mean Wave VIII Mean
Pre-match, face-to-face mentor training 6.2 hours 5.1 hours
Post-match, 1 year of mentor training & support 10.3 hours 11.1 hours
Exhibit 11 Mean Hours Spent on Mentor Training and Support from Programs
by Program Type Wave VIII of the Mentor Michigan Census
Community-based n=107
School- based n=68
Site-based n=15
Faith-based
n=9
Youth Program
N=13
Other n=10
Pre-match, face-to-face mentor training
5.0 6.1 3.4 7.6 1.6 3.3
Post-match, 1 year of mentor training & support
14.9 8.6 5.2 5.5 2.0 9.0
The Scope and Nature of Mentoring in Michigan
Kahle Research Solutions Page 20 February 2011
Exhibit 12 Pre- and Post- Match Training and Support for Mentors Waves VII vs. Wave VIII of the Mentor Michigan Census
Wave VII %
Wave VIII %
Number of hours of in-person, pre-match training for mentors
None 3 4
Less than 1 hour 0 0
1 – <2 hours 15 23
2 – <4 hours 31 28
4 – < 6 hours 17 15
6 – 8 hours 11 11
More than 8 hours 16 14
Don’t know 7 5
Number of post-match hours of mentor training / support
None 5 11
Less than 1 hour 0 0
1 – <2 hours 6 11
2 – <4 hours 17 15
4 – < 6 hours 10 15
6 – 8 hours 15 11
More than 8 hours 33 22
Don’t know 14 15
The Scope and Nature of Mentoring in Michigan
Kahle Research Solutions Page 21 February 2011
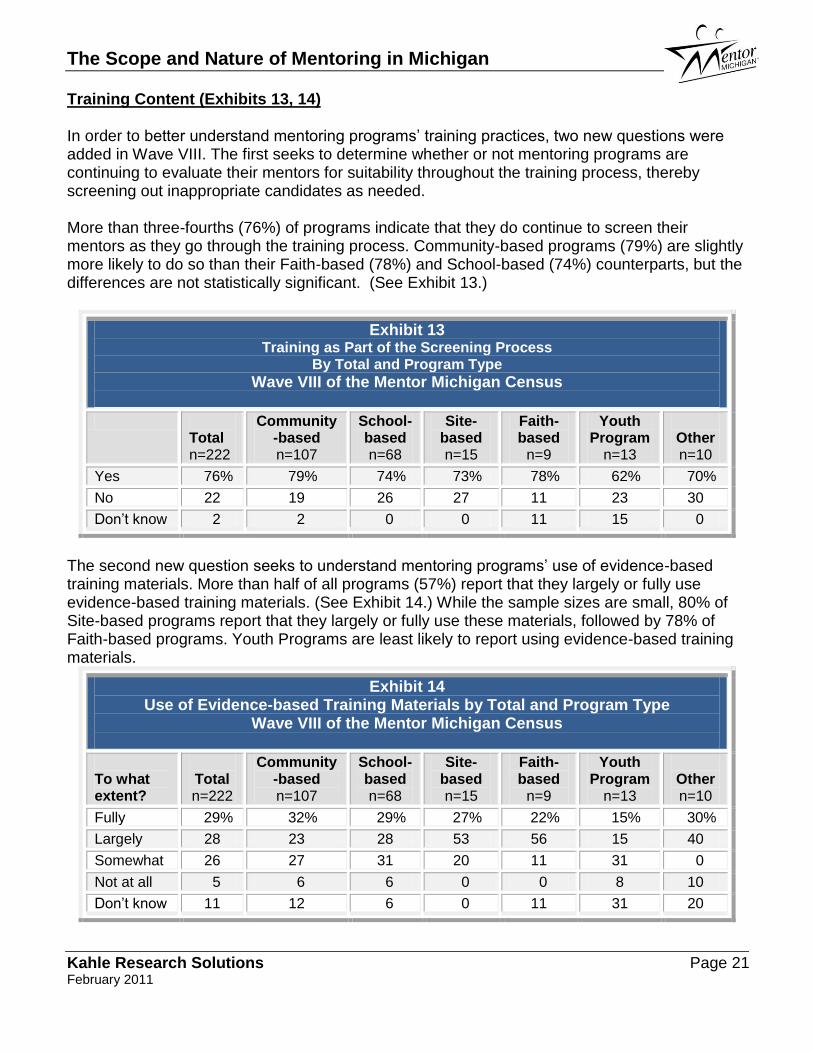
Training Content (Exhibits 13, 14) In order to better understand mentoring programs’ training practices, two new questions were added in Wave VIII. The first seeks to determine whether or not mentoring programs are continuing to evaluate their mentors for suitability throughout the training process, thereby screening out inappropriate candidates as needed. More than three-fourths (76%) of programs indicate that they do continue to screen their mentors as they go through the training process. Community-based programs (79%) are slightly more likely to do so than their Faith-based (78%) and School-based (74%) counterparts, but the differences are not statistically significant. (See Exhibit 13.)
Exhibit 13 Training as Part of the Screening Process
By Total and Program Type
Wave VIII of the Mentor Michigan Census
Total n=222
Community-based n=107
School- based n=68
Site-based n=15
Faith-based
n=9
Youth Program
n=13
Other n=10
Yes 76% 79% 74% 73% 78% 62% 70%
No 22 19 26 27 11 23 30
Don’t know 2 2 0 0 11 15 0
The second new question seeks to understand mentoring programs’ use of evidence-based training materials. More than half of all programs (57%) report that they largely or fully use evidence-based training materials. (See Exhibit 14.) While the sample sizes are small, 80% of Site-based programs report that they largely or fully use these materials, followed by 78% of Faith-based programs. Youth Programs are least likely to report using evidence-based training materials.
Exhibit 14 Use of Evidence-based Training Materials by Total and Program Type
Wave VIII of the Mentor Michigan Census
To what extent?
Total n=222
Community-based n=107
School-based n=68
Site-based n=15
Faith-based
n=9
Youth Program
n=13
Other n=10
Fully 29% 32% 29% 27% 22% 15% 30%
Largely 28 23 28 53 56 15 40
Somewhat 26 27 31 20 11 31 0
Not at all 5 6 6 0 0 8 10
Don’t know 11 12 6 0 11 31 20
The Scope and Nature of Mentoring in Michigan
Kahle Research Solutions Page 22 February 2011
Section III:
Mentoring Types, Intensity and Duration
The Scope and Nature of Mentoring in Michigan
Kahle Research Solutions Page 23 February 2011
Section III: Mentoring Types, Intensity and Duration
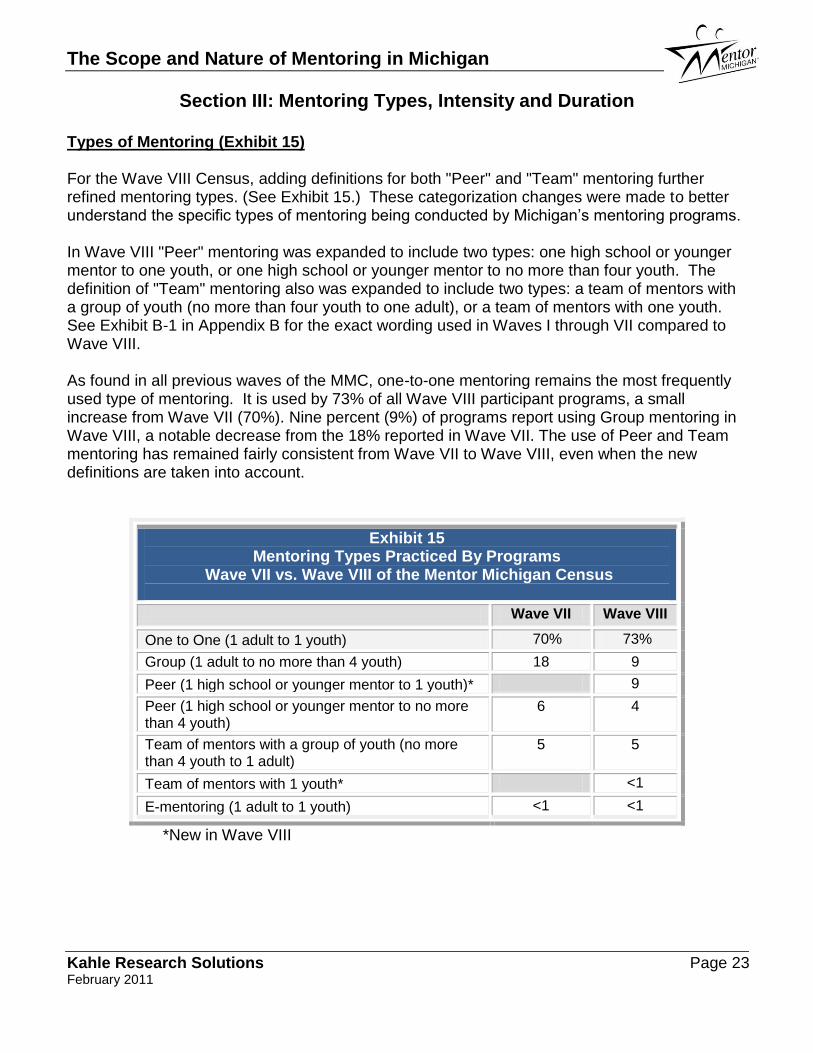
Types of Mentoring (Exhibit 15) For the Wave VIII Census, adding definitions for both "Peer" and "Team" mentoring further refined mentoring types. (See Exhibit 15.) These categorization changes were made to better understand the specific types of mentoring being conducted by Michigan’s mentoring programs. In Wave VIII "Peer" mentoring was expanded to include two types: one high school or younger mentor to one youth, or one high school or younger mentor to no more than four youth. The definition of "Team" mentoring also was expanded to include two types: a team of mentors with a group of youth (no more than four youth to one adult), or a team of mentors with one youth. See Exhibit B-1 in Appendix B for the exact wording used in Waves I through VII compared to Wave VIII. As found in all previous waves of the MMC, one-to-one mentoring remains the most frequently used type of mentoring. It is used by 73% of all Wave VIII participant programs, a small increase from Wave VII (70%). Nine percent (9%) of programs report using Group mentoring in Wave VIII, a notable decrease from the 18% reported in Wave VII. The use of Peer and Team mentoring has remained fairly consistent from Wave VII to Wave VIII, even when the new definitions are taken into account.
Exhibit 15 Mentoring Types Practiced By Programs
Wave VII vs. Wave VIII of the Mentor Michigan Census
Wave VII Wave VIII
One to One (1 adult to 1 youth) 70% 73%
Group (1 adult to no more than 4 youth) 18 9
Peer (1 high school or younger mentor to 1 youth)* 9
Peer (1 high school or younger mentor to no more than 4 youth)
6 4
Team of mentors with a group of youth (no more than 4 youth to 1 adult)
5 5
Team of mentors with 1 youth* <1
E-mentoring (1 adult to 1 youth) <1 <1
*New in Wave VIII
The Scope and Nature of Mentoring in Michigan
Kahle Research Solutions Page 24 February 2011
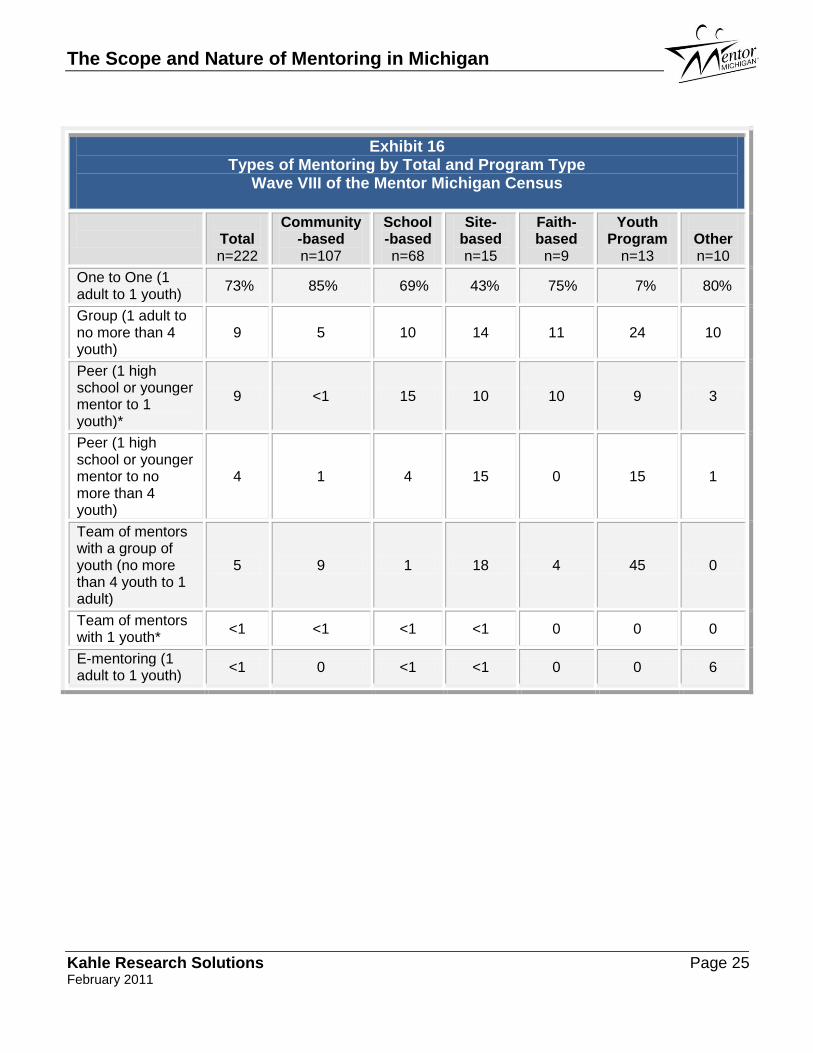
Types of Mentoring by Program Type (Exhibit 16) One-to-one mentoring is the primary form of mentoring across all program types. (See Exhibit 16.) Community-based programs use this method most often (85%), followed by Other programs (80%), Faith-based programs (75%) and School-based programs (69%). Youth programs use a team of mentors with a group of youth (no more than 4 youth to 1 adult) as their primary means of mentoring (45%), followed by group mentoring (24%) and a combination of the two forms of peer mentoring (also 24%). Although Site-based programs describe most of their mentoring as one-to-one, a good percentage also use peer mentoring in one form or the other (25%) as well as a team of mentors with a group of youth (no more than 4 youth to 1 adult) (18%). Less than one percent (1%) of any program type uses a team of mentors with one youth, and there is very little use of e-mentoring (<1%). Only programs categorized as Other report using e-mentoring (6%) to any extent.
The Scope and Nature of Mentoring in Michigan
Kahle Research Solutions Page 25 February 2011
Exhibit 16 Types of Mentoring by Total and Program Type
Wave VIII of the Mentor Michigan Census
Total n=222
Community-based n=107
School-based n=68
Site-based n=15
Faith-based
n=9
Youth Program
n=13
Other n=10
One to One (1 adult to 1 youth)
73% 85% 69% 43% 75% 7% 80%
Group (1 adult to no more than 4 youth)
9 5 10 14 11 24 10
Peer (1 high school or younger mentor to 1 youth)*
9 <1 15 10 10 9 3
Peer (1 high school or younger mentor to no more than 4 youth)
4 1 4 15 0 15 1
Team of mentors with a group of youth (no more than 4 youth to 1 adult)
5 9 1 18 4 45 0
Team of mentors with 1 youth*
<1 <1 <1 <1 0 0 0
E-mentoring (1 adult to 1 youth)
<1 0 <1 <1 0 0 6
The Scope and Nature of Mentoring in Michigan
Kahle Research Solutions Page 26 February 2011
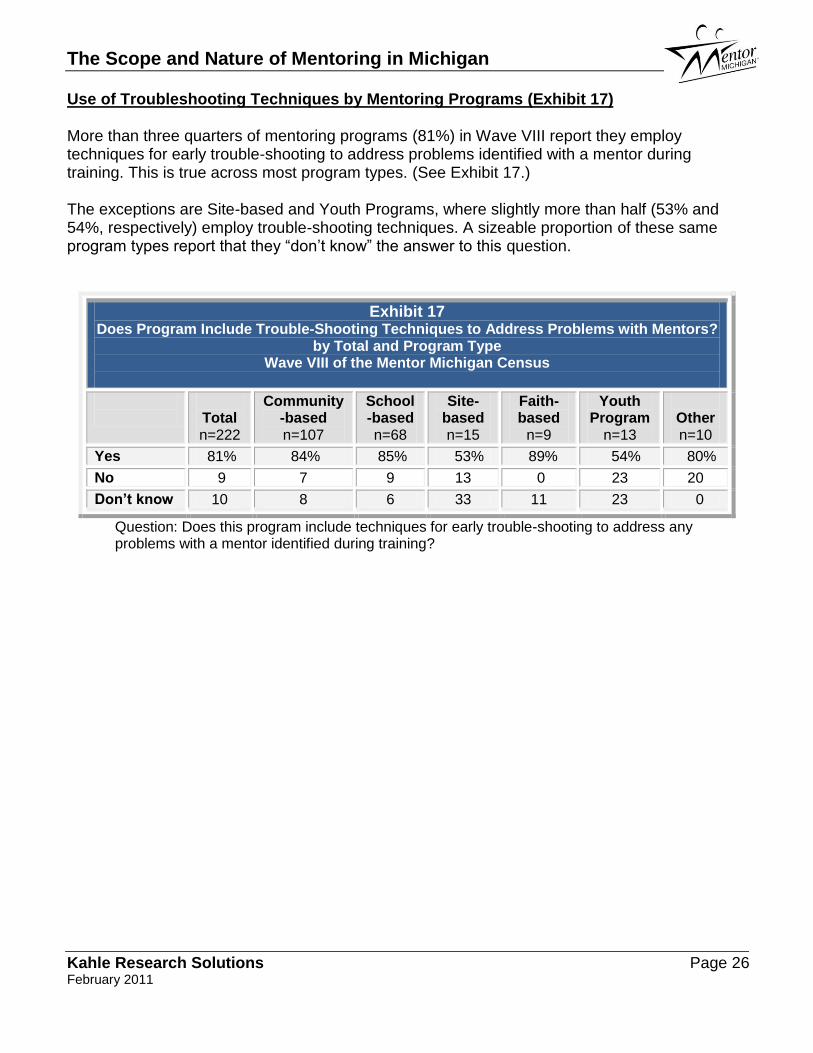
Use of Troubleshooting Techniques by Mentoring Programs (Exhibit 17) More than three quarters of mentoring programs (81%) in Wave VIII report they employ techniques for early trouble-shooting to address problems identified with a mentor during training. This is true across most program types. (See Exhibit 17.) The exceptions are Site-based and Youth Programs, where slightly more than half (53% and 54%, respectively) employ trouble-shooting techniques. A sizeable proportion of these same program types report that they “don’t know” the answer to this question.
Exhibit 17 Does Program Include Trouble-Shooting Techniques to Address Problems with Mentors?
by Total and Program Type Wave VIII of the Mentor Michigan Census
Total n=222
Community-based n=107
School-based n=68
Site-based n=15
Faith-based
n=9
Youth Program
n=13
Other n=10
Yes 81% 84% 85% 53% 89% 54% 80%
No 9 7 9 13 0 23 20
Don’t know 10 8 6 33 11 23 0
Question: Does this program include techniques for early trouble-shooting to address any problems with a mentor identified during training?
The Scope and Nature of Mentoring in Michigan
Kahle Research Solutions Page 27 February 2011
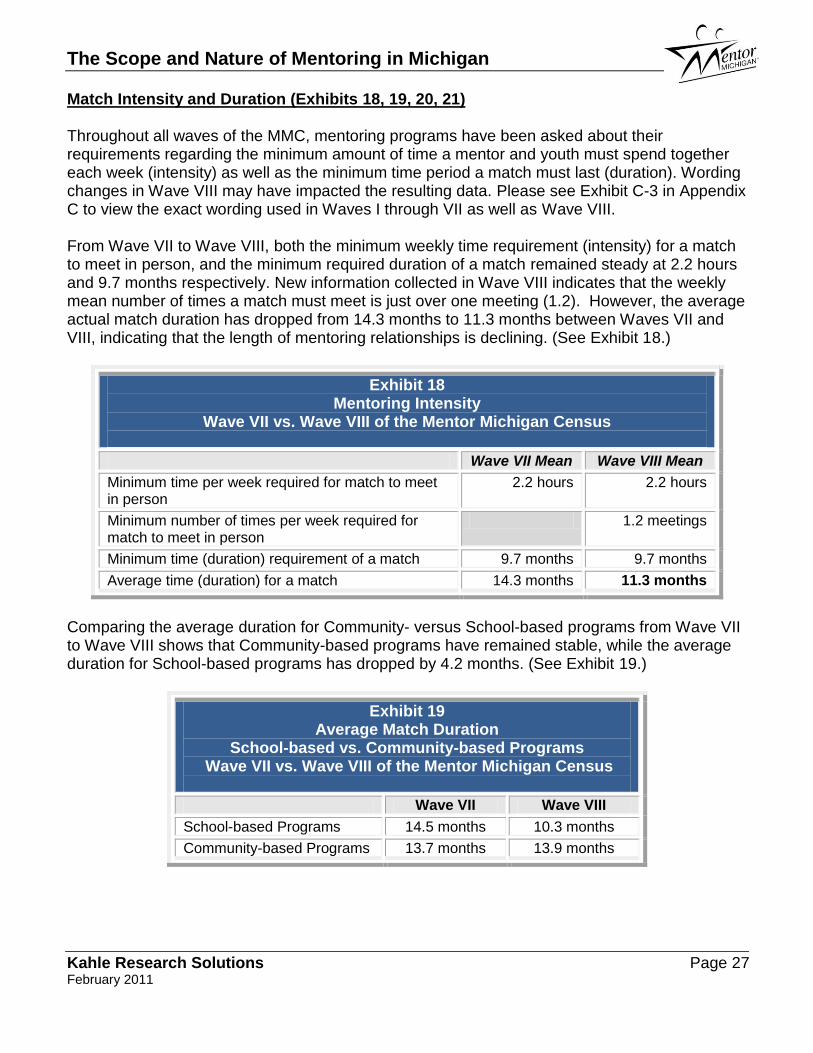
Match Intensity and Duration (Exhibits 18, 19, 20, 21) Throughout all waves of the MMC, mentoring programs have been asked about their requirements regarding the minimum amount of time a mentor and youth must spend together each week (intensity) as well as the minimum time period a match must last (duration). Wording changes in Wave VIII may have impacted the resulting data. Please see Exhibit C-3 in Appendix C to view the exact wording used in Waves I through VII as well as Wave VIII. From Wave VII to Wave VIII, both the minimum weekly time requirement (intensity) for a match to meet in person, and the minimum required duration of a match remained steady at 2.2 hours and 9.7 months respectively. New information collected in Wave VIII indicates that the weekly mean number of times a match must meet is just over one meeting (1.2). However, the average actual match duration has dropped from 14.3 months to 11.3 months between Waves VII and VIII, indicating that the length of mentoring relationships is declining. (See Exhibit 18.)
Exhibit 18 Mentoring Intensity
Wave VII vs. Wave VIII of the Mentor Michigan Census
Wave VII Mean Wave VIII Mean
Minimum time per week required for match to meet in person
2.2 hours 2.2 hours
Minimum number of times per week required for match to meet in person
1.2 meetings
Minimum time (duration) requirement of a match 9.7 months 9.7 months
Average time (duration) for a match 14.3 months 11.3 months
Comparing the average duration for Community- versus School-based programs from Wave VII to Wave VIII shows that Community-based programs have remained stable, while the average duration for School-based programs has dropped by 4.2 months. (See Exhibit 19.)
Exhibit 19 Average Match Duration
School-based vs. Community-based Programs Wave VII vs. Wave VIII of the Mentor Michigan Census
Wave VII Wave VIII
School-based Programs 14.5 months 10.3 months
Community-based Programs 13.7 months 13.9 months
The Scope and Nature of Mentoring in Michigan
Kahle Research Solutions Page 28 February 2011
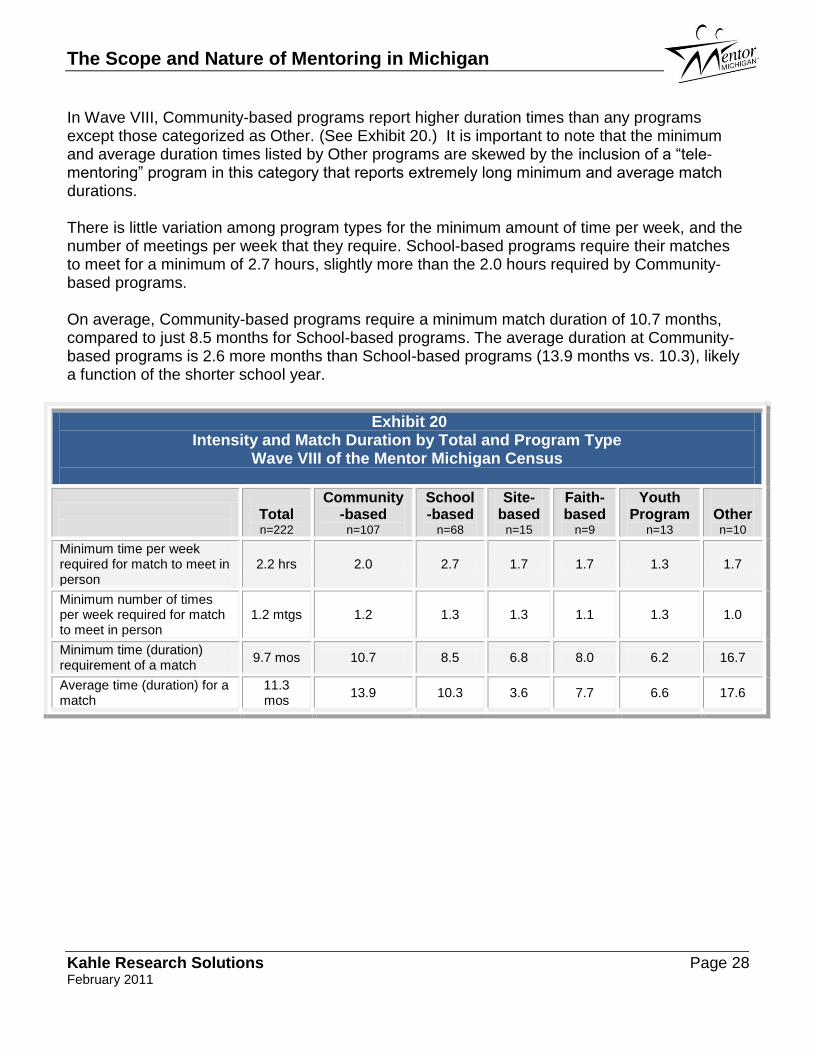
In Wave VIII, Community-based programs report higher duration times than any programs except those categorized as Other. (See Exhibit 20.) It is important to note that the minimum and average duration times listed by Other programs are skewed by the inclusion of a “tele-mentoring” program in this category that reports extremely long minimum and average match durations. There is little variation among program types for the minimum amount of time per week, and the number of meetings per week that they require. School-based programs require their matches to meet for a minimum of 2.7 hours, slightly more than the 2.0 hours required by Community-based programs. On average, Community-based programs require a minimum match duration of 10.7 months, compared to just 8.5 months for School-based programs. The average duration at Community-based programs is 2.6 more months than School-based programs (13.9 months vs. 10.3), likely a function of the shorter school year.
Exhibit 20 Intensity and Match Duration by Total and Program Type
Wave VIII of the Mentor Michigan Census
Total n=222
Community-based
n=107
School-based
n=68
Site-based
n=15
Faith-based
n=9
Youth Program
n=13
Other n=10
Minimum time per week required for match to meet in person
2.2 hrs 2.0 2.7 1.7 1.7 1.3 1.7
Minimum number of times per week required for match to meet in person
1.2 mtgs 1.2 1.3 1.3 1.1 1.3 1.0
Minimum time (duration) requirement of a match
9.7 mos 10.7 8.5 6.8 8.0 6.2 16.7
Average time (duration) for a match
11.3 mos
13.9 10.3 3.6 7.7 6.6 17.6
The Scope and Nature of Mentoring in Michigan
Kahle Research Solutions Page 29 February 2011
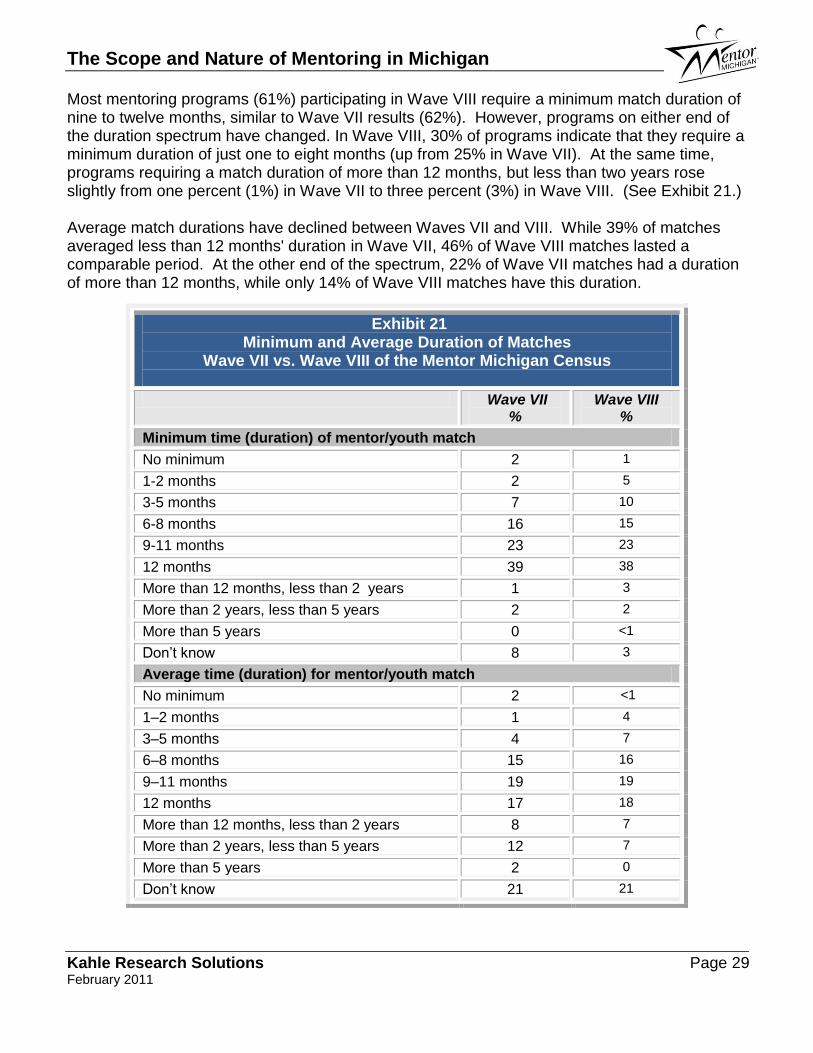
Most mentoring programs (61%) participating in Wave VIII require a minimum match duration of nine to twelve months, similar to Wave VII results (62%). However, programs on either end of the duration spectrum have changed. In Wave VIII, 30% of programs indicate that they require a minimum duration of just one to eight months (up from 25% in Wave VII). At the same time, programs requiring a match duration of more than 12 months, but less than two years rose slightly from one percent (1%) in Wave VII to three percent (3%) in Wave VIII. (See Exhibit 21.) Average match durations have declined between Waves VII and VIII. While 39% of matches averaged less than 12 months' duration in Wave VII, 46% of Wave VIII matches lasted a comparable period. At the other end of the spectrum, 22% of Wave VII matches had a duration of more than 12 months, while only 14% of Wave VIII matches have this duration.
Exhibit 21 Minimum and Average Duration of Matches
Wave VII vs. Wave VIII of the Mentor Michigan Census
Wave VII %
Wave VIII %
Minimum time (duration) of mentor/youth match
No minimum 2 1
1-2 months 2 5
3-5 months 7 10
6-8 months 16 15
9-11 months 23 23
12 months 39 38
More than 12 months, less than 2 years 1 3
More than 2 years, less than 5 years 2 2
More than 5 years 0 <1
Don’t know 8 3
Average time (duration) for mentor/youth match
No minimum 2 <1
1–2 months 1 4
3–5 months 4 7
6–8 months 15 16
9–11 months 19 19
12 months 17 18
More than 12 months, less than 2 years 8 7
More than 2 years, less than 5 years 12 7
More than 5 years 2 0
Don’t know 21 21
The Scope and Nature of Mentoring in Michigan
Kahle Research Solutions Page 30 February 2011
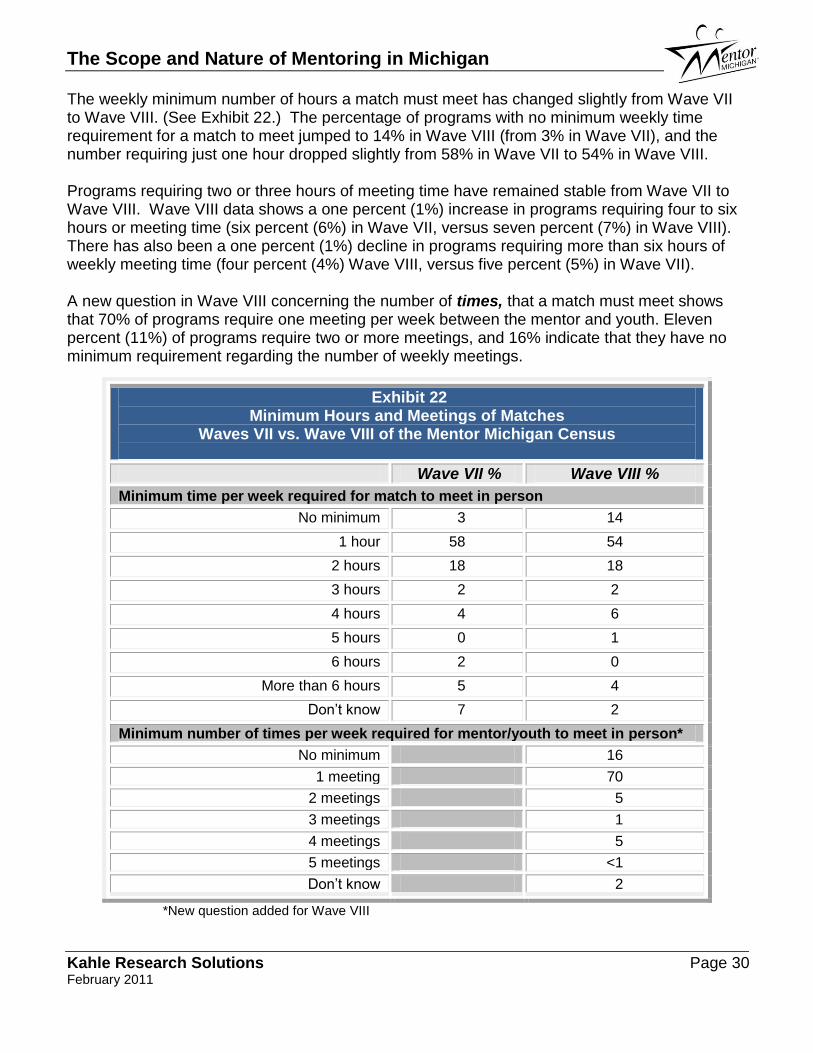
The weekly minimum number of hours a match must meet has changed slightly from Wave VII to Wave VIII. (See Exhibit 22.) The percentage of programs with no minimum weekly time requirement for a match to meet jumped to 14% in Wave VIII (from 3% in Wave VII), and the number requiring just one hour dropped slightly from 58% in Wave VII to 54% in Wave VIII. Programs requiring two or three hours of meeting time have remained stable from Wave VII to Wave VIII. Wave VIII data shows a one percent (1%) increase in programs requiring four to six hours or meeting time (six percent (6%) in Wave VII, versus seven percent (7%) in Wave VIII). There has also been a one percent (1%) decline in programs requiring more than six hours of weekly meeting time (four percent (4%) Wave VIII, versus five percent (5%) in Wave VII). A new question in Wave VIII concerning the number of times, that a match must meet shows that 70% of programs require one meeting per week between the mentor and youth. Eleven percent (11%) of programs require two or more meetings, and 16% indicate that they have no minimum requirement regarding the number of weekly meetings.
Exhibit 22 Minimum Hours and Meetings of Matches
Waves VII vs. Wave VIII of the Mentor Michigan Census
Wave VII % Wave VIII %
Minimum time per week required for match to meet in person
No minimum 3 14
1 hour 58 54
2 hours 18 18
3 hours 2 2
4 hours 4 6
5 hours 0 1
6 hours 2 0
More than 6 hours 5 4
Don’t know 7 2
Minimum number of times per week required for mentor/youth to meet in person*
No minimum 16
1 meeting 70
2 meetings 5
3 meetings 1
4 meetings 5
5 meetings <1
Don’t know 2
*New question added for Wave VIII
The Scope and Nature of Mentoring in Michigan
Kahle Research Solutions Page 31 February 2011
Section IV:
Youth Outcomes Targeted by Mentoring Programs
The Scope and Nature of Mentoring in Michigan
Kahle Research Solutions Page 32 February 2011
Section IV: Youth Outcomes Targeted by Mentoring Programs
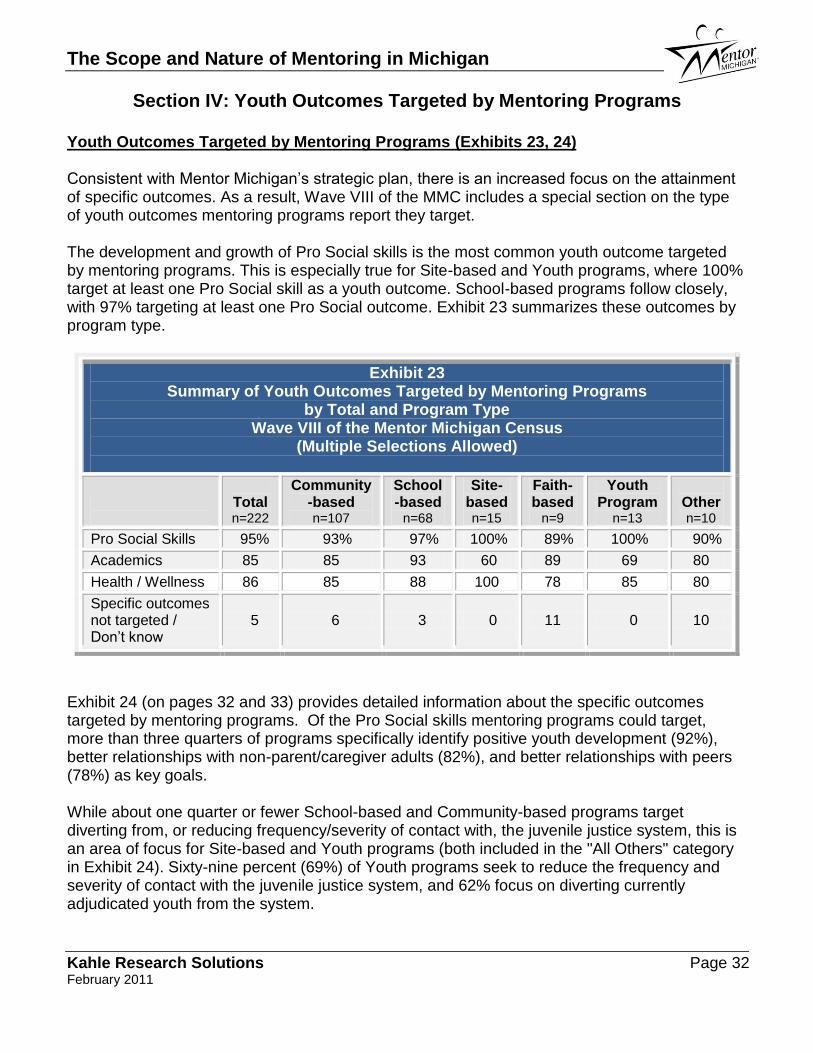
Youth Outcomes Targeted by Mentoring Programs (Exhibits 23, 24) Consistent with Mentor Michigan’s strategic plan, there is an increased focus on the attainment of specific outcomes. As a result, Wave VIII of the MMC includes a special section on the type of youth outcomes mentoring programs report they target. The development and growth of Pro Social skills is the most common youth outcome targeted by mentoring programs. This is especially true for Site-based and Youth programs, where 100% target at least one Pro Social skill as a youth outcome. School-based programs follow closely, with 97% targeting at least one Pro Social outcome. Exhibit 23 summarizes these outcomes by program type.
Exhibit 23 Summary of Youth Outcomes Targeted by Mentoring Programs
by Total and Program Type Wave VIII of the Mentor Michigan Census
(Multiple Selections Allowed)
Total n=222
Community-based n=107
School-based
n=68
Site-based n=15
Faith-based
n=9
Youth Program
n=13
Other n=10
Pro Social Skills 95% 93% 97% 100% 89% 100% 90%
Academics 85 85 93 60 89 69 80
Health / Wellness 86 85 88 100 78 85 80
Specific outcomes not targeted / Don’t know
5 6 3 0 11 0 10
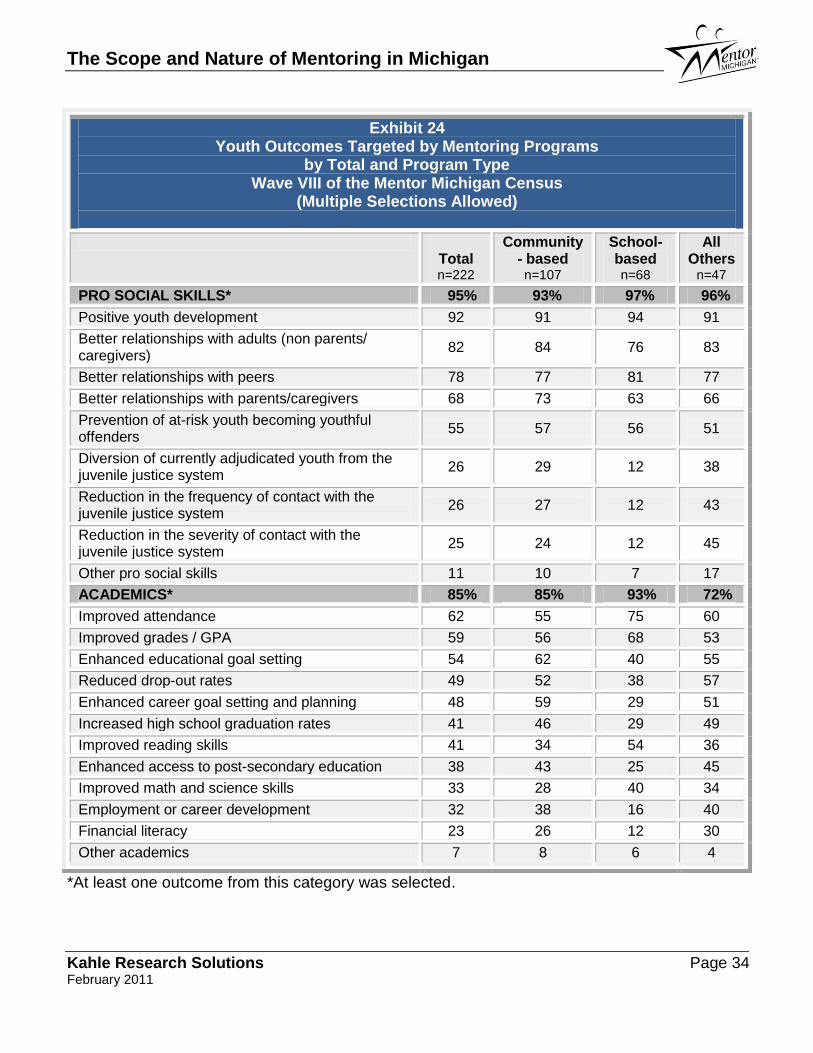
Exhibit 24 (on pages 32 and 33) provides detailed information about the specific outcomes targeted by mentoring programs. Of the Pro Social skills mentoring programs could target, more than three quarters of programs specifically identify positive youth development (92%), better relationships with non-parent/caregiver adults (82%), and better relationships with peers (78%) as key goals. While about one quarter or fewer School-based and Community-based programs target diverting from, or reducing frequency/severity of contact with, the juvenile justice system, this is an area of focus for Site-based and Youth programs (both included in the "All Others" category in Exhibit 24). Sixty-nine percent (69%) of Youth programs seek to reduce the frequency and severity of contact with the juvenile justice system, and 62% focus on diverting currently adjudicated youth from the system.
The Scope and Nature of Mentoring in Michigan
Kahle Research Solutions Page 33 February 2011
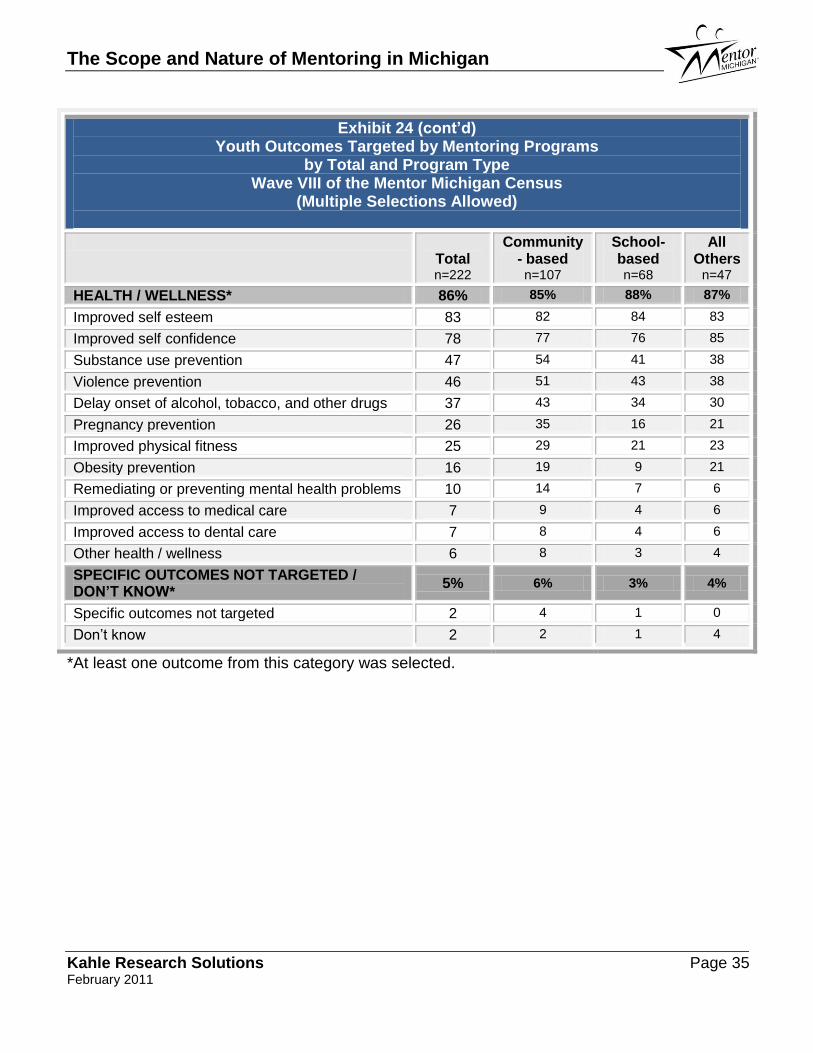
Various Academic outcomes are an area of focus for more than 80% of all programs. Not surprisingly, 93% of School-based programs indicate this is a focus. Within Academics, improved attendance (62%), and grades/GPA (59%) are the highest priorities. Eighty-six percent (86%) of all programs have a Health/Wellness focus for youth. Improved self- esteem (83%) and improved self-confidence (78%) are the most often cited Health and Wellness outcomes targeted. All Site-based programs (100%) have some Health/Wellness focus. Improved physical fitness (25%) and obesity prevention (16%) are targeted by relatively few mentoring programs, which is a concern in light of the growing number of obese youth in this country. Encouragingly, nearly all mentoring programs target specific youth outcomes consistent with the Mentor Michigan strategic plan. Only five percent (5%) of all programs indicate, “specific outcomes not targeted” or “don’t know”.
The Scope and Nature of Mentoring in Michigan
Kahle Research Solutions Page 34 February 2011
Exhibit 24 Youth Outcomes Targeted by Mentoring Programs
by Total and Program Type Wave VIII of the Mentor Michigan Census
(Multiple Selections Allowed)
Total n=222
Community- based
n=107
School-based
n=68
All Others
n=47
PRO SOCIAL SKILLS* 95% 93% 97% 96%
Positive youth development 92 91 94 91
Better relationships with adults (non parents/ caregivers)
82 84 76 83
Better relationships with peers 78 77 81 77
Better relationships with parents/caregivers 68 73 63 66
Prevention of at-risk youth becoming youthful offenders
55 57 56 51
Diversion of currently adjudicated youth from the juvenile justice system
26 29 12 38
Reduction in the frequency of contact with the juvenile justice system
26 27 12 43
Reduction in the severity of contact with the juvenile justice system
25 24 12 45
Other pro social skills 11 10 7 17
ACADEMICS* 85% 85% 93% 72%
Improved attendance 62 55 75 60
Improved grades / GPA 59 56 68 53
Enhanced educational goal setting 54 62 40 55
Reduced drop-out rates 49 52 38 57
Enhanced career goal setting and planning 48 59 29 51
Increased high school graduation rates 41 46 29 49
Improved reading skills 41 34 54 36
Enhanced access to post-secondary education 38 43 25 45
Improved math and science skills 33 28 40 34
Employment or career development 32 38 16 40
Financial literacy 23 26 12 30
Other academics 7 8 6 4
*At least one outcome from this category was selected.
The Scope and Nature of Mentoring in Michigan
Kahle Research Solutions Page 35 February 2011
Exhibit 24 (cont’d) Youth Outcomes Targeted by Mentoring Programs
by Total and Program Type Wave VIII of the Mentor Michigan Census
(Multiple Selections Allowed)
Total n=222
Community- based
n=107
School-based
n=68
All Others
n=47
HEALTH / WELLNESS* 86% 85% 88% 87%
Improved self esteem 83 82 84 83
Improved self confidence 78 77 76 85
Substance use prevention 47 54 41 38
Violence prevention 46 51 43 38
Delay onset of alcohol, tobacco, and other drugs 37 43 34 30
Pregnancy prevention 26 35 16 21
Improved physical fitness 25 29 21 23
Obesity prevention 16 19 9 21
Remediating or preventing mental health problems 10 14 7 6
Improved access to medical care 7 9 4 6
Improved access to dental care 7 8 4 6
Other health / wellness 6 8 3 4
SPECIFIC OUTCOMES NOT TARGETED / DON’T KNOW*
5% 6% 3% 4%
Specific outcomes not targeted 2 4 1 0
Don’t know 2 2 1 4
*At least one outcome from this category was selected.
The Scope and Nature of Mentoring in Michigan
Kahle Research Solutions Page 36 February 2011
Section V:
Program Evaluation
The Scope and Nature of Mentoring in Michigan
Kahle Research Solutions Page 37 February 2011
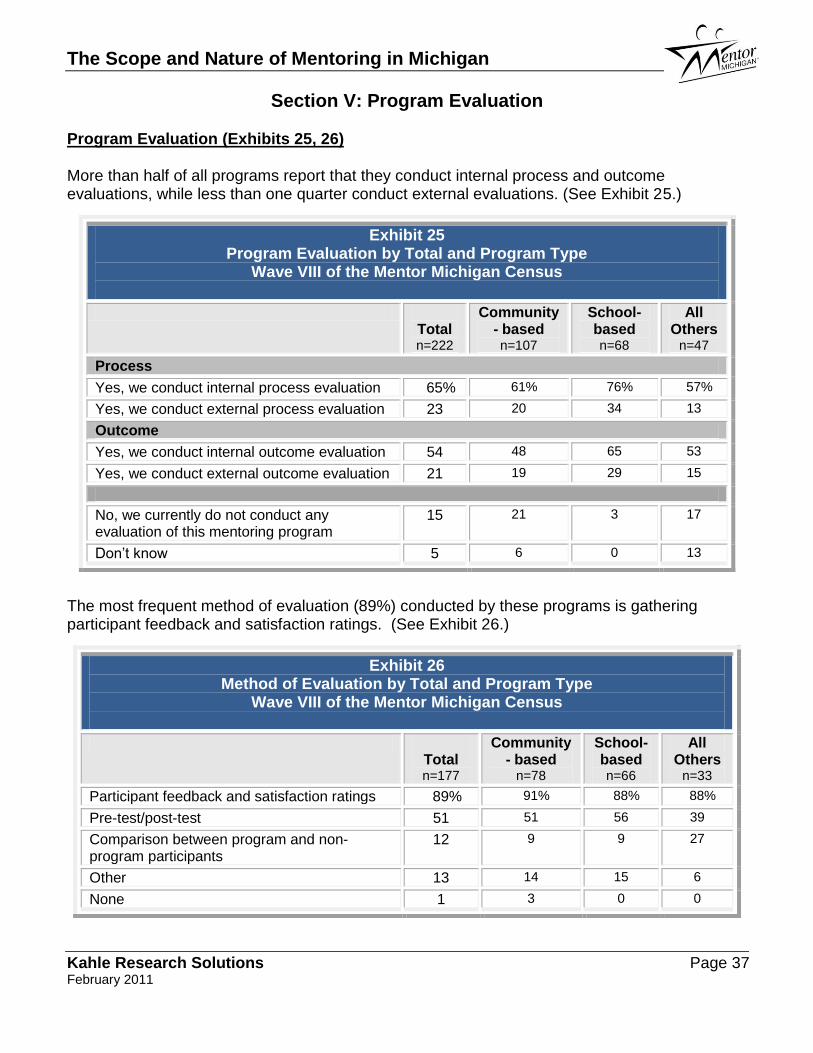
Section V: Program Evaluation Program Evaluation (Exhibits 25, 26) More than half of all programs report that they conduct internal process and outcome evaluations, while less than one quarter conduct external evaluations. (See Exhibit 25.)
Exhibit 25 Program Evaluation by Total and Program Type
Wave VIII of the Mentor Michigan Census
Total n=222
Community- based
n=107
School-based
n=68
All Others
n=47
Process
Yes, we conduct internal process evaluation 65% 61% 76% 57%
Yes, we conduct external process evaluation 23 20 34 13
Outcome
Yes, we conduct internal outcome evaluation 54 48 65 53
Yes, we conduct external outcome evaluation 21 19 29 15
No, we currently do not conduct any evaluation of this mentoring program
15 21 3 17
Don’t know 5 6 0 13
The most frequent method of evaluation (89%) conducted by these programs is gathering participant feedback and satisfaction ratings. (See Exhibit 26.)
Exhibit 26 Method of Evaluation by Total and Program Type
Wave VIII of the Mentor Michigan Census
Total n=177
Community- based
n=78
School-based
n=66
All Others
n=33
Participant feedback and satisfaction ratings 89% 91% 88% 88%
Pre-test/post-test 51 51 56 39
Comparison between program and non-program participants
12 9 9 27
Other 13 14 15 6
None 1 3 0 0
The Scope and Nature of Mentoring in Michigan
Kahle Research Solutions Page 38 February 2011
Evidence of Effectiveness Respondents were asked to provide qualitative feedback regarding what they see as the most convincing evidence of the effectiveness of their programs. Their feedback is organized by three levels of reliability:
1. Anecdotal self reports 2. Pre- and post-testing/research-based evaluations 3. Use of comparative and/or control groups
1. Anecdotal self reports The most common method of measuring program effectiveness cited by survey respondents is through anecdotal self reports from the youth they serve. These reports are sometimes prompted, but very often are relayed spontaneously through informal conversations or notes.
“Students come back years later and tell us how valuable their mentor was to them.”
“Many students name having a mentor as one of the most formative experiences during their college years.”
“There have been numerous examples of positive impact. Many of our participants had a safe place to come and have fun over the summer and did not have to worry about the numerous changes they are subjected to on a daily basis.” “Information given by youth themselves with input on how their mentor has affected their life in a positive way, such as: helping them get a job, showing them what positive „fun‟ is and how to experience joy. This is how we know we are effective the most.” “The essays that the girls have written about participating in the program and how this has impacted them.”
Third party reporting by teachers, mentors, parents, and social justice personnel provide many of the anecdotal reports these programs cite as evidence of their effectiveness. This feedback is acquired through interviews, essays, and word of mouth.
“Judges report they receive more information in order to make better decisions for the children.” “Teachers comment on yearly evaluations citing a student‟s academic improvement because of the one-on-one time they spend with a volunteer.” “The feedback of mentors regarding their satisfaction with the relationship weighs heavily.” “The personal testimonies of mentors, mentees, and involved caregivers in the enhanced personal success of the mentees.”

The Scope and Nature of Mentoring in Michigan
Kahle Research Solutions Page 39 February 2011
“Words and gratitude have been expressed by parents who state they have seen improvement in the child's attitude at home and better performance in school.”
Some programs are using more objective measures such as grades, drug tests, and participation in extracurricular activities as evidence of their effectiveness.
“Last year we served 37 youth and 78% of those students are still enrolled on (college) campus and on course for graduation. In addition, 97% of the students in our mentoring program joined other student organizations on campus.” “The results of a student's GPA, extracurricular activities, scholarships, financial aid, acceptance into the college of their choice, and their (feedback) and parents' feedback are also weighed heavily.”
“Elementary school students lagging behind academically were able to improve enough to progress to next grade level with peers.” “Children finishing high school, getting adopted, behaviors improving within the home. Evidence is based on communication with foster parents, mentors, mentees and DHS workers.” “Positive results from drug testing.” “The youth have increasingly better attendance at the meetings. They also continue to bring their friends to join in the group.” “I have a mentee who was referred to me by this probation officer and within the past year he has turned his life around, he is back in school and doing great.” “We have a 99% completion rate for high school graduation within our group. None of our group is presently involved with the justice system. 30% of our youth are attending college.”
2. Pre- and post-testing/research-based evaluations Some mentoring programs report that they perform pre- and post-testing to measure the effectiveness of their efforts, while some others make use of research-based evaluations.
“We give youth a survey before and after mentoring to measure how good their self-esteem is and how well they are doing in school and in terms of relationships with adults.”
“Using the Brigance assessment tools, the children involved in the (name) Program this past year increased their scores on average 28 points. This put the majority of our children in a scoring range of 75% or above.” “84% of youth increased an academic grade while in the program, 90% of youth continued their education past high school. Teachers reported (youth) had statistically significant positive changes in youth behavior/mindset in 12 categories.”
The Scope and Nature of Mentoring in Michigan
Kahle Research Solutions Page 40 February 2011
“98% of participants were diverted from residential placement as a result of working with a mentor.” “Students who are being mentored had 30% less incidents of discipline reports after they were being mentored than they had prior to the mentor relationship.” “179 children of prisoners improved grade level achievement (85%), improved social skills (90%), improved ability to focus attention (93%) and enjoyed a positive relationship with their (mentor).” “Results from the most recent Strength of Relationship (SOR) survey indicate a child's overall satisfaction rate of 4.4 (out of 5) of their match. Likewise, volunteers had an overall satisfaction rate of 4, giving an overall satisfaction rate of 4 for the Community-based matches.” “87% of youth enrolled in mentoring had a reduction in severity and or frequency of contact with the Juvenile Justice system. 55% of youth enrolled showed an improvement in core academic subjects as measured by GPA, 52% of youth decreased the number of days absent from school while in the program.”
“Youth responded to an open ended question regarding what they gained from having a mentor. The most frequent responses were: Having someone to talk to (53%), feel better about themselves (34%), a friend (26%), and new skills (15%).”
3. Use of comparative and/or control groups While 12% of the 137 Census respondents indicate that they use comparative groups to evaluate their program effectiveness, only three programs provide examples of this in the open-ended portion of the survey. (See Exhibit 27.)
“According to the US Department of Education, migrant students have a 40 to 45% rate of high school graduation nation-wide. (Program‟s) cumulative high school graduation rate for 2008: 83%. Cumulative college enrollment rate for those who graduated high school: 62%.” “Reading levels for students evaluated increased more for students mentored than those not mentored in the same grade and class.” “SOH participants who were tested with the Measures of Academic Progress (MAP) test in both fall and spring had gains that exceeded those of non-SOH participants at the SOH schools in 2nd, 3rd, and 4th grade, but not in 1st grade.”
The Scope and Nature of Mentoring in Michigan
Kahle Research Solutions Page 41 February 2011
Challenges in Documenting Program Outcomes This year’s survey respondents were asked to identify the challenges they encounter in documenting program outcomes. Feedback from these respondents falls into several different categories:
Limited resources/finances
Difficulties acquiring data
Lack of evaluation know-how Limited resources/finances Not surprisingly, a lack of financial resources is the most often cited challenge to documenting program outcomes. Without funding, staff cannot be hired or allocated to perform this work. Instead, financial and human resources are allocated elsewhere.
“Funding and staff time would be the biggest challenges we face in documenting these outcomes.” “The biggest challenge our organization faces is the lack of money. There is an abundance of ideas for programs but not much money to support those ideas.” “I have been Director for three years. There are many things that we do not measure that might be valuable to measure, but that I don't have the ability to implement due to time and staff restraints.” “Our biggest barrier is handling this portion of our program in the time frame available with part-time staffing due to our low budget of available operational funding.” “Financial resources to pay for evaluator.” “Finances. As a volunteer run organization, we do not have the time or resources to do all we know we should.” “The time it takes to effectively document and follow through with documenting as often as needed.” “Having time to process results of surveys.” “The biggest challenge is maintaining adequate staff support.” “Limited resources; limited time.”
“Measurement of outcomes has not been as much of a priority as it will be in our next year because our focus has been largely on administrative development. However, we intend to make pre-evaluations and post-evaluations a larger part of the process.”
The Scope and Nature of Mentoring in Michigan
Kahle Research Solutions Page 42 February 2011
Difficulties acquiring data Many respondents report that it is a constant challenge to obtain completed surveys and other information from mentors, youth, and parents involved in their programs. For many, transient populations and extended timeframes for tracking youth compound the difficulty.
“The biggest challenge we have is collecting reports from our mentors. Currently our mentors are required to fill out monthly mentor reports, but we have a very hard time consistently collecting them back.” “Obtaining post-match evaluation forms from mentors and mentees.” “Some parents who don't want us to check the outcomes.” “Having all participants complete and return outcome evaluations in a timely manner so that progress can be tracked.” “A challenge in documenting outcomes is getting parents to complete the evaluation forms.”
“Some youth move from the area and we lose contact with them.” “Keeping in touch with migrant families throughout the years to be able to track graduation rates.” “Contact is lost… once a family moves away out of area, changes phone number, address.” “Our program serves the entire state of Michigan. Maintaining consistent contact and tracking of the mentors and mentees is sometimes difficult.” “Youth do not stay in touch for longer term follow-up.” “(This) is a prevention program. We must wait up to 10 years to see if youth remain non-court involved as they age. Additionally, they tend to be a very mobile population and it makes tracking outcomes all the more difficult.”
Other programs report having difficulty acquiring needed official records from organizations such as schools and courts, and even other staff within their own organization. A few also express a need for access to control groups in order to measure their success.
“One of the challenges would be obtaining school reports from the various school districts in our County.”
“Getting input from a variety of very busy staff who work with the children on various shifts.” “Having a comparison group of students completing the pre- and post-surveys.” “Access to data to do any comparisons at beginning and end of year as well as between kids who have a tutor and those that do not.”
The Scope and Nature of Mentoring in Michigan
Kahle Research Solutions Page 43 February 2011
Lack of evaluation know-how While most of these respondents know that documenting their program’s outcomes is important, many seem to lack knowledge about how to do so. Some are unaware of how to transfer their program’s anecdotal evaluation methods to measurable goals and outcomes. Others, especially those in Faith-based programs, express concerns about measuring outcomes such as “spiritual growth.”
“Interpreting anecdotal evidence and representing it in ways that are meaningful to multiple groups.” “Tracking and being able to document the impact we are making with the changes in peer mentors.”
“The relationships that develop between a student and a mentor do not always show immediate results and it s very hard to document the growth and development of a student because of the mentoring relationship.” “Finding measurable outcomes.” “It's difficult to connect which service (of many) is having a positive impact. Some youth improve in one area but not others.”
“Much of the outcomes are anecdotal and difficult to apply to a standard measuring system.” “It's difficult to measure outcomes such as spiritual growth. Often the mentor's impact is not fully realized until years later.”
“The outcomes can be similar to planting seeds and not always „documentable‟ in the first few years. We will be tracking school attendance, consistency of the mentoring relationships, documenting stories and things going on in kids lives that we previously were unaware.” “The challenge of continual changes on adjusting the program from research-based information and the requirements to meet those changes.” “Evaluation of the effectiveness of our program has always been an area that we are challenged in. We have several testimonials but not as much statistical data.”
Many respondents indicate they need assistance identifying valid evaluation instruments that will work with their programs. Still others report that they are part of a larger initiative, making it difficult to isolate their program’s outcomes.
“Finding the proper measuring tool to measure social and emotional impact on the children.” “(We need) a basic guideline for conducting research in the least biased way possible.”
“We've changed our evaluation forms a few times in the past few years, so it's hard to get concrete data on ever changing forms.”
The Scope and Nature of Mentoring in Michigan
Kahle Research Solutions Page 44 February 2011
“The biggest challenge our organization faces is finding a way to document qualitative data on the effectiveness of the program and tracking data on program graduates.” “Multiple agencies are involved thus making it more difficult to track.”
“The biggest challenge is evaluating the mentoring program by itself, since it is only one component of a bigger treatment program.”
The Scope and Nature of Mentoring in Michigan
Kahle Research Solutions Page 45 February 2011
Section VI: Demographics
Active Mentors, Youth Served,
Waiting Lists
The Scope and Nature of Mentoring in Michigan
Kahle Research Solutions Page 46 February 2011
Section VI: Demographics Active Mentors, Youth Served, Waiting Lists
Demographics of Mentors and Youth Served (Exhibits 27, 28)
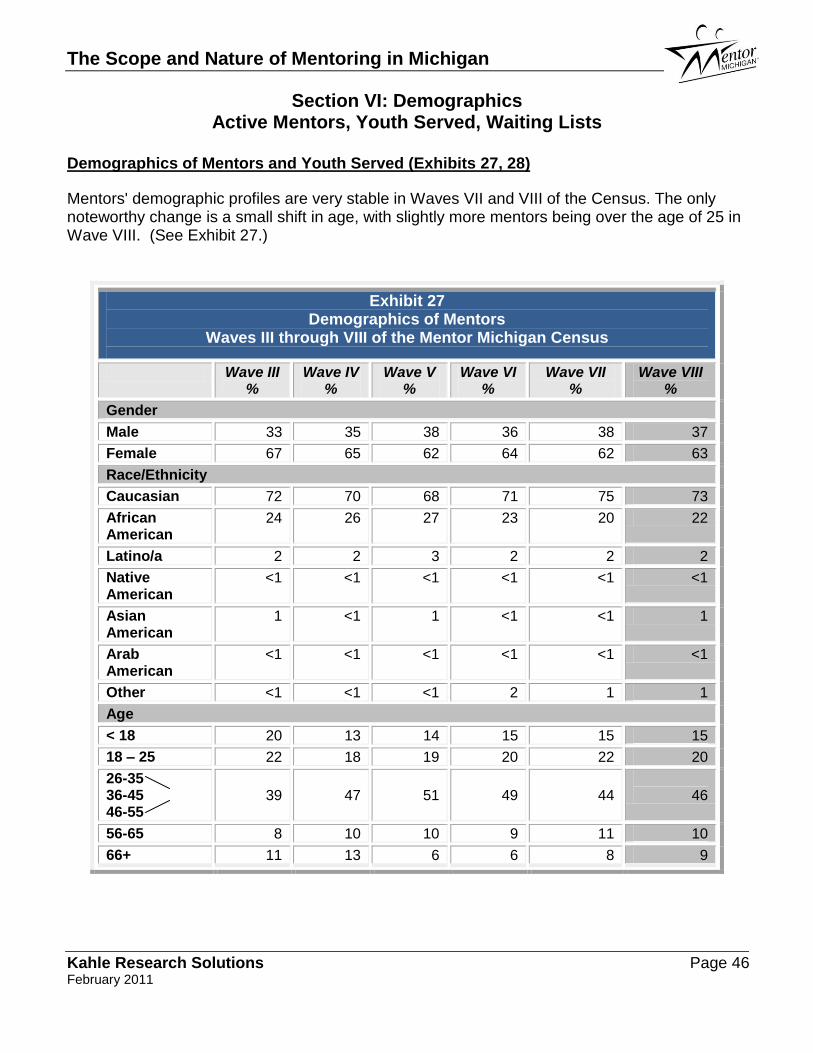
Mentors' demographic profiles are very stable in Waves VII and VIII of the Census. The only noteworthy change is a small shift in age, with slightly more mentors being over the age of 25 in Wave VIII. (See Exhibit 27.)
Exhibit 27 Demographics of Mentors
Waves III through VIII of the Mentor Michigan Census
Wave III %
Wave IV %
Wave V %
Wave VI %
Wave VII %
Wave VIII %
Gender
Male 33 35 38 36 38 37
Female 67 65 62 64 62 63
Race/Ethnicity
Caucasian 72 70 68 71 75 73
African American
24 26 27 23 20 22
Latino/a 2 2 3 2 2 2
Native American
<1 <1 <1 <1 <1 <1
Asian American
1 <1 1 <1 <1 1
Arab American
<1 <1 <1 <1 <1 <1
Other <1 <1 <1 2 1 1
Age
< 18 20 13 14 15 15 15
18 – 25 22 18 19 20 22 20
26-35 36-45 46-55
39
47
51
49
44
46
56-65 8 10 10 9 11 10
66+ 11 13 6 6 8 9
The Scope and Nature of Mentoring in Michigan
Kahle Research Solutions Page 47 February 2011
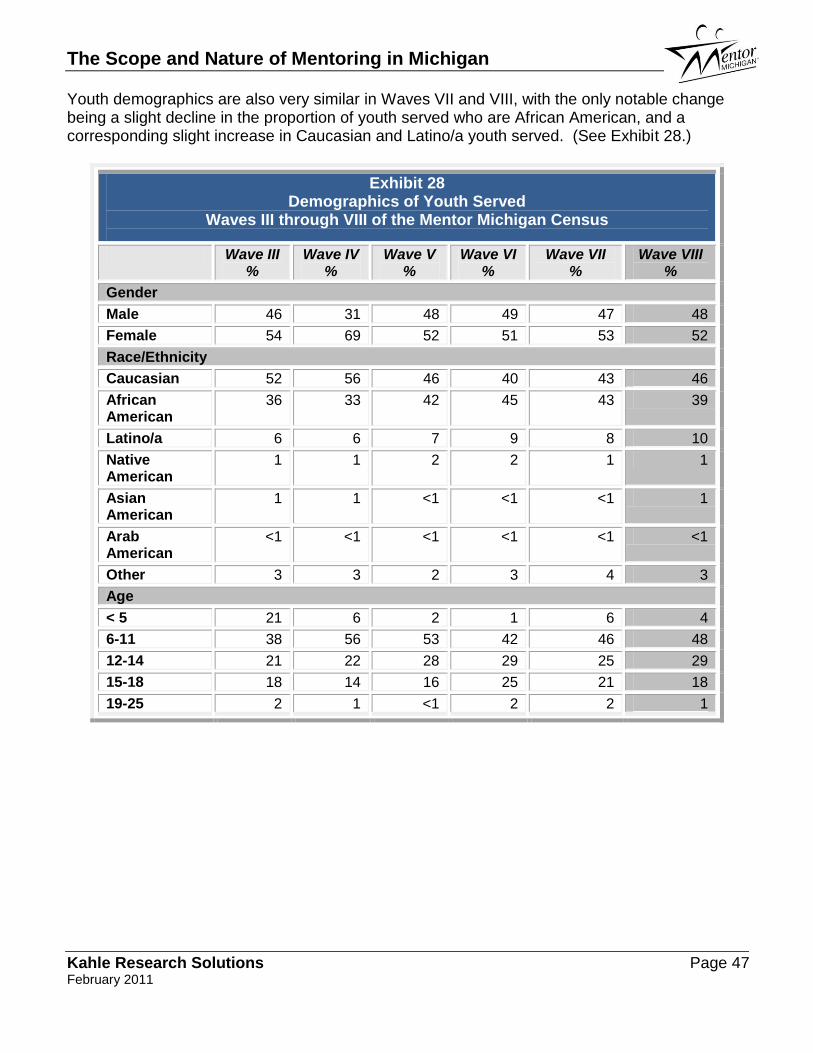
Youth demographics are also very similar in Waves VII and VIII, with the only notable change being a slight decline in the proportion of youth served who are African American, and a corresponding slight increase in Caucasian and Latino/a youth served. (See Exhibit 28.)
Exhibit 28 Demographics of Youth Served
Waves III through VIII of the Mentor Michigan Census
Wave III %
Wave IV %
Wave V %
Wave VI %
Wave VII %
Wave VIII %
Gender
Male 46 31 48 49 47 48
Female 54 69 52 51 53 52
Race/Ethnicity
Caucasian 52 56 46 40 43 46
African American
36 33 42 45 43 39
Latino/a 6 6 7 9 8 10
Native American
1 1 2 2 1 1
Asian American
1 1 <1 <1 <1 1
Arab American
<1 <1 <1 <1 <1 <1
Other 3 3 2 3 4 3
Age
< 5 21 6 2 1 6 4
6-11 38 56 53 42 46 48
12-14 21 22 28 29 25 29
15-18 18 14 16 25 21 18
19-25 2 1 <1 2 2 1
The Scope and Nature of Mentoring in Michigan
Kahle Research Solutions Page 48 February 2011
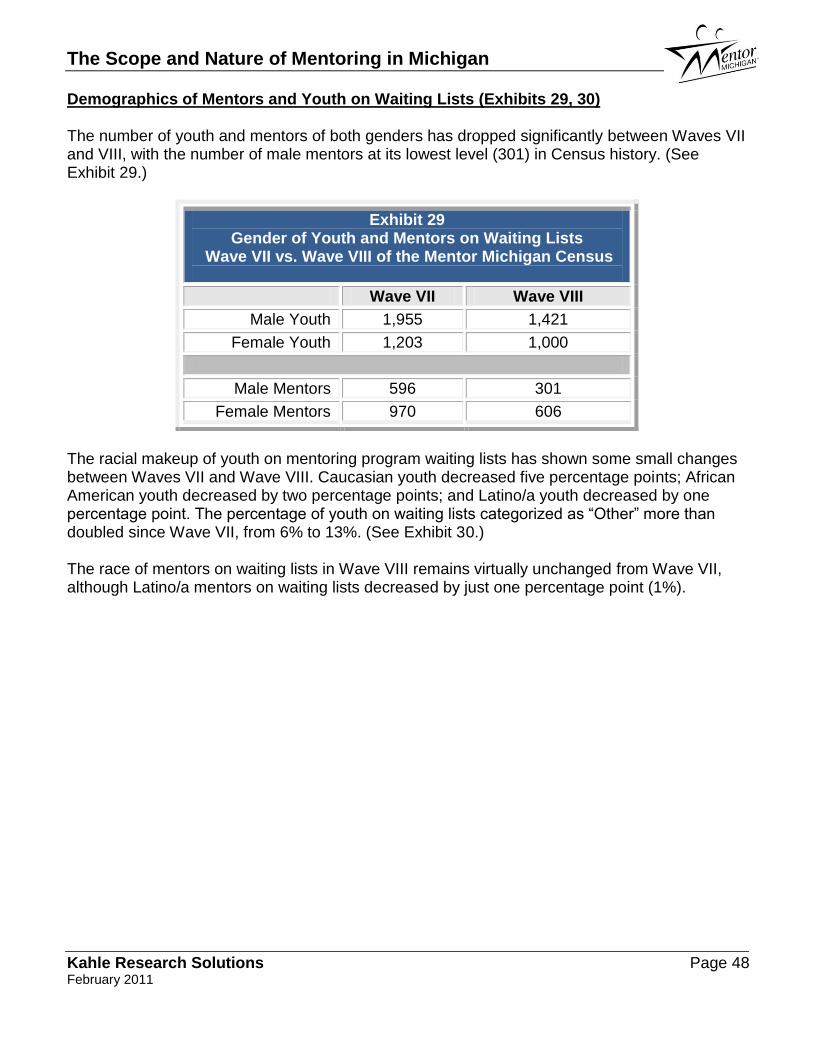
Demographics of Mentors and Youth on Waiting Lists (Exhibits 29, 30) The number of youth and mentors of both genders has dropped significantly between Waves VII and VIII, with the number of male mentors at its lowest level (301) in Census history. (See Exhibit 29.)
Exhibit 29 Gender of Youth and Mentors on Waiting Lists
Wave VII vs. Wave VIII of the Mentor Michigan Census
Wave VII Wave VIII
Male Youth 1,955 1,421
Female Youth 1,203 1,000
Male Mentors 596 301
Female Mentors 970 606
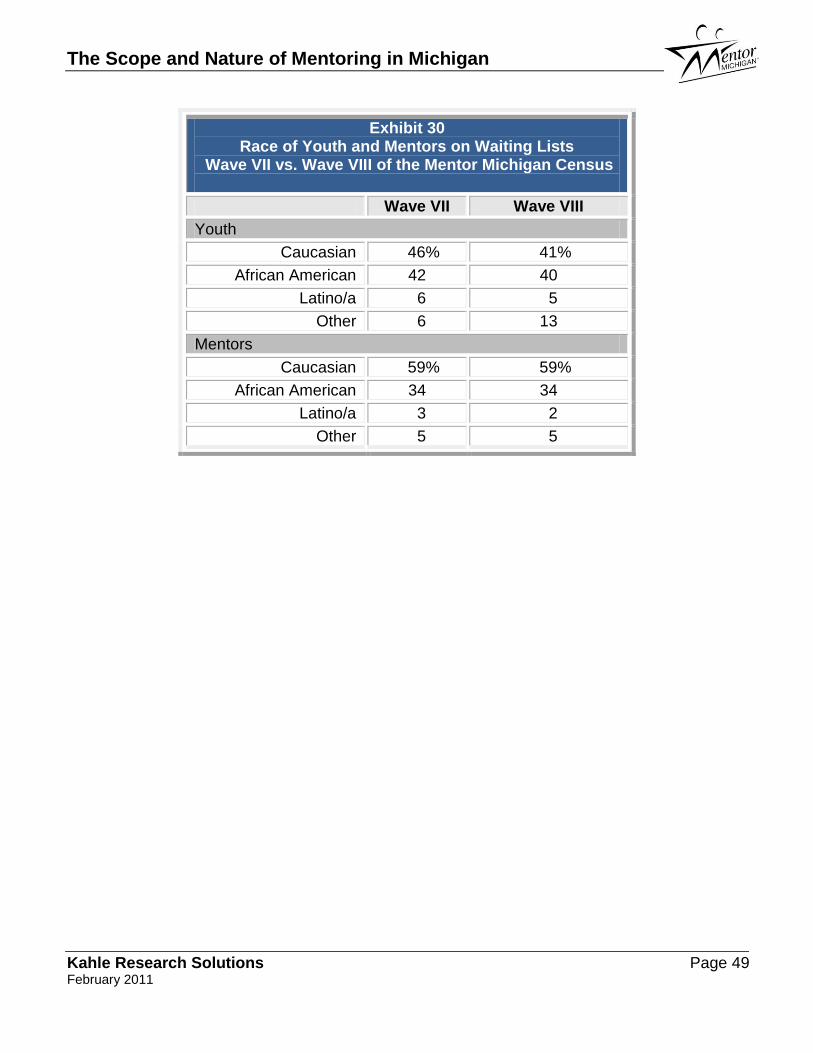
The racial makeup of youth on mentoring program waiting lists has shown some small changes between Waves VII and Wave VIII. Caucasian youth decreased five percentage points; African American youth decreased by two percentage points; and Latino/a youth decreased by one percentage point. The percentage of youth on waiting lists categorized as “Other” more than doubled since Wave VII, from 6% to 13%. (See Exhibit 30.) The race of mentors on waiting lists in Wave VIII remains virtually unchanged from Wave VII, although Latino/a mentors on waiting lists decreased by just one percentage point (1%).
The Scope and Nature of Mentoring in Michigan
Kahle Research Solutions Page 49 February 2011
Exhibit 30 Race of Youth and Mentors on Waiting Lists
Wave VII vs. Wave VIII of the Mentor Michigan Census
Wave VII Wave VIII
Youth
Caucasian 46% 41%
African American 42 40
Latino/a 6 5
Other 6 13
Mentors
Caucasian 59% 59%
African American 34 34
Latino/a 3 2
Other 5 5
The Scope and Nature of Mentoring in Michigan
Kahle Research Solutions Page 50 February 2011
Section VII:
Satisfaction with Mentor Michigan
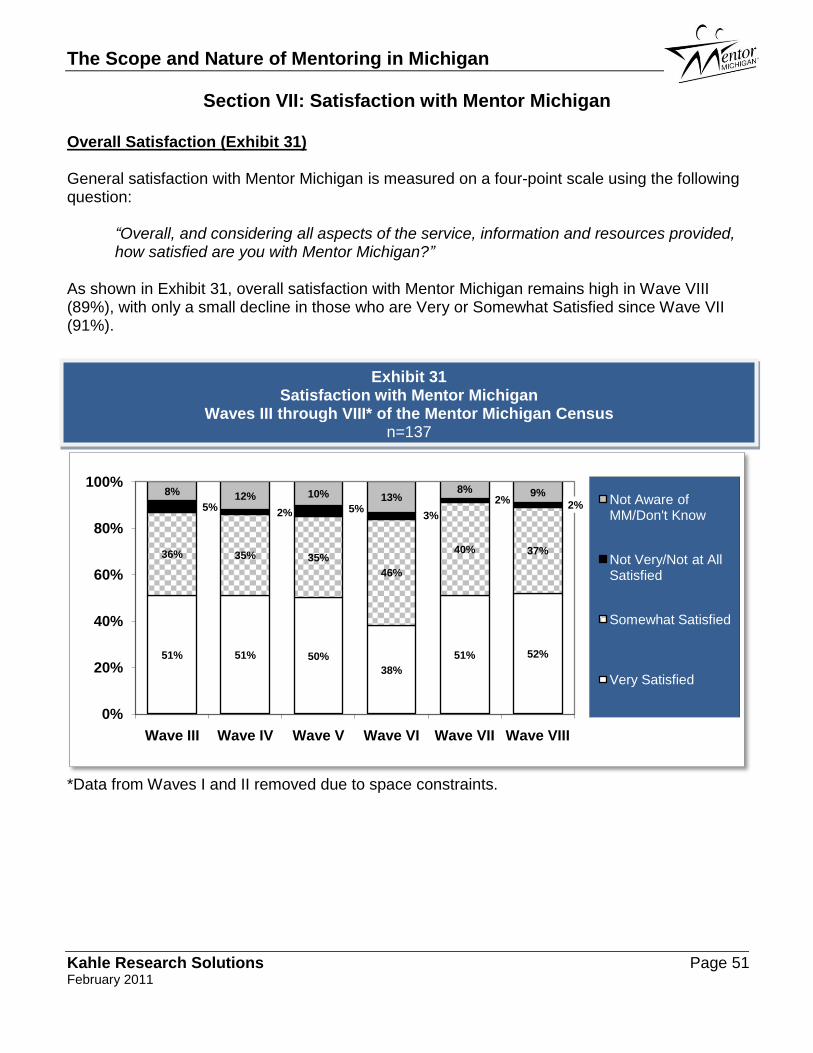
The Scope and Nature of Mentoring in Michigan
Kahle Research Solutions Page 51 February 2011
51% 51% 50%
38%
51% 52%
36% 35% 35%
46%
40% 37%
5%2% 5%
3%
2%2%
8% 12% 10% 13%8% 9%
0%
20%
40%
60%
80%
100%
Wave III Wave IV Wave V Wave VI Wave VII Wave VIII
Not Aware of MM/Don't Know
Not Very/Not at All Satisfied
Somewhat Satisfied
Very Satisfied
Section VII: Satisfaction with Mentor Michigan
Overall Satisfaction (Exhibit 31) General satisfaction with Mentor Michigan is measured on a four-point scale using the following question:
“Overall, and considering all aspects of the service, information and resources provided, how satisfied are you with Mentor Michigan?”
As shown in Exhibit 31, overall satisfaction with Mentor Michigan remains high in Wave VIII (89%), with only a small decline in those who are Very or Somewhat Satisfied since Wave VII (91%).
*Data from Waves I and II removed due to space constraints.
Exhibit 31 Satisfaction with Mentor Michigan
Waves III through VIII* of the Mentor Michigan Census n=137
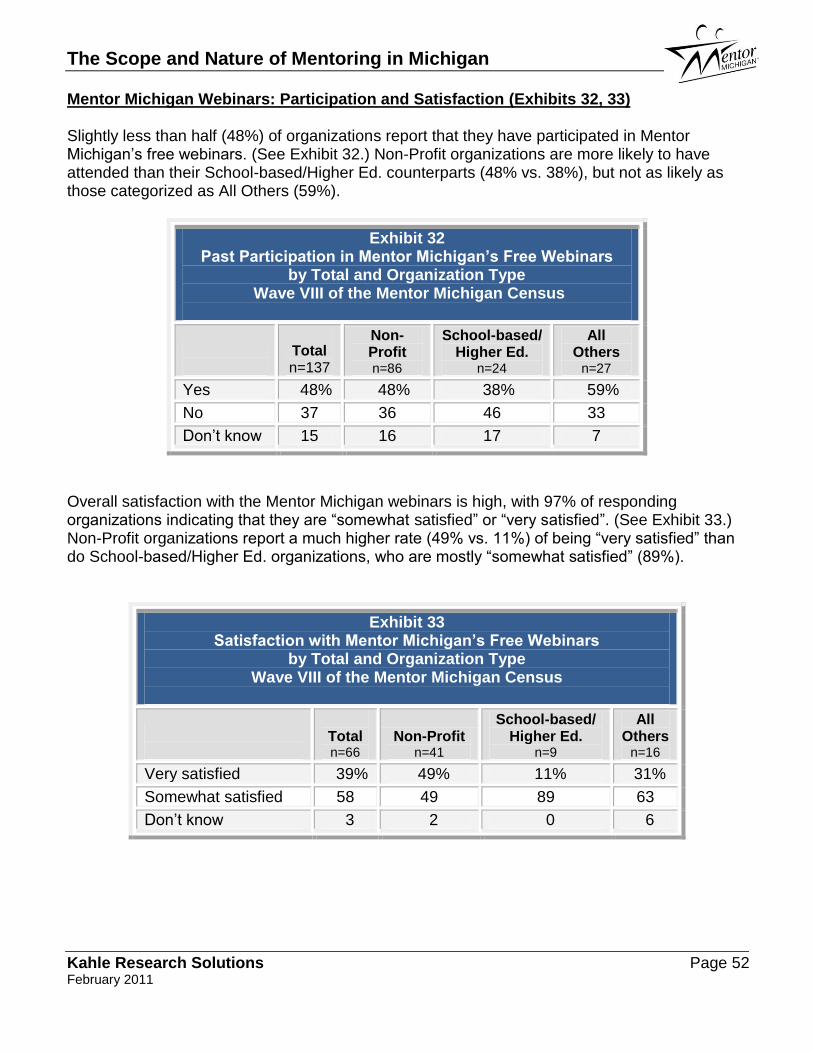
The Scope and Nature of Mentoring in Michigan
Kahle Research Solutions Page 52 February 2011
Mentor Michigan Webinars: Participation and Satisfaction (Exhibits 32, 33) Slightly less than half (48%) of organizations report that they have participated in Mentor Michigan’s free webinars. (See Exhibit 32.) Non-Profit organizations are more likely to have attended than their School-based/Higher Ed. counterparts (48% vs. 38%), but not as likely as those categorized as All Others (59%).
Exhibit 32 Past Participation in Mentor Michigan’s Free Webinars
by Total and Organization Type Wave VIII of the Mentor Michigan Census
Total n=137
Non-Profit n=86
School-based/ Higher Ed.
n=24
All Others
n=27
Yes 48% 48% 38% 59%
No 37 36 46 33
Don’t know 15 16 17 7
Overall satisfaction with the Mentor Michigan webinars is high, with 97% of responding organizations indicating that they are “somewhat satisfied” or “very satisfied”. (See Exhibit 33.) Non-Profit organizations report a much higher rate (49% vs. 11%) of being “very satisfied” than do School-based/Higher Ed. organizations, who are mostly “somewhat satisfied” (89%).
Exhibit 33 Satisfaction with Mentor Michigan’s Free Webinars
by Total and Organization Type Wave VIII of the Mentor Michigan Census
Total n=66
Non-Profit n=41
School-based/ Higher Ed.
n=9
All Others
n=16
Very satisfied 39% 49% 11% 31%
Somewhat satisfied 58 49 89 63
Don’t know 3 2 0 6
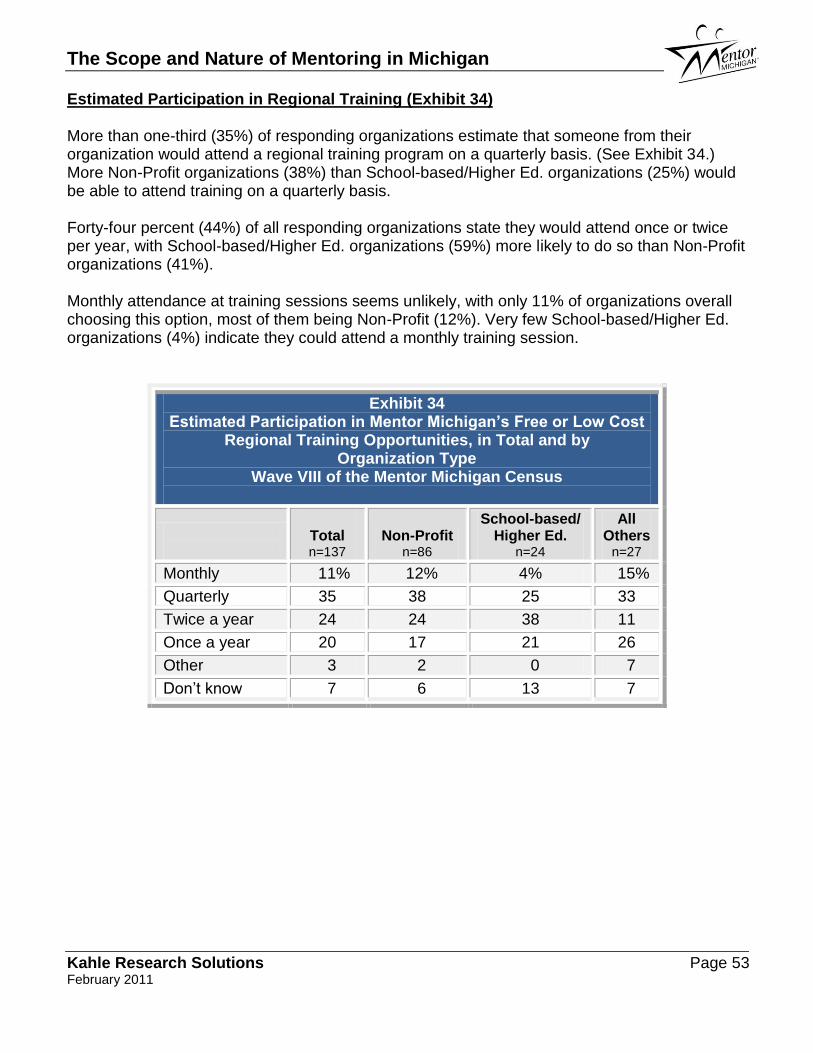
The Scope and Nature of Mentoring in Michigan
Kahle Research Solutions Page 53 February 2011
Estimated Participation in Regional Training (Exhibit 34) More than one-third (35%) of responding organizations estimate that someone from their organization would attend a regional training program on a quarterly basis. (See Exhibit 34.) More Non-Profit organizations (38%) than School-based/Higher Ed. organizations (25%) would be able to attend training on a quarterly basis. Forty-four percent (44%) of all responding organizations state they would attend once or twice per year, with School-based/Higher Ed. organizations (59%) more likely to do so than Non-Profit organizations (41%). Monthly attendance at training sessions seems unlikely, with only 11% of organizations overall choosing this option, most of them being Non-Profit (12%). Very few School-based/Higher Ed. organizations (4%) indicate they could attend a monthly training session.
Exhibit 34 Estimated Participation in Mentor Michigan’s Free or Low Cost
Regional Training Opportunities, in Total and by Organization Type
Wave VIII of the Mentor Michigan Census
Total n=137
Non-Profit n=86
School-based/ Higher Ed.
n=24
All Others
n=27
Monthly 11% 12% 4% 15%
Quarterly 35 38 25 33
Twice a year 24 24 38 11
Once a year 20 17 21 26
Other 3 2 0 7
Don’t know 7 6 13 7
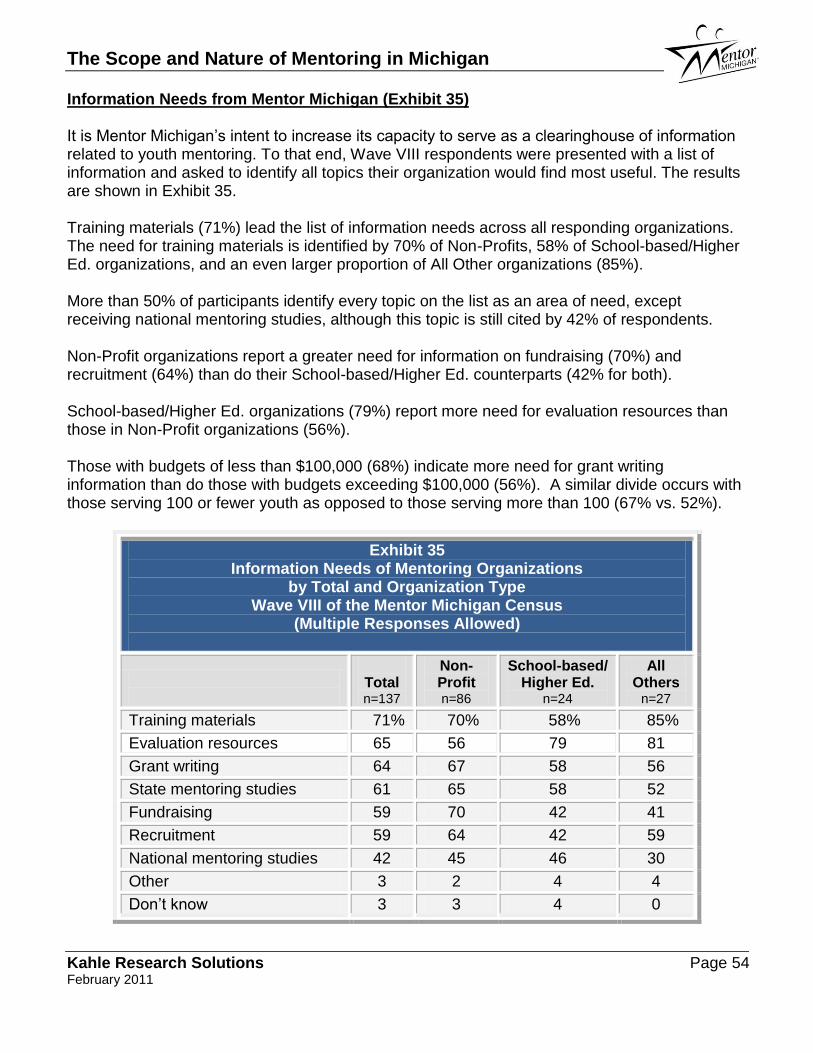
The Scope and Nature of Mentoring in Michigan
Kahle Research Solutions Page 54 February 2011
Information Needs from Mentor Michigan (Exhibit 35) It is Mentor Michigan’s intent to increase its capacity to serve as a clearinghouse of information related to youth mentoring. To that end, Wave VIII respondents were presented with a list of information and asked to identify all topics their organization would find most useful. The results are shown in Exhibit 35. Training materials (71%) lead the list of information needs across all responding organizations. The need for training materials is identified by 70% of Non-Profits, 58% of School-based/Higher Ed. organizations, and an even larger proportion of All Other organizations (85%). More than 50% of participants identify every topic on the list as an area of need, except receiving national mentoring studies, although this topic is still cited by 42% of respondents. Non-Profit organizations report a greater need for information on fundraising (70%) and recruitment (64%) than do their School-based/Higher Ed. counterparts (42% for both). School-based/Higher Ed. organizations (79%) report more need for evaluation resources than those in Non-Profit organizations (56%). Those with budgets of less than $100,000 (68%) indicate more need for grant writing information than do those with budgets exceeding $100,000 (56%). A similar divide occurs with those serving 100 or fewer youth as opposed to those serving more than 100 (67% vs. 52%).
Exhibit 35 Information Needs of Mentoring Organizations
by Total and Organization Type Wave VIII of the Mentor Michigan Census
(Multiple Responses Allowed)
Total n=137
Non-Profit n=86
School-based/ Higher Ed.
n=24
All Others
n=27
Training materials 71% 70% 58% 85%
Evaluation resources 65 56 79 81
Grant writing 64 67 58 56
State mentoring studies 61 65 58 52
Fundraising 59 70 42 41
Recruitment 59 64 42 59
National mentoring studies 42 45 46 30
Other 3 2 4 4
Don’t know 3 3 4 0
The Scope and Nature of Mentoring in Michigan
Kahle Research Solutions Page 55 February 2011
Appendices
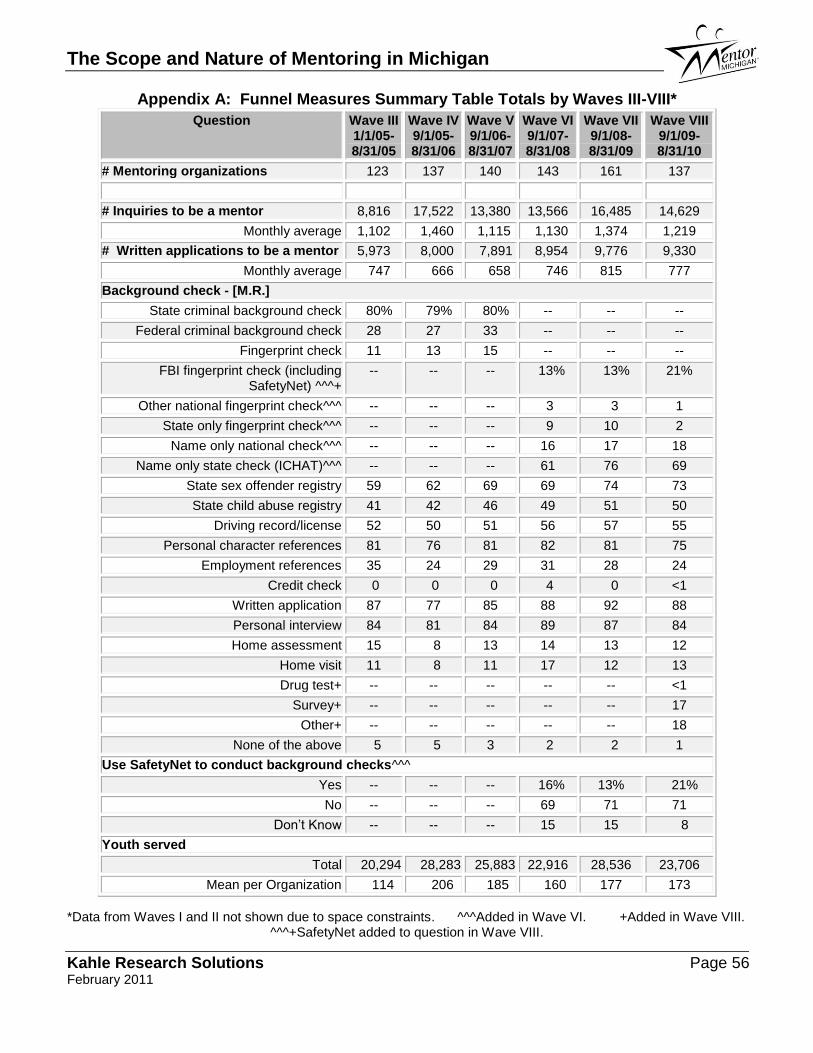
The Scope and Nature of Mentoring in Michigan
Kahle Research Solutions Page 56 February 2011
Appendix A: Funnel Measures Summary Table Totals by Waves III-VIII*
Question Wave III 1/1/05-8/31/05
Wave IV 9/1/05-8/31/06
Wave V 9/1/06-8/31/07
Wave VI 9/1/07-8/31/08
Wave VII 9/1/08-8/31/09
Wave VIII 9/1/09-8/31/10
# Mentoring organizations 123 137 140 143 161 137
# Inquiries to be a mentor 8,816 17,522 13,380 13,566 16,485 14,629
Monthly average 1,102 1,460 1,115 1,130 1,374 1,219
# Written applications to be a mentor 5,973 8,000 7,891 8,954 9,776 9,330
Monthly average 747 666 658 746 815 777
Background check - [M.R.]
State criminal background check 80% 79% 80% -- -- --
Federal criminal background check 28 27 33 -- -- --
Fingerprint check 11 13 15 -- -- --
FBI fingerprint check (including SafetyNet) ^^^+
-- -- -- 13% 13% 21%
Other national fingerprint check^^^ -- -- -- 3 3 1
State only fingerprint check^^^ -- -- -- 9 10 2
Name only national check^^^ -- -- -- 16 17 18
Name only state check (ICHAT)^^^ -- -- -- 61 76 69
State sex offender registry 59 62 69 69 74 73
State child abuse registry 41 42 46 49 51 50
Driving record/license 52 50 51 56 57 55
Personal character references 81 76 81 82 81 75
Employment references 35 24 29 31 28 24
Credit check 0 0 0 4 0 <1
Written application 87 77 85 88 92 88
Personal interview 84 81 84 89 87 84
Home assessment 15 8 13 14 13 12
Home visit 11 8 11 17 12 13
Drug test+ -- -- -- -- -- <1
Survey+ -- -- -- -- -- 17
Other+ -- -- -- -- -- 18
None of the above 5 5 3 2 2 1
Use SafetyNet to conduct background checks^^^
Yes -- -- -- 16% 13% 21%
No -- -- -- 69 71 71
Don’t Know -- -- -- 15 15 8
Youth served
Total 20,294 28,283 25,883 22,916 28,536 23,706
Mean per Organization 114 206 185 160 177 173
*Data from Waves I and II not shown due to space constraints. ^^^Added in Wave VI. +Added in Wave VIII. ^^^+SafetyNet added to question in Wave VIII.
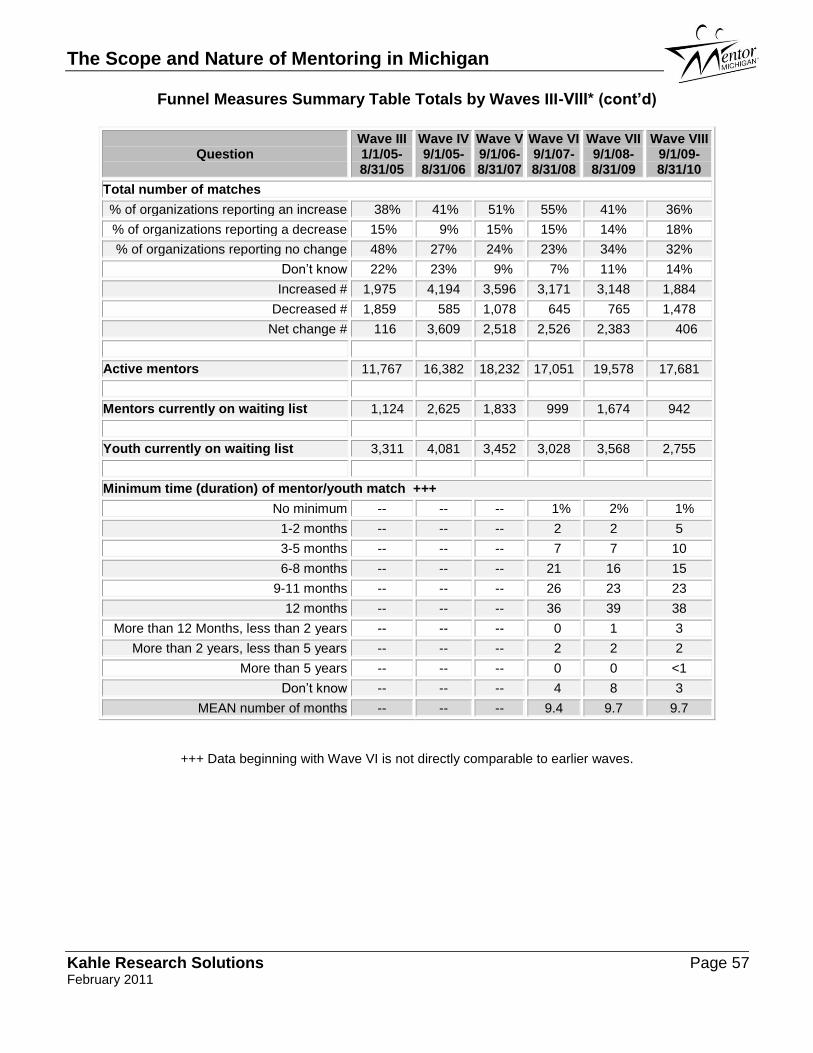
The Scope and Nature of Mentoring in Michigan
Kahle Research Solutions Page 57 February 2011
Funnel Measures Summary Table Totals by Waves III-VIII* (cont’d)
Question
Wave III 1/1/05-8/31/05
Wave IV 9/1/05-8/31/06
Wave V 9/1/06-8/31/07
Wave VI 9/1/07-8/31/08
Wave VII 9/1/08-8/31/09
Wave VIII 9/1/09-8/31/10
Total number of matches
% of organizations reporting an increase 38% 41% 51% 55% 41% 36%
% of organizations reporting a decrease 15% 9% 15% 15% 14% 18%
% of organizations reporting no change 48% 27% 24% 23% 34% 32%
Don’t know 22% 23% 9% 7% 11% 14%
Increased # 1,975 4,194 3,596 3,171 3,148 1,884
Decreased # 1,859 585 1,078 645 765 1,478
Net change # 116 3,609 2,518 2,526 2,383 406
Active mentors 11,767 16,382 18,232 17,051 19,578 17,681
Mentors currently on waiting list 1,124 2,625 1,833 999 1,674 942
Youth currently on waiting list 3,311 4,081 3,452 3,028 3,568 2,755
Minimum time (duration) of mentor/youth match +++
No minimum -- -- -- 1% 2% 1%
1-2 months -- -- -- 2 2 5
3-5 months -- -- -- 7 7 10
6-8 months -- -- -- 21 16 15
9-11 months -- -- -- 26 23 23
12 months -- -- -- 36 39 38
More than 12 Months, less than 2 years -- -- -- 0 1 3
More than 2 years, less than 5 years -- -- -- 2 2 2
More than 5 years -- -- -- 0 0 <1
Don’t know -- -- -- 4 8 3
MEAN number of months -- -- -- 9.4 9.7 9.7
+++ Data beginning with Wave VI is not directly comparable to earlier waves.
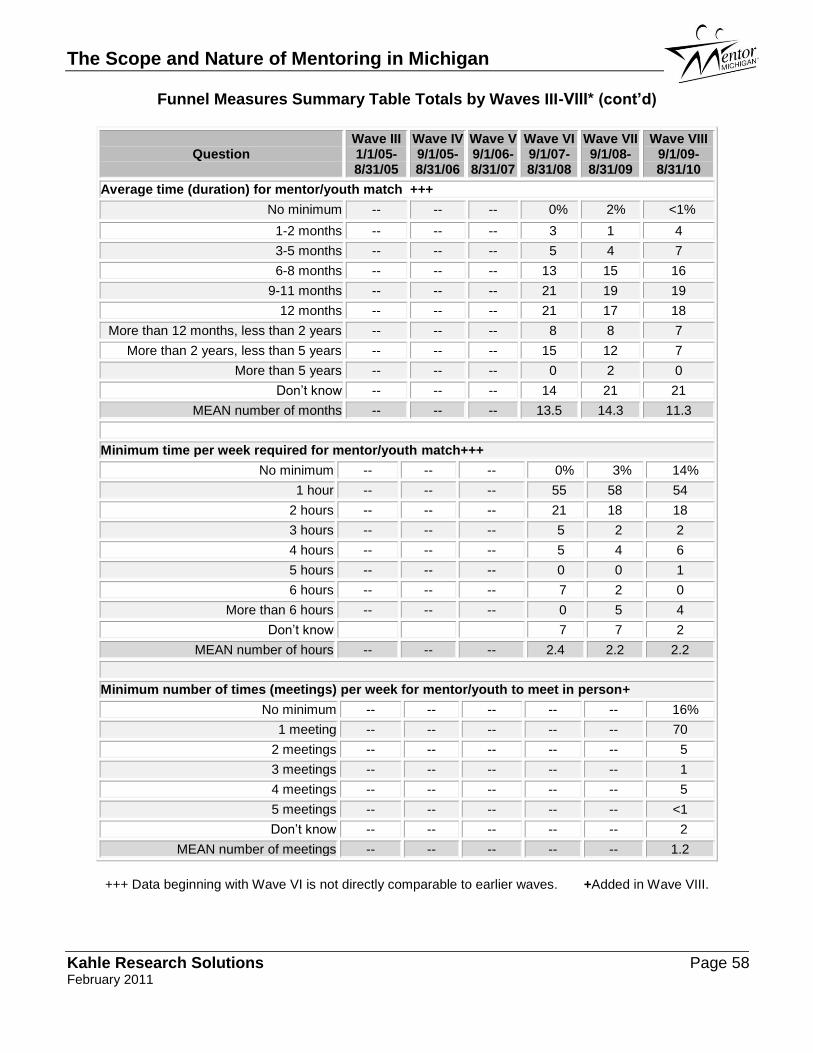
The Scope and Nature of Mentoring in Michigan
Kahle Research Solutions Page 58 February 2011
Funnel Measures Summary Table Totals by Waves III-VIII* (cont’d)
Question
Wave III 1/1/05-8/31/05
Wave IV 9/1/05-8/31/06
Wave V 9/1/06-8/31/07
Wave VI 9/1/07-8/31/08
Wave VII 9/1/08-8/31/09
Wave VIII 9/1/09-8/31/10
Average time (duration) for mentor/youth match +++
No minimum -- -- -- 0% 2% <1%
1-2 months -- -- -- 3 1 4
3-5 months -- -- -- 5 4 7
6-8 months -- -- -- 13 15 16
9-11 months -- -- -- 21 19 19
12 months -- -- -- 21 17 18
More than 12 months, less than 2 years -- -- -- 8 8 7
More than 2 years, less than 5 years -- -- -- 15 12 7
More than 5 years -- -- -- 0 2 0
Don’t know -- -- -- 14 21 21
MEAN number of months -- -- -- 13.5 14.3 11.3
Minimum time per week required for mentor/youth match+++
No minimum -- -- -- 0% 3% 14%
1 hour -- -- -- 55 58 54
2 hours -- -- -- 21 18 18
3 hours -- -- -- 5 2 2
4 hours -- -- -- 5 4 6
5 hours -- -- -- 0 0 1
6 hours -- -- -- 7 2 0
More than 6 hours -- -- -- 0 5 4
Don’t know 7 7 2
MEAN number of hours -- -- -- 2.4 2.2 2.2
Minimum number of times (meetings) per week for mentor/youth to meet in person+
No minimum -- -- -- -- -- 16%
1 meeting -- -- -- -- -- 70
2 meetings -- -- -- -- -- 5
3 meetings -- -- -- -- -- 1
4 meetings -- -- -- -- -- 5
5 meetings -- -- -- -- -- <1
Don’t know -- -- -- -- -- 2
MEAN number of meetings -- -- -- -- -- 1.2
+++ Data beginning with Wave VI is not directly comparable to earlier waves. +Added in Wave VIII.
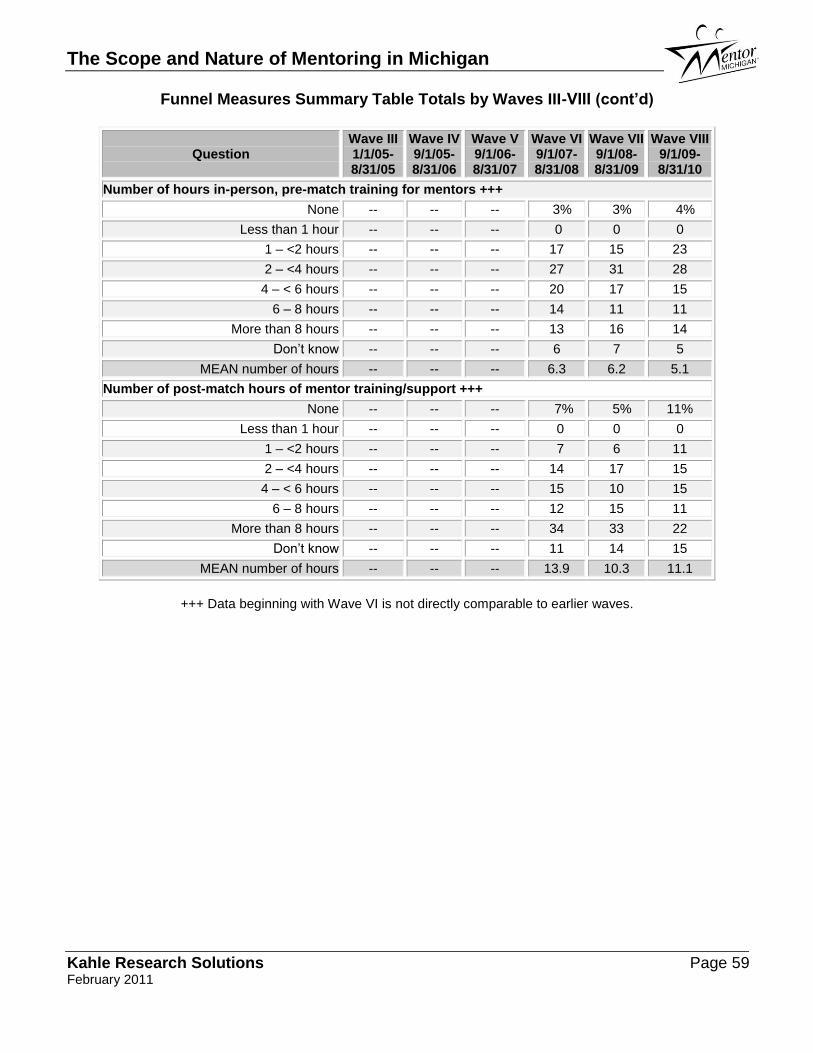
The Scope and Nature of Mentoring in Michigan
Kahle Research Solutions Page 59 February 2011
Funnel Measures Summary Table Totals by Waves III-VIII (cont’d)
Question
Wave III 1/1/05-8/31/05
Wave IV 9/1/05-8/31/06
Wave V 9/1/06-8/31/07
Wave VI 9/1/07-8/31/08
Wave VII 9/1/08-8/31/09
Wave VIII 9/1/09-8/31/10
Number of hours in-person, pre-match training for mentors +++
None -- -- -- 3% 3% 4%
Less than 1 hour -- -- -- 0 0 0
1 – <2 hours -- -- -- 17 15 23
2 – <4 hours -- -- -- 27 31 28
4 – < 6 hours -- -- -- 20 17 15
6 – 8 hours -- -- -- 14 11 11
More than 8 hours -- -- -- 13 16 14
Don’t know -- -- -- 6 7 5
MEAN number of hours -- -- -- 6.3 6.2 5.1
Number of post-match hours of mentor training/support +++
None -- -- -- 7% 5% 11%
Less than 1 hour -- -- -- 0 0 0
1 – <2 hours -- -- -- 7 6 11
2 – <4 hours -- -- -- 14 17 15
4 – < 6 hours -- -- -- 15 10 15
6 – 8 hours -- -- -- 12 15 11
More than 8 hours -- -- -- 34 33 22
Don’t know -- -- -- 11 14 15
MEAN number of hours -- -- -- 13.9 10.3 11.1
+++ Data beginning with Wave VI is not directly comparable to earlier waves.
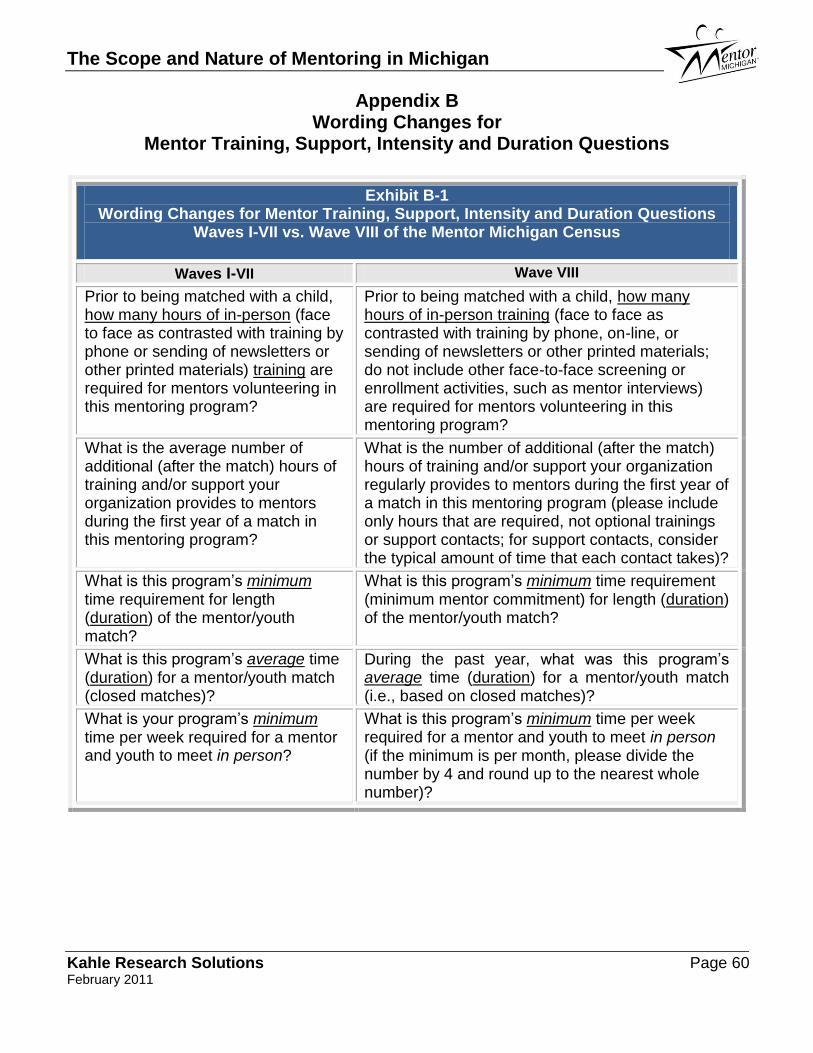
The Scope and Nature of Mentoring in Michigan
Kahle Research Solutions Page 60 February 2011
Appendix B Wording Changes for
Mentor Training, Support, Intensity and Duration Questions
Exhibit B-1 Wording Changes for Mentor Training, Support, Intensity and Duration Questions
Waves I-VII vs. Wave VIII of the Mentor Michigan Census
Waves I-VII Wave VIII
Prior to being matched with a child, how many hours of in-person (face to face as contrasted with training by phone or sending of newsletters or other printed materials) training are required for mentors volunteering in this mentoring program?
Prior to being matched with a child, how many hours of in-person training (face to face as contrasted with training by phone, on-line, or sending of newsletters or other printed materials; do not include other face-to-face screening or enrollment activities, such as mentor interviews) are required for mentors volunteering in this mentoring program?
What is the average number of additional (after the match) hours of training and/or support your organization provides to mentors during the first year of a match in this mentoring program?
What is the number of additional (after the match) hours of training and/or support your organization regularly provides to mentors during the first year of a match in this mentoring program (please include only hours that are required, not optional trainings or support contacts; for support contacts, consider the typical amount of time that each contact takes)?
What is this program’s minimum time requirement for length (duration) of the mentor/youth match?
What is this program’s minimum time requirement (minimum mentor commitment) for length (duration) of the mentor/youth match?
What is this program’s average time (duration) for a mentor/youth match (closed matches)?
During the past year, what was this program’s average time (duration) for a mentor/youth match (i.e., based on closed matches)?
What is your program’s minimum time per week required for a mentor and youth to meet in person?
What is this program’s minimum time per week required for a mentor and youth to meet in person (if the minimum is per month, please divide the number by 4 and round up to the nearest whole number)?
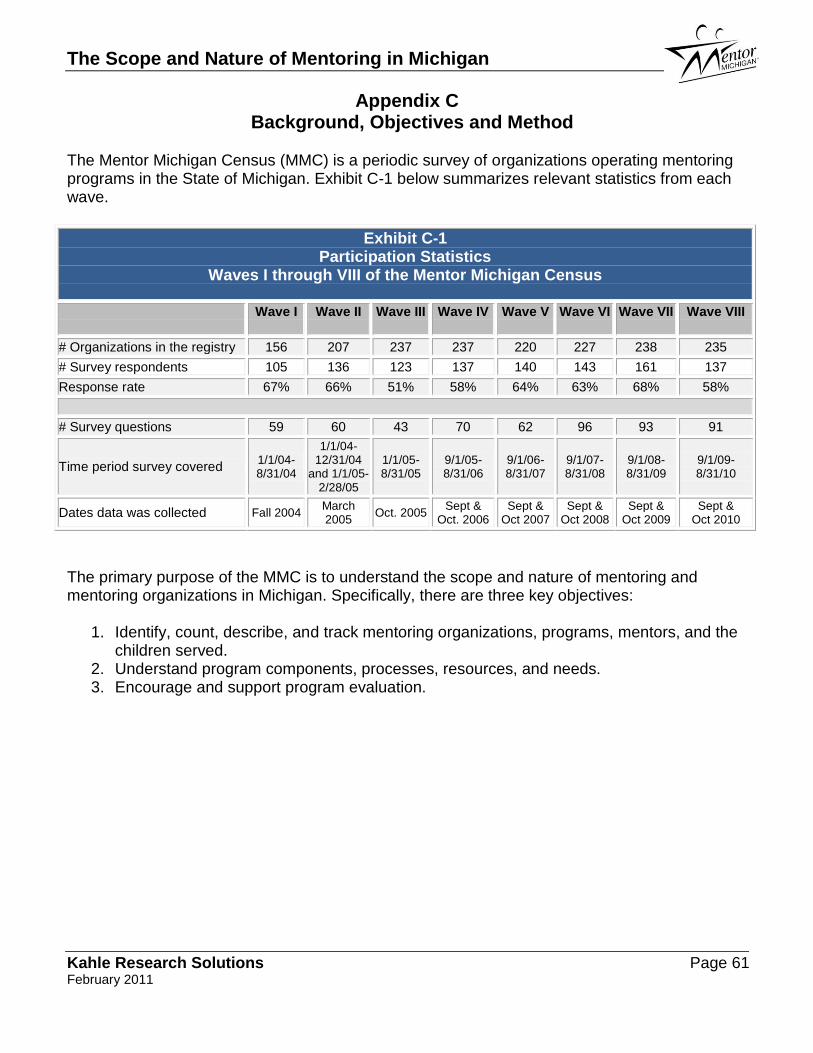
The Scope and Nature of Mentoring in Michigan
Kahle Research Solutions Page 61 February 2011
Appendix C Background, Objectives and Method
The Mentor Michigan Census (MMC) is a periodic survey of organizations operating mentoring programs in the State of Michigan. Exhibit C-1 below summarizes relevant statistics from each wave.
Exhibit C-1 Participation Statistics
Waves I through VIII of the Mentor Michigan Census
Wave I
Wave II Wave III
Wave IV
Wave V
Wave VI
Wave VII
Wave VIII
# Organizations in the registry 156 207 237 237 220 227 238 235
# Survey respondents 105 136 123 137 140 143 161 137
Response rate 67% 66% 51% 58% 64% 63% 68% 58%
# Survey questions 59 60 43 70 62 96 93 91
Time period survey covered 1/1/04-8/31/04
1/1/04-12/31/04
and 1/1/05-2/28/05
1/1/05-8/31/05
9/1/05-8/31/06
9/1/06-8/31/07
9/1/07-8/31/08
9/1/08-8/31/09
9/1/09-8/31/10
Dates data was collected Fall 2004 March 2005
Oct. 2005 Sept &
Oct. 2006 Sept &
Oct 2007 Sept &
Oct 2008 Sept &
Oct 2009 Sept &
Oct 2010
The primary purpose of the MMC is to understand the scope and nature of mentoring and mentoring organizations in Michigan. Specifically, there are three key objectives:
1. Identify, count, describe, and track mentoring organizations, programs, mentors, and the children served.
2. Understand program components, processes, resources, and needs. 3. Encourage and support program evaluation.
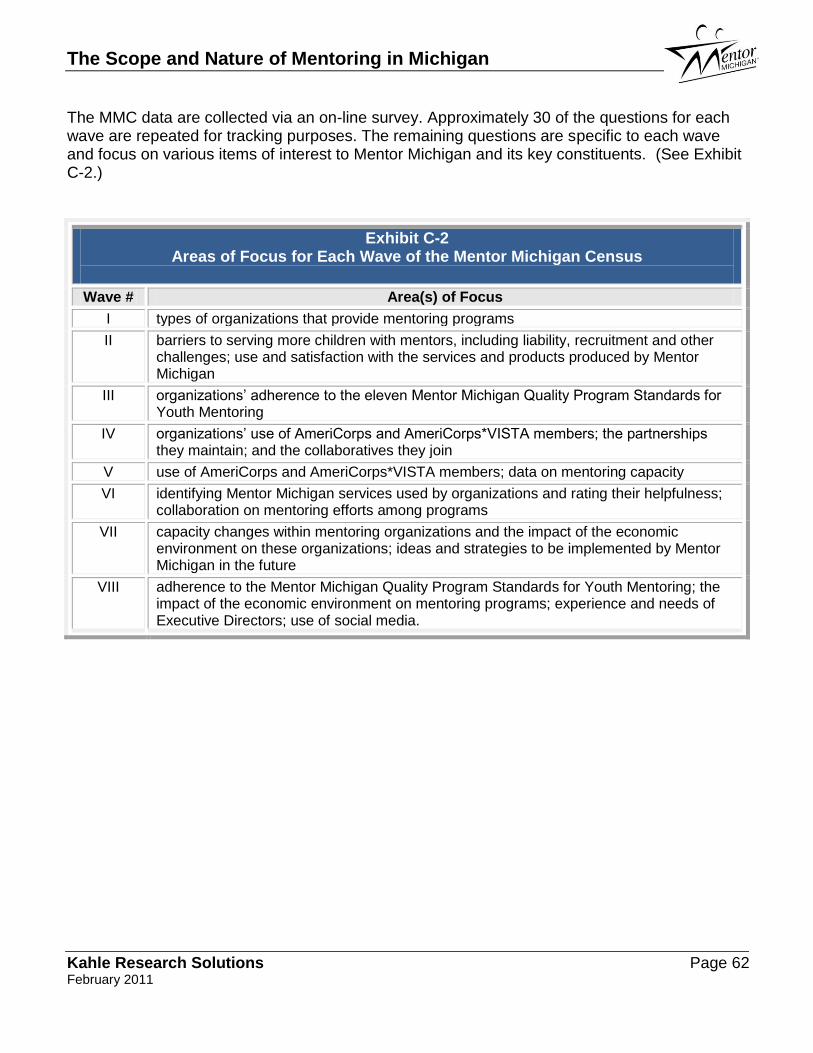
The Scope and Nature of Mentoring in Michigan
Kahle Research Solutions Page 62 February 2011
The MMC data are collected via an on-line survey. Approximately 30 of the questions for each wave are repeated for tracking purposes. The remaining questions are specific to each wave and focus on various items of interest to Mentor Michigan and its key constituents. (See Exhibit C-2.)
Exhibit C-2 Areas of Focus for Each Wave of the Mentor Michigan Census
Wave # Area(s) of Focus
I types of organizations that provide mentoring programs
II barriers to serving more children with mentors, including liability, recruitment and other challenges; use and satisfaction with the services and products produced by Mentor Michigan
III organizations’ adherence to the eleven Mentor Michigan Quality Program Standards for Youth Mentoring
IV organizations’ use of AmeriCorps and AmeriCorps*VISTA members; the partnerships they maintain; and the collaboratives they join
V use of AmeriCorps and AmeriCorps*VISTA members; data on mentoring capacity
VI identifying Mentor Michigan services used by organizations and rating their helpfulness; collaboration on mentoring efforts among programs
VII capacity changes within mentoring organizations and the impact of the economic environment on these organizations; ideas and strategies to be implemented by Mentor Michigan in the future
VIII adherence to the Mentor Michigan Quality Program Standards for Youth Mentoring; the impact of the economic environment on mentoring programs; experience and needs of Executive Directors; use of social media.
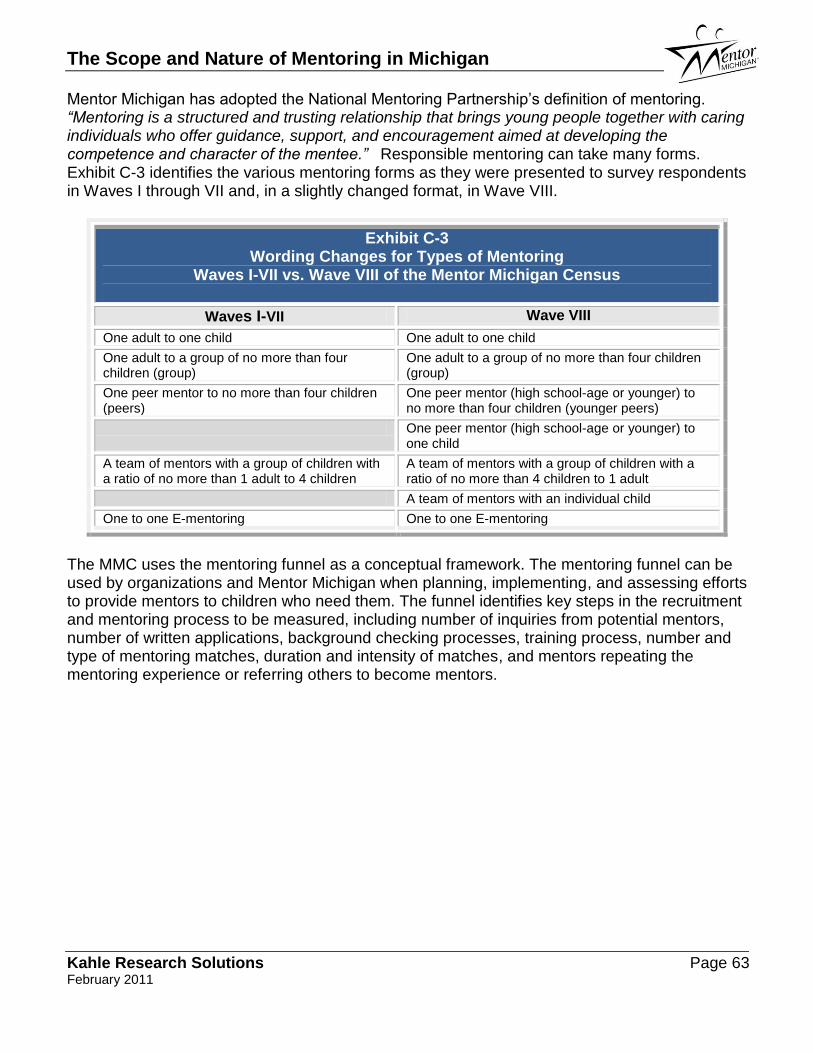
The Scope and Nature of Mentoring in Michigan
Kahle Research Solutions Page 63 February 2011
Mentor Michigan has adopted the National Mentoring Partnership’s definition of mentoring. “Mentoring is a structured and trusting relationship that brings young people together with caring individuals who offer guidance, support, and encouragement aimed at developing the competence and character of the mentee.” Responsible mentoring can take many forms. Exhibit C-3 identifies the various mentoring forms as they were presented to survey respondents in Waves I through VII and, in a slightly changed format, in Wave VIII.
Exhibit C-3 Wording Changes for Types of Mentoring
Waves I-VII vs. Wave VIII of the Mentor Michigan Census
Waves I-VII Wave VIII
One adult to one child One adult to one child
One adult to a group of no more than four children (group)
One adult to a group of no more than four children (group)
One peer mentor to no more than four children (peers)
One peer mentor (high school-age or younger) to no more than four children (younger peers)
One peer mentor (high school-age or younger) to one child
A team of mentors with a group of children with a ratio of no more than 1 adult to 4 children
A team of mentors with a group of children with a ratio of no more than 4 children to 1 adult
A team of mentors with an individual child
One to one E-mentoring One to one E-mentoring
The MMC uses the mentoring funnel as a conceptual framework. The mentoring funnel can be used by organizations and Mentor Michigan when planning, implementing, and assessing efforts to provide mentors to children who need them. The funnel identifies key steps in the recruitment and mentoring process to be measured, including number of inquiries from potential mentors, number of written applications, background checking processes, training process, number and type of mentoring matches, duration and intensity of matches, and mentors repeating the mentoring experience or referring others to become mentors.