Embed Size (px)
Citation preview
MMEENN BBEEHHAAVVIINNGG BBAADDLLYY IIRRRRAATTIIOONNAALLIITTYY IINN DDEECCIISSIIOONN MMAAKKIINNGG WWHHEENN
DDEEFFEEAATT BBEECCOOMMEESS HHAARRDD TTOO AACCCCEEPPTT
RISHI OBEROI
ABSTRACT
In the past few decades, a number of market anomalies have produced themselves as proper literatures rather than being mere errors of the markets. Behavioural psychology has made it possible to link these anomalies to the core of human behaviour explaining over-trading in the markets, price volatility and the equity premium puzzle among a few. These are backed by both laboratory experiments and empirical evidence. One particularly significant theory is the theory of Loss Aversion outlining how individuals tend to be averse to losses and its effect on decisions and the markets. This paper seeks to establish a new perspective to loss aversion. It investigates into the perception that individuals, when in a repetitive decision making process, instead of changing their decisions facing situations of winning or losing, only change the intensiveness of the decision and not the decision itself. This is exposed by proving that when defeat is hard to accept, it results in an aggressive behaviour in decision making. The theory is validated by conducting an experiment on agents on how they behave to random situations of winning and losing in a continuous environment of decision making. This paper then verifies the theory by conducting an empirical analysis of private investors where they are asked a set of related questions, specifically about the recent market decline after March 2000, which reveal their behaviour into decision making. Every attempt is made to clarify and demonstrate that such aggressiveness is not linked to overconfidence. This paper also supports, theoretically, the view that such behaviour could help explain over-trading in the markets before the actual decline.

ACKNOWLEDGEMENTS
I would like to extend my gratitude to my supervisor, Professor Ralph Bailey, for his kind support, especially at times when it was needed the most. Despite many unfortunate hurdles, he has been understanding and encouraging, boosting my efforts. I am also thankful to Jai Oberoi, a graduate programmer in I.T. who helped me in finishing the software for the experiment. I would also like to thank Yahoo Groups for its support and discussions over the period. Finally, the credit goes to all those who willingly participated in the experiment and also all the private investors who gave their prompt responses to the empirical investigation. I wish them good luck for the future.
TABLE OF CONTENTS
Glossary of Terms
1. INRODUCTION..……………………………………………………………1 1.1 Background...……………………………………………………………… 1 1.2 Purpose of the thesis.....…………………………………………………… 4 1.3 The Experiment....………………………………………………………… 5 1.4 Verification through Empirical Analysis……………………………………5 1.5 Overview of the Thesis…………………………………………………….6
2. BLACKJACK: THE EXPERIMENT..………………………………..…… 7
2.1 The Construction: Building the Experiment……………………………… 7 2.2 The Material: Elements of the Experiment…………………………………8 2.3 The Players…………………………….…………………………………...9
2.3.1 Categorising Human Behaviour…………………………………….. 10 2.4 Compiling the results……………………………………...………………11
3. “HIT OR STAY, SIR?”: Validating the theory........…………………..……12
3.1 Profile of the Sample.………………………...……………………………12 3.2 Testing Intensity in Decisions……………………………..………………14 3.3 BET ONE
3.3.1 Winners and Losers.………………………….……………………15 3.3.2 Survivors…...…………………………………...…………………15 3.3.3 Testing Aggressiveness….…………………………………………16 3.3.4 Testing Intensity and Confidence …………………………………16
3.4 BET TWO
3.4.1 Winners and Losers……………………………………………… 18 3.4.2 Testing Aggressiveness...…………………………………………..18 3.4.3 Testing Intensity and Confidence………………………………….19
3.5 BET THREE
3.5.1 Winners and Losers..………………………………………………21 3.5.2 Testing Aggressiveness.……………………………………………21 3.5.3 Testing Intensity and Confidence.…………………………………22
4. EMPIRICAL INVESTIGATION.…………………………………………25
4.1 Profile of the Sample.……………………………………………………...25 4.2 Involvement in Trading during 1998 and 2000.……………………………26 4.3 Investor’s ability to forecast Market Development..……………………….26 4.4 Involvement in trading during the Market Decline in March 2000....………27
4.4.1 Filtered Sample………………………………………………………27 4.5 Checking the research’s Market Characteristic......…………………………27 4.6 Feeling Defeat ……………………………………………………………28 4.7 Accepting Defeat….………………………………………………………28
4.8 Investigating the Choice of Decision....……………………………………29
4.8.1 The Findings……..……………….………………………………….29 4.8.2 Isolating the Theory from Overconfidence…………………………..30
4.9 Relating Empirical Analysis to General Behaviour………………………....30 4.9.1 Determining Overconfidence..………………………………………31 4.9.2 Determining Aggression……………………………………………..31 4.9.3Aggression & Overconfidence: Isolating the effects of each other…... 33
4.10 Sample Satisfaction and Design of the Questionnaire…………………33
5. IMPLICATIONS……………………………………………………………34
6. CRITIQUE………………………………………………………………… 36
References Appendices: Appendix 1: BlackJack: The Experiment Questionnaire Appendix 2: BlackJack: The Experiment Results Appendix 3: Empirical Investigation Questionnaire Appendix 4: Empirical Investigation Results
GLOSSARY OF TERMS
Agents Economists like to refer to the people they study as economic agents. {Source: Econmodel} Bear market A market in which prices of a certain group of securities are falling or are expected to fall. Although figures can vary, a downturn of 15%-20% or more in multiple indexes (Dow or S&P 500) is considered a bear market. {Source: Investopedia} Behavioural Finance A field of finance that proposes psychology-based theories to explain stock market anomalies. Within behavioral finance it is assumed that the information structure and the characteristics of market participants systematically influence their investment decisions as well as market outcomes. {Source: Investopedia} Black Jack A gambling game using cards; the object is to hold cards having a higher count than those dealt to the bank up to but not exceeding 21 {Source: HyperDictonary} Bull market A market in which prices of a certain group of securities are rising or are expected to rise. {Source: Investopedia} Defeat The feeling that accompanies an experience of being thwarted in attaining your goals. {Source: HyperDictonary} Expected Utility Hypothesis The expected utility hypothesis is the hypothesis that the utility of an agent facing uncertainty is calculated by considering utility in each possible state and constructing a weighted average, where the weights are the agent's estimate of the probability of each state. [Arrow, 1963 attributes to Daniel Bernoulli (1738) the earliest known written statement of this hypothesis; Source: Econterms] Experiment A trial or special observation, made to confirm or disprove something doubtful; esp., one under conditions determined by the experimenter; an act or operation undertaken in order to discover some unknown principle or effect, or to test, establish, or illustrate some suggest or known truth; practical test; poof. {Source: Self Knowledge} Finance The branch of economics that studies the management of money and other assets. {Source: WordNet ® 1.7}
Internet The Internet is a world-wide connection of computer networks. It allows users to send and receive information through things like electronic mail (email), search for information held on computers throughout the world and publish material over the World Wide Web. It is a public, cooperative, and self-sustaining facility accessible to hundreds of millions of people worldwide. Loss Aversion “A wide spread pattern, evident in many aspects of decision making, in which people seem particularly sensitive to losses and eager to avoid them” [Gleitman et al. 2000] Over-confidence Total certainty or greater certainty that circumstances warrant {Source: WordNet ® 1.7} Private Investor A private investor is a person who invests his/her money on the stock market and manages his/her own portfolio of shares. He/She operates only in private matters and not employed by a corporation, partnership, proprietorship or any other entity whatsoever engaged in giving investment services. {Source: OnlineTrader} Risk The quantifiable likelihood of loss or less-than-expected returns {Source: Investorwords} Risk Aversion Put informally, risk aversion means that if several investments have the same expected return/payoff, the one with the smallest variation in the outcome is preferred.
I
INTRODUCTION
The world of finance has been driven by statistical sciences and mathematical
methods. Apparently, these methods have been based upon people’s attitude towards
uncertainty modelled through risk aversion1 and expected utility theory2.
However, these classical utility functions have some serious criticisms3.
Although risk aversion and expected utility tend to be an appealing characteristic to
formulate a theory upon, much for its excellent mathematical properties, they have failed
to show that all individuals have preferences that can be modelled realistically, atleast in
certain circumstances. Moreover, behavioural psychology has given birth to new views to
the way financial decisions are evaluated. The wide latitude of behavioural psychology in
the field of finance has produced many theories that relate individuals’ behaviour to
markets and it holds considerable scope for new investigation.
1.1 Background
Behavioural finance tests the validity of laboratory experiments towards
evaluating preferences. Such experiments basically root from the classical assumptions
being invalid. Much research has taken place since the 1980’s on understanding how
people behave realistically when facing a decision involving uncertain outcomes.
One theory of such behaviour is proposed by Kaheman and Tversky (1979)
as a decision framework called ‘Prospect Theory’. They propose a descriptive framework
for the way people make decisions under condition of risk and uncertainty.
1 Put informally, one is risk averse when one takes risk only if the expected return is high enough to compensate him/her for the risk. Among the pioneers in risk aversion are K. J. Arrow (‘The Theory of Risk Aversion’ (1964)) and Friedman & Savage (‘The Utility Analysis of Choices involving Risk’ (1948)).
A compact example to risk aversion can be found at http://www.wfu.edu/users/palmitar/Law&Valuation/Chapter%202/2-1-3.htm
2 John von Neumann & Oskar Morgenstern (1944) suggested a model for understanding and
systematically modelling risk preference: This was named Expected Utility Theory. An agent possesses a von-Neumann-Morgenstern utility function if he/she ranks uncertain pay-offs according to (higher) expected value of the individual outcomes that may come.
3 Rabin (2000) and Rabin & Thaler (2001) criticise the use of diminishing marginal utility in explaining
risk aversion in small gambles. Kahneman & Tversky (1979) describe several classes of choice problems in which preferences systematically violate the axioms of the EU theory.
- 1 -
- 2 -
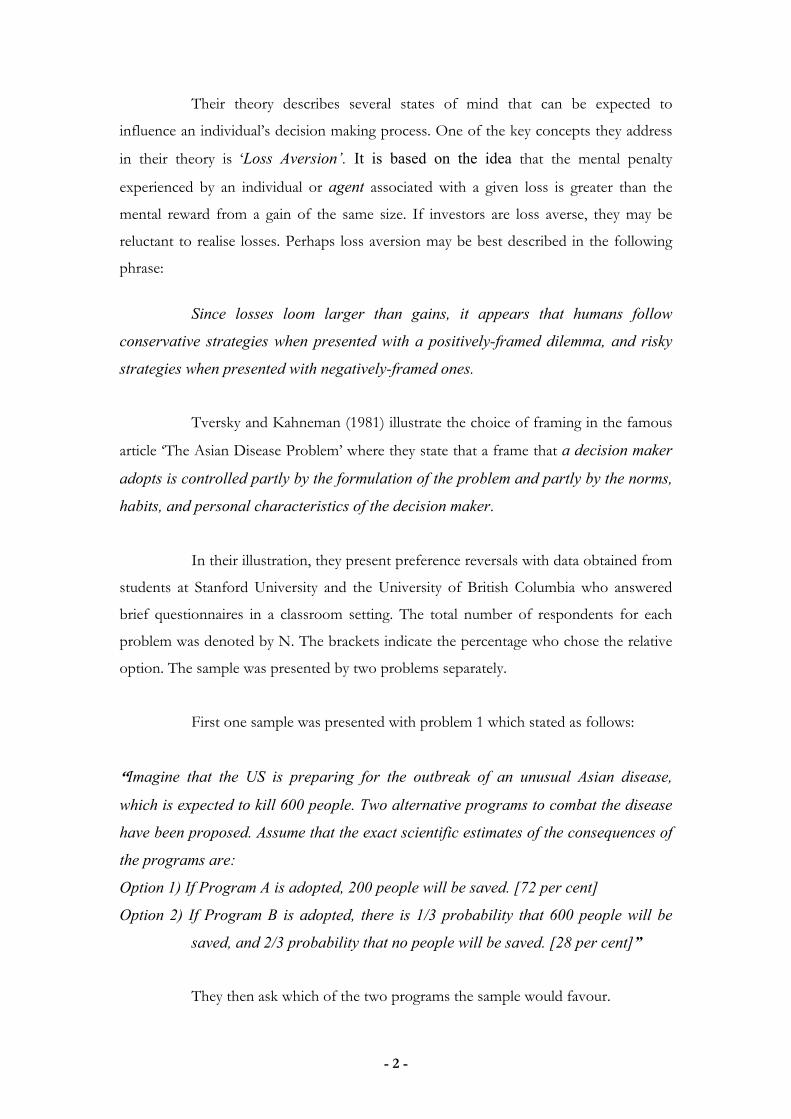
Their theory describes several states of mind that can be expected to
influence an individual’s decision making process. One of the key concepts they address
in their theory is ‘Loss Aversion’. It is based on the idea that the mental penalty
experienced by an individual or agent associated with a given loss is greater than the
mental reward from a gain of the same size. If investors are loss averse, they may be
reluctant to realise losses. Perhaps loss aversion may be best described in the following
phrase:
Since losses loom larger than gains, it appears that humans follow
conservative strategies when presented with a positively-framed dilemma, and risky
strategies when presented with negatively-framed ones.
Tversky and Kahneman (1981) illustrate the choice of framing in the famous
article ‘The Asian Disease Problem’ where they state that a frame that a decision maker
adopts is controlled partly by the formulation of the problem and partly by the norms,
habits, and personal characteristics of the decision maker.
In their illustration, they present preference reversals with data obtained from
students at Stanford University and the University of British Columbia who answered
brief questionnaires in a classroom setting. The total number of respondents for each
problem was denoted by N. The brackets indicate the percentage who chose the relative
option. The sample was presented by two problems separately.
First one sample was presented with problem 1 which stated as follows:
“Imagine that the US is preparing for the outbreak of an unusual Asian disease,
which is expected to kill 600 people. Two alternative programs to combat the disease
have been proposed. Assume that the exact scientific estimates of the consequences of
the programs are:
Option 1) If Program A is adopted, 200 people will be saved. [72 per cent]
Option 2) If Program B is adopted, there is 1/3 probability that 600 people will be
saved, and 2/3 probability that no people will be saved. [28 per cent]”
They then ask which of the two programs the sample would favour.
- 3 -
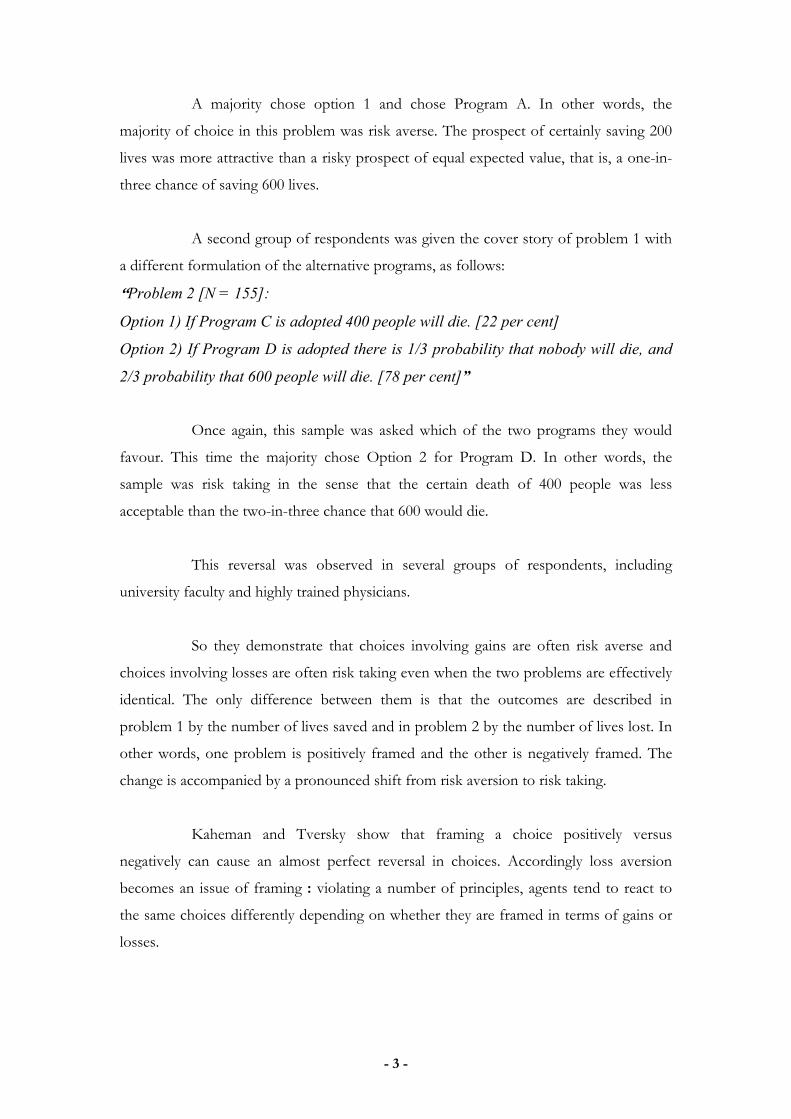
A majority chose option 1 and chose Program A. In other words, the
majority of choice in this problem was risk averse. The prospect of certainly saving 200
lives was more attractive than a risky prospect of equal expected value, that is, a one-in-
three chance of saving 600 lives.
A second group of respondents was given the cover story of problem 1 with
a different formulation of the alternative programs, as follows:
“Problem 2 [N = 155]:
Option 1) If Program C is adopted 400 people will die. [22 per cent]
Option 2) If Program D is adopted there is 1/3 probability that nobody will die, and
2/3 probability that 600 people will die. [78 per cent]”
Once again, this sample was asked which of the two programs they would
favour. This time the majority chose Option 2 for Program D. In other words, the
sample was risk taking in the sense that the certain death of 400 people was less
acceptable than the twointhree chance that 600 would die.
This reversal was observed in several groups of respondents, including
university faculty and highly trained physicians.
So they demonstrate that choices involving gains are often risk averse and
choices involving losses are often risk taking even when the two problems are effectively
identical. The only difference between them is that the outcomes are described in
problem 1 by the number of lives saved and in problem 2 by the number of lives lost. In
other words, one problem is positively framed and the other is negatively framed. The
change is accompanied by a pronounced shift from risk aversion to risk taking.
Kaheman and Tversky show that framing a choice positively versus
negatively can cause an almost perfect reversal in choices. Accordingly loss aversion
becomes an issue of framing : violating a number of principles, agents tend to react to
the same choices differently depending on whether they are framed in terms of gains or
losses.
1.2 Purpose of the Thesis
However, this thesis, seeks to prove a different effect of loss aversion on
decision making. It provides a new perspective through loss aversion (and does not
disprove the existing theory). It seeks to prove that:
In a continuing (or repeating) model, agents being averse to loss, when
faced with a decision to an uncertain outcome, differ only in terms of intensiveness
of the choice based on the immediate previous experience of winning or losing,
while the choice itself remains broadly similar.
In other words, the broad choice remains unchanged when an individual
faces winning or losing in reality, subject to a continuing process of decision making.
A continuing (or repeating) model is here defined as a process which
regenerates itself over and over, with the lapse of time. Investing in a stock
market can be understood as a continuing process where decisions are
continuously taken over a period of time. In other words, decisions are repeatedly
required to be taken over the lapse of time.
The difference of this theory from the choice of framing is that with framing,
one chooses from a set of decisions on the basis of what would happen if the decision
was taken. The essence of this theory, however, lies in demonstrating the choice of
decision based on what has already happened affecting the decision for the subsequent
repeated situation.
This is not a paper on Overconfidence4. This thesis seeks to prove
irrationality in a continuous environment while overconfidence does not distinguish
between levels of behaviour for each decision based on past experiences. The theory of
overconfidence does not take account of a continuous process for an investment
strategy but imposes that it is the overconfidence that generates the irrationality in
decision making. However, this paper seeks to pave way for proving how the outcomes
of an investment strategy affect behaviour and decision making, irrespective of the issue
of confidence. 4 Lichtenstein, Fishchhoff, and Phillips (1977) find that individuals are overconfident and frequently
overestimate the reliability of their knowledge. Professional investors are more confident of their predictions in fields where they have self-declared expertise, holding their predictive ability constant. More recent researches have also explained this phenomenon: De Bondt and Thaler (1985); Goldberg, Von Nitsch, 2001.
- 4 -
- 5 -
1.3 The Experiment
This thesis seeks to conduct an experiment involving a sample of 100
individuals using gaming software which enables to perform a test on how people react,
in a continuous environment, to situations of winning or losing. The game is ‘Blackjack’,
the game of cards. The sample is required to answer the questions built-in in the design
of the game based on their eagerness and behaviour.
Although most of the experiment software was designed by me, but quite
some help was extended by a graduate programmer of Information Technology and
Design, Jai Oberoi, in linking the answers to the questions asked to a printable format.
The results of the experiment are generated as reports and collected to be
deduced upon. The research reveals that although winning and losing affects the way a
person makes a choice in its intensity and approach, the choice itself is almost certainly
one sided.
1.4 Verification through Empirical Analysis
The validity of a laboratory experiment can be strengthened by empirical
relevance. Efforts are made towards it by questioning private investors about their
behaviour during investing. The time period analysed is during and after the market
decline of March 2000.
However, due to time restriction, it was not possible to gather substantial
evidence for empirical validation and only a small sample was analysed. But due care and
thought has been given in designing the Questions in a way so as to make it easier for the
sample to recollect their behaviour during that period.
- 6 -
1.5 Overview of the Thesis
The structure of the thesis is as follows:
Chapter 2 Consists of how the experiment is built describing the working process and
gathering of results. It also accounts for how the diverse behaviours among
individuals are characterised.
Chapter 3 Presents a deduction of the results evaluated and also comparisons across
gender and confidence. The validity of the theory is exposed in this chapter
and is also isolated from over-confidence.
Chapter 4 Describes the empirical research conducted and the results obtained. A
subsequent analysis of these results is included with the observations. Here
again, the isolation of the theory from overconfidence is empirically verified.
Chapter 5 Concerns the implications of the theory on a general level which might be
able to explain some anomalies in the market trend. Although a pure
econometric model might be needed to prove the implication of the theory
on the anomalies, it has not been included in this research.
Chapter 6 Provides an account of the criticisms that might be faced by this thesis on a
few issues. It openly invites criticism, if any, for it is then that further
research will be pushed on to validate the principle behind the theory.
Relevant appendices are included at the end of the thesis.
II
BLACKJACK : THE EXPERIMENT
For most of us, the task of beating the market is not difficult, it is the job of beating
ourselves that’s proves to be overwhelming - Martin J. Pring
If one could master one’s emotions, we would be less likely to extensively use
books and mathematical methods to make judgements. Important as they may be, the
response in terms of decisions to such emotions has a great deal to play in the following
experiment.
The experiment of this paper relates the game BlackJack to investment
psychology. It seeks to explain how immediate past performance is a reference affecting
decisions, which are irrational in theory, in a continuous environment.
2.1 The Construction: Building the Experiment
It has been considered better for the game to be built as a computer gaming
software and the questions constructed within for three good reasons:
1. The outreach of a computer based experiment is wide, having no need for a physical
presence since the experiment questions need to be answered by the sample itself.
2. In order to eliminate personal judgments and distractions while playing the game, the
sample answers all the questions itself. The ease of a computer based questionnaire
(Appendix 1), which here has been designed to filter similar characteristics, is far better
than paper-based questionnaires since comparisons can be made much more easily
without having the need of analysing the answers on each questionnaire. It saves time
and avoids misinterpretations of results.
3. By being able to experiment and gather results from different communities across
geographic areas, their behaviours can be compared with each other within the
experiment. Although comparisons are not included in this thesis, research is plausible by
analysing the results of the experiment.
- 7 -
2.2 The Material: Elements of the Experiment
The questionnaire, as seen in Appendix I, starts by asking which group the sample
belongs to. They are characterised on the basis of the following: (Appendix I: Section 1)
Gender
Age Group
Geographic Location
Expertise in gambling (It is assumed that the more familiar an individual is with
gambling, the better gambler he or she is)
The experiment itself, starts by asking a question designed in a way so as to
see how the sample feels about its chances in the game before playing the game6
(Appendix I: Section 2). Tests similar to such, at individual levels, have been conducted
before to demonstrate overconfidence among people in their ability and knowledge.
Overconfidence is characteristic of people, not of markets (Odean 1998a). People have
unrealistically positive self-evaluations (Greenwald 1980). They rate their abilities and
their prospects higher than those of their peers.
When a sample of U.S. students – average age 22 – assessed their own driving
safety, 82% judged themselves to be in the top 30% of the group (Svenson 1981)7 . In a
similar way, professional investors are more confident of their predictions in fields where
they have self-declared expertise, holding their predictive ability constant.
The sample then enters an amount it wishes to bet with. Each individual is
given a credit of virtual $ 200 to start with.
After the first bet is played, and the winner has either won or lost, another set
of questions is required to be answered before any individual can proceed (Appendix 1:
Section 3). The answers test how eager or aggressive the sample is after winning or
losing the previous bet(s). In other words, a record of choices is logged and then
evaluated at the end of each game. The questions here test how the sample wishes to play
further thereby logging his interests.
5 The sample was given a copy of the game without the questions before they started the experiment
so they could get familiar with the game. 6 A modest 51% of a group of older Swedish students – average age 33 – placed themselves on the
top 30% of their group. - 8 -
Another question then follows in order to log how the sample responds
when questioning his chances of winning the next game and his confidence in that
factor. This is regardless of a situation of winning or losing.
This procedure is repeated after every game and logged7 in a printable format
till the sample quits either willingly or forcefully because of no remaining credit in the
virtual account. The log created is requested back from each individual in the sample
either through postal mail or through email over the internet. All results are gathered,
matched and compared, and then arranged into 6 categories according to their behaviour.
2.3 The Players
Gathering a sample to conduct an experiment is a challenging task and
requires a lot of resources to be devoted in assembling and re-collecting the results.
However, the internet provides an excellent solution to this issue. If experiments can be
prepared as computer generated (which do not require supervision) or if surveys are to
be conducted, the best approach is the ‘Internet’. It accesses millions of people from
all around the world for an unimaginably low cost.
For this research, the internet was used as the tool of deployment for the
experiment. There are many who have their interest in the broad subject such as
discussion groups on the World Wide Web, e.g. Yahoo8. People including friends and
acquaintances were contacted through email and the results were requested back from
the participants. They were told that for unbiased experimental purposes, the principle
of the experiment could not be communicated and it would be publicised for the
group after the research was completed. Also many former fellow classmates helped
by participating in the experiment.
This tool has not only been inexpensive but fully effective. The best way to
see what happens to a flower is by putting it in a room satiated by butterflies! This is
what was done for this research.
7 The result of each question answered in the game is noted in a log file as a Microsoft Word document named Results.doc.
8 Yahoo is an index to information on the world wide web. A small world in itself.
- 9 -
2.3.1 Categorising human behaviour
Categories are made so it is easier to analyse behaviour by reducing the need
to observe all values or answers individually. This is unrelated to the primary
research purpose but only assists in deducing from the results. Categories A to F
(Appendix 1: Section 4) :
Category A
If an individual loses a game and answers “Yes, definitely” to question 2 (Appendix I:
Section 2) and answers “Yes, definitely” to question 4 (Appendix I: Section 3), then he is
thought to be ‘irrational, aggressive and over-confident’ and categorised as ‘A’.
Category B
If an individual loses a game and answers “Yes, definitely” to question 2 (Appendix I:
Section 2) and answers “Yes” or “Cannot say” to question 4 (Appendix I: Section 3),
then he is thought to be rrational and aggress ve’ and categorised as ‘B’. ‘i i
Category C
If an individual loses a game and answers “Will give it a shot” to question 2 (Appendix I:
Section 2), then he is thought to be ‘cautious but irrational’ and categorised as ‘C’.
Category D
If an individual loses a game and answers “No” to question 2 (Appendix I: Section 2),
then he is thought to be ‘cautious but rational’ and categorised as ‘D’.
Or
If an individual wins a game and answers “Will give it a shot” to question 2 (Appendix I:
Section 2), then he is thought to be ‘cautious and rational’ and categorised as ‘D’.
Category E:
If an individual wins a game and answers “Yes, definitely” or “Yes” to question 2
(Appendix I: Section 2), then he is thought to be ‘incautious’ and categorised as ‘E’.
Category F:
If an individual wins a game and answers “No” to question 2 (Appendix I: Section 2),
then his behaviour is categorised as ‘unclassified’ under category ‘F’.
- 10 -

- 11 -
All other behaviours are unclassified as well as they do not form a part or
have any purpose in the research. This is because such behaviours can be triggered for a
number of reasons outside either the study or (ir)rationality, such as personal reasons-
Someone who wins might not want to play any further because of some important
phone call or work to finish etc.. Although it may also be plausible that an individual is
so satisfied after winning the bet that he or she no longer wishes to play any further, but
such behaviour has a very low probability of occurrence and does not support the
research. So it is categorised as unclassified.
2.4 Compiling the results
All results of the experiment have been compiled into one file using
Microsoft Access and Microsoft Excel and it has made it easier to compare various
aspects of the findings. Appendix 2 consists of the tables constructed from the findings.
III
“HIT OR STAY, SIR?” VALIDATING THE THEORY
He who does not hope to win has already lost – Jose Joaquin Olmedo
In many countries, the law imposes certain legal restrictions on gambling, as
to the legal age limit, maximum allowable limit, geographic coverage etc., but it cannot
restrict the habits within individuals. Almost every one of us is struck by it at some point
in life and no matter which profile one observes, gambling is inherently familiar to that
profile.
The questions posed in this experimental game indicate these profiles. We
look at the purpose solved by each question and results indicated.
3.1 Profile of the Sample
The profile of the respondents is quite mixed. Out of the 100 responses
received, 78 were men and 22 women. While the men came from all age groups, the
women were concentrated around the 26-35 year group. (See Appendix 3)
As far as familiarity with gambling was concerned, all of them had had a
previous experience of gambling, either occasionally or on a regular basis.
The sample belonged mainly to the United States, which I think is quite
valuable since the stock market has shown exceptional development during the past few
decades in the United States (Goetzmann, W. N. and Jorion, P. (1996)). And if the
experiment is to be related empirically to the stock market, this would provide a solid
ground to verify the findings of the experiment. Quite a few in the sample are from the
United Kingdom, 21 to be precise. The rest are scattered around the world from
Australia, India, China and Sri Lanka.
- 12 -
After the sample has entered their profile, a question tests their confidence
on their chances of winning before they start the game. This is not done to judge
overconfidence but to phase out over-confidence being linked to an aggressive decision
making process after suffering a loss or facing defeat. Some might argue that such
aggressiveness is only revealed by over-confident agents, but this research will eliminate
such a supposition.
This question forms a part of that process. It will then be established that
even agents or individuals without much faith in their abilities, tend not to be able to
accept defeat.
69%9 of the total sample demonstrated confidence in their ability to win the
game. This is surprisingly a lower figure than anticipated judging from the findings of the
previous question (that all the individuals had a previous experience of gambling). It
would generally be the belief that the more one gets accustomed to a process, the more
confident he would feel in the process, for the process.
Consider this: Your confidence in using a ‘Do It Yourself’ Kit for your home
improvement or other constructions increases considerably after the first few attempts.
In a survey10 conducted by the Woolwich in 2000 through an Audience Selection, 50%
of people enjoyed their D.I.Y. and a substantial minority felt that they could outperform
the professionals in D.I.Y. Men were the most confident of their DIY skills: one in five
claimed that they could do it better than any professional. Women were more cautious,
or perhaps more realistic, with only 17% believing they could do better than the outside
experts.
So why isn’t the response to over-confidence higher than the one found?
Well, it could be believed that there is a possibility for those who do not
gamble regularly but occasionally or rarely to be unconfident about their skills and
abilities so as not to count themselves as the jacks of the trade.
9 all percentages are approximated to the nearest decimal point. 10 http://www.rigby-research.co.uk/marketinfo/housing/diy.asp
- 13 -
Certainly this is what the findings reveal. Those who gamble regularly are too
confident in judging themselves. All the 63 who gambled regularly felt confident. While
out of the remaining : 31, who only gambled occasionally, either did not feel confident
or could not say what their chances of winning would be. Only a few of them, 6, were
overconfident.
Another finding in this result is that proportionally more men seem to be
over-confident when compared to women. Approximately 78% of the total men were
over-confident, almost all (57) who played regularly, while only 37% of the total women
were over-confident (8 out of 22). Once again, this might have something to do with the
fact that not many women in the sample were regular gamblers. Most of them played
occasionally. So to isolate the effects on confidence of ‘playing occasionally’ or ‘being a
woman’ is difficult. But it has been shown in previous researches that women tend to be
less confident than men11 . These findings will come in good use later in the research.
3.2 Testing Intensity in Decisions
The sample is then asked the estimated value of the bet that they would like
to place. Although the sample is given a credit of $200 each in their account, they can
place a bet of any amount within that range i.e. $1-$200. The purpose of this question is
to observe how much effect, if any, does winning or losing have on the proportional
amount that is bet.
It could be true that aggressiveness is not only present in the decision making
process but it works its way through to the intensity of the decision. In other words, in
this case, we might see an increase in the amount of bet placed after a loss or defeat by
the game.
The results of this question are not important at this point of time in the
research but its purpose will become clear as we proceed further into the research with
its significance getting greater. However, the range chosen by groups is shown in
Appendix 2.
11 Bruce & Johnson, 1994 show that males show more confidence in gambling than females. Another
research that highlights the same fact has been conducted by Toneatto, T., Blitz-Miller, T., Calderwood, K., Dragonetti, R. & Tsanos, A. (1997).
- 14 -
3.3 BET ONE
3.3.1 Winners and Losers
When the game starts and the sample choose their first bet, the outcome of
the bet is logged (as explained in the previous chapter) according to a win or loss. Such
winning or losing is random and in a sense independent to the skills and abilities of the
sample in playing the game12
“A gambler with a system must be, to a greater or lesser extent, insane”
George Augustus Sala (1828 – 95) (English Writer and Journalist)
There is little use in explaining the results and outcomes of the first bet for
the sample. However, this does have further implications on bets placed after the first
one so we illustrate the results as they were logged.
54% won their first bet
39% lost their first bet
7% had a draw
3.3.2 Survivors
After the outcome of the first bet, the sample is faced with another set of
questions. They are asked if they wish to play the next game. It might be too early to ask
if they wished to proceed just after the first bet as one would be expected to stay for a
much longer time on the table than only for one single bet. But the results tell us a
different story: Even though no one is expected to quit the game, 8 people out of the
sample quit; All of them men. But here quitting has been forced by insufficient credit in
the account. In other words, they had bet all the money i.e. $200 towards the first bet.
One would wonder why they bet all the 200 dollars on the first bet. It might seem easier
to explain it when one notices that all the 8 men who were forced to quit were over-
confident in the beginning of the game. This clarifies why they would want to bet the
whole amount for the first bet, confident about winning it.
12 Blackjack is a game of cards where skills can only come is use when one can count cards! Statistics and mathematics although do come to play but once the decks are shuffled, it is more of luck than anything else. One has to be extremely highly skilled and professional to beat the game.
- 15 -
- 16 -
3.3.3 Testing Aggressiveness
Out of the 92 left in the sample who were still playing the game, 79 were
eager to play the next bet while 13 wished to ‘Give it a shot’ (See Appendix 2)
Once again, out of the 79 who were eager to play further, 64% (50 off 79)
were the ones who gambled regularly, and so, from the finding of over-confidence,
trusted their abilities much more than the others to play the next bet. The remaining 37%
(29 out of 79) were out of the group who played occasionally but out of these 26 people,
6 were overconfident to begin with during the game.
The remaining 13 who wanted to try the next game were mainly from the
group who only played occasionally and were not confident in the beginning or could not
say. Only 5 were the overconfident ones.
3.3.4 Testing Intensity and Confidence
Answering “Yes, definitely” or “Will give it a shot” proceeds the game to the
next bet. But before the sample could place the next bet, they were required to answer
two more questions. The first one of these asks how much they wish to bet. It can be
observed that there was no change in the proportion of amount the sample wished to
bet. This could be to do with the fact that it was only the second bet, so it did not drive
up the need to feel rich rapidly in order to induce the groups to bet a higher amount.
Although it would be expected that once a person wins a bet, he would bet even more
for the next bet but this did not ensue here. The proportion of amount of bet placed
remained largely unchanged.
The second question tests the change in level of confidence after winning or
losing the first bet. The sample was asked if they thought they would win the next bet.
Out of the 54 who won the first bet; 13 believed they would win the second bet but were
not over- confident (they answered ‘Yes’); 8 could not say whether they would win or
lose, deeming them uncertain; and 33 were over-confident that they would win the
second bet (they answered ‘Yes, definitely’). Those who had faith in their abilities in the
start clearly would demonstrate no sign of changing their perspective once they win.
Among the 33, 30 were the people who were overconfident to start with while the
remaining 3 were from the group which was either unconfident or could not judge the
level of their abilities.

- 17 -
Out of the group that lost its first best, 64% still were certain they would win
the second bet. These 64% constitute the 22 overconfident people and 3 who were not
confident to start with. One would expect the latter group to back out of the game or
atleast be cautious in determining their abilities once they lose a bet, but such rational
behaviour is not exposed here. However the number of people in this group to
demonstrate such behaviour is too low to assert anything. It is only after a few bets have
been placed and results noted and logged, that one can analyse and draw conclusions on
the behaviour of the sample.
The rest 36% out of the group that lost the first bet (14 out of 39) constituted 5
(13%) who could not say what their chances would be for the next game and 1 was
certain but not over-confident by answering “Yes” for winning the next game. It was not
possible to check the behaviour of the remaining 8 as they lost completely and were out
of the game.
The findings of this question after every bet is important when compared to
the question that tests aggressiveness in decision making (i.e. Question 1, Appendix 1:
Section 3 - ‘Do you wish to play the next game?’). As explained earlier, this is to isolate
this theory from over-confidence. The attempt is to test the behaviour of the
unconfident group in the sample in making decisions after facing defeat or loss. For even
those who are insecure will display aggressiveness in decision making after facing defeat.
However, more attention will be paid to the behaviour of those who lose
their bets at each stage from the second bet onwards as that is the primary purpose of
the paper. Nevertheless, comparing the results of overconfidence with aggressiveness
and intensity will also form an important part of the following findings.
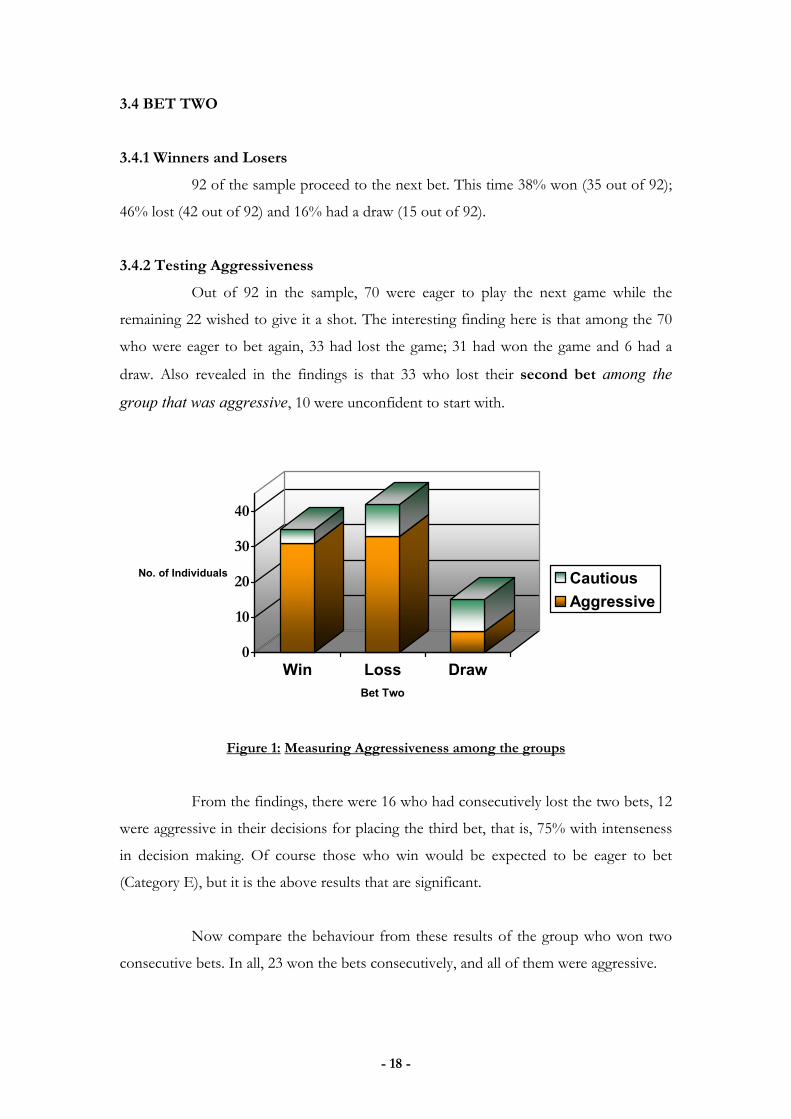
3.4 BET TWO
3.4.1 Winners and Losers
92 of the sample proceed to the next bet. This time 38% won (35 out of 92);
46% lost (42 out of 92) and 16% had a draw (15 out of 92).
3.4.2 Testing Aggressiveness
Out of 92 in the sample, 70 were eager to play the next game while the
remaining 22 wished to give it a shot. The interesting finding here is that among the 70
who were eager to bet again, 33 had lost the game; 31 had won the game and 6 had a
draw. Also revealed in the findings is that 33 who lost their second bet among the
group that was aggressive, 10 were unconfident to start with.
0
10
20
30
40
No. of Individuals
Win Loss DrawBet Two
CautiousAggressive
Figure 1: Measuring Aggressiveness among the groups
From the findings, there were 16 who had consecutively lost the two bets, 12
were aggressive in their decisions for placing the third bet, that is, 75% with intenseness
in decision making. Of course those who win would be expected to be eager to bet
(Category E), but it is the above results that are significant.
Now compare the behaviour from these results of the group who won two
consecutive bets. In all, 23 won the bets consecutively, and all of them were aggressive.
- 18 -
One would expect that the decision on placing a bet for a group that lost two
consecutive bets would differ from the decision of a group which wins two consecutive
bets. But the findings reveal a similarity between the behaviour of the groups. Both are
aggressive in this continuous environment although the reasons behind such
aggressiveness differ.
3.4.3 Testing Intensity and Confidence
Among the 33 aggressive decision makers (who lost the second bet), 18
changed their level of betting amounts to a higher range. Among these 18, 11 belonged
to the group that had lost twice consecutively and became aggressive (group of 12). In
other words, these 92% (11 out of 12) aggressive decision makers increased their betting
range after facing consecutive defeat in the previous bets.
0102030405060708090
100
Percentage of Individuals
%
Only Lost Bet 2 Lost Bet 1 & 2
ModerateIntense
Figure 2: Measuring Intensity
Thus, both groups have similar choices, only the intensity varies. 92% of the
aggressive group which lost the bet increased their betting range while the winning group
did not change their range for the next bet.
When asked if the sample thought they would win the next bet, the findings
are even more interesting:
All the 16 who had lost twice could not comment about their chances
(Category B). Among these were 12 who became intense in their decisions. So,
although this group was not sure of its chances and was uncertain, but it still took
the decision to play further.
- 19 -
This certainly does not account for any kind of rational behaviour in the
theories of finance over the past decades. Such irrationality is generated purely from
human nature.
It can be thought that a high percentage of losers who became aggressive
decision makers is due to the fact that defeat or loss can, most of the times, be hard to
accept. Such a notion may result in producing irrationality in decision making.
And this is true for all groups of people. Out of the 70 who were eager to
play the next bet, 46 were overconfident since the beginning of the game and 24
were either unconfident or not certain about their abilities. Thus, we observe an
aggressive behaviour across both groups. Proportionally, 66% of the over-
confident group (46 out of the 69 overconfident in all) was eager to play the next
bet and 77% of the unconfident group (24 out of 31) became eager or aggressive
for the next bet.
0102030405060708090
100
Percentage of Individuals
%
Overconfident Unconfident
ModerateEager
Figure 3: Comparing the theory with Overconfidence
The findings from the third bet will confirm such behaviour.
- 20 -
3.5 BET THREE
3.5.1 Winners and Losers
For the third bet, the following were the results:
49% won: 45 out of 92
43% lost: 40 out of 92
8% had a draw: 7 out of 92
3.5.2 Testing Aggressiveness
The sample still consists of 92 individuals being experimented. Among these,
74 were eager to play the next bet while 18 wanted to give it a try. Among the eager
group of 73, 33 had actually lost the third bet; 38 had won it, while the remaining 3 had a
draw.
0
10
20
30
40
No. of Individuals
Win Loss DrawBet Three
CautiousAggressive
Figure 4: Measuring Aggressiveness among the groups
Observing carefully, among the 33 aggressive decision makers who had lost
the third bet, 14 were unconfident in the beginning of the game.
24 of those who lost the second bet also lost the third bet. In other words, 24
of the sample in this case had lost two consecutive bets (the second bet and the third
bet). Out of these, 22 became eager to play the next bet i.e. they were aggressive in taking
their decisions. At this stage it was 92% of those who lost the last two bets who became
intense to place the next bet.
- 21 -
Another interesting finding is that from the sample that lost all the three bets
(7 had lost all the three bets), all of them became eager to place the fourth bet!
Now again, these results are compared with the group who won the last two
bets consecutively. 19 won the second as well as the third bet; once again all of them
were aggressive decision makers
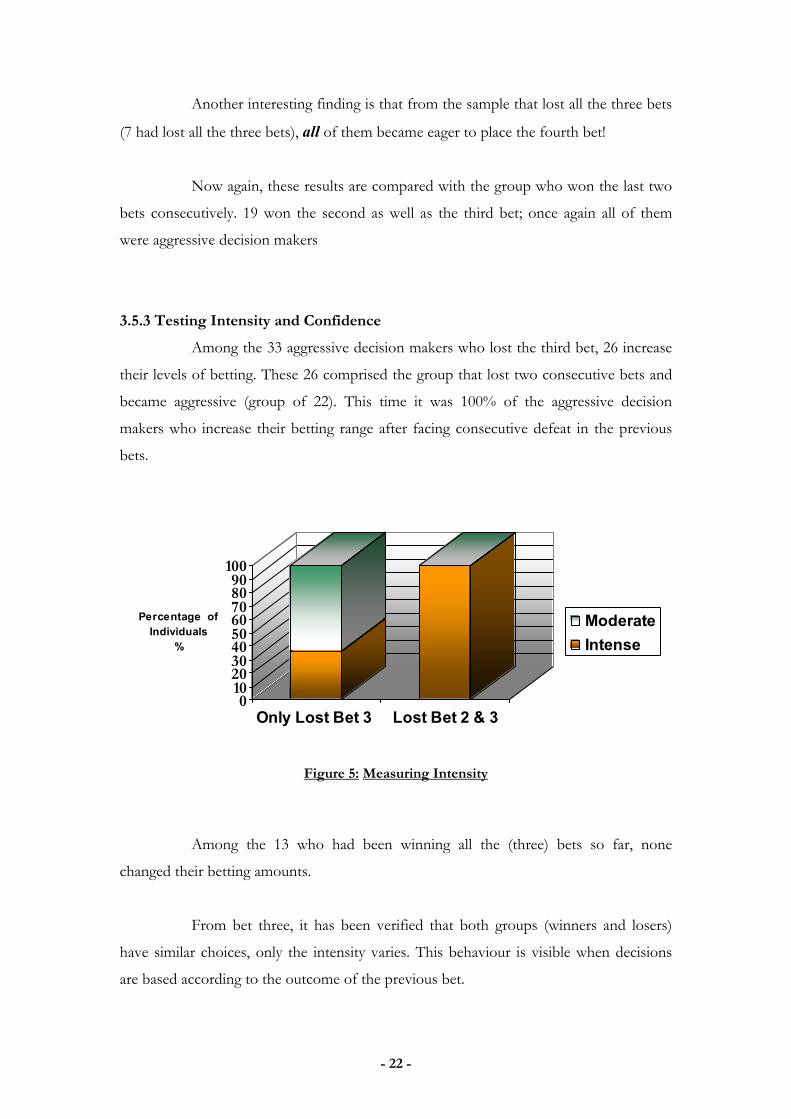
3.5.3 Testing Intensity and Confidence
Among the 33 aggressive decision makers who lost the third bet, 26 increase
their levels of betting. These 26 comprised the group that lost two consecutive bets and
became aggressive (group of 22). This time it was 100% of the aggressive decision
makers who increase their betting range after facing consecutive defeat in the previous
bets.
0102030405060708090
100
Percentage of Individuals
%
Only Lost Bet 3 Lost Bet 2 & 3
ModerateIntense
Figure 5: Measuring Intensity
Among the 13 who had been winning all the (three) bets so far, none
changed their betting amounts.
From bet three, it has been verified that both groups (winners and losers)
have similar choices, only the intensity varies. This behaviour is visible when decisions
are based according to the outcome of the previous bet.
- 22 -
The final question for the bet seeks to test if the sample is confident after
taking a decision. Once again, the 24 individuals who lost twice consecutively in the
previous bets could not comment about their chances. Among these were 22 who
became aggressive in their decisions (Category B).
Now I attempt to isolate overconfidence from the validity of the theory.
Out of the 74 who became eager to play the next bet, 51 were overconfident
since the beginning. 23 were unconfident. Here, the behaviour from the second bet can
be verified. The proportions of aggressive overconfident individuals and the unconfident
ones remained largely unchanged. 74% of overconfident individuals were eager to play
the fourth bet (51 out of 69) and 75% of unconfident individuals became eager to play
the fourth bet. Compare these findings from the second bet where 66% of the
overconfident group and 77% of the unconfident group became eager to play the third
bet!
0102030405060708090
100
Percentage of Individuals
%
Overconfident Unconfident
ModerateEager
Figure 6: Comparing the theory with Overconfidence
Hence, it has not only been validated but also verified that defeat or loss
becomes hard to accept and forces a decision not different from the decision taken when
gains are made. This behaviour exists irrespective of the levels of confidence among
individuals.
- 23 -

It can now be asserted that an individual, when faced with a decision leading
to an uncertain outcome in a continuing process, only differs in the intenseness of the
decision according to previous events of winning or losing, but the broad choice remains
unaltered. More specifically, losses tend to generate the aggressiveness and intensity
among the choice of decision.
The analysis rests after bet three due to limitations of the thesis though the
research can be extended by observing the complete results. But a glance to the rest of
the results reveals the same findings.
- 24 -
IV
EMPIRICAL INVESTIGATION
Pride of opinion has been responsible for the downfall of more men on Wall Street
than any other factor - Charles Dow
The laboratory results turned out just as anticipated, with individuals
behaving in a manner where defeat is hard to accept. Now the purpose is to use that
deduction in the stock market for empirical analysis. This chapter deals with validating
the theory empirically by asking a set of questions to those involved in investing.
The questionnaire presented in Appendix 3 is the one directed at private
investors.
50 questionnaires were sent out to investors from different countries through
email (internet) and postal mail. Out of those, 43 questionnaires were received fully filled.
3 were incomplete and the remaining 4 were not received at all. For the investigation,
only the completed questionnaires were taken into account.
The following sections will describe the profile of respondents as well as
purpose of the questions together with the results obtained. Tables and statistics of each
question are provided in Appendix 4.
4.1 Profile of the sample
This questionnaire is designed specifically for investors who had been
involved in trading activities during the recent period of market decline in March 2000.
This is done because of two reasons:
One, to be sure that empirical investigation is carried on around the same
base and for the same time period. Otherwise discrepancies might arise among
characteristics of different time periods, for each time period for the stock market is led
by and characterised by different factors. The boom from 1998 till March 2000 was
contributed by the growth and development of Information Technology.
- 25 -
- 26 -
Secondly, it is important to consider evidence from the recent past instead of
a period long time ago since the questionnaire is one which requires one to jog his
memory; and the further we go back in time, the less likely are we to get reliable results.
Moreover data collected on the basis of information provided in response to questions
about the past is much more reliable for a recent market crash.
The past is malleable and flexible, changing as our recollection interprets and re-explains what has happened.
- Peter Berger
79 % of the private investors who responded to the questionnaire were men,
the rest women. 72 % among the age group ‘26-35’; 21% from the age group ‘36-50’ and
7% were ‘Over 50 years’
4.2 Involvement in Trading during 1998 and 2000
The first of the set of questions checks to see if the respondents are suitable
to be included in the sample. Although a pre-check on the respondents was already
undertaken, the question is still included for assurance purposes. As it turns out, all the
respondents were considered for the sample.
4.3 Investor’s Ability to forecast Market Development
The second question is interested to determine if investors believed they
could forecast market development during the speculative bubble. The purpose is to
establish the degree of over confidence among investors during the period from the fall
of 1998 to March 2000. 44% of private investors (19 out of 43) believed that they could
forecast the market development at some point during the speculative bubble. Out of
these, 79% were men and 21% women. 14% (6 out of 43) could not decide and the rest
(18 out of 43) believed that they could not forecast the market development.
The idea is to test later on if the results of the experiment on analysing the
behaviour of the sample is same across all groups i.e. overconfident; unconfident; and
those indecisive.
This will help isolate and distinguish the theory from over confidence. As
stated earlier, this is not a theory in overconfidence and so it is necessary to test the
behaviour across the group which was not confident with the group which was
confident.
4.4 Involvement in Trading during the Market Decline in March 2000
For empirical evaluation, it was necessary to check if the sample was involved
in and continued trading during the period of decline. This is so because only people
who continued to invest could exhibit behaviour of aggressiveness after suffering losses.
Those who stopped trading could not have displayed such behaviour and are supposed
to fit Category D – Cautious and rational. Questions 3 and 4 together deal with this issue.
The findings show that 12% (5 out of 43) of the respondents demonstrated
such a behaviour i.e. stopped trading. The reason behind such a finding, although not
investigated here, can be attributed to caution observed by some investors during
investing.
4.4.1 Filtered Sample
From this moment onwards in the investigation, only the group which
continued to trade during the decline is considered for research purposes. Since the
idea is to test the aggressiveness in decision making after facing defeat, 5 of the investors
who stopped trading are no more considered for investigation as their behaviour no
longer deemed to be related to this research. The filtered sample now consists of 38
private investors in all.
4.5 Checking the research’s Market Characteristic
Question 5 tests if the sample which was involved in trading actually did lose
or did it belong to the bear market13. This paper currently only investigates the bull
market for a compact evaluation to the dissertation. Expediently, the sample fully
belongs to the bull market. Moreover as described earlier, it is necessary to suffer loss in
order to prove the theory empirically which states that loss or defeat makes one more
aggressive in decision making since defeat becomes hard to accept (while the choice
remains unchanged in reference to a situation of win).
13The sample would have a lesser chance to lose if it was trading on the expectancy that process of stocks would fall. During and after the market decline, the bull market was never strong and with stock index falling, it was unlikely that anyone made a profit on the expectancy that stock index would rise. .
- 27 -
4.6 Feeling Defeat
An important issue that follows is to identify if the sample at any point in
time felt defeated by the market. When you feel defeated, it is a sense of ego that sinks
deep in and you wish to undo the effects of defeat. The results for question 6 were
impressively higher than expected. 76% of the filtered sample (29 out of 38) believed that
they were defeated by the market. 16% (6 out of 38) blamed their own abilities in making
the wrong decision. This is an important result as it also gives an account of the
intenseness in decision making for those who did actually consider their investment
strategies to be inappropriate.
Although the findings for this question may just be related to a change in
perception over the time period since the market decline, nevertheless this is an
important result. 8% could not say about how they felt. This could either be because they
could not remember or because they put it to fate, nothing to do with undermining their
ability in strategising investment decisions.
4.7 Accepting Defeat
It is one thing to feel defeated and another to accept it. This is what question
7 addresses. 37/38 people in the sample who felt defeated were unwilling to accept
defeat. Although this amounts to 97% of the sample who felt defeated and unwilling to
accept it, there was one person who did accept defeat and that is enough evidence that
there is a distinction between feeling defeated and accepting defeat. However it is not
reasoned as to why the investor continued investing if she did accept defeat. It could
have been due to personal nature of not giving up or it could be from any other factor
not investigated.
These questions, although might seem similar, but were necessary to
rejuvenate all the characteristics of the specific time in the sample’s memory so they
could easily relate back to it.
- 28 -
4.8 Investigating the Choice of Decision
The next issue, question 8, was designed to test the theory for itself. It seeks
to know if there was a time after the decline that the sample stopped buying more
investments. This is so designed in order to know if the change in circumstances, from
winning in stocks before March 2000 to losing after March 2000, affected the choice of
decision making, from buying and trading investment before March 2000 to stopping
trade after March 2000.
4.8.1 The Findings
The results are in line with the laboratory experiment for 85% of the sample
(32 out of 38). These individuals still invested and did not stop. However, even more
astonishing is that out of the 15% who did stop investing, all of them still wished they
could beat the market by investing in new opportunities. It shows intensity in thought
although not in action.
Among the 32 (85%) who did not stop investing, when asked why they
continued trading (Question 8b Appendix 3), led to the following findings:
(i) “I wanted to beat the market” 31% (10 out of 32)
(ii) “I was sure of my strategies” 19% (6 out of 32)
(iii) “I could not accept losing” 50% (16 out of 32)
(iv) “Cannot say” 0
While answers to (ii) are intended to determine overconfidence, (i) and (iii)
show the actual aggressiveness in behaviour after the losing. From 8 and 8b, this means
that after losing, the choice of decisions remained unchanged, only the samples’ degree
of intenseness in decision making increased. Thus confirming the results of the
experiment and the primary purpose of the paper which seeks to prove that defeat can
be hard to accept, leading to aggressiveness and intenseness in decision making.
- 29 -
4.8.2 Isolating the Theory from Overconfidence
The secondary purpose is to check how many of the aggressive sample had
faith in their abilities to forecast the market to start with. As described before, this will
assist to prove that this paper is not a theory on overconfidence and that overconfidence
can be kept neutral in accepting this theory. Out of the aggressive sample, 12 were
unconfident about their abilities to start with. This amounts to 46% of the aggressive
group (11 out of 26). A similar number was confident when they started i.e. 11 out of the
aggressive group of 26 were overconfident. The remaining 3 were from the group who
could not decide if they felt confident in their abilities in the beginning.
With these findings, one can assert that the aggressive behaviour is
distributed amongst the whole sample without specific reference to over-confidence.
Overconfidence is not the factor that generates aggressiveness but the fact that defeat
is hard to accept produces a sense of intensity in decision making. Proportionally, out
of all the overconfident group of 19, 58% turned out with an aggressive behaviour while
out of the unconfident group of 18, 67% demonstrated an aggressive behaviour.
4.9 Relating Empirical Analysis to General Behaviour
The results to these 8 questions have empirically validated the theory. But is
there a link between the results of the laboratory experiment and the results of the
empirical investigation?
The lab experiment was conducted on a random sample from the general
public. They may or may not have anything to do with investing in the stock market. On
the other hand, the empirical investigation was conducted on a sample strictly involved
with trading. It could just be true that two separate fields might behave in a “similar”
manner when posed in front of a “similar” situation, much specific to their field of
expertise. Or it could be that the sample was biased towards behaving the way they did
during the decline in March 2000 due to broader reasons not investigated here, and that
they will not behave in this fashion given a similar situation in some other time or more
generally.
- 30 -
In other words, does it follow through logical deduction that if the empirical
investigation yielded a set of results for its own area of expertise in finance, then they
would yield the “same” results for a more general but similar situations.
I have already shown that the general experiment results follow through to
more specific fields. To show that this is true vice versa, another set of questions is posed
within the questionnaire:
4.9.1 Determining Overconfidence
Question 9 seeks to determine if the sample would become aggressive in
decision making in a continuous environment in a more general situation when faced
with a loss while the choice of decision will change only in intenseness and not the actual
choice itself. It places the sample in a broader state and tests the decision making
process. Once again the sample here is the filtered sample of 38.
When the sample was asked if they thought they were good investors, 63% of
them believed that they were (24 out of 38). This shows the overconfidence factor.
Although this is a percentage much higher than what the experiment generated, it is likely
that such a rate of confidence is greater on a broader level than when asked about
specific actions or events. Nevertheless there is not much gap or sacrifice of confidence
when it comes to judging one’s own skills. Moreover the purpose of this question is not
to determine overconfidence, but to see how many of those who are overconfident
would demonstrate aggressive decision making behaviour, if they do. Among the rest, 9
were unconfident and 5 could not determine.
4.9.2 Determining Aggression
Any aggressiveness will be measured by question 10. The sample is described
a situation in which a stock that they bought has a 50-50 chance to either increase or
decrease in value by 25% each week and from the past three weeks since they bought the
stock, it has been falling at the rate of 25% each week. They are then asked what they
would do when facing such a situation.
- 31 -

Four possible choices are presented:
(i) investing more in the stock to cover part or whole of the losses when the price rises
since it has a 50% chance to rise as well each week.
(ii) do nothing and hold the stock till the price rises
(iii) sell the stock
(iv) cannot say
The concluding findings from this question satisfy the primary purpose of the
investigation. 79% want to invest more in the stock to cover their losses. This cannot be
held as rational behaviour. The risk of such an investment has risen, given that more
information on the stock does not exist, to pull out of the investment if one is avert to
risks. However this sample does not display such behaviour. In contrast, it becomes
aggressive towards the decision making process in order to cover the previous losses.
Once again, this proves how hard it is to accept defeat thereby resulting in an
aggressive behaviour, not only specific to the time period in the analysis but more
generally as well.
5% wanted to do nothing and hold the stock for the 4th week as well.
Although this does not display aggressiveness, it does show a tendency
towards hoping to win in future. This could be due to a reluctance to accept loss or
personal judgement. However the percentage is far too low compared to the percentages
choosing i, that such a strategy can be considered as biased elements in estimation.
Out of the remaining, 11% wanted to sell the stock and another 5% could
not decide what their strategy would be.
- 32 -
4.9.3 Aggression and Overconfidence: Isolating the effects of each other
Connecting the results for question 10 to the results on overconfidence in
question 9:
1.Out of the 63% who were overconfident as an investor, 20 were among the group
which was aggressive; 2 wished to hold the stock for the 4th week and 2 could not say.
2. Out of the 9 unconfident (24%), 8 of them displayed an aggressive behaviour; 1
wanted to hold the stock for the fourth week.
When these two relevant findings are compared, it can be observed that
proportionally: 83% of the over-confident investors (from question 9) demonstrate an
aggressive behaviour; Also 89% of the unconfident group demonstrates similar
aggressive behaviour!
Evidently, there is no link between overconfidence and reluctance to accept
defeat, for even those who do not have much faith in their abilities become aggressive in
decision making after facing defeat.
It must be remembered that these deductions are from a continuous
environment.
4.10 Sample Satisfaction and Design of the Questionnaire
This questionnaire was designed very carefully so it was easy to understand
and recall information about the past. In cases of difficulties to remember past specific
events, it is well believed that one needs to create a similar situation as the past,
surrounding the subject, to help recollect familiar information from the memory. The
questions here were posed in a way so as to rebuild the characteristics that might have
occurred in the past, event by event or step by step.
When asked if the sample was satisfied in the way the questionnaire was
designed helping them to recollect past information, 94% agreed that it was helpful while
only 3 out of the sample could not determine if it refreshed their memory or not.
- 33 -
V
IMPLICATIONS
There are no certainties in this investment world, and where there are no certainties, you should begin by understanding yourself.
- James L. Fraser
The growth of behavioural finance research has been fuelled by the inability
of the traditional framework to explain many empirical patterns, including stock market
bubbles in Japan, Taiwan and the U.S. (Ritter 2003)
During a crash, every market has a cushion around it preventing the crash to
take some time to materialise. This is not a cushion that prevents the inevitable, nor does
it protect from the sooner implications of the crash. All it does is prolong the process of
collapse. So the market fails to crash when it actually should owing to the excessive
trading before and during the cushion period which takes time to dissolve.
This paper provides a general insight to the implications of the theory in
explaining such empirical anomalies. It only offers an outline to what the theory implies.
According to Taylor and Brown (1988), most individuals see themselves
better than others. They rate their abilities and their prospects higher than those of their
peers. This same phenomenon has been applied into finance.
Anecdotal evidence suggests that in many markets trading volume is
excessive (Dow and Gorton (1997)). Recent empirical studies (Odean (1998a), Statman
and Thorley (1998)) indicate that overconfidence generates trading. In the absence of
noise traders, heterogeneous beliefs among rational investors will generate excessive
trading if rationality is common knowledge. In reality, the high trading volume produced
by well informed institutional investors through their active portfolio management is
much higher than the one produced by individual traders. (Odean: Volume, Volatility,
Price and Profit when all traders are above average). So far through behavioural finance,
overconfidence and agent relationship has been used to explain the trading volume
puzzle and the belief that investors can outperform the market.
- 34 -
However, this paper adds another factor to explain excessive trading. The
aggressiveness in decision making that follows from a recent experience, blocks all access
to rationality. The impact being that it does not allow investors to stop trading when they
should, during signs of losses. In other words, having defeat hard to accept, the decision
making process becomes more intense while the decision among broader choices
remains unchanged.
In the experiment, every time the sample is defeated, it becomes more
intense and aggressive in order to undo the last effects. In a similar fashion, as seen in the
results of the empirical investigation, it is possible to generate over trading in stocks at
times when it should be low. With continuous repetition of defeat which leaves no more
resources to be able to undo the wrong choices undertaken, even if defeat is still hard to
accept, trading by the individual will stop only when all the resources are low or drained
out. With multiple people in a similar ordeal, it is then that the whole market is affected
and crashes. Thus it takes some time for the market to crash and it does not happen
when it is actually should happen
- 35 -
VI
CRITIQUE
He only profits from praise who values criticism. Heinrich Heine (1797 - 1856)
The analysis of this theory, though can pave way for future extensive
research, it does possess characteristics that are prone to criticism. Such criticism is
welcomed, for if it wasn’t for the idea of criticising, new theories would not replace old
ones. And this is true not just for economics or finance!
This paper deals with psychological issues in a manner most controversial.
Some of the issues that may be criticised are given below. However, these criticisms can
be limited by the explained attempts of assurance.
1. Questioning Significance of the Results
This paper lacks a statistical proof for significance of the findings. It has been
more explanatory than being mathematically enhanced by hypothesis testing on the
valid results. Such tests should have been included even if this theory does not
disprove any existing theory but only attempts to provide a new perspective in
behavioural finance through the theory of Loss Aversion. This is a strong issue to be
addressed so no arguments can be given against it.
But I can assure the readers that my next work on this research will be armed
with statistical analysis and tools, leaving no stone unturned. This research does not
end with this thesis14 .
14 I urge the readers who are interested in this research to participate their version or criticism to the
research for the next paper(s). - 36 -
2. Questioning Authenticity of the Results
Using a computer generated software as an experiment which does not have
the need to be supervised may be criticised for the fact that the results could be falsely
generated by the sample.
However it can be assured that no one from the sample knew what the
experiment was regarding prior or during the experiment. It is only when copies of this
paper will be sent out to the sample, as requested, that they will be provided an insight
to the purpose of the experiment. Moreover, a uniquely systematic set of questions that
follows according to the previous answer provided limits such deceptions.
3. Empirical Strength of the Theory
Another strong criticism may evolve from the empirical foundation of this
paper. The results from a sample of 43 do not necessarily validate a theory. More
evidence is needed and researched into before conclusive statements can be asserted.
The empirical foundation of this paper, in the above sense, can be argued to be
inconclusive.
However, it must be kept into account that extensive empirical research has
been left out for this paper not because it was beyond the scope of study but to be able
to comply with the rules of a masters’ dissertation15 .
15 Having said that, previous empirical evaluation on investor behaviour might be studied for
relevance from ‘Behavioral Finance – And the Change of Investor Behavior during and after the Speculative Bubble at the end of the 1990s’ (Pg. 67 -70) by Malena Johnsson, Henrik Lindblom and Peter Platan.
- 37 -
4. Hindsight Bias
Also the empirical analysis carried out on a sample of 43 can be argued to be
less than accurate. The empirical sample consisted of private investors and their
accuracy of remembering investment strategies during past periods is controversial.
The questionnaire is susceptible to the subjective opinions of the respondents.
Fischhoff (1982) writes “they even misremember their own predictions so as to
exaggerate in hindsight what they know in foresight”.
One’s response is often exposed to his/her subjective ability to recollect past
events or strategies. It is quite possible for the respondents to have changed their
perception of past events according to the actual belief in the market. Accordingly, the
responses may be biased towards what they think would have been the correct strategy
if they were exposed to a similar choice in the present time period instead of reflecting
on the actual strategy undertaken in the past.
However, it must be noted that extensive efforts have been made in
designing the questionnaire in a way so the sample can recollect past behaviour event
by event.
4. Need for a Solution
This paper does not provide a solution to the ordeal16. Behavioural
psychology is a vast subject. To understand and assert instances for its application in
finance, it requires an extensive research of human psychology, culture, way of thinking
and other such social factors which affect behaviours among men and women.
16 My endeavours are to extensively research and validate my theory to be able to provide a key to the implications and solutions from the theory. However, for my current paper, I am limited in scope set by the rules.
- 38 -
5. Dominance in the Market
The research underlying the theory has been performed at individual investor
level. Financial markets reflect the results of the behaviour of large number of
individuals, especially institutional investors. The argument against the theory can be
based around the observation that the empirical investigation has been carried on upon
private investors and not the skilled institutional investors; so would the behaviour
overflow to the institutional segment in any way?
However, quite a few researches have shown that the institutional investors
behave in a similar fashion to the private individual investor17 and sometimes even
more irrational.
Apart from these criticisms, every possible attempt has been made to keep this
thesis free from leakages.
17 A good empirical investigation has been conducted by Masters Graduates of School of Economics and Management, Lund University, Sweden in their thesis: Behavioral Finance – And the change of Investor behavior during and after the speculative bubble at the end of the 1990s. Earlier research has also been done by Odean: Volume, volatility, price and profit when all traders are above average.
- 39 -
REFERENCES Arrow, K. J., (1964), “Aspects of the Theory of Risk-Bearing”. Helsinki: Yrjö Hahnsson Foundation.
Baruch Fischhoff, “For those condemned to study the past: Heuristics and biases in hindsight”, in Daniel Kahneman, Paul Slovic, and Amos Tversky, editors, Judgment Under Uncertainty: Heuristics and Biases (Cambridge University Press, 1982), pp. 335-351.
Bruce, A. C., & J. E. V., Johnson, (1994). “Male and female betting behaviour: New perspectives.” Journal of Gambling Studies, 10, 183-198. De Bondt, W.F., and Thaler, R.H., (1985), “Does the Stock market Overreact?” Journal of Finance, 40: 793-805. Dow, James and Gary Gorton, “Noise Trading, Delegated Portfolio Management, and Economic Welfare,” Journal of Political Economy 105 (5): 1024 – 1050. Friedman and Savage (1948) ‘The Utility Analysis of Choices involving Risk”. Goetzmann, William N. and Jorion, Philippe, "A Century of Global Stock Markets" (December 1996). Yale School of Management Working Paper No. F-55. Available at http://papers.ssrn.com/sol3/papers.cfm?abstract_id=8156 Goldberg, Joachim and von Nitsch, Rüdiger, (2001) Behavioral Finance, John Wiley & Sons Ltd. Greenwald, A. G., (1980), “The totalitarian ego: Fabrication and revision of personal history”. American Psychologist, 35, 603-618. (Available at http://faculty.washington.edu/agg/bytopic.htm). http://www.wfu.edu/users/palmitar/Law&Valuation/Chapter%202/2-1-3.htm Kahneman, Daniel and Amos, Tversky, (1979), “Prospect Theory: An Analysis of Decision Under Risk”, Econometrica, Vol. 47. No. 2, 263-291. Lichtenstein, Sarah, Baruch Fischhoff, and Lawrence Phillips, (1982). "Calibration of Probabilities: The State of the Art to 1980." Odean, Terrance, 1998a, “Volume, volatility, price and profit when all traders are above average”, Journal of Finance 53, 1887 – 1934. Pring, Martin J. (1995), “Investment Psychology explained: Classic Strategies to beat the market”, Wiley Europe Publishers.
Ritter, J., “Behavioral Finance”, Pacific-Basin Finance Journal, September 2003 Vol. 11 No.4: 429 -437 (bear.cba.ufl/edu/ritter/publ_papers/Behavioral%20Finance.pdf).
Rabin, Matthew (2000), “Risk Aversion and Expected Utility Theory: A Calibration Theorm,” Econometrica 68, Pages 1281 – 1292. Rabin, M. and Richard H. Thaler, (2001), “Anomalies: Risk Aversion,” Journal of Economic Perspectives 15, 219 – 232.
Shefrin, Hersh (2002) “Beyond Greed and Fear: Understanding behavioral finance and the psychology of investing.” Oxford Universtity Press.
Statman, Meir, and Steve Thorley, (1999) "Investor Overconfidence and Trading Volume," Working Paper, Santa Clara University. Svenson, O., (1981), “Are we all less risky and more skilful than our fellow drivers?” Acta Psychologica, 47, 143-148. Taylor, S. E., and J. D. Brown, (1988), “Illusion and well-being: A social psychological perspective on mental health Psychological Bulletin”, 103, 193-210. The Woolwich DIY survey 2000, Michael Rigby Associates, http://www.rigby-research.co.uk/marketinfo/housing/diy.asp Toneatto, T., Blitz-Miller, T., Calderwood, K., Dragonetti, R. & Tsanos, A. (1997), Cognitive distortions in heavy gambling. Journal of Gambling Studies, 13, 253–266. Tversky, A. and D. Kahneman (1992), “Advances in prospect theory: Cumulative representation of uncertainty”. Journal of Risk and Uncertainty, 5, 297-323. Tversky A., and D. Kahneman (1981), ‘The framing of Decisions and the Psychology of Choice’, Science 211, Pages 453 – 458, American Association for the Advancement of Science. von Neumann, John and Oskar Morgenstern, (1944), “Theory of Games and Economic Behavior”, Princeton University Press, Princeton, 1944; Also third edition: 1953. Yahoo Groups: http://groups.yahoo.com/group/behavioural_finance & http:// groups.yahoo.com/group/behavioral-finance

APPENDICES
Appendix 1: BlackJack: The Experiment Questionnaire Appendix 2: BlackJack: The Experiment Results
Appendix 3: Empirical Investigation Questionnaire Appendix 4: Empirical Investigation Results

Appendix ONE BLACKJACK: THE EXPERIMENT
QUESTIONNAIRE
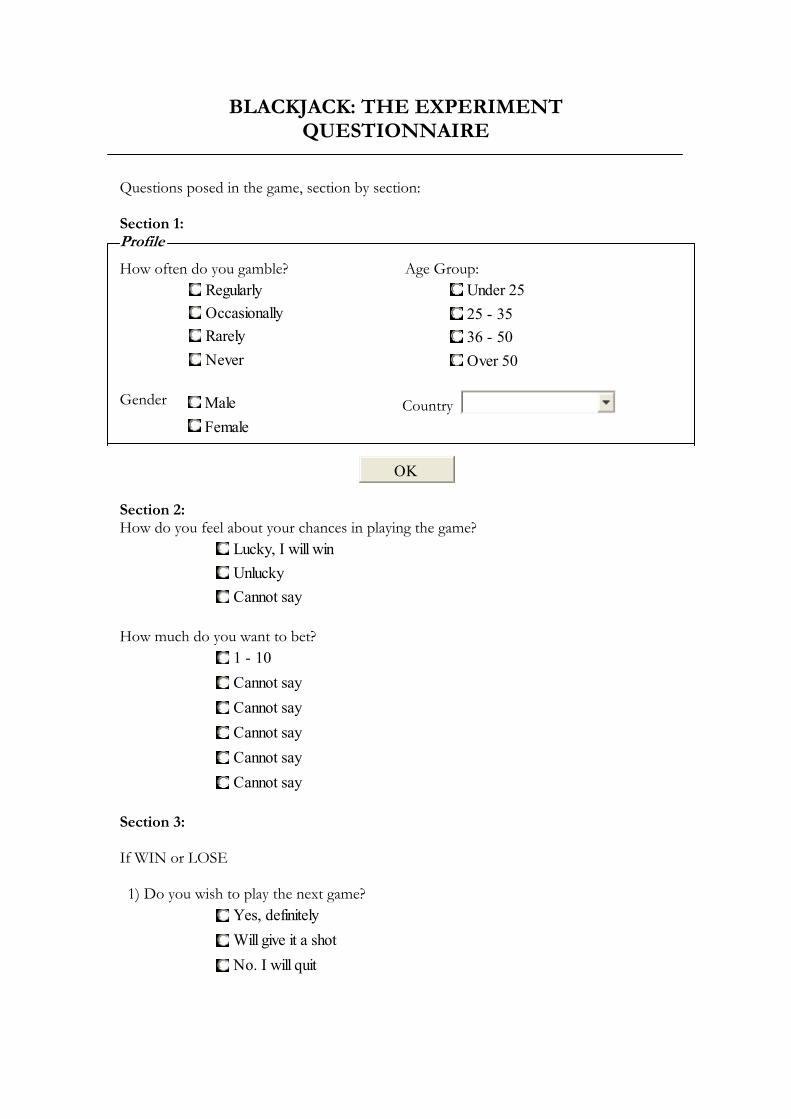
BLACKJACK: THE EXPERIMENT QUESTIONNAIRE
Questions posed in the game, section by section: Section 1: Profile
How often do you gamble?
Regularly Occasionally Rarely Never
Age Group:
Under 25 25 - 35 36 - 50 Over 50
Male Country Female
Gender
OK
Section 2: How do you feel about your chances in playing the game?
Lucky, I will win Unlucky
Cannot say How much do you want to bet?
1 - 10 Cannot say Cannot say Cannot say Cannot say Cannot say
Section 3: If WIN or LOSE 1) Do you wish to play the next game?
Yes, definitely Will give it a shot No. I will quit

If Yes: 2) How much do you want to bet?
1 - 10 11 - 20 21 - 30 31 - 40 41 - 50 Over 50
3) Do you think you will win the next game?
Yes, definitely Yes No No, definitely Cannot say
If No: QUIT Section 4: Categories If loss and answer to question 2 is "Yes, definitely" and answer to question 4 is "Yes, definitely" then Category A If loss and answer to question 2 is "Yes, definitely" and answer to question 4 is "Yes" or “Cannot say” then Category B If loss and answer to question 2 is "Will give it a shot", then Category C If loss and answer to question 2 is "NO", then Category D If win and answer to question 2 is "Yes, definitely" or “Yes”, then Category E If win and answer to question 2 is "Will give it a shot", then Category D If win and answer to 2 is "no", then Category F

Appendix TWO BLACKJACK: THE EXPERIMENT
RESULTS

BLACKJACK: THE EXPERIMENTRESULTS
ID Do you gamble? Gender Age Group Country Sec 2: Q1 Sec 2: Q2 BET ONE Outcome Sec 3: Q1 Sec 3: Q2 Sec 3: Q31 Occasionally Female 26 -35 United States Lucky, I will win 11 - 20 BET ONE Win Yes, definitely 11 - 20 Yes, definitely2 Occasionally Female Under 25 Australia Lucky, I will win 11 - 20 BET ONE Draw Yes, definitely 11 - 20 Yes, definitely3 Occasionally Female 26 -35 United States Unlucky 11 - 20 BET ONE Win Yes, definitely 11 - 20 Yes4 Occasionally Female 26 -35 United Kingdom Cannot say 11 - 20 BET ONE Win Yes, definitely 11 - 20 Yes5 Occasionally Female 26 -35 United States Cannot say 11 - 20 BET ONE Win Yes, definitely 11 - 20 Yes6 Occasionally Female 26 -35 India Unlucky 11 - 20 BET ONE Win Yes, definitely 21 - 30 Cannot say7 Occasionally Female 26 -35 United States Cannot say 21 - 30 BET ONE Win Yes, definitely 21 - 30 Cannot say8 Occasionally Female 26 -35 United Kingdom Unlucky 11 - 20 BET ONE Win Yes, definitely 11 - 20 Cannot say9 Occasionally Female 26 -35 United States Unlucky 11 - 20 BET ONE Win Yes, definitely 11 - 20 Cannot say
10 Occasionally Female 26 -35 India Cannot say 1 - 10 BET ONE Win Will give it a shot 1 - 10 Yes11 Occasionally Female 26 -35 United States Cannot say 1 - 10 BET ONE Lose Will give it a shot 1 - 10 Yes, definitely12 Occasionally Female 36 -50 United States Cannot say 11 - 20 BET ONE Lose Will give it a shot 11 - 20 Yes, definitely13 Occasionally Female 36 -50 India Cannot say 11 - 20 BET ONE Lose Will give it a shot 11 - 20 Cannot say14 Occasionally Female 26 -35 United States Cannot say 11 - 20 BET ONE Lose Will give it a shot 11 - 20 Cannot say15 Occasionally Female 26 -35 United Kingdom Cannot say 21 - 30 BET ONE Lose Will give it a shot 21 - 30 Yes16 Occasionally Female 26 -35 United Kingdom Cannot say 21 - 30 BET ONE Draw Yes, definitely 21 - 30 Cannot say17 Regularly Female 26 -35 United Kingdom Lucky, I will win 21 - 30 BET ONE Win Yes, definitely 21 - 30 Yes, definitely18 Regularly Female 26 -35 United States Lucky, I will win 21 - 30 BET ONE Win Yes, definitely 21 - 30 Yes, definitely19 Regularly Female 36 -50 United States Lucky, I will win 21 - 30 BET ONE Win Will give it a shot 21 - 30 Yes, definitely20 Regularly Female 26 -35 United States Lucky, I will win 31 - 40 BET ONE Lose Yes, definitely 31 - 40 Yes, definitely21 Regularly Female 26 -35 United States Lucky, I will win 31 - 40 BET ONE Lose Will give it a shot 31 - 40 Yes, definitely22 Regularly Female 36 -50 India Lucky, I will win 31 - 40 BET ONE Lose Will give it a shot 31 - 40 Cannot say23 Occasionally Male 36 -50 United Kingdom Cannot say 11 - 20 BET ONE Win Yes, definitely 11 - 20 Yes24 Occasionally Male 36 -50 United States Lucky, I will win 31 - 40 BET ONE Win Yes, definitely 31 - 40 Yes, definitely25 Occasionally Male 36 -50 United States Lucky, I will win 31 - 40 BET ONE Draw Yes, definitely 31 - 40 Yes, definitely26 Occasionally Male 36 -50 United States Lucky, I will win 31 - 40 BET ONE Draw Yes, definitely 31 - 40 Cannot say27 Occasionally Male 26 -35 United Kingdom Lucky, I will win Over 50 BET ONE Draw Yes, definitely Over 50 Cannot say28 Occasionally Male 26 -35 India Cannot say 21 - 30 BET ONE Win Yes, definitely 21 - 30 Yes, definitely29 Occasionally Male 36 -50 United States Cannot say 11 - 20 BET ONE Win Yes, definitely 11 - 20 Yes, definitely30 Occasionally Male 26 -35 United States Cannot say 11 - 20 BET ONE Win Yes, definitely 11 - 20 Yes, definitely31 Occasionally Male 36 -50 United Kingdom Cannot say 11 - 20 BET ONE Win Yes, definitely 11 - 20 Yes32 Occasionally Male Under 25 United Kingdom Cannot say 11 - 20 BET ONE Win Yes, definitely 11 - 20 Yes33 Occasionally Male 26 -35 United States Cannot say 11 - 20 BET ONE Win Yes, definitely 11 - 20 Yes34 Occasionally Male 26 -35 United States Cannot say 11 - 20 BET ONE Win Yes, definitely 11 - 20 Yes35 Occasionally Male 26 -35 India Cannot say 21 - 30 BET ONE Win Yes, definitely 21 - 30 Yes36 Occasionally Male 36 -50 United States Cannot say 21 - 30 BET ONE Win Yes, definitely 21 - 30 Yes
1

BLACKJACK: THE EXPERIMENTRESULTS
BET TWO Outcome Sec 3: Q1 Sec 3: Q2 Sec 3: Q3 BET THREE Outcome Sec 3: Q1 Sec 3: Q2 Sec 3: Q3BET TWO Win Yes, definitely 21 - 30 Yes, definitely BET THREE Win Yes, definitely 21 - 30 Yes, definitelyBET TWO Lose Yes, definitely 11 - 20 Yes BET THREE Win Yes, definitely 11 - 20 Yes, definitelyBET TWO Win Yes, definitely 11 - 20 Yes BET THREE Win Yes, definitely 11 - 20 Yes, definitelyBET TWO Lose Yes, definitely 21 - 30 Cannot say BET THREE Win Yes, definitely 21 - 30 Cannot sayBET TWO Lose Yes, definitely 21 - 30 Cannot say BET THREE Lose Yes, definitely 41 - 50 Cannot sayBET TWO Win Yes, definitely 21 - 30 Cannot say BET THREE Lose Yes, definitely 21 - 30 Cannot sayBET TWO Draw Yes, definitely 31 - 40 Yes BET THREE Draw Will give it a shot 31 - 40 YesBET TWO Draw Will give it a shot 11 - 20 Cannot say BET THREE Win Will give it a shot 11 - 20 Cannot sayBET TWO Lose Yes, definitely 11 - 20 Cannot say BET THREE Lose Yes, definitely 31 - 40 Cannot sayBET TWO Draw Yes, definitely 1 - 10 Yes BET THREE Lose Yes, definitely 21 - 30 Cannot sayBET TWO Lose Yes, definitely 21 - 30 Cannot say BET THREE Lose Yes, definitely 31 - 40 Cannot sayBET TWO Win Yes, definitely 11 - 20 Yes, definitely BET THREE Win Yes, definitely 1 - 10 Yes, definitelyBET TWO Lose Will give it a shot 11 - 20 Cannot say BET THREE Lose Yes, definitely 21 - 30 Cannot sayBET TWO Draw Will give it a shot 11 - 20 Cannot say BET THREE Win Will give it a shot 1 - 10 Cannot sayBET TWO Lose Yes, definitely 41 - 50 Cannot say BET THREE Lose Yes, definitely Over 50 Cannot sayBET TWO Lose Will give it a shot 21 - 30 Cannot say BET THREE Win Will give it a shot 21 - 30 Cannot sayBET TWO Win Yes, definitely 21 - 30 Yes, definitely BET THREE Win Yes, definitely 21 - 30 Yes, definitelyBET TWO Lose Yes, definitely 21 - 30 Yes BET THREE Win Yes, definitely 21 - 30 Yes, definitelyBET TWO Draw Yes, definitely 21 - 30 Yes BET THREE Lose Will give it a shot 21 - 30 Yes, definitelyBET TWO Win Yes, definitely 31 - 40 Yes, definitely BET THREE Win Yes, definitely 31 - 40 Yes, definitelyBET TWO Draw Will give it a shot 31 - 40 Cannot say BET THREE Lose Yes, definitely 31 - 40 Cannot sayBET TWO Win Will give it a shot 31 - 40 Cannot say BET THREE Win Yes, definitely 31 - 40 Cannot sayBET TWO Draw Yes, definitely 11 - 20 Yes BET THREE Win Yes, definitely 11 - 20 YesBET TWO Win Yes, definitely 31 - 40 Yes, definitely BET THREE Draw Yes, definitely 31 - 40 Yes, definitelyBET TWO Lose Yes, definitely 31 - 40 Yes BET THREE Lose Yes, definitely Over 50 Cannot sayBET TWO Lose Will give it a shot 31 - 40 Cannot say BET THREE Lose Yes, definitely Over 50 Cannot sayBET TWO Draw Will give it a shot Over 50 Yes BET THREE Win Will give it a shot Over 50 YesBET TWO Lose Yes, definitely 21 - 30 Yes, definitely BET THREE Lose Yes, definitely 41 - 50 Cannot sayBET TWO Lose Yes, definitely 11 - 20 Yes BET THREE Lose Yes, definitely 31 - 40 Cannot sayBET TWO Win Yes, definitely 11 - 20 Yes, definitely BET THREE Lose Yes, definitely 21 - 30 Cannot sayBET TWO Draw Yes, definitely 11 - 20 Yes BET THREE Lose Will give it a shot 11 - 20 Cannot sayBET TWO Lose Yes, definitely 21 - 30 Yes, definitely BET THREE Win Yes, definitely 21 - 30 Yes, definitelyBET TWO Lose Yes, definitely 21 - 30 Yes BET THREE Win Yes, definitely 21 - 30 YesBET TWO Lose Yes, definitely 11 - 20 Yes BET THREE Lose Yes, definitely 31 - 40 Cannot sayBET TWO Lose Yes, definitely 41 - 50 Yes BET THREE Lose Yes, definitely Over 50 Cannot sayBET TWO Win Yes, definitely 21 - 30 Yes BET THREE Win Yes, definitely 21 - 30 Yes
2

BLACKJACK: THE EXPERIMENTRESULTS
37 Occasionally Male 36 -50 United States Cannot say 21 - 30 BET ONE Win Yes, definitely 21 - 30 Yes38 Occasionally Male 36 -50 United States Cannot say 41 - 50 BET ONE Win Yes, definitely 41 - 50 Yes39 Occasionally Male Under 25 India Unlucky 21 - 30 BET ONE Win Yes, definitely 21 - 30 Cannot say40 Occasionally Male Under 25 United Kingdom Cannot say 21 - 30 BET ONE Win Yes, definitely 21 - 30 No, definitely41 Occasionally Male Under 25 India Cannot say 41 - 50 BET ONE Win Yes, definitely 41 - 50 Cannot say42 Occasionally Male Under 25 United States Cannot say 41 - 50 BET ONE Win Will give it a shot Over 50 Cannot say43 Occasionally Male 26 -35 India Unlucky Over 50 BET ONE Lose Will give it a shot 21 - 30 Yes, definitely44 Regularly Male 26 -35 United States Lucky, I will win Over 50 BET ONE Draw Yes, definitely 41 - 50 Yes, definitely45 Regularly Male 26 -35 United States Lucky, I will win 41 - 50 BET ONE Draw Yes, definitely 41 - 50 Yes, definitely46 Regularly Male Over 50 Sri Lanka Lucky, I will win Over 50 BET ONE Lose x x x47 Regularly Male Over 50 India Lucky, I will win Over 50 BET ONE Lose x x x48 Regularly Male 26 -35 United States Lucky, I will win Over 50 BET ONE Lose x x x49 Regularly Male Under 25 United States Lucky, I will win Over 50 BET ONE Lose x x x50 Regularly Male Under 25 United Kingdom Lucky, I will win Over 50 BET ONE Lose x x x51 Regularly Male 26 -35 United States Lucky, I will win Over 50 BET ONE Lose x x x52 Regularly Male 26 -35 United States Lucky, I will win Over 50 BET ONE Lose x x x53 Regularly Male 26 -35 United Kingdom Lucky, I will win Over 50 BET ONE Lose x x x54 Regularly Male 36 -50 United States Lucky, I will win 41 - 50 BET ONE Lose Will give it a shot 41 - 50 Cannot say55 Regularly Male 36 -50 United States Lucky, I will win 31 - 40 BET ONE Lose Yes, definitely 31 - 40 Cannot say56 Regularly Male 26 -35 United States Lucky, I will win 41 - 50 BET ONE Lose Yes, definitely 41 - 50 Yes, definitely57 Regularly Male 26 -35 India Lucky, I will win 41 - 50 BET ONE Lose Yes, definitely 31 - 40 Yes, definitely58 Regularly Male Under 25 United States Lucky, I will win 31 - 40 BET ONE Lose Yes, definitely 31 - 40 Yes, definitely59 Regularly Male 36 -50 United States Lucky, I will win 31 - 40 BET ONE Lose Yes, definitely 31 - 40 Yes, definitely60 Regularly Male 36 -50 India Lucky, I will win 31 - 40 BET ONE Lose Yes, definitely 31 - 40 Yes, definitely61 Regularly Male Over 50 Sri Lanka Lucky, I will win 21 - 30 BET ONE Lose Yes, definitely 21 - 30 Yes, definitely62 Regularly Male 26 -35 China Lucky, I will win 31 - 40 BET ONE Lose Yes, definitely 31 - 40 Yes, definitely63 Regularly Male 36 -50 United Kingdom Lucky, I will win 31 - 40 BET ONE Lose Yes, definitely 31 - 40 Yes, definitely64 Regularly Male 26 -35 United States Lucky, I will win 31 - 40 BET ONE Lose Yes, definitely 31 - 40 Yes, definitely65 Regularly Male 26 -35 United States Lucky, I will win 21 - 30 BET ONE Lose Yes, definitely 21 - 30 Yes, definitely66 Regularly Male 26 -35 United States Lucky, I will win 21 - 30 BET ONE Lose Yes, definitely 21 - 30 Yes, definitely67 Regularly Male 26 -35 China Lucky, I will win 21 - 30 BET ONE Lose Yes, definitely 21 - 30 Yes, definitely68 Regularly Male 26 -35 United States Lucky, I will win 21 - 30 BET ONE Lose Yes, definitely 21 - 30 Yes, definitely69 Regularly Male 36 -50 United States Lucky, I will win 21 - 30 BET ONE Lose Yes, definitely 21 - 30 Yes, definitely70 Regularly Male 36 -50 United States Lucky, I will win 31 - 40 BET ONE Lose Yes, definitely 11 - 20 Yes, definitely71 Regularly Male 36 -50 United States Lucky, I will win 31 - 40 BET ONE Lose Yes, definitely 31 - 40 Yes, definitely72 Regularly Male Under 25 United Kingdom Lucky, I will win 21 - 30 BET ONE Lose Yes, definitely 21 - 30 Yes, definitely73 Regularly Male 26 -35 United States Lucky, I will win 31 - 40 BET ONE Lose Yes, definitely 21 - 30 Yes, definitely
3

BLACKJACK: THE EXPERIMENTRESULTS
BET TWO Win Yes, definitely 21 - 30 Yes BET THREE Win Yes, definitely 21 - 30 YesBET TWO Win Yes, definitely 41 - 50 Yes BET THREE Lose Will give it a shot 41 - 50 Cannot sayBET TWO Lose Yes, definitely 21 - 30 Yes BET THREE Lose Yes, definitely 31 - 40 Cannot sayBET TWO Lose Will give it a shot 21 - 30 Cannot say BET THREE Lose Yes, definitely 31 - 40 Cannot sayBET TWO Draw Will give it a shot 41 - 50 Cannot say BET THREE Win Will give it a shot 41 - 50 Cannot sayBET TWO Draw Will give it a shot Over 50 Cannot say BET THREE Lose Will give it a shot Over 50 Cannot sayBET TWO Lose Yes, definitely 41 - 50 Cannot say BET THREE Lose Yes, definitely Over 50 Cannot sayBET TWO Lose Yes, definitely 41 - 50 Cannot say BET THREE Win Yes, definitely 41 - 50 YesBET TWO Win Yes, definitely 41 - 50 Yes, definitely BET THREE Win Yes, definitely 41 - 50 Yes, definitely
x x x x x x x x x xx x x x x x x x x xx x x x x x x x x xx x x x x x x x x xx x x x x x x x x xx x x x x x x x x xx x x x x x x x x xx x x x x x x x x x
BET TWO Draw Will give it a shot 41 - 50 Cannot say BET THREE Lose Yes, definitely 41 - 50 Cannot sayBET TWO Lose Yes, definitely Over 50 Cannot say BET THREE Lose Yes, definitely over 50 Cannot sayBET TWO Draw Will give it a shot 41 - 50 Yes BET THREE Win Will give it a shot 41 - 50 YesBET TWO Lose Yes, definitely 41 - 50 Cannot say BET THREE Lose Yes, definitely Over 50 Cannot sayBET TWO Lose Yes, definitely 41 - 50 Cannot say BET THREE Lose Yes, definitely Over 50 Cannot sayBET TWO Lose Yes, definitely 41 - 50 Cannot say BET THREE Lose Yes, definitely Over 50 Cannot sayBET TWO Lose Yes, definitely Over 50 Cannot say BET THREE Win Yes, definitely Over 50 Cannot sayBET TWO Lose Yes, definitely 41 - 50 Cannot say BET THREE Win Yes, definitely 41 - 50 Cannot sayBET TWO Lose Yes, definitely 41 - 50 Cannot say BET THREE Win Yes, definitely 41 - 50 YesBET TWO Lose Yes, definitely 41 - 50 Cannot say BET THREE Win Yes, definitely 41 - 50 Cannot sayBET TWO Lose Yes, definitely 31 - 40 Cannot say BET THREE Win Yes, definitely 31 - 40 YesBET TWO Lose Will give it a shot 31 - 40 Cannot say BET THREE Lose Yes, definitely 41 - 50 Cannot sayBET TWO Lose Will give it a shot 21 - 30 Cannot say BET THREE Lose Yes, definitely 31 - 40 Cannot sayBET TWO Lose Will give it a shot 21 - 30 Cannot say BET THREE Win Yes, definitely 21 - 30 YesBET TWO Win Yes, definitely 21 - 30 Yes, definitely BET THREE Lose Yes, definitely 21 - 30 YesBET TWO Win Yes, definitely 21 - 30 Yes, definitely BET THREE Lose Yes, definitely 31 - 40 Yes, definitelyBET TWO Win Yes, definitely 11 - 20 Yes, definitely BET THREE Win Yes, definitely 11 - 20 Yes, definitelyBET TWO Win Yes, definitely 31 - 40 Yes BET THREE Win Yes, definitely 31 - 40 YesBET TWO Win Yes, definitely 21 - 30 Yes BET THREE Draw Will give it a shot 21 - 30 Cannot sayBET TWO Win Will give it a shot 21 - 30 Yes BET THREE Lose Will give it a shot 21 - 30 Cannot say
4

BLACKJACK: THE EXPERIMENTRESULTS
74 Regularly Male Under 25 United Kingdom Lucky, I will win 21 - 30 BET ONE Lose Yes, definitely 21 - 30 Yes, definitely75 Regularly Male 36 -50 United States Lucky, I will win 21 - 30 BET ONE Lose Yes, definitely 21 - 30 Yes, definitely76 Regularly Male 36 -50 United States Lucky, I will win 21 - 30 BET ONE Win Will give it a shot 21 - 30 Yes, definitely77 Regularly Male 36 -50 United States Lucky, I will win 41 - 50 BET ONE Win Yes, definitely 41 - 50 Yes, definitely78 Regularly Male 36 -50 United States Lucky, I will win 41 - 50 BET ONE Win Yes, definitely 41 - 50 Yes, definitely79 Regularly Male 26 -35 United States Lucky, I will win Over 50 BET ONE Win Yes, definitely Over 50 Yes, definitely80 Regularly Male 26 -35 United States Lucky, I will win 31 - 40 BET ONE Win Yes, definitely 31 - 40 Yes, definitely81 Regularly Male 26 -35 United States Lucky, I will win 21 - 30 BET ONE Win Yes, definitely 21 - 30 Yes, definitely82 Regularly Male 36 -50 United States Lucky, I will win 21 - 30 BET ONE Win Yes, definitely 21 - 30 Yes, definitely83 Regularly Male 26 -35 China Lucky, I will win 21 - 30 BET ONE Win Yes, definitely 21 - 30 Yes, definitely84 Regularly Male 36 -50 United Kingdom Lucky, I will win 31 - 40 BET ONE Win Yes, definitely 31 - 40 Yes, definitely85 Regularly Male Over 50 United States Lucky, I will win 21 - 30 BET ONE Win Yes, definitely 21 - 30 Yes, definitely86 Regularly Male 36 -50 United States Lucky, I will win 11 - 20 BET ONE Win Yes, definitely 11 - 20 Yes, definitely87 Regularly Male 36 -50 China Lucky, I will win 21 - 30 BET ONE Win Yes, definitely 21 - 30 Yes, definitely88 Regularly Male 26 -35 United States Lucky, I will win 11 - 20 BET ONE Win Yes, definitely 11 - 20 Yes, definitely89 Regularly Male 36 -50 United Kingdom Lucky, I will win 11 - 20 BET ONE Win Yes, definitely 11 - 20 Yes, definitely90 Regularly Male 36 -50 United States Lucky, I will win 21 - 30 BET ONE Win Yes, definitely 21 - 30 Yes, definitely91 Regularly Male 36 -50 United Kingdom Lucky, I will win 21 - 30 BET ONE Win Yes, definitely 21 - 30 Yes, definitely92 Regularly Male 36 -50 United States Lucky, I will win 21 - 30 BET ONE Win Yes, definitely 21 - 30 Yes, definitely93 Regularly Male 26 -35 China Lucky, I will win 21 - 30 BET ONE Win Yes, definitely 21 - 30 Yes, definitely94 Regularly Male Over 50 United States Lucky, I will win 21 - 30 BET ONE Win Yes, definitely 21 - 30 Yes, definitely95 Regularly Male 26 -35 United Kingdom Lucky, I will win 21 - 30 BET ONE Win Yes, definitely 21 - 30 Yes, definitely96 Regularly Male Over 50 United Kingdom Lucky, I will win 21 - 30 BET ONE Win Yes, definitely 21 - 30 Yes, definitely97 Regularly Male Over 50 United States Lucky, I will win 31 - 40 BET ONE Win Yes, definitely 31 - 40 Yes, definitely98 Regularly Male Over 50 United States Lucky, I will win 31 - 40 BET ONE Win Yes, definitely 31 - 40 Yes, definitely99 Regularly Male 26 -35 China Lucky, I will win 41 - 50 BET ONE Win Yes, definitely 41 - 50 Yes, definitely
100 Regularly Male Under 25 United Kingdom Lucky, I will win 21 - 30 BET ONE Win Yes, definitely 21 - 30 Yes, definitely
5

BLACKJACK: THE EXPERIMENTRESULTS
BET TWO Win Will give it a shot 21 - 30 Yes BET THREE Draw Will give it a shot 21 - 30 YesBET TWO Win Will give it a shot 21 - 30 Yes BET THREE Draw Will give it a shot 21 - 30 Cannot sayBET TWO Win Yes, definitely 21 - 30 Yes, definitely BET THREE Draw Yes, definitely 21 - 30 Yes, definitelyBET TWO Draw Yes, definitely 41 - 50 Yes, definitely BET THREE Win Yes, definitely 41 - 50 Yes, definitelyBET TWO Draw Will give it a shot 41 - 50 Cannot say BET THREE Lose Will give it a shot 41 - 50 Cannot sayBET TWO Lose Yes, definitely Over 50 Yes, definitely BET THREE Win Yes, definitely Over 50 Yes, definitelyBET TWO Lose Yes, definitely 31 - 40 Yes, definitely BET THREE Win Yes, definitely 31 - 40 Yes, definitelyBET TWO Lose Yes, definitely 31 - 40 Yes, definitely BET THREE Win Yes, definitely 31 - 40 Yes, definitelyBET TWO Lose Yes, definitely 21 - 30 Yes, definitely BET THREE Win Yes, definitely 21 - 30 Cannot sayBET TWO Lose Yes, definitely 31 - 40 Yes, definitely BET THREE Lose Will give it a shot 31 - 40 Cannot sayBET TWO Lose Yes, definitely 31 - 40 Yes, definitely BET THREE Lose Will give it a shot 31 - 40 Cannot sayBET TWO Lose Yes, definitely 21 - 30 Yes, definitely BET THREE Lose Yes, definitely 31 - 40 Cannot sayBET TWO Lose Will give it a shot 11 - 20 Yes BET THREE Win Yes, definitely 11 - 20 YesBET TWO Lose Will give it a shot 21 - 30 Yes BET THREE Lose Yes, definitely 41 - 50 Cannot sayBET TWO Win Yes, definitely 11 - 20 Yes, definitely BET THREE Win Yes, definitely 11 - 20 Yes, definitelyBET TWO Win Yes, definitely 11 - 20 Yes, definitely BET THREE Win Yes, definitely 11 - 20 Yes, definitelyBET TWO Win Yes, definitely 21 - 30 Yes, definitely BET THREE Win Yes, definitely 21 - 30 Yes, definitelyBET TWO Win Yes, definitely 21 - 30 Yes, definitely BET THREE Win Yes, definitely 21 - 30 Yes, definitelyBET TWO Win Yes, definitely 21 - 30 Yes, definitely BET THREE Win Yes, definitely 21 - 30 Yes, definitelyBET TWO Win Yes, definitely 21 - 30 Yes, definitely BET THREE Win Yes, definitely 21 - 30 Yes, definitelyBET TWO Win Yes, definitely 21 - 30 Yes, definitely BET THREE Win Yes, definitely 21 - 30 Yes, definitelyBET TWO Win Yes, definitely 21 - 30 Yes, definitely BET THREE Win Yes, definitely 21 - 30 Yes, definitelyBET TWO Win Yes, definitely 21 - 30 Yes, definitely BET THREE Lose Yes, definitely 21 - 30 Yes, definitelyBET TWO Win Yes, definitely 31 - 40 Yes, definitely BET THREE Lose Yes, definitely 31 - 40 Yes, definitelyBET TWO Win Yes, definitely 31 - 40 Yes, definitely BET THREE Lose Yes, definitely 31 - 40 Yes, definitelyBET TWO Win Yes, definitely 41 - 50 Yes, definitely BET THREE Lose Yes, definitely 41 - 50 Yes, definitelyBET TWO Win Yes, definitely 21 - 30 Yes, definitely BET THREE Draw Yes, definitely 21 - 30 Yes, definitely
6

Appendix THREE
EMPIRICAL INVESTIGATION QUESTIONNAIRE

Dear Sir/Mam, I am a student Economics from the University of Birmingham, United Kingdom and am writing my Master’s Thesis on one aspect of Behavioural Finance. My research deals with the issue concerning how the choice of decision is affected while investing in the stock market. For unbiased research purposes, it would not be possible to provide full details of the research before filling the questionnaire. However, once the questionnaires have been submitted, the purpose of this research will be communicated to all participants. This questionnaire consists of 11 Questions and should take approximately 10-15 minutes to complete. For each question, please choose the best option that reflects your opinion or experience. The form can then be emailed to me at the address given at the bottom of the questionnaire. Your kind response would greatly contribute to the research. It can be assured that all questionnaires will be kept anonymous and confidential.
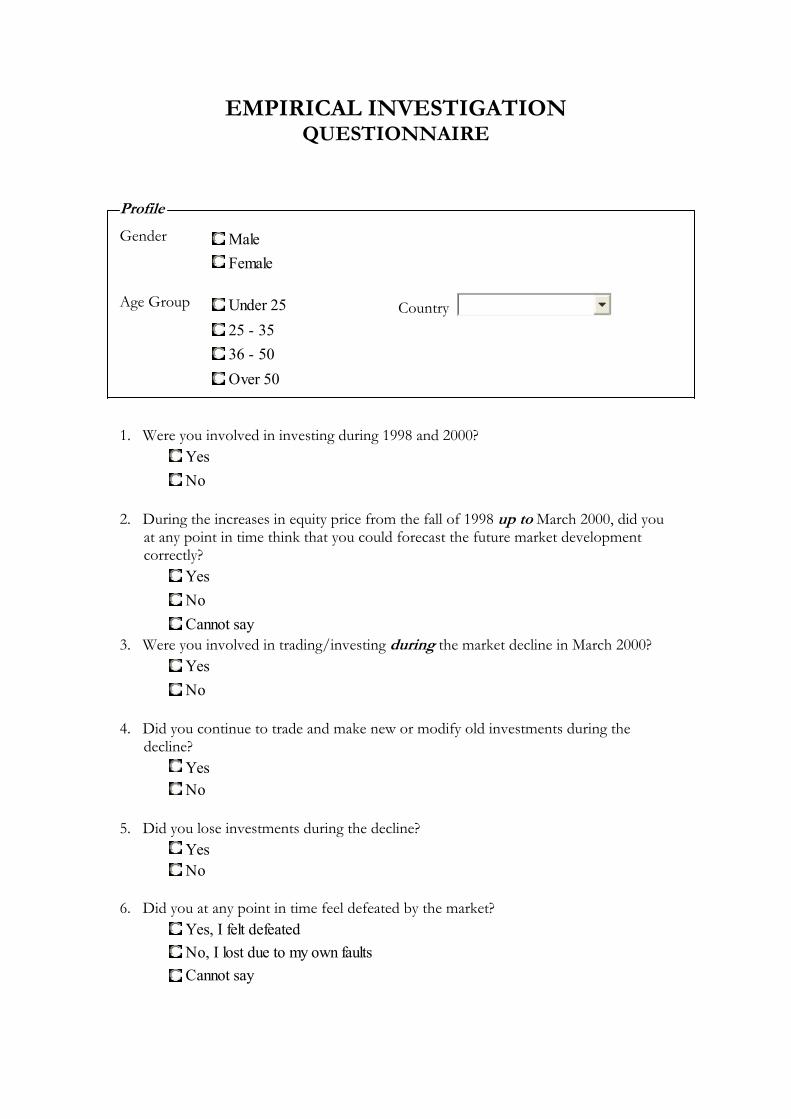
EMPIRICAL INVESTIGATION QUESTIONNAIRE
Profile
Male Female
Gender
Under 25 Country 25 - 35 36 - 50
Age Group
Over 50 1. Were you involved in investing during 1998 and 2000?
Yes No
2. During the increases in equity price from the fall of 1998 up to March 2000, did you
at any point in time think that you could forecast the future market development correctly?
Yes No Cannot say
3. Were you involved in trading/investing during the market decline in March 2000? Yes No
4. Did you continue to trade and make new or modify old investments during the
decline? Yes No
5. Did you lose investments during the decline?
Yes No
6. Did you at any point in time feel defeated by the market?
Yes, I felt defeated No, I lost due to my own faults Cannot say
7. If Yes, was it hard to accept defeat? Yes No Cannot say
8. After March 2000, was there a time when you stopped investing any further?
Yes, I stopped investing No, I still invested
8a. If Yes, did you still wish you were able to beat the market by investing in new
opportunities? Yes No
8b. If No, why did you still keep investing? I wanted to beat the market I was sure of my strategies I could not accept losing
Cannot say 9. Do you think you are a good investor?
Yes, I am a very good investor No, I am an average or bad investor Cannot say
10. Only the following information exists for a stock investment: Suppose a stock has 50-
50 chance to either increase or decrease by 25% each week. The first 3 weeks since you bought the stock, it falls by 25% each week. What would you do for the 4th week?
Invest more in stock to cover up losses when price rises as it has a 50-50 chanceHold the stock for 1 more week to check price movementSell the stock Cannot say
11. Finally, do you think the set of questions posed in this questionnaire helped you
recollect events from the past? Yes, it was very helpful No, I had to stress to remember Cannot say
Thank you kindly.
e-mail to: [email protected]

Appendix FOUR EMPIRICAL INVESTIGATION
RESULTS
Empirical Investigation Results
ID Gender Age Group Country Q1 Q2 Q3 Q4 Q5 Q6 Q71 Male 25 - 35 United States Yes Yes Yes Yes Yes Yes, I felt defeated Yes2 Male 25 - 35 United States Yes Yes Yes Yes Yes Yes, I felt defeated Yes3 Male 35 - 50 United States Yes Yes Yes Yes Yes Yes, I felt defeated Yes4 Male 25 - 35 United States Yes Yes Yes Yes Yes Yes, I felt defeated Yes5 Male 25 - 35 United States Yes Yes Yes Yes Yes Yes, I felt defeated Yes6 Male Over 50 United States Yes Yes Yes Yes Yes Yes, I felt defeated Yes7 Male 25 - 35 United States Yes Yes Yes Yes Yes Yes, I felt defeated Yes8 Male Over 50 United States Yes Yes Yes Yes Yes Yes, I felt defeated Yes9 Male 25 - 35 United States Yes Yes Yes Yes Yes Yes, I felt defeated Yes
10 Male 25 - 35 United States Yes Yes Yes Yes Yes Yes, I felt defeated Yes11 Male 25 - 35 United States Yes Yes Yes Yes Yes Yes, I felt defeated Yes12 Male 25 - 35 United Kingdom Yes Yes Yes Yes Yes Yes, I felt defeated Yes13 Male 35 - 50 United Kingdom Yes Yes Yes Yes Yes Yes, I felt defeated Yes14 Male 25 - 35 United Kingdom Yes Yes Yes Yes Yes Yes, I felt defeated Yes15 Male 35 - 50 United States Yes Yes Yes Yes Yes No, I lost due to my own faults No16 Male 25 - 35 United Kingdom Yes No Yes Yes Yes Yes, I felt defeated Yes17 Male 25 - 35 United Kingdom Yes No Yes Yes Yes Yes, I felt defeated Yes18 Male 25 - 35 United States Yes No Yes Yes Yes Yes, I felt defeated Yes19 Male 25 - 35 United States Yes No Yes Yes Yes Yes, I felt defeated Yes20 Male 25 - 35 United States Yes No Yes Yes Yes Yes, I felt defeated Yes21 Male 25 - 35 United Kingdom Yes No Yes Yes Yes Yes, I felt defeated Yes22 Male 25 - 35 United Kingdom Yes No Yes Yes Yes Yes, I felt defeated Yes23 Male 25 - 35 United Kingdom Yes No Yes Yes Yes No, I lost due to my own faults Yes24 Male 25 - 35 United Kingdom Yes No Yes Yes Yes No, I lost due to my own faults Yes25 Male 25 - 35 United Kingdom Yes No Yes Yes Yes No, I lost due to my own faults Yes26 Male 25 - 35 France Yes No Yes Yes Yes Cannot say Yes27 Male 25 - 35 France Yes No Yes Yes Yes Cannot say Yes28 Male 35 - 50 United Kingdom Yes No Yes No x x x29 Male 35 - 50 United States Yes No Yes No x x x30 Male 25 - 35 United States Yes Cannot say Yes Yes Yes Yes, I felt defeated Yes31 Male 25 - 35 United States Yes Cannot say Yes Yes Yes Yes, I felt defeated Yes32 Male 25 - 35 Germany Yes Cannot say Yes Yes Yes Yes, I felt defeated Yes33 Male 35 - 50 Germany Yes Cannot say Yes Yes Yes Yes, I felt defeated Yes34 Male 25 - 35 United Kingdom Yes Cannot say Yes Yes Yes Cannot say Yes35 Female 25 - 35 United Kingdom Yes Yes Yes Yes Yes Yes, I felt defeated Yes36 Female 35 - 50 United Kingdom Yes Yes Yes Yes Yes Yes, I felt defeated Yes37 Female Over 50 United States Yes Yes Yes Yes Yes Yes, I felt defeated Yes38 Female 25 - 35 United States Yes Yes Yes Yes Yes No, I lost due to my own faults Yes39 Female 25 - 35 United States Yes No Yes Yes Yes No, I lost due to my own faults Yes40 Female 35 - 50 France Yes No Yes No x x x41 Female 35 - 50 France Yes No Yes No x x x42 Female 25 - 35 France Yes No Yes No x x x43 Female 25 - 35 United States Yes Cannot say Yes Yes Yes Yes, I felt defeated Yes
1
Empirical Investigation Results
ID Question 8 Question 8a Question 8b1 No, I still invested x I wanted to beat the market2 No, I still invested x I wanted to beat the market3 No, I still invested x I wanted to beat the market4 No, I still invested x I wanted to beat the market5 No, I still invested x I wanted to beat the market6 No, I still invested x I was sure of my strategies7 No, I still invested x I was sure of my strategies8 No, I still invested x I was sure of my strategies9 No, I still invested x I was sure of my strategies
10 No, I still invested x I could not accept losing11 No, I still invested x I could not accept losing12 No, I still invested x I could not accept losing13 No, I still invested x I could not accept losing14 No, I still invested x I could not accept losing15 Yes, I stopped investing. Yes x16 No, I still invested x I wanted to beat the market17 No, I still invested x I wanted to beat the market18 No, I still invested x I could not accept losing19 No, I still invested x I could not accept losing20 No, I still invested x I could not accept losing21 No, I still invested x I could not accept losing22 No, I still invested x I could not accept losing23 No, I still invested x I could not accept losing24 No, I still invested x I could not accept losing25 Yes, I stopped investing. Yes x26 No, I still invested x I could not accept losing27 No, I still invested x I could not accept losing28 x x x29 x x x30 No, I still invested x I could not accept losing31 No, I still invested x I could not accept losing32 Yes, I stopped investing. Yes x33 Yes, I stopped investing. Yes x34 No, I still invested x I could not accept losing35 Yes, I stopped investing. Yes x36 No, I still invested x I wanted to beat the market37 No, I still invested x I was sure of my strategies38 No, I still invested x I was sure of my strategies39 No, I still invested x I wanted to beat the market40 x x x41 x x x42 x x x43 Yes, I stopped investing. Yes x
2
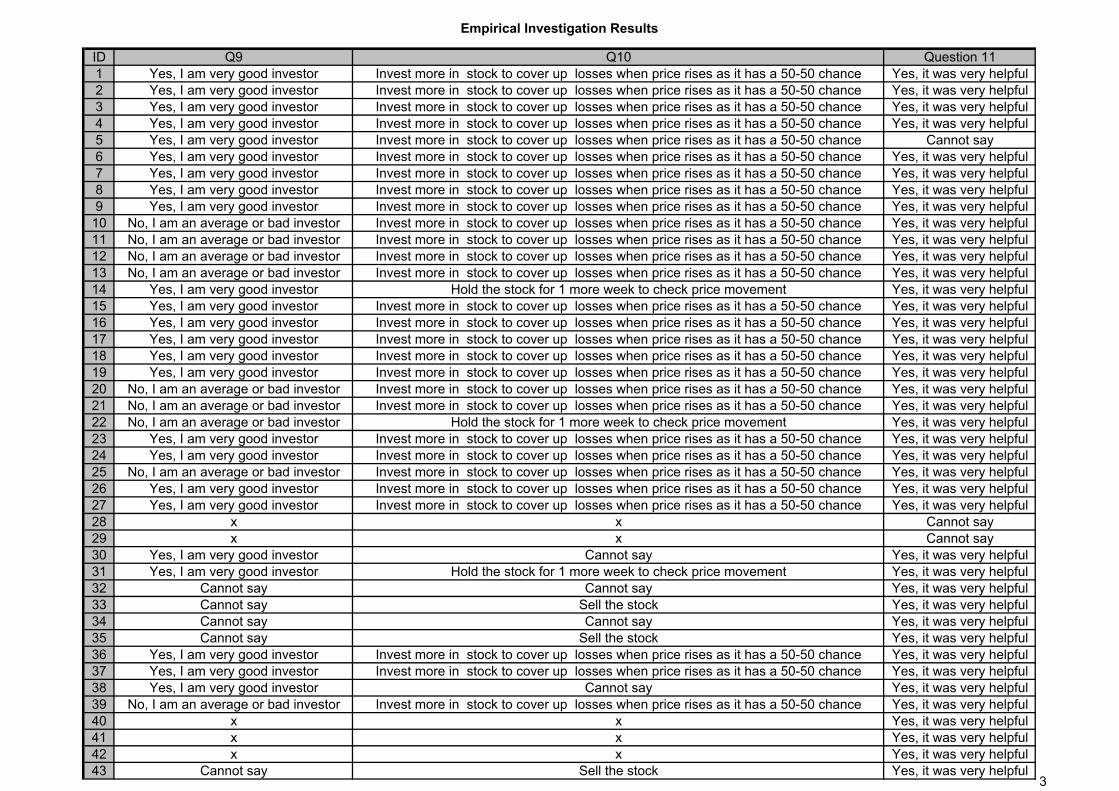
Empirical Investigation Results
ID Q9 Q10 Question 111 Yes, I am very good investor Invest more in stock to cover up losses when price rises as it has a 50-50 chance Yes, it was very helpful2 Yes, I am very good investor Invest more in stock to cover up losses when price rises as it has a 50-50 chance Yes, it was very helpful3 Yes, I am very good investor Invest more in stock to cover up losses when price rises as it has a 50-50 chance Yes, it was very helpful4 Yes, I am very good investor Invest more in stock to cover up losses when price rises as it has a 50-50 chance Yes, it was very helpful5 Yes, I am very good investor Invest more in stock to cover up losses when price rises as it has a 50-50 chance Cannot say6 Yes, I am very good investor Invest more in stock to cover up losses when price rises as it has a 50-50 chance Yes, it was very helpful7 Yes, I am very good investor Invest more in stock to cover up losses when price rises as it has a 50-50 chance Yes, it was very helpful8 Yes, I am very good investor Invest more in stock to cover up losses when price rises as it has a 50-50 chance Yes, it was very helpful9 Yes, I am very good investor Invest more in stock to cover up losses when price rises as it has a 50-50 chance Yes, it was very helpful
10 No, I am an average or bad investor Invest more in stock to cover up losses when price rises as it has a 50-50 chance Yes, it was very helpful11 No, I am an average or bad investor Invest more in stock to cover up losses when price rises as it has a 50-50 chance Yes, it was very helpful12 No, I am an average or bad investor Invest more in stock to cover up losses when price rises as it has a 50-50 chance Yes, it was very helpful13 No, I am an average or bad investor Invest more in stock to cover up losses when price rises as it has a 50-50 chance Yes, it was very helpful14 Yes, I am very good investor Hold the stock for 1 more week to check price movement Yes, it was very helpful15 Yes, I am very good investor Invest more in stock to cover up losses when price rises as it has a 50-50 chance Yes, it was very helpful16 Yes, I am very good investor Invest more in stock to cover up losses when price rises as it has a 50-50 chance Yes, it was very helpful17 Yes, I am very good investor Invest more in stock to cover up losses when price rises as it has a 50-50 chance Yes, it was very helpful18 Yes, I am very good investor Invest more in stock to cover up losses when price rises as it has a 50-50 chance Yes, it was very helpful19 Yes, I am very good investor Invest more in stock to cover up losses when price rises as it has a 50-50 chance Yes, it was very helpful20 No, I am an average or bad investor Invest more in stock to cover up losses when price rises as it has a 50-50 chance Yes, it was very helpful21 No, I am an average or bad investor Invest more in stock to cover up losses when price rises as it has a 50-50 chance Yes, it was very helpful22 No, I am an average or bad investor Hold the stock for 1 more week to check price movement Yes, it was very helpful23 Yes, I am very good investor Invest more in stock to cover up losses when price rises as it has a 50-50 chance Yes, it was very helpful24 Yes, I am very good investor Invest more in stock to cover up losses when price rises as it has a 50-50 chance Yes, it was very helpful25 No, I am an average or bad investor Invest more in stock to cover up losses when price rises as it has a 50-50 chance Yes, it was very helpful26 Yes, I am very good investor Invest more in stock to cover up losses when price rises as it has a 50-50 chance Yes, it was very helpful27 Yes, I am very good investor Invest more in stock to cover up losses when price rises as it has a 50-50 chance Yes, it was very helpful28 x x Cannot say29 x x Cannot say30 Yes, I am very good investor Cannot say Yes, it was very helpful31 Yes, I am very good investor Hold the stock for 1 more week to check price movement Yes, it was very helpful32 Cannot say Cannot say Yes, it was very helpful33 Cannot say Sell the stock Yes, it was very helpful34 Cannot say Cannot say Yes, it was very helpful35 Cannot say Sell the stock Yes, it was very helpful36 Yes, I am very good investor Invest more in stock to cover up losses when price rises as it has a 50-50 chance Yes, it was very helpful37 Yes, I am very good investor Invest more in stock to cover up losses when price rises as it has a 50-50 chance Yes, it was very helpful38 Yes, I am very good investor Cannot say Yes, it was very helpful39 No, I am an average or bad investor Invest more in stock to cover up losses when price rises as it has a 50-50 chance Yes, it was very helpful40 x x Yes, it was very helpful41 x x Yes, it was very helpful42 x x Yes, it was very helpful43 Cannot say Sell the stock Yes, it was very helpful
3