Embed Size (px)
Citation preview

June 23, 2015 www.camsys.com
Memphis MPO Model Update
Model User Guide
prepared for
Memphis MPO
prepared by
Cambridge Systematics, Inc.
Final
Report


report
Memphis MPO Model Update
Model User Guide
prepared for
Memphis MPO
prepared by
Cambridge Systematics, Inc. 115 South LaSalle Street, Suite 2200 Chicago, IL 60603
date
June 23, 2015


Memphis MPO Model Update
Cambridge Systematics, Inc. i
Table of Contents
1.0 Introduction ......................................................................................................... 1-1
2.0 Model Extent ........................................................................................................ 2-1
2.1 3-Bridge Model ............................................................................................ 2-1
2.2 Key Features of Model Network .............................................................. 2-2
3.0 Model Overview ................................................................................................. 3-1
3.1 Initialization ................................................................................................. 3-2
Set Demographic and Employment Data for Correct Analysis Year ............................................................................................................... 3-3
Set TAZ Area Types ................................................................................... 3-3
Set Network Scenario for Correct Analysis Year ................................... 3-4
Set Network Speeds and Capacities ......................................................... 3-5
3.2 Network Skimming .................................................................................... 3-6
Build 4 Timeperiod Highway and Transit Network ............................. 3-6
Highway and Transit Skims (4 periods) .................................................. 3-7
3.3 Trip Generation ........................................................................................... 3-7
Calculate Employment Accessibility (within 15 min travel) ................ 3-8
Trip Generation (All purposes)................................................................. 3-8
Freight Model Trip Generation and Distribution .................................. 3-9
External Observed Trip Generation ......................................................... 3-9
External-Internal Trip Generation ............................................................ 3-9
3.4 Compute Log Sums .................................................................................... 3-9
3.5 Destination Choice Model ....................................................................... 3-10
Destination Choice Model for All Purposes ......................................... 3-11
External-External Trip Distribution ....................................................... 3-11
External-Internal Auto Trip Distribution .............................................. 3-11
Frataring EI Trips to Match AADT ........................................................ 3-11
3.6 Mode Choice Model ................................................................................. 3-12
3.7 PA to OD .................................................................................................... 3-13
Create Final Truck Trips and Auto Trips .............................................. 3-13
Apply TOD and Directional Factors ...................................................... 3-14
Create OP Matrix for Park-N-Ride Vehicle Trips ................................ 3-14
3.8 Trip Assignment ....................................................................................... 3-15
Transit Assignment .................................................................................. 3-15

Table of Contents, continued
ii Cambridge Systematics, Inc.
Highway Assignment .............................................................................. 3-15
3.9 Feedback .................................................................................................... 3-16
4.0 Installation and Implementation Overview .................................................. 4-1
4.1 Hardware Requirements ........................................................................... 4-1
4.2 Software Requirements .............................................................................. 4-1
4.3 Installation Process ..................................................................................... 4-1
4.4 Folder Structure .......................................................................................... 4-3
5.0 Preparing a Model Run ...................................................................................... 5-1
5.1 Input Data and Parameter files ................................................................. 5-1
5.2 Scenario Setup ............................................................................................. 5-4
6.0 Running the Model ............................................................................................ 6-1
6.1 Running Single Stage ................................................................................. 6-1
6.2 Running Single Loop .................................................................................. 6-2
6.3 Running Multi Loop ................................................................................... 6-2
6.4 Model Outputs ............................................................................................ 6-2
7.0 Network and TAZ Attributes ........................................................................... 7-1
7.1 Highway Network Attributes ................................................................... 7-1
7.2 Transit Network Attributes ..................................................................... 7-10
7.3 TAZ Boundary Attributes ....................................................................... 7-11

Memphis MPO Model Update
Cambridge Systematics, Inc. iii
List of Tables
Table 3-1 Area Type Coding .................................................................................... 3-3
Table 3-2 Year Specific Network Attributes .......................................................... 3-4
Table 3-3 Definition of Income Levels .................................................................... 3-9
Table 3-4 Time of Day Factors by Trip Purpose ................................................. 3-11
Table 3-5 Modal Availability by Purpose ............................................................ 3-12
Table 3-6 Time of Day Factors for Trucks ............................................................ 3-14
Table 3-7 Time-of-Day Directional Trip Factors (Origin = Production) .......... 3-14
Table 5-1 Model Input Files and Parameter Files ................................................. 5-1
Table 6.1 Model Outputs ......................................................................................... 6-2
Table 7-1 Network Link Attributes ......................................................................... 7-1
Table 7-2 Transit Route Attributes ........................................................................ 7-10
Table 7-3 Transit Stop Attributes .......................................................................... 7-10
Table 7-4 TAZ Attributes ....................................................................................... 7-11


Memphis MPO Model Update
Cambridge Systematics, Inc. v
List of Figures
Figure 2.1 Study Region ............................................................................................. 2-3
Figure 3.1 Model Steps ............................................................................................... 3-2
Figure 3.2 Steps in Initialization Stage ..................................................................... 3-3
Figure 3.3 Steps in the Network Skimming Stage .................................................. 3-6
Figure 3.4 Steps in the Trip Generation Stage ........................................................ 3-8
Figure 3.5 Steps in Compute Logsum Stage ........................................................... 3-9
Figure 3.6 Mode Choice Nesting Levels ................................................................ 3-10
Figure 3.7 Steps in the Destination Choice Model Stage ..................................... 3-10
Figure 3.8 Mode Choice Model Stage .................................................................... 3-12
Figure 3.9 Stages in the PA to OD Step ................................................................. 3-13
Figure 3.10 Stages in the Trip Assignment Step ..................................................... 3-15
Figure 3.11 Feedback Loop Step ............................................................................... 3-16
Figure 4.1 Contents of Model Initialization File ..................................................... 4-2
Figure 4.2 Adding Memphis MPO Model to TransCAD menu ........................... 4-3
Figure 5.1 Memphis Model Interface ....................................................................... 5-5
Figure 5.2 Scenario Set-up Window ......................................................................... 5-6
Figure 5.3 Model Step Content Window ................................................................. 5-7
Figure 6.1 Sub-Stage Setting Window for Initialization Stage ............................. 6-1


Memphis MPO Model Update
Cambridge Systematics, Inc. 1-1
1.0 Introduction
This report provides a user guide for the updated Memphis MPO model which will serve as the primary forecasting model for the Memphis Urban Area Metropolitan Planning Organization (Memphis MPO). This model was updated as part of the 2014 Memphis Urban Area MPO Mid-South Regional Household Travel Survey, Freight Survey, Transit On-Board Survey, and Travel Demand Model Update. The data used in the model update included a household travel survey, a transit on-board survey, and GPS-based truck data. The modeling effort was supported by the Memphis MPO, the Tennessee Department of Transportation (TDOT) and the Mississippi Department of Transportation (MDOT).
The updated model developed as part of this project builds on the existing framework of the Memphis MPO travel demand model with a few key changes:
The model uses household income as a key segmentation variable to support environmental justice analyses;
The model incorporates bike and walk modes within the model framework;
The model includes a brand new freight model developed using regional freight GPS and commodity flow data;
The model boundary is extended to include a 8-county region (in its entirety). It also extends into Arkansas for the first time; and
The model includes several new forecast years that are relevant from a policy standpoint.
This report outlines all the key steps in the regional travel demand model and describes how each of the key modeling routines are integrated within the model user interface. The rest of the report is organized as follows:
Section 2 outlines the geographic extent of the regional travel demand model;
Section 3 discusses each of the steps in the model user interface and describes what each of the steps does;
Section 4 provides a brief discussion about installation and hardware requirements;
Section 5 and Section 6 describe the key steps that must be undertaken prior to setting up a model run; and
Section 7 discusses the key attributes in the model files.


Memphis MPO Model Update
Cambridge Systematics, Inc. 2-1
2.0 Model Extent
The region covered by the Memphis MPO model is a part of several different models including:
Tennessee, Mississippi, and Arkansas (under development) statewide models;
Northwest Mississippi Regional Model;
West Memphis MPO; and
Variations of the previous MPO model including the 3-bridge model that was used to study bridge alternatives over the Mississippi River.
2.1 3-BRIDGE MODEL The updated travel demand model was developed using the 3-bridge model as the basis for developing a detailed transportation network for the following reasons:
It incorporates the entire region that was included as part of the previous Memphis MPO model.
– This model includes Crittenden County TAZs and, is an excellent resource for data related to Arkansas.
– Using this model obviates the need to use the West Memphis MPO model thereby limiting the number of models that must be stitched together for the Memphis MPO model update.
The TAZ structure in the urban region is granular enough to support model development and enhancements.
– The statewide models, while having a lot of detail, are pretty large sized even in urban areas. Having such large TAZs in the urban areas reduces the effectiveness of the model to capture key elements such as transit accessibility.
– Further, both the Mississippi and Arkansas statewide models were under development and therefore, not ready for use in the Memphis MPO model update.
Rural TAZs are sized uniformly throughout the region and therefore, provide an excellent starting point for model development.
– As a contrast, the Northwest Mississippi TAZs were much smaller than TAZs in the rural parts of Tennessee. Having different sized TAZs may

Memphis MPO Model Update
2-2 Cambridge Systematics, Inc.
lead to inconsistencies in traffic assignment procedures in different parts of the region which is not desirable.
Further, the 3-bridge model provides a consistent list of attributes in the model network which is crucial for the development of a functional network structure.
2.2 KEY FEATURES OF MODEL NETWORK Some key features in the Memphis model network are listed below:
The model boundary includes the following counties in its entirety (Figure 2.1):
– Shelby County (largest and includes Memphis)
– DeSoto County (second largest and fastest growing)
– Crittenden County (only county from Arkansas)
– Fayette County
– Marshall County
– Tata County
– Tipton County
– Tunica County
Areas that were not covered by the 3-bridge model – such as parts of Marshall County, new TAZs were designed using the Census TAZ structure.
In total, the Memphis MPO model has 1729 internal zones which are aggregated into 26 planning districts for modeling purposes. The districts have greater granularity in the urban portions of Shelby and DeSoto counties and are somewhat aggregate in nature in the rural counties.
The modeling team retained all attributes included in the model stream that were used in different model routines. Only those variables that were not utilized were dropped from the final list. This allows greater continuity in the modeling framework for Memphis MPO staff.
Some roadways that had been built in the recent past were adjusted to account for differences in proposed and actual geographic layout. Such changes were made in discussions with the Memphis MPO staff.
It was observed that some attributes such as number of lanes, posted speeds, and functional classes were incorrect in parts of the region, especially Mississippi. Wherever such inconsistencies were found, CS staff made changes to the network during the model development procedures.
No changes were made to model application routines unless absolutely warranted:

Memphis MPO Model Update
Cambridge Systematics, Inc. 2-3
Figure 2.1 Study Region


Memphis MPO Model Update
Cambridge Systematics, Inc. 3-1
3.0 Model Overview
The Memphis travel demand model is a four-step trip based model. The four steps include trip generation, trip distribution, mode choice and trip assignment. The model runs through nine stages to accomplish these four steps. The nine stages are:
Model initialization;
Network skimming;
Trip generation;
Compute log sums;
Destination choice;
Mode choice;
Conversion from pa to od formats;
Trip assignment; and
Feedback assignment.
The model considers four time of day periods: AM peak period (6 AM to 9 AM), midday off-peak period (9 AM to 2 PM), PM peak-period (2 PM to 6 PM) and night off-peak period (6 PM to 6 AM). Figure 3.1 shows the model stages at model user interface. This section outlines each of these steps in great detail.

Memphis MPO Model Update
3-2 Cambridge Systematics, Inc.
Figure 3.1 Model Steps
3.1 INITIALIZATION The initialization stage includes the following sub-stages:
Set demographic and employment for correct analysis year;
Set TAZ area types;
Set network scenario for the correct analysis year; and
Set network speeds and capacities.
Figure 3.2 shows the sub-stages in initialization stage at the user-interface.

Memphis MPO Model Update
Cambridge Systematics, Inc. 3-3
Figure 3.2 Steps in Initialization Stage
Set Demographic and Employment Data for Correct Analysis Year
The sub-stage “Set demographic and employment data for correct analysis year” reads the demographic and employment data from the traffic analysis zone (TAZ) attribute file and codes the data in the TAZ boundary polygon file. It is critical to set the correct model year in the user interface so the model may pull in the right files.
The TAZ data fields that get coded are: population, total number of households, total employment, retail employment, industrial and manufacturing employment, wholesale employment, service employment, office employment, government employment, school enrollment, university enrollment and special generator from FedEx, Graceland and airport.
Set TAZ Area Types
The sub-stage “Set TAZ area types” sets the area types in the TAZ boundary shape file. Table 3.1 shows the description of the area type coding1.
Table 3-1 Area Type Coding
Area Type Code Area Type
1 CBD
2 Urban
3 suburban
4 Rural
1 Base and future year area types are the same. The future year area type calculation was turned off in the script since it was setting all are area types to urban. The area type in future is a function of employment and population density.

Memphis MPO Model Update
3-4 Cambridge Systematics, Inc.
Set Network Scenario for Correct Analysis Year
The sub-stage “Set network scenario for the correct analysis year” codes the year-specific network attributes at the network. Table 3.2 shows the year-specific network attributes. The table also shows the source of the network data.
The network fields specific to base year can be identified from the fieldname with prefix “Y10_”.
This sub-stage copies the base year attributes which were pre-coded in the network to the year specific network fields.
Then, the year-specific attributes get updated based on the project information from project lookup table.
Any projects related to the changes in ramp types, signal density, signal coordination, heavy residential area indicator and HOV lane indicator are not listed in project lookup table. These changes need to be coded in the network manually.
Table 3-2 Year Specific Network Attributes
Network attribute Description Source
In_Highway Flag to enable highway link Project lookup table
In_Transit Flag to enable highway link in transit network
Project lookup table
In_Walk Indicates whether the link is available to walk or not
Project lookup table
Fac_Type Functional class Project lookup table
Area_Type Area type TAZ boundary file
Posted_Speed Posted speed Project lookup table
MedType Median type Project lookup table
RampType Ramp type Project lookup table
AB_Lanes Number of lanes in AB direction Project lookup table
BA_Lanes Number of lanes in BA direction Project lookup table
AB_LANE_WI Lane width (feet) Project lookup table
BA_LANE_WI Lane width (feet) Project lookup table
AB_SHOULD Shoulder width (feet) Project lookup table
BA_SHOULD Shoulder width (feet) Project lookup table
AB_Parking Flag to indicate parking Project lookup table
BA_Parking Flag to indicate parking Project lookup table
RampType Ramp type Highway network file
SigDens Signal density Highway network file
SigCoord Signal coordination flag Highway network file
Heav_Rest Heavy residential flag Highway network file
HOV HOV flag Highway network file

Memphis MPO Model Update
Cambridge Systematics, Inc. 3-5
Set Network Speeds and Capacities
The sub-stage “Set network speeds and capacities” calculates the link speed and capacities.
The free-flow highway travel time gets populated by the posted-speed coded in the network.
The model populates the free-flow speed into the links with missing posted-speed values based on the link functional classes and area types.
The free-flow speed gets further adjusted by the speed adjustment factor and signal coordination factor to reflect existing roadway characteristics such as area types, functional classes and existence of signal coordination.
The speed adjustment factors are introduced as inputs to the model (see Section 5).
The free flow travel speed is calculated at the first iteration of the feedback loop.
In subsequent iterations of feedback loop, the congested travel speed for each of the time of day periods gets populated from the highway assignment results.
Transit speed is calculated by adjusting highway speed based on link functional class and area type.
The link capacities at different time of day periods and at different level of services are calculated by the sub-stage “Set network speeds and capacities”. The equation XX calculates the capacity. The values of the variables used in the equation are determined from the capacity lookup table based on the link characteristics such as functional class, area types, shoulder width, number of lanes, median type etc. The capacity lookup table is an input to the model (see section 5).
– SF = c * N * fw
* fHV
* Fp
* FE
* fd
* FSD
* FSC
* FCLT
* FPark
* (v/c)i
– Where the variables are:
– SF = Maximum service flow for desired level-of-service
– c = Capacity under ideal conditions (vehicles per hour per lane)
– N = Number of lanes
– fw
= Factor due to lane and shoulder width
– fHV
= Factor due to percent heavy vehicles
– Fp
= Factor due to driver population
– FE
= Factor due to driving environment

Memphis MPO Model Update
3-6 Cambridge Systematics, Inc.
– fd
= Factor due to directional distribution
– FSD
= Factor due to signal density
– FSC
= Factor due to signal coordination
– FCLT
= Factor for continuous left-turn lane (for undivided sections)
– FPark
= Factor for on-street parking
The constants of volume delay function (alpha and beta values) are coded in the network by the sub-stage “Set network speeds and capacities”. A lookup table which is an input to the model (Section 5) is used to determine the value of the constants.
3.2 NETWORK SKIMMING The network skimming stage includes the following sub-stages:
Build 4 timeperiod highway network
Build 4 timeperiod transit network
Highway skims ( 4 periods)
Transit skims ( 4 periods)
Figure XX shows the sub-stages in network skimming stage.
Figure 3.3 Steps in the Network Skimming Stage
Build 4 Timeperiod Highway and Transit Network
The sub-stage “Build 4 timeperiod highway network” reads the highway network attributes and stores the network data in the network file (*.net).
The highway skimming and the highway assignment process takes the network file as input to get the network information.
Memphis MPO Model Update
Cambridge Systematics, Inc. 3-7
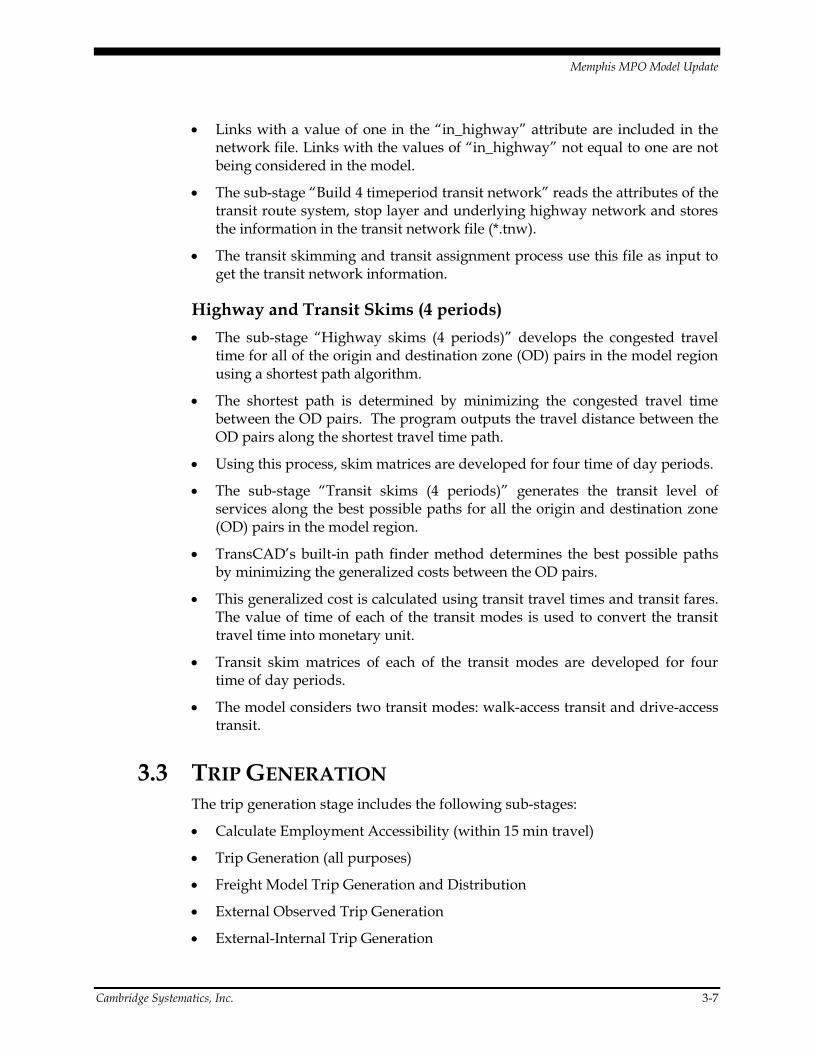
Links with a value of one in the “in_highway” attribute are included in the network file. Links with the values of “in_highway” not equal to one are not being considered in the model.
The sub-stage “Build 4 timeperiod transit network” reads the attributes of the transit route system, stop layer and underlying highway network and stores the information in the transit network file (*.tnw).
The transit skimming and transit assignment process use this file as input to get the transit network information.
Highway and Transit Skims (4 periods)
The sub-stage “Highway skims (4 periods)” develops the congested travel time for all of the origin and destination zone (OD) pairs in the model region using a shortest path algorithm.
The shortest path is determined by minimizing the congested travel time between the OD pairs. The program outputs the travel distance between the OD pairs along the shortest travel time path.
Using this process, skim matrices are developed for four time of day periods.
The sub-stage “Transit skims (4 periods)” generates the transit level of services along the best possible paths for all the origin and destination zone (OD) pairs in the model region.
TransCAD’s built-in path finder method determines the best possible paths by minimizing the generalized costs between the OD pairs.
This generalized cost is calculated using transit travel times and transit fares. The value of time of each of the transit modes is used to convert the transit travel time into monetary unit.
Transit skim matrices of each of the transit modes are developed for four time of day periods.
The model considers two transit modes: walk-access transit and drive-access transit.
3.3 TRIP GENERATION The trip generation stage includes the following sub-stages:
Calculate Employment Accessibility (within 15 min travel)
Trip Generation (all purposes)
Freight Model Trip Generation and Distribution
External Observed Trip Generation
External-Internal Trip Generation

Memphis MPO Model Update
3-8 Cambridge Systematics, Inc.
Figure 3.4 shows the sub-stages in trip generation stage.
Figure 3.4 Steps in the Trip Generation Stage
Calculate Employment Accessibility (within 15 min travel)2
The sub-stage “Calculate Employment Accessibility (within 15 min travel)” determines the percentage of total TAZ employment that are accessible within 15 minutes of travel. Then, the percentages are coded in the network field “Percent_Within_15minutes” of the TAZ boundary file.
Trip Generation (All purposes)
The sub-stage “Trip Generation (all purposes)” calculates the daily trip production and trip attraction for each of the TAZ within the model region.
The trip purposes are: journey to work, home-based school, home-based university, home-based shopping, home-based social and recreational, home-based pick-up and drop-off, home-based other, non-home-based work and non-home-based non-work.
The model uses the trip generation rates and the socio-economic data to calculate the productions and attractions at the zonal level.
The productions and attractions are calculated for all of the nine trip purposes.
The productions for each of the trip purposes are segmented by four income levels.
The trip productions and attractions are coded in the TAZ layer.
The definition of each of the income levels are shown in Table 3.3.
2 This percentage is not being used in the model and may be used for reporting purposes.

Memphis MPO Model Update
Cambridge Systematics, Inc. 3-9
Table 3-3 Definition of Income Levels
Income level Annual household income
1 Less than $20,000
2 $20,000 to $35,000
3 $35,000 to $100,000
4 Greater than $100,000
Freight Model Trip Generation and Distribution
The sub-stage “Freight Model Trip Generation and Distribution” develops the origin-destination truck trips that travel within the model regional boundary. The model considers two truck types: single-unit truck and multi-unit truck.
External Observed Trip Generation
The sub-stage “External Observed Trip Generation” calculates the daily external-internal and external-external trips by single-occupancy passenger vehicles (SOV), high-occupancy passenger vehicles (HOV), single-unit trucks and multi-unit trucks from the observed count data at the external stations. The calculated values are saved in the external trip data file.
External-Internal Trip Generation
The “External Internal Trip Generation” calculates the external-internal (EI) trip ends at the model internal TAZ using EI trip rates and the socio-economic data.
3.4 COMPUTE LOG SUMS The compute logsum stage includes only one sub-stage as shown in Figure 3.5.
Figure 3.5 Steps in Compute Logsum Stage
The sub-stage “Compute Log Sum” computes the logsum values for all trip purposes and for each of the time of day periods. These mode choice logsum values are an integral part of the application of the destination choice model. They represent the zonal accessibility, i.e. how easily can a zone be accessed by different modes of transportation.

Memphis MPO Model Update
3-10 Cambridge Systematics, Inc.
The mode choice model is implemented as nested logit model. The mode nesting is shown in Figure 3.6. The logsum values are calculated by four income groups for all the modes at each of the nesting levels.
Figure 3.6 Mode Choice Nesting Levels
3.5 DESTINATION CHOICE MODEL The destination choice model stage includes the following sub-stages:
Destination Choice Model for All Purposes
External-External Trip Distribution
External-Internal Auto Trip Distribution
Frataring EI trips to Match AADT
Figure 3.7 shows the sub-stages in destination choice model stage.
Figure 3.7 Steps in the Destination Choice Model Stage
Bike
All Modes
Transit Drive Alone Shared Drive Non-motorized
Shared Drive 2
Shared Drive 3+
Walk Access
Drive Access
Walk
Memphis MPO Model Update
Cambridge Systematics, Inc. 3-11
Destination Choice Model for All Purposes
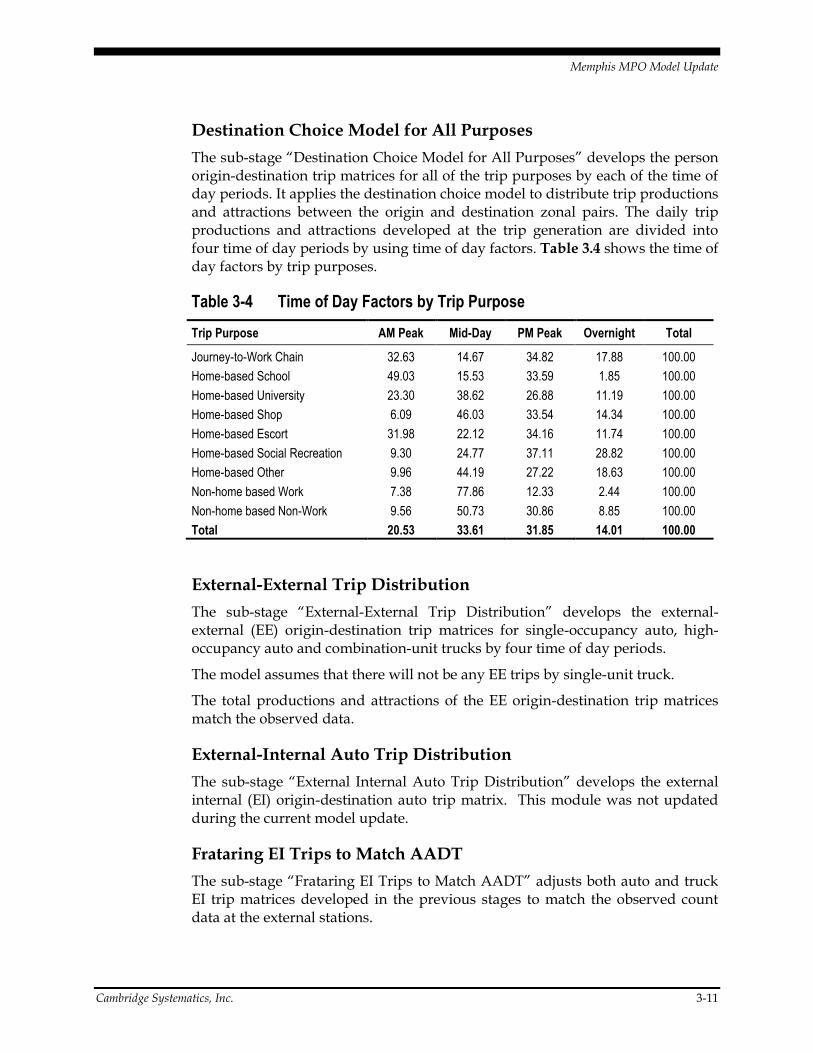
The sub-stage “Destination Choice Model for All Purposes” develops the person origin-destination trip matrices for all of the trip purposes by each of the time of day periods. It applies the destination choice model to distribute trip productions and attractions between the origin and destination zonal pairs. The daily trip productions and attractions developed at the trip generation are divided into four time of day periods by using time of day factors. Table 3.4 shows the time of day factors by trip purposes.
Table 3-4 Time of Day Factors by Trip Purpose
Trip Purpose AM Peak Mid-Day PM Peak Overnight Total
Journey-to-Work Chain 32.63 14.67 34.82 17.88 100.00
Home-based School 49.03 15.53 33.59 1.85 100.00
Home-based University 23.30 38.62 26.88 11.19 100.00
Home-based Shop 6.09 46.03 33.54 14.34 100.00
Home-based Escort 31.98 22.12 34.16 11.74 100.00
Home-based Social Recreation 9.30 24.77 37.11 28.82 100.00
Home-based Other 9.96 44.19 27.22 18.63 100.00
Non-home based Work 7.38 77.86 12.33 2.44 100.00
Non-home based Non-Work 9.56 50.73 30.86 8.85 100.00
Total 20.53 33.61 31.85 14.01 100.00
External-External Trip Distribution
The sub-stage “External-External Trip Distribution” develops the external-external (EE) origin-destination trip matrices for single-occupancy auto, high-occupancy auto and combination-unit trucks by four time of day periods.
The model assumes that there will not be any EE trips by single-unit truck.
The total productions and attractions of the EE origin-destination trip matrices match the observed data.
External-Internal Auto Trip Distribution
The sub-stage “External Internal Auto Trip Distribution” develops the external internal (EI) origin-destination auto trip matrix. This module was not updated during the current model update.
Frataring EI Trips to Match AADT
The sub-stage “Frataring EI Trips to Match AADT” adjusts both auto and truck EI trip matrices developed in the previous stages to match the observed count data at the external stations.

Memphis MPO Model Update
3-12 Cambridge Systematics, Inc.
3.6 MODE CHOICE MODEL The model choice model stage includes one sub-stage as shown in figure XX.
Figure 3.8 Mode Choice Model Stage
This stage breaks down the internal origin-destination person trip matrices by modes. This is done separately for all trip purposes and for all of the four time of day periods.
The mode choice model is applied to develop the probabilities of taking different modes to travel from an origin to a destination zone.
The probabilities are applied to the person trips developed in the destination choice model stage to allocate the person trips into different modes.
The model considers eight modes: walk access transit, drive access transit, walk, bike, school bus, drive alone auto, shared-ride auto with 2 persons and shared-ride auto with 3 or more persons. Not all modes are available to all trip purposes. Table 3.5 shows the mode availability by trip purposes. In this version of the model update, bike and walk have been introduced while (future) premium transit has been folded into one transit mode.
Table 3-5 Modal Availability by Purpose
Mode available
Journey to work Walk access transit, drive access transit, walk, bike, drive alone, shared-ride 2 persons, shared-ride 3+ persons
Home-based school
Walk access transit, drive access transit, walk, school bus, drive alone, shared-ride 2 persons, shared-ride 3+ persons
Home-based university
Walk access transit, drive access transit, walk, bike, drive alone, shared-ride 2 persons, shared-ride 3+ persons
Home-based shopping
Walk access transit, drive access transit, walk, drive alone, shared-ride 2 persons, shared-ride 3+ persons
Home-based pick-up and drop-off
Walk, drive alone, shared-ride 2 persons, shared-ride 3+ persons

Memphis MPO Model Update
Cambridge Systematics, Inc. 3-13
Home-based social and recreational
Walk access transit, drive access transit, walk, bike, drive alone, shared-ride 2 persons, shared-ride 3+ persons
Home-based other
Walk access transit, drive access transit, walk, bike, drive alone, shared-ride 2 persons, shared-ride 3+ persons
Non-home-based work
Walk access transit, drive access transit, walk, drive alone, shared-ride 2 persons, shared-ride 3+ persons
Non-home-based non-work
Walk access transit, drive access transit, walk, drive alone, shared-ride 2 persons, shared-ride 3+ persons
3.7 PA TO OD Prior to assignment, it is important to convert the trip tables formatted in a production-attraction structure to an origin-destination format. This allows the models to truly capture directional congestion in the peak periods and better reflect ground reality. There are three sub-stages in this step.
Create Final Truck Trips and Auto External Trips
Apply TOD and Directional Factors (All Purpose Auto and Transit Trips)
Create OP Matrix for Park-N-Ride Vehicle Trips
Figure 3.9 Stages in the PA to OD Step
Create Final Truck Trips and Auto Trips
The sub-stage “Create Final Truck Trips and Auto Trips” creates an origin-destination matrix that has all single-unit truck trips, all multi-unit truck trips and external auto trips.
It splits the daily truck trips by four time of day periods (TOD). Table 3.6 shows the time of day factors to convert daily truck trips into four time of day periods.

Memphis MPO Model Update
3-14 Cambridge Systematics, Inc.
Table 3-6 Time of Day Factors for Trucks
Time Period Single-unit Truck (%) Multi-unit Truck (%)
AM 17.9 16.2
MD 31.4 27.5
PM 27.8 26.9
OP 22.9 29.4
Apply TOD and Directional Factors
The sub-stage “Apply TOD and Directional Factors (All Purpose Auto and Transit Trips)” applies time of day factors, the directional factors to persons and occupancy rates to convert the person trips created at mode-choice stage to vehicle origin-destination (OD) trips.
Time of day direction factors by trip purposes are input to the model (see Table 3.7). The OD tables created at this stage are used as OD trips in the highway and transit assignment.
Table 3-7 Time-of-Day Directional Trip Factors (Origin = Production)
Trip Purpose Direction AM Peak Mid-Day PM Peak Overnight
Journey-to-Work Chain % from Home 96.53 63.29 8.32 31.29
% to Home 3.47 36.71 91.68 68.71
Home-based School % from Home 98.99 14.51 3.63 45.98
% to Home 1.01 85.49 96.37 54.02
Home-based University % from Home 96.33 45.70 43.71 6.63
% to Home 3.67 54.30 56.29 93.37
Home-based Shop % from Home 73.64 44.62 38.42 30.46
% to Home 26.36 55.38 61.58 69.54
Home-based Escort % from Home 66.70 64.71 41.71 41.37
% to Home 33.30 35.29 58.29 58.63
Home-based Social Recreation
% from Home 71.05 62.39 58.90 20.38
% to Home 28.95 37.61 41.10 79.62
Home-based Other % from Home 87.04 57.07 47.46 24.32
% to Home 12.96 42.93 52.54 75.68
Non-home based Work N/A 50.0 50.0 50.0 50.0
Non-home based Non-Work N/A 50.0 50.0 50.0 50.0
Create OP Matrix for Park-N-Ride Vehicle Trips
The sub-stage “Create OP Matrix for Park-N-Ride Vehicle Trips” identifies the trips between parking lots and TAZ made by auto-access transit mode and

Memphis MPO Model Update
Cambridge Systematics, Inc. 3-15
creates the park and ride OD trip matrix. The park and ride trips are added to OD trips by auto modes.
3.8 TRIP ASSIGNMENT The Trip Assignment model stage includes the following sub-stages:
Transit Assignment
Highway Assignment
Figure 3.10 Stages in the Trip Assignment Step
Transit Assignment
The sub-stage “Transit Assignment “ assigns the transit origin-destination trips on transit network.
It uses the “pathfinding” method to load the origin-destination trips on the transit network.
The “pathfinding” method finds the best possible route by comparing generalized cost of travel along different routes between the origin-destination zonal pairs.
The generalized cost is a function of transit route attributes such as fare, walk time, access time, egress time in-vehicle travel time, number of transfers and dwelling cost.
The assignment process develops the ridership and the transit travel time data by four time of day periods and by two transit modes (walk access and drive access) for transit routes in the region.
Highway Assignment
The sub-stage “Highway Assignment” assigns the auto and truck origin-destination trips on the network.
It produces traffic volume, travel time and volume to capacity ratio on each of the links in the network by modes and by time of day periods.
The highway assignment is performed into two phases.

Memphis MPO Model Update
3-16 Cambridge Systematics, Inc.
– First, the external to external origin-destination trips and the multi-unit truck trips are assigned to the network by using “All or Nothing” method. This assignment method does not consider the impact of congestion and assigns the vehicles along the shortest free-flow travel time path. The model assumes that the external to external trips and the multi-unit trucks do not change the path based on the traffic congestion. The assigned external-external volume and multi-unit truck volume are used as the preload volumes in the network for the second phase of the assignment process.
– The second phase of assignment uses the user-equilibrium method. The user-equilibrium method determines the best possible route by minimizing the generalized cost along different route alternatives. The generalized cost is a function of network attributes such as network free-flow travel time, capacity and preload. The second phase of traffic assignment is sensitive to traffic congestion.
3.9 FEEDBACK The feedback model stage includes only one sub-stage as shown below in Figure 3.11.
Figure 3.11 Feedback Loop Step
The “Run feedback loop” compares the skim tables and the assignment results between the different iterations of the model assignment procedures. Based on the convergence criteria of the model, this stage determines whether the model has converged or not.
If the criteria is satisfied then the model run stops and notifies the user that the model run is finished.
Otherwise, the model run continues to run the next feedback loop until it reaches the maximum number of feedback loop sets by the user or until it meets the convergence criteria (whichever comes first).

Memphis MPO Model Update
Cambridge Systematics, Inc. 4-1
4.0 Installation and Implementation Overview
The Memphis Travel Demand Model runs on the TransCAD platform in the Windows operating system.
4.1 HARDWARE REQUIREMENTS Below are the requirements for an efficient model run. The program will work on systems with less RAM and processors, (e.g. a laptop with 8 GB RAM and 4 cores), although it will perform better on the configuration defined below.
Hard disk capacity: ~50 GB per scenario
RAM requirements: GB
CPU requirements: 2.79 GHz (2 processors)
System type: 64-bit operation system
4.2 SOFTWARE REQUIREMENTS The model was developed on the TransCAD Transportation Planning Software, Version 6.0, build 4245, 64 bit. The MPO staff and their consultants must review if other builds of TransCAD are compatible with the development version before running the model.
4.3 INSTALLATION PROCESS The installation process involves the following steps:
Compile the model script;
Update the initialization file;
Add the model to the TransCAD menu.
The model script is compiled to create the UI database. The script compilation steps are shown below.
Open TransCAD program.
Access the “GIS Developer’s Kit “ from “Tools” menu.
Compile the script (Memphis_Model.rsc) by clicking the third button from
the left .

Memphis MPO Model Update
4-2 Cambridge Systematics, Inc.
The compiled script will be saved in file format called “Interfaces (*.dbd)”.
The model initialization file (Memphis_Model.ini) includes the list of the model setup files. The file content is shown in figure XX. During the model installation, the directory names and the file names need to be updated to reflect the actual file path. The updated file (Memphis_Model.ini) needs to be copied to the folder where TransCAD program is installed. For example, if the TransCAD program file (tcw.exe) exists in the folder “C:\Program files\TransCAD”, the initialization needs to be copied there. TransCAD program uses this file to find the model setup files.
Figure 4.1 Contents of Model Initialization File
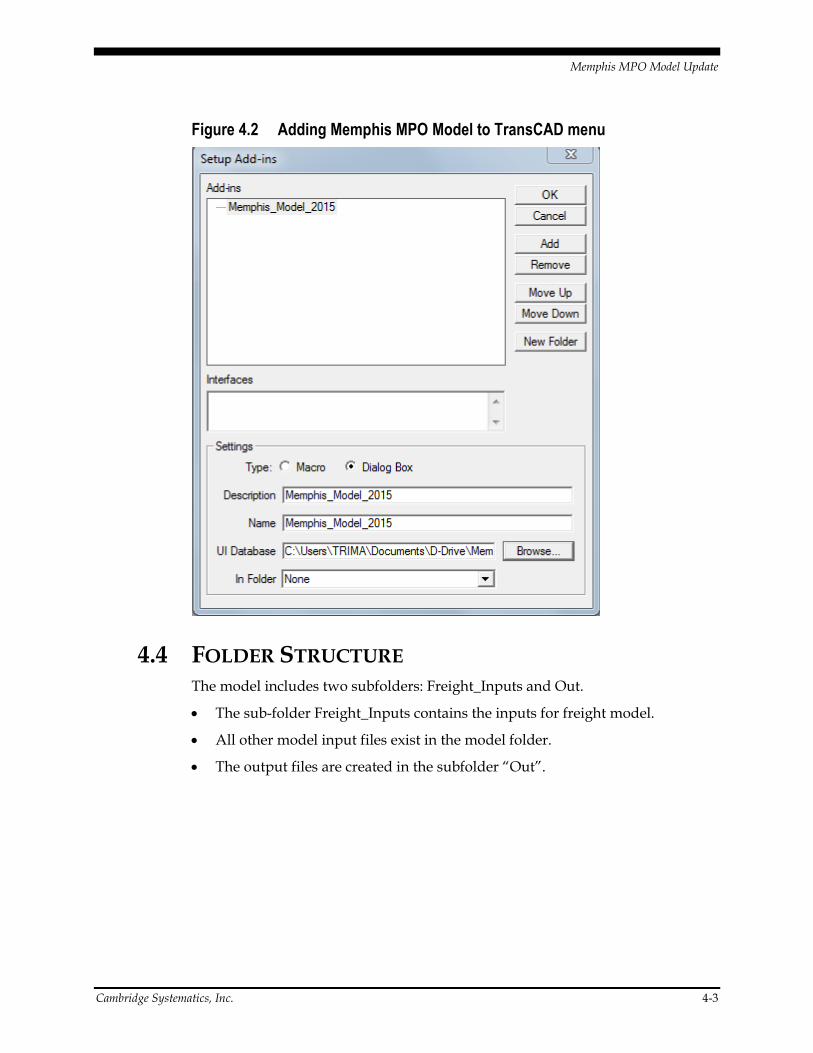
The model is added to TransCAD menu by using “Setup Add-Ins” window. “Setup Add-Ins” window is opened by clicking the menu “Tools->Setup Add-Ins”. Figure 4.2 shows the “Setup Add-Ins” window.
Memphis MPO Model Update
Cambridge Systematics, Inc. 4-3
Figure 4.2 Adding Memphis MPO Model to TransCAD menu
4.4 FOLDER STRUCTURE The model includes two subfolders: Freight_Inputs and Out.
The sub-folder Freight_Inputs contains the inputs for freight model.
All other model input files exist in the model folder.
The output files are created in the subfolder “Out”.


Memphis MPO Model Update
Cambridge Systematics, Inc. 5-1
5.0 Preparing a Model Run
All the steps required to set up a model run are discussed below.
5.1 INPUT DATA AND PARAMETER FILES To run the model, the required input files and parameters are shown in Table
5.1.
Table 5-1 Model Input Files and Parameter Files
Input Filename
Highway network database Memphis_Network_v26.dbd
Transit Route System Route_System_v26.rts
Traffic Analysis Zone layer and database file TAZ_Boundary_08.dbd
Trip generation rates for Shelby county TripGeneration_Rates_Shelby.bin
Trip generation rates for DeSoto county TripGeneration_Rates_DeSoto.bin
Trip generation rates for the rest of the model region
TripGeneration_Rates_Rest.bin
Mode Choice: journey to work coefficients Mode_Choice_JTW.asc
Mode Choice: non-home based work coefficients
Mode_Choice_NHBW.asc
Mode Choice non-home based non-work coefficients
Mode_Choice_NHBNW.asc
Mode Choice: home-based school coefficients Mode_Choice_HBSchool.asc
Mode Choice: home-based social and recreational coefficients
Mode_Choice_HBSocRec.asc
Mode Choice: home-based shopping coefficients
Mode_Choice_HBShop.asc
Mode Choice: home-based pickup drop-off coefficients
Mode_Choice_HBPUDO.asc
Mode Choice: home-based other coefficients Mode_Choice_HBO.asc
Mode Choice: home-based university coefficients
Mode_Choice_HBUniv.asc
Transit mode table modes.bin
Transit transfer table mode_xfer.bin
Fare zone lookup table FareZones.mtx
Destination choice coefficients DestinationChoice_Coefficients.bin
Time of day factors used in capacity calculation tod_factors.bin
Capacity equation lookup factors Capacity_Lookup.bin
Alpha and Beta lookup table aB Lookup.dbf
External trip data for the model year *_External_Trip_Data.bin

Memphis MPO Model Update
5-2 Cambridge Systematics, Inc.
External trip K-Factor matrix EE_K_factors.mtx
Hourly directional percentages HOURLY.bin
IE gravity model Gamma function parameter settings
IE_FF_Gamma_Equation.bin
IE trip generation rates IE_Trip_Rates.bin
QRFM trip generation rates for Internal-Internal trucks
Freight_Inputs\Memphis_IIRates.bin
QRFM trip distribution K-factor matrix Freight_Inputs\KFactors_Internal.mtx
TOD factors for II and IE Trucks QRFM_TOD_Factors.bin
Congested speed factors by TOD for initial skim Congested_Speed_Factors.bin
Fsc and Fsd factors for highway capacity calculation
CapacityFactor_Signal.bin
HOV occupancy by time of day HOV_Occupancy_TOD.bin
Time of day factors for internal person trips by trip purposes
TODFactor_Internal_Trips.bin
Link specific turning penalties Ramp_Penalties.bin
TAZ attributes bin file, need to add year as prefix to find the file
*_TAZ_Attributes.bin
Future Year project list Projects.bin
Penalty for in line group transfers XFERWaitTable.bin
QRFM friction factor table Freight_Inputs\FFactors_internal.bin
Trip generation rates for commodities Freight_Inputs\Memphis_IERates.bin
Internal special generators for ATRI calibrated QRFM trip generation
Freight_Inputs\Internal_SG.bin
Special generators for Transearch derived freight generation
Freight_Inputs\IE_SG.bin
Truck trips by commodity group external to Memphis
Freight_Inputs\IE_PAs.bin
IE K-factor matrix EIE_KFactors.mtx
Commodity Flow friction factor table Freight_Inputs\FFactors.bin
Table with average external distance by commodity type
Freight_Inputs\ExternalDistances.bin
External External trucks from subarea extraction
Freight_Inputs\Truck_EE_Trips.mtx
Freight truck K-factor matrix Freight_Inputs\KFactors.mtx
AM assignment iterations 50
MD assignment iterations 50
PM assignment iterations 50
OP assignment iterations 50
AM assignment convergence 0.001
MD assignment convergence 0.001
PM assignment convergence 0.001
OP assignment convergence 0.001
AUTO PCE 1
Medium Truck PCE 1.5

Memphis MPO Model Update
Cambridge Systematics, Inc. 5-3
Heavy Truck PCE 2
MSA Feedback RMSE Convergence 10
Skim matrices RMSE comparison for Feedback converge
1
Value of time for AM DrivetoTransit 0.1
Value of time for AM WalktoTransit 0.05
Value of time for MD DrivetoTransit 0.05
Value of time for MD WalktoTransit 0.05
Value of time for PM DrivetoTransit 0.1
Value of time for PM WalktoTransit 0.05
Value of time for OP DrivetoTransit 0.05
Value of time for OP WalktoTransit 0.05
Out-of-vehicle travel time weight for AM DrivetoTransit
2
Out-of-vehicle travel time weight for AM WalktoTransit
2
Out-of-vehicle travel time weight for MD DrivetoTransit
3
Out-of-vehicle travel time weight for MD WalktoTransit
3
Out-of-vehicle travel time weight for PM DrivetoTransit
2
Out-of-vehicle travel time weight for PM WalktoTransit
2
Out-of-vehicle travel time weight for OP DrivetoTransit
3
Out-of-vehicle travel time weight for OP WalktoTransit
3
Global layover time 5
Maximum Parking-to-Stop walk time 10
Maximum access time 18
Maximum egress time 18
Maximum total time 180
Transfer penalty weight 1
Transfer penalty 20
Maximum Initial wait time 10
Minimum Initial wait time 5
Maximum Transfer walk time 6
Path combination factor 0.5
Maximum number of transfers 3
Maximum number of freight distribution iterations
40
Freight distribution convergence value 0.001
The input data may be accessed using the following steps:

Memphis MPO Model Update
5-4 Cambridge Systematics, Inc.
Click on the “Setup” button on the user interface shown in Figure 5.1.
In the next interface table (Figure 5.2), clicking on the “contents” button brings up a third interface table that shows the input and output data for each of the model steps.
As an example, the input files associated with the “Initialization” step are shown in Figure 5.3. Output files may also be viewed by clicking on the “output” button in Figure 5.3.
5.2 SCENARIO SETUP The scenario setup involves the following steps.
Copy the scenario specific input files in the model folder.
Open “Tools->Add-Ins->Memphis Model” from TransCAD menu. Figure 5.1 shows the Memphis Model interface.
The bridge option call-out button helps build bridges that have already been built in the region and must be retained.

Memphis MPO Model Update
Cambridge Systematics, Inc. 5-5
Figure 5.1 Memphis Model Interface

Memphis MPO Model Update
5-6 Cambridge Systematics, Inc.
By clicking the setup button, the setup window (Figure 5.2) will pop-up. In each scenario, it is important that all input files are available; otherwise the model will fail. At the first instance of a model run, it is expected that all output files will be unavailable.
Figure 5.2 Scenario Set-up Window
Click the button “Add” to add a new scenario.
Name the scenario by typing the name in the textbox “Name”.
Click the button “Dir” to setup the model directory path.
Double click on the items in the list “Steps” to check/edit the model input files and parameters.
Click the button “OK”.
Select the scenario name from the list “Scenarios” in the model user interface.
Select the scenario year.
CS has provided the MPO with separate files and folders for each model year. Therefore, care must be taken to ensure that the scenario year is set to the appropriate year in which the folder is housed. Otherwise, the model will fail since it cannot access key input files for different model years.

Memphis MPO Model Update
Cambridge Systematics, Inc. 5-7
Figure 5.3 Model Step Content Window


Memphis MPO Model Update
Cambridge Systematics, Inc. 6-1
6.0 Running the Model
The Memphis Travel Demand model can be run using any of the three different options: Single Stage, Single Loop and Multi Loop. The radio buttons in the user interface allow the user to select these options. Before running the model, the user should prepare the model data and setup the scenario (as described in Section 5).
When running different scenarios, it is best practice to copy all the inputs from the base directory to a scenario specific directory and set up the run there. This will ensure version control and no over-writing of files. When running a scenario for the first time, it is important to run the model steps in sequence and from the very beginning. For scenarios where the model has already been run once, the model may be run for intermediate steps only, if necessary. However, the analyst must have a sound reason for doing so (fixed trip tables, for instance).
6.1 RUNNING SINGLE STAGE The single stage running option will allow the user to run a single stage. The model will stop after running that stage. The radio button “Stage” in the user interface allows the user to select this option. To run all sub-stages within a stage, click the respective button of the stage of interest. To run a specific sub-stage, click the button next to the stage button and a sub-stage setting window will pop-up. An example of sub-stage setting window is shown in Figure 6.1. The user can select/unselect the option, close the window and click the stage button to run the sub-stage of interest.
Figure 6.1 Sub-Stage Setting Window for Initialization Stage
Memphis MPO Model Update
6-2 Cambridge Systematics, Inc.
6.2 RUNNING SINGLE LOOP The single loop running option will allow the user to run all of the model stages in one loop. No feedback looping will occur for this option. The model will stop after running the trip assignment stage. The radio button “Loop” in the user-interface will allow the user to run the model in single loop option.
6.3 RUNNING MULTI LOOP The multi loop running option will allow the user to run the model with feedback loops. In this option, the model will run in multiple loops. After running all of the stages up to highway trip assignment in the first iteration of the feedback loop, the congested travel time will be coded in the network and the model stages will run under the congested travel condition in the second iteration of the feedback loop. The highway assignment results of the second iteration will be compared with that of the first iteration. If the convergence criteria is not satisfied, the model stages will be continued to run in the third iteration. The feedback loop will continue until the comparison meets the convergence criteria. The transit assignment is run in the final iteration of the feedback loop. The radio button “All Loops” in the user-interface will allow the user to run the model with feedback loop. The drop down list “Start Loop” represents the starting loop and the text box “End Loop” represents the final loop.
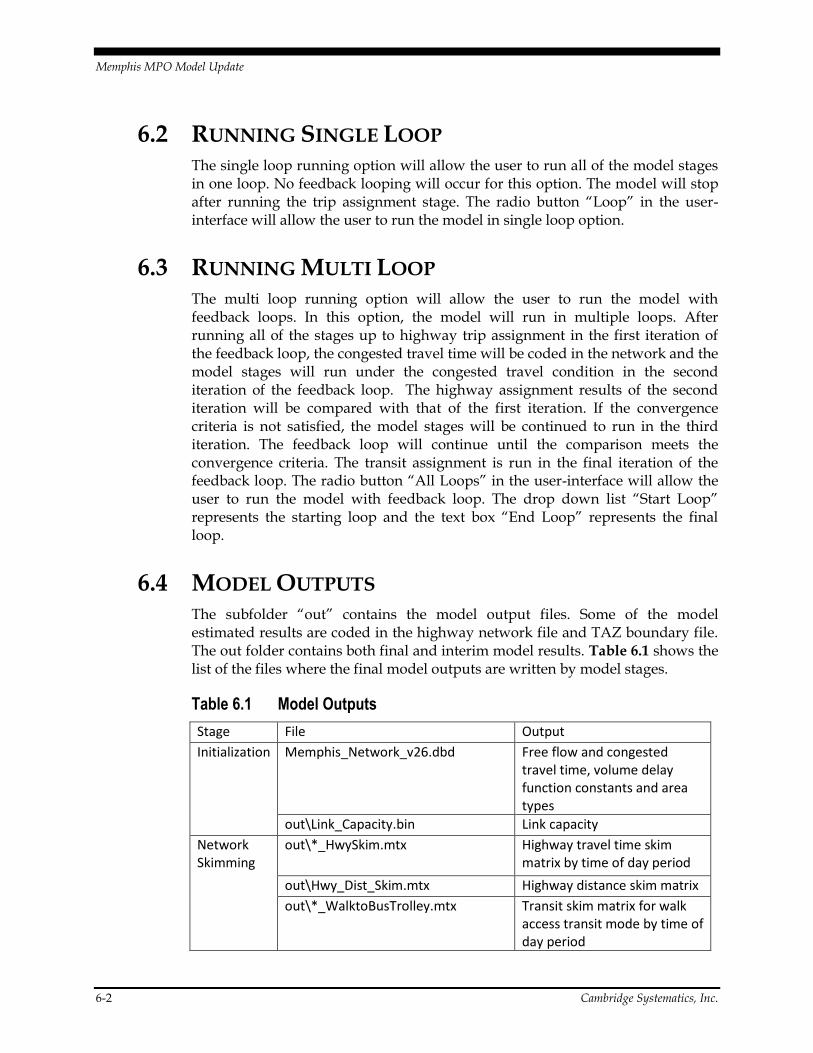
6.4 MODEL OUTPUTS The subfolder “out” contains the model output files. Some of the model estimated results are coded in the highway network file and TAZ boundary file. The out folder contains both final and interim model results. Table 6.1 shows the list of the files where the final model outputs are written by model stages.
Table 6.1 Model Outputs
Stage File Output
Initialization Memphis_Network_v26.dbd Free flow and congested travel time, volume delay function constants and area types
out\Link_Capacity.bin Link capacity
Network Skimming
out\*_HwySkim.mtx Highway travel time skim matrix by time of day period
out\Hwy_Dist_Skim.mtx Highway distance skim matrix
out\*_WalktoBusTrolley.mtx Transit skim matrix for walk access transit mode by time of day period

Memphis MPO Model Update
Cambridge Systematics, Inc. 6-3
out\*_DrivetoBusTrolley.mtx Transit skim matrix for drive access transit mode by time of day period
Trip Generation
TAZ_Boundary_08.dbd Person internal trip productions and attractions by purposes
2010_External_Trip_Data.bin External auto and truck trip ends at external stations
out\IE_Auto_PA.bin External-internal auto trip ends at the internal TAZ
out\Trip_Gen_IEP.bin Multi-unit internal truck trip productions by commodity group
out\Trip_Gen_IEA.bin Multi-unit internal truck trip attractions by commodity group
out\Trip_Gen_II.bin Single-unit internal truck trip productions and attractions
Compute LogSums
out\Utility_*_*.mtx Destination choice utility by time of day and by trip purposes
Destination Choice
out\PersonTrips_*_*.mtx Person trip matrix by time of day and by trip purpose
Mode Choice
out\ModalPersonTrips_*_*.mtx Person trips by mode, by time of day and by purpose
PA to OD out\OD_MMA_PNR.mtx Auto origin-destination trips by time of day
out\OD_Preload.mtx Multi-unit truck trips and external-external auto trips by time of day
out\OD_*WalkAccessTransit.mtx Walk access transit origin-destination trips by time of day
out\OD_*AutoAccessTransit.mtx Auto access transit origin-destination trips by time of day
Trip Assignment
Assignment_Summary_*.bin Highway assignment results
TASN_ONO_*_AutoAccessTransit.bin Auto access transit boardings/alightings by time of day
TASN_ONO_*_WalkAccessTransit.bin Walk access transit boardings/alightings by time of day

Memphis MPO Model Update
6-4 Cambridge Systematics, Inc.
TASN_FLW_*_AutoAccessTransit Auto access in-vehicle travel time and ridership by time of day
TASN_FLW_*_WalkAccessTransit Walk access in-vehicle travel time and ridership by time of day

Memphis MPO Model Update
Cambridge Systematics, Inc. 7-1
7.0 Network and TAZ Attributes
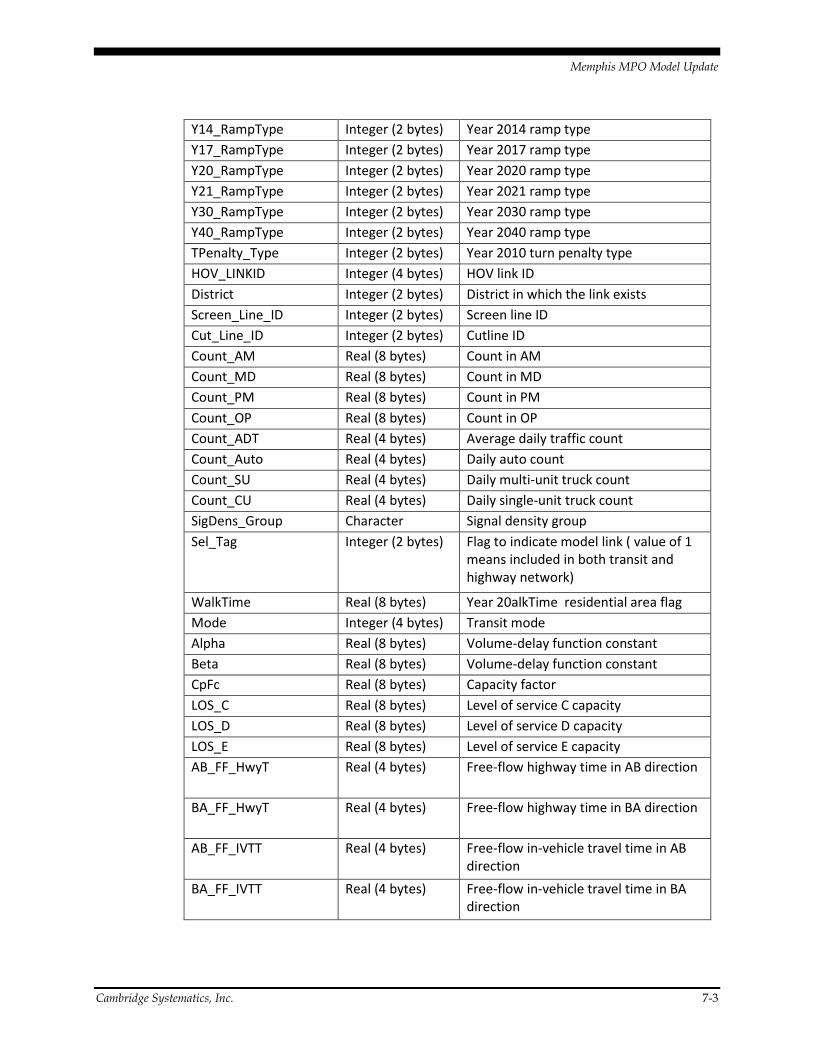
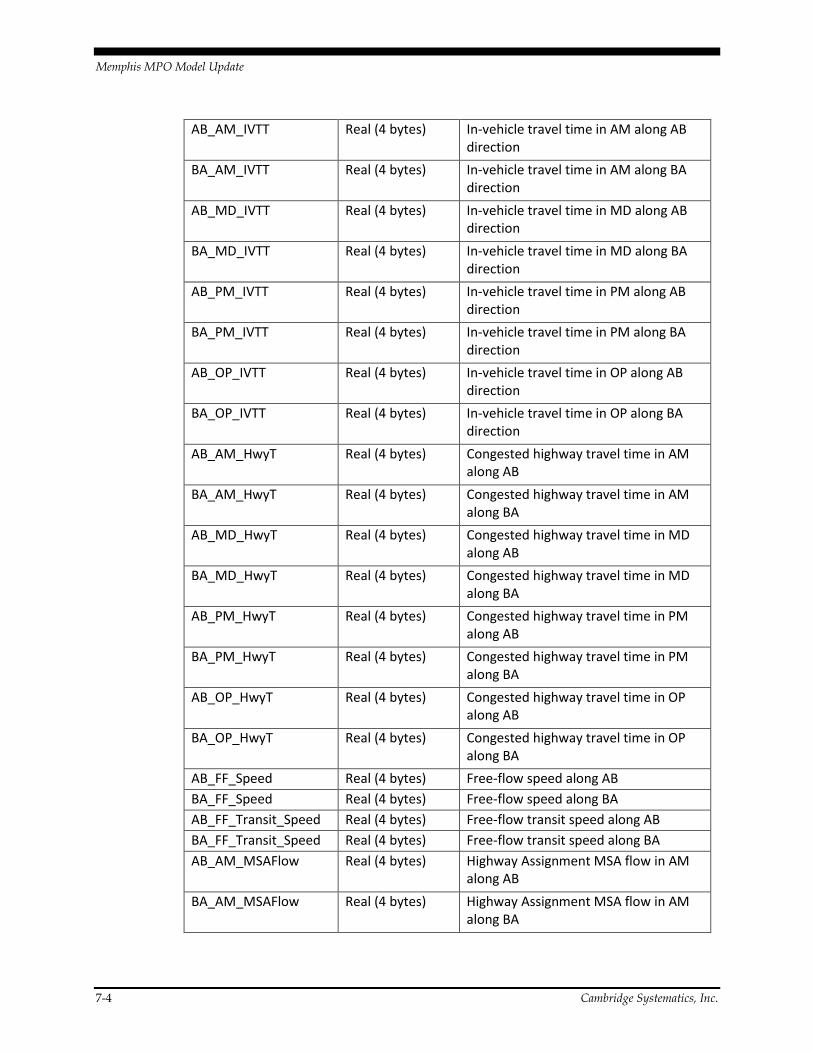
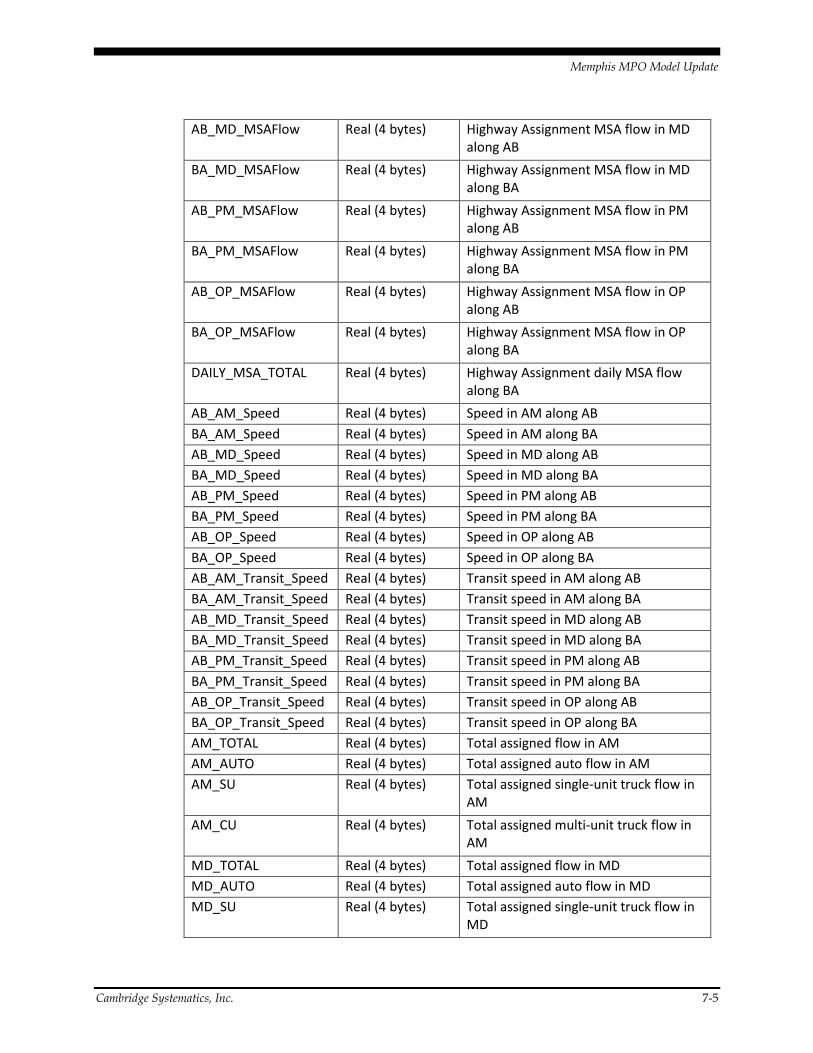
7.1 HIGHWAY NETWORK ATTRIBUTES The highway network includes link layer and node layer. The link layer attributes are shown in Table 7-1. The model uses the node layer’s ID field to identify the centroid nodes. The value of ID less 10,000 represents the centroid nodes.
Table 7-1 Network Link Attributes
Link Attribute Field Data Type Description
ID Integer (4 bytes) Network link ID
Length Real (8 bytes) Link length in miles
Dir Integer (2 bytes) TransCAD direction field
NAME Character Road name
State Character State
County_Name Character County name
ID_3bridge Real (4 bytes) Link ID in 3-bridge model network
ID_MS Real (4 bytes) Link ID in MS model network
Y10_In_Highway Integer (2 bytes) Year 2010 model highway link flag. Value of 1 means link included in 2010 highway network.
Y10_In_Transit Integer (2 bytes) Year 2010 model walk link flag. Value of 1 means link included in 2010 transit network.
Y10_In_Walk Integer (2 bytes) Year 2010 model transit link flag. Value of 1 means link available to walk in 2010.
Y10_Fac_Type Integer (4 bytes) Year 2010 functional class
Y10_Posted_Speed Real (8 bytes) Year 2010 posted speed in MPH
Y10_MedTyp Integer (2 bytes) Year 2010 median type (value= 1 for no median; 2 for raised-curved median; 3 for landscaped; 4 for left turn lane)
Y10_Facility_Type_Text Character Year 2010 functional class name
Y10_AB_LANES Integer (4 bytes) Year 2010 AB lanes
Y10_BA_LANES Integer (4 bytes) Year 2010 BA lanes
Y10_AB_LANE_WI Integer (4 bytes) Year 2010 AB lane width in feet
Y10_BA_LANE_WI Integer (4 bytes) Year 2010 BA lane width in feet

Memphis MPO Model Update
7-2 Cambridge Systematics, Inc.
Y10_AB_SHOULD Integer (4 bytes) Year 2010 BA shoulder width in feet
Y10_BA_SHOULD Integer (4 bytes) Year 2010 AB shoulder width in feet
Y10_AB_PARKING Integer (4 bytes) Year 2010 parking in AB direction
Y10_BA_PARKING Integer (4 bytes) Year 2010 parking in BA direction
Y10_AB_BIKE_LA Integer (4 bytes) Year 2010 bike lanes in AB direction
Y10_BA_BIKE_LA Integer (4 bytes) Year 2010 bike lanes in BA direction
Y10_Heav_Rest Integer (2 bytes) Year 2010 heavy residential area flag
Y11_Heav_Rest Integer (4 bytes) Year 2011 heavy residential area flag
Y14_Heav_Rest Integer (4 bytes) Year 2014 heavy residential area flag
Y17_Heav_Rest Integer (4 bytes) Year 2017 heavy residential area flag
Y20_Heav_Rest Integer (4 bytes) Year 2020 heavy residential area flag
Y21_Heav_Rest Integer (4 bytes) Year 2021 heavy residential area flag
Y30_Heav_Rest Integer (4 bytes) Year 2030 heavy residential area flag
Y40_Heav_Rest Integer (4 bytes) Year 2040 heavy residential area flag
Y10_SigDens Integer (2 bytes) Year 2010 signal per mile
Y11_SigDens Integer (2 bytes) Year 2011 signal per mile
Y14_SigDens Integer (2 bytes) Year 2014 signal per mile
Y17_SigDens Integer (2 bytes) Year 2017 signal per mile
Y20_SigDens Integer (2 bytes) Year 2020 signal per mile
Y21_SigDens Integer (2 bytes) Year 2021 signal per mile
Y30_SigDens Integer (2 bytes) Year 2030 signal per mile
Y40_SigDens Integer (2 bytes) Year 2040 signal per mile
Y10_SigCoord Integer (2 bytes) Year 2010 signal coordination falg
Y11_SigCoord Integer (2 bytes) Year 2011 signal coordination flag
Y14_SigCoord Integer (2 bytes) Year 2014 signal coordination flag
Y17_SigCoord Integer (2 bytes) Year 2017 signal coordination flag
Y20_SigCoord Integer (2 bytes) Year 2020 signal coordination flag
Y21_SigCoord Integer (2 bytes) Year 2021 signal coordination flag
Y30_SigCoord Integer (2 bytes) Year 2030 signal coordination flag
Y40_SigCoord Integer (2 bytes) Year 2040 signal coordination flag
Y10_HOV Integer (2 bytes) Year 2010 HOV flag
Y11_HOV Integer (2 bytes) Year 2011 HOV flag
Y14_HOV Integer (2 bytes) Year 2014 HOV flag
Y17_HOV Integer (2 bytes) Year 2017 HOV flag
Y20_HOV Integer (2 bytes) Year 2020 HOV flag
Y21_HOV Integer (2 bytes) Year 2021 HOV flag
Y30_HOV Integer (2 bytes) Year 2030 HOV flag
Y40_HOV Integer (2 bytes) Year 2040 HOV flag
Y10_RampType Integer (2 bytes) Year 2010 ramp type
Y11_RampType Integer (2 bytes) Year 2011 ramp type
Memphis MPO Model Update
Cambridge Systematics, Inc. 7-3
Y14_RampType Integer (2 bytes) Year 2014 ramp type
Y17_RampType Integer (2 bytes) Year 2017 ramp type
Y20_RampType Integer (2 bytes) Year 2020 ramp type
Y21_RampType Integer (2 bytes) Year 2021 ramp type
Y30_RampType Integer (2 bytes) Year 2030 ramp type
Y40_RampType Integer (2 bytes) Year 2040 ramp type
TPenalty_Type Integer (2 bytes) Year 2010 turn penalty type
HOV_LINKID Integer (4 bytes) HOV link ID
District Integer (2 bytes) District in which the link exists
Screen_Line_ID Integer (2 bytes) Screen line ID
Cut_Line_ID Integer (2 bytes) Cutline ID
Count_AM Real (8 bytes) Count in AM
Count_MD Real (8 bytes) Count in MD
Count_PM Real (8 bytes) Count in PM
Count_OP Real (8 bytes) Count in OP
Count_ADT Real (4 bytes) Average daily traffic count
Count_Auto Real (4 bytes) Daily auto count
Count_SU Real (4 bytes) Daily multi-unit truck count
Count_CU Real (4 bytes) Daily single-unit truck count
SigDens_Group Character Signal density group
Sel_Tag Integer (2 bytes) Flag to indicate model link ( value of 1 means included in both transit and highway network)
WalkTime Real (8 bytes) Year 20alkTime residential area flag
Mode Integer (4 bytes) Transit mode
Alpha Real (8 bytes) Volume-delay function constant
Beta Real (8 bytes) Volume-delay function constant
CpFc Real (8 bytes) Capacity factor
LOS_C Real (8 bytes) Level of service C capacity
LOS_D Real (8 bytes) Level of service D capacity
LOS_E Real (8 bytes) Level of service E capacity
AB_FF_HwyT Real (4 bytes) Free-flow highway time in AB direction
BA_FF_HwyT Real (4 bytes) Free-flow highway time in BA direction
AB_FF_IVTT Real (4 bytes) Free-flow in-vehicle travel time in AB direction
BA_FF_IVTT Real (4 bytes) Free-flow in-vehicle travel time in BA direction
Memphis MPO Model Update
7-4 Cambridge Systematics, Inc.
AB_AM_IVTT Real (4 bytes) In-vehicle travel time in AM along AB direction
BA_AM_IVTT Real (4 bytes) In-vehicle travel time in AM along BA direction
AB_MD_IVTT Real (4 bytes) In-vehicle travel time in MD along AB direction
BA_MD_IVTT Real (4 bytes) In-vehicle travel time in MD along BA direction
AB_PM_IVTT Real (4 bytes) In-vehicle travel time in PM along AB direction
BA_PM_IVTT Real (4 bytes) In-vehicle travel time in PM along BA direction
AB_OP_IVTT Real (4 bytes) In-vehicle travel time in OP along AB direction
BA_OP_IVTT Real (4 bytes) In-vehicle travel time in OP along BA direction
AB_AM_HwyT Real (4 bytes) Congested highway travel time in AM along AB
BA_AM_HwyT Real (4 bytes) Congested highway travel time in AM along BA
AB_MD_HwyT Real (4 bytes) Congested highway travel time in MD along AB
BA_MD_HwyT Real (4 bytes) Congested highway travel time in MD along BA
AB_PM_HwyT Real (4 bytes) Congested highway travel time in PM along AB
BA_PM_HwyT Real (4 bytes) Congested highway travel time in PM along BA
AB_OP_HwyT Real (4 bytes) Congested highway travel time in OP along AB
BA_OP_HwyT Real (4 bytes) Congested highway travel time in OP along BA
AB_FF_Speed Real (4 bytes) Free-flow speed along AB
BA_FF_Speed Real (4 bytes) Free-flow speed along BA
AB_FF_Transit_Speed Real (4 bytes) Free-flow transit speed along AB
BA_FF_Transit_Speed Real (4 bytes) Free-flow transit speed along BA
AB_AM_MSAFlow Real (4 bytes) Highway Assignment MSA flow in AM along AB
BA_AM_MSAFlow Real (4 bytes) Highway Assignment MSA flow in AM along BA
Memphis MPO Model Update
Cambridge Systematics, Inc. 7-5
AB_MD_MSAFlow Real (4 bytes) Highway Assignment MSA flow in MD along AB
BA_MD_MSAFlow Real (4 bytes) Highway Assignment MSA flow in MD along BA
AB_PM_MSAFlow Real (4 bytes) Highway Assignment MSA flow in PM along AB
BA_PM_MSAFlow Real (4 bytes) Highway Assignment MSA flow in PM along BA
AB_OP_MSAFlow Real (4 bytes) Highway Assignment MSA flow in OP along AB
BA_OP_MSAFlow Real (4 bytes) Highway Assignment MSA flow in OP along BA
DAILY_MSA_TOTAL Real (4 bytes) Highway Assignment daily MSA flow along BA
AB_AM_Speed Real (4 bytes) Speed in AM along AB
BA_AM_Speed Real (4 bytes) Speed in AM along BA
AB_MD_Speed Real (4 bytes) Speed in MD along AB
BA_MD_Speed Real (4 bytes) Speed in MD along BA
AB_PM_Speed Real (4 bytes) Speed in PM along AB
BA_PM_Speed Real (4 bytes) Speed in PM along BA
AB_OP_Speed Real (4 bytes) Speed in OP along AB
BA_OP_Speed Real (4 bytes) Speed in OP along BA
AB_AM_Transit_Speed Real (4 bytes) Transit speed in AM along AB
BA_AM_Transit_Speed Real (4 bytes) Transit speed in AM along BA
AB_MD_Transit_Speed Real (4 bytes) Transit speed in MD along AB
BA_MD_Transit_Speed Real (4 bytes) Transit speed in MD along BA
AB_PM_Transit_Speed Real (4 bytes) Transit speed in PM along AB
BA_PM_Transit_Speed Real (4 bytes) Transit speed in PM along BA
AB_OP_Transit_Speed Real (4 bytes) Transit speed in OP along AB
BA_OP_Transit_Speed Real (4 bytes) Transit speed in OP along BA
AM_TOTAL Real (4 bytes) Total assigned flow in AM
AM_AUTO Real (4 bytes) Total assigned auto flow in AM
AM_SU Real (4 bytes) Total assigned single-unit truck flow in AM
AM_CU Real (4 bytes) Total assigned multi-unit truck flow in AM
MD_TOTAL Real (4 bytes) Total assigned flow in MD
MD_AUTO Real (4 bytes) Total assigned auto flow in MD
MD_SU Real (4 bytes) Total assigned single-unit truck flow in MD

Memphis MPO Model Update
7-6 Cambridge Systematics, Inc.
MD_CU Real (4 bytes) Total assigned multi-unit truck flow in MD
PM_TOTAL Real (4 bytes) Total assigned flow in PM
PM_AUTO Real (4 bytes) Total assigned auto flow in PM
PM_SU Real (4 bytes) Total assigned single-unit truck flow in PM
PM_CU Real (4 bytes) Total assigned multi-unit truck flow in PM
OP_TOTAL Real (4 bytes) Total assigned flow in OP
OP_AUTO Real (4 bytes) Total assigned auto flow in OP
OP_SU Real (4 bytes) Total assigned single-unit truck flow in OP
OP_CU Real (4 bytes) Total assigned multi-unit truck flow in OP
DAILY_TOTAL Integer (4 bytes) Total daily assigned flow
AB_Daily_Total Integer (4 bytes) Daily assigned flow in AB
BA_Daily_Total Integer (4 bytes) Daily assigned flow in BA
DAILY_AUTO Real (8 bytes) Daily assigned auto flow
DAILY_SU Real (8 bytes) Daily assigned single-unit truck flow
DAILY_CU Real (8 bytes) Daily assigned multi-unit truck flow
AB_AM_TOTAL Real (8 bytes) Assigned total flow in AM along AB
BA_AM_TOTAL Real (8 bytes) Assigned total flow in AM along BA
AB_AM_AUTO Real (8 bytes) Assigned auto flow in AM along AB
BA_AM_AUTO Real (8 bytes) Assigned auto flow in AM along BA
AB_AM_SU Real (8 bytes) Assigned single-unit truck flow in AM along AB
BA_AM_SU Real (8 bytes) Assigned single-unit truck flow in AM along BA
AB_AM_CU Real (8 bytes) Assigned multi-unit truck flow in AM along AB
BA_AM_CU Real (8 bytes) Assigned multi-unit truck flow in AM along BA
AB_MD_TOTAL Real (8 bytes) Assigned total flow in MD along AB
BA_MD_TOTAL Real (8 bytes) Assigned total flow in MD along BA
AB_MD_AUTO Real (8 bytes) Assigned auto flow in MD along AB
BA_MD_AUTO Real (8 bytes) Assigned auto flow in MD along BA
AB_MD_SU Real (8 bytes) Assigned single-unit truck flow in MD along AB
BA_MD_SU Real (8 bytes) Assigned single-unit truck flow in MD along BA

Memphis MPO Model Update
Cambridge Systematics, Inc. 7-7
AB_MD_CU Real (8 bytes) Assigned multi-unit truck flow in MD along AB
BA_MD_CU Real (8 bytes) Assigned multi-unit truck flow in MD along BA
AB_PM_TOTAL Real (8 bytes) Assigned total flow in PM along AB
BA_PM_TOTAL Real (8 bytes) Assigned total flow in PM along BA
AB_PM_AUTO Real (8 bytes) Assigned auto flow in PM along AB
BA_PM_AUTO Real (8 bytes) Assigned auto flow in PM along BA
AB_PM_SU Real (8 bytes) Assigned single-unit truck flow in PM along AB
BA_PM_SU Real (8 bytes) Assigned single-unit truck flow in PM along BA
AB_PM_CU Real (8 bytes) Assigned multi-unit truck flow in PM along AB
BA_PM_CU Real (8 bytes) Assigned multi-unit truck flow in PM along BA
AB_OP_TOTAL Real (8 bytes) Assigned total flow in OP along AB
BA_OP_TOTAL Real (8 bytes) Assigned total flow in OP along BA
AB_OP_AUTO Real (8 bytes) Assigned auto flow in OP along AB
BA_OP_AUTO Real (8 bytes) Assigned auto flow in OP along BA
AB_OP_SU Real (8 bytes) Assigned single-unit truck flow in OP along AB
BA_OP_SU Real (8 bytes) Assigned single-unit truck flow in OP along BA
AB_OP_CU Real (8 bytes) Assigned multi-unit truck flow in OP along AB
BA_OP_CU Real (8 bytes) Assigned multi-unit truck flow in OP along BA
PRJ_ID1 Integer (4 bytes) Project ID field
PRJ_ID2 Integer (4 bytes) Project ID field
PRJ_ID3 Integer (4 bytes) Project ID field
PRJ_ID4 Integer (4 bytes) Project ID field
PRJ_ID5 Integer (4 bytes) Project ID field
PRJ_ID6 Integer (4 bytes) Project ID field
Future_OneWay Integer (4 bytes) Future oneway flag
In_Highway Integer (4 bytes) Model highway link flag. Value of 1 means link included highway network.
In_Transit Integer (4 bytes) Model walk link flag. Value of 1 means link included transit network.

Memphis MPO Model Update
7-8 Cambridge Systematics, Inc.
In_Walk Integer (4 bytes) Model transit link flag. Value of 1 means link available to walk .
Fac_Type Integer (4 bytes) Link functional class used in model
Area_Type Integer (4 bytes) Link area type used in model
AB_Speed Real (4 bytes) Link speed along AB direction
BA_Speed Real (4 bytes) Link speed along BA direction
Posted_Speed Real (8 bytes) Posted speed used in model
MedTyp Integer (2 bytes) Ramp type used in model
RampType Integer (2 bytes) Median type used in model
AB_Lanes Integer (4 bytes) Number of lanes along AB used in model
BA_Lanes Integer (4 bytes) Number of lanes along BA used in model
AB_LANE_WI Integer (4 bytes) Lane width in feet along AB used in model
BA_LANE_WI Integer (4 bytes) Lane width in feet along BA used in model
AB_SHOULD Integer (4 bytes) Shoulder width in feet along AB used in model
BA_SHOULD Integer (4 bytes) Shoulder width in feet along BA used in model
AB_Parking Integer (4 bytes) Parking in AB direction used in model
BA_Parking Integer (4 bytes) Parking in BA direction used in model
Heav_Rest Integer (4 bytes) Heavy residential flag used in model
SigDens Integer (4 bytes) Signal density used in model
SigCoord Integer (4 bytes) Signal coordination flag used in model
HOV Integer (2 bytes) HOV flag used in model
Capa_ADT_A Integer (4 bytes) Daily link capacity at level of service A
Capa_ADT_B Integer (4 bytes) Daily link capacity at level of service B
Capa_ADT_C Integer (4 bytes) Daily link capacity at level of service C
Capa_ADT_D Integer (4 bytes) Daily link capacity at level of service E
Capa_ADT_E Integer (4 bytes) Daily link capacity at level of service D
Vol_ADT Integer (4 bytes) Daily volume
VoC_ADT Real (8 bytes) Daily volume to capacity ratio
LOS_ADT Character Daily level of service
Vol_AM Integer (4 bytes) AM volume
VoC_AM Real (8 bytes) AM volume to capacity ratio
LOS_AM Character AM level of service
CSpeed_AM Integer (4 bytes) Congested speed in AM
Capa_AM_A Integer (4 bytes) AM link capacity at level of service A

Memphis MPO Model Update
Cambridge Systematics, Inc. 7-9
Capa_AM_B Integer (4 bytes) AM link capacity at level of service B
Capa_AM_C Integer (4 bytes) AM link capacity at level of service C
Capa_AM_D Integer (4 bytes) AM link capacity at level of service E
Capa_AM_E Integer (4 bytes) AM link capacity at level of service D
Vol_PM Integer (4 bytes) PM volume
VoC_PM Real (8 bytes) PM volume to capacity ratio
LOS_PM Character PM level of service
CSpeed_PM Integer (4 bytes) Congested speed in PM
Capa_PM_A Integer (4 bytes) PM link capacity at level of service A
Capa_PM_B Integer (4 bytes) PM link capacity at level of service B
Capa_PM_C Integer (4 bytes) PM link capacity at level of service C
Capa_PM_D Integer (4 bytes) PM link capacity at level of service E
Capa_PM_E Integer (4 bytes) PM link capacity at level of service D
Vol_Peak Integer (4 bytes) Peak volume
Voc_Peak Real (8 bytes) Peak volume to capacity ratio
LOS_Peak Character Peak level of service
CSpeed_Peak Integer (4 bytes) Congested speed in Peak
Capa_Peak_A Integer (4 bytes) Peak link capacity at level of service A
Capa_Peak_B Integer (4 bytes) Peak link capacity at level of service B
Capa_Peak_C Integer (4 bytes) Peak link capacity at level of service C
Capa_Peak_D Integer (4 bytes) Peak link capacity at level of service E
Capa_Peak_E Integer (4 bytes) Peak link capacity at level of service D
In_MPO_Study_Area Integer (2 bytes) Flag to highlight MPO stady area. Value of 1 for links in MPO study area.
AB_AM_CongTime Real (8 bytes) AM congested travel time along AB
BA_AM_CongTime Real (8 bytes) AM congested travel time along BA
AB_MD_CongTime Real (8 bytes) MD congested travel time along AB
BA_MD_CongTime Real (8 bytes) MD congested travel time along BA
AB_PM_CongTime Real (8 bytes) PM congested travel time along AB
BA_PM_CongTime Real (8 bytes) PM congested travel time along BA
AB_OP_CongTime Real (8 bytes) OP congested travel time along AB
BA_OP_CongTime Real (8 bytes) OP congested travel time along BA
AB_AM_CongSpeed Real (8 bytes) AM congested travel speed along AB
BA_AM_CongSpeed Real (8 bytes) AM congested travel speed along BA
AB_MD_CongSpeed Real (8 bytes) MD congested travel speed along AB
BA_MD_CongSpeed Real (8 bytes) MD congested travel speed along BA
AB_PM_CongSpeed Real (8 bytes) PM congested travel speed along AB
BA_PM_CongSpeed Real (8 bytes) PM congested travel speed along BA
AB_OP_CongSpeed Real (8 bytes) OP congested travel speed along AB
BA_OP_CongSpeed Real (8 bytes) OP congested travel speed along BA

Memphis MPO Model Update
7-10 Cambridge Systematics, Inc.
7.2 TRANSIT NETWORK ATTRIBUTES Transit network consists of transit route layer and the stop layer. Table 7-2 and Table 7-3 show the attributes of route layer and stop layer respectively.
Table 7-2 Transit Route Attributes
Route Attribute Field Data Type Description
Route_ID Integer Route ID
Route_Name Character Route name
Disabled Integer Flag to disable transit route. Value of 1 flags the disabled route.
BORNYEAR Integer Born year of route
RETIREYEAR Integer Retire year of route
Line_ID Integer Line ID
LineName Character Line name
Corridor_ID Integer Corridor ID
CorridorName Character Corridor name
Group_ID Integer Group ID
GroupName Character Group name
Mode Integer Mode ID
AM_Headway Integer AM headway
MD_Headway Integer MD headway
PM_Headway Integer PM headway
OP_Headway Integer OP headway
FareMatrixIndex Integer Fair matrix index
AM_DwellTime Real Number AM dwelltime
MD_DwellTime Real Number MD dwelltime
PM_DwellTime Real Number PM dwelltime
OP_DwellTime Real Number OP dwelltime
IVTT_Weight Real Number IVTT weight
Table 7-3 Transit Stop Attributes
Stop Attribute Field Data Type Description
ID Integer (4 bytes) Stop ID
Route_ID Integer (4 bytes) Route ID
NodeID Integer (4 bytes) Nearest highway node ID
District Integer (4 bytes) District

Memphis MPO Model Update
Cambridge Systematics, Inc. 7-11
Zone Integer (4 bytes) Zone
Route_Name Character Route name
Stop_Name Character Stop name
Fare_Zone Integer (4 bytes) Fare zone
Mode Integer (4 bytes) Mode
Mode Description Character Mode description
AM_Service Integer (4 bytes) AM service flag
MD_Service Integer (4 bytes) MD service flag
PM_Service Integer (4 bytes) PM service flag
OP_Service Integer (4 bytes) OP service flag
7.3 TAZ BOUNDARY ATTRIBUTES The attributes of TAZ boundary file are shown in Table 7-4.
Table 7-4 TAZ Attributes
TAZ Attribute Field Data Type Description
ID Integer (4 bytes) TAZ ID
Area Real (8 bytes) TAZ area in square mile
State Character TAZ state
County Character TAZ county
Percent_Within_15minutes Real (8 bytes) Percent of total TAZ employment within 15 minutes of travel
Pop Integer (4 bytes) TAZ population
HH Integer (4 bytes) Total HH in TAZ
Total_Emp Integer (4 bytes) Total employment in TAZ
Retail Integer (4 bytes) Retail employment in TAZ
Indust_MFG Integer (4 bytes) Industrial and manufacturing employment in TAZ
Wholesale Integer (4 bytes) Wholesale employment in TAZ
Service Integer (4 bytes) Service employment in TAZ
Office Integer (4 bytes) Office employment in TAZ
Government Integer (4 bytes) Government employment in TAZ
School_Enrollment Integer (4 bytes) School enrollment in TAZ
University_Enrollment Integer (4 bytes) University enrollment
Special_FedEx Integer (4 bytes) Special trip generation by FedEx
Special_Graceland Integer (4 bytes) Special trip generation by Graceland
Special_Airport Integer (4 bytes) Special trip generation by Airport
Base_AreaType Integer (2 bytes) TAZ area type in base year

Memphis MPO Model Update
7-12 Cambridge Systematics, Inc.
District Integer (2 bytes) TAZ district
District_Name Character TAZ district name
CBDUrban Integer (4 bytes) CBD flag
TerminalTime Integer (4 bytes) Terminal time
Transit_Fare_Zone Integer (4 bytes) Fare zone
CTY_FIPS_Code Integer (4 bytes) County FIPS
COUNTY_Name Character County name
Zone_Type Character Zone type
PopDensity Real (8 bytes) Population per square mile
EmpDensity Real (8 bytes) Employment per square mile
AreaType Integer (2 bytes) Area type
JTW_Inc1_p Real (8 bytes) Journey to work trip production for income group 1
JTW_Inc2_p Real (8 bytes) Journey to work trip production for income group 2
JTW_Inc3_p Real (8 bytes) Journey to work trip production for income group 3
JTW_Inc4_p Real (8 bytes) Journey to work trip production for income group 4
JTW_a Real (8 bytes) Journey to work trip attraction
HBSch_Inc1_p Real (8 bytes) Home-based school trip production for income group 1
HBSch_Inc2_p Real (8 bytes) Home-based school trip production for income group 2
HBSch_Inc3_p Real (8 bytes) Home-based school trip production for income group 3
HBSch_Inc4_p Real (8 bytes) Home-based school trip production for income group 4
HBSch_a Real (8 bytes) Home-based school trip attraction
HBUniv_Inc1_p Real (8 bytes) Home-based university trip production for income group 1
HBUniv_Inc2_p Real (8 bytes) Home-based university trip production for income group 2
HBUniv_Inc3_p Real (8 bytes) Home-based university trip production for income group 3
HBUniv_Inc4_p Real (8 bytes) Home-based university trip production for income group 4
HBUniv_a Real (8 bytes) Home-based university trip attraction
HBSh_Inc1_p Real (8 bytes) Home-based shopping trip production for income group 1

Memphis MPO Model Update
Cambridge Systematics, Inc. 7-13
HBSh_Inc2_p Real (8 bytes) Home-based shopping trip production for income group 2
HBSh_Inc3_p Real (8 bytes) Home-based shopping trip production for income group 3
HBSh_Inc4_p Real (8 bytes) Home-based shopping trip production for income group 4
HBSh_a Real (8 bytes) Home-based shopping trip attraction
HBpudo_Inc1_p Real (8 bytes) Home-based pick/drop trip production for income group 1
HBpudo_Inc2_p Real (8 bytes) Home-based pick/drop trip production for income group 2
HBpudo_Inc3_p Real (8 bytes) Home-based pick/drop trip production for income group 3
HBpudo_Inc4_p Real (8 bytes) Home-based pick/drop trip production for income group 4
HBpudo_a Real (8 bytes) Home-based pick/drop trip attraction
HBSR_Inc1_p Real (8 bytes) Home-based social/recreation trip production for income group 1
HBSR_Inc2_p Real (8 bytes) Home-based social/recreation trip production for income group 2
HBSR_Inc3_p Real (8 bytes) Home-based social/recreation trip production for income group 3
HBSR_Inc4_p Real (8 bytes) Home-based social/recreation trip production for income group 4
HBSR_a Real (8 bytes) Home-based social/recreation trip attraction
HBO_Inc1_p Real (8 bytes) Home-based other trip production for income group 1
HBO_Inc2_p Real (8 bytes) Home-based other trip production for income group 2
HBO_Inc3_p Real (8 bytes) Home-based other trip production for income group 3
HBO_Inc4_p Real (8 bytes) Home-based other trip production for income group 4
HBO_a Real (8 bytes) Home-based other trip attraction
NHBWork_Inc1_p Real (8 bytes) non-home-based work trip production for income group 1
NHBWork_Inc2_p Real (8 bytes) non-home-based work trip production for income group 2

Memphis MPO Model Update
7-14 Cambridge Systematics, Inc.
NHBWork_Inc3_p Real (8 bytes) non-home-based work trip production for income group 3
NHBWork_Inc4_p Real (8 bytes) non-home-based work trip production for income group 4
NHBWork_a Real (8 bytes) non-home-based work trip attraction
NHBNonWork_Inc1_p Real (8 bytes) non-home-based non-work trip production for income group 1
NHBNonWork_Inc2_p Real (8 bytes) non-home-based non-work trip production for income group 2
NHBNonWork_Inc3_p Real (8 bytes) non-home-based non-work trip production for income group 3
NHBNonWork_Inc4_p Real (8 bytes) non-home-based non-work trip production for income group 4
NHBNonWork_a Real (8 bytes) non-home-based non-work trip attraction