Embed Size (px)
Citation preview

MEDUSA MINING LIMITED ABN 60 099 377 849
Consolidated Entity
ASX APPENDIX 4E AND ANNUAL FINANCIAL REPORT
FOR THE YEAR ENDED 30 JUNE 2014

APPENDIX 4 E
Page 2 of 62
Appendix 4E
Preliminary final report Period ending 30 June 2014
Name of entity
MEDUSA MINING LIMITED
ABN or equivalent company reference
Half yearly (tick)
Preliminary final (tick)
Half year/ financial ended (“current period”)
60 099 377 849 √ 30 June 2014 Results for announcement to the market
Revenues and profits: US$’000 US$’000
Revenues from ordinary activities down 16% 100,680 to 84,196
Profit from ordinary activities after tax attributable to members down 38% 50,181 to 30,871
Net profit for the period attributable to members down 38% 50,181 to 30,871
(All comparisons to the previous period ended 30 June 2013)
Dividends: Amount per security Franked amount per security
Interim dividend Nil N/A
Final dividend Nil N/A
Total dividend paid for the year Nil N/A No dividends were declared and paid for period ended 30 June 2013.
Net tangible assets per share:
The net tangible assets per share as at 30 June 2014 was US$2.055 (30 June 2013: US$1.893)
Change in control of entities:
There has been no change in control, either gained or loss during the current period.
Associates and Joint Venture entities:
The Consolidated Group did not have a holding in any associates or joint venture entities during the current period.
Other information:
This report is based on accounts which are audited.
Except for matters noted above, all disclosure requirements pursuant to ASX Listing Rule 4.3A are contained within the Company’s consolidated financial statements for the year ended 30 June 2014 which accompany this report.
DIRECTOR’S REPORT
Page 3 of 62
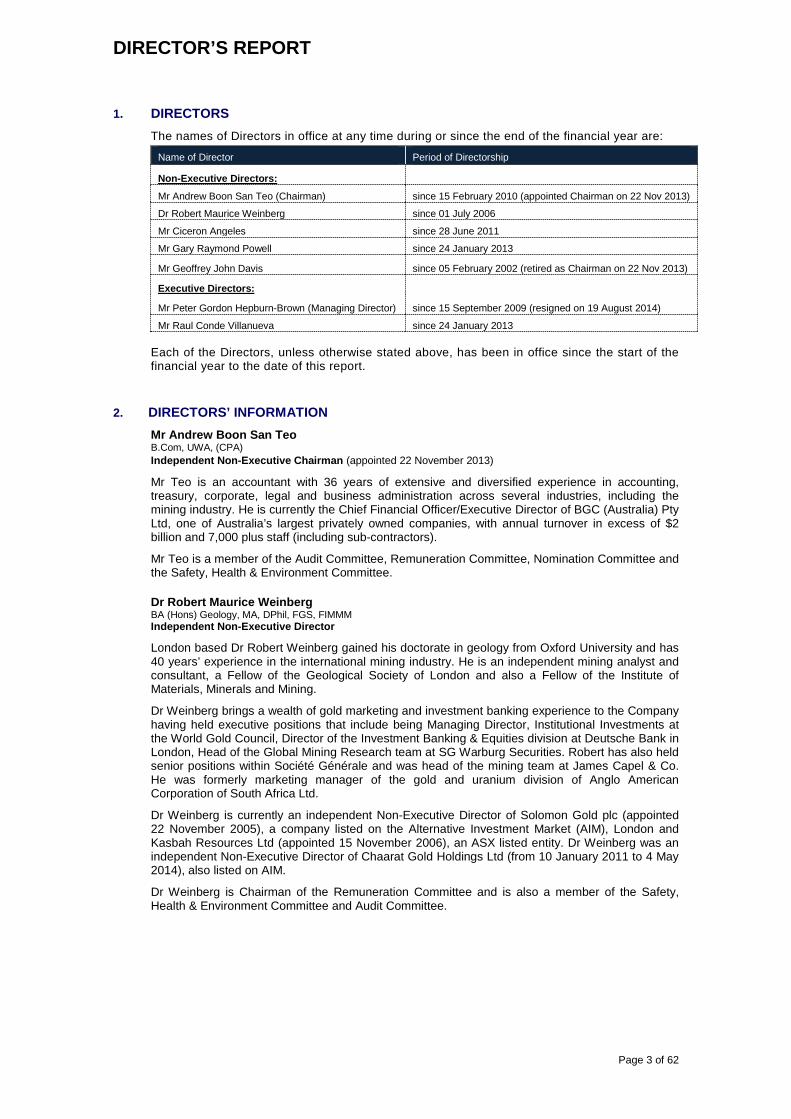
1. DIRECTORS The names of Directors in office at any time during or since the end of the financial year are:
Name of Director Period of Directorship
Non-Executive Directors:
Mr Andrew Boon San Teo (Chairman) since 15 February 2010 (appointed Chairman on 22 Nov 2013)
Dr Robert Maurice Weinberg since 01 July 2006
Mr Ciceron Angeles since 28 June 2011
Mr Gary Raymond Powell since 24 January 2013
Mr Geoffrey John Davis since 05 February 2002 (retired as Chairman on 22 Nov 2013)
Executive Directors:
Mr Peter Gordon Hepburn-Brown (Managing Director) since 15 September 2009 (resigned on 19 August 2014)
Mr Raul Conde Villanueva since 24 January 2013
Each of the Directors, unless otherwise stated above, has been in office since the start of the financial year to the date of this report.
2. DIRECTORS’ INFORMATION Mr Andrew Boon San Teo B.Com, UWA, (CPA) Independent Non-Executive Chairman (appointed 22 November 2013)
Mr Teo is an accountant with 36 years of extensive and diversified experience in accounting, treasury, corporate, legal and business administration across several industries, including the mining industry. He is currently the Chief Financial Officer/Executive Director of BGC (Australia) Pty Ltd, one of Australia’s largest privately owned companies, with annual turnover in excess of $2 billion and 7,000 plus staff (including sub-contractors).
Mr Teo is a member of the Audit Committee, Remuneration Committee, Nomination Committee and the Safety, Health & Environment Committee.
Dr Robert Maurice Weinberg BA (Hons) Geology, MA, DPhil, FGS, FIMMM Independent Non-Executive Director
London based Dr Robert Weinberg gained his doctorate in geology from Oxford University and has 40 years’ experience in the international mining industry. He is an independent mining analyst and consultant, a Fellow of the Geological Society of London and also a Fellow of the Institute of Materials, Minerals and Mining.
Dr Weinberg brings a wealth of gold marketing and investment banking experience to the Company having held executive positions that include being Managing Director, Institutional Investments at the World Gold Council, Director of the Investment Banking & Equities division at Deutsche Bank in London, Head of the Global Mining Research team at SG Warburg Securities. Robert has also held senior positions within Société Générale and was head of the mining team at James Capel & Co. He was formerly marketing manager of the gold and uranium division of Anglo American Corporation of South Africa Ltd.
Dr Weinberg is currently an independent Non-Executive Director of Solomon Gold plc (appointed 22 November 2005), a company listed on the Alternative Investment Market (AIM), London and Kasbah Resources Ltd (appointed 15 November 2006), an ASX listed entity. Dr Weinberg was an independent Non-Executive Director of Chaarat Gold Holdings Ltd (from 10 January 2011 to 4 May 2014), also listed on AIM.
Dr Weinberg is Chairman of the Remuneration Committee and is also a member of the Safety, Health & Environment Committee and Audit Committee.

DIRECTOR’S REPORT
Page 4 of 62
Mr Ciceron Angeles B.Sc (Geology), MAppSc (Mineral Exploration), FAusIMM (CP), FSEG. Independent Non-Executive Director
Philippines based, Mr Angeles is a geologist with 37 years of experience in gold and base metal exploration in Asia, mainly Philippines, Indonesia, China, Malaysia and Iran. His specialisations include epithermal gold-silver, porphyry copper-gold and Carlin styles of mineralisation.
Mr Angeles obtained his MAppSc in Mineral Exploration from the University of New South Wales, Australia in 1985 and is a Fellow and accredited Chartered Professional (CP) in the discipline of geology of the Australasian Institute of Mining and Metallurgy (AusIMM) and a Fellow of the Society of Economic Geologists. He was also the Asia Exploration Manager for Newcrest Mining during which time Newcrest brought the Gosowong Gold Mine into production.
Mr Angeles was the Technical Director of GGG Resources plc, a company listed on the ASX in Australia and AIM in London, from 3 September 2009 until his resignation on 15 March 2012.
Mr Angeles is Chairman of the Nomination Committee.
Mr Gary Raymond Powell B.App.Sc. (Geology) Member, Australian Institute of Geoscientists Member, Australasian Institute of Mining & Metallurgy Independent Non-Executive Director
Mr Gary Powell was appointed Non-executive Director on 24 January 2013 and brings Philippines operating experience to the Board. Mr Powell is a geologist with 31 years of experience working in Australia, Central Asia and importantly, since 1997, the Philippines.
Mr Powell has worked for major and junior companies as an employee and on a consulting basis. He was a founding and Managing Director of ASX listed Egerton Gold NL from 1993 to 2000, and more recently a founding, Non-Executive and then Executive Director from 2004 to 2009 of Metals Exploration plc listed on the Alternative Investment Market (AIM) in the United Kingdom. In his role with Metals Exploration plc, Mr Powell managed the progressing of the Runruno Gold Deposit in the Philippines to the drilled up resource stage (and which is now in construction with forecast production in 2015).
Mr Powell has been overseeing the resource definition at the Company’s Co-O Mine and Bananghilig Project and continues to consult to the Company as required.
Mr Powell was appointed as the Chairman of the Audit Committee on 26 February 2014.
Mr Geoffrey John Davis M.Sc., Mining and Exploration Geology, B. Sc (Hons), Geology, Member, Australian Institute of Geoscientists. Non-Executive Chairman Retired 22 November 2013
Mr Davis worked initially with BHP for 10 years following his graduation in 1972, before becoming a consultant in 1980 to BHP until late 1981 and subsequently to numerous mining and exploration companies in Australia, Asia and South America. This work specialised in epithermal precious metal and porphyry copper-gold opportunities, and included project acquisition, assessment and exploration.
Since 1990, most of his work has been with junior explorers and he has been Exploration Manager to a number of these companies. From the mid 1990’s, he has also held Directorships and senior executive positions in a number of listed and unlisted Australian, Asian and London based exploration and mining companies. Mr Davis has been involved with the Philippines for 32 years and has developed a network of contacts in the mining, exploration, legal and tenement management sectors of the industry which are valuable in developing the Company’s business interests in the Philippines.
Mr Davis was Managing Director of Medusa since its inception on 5 February 2002 until he stood down and was appointed Non-Executive Chairman on 9 June 2011. Mr Davis retired from the Board, Audit Committee, Remuneration Committee and Safety, Health & Environment Committee on 22 November 2013.

DIRECTOR’S REPORT
Page 5 of 62
Mr Peter Gordon Hepburn-Brown BAppSc-Mining Engineering (1980), Grad Dip Human Resources (1996), Member of Inst of Engineers, Australia Managing Director Since Resigned 19 August 2014
Mr Peter Hepburn-Brown who was appointed Managing Director on 9 June 2011, joined the Board of Medusa on 15 September 2009, and was the Company’s Executive Director - Operations since 27 July 2010. He is a mining engineer with 36 years of experience in a wide range of mining situations, commodities and overseas jurisdictions. He has held senior management positions such as Executive Director Operations for Harmony Gold Australia, General Manager Operations for Great Central Mines, as well as other executive, operational and consulting positions.
Mr Hepburn-Brown's experience includes hands-on shaft sinking and airleg mining in narrow vein mines, experience that is well suited to the Company's current operations in the Philippines, as well as mining large open pit, disseminated ore bodies. Mr Hepburn-Brown has a proven track record and his skills and experience complement those of his fellow Board members.
Mr Hepburn-Brown was appointed an independent Non-Executive Director of MRL Corporation Limited, a company listed on the ASX in Australia, on 7 February 2014. Mr Hepburn-Brown was a Non-Executive Director of Alloy Resources Limited, an ASX listed entity, from 2 June 2004 to 30 November 2010. During the past three years, Mr Hepburn-Brown also served as a Non-executive Director of Morning Star Gold NL, an entity listed on the ASX from 18 February 2010 to 1 February 2011.
Mr Hepburn-Brown was also the Chairman of the Health & Safety and Nomination Committees and was appointed to the Remuneration Committee on 22 November 2013.
Mr Hepburn-Brown has since resigned as Managing Director and as a member of all Committees on 19 August 2014.
Mr Raul Conde Villanueva LL.B., Attorney and Counselor-at-Law Executive Director
Attorney Raul Villanueva was appointed an Executive Director of Medusa on 24 January 2013 following his appointment as President of the Company’s Philippines operating company, Philsaga Mining Corporation (“Philsaga”) in December 2012.
Attorney Villanueva who has Bachelor degrees in Economics, Military Science & Tactics, and Law has been a member of the Integrated Bar of the Philippines and an Attorney and Counselor-at-Law since 1994. He brings a focused approach to improving the operating systems and professionalism of the Company, based on his education and several years of experience in law as well as managing companies and will further align the objectives of the Medusa Group of Companies.
3. COMPANY SECRETARY Mr Peter Alphonso B.Com, UWA (CPA)
Mr Peter Alphonso was appointed Company Secretary on 11 December 2007.
Mr Alphonso’s 35 years of experience has included associations with the auditing, engineering and communications industries, with the majority of his experience centred on the gold and nickel sectors of the mining industry. Mr Alphonso’s experience has included associations with Coopers and Lybrand, Western Mining Corporation, Great Central Mines and Tiwest Joint Venture and he has also consulted to government departments on research projects.
As Company Secretary Mr Peter Alphonso is responsible for the corporate secretarial functions of the Company as well as all financial and statutory reporting of the Company and also directing and monitoring of all financial aspects of the Company’s overseas operations.
Mr Peter Alphonso was appointed Chief Financial Officer on 1 July 2013.

DIRECTOR’S REPORT
Page 6 of 62
4. MEETINGS OF DIRECTORS The number of meetings held during the financial year by Company Directors and the number of those meetings attended by each Director was:
Name of Director
Board of Directors Meetings
Audit Committee
Remuneration Committee
SHE Committee
Nomination Committee
No. of meetings(1)
No. attended
No. of meetings(1)
No. attended
No. of meetings(1)
No. attended
No. of meetings(1)
No. attended
No. of meetings(1)
No. attended
Geoffrey Davis 2 2 1 - 1 1 1 1 - -
Peter Hepburn-Brown 6 6 - - - - 3 3 1 1
Robert Weinberg 6 5 2 1 1 1 3 3 - -
Andrew Teo 6 6 2 2 1 1 3 3 1 1
Ciceron Angeles 6 5 - - - - - - 1 1
Raul Villanueva 6 6 - - - - - - - -
Gary Powell 6 6 1 1 - - - - - - (1) Number of meetings held during the time the Director held office during the year
5. PRINCIPAL ACTIVITIES The principal activities of the Group during the course of the financial year were mineral
exploration, evaluation, development and mining/production of gold. There were no significant changes in the nature of the activities of the Group during the year.
6. OPERATING RESULTS The net consolidated profit for the financial year attributable to members of Medusa Mining
Limited after provision of income tax was US$30.9 million [2013: US$50.2 million].
Key financial results:
Key Results 30 June 2014 30 June 2013 Variance (%)
Revenues US$84.2M US$100.7M (US$16.5M) 16%
EBITDA US$48.3M US$63.2M (US$14.9M) 24%
NPAT US$30.9M US$50.2M (US$19.3M) 38%
EPS (basic) US$0.154 US$0.266 (US$0.112) 42%
Dividend per share Nil Nil Nil N/A
Medusa recorded a net profit after tax (“NPAT”) of US$30.9 million and earnings before interest, tax depreciation and amortisation (“EBITDA”) of US$48.3 million for the full year to 30 June 2014, compared to US$50.2 million and US$63.2 million respectively in the previous year.
The Company recorded Revenues of US$84.2 million compared to US$100.7 million for the previous year. Medusa is an un-hedged gold producer and received an average price of US$1,299 per ounce from the sale of 65,943 ounces of gold for the year (previous year: 77,488 ounces at US$1,610 per ounce).
As at year end, the Company, had total cash and cash equivalent in gold on metal account of approximately US$13.68 million (2013: US$7.45 million).
During the year:
The Co-O Mine produced 59,904 ounces of gold for the year, at an average recovered grade of 4.76 g/t gold (2013: 62,243 ounces at average recovered grade of 7.02 g/t gold)
The average cash cost for the year of US$418 per ounce was higher than the previous year’s average cash cost of US$313 per ounce due primarily to excess mine manning levels, low mine productivity, SAG mill commissioning delays and lower than budget mill recoveries.
Depreciation of fixed assets and amortisation of capitalised mine development and mine exploration was US$17.5 million (2013: US$13.1 million);
US$15.8 million was expended on exploration activities (2013:US$24 million);
Capitalised mine development costs totalled US$36.3 million for the year (2013: US$34.5 million);
US$23.6 million was expended on capital works associated with the new mill construction and infrastructure, mine expansion and sustaining capital at the mine and mill (2013: US$44.2 million);
DIRECTOR’S REPORT
Page 7 of 62
7. REVIEW OF OPERATIONS A review and summary information concerning the Group’s operations and exploration activities for the financial year and the results of those operations are set out in the Chairman’s Review and Managing Director’s Report on Operations which will be available in the Full Annual Report.
8. DIVIDENDS No dividends were declared during the financial year.
9. SIGNIFICANT CHANGE IN STATE OF AFFAIRS Significant changes in the state of affairs of the Group during the financial year were as follows:
In the September 2013 quarter, the Company raised gross proceeds of A$34,002,702 via the placement of 18,890,390 ordinary shares at A$1.80 each to clients of Euroz Securities Limited
On 4 April 2014, application was made to the UK Listing Authority for the Securities to be removed from the Official List, and to the London Stock Exchange (“LSE”) for the Securities to be removed from trading. The last day of dealings in the Securities on the LSE was on 22 May 2014. The cancellation of the listing and of trading in the Securities on the LSE took effect on 23 May 2014.
On 22 November 2013 Mr Geoffrey Davis retired as Chairman of the Company and Mr Andrew Teo was appointed as his replacement.
In the opinion of the Directors, there were no other significant changes in the state of the affairs of the Group that occurred during the financial year.
10. EVENTS SUBSEQUENT TO BALANCE DATE Mr Hepburn-Brown resigned as Managing Director and as a member of all Committees on 19 August 2014.
Mr Geoffrey Davis agreed to assume the role of Chief Executive Officer for an interim period following the resignation of Peter Hepburn-Brown as Managing Director, and will officially commence his role on 1 September 2014.
There has not arisen in the interval between the end of the financial year and the date of this report any item, transaction or event of a material and/or unusual nature likely, in the opinion of the Directors of the Company, to affect significantly the operations of the Group, the results of those operations, or the state of affairs of the Group in subsequent financial years.
11. FUTURE DEVELOPMENTS, BUSINESS STRATEGIES AND PROSPECTS The Group will continue its policy of organic growth within its land-holdings in the Philippines
and test attractive mineral properties with a view to developing properties capable of economic mineral production.
In the opinion of the Directors, disclosure of any further information about likely developments in the Group’s operations in future financial years and the expected results of those operations, and the Group’s business strategies and prospects for future years, would be likely to result in unreasonable prejudice to the Group.
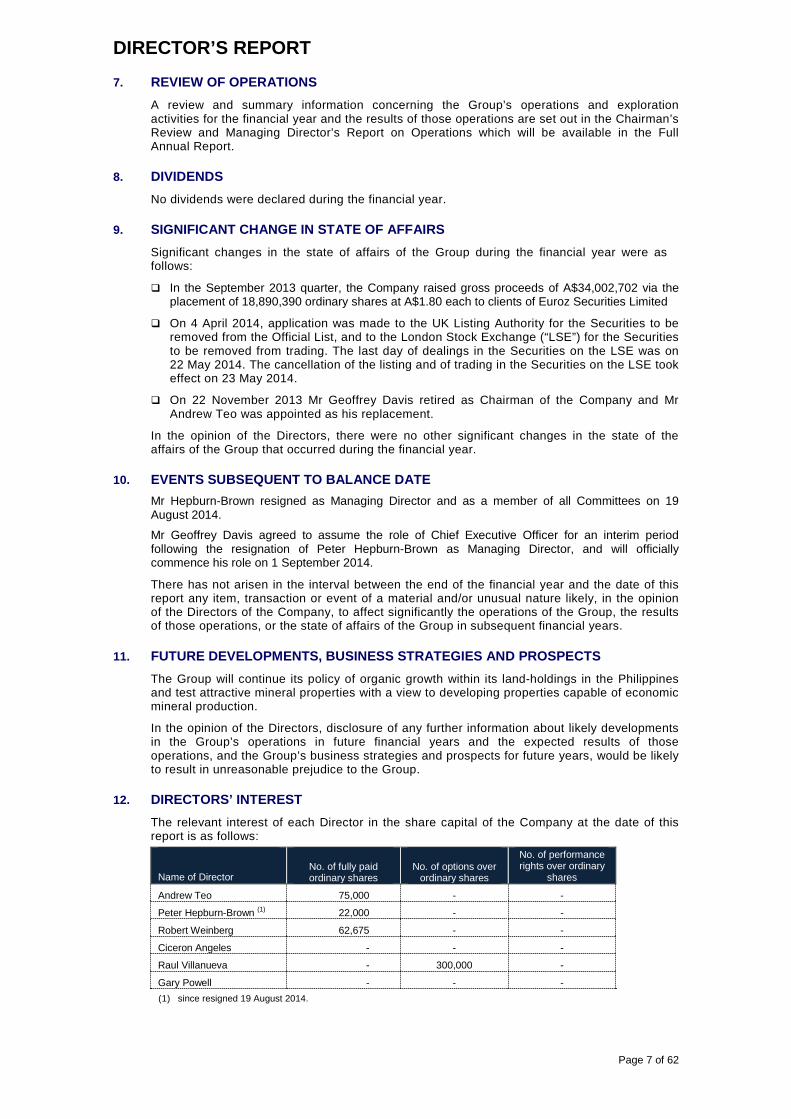
12. DIRECTORS’ INTEREST The relevant interest of each Director in the share capital of the Company at the date of this
report is as follows:
Name of Director No. of fully paid ordinary shares
No. of options over ordinary shares
No. of performance rights over ordinary
shares
Andrew Teo 75,000 - -
Peter Hepburn-Brown (1) 22,000 - -
Robert Weinberg 62,675 - -
Ciceron Angeles - - -
Raul Villanueva - 300,000 -
Gary Powell - - - (1) since resigned 19 August 2014.
DIRECTOR’S REPORT
Page 8 of 62
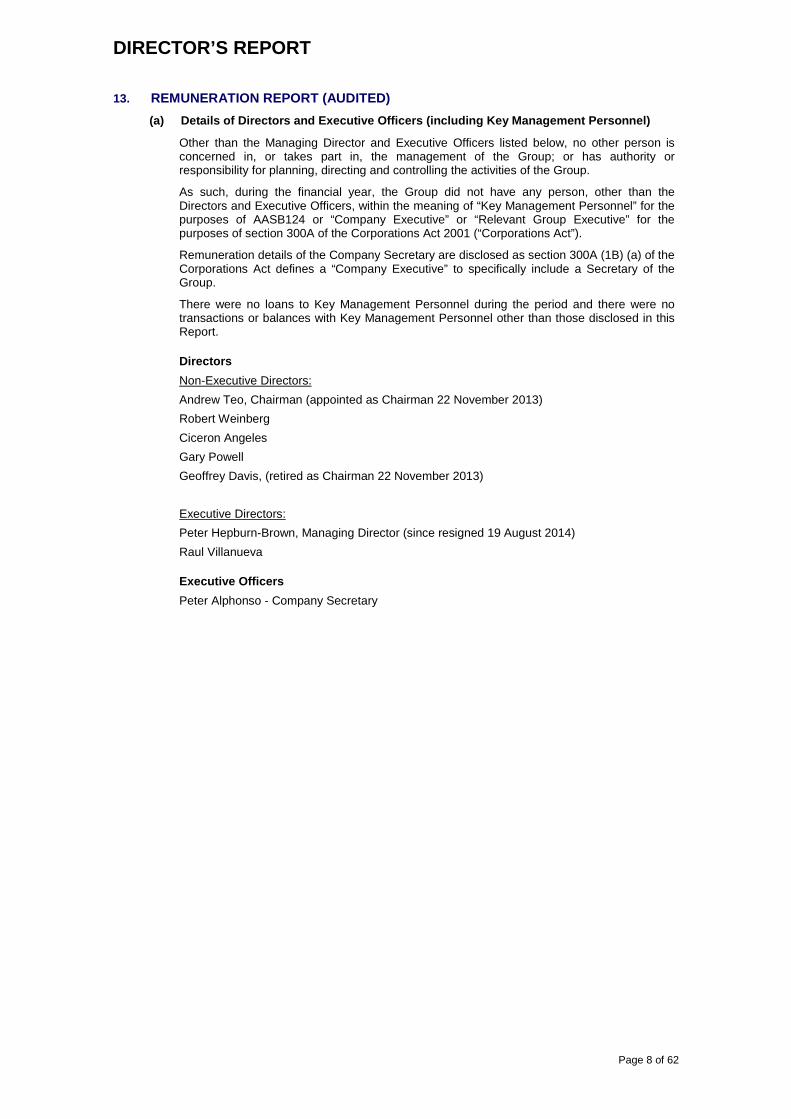
13. REMUNERATION REPORT (AUDITED) (a) Details of Directors and Executive Officers (including Key Management Personnel)
Other than the Managing Director and Executive Officers listed below, no other person is concerned in, or takes part in, the management of the Group; or has authority or responsibility for planning, directing and controlling the activities of the Group.
As such, during the financial year, the Group did not have any person, other than the Directors and Executive Officers, within the meaning of “Key Management Personnel” for the purposes of AASB124 or “Company Executive” or “Relevant Group Executive” for the purposes of section 300A of the Corporations Act 2001 (“Corporations Act”).
Remuneration details of the Company Secretary are disclosed as section 300A (1B) (a) of the Corporations Act defines a “Company Executive” to specifically include a Secretary of the Group.
There were no loans to Key Management Personnel during the period and there were no transactions or balances with Key Management Personnel other than those disclosed in this Report.
Directors Non-Executive Directors: Andrew Teo, Chairman (appointed as Chairman 22 November 2013) Robert Weinberg Ciceron Angeles Gary Powell Geoffrey Davis, (retired as Chairman 22 November 2013)
Executive Directors: Peter Hepburn-Brown, Managing Director (since resigned 19 August 2014) Raul Villanueva
Executive Officers Peter Alphonso - Company Secretary

DIRECTORS’ REPORT
Page 9 of 62
(b) Directors’ and Executives’ remuneration (Company and consolidated) The following tables provides the details of the remuneration of all Directors and Executives of the Group and the nature and amount of the elements of their remuneration (in US$’s) for the year ended 30 June 2014 and the previous financial year.
Short term benefits
Post-employment benefits Long-term benefits Equity-settled share-based payments Cash-settled
share-based payments
Termin-ation
benefits
Proportion of remuneration performance
related
Value of options as
proportion of remuneration Name Year Salary/ fees
Directors’ fees
Non-monetary Bonus (4)
Super-annuation Other(9)
Incentive plans LSL(10)
Shares/ units
Options/ rights TOTAL
Directors
Non-Executive
Geoffrey Davis (6) 2014 224,587 35,212 - - - - - - - - - - 259,799 - -
2013 27,597 101,440 - - - - - - - - - - 129,037 - -
Robert Weinberg 2014 - 68,089 - - - - - - - - - - 68,089 - -
2013 - 76,080 - - - - - - - - - - 76,080 - -
Andrew Teo 2014 - 81,982 - - - - - - - - - - 81,982 - -
2013 - 76,080 - - - - - - - - - - 76,080 - -
Ciceron Angeles 2014 42,921 68,089 - - - - - - - - - - 111,010 - -
2013 63,016 76,080 - - - - - - - - - - 139,096 - -
Gary Powell (1) 2014 269,607 68,089 - - - - - - - - - - 337,696 - -
2013 160,204 32,188 - - - - - - - - - - 192,392 - -
Executive
Peter Hepburn-Brown (5), (8)
2014 696,147 - - - 31,955 87,360 - - - - - - 815,462 - -
2013 746,800 - - - 12,968 67,205 - - - - - - 826,973 - -
Raul Villanueva (2) 2014 373,910 - - - - - - - - - - - 373,910 - -
2013 174,348 - - - - - - - - - - - 174,348 - -
Executives
Peter Alphonso 2014 331,758 - - - 22,827 97,747 - 74,371 - - - - 526,703 - - 2013 285,363 - - - 12,711 39.381 - - - - - - 337,455 - -
Roy Daniel (7) 2014 - - - - - - - - - - - - - - -
2013 603,480 - - - 25,000 - - - - - - - 628,480 - -
Samuel Afdal (3) 2014 - - - - - - - - - - - - - - -
2013 210,945 - - - - - - - - - - - 210,945 - -
Total 2014 1,938,930 321,461 - - 54,782 185,107 - 74,371 - - - - 2,574,651 - -
2013 2,271,753 361,868 - - 50,679 106,586 - - - - - - 2,790,886 - -
(1) Mr Gary Powell appointed 24 January 2013 (2) Mr Raul Villanueva appointed 24 January 2013 (3) Mr Samuel Afdal resigned 10 December 2012 (4) Bonuses are generally paid in October and relate to the previous year’s financial results. No bonuses will be paid to any Senior Executives in 2014/15 relating to the financial year ended 30 June 2014. (5) Performance Rights granted during the 2011 financial year (and disclosed as Equity settled share based payments in the previous financial year) lapsed during the 2013 financial year due to performance criteria not being met. (6) Mr Geoffrey Davis retired 22 November 2013 (7) Mr Roy Daniel retired 30 June 2013 (8) Mr Peter Hepburn-Brown since resigned 19 August 2014 (9) Comprises Annual Leave accrued during the year but not paid (10) Comprises Long Service Leave accrued during the year but not paid

DIRECTORS’ REPORT
Page 10 of 62
(c) Remuneration options and equity based instruments
No options or other equity based instruments or rights over any of them, were granted by the Company or any entity controlled by the Company as remuneration during or since the end of the financial year.
(d) Shares issued on exercise of options granted as remuneration
During the financial year, no fully paid ordinary shares were issued on the exercise of options previously granted as remuneration to Directors and Executives.
(e) Option/rights holdings
The movement during the year in the number of options/rights over ordinary shares in Medusa Mining Limited held directly, indirectly or beneficially, by each Director and Executive, including their personally related entities is as follows:
Financial year 2013/2014
Name Balance 01/07/13
Options/rights granted as
remuneration
Options/ rights
exercised
Options/ Rights not exercised
and lapsed
Balance held
30/06/14
Vested & exercisable 30/06/14 (1)
Total not exercisable 30/06/14 (2)
Directors
Geoffrey Davis (3) - - - - - - -
Peter Hepburn-Brown(4) - - - - - - -
Robert Weinberg - - - - - - -
Andrew Teo - - - - - - -
Ciceron Angeles - - - - - - -
Raul Villanueva 300,000 - - - 300,000 300,000 -
Gary Powell - - - - - - -
Executives
Peter Alphonso - - - - - - - (1) Options vested and exercisable are all the options vested at the reporting date; (2) Options that are not exercisable have not vested at the reporting date (3) Mr Geoffrey David retired 22 November 2013 (4) Mr Peter Hepburn-Brown resigned 19 August 2014
Financial Year 2012/2013
Name Balance 01/07/12
Options/rights granted as
remuneration
Options/ rights
exercised
Options/ Rights not exercised
and lapsed
Balance held
30/06/13
Vested & exercisable 30/06/13 (1)
Total not exercisable 30/06/13 (2)
Directors
Geoffrey Davis - - - - - - -
Peter Hepburn-Brown(3) 250,000 - - (250,000) - - -
Robert Weinberg - - - - - - -
Andrew Teo - - - - - - -
Ciceron Angeles - - - - - - -
Gary Powell - - - - - - -
Raul Villanueva 300,000 - - - 300,000 150,000 150,000
Executives - - - - - - -
Roy Daniel(4) - - - - - - -
Peter Alphonso - - - - - - -
Samuel Afdal(5) - - - - - - - (1) Options vested and exercisable are all the options vested at the reporting date; (2) Options that are not exercisable have not vested at the reporting date (3) Mr Hepburn-Brown was allocated 250,000 performance rights on 11 November 2011 (4) Mr Roy Daniel retired as Finance Director 09 June 2011 but continued in an executive role as Chief Financial
Officer until 30 June 2013 (5) Mr Samuel Afdal resigned on 10 December 2012
(f) Share holdings
The movement during the year in the number of ordinary shares in Medusa Mining Limited held directly, indirectly or beneficially, by each Director and key management personnel, including their personally related entities is as follows:

DIRECTORS’ REPORT
Page 11 of 62
Financial year 2013/14
Name Balance 30/06/13
Shares held at
appointment
Bonus Issue of shares
Shares purchased
Options exercised
Shares sold
Balance 30/06/14
Non-Executive Directors Andrew Teo 75,000 - - - - - 75,000
Geoffrey Davis (1) 4,102,750 - - - 4,102,750
Robert Weinberg 62,675 - - - - - 62,675
Ciceron Angeles - - - - - -
Gary Powell - - - - - - -
Executive Directors
Peter Hepburn-Brown (2) 22,000 - - - - - 22,000
Raul Villanueva - - - - - - -
Executives
Peter Alphonso 127,500 - - - - - 127,500
(1) Mr Geoffrey Davis retired 22 November 2013 (2) Mr Peter Hepburn-Brown since resigned 19 August 2014
Financial year 2012/13
Name Balance 30/06/12
Shares held at
appointment
Bonus Issue of shares
Shares purchased
Options exercised
Shares sold
Balance 30/06/13
Non-Executive Directors Andrew Teo 65,000 - - 10,000 - - 75,000
Geoffrey Davis 4,052,750 - - 50,000 - 4,102,750
Robert Weinberg 59,975 - - 2,700 - - 62,675
Ciceron Angeles - - - -
Gary Powell (2) - - - - - - -
Executive Directors
Peter Hepburn-Brown 17,000 - - 5,000 - - 22,000
Raul Villanueva (1) - - - - - - -
Executives
Roy Daniel (3) 1,425,000 - - - - - 1,425,000
Peter Alphonso 126,500 - - 1,000 - - 127,500
Samuel Afdal (4) 1,450,000 - - - - 1,450,000 -
(1) Raul Villanueva appointed 24 January 2013 (2) Mr Gary Powell appointed 24 January 2013 (3) Mr Roy Daniel retired 30 June 2013 (4) Mr Samuel Afdal resigned 10 December 2012
(g) Remuneration policies
Remuneration Committee
The Remuneration Committee of the Board of Directors is responsible for determining, reviewing and making recommendations to the Board on compensation arrangements for the Non-Executive Directors, Managing Director and Executive Officers.
The Remuneration Committee assesses the appropriateness of the nature and amount of emoluments of such officers on an annual basis by reference to relevant market conditions. It is empowered to engage the assistance of external consultants specialising in remuneration of executives and personnel in the mining industry to provide analysis and advice to ensure executive remuneration packages reflect relevant international employment market conditions. During the financial year, the Board did not obtain any independent advice from external consultants.

DIRECTORS’ REPORT
Page 12 of 62
Remuneration Philosophy
The main objective is the retention of a high quality Board and executive team, to maximise value of the shareholders’ investment. Remuneration levels are therefore competitively set to attract, retain and motivate appropriately qualified and experienced Directors and Executives.
In determining the level and make up of remuneration levels for Executives of the Group, the remuneration policy has been structured to increase goal congruence between shareholders and Executives and includes the payment of bonuses based on achievement of specific goals related to the performance of the Group and also the issue of incentive options or equity based instruments to encourage alignment of personal and shareholder interests.
Non-Executive Directors remuneration:
The Board seeks to set aggregate remuneration at a level that provides the Company with the ability to attract and retain Non-Executive Directors of the highest calibre.
Non-Executive Directors’ fees are paid within the aggregate amount approved by shareholders from time to time. Total remuneration for all Non-Executive Directors, last approved by shareholders on 18 November 2009, is not to exceed A$400,000 per annum. The amount of aggregate remuneration sought to be approved by shareholders and the manner in which it is apportioned amongst Directors is reviewed annually.
The Board considers the amount of Director fees being paid by comparable international resource companies with similar responsibilities, and the experience of each Non-Executive Director when undertaking the review process.
Directors’ fees cover all main Board activities and membership of Board Committees. No retirement benefits are provided for any Non-Executive Director’s retirement or termination and Non-Executive Directors do not receive performance related compensation remuneration.
Director fees currently paid to Non-Executive Directors are as follows: o Andrew Boon San Teo (Non-Executive Chairman): A$100,000 per annum; o Dr Robert Weinberg (Non-Executive Director): A$75,000 per annum; o Ciceron Angeles (Non-Executive Director): A$75,000 per annum o Gary Powell (Non-Executive Director) A$75,000 per annum
Executive Remuneration:
Objective
The Company’s aim is to ensure Executives perform at a high level by incentivising them with the level and mix of remuneration commensurate with their position and responsibilities. These incentives include, to rewarding Executives for individual performances; and ensuring total remuneration is competitive by international market standards.
Remuneration is made up of a fixed component as well as a variable component which is performance linked and only granted when considered appropriate by the Board.
The remuneration of Executives, including the Managing Director, is reviewed annually by the Remuneration Committee, with the review taking into consideration the contribution of the individuals commensurate with the performance of the business unit within their responsibility, the overall performance of the Company and comparable employment market conditions internationally.
Fixed Remuneration Fixed remuneration consists of base salary, any non-monetary benefits and employer contributions to superannuation funds. The level of fixed remuneration is set so as to provide a base level of remuneration which is both appropriate to the position and is competitive in the market. Fixed remuneration is reviewed annually by the Remuneration Committee.
When appropriate, external remuneration consultants provide analysis and independent advice to ensure that Executives’ remuneration levels are competitive in the international market place. During the financial year, the Board did not obtain any independent advice from external consultants.

DIRECTORS’ REPORT
Page 13 of 62
Variable Remuneration Variable remuneration is performance linked and includes both short-term and long-term incentives and is designed to reward key management personnel for meeting or exceeding their financial and personal objectives. The short-term incentive is an ‘at risk’ bonus provided in the form of cash whilst the long-term incentive is provided as options over ordinary shares or performance rights to acquire fully paid ordinary shares in the Company.
Short-term Incentives (“STI”)
Each year, the Board sets key performance indicators (“KPIs”) for key management personnel. The KPIs generally include measures relating to the Group, the relevant segment, and the individual, and include financial, people, strategy and risk measures. The measures are chosen as they directly align the individual’s reward to the KPIs of the Group and to its strategy and performance.
During the financial year, the Board set the following KPIs that applied to each member of Key Management Personnel: o The Group meeting or exceeding annual production targets set by the Board based on
a combination of physical parameters that include development meterage achieved, total ore mined and milled and ounces produced during the financial year. This KPI was chosen as the Board considers it to be the most significant Group controlled factor directly impacting the profitability of the Group;
o The Group's exploration drilling rates based on drilling targets set by the Board. This KPI was chosen as the Board considers exploration rates to be a key factor supporting the identification and development of the Group's growth projects and sustaining the Group's production into the future;
o The Group's level of compliance with its sustainability policy as outlined in the Review of Operations. This includes compliance with environmental obligations and health and safety regulations and guidelines and is assessed by reference to the level of non-compliance (if any) by the Group with its obligations. This KPI was chosen as the Company is committed to its environmental performance and considers health and safety to be a leading indicator of management and operational performance.
At the end of the financial year the Board assesses the actual performance of the Group, the relevant segment and individual against the KPIs set at the beginning of the financial year. Should the Group achieve the set KPIs, the Board may reward the Key Management Personnel with a bonus during the salary review. Any bonus payable must fall within 0.5% of net profit after tax of the Group and not exceed 50% of an individual’s fixed remuneration. The Board retains absolute discretion over payment of these bonuses and can adjust payments (within the above caps) to take into account the overall performance of the Group, personal performance and prevailing market conditions.
This method of assessment was chosen as it provides the Board with an objective assessment of the Group’s performance against identifiable factors that relate to the group’s profitability and the sustainability of the Group’s operations.
No STIs were granted to any key management personnel in the subsequent period since the end of the financial year ended 30 June 2014.
Long-term Incentive (“LTI”)
Historically, LTIs granted to key management personnel have been in the form of options over ordinary shares. The Board is currently considering whether to adopt other LTI measures, including a performance rights plan in which key management personnel can participate.
The primary objective of Medusa’s LTI based remuneration is and will continue to be, to reward key management personnel in a manner which aligns this element of remuneration with the creation of shareholder wealth. The Board takes into account and will continue to take into account, appropriate measures of shareholder wealth, including those outlined in section 13(g) below and Company performance in setting the performance criteria applicable to its LTI based remuneration.
No LTIs were granted to any key management personnel during the financial year ending 30 June 2014.

DIRECTORS’ REPORT
Page 14 of 62
(h) Company performance
In considering the Company’s performance and benefits for shareholder wealth, the Remuneration Committee take into account the following indices in respect of the current financial year and the previous four financial years.
Year ended 30 June Note 2010 2011 2012 2013 2014
Basic earnings per share (EPS) (1) US$0.378 US$0.587 US$0.261 US$0.266 US$0.154
Share price at 30 June A$3.90 A$6.59 A$4.83 A$1.55 A$1.85
Share price increase (2) A$1.70 A$2.69 (A$1.76) (A$3.28) A$0.30
Total shareholder returns (TSR) (3) 77.3% 69.0% (26.7%) (67.5%) 19.4%
(1) Basic EPS is calculated as net profit after tax divided by the weighted average number of ordinary shares; (2) Share price movement during the financial year; (3) TSR is defined as the growth/decline (in percentage terms) in the share price, taking into account dividends
paid over the previous financial year ending 30 June. No dividends were paid during the current financial year (Dividends totalling A$0.10 were paid in the 2011 and 2012 financial years and A$0.02 was paid for the financial year ending 2013 No dividends were paid or capital returned in the previous respective years from 2008 to 2010).
(i) Board policy in relation to limiting exposure to risk in securities
Under the Company's Securities Trading Policy, Directors and Executives are prohibited from dealing in financial products issued or created over or in respect of Medusa securities (eg hedges or derivatives) which have the effect of reducing or eliminating the risk associated with any equity incentives that Medusa may offer from time to time (for example, a person may be granted an equity incentive award that vests at a time in the future subject to achieving certain performance goals; certain financial institutions offer products which act as an insurance policy if the performance goals are not met, thereby reducing the "at-risk" element of the person's incentive arrangements).
$0.00
$1.00
$2.00
$3.00
$4.00
$5.00
$6.00
$7.00
$8.00
$9.00
$10.00
Shar
e Pr
ice
Month/Year

DIRECTORS’ REPORT
Page 15 of 62
(j) Employment contracts Executive Directors
Peter Hepburn-Brown (Managing Director) (Since resigned 19 August 2014)
Contract description:
Employment contract between the Company and Peter Hepburn-Brown (“Employee”).
Term: An initial term ending on 8 June 2016 (subject to earlier termination) (“Initial Term”). If not terminated on or prior to 8 June 2016, the agreement will continue until terminated.
Services: The Employee is employed as Managing Director of the Company and will be responsible for the overall management of the Company (subject to the direction of the Board); and its operations and strategic development.
Remuneration: Fixed remuneration: A$725,000 per annum plus a superannuation contribution of A$25,000 per annum, subject to annual review by the Board. During the review, the Board will consider the progress of the Company and comparable industry standard. Variable remuneration - Short term incentive: The Employee maybe entitled to an annual bonus at the discretion of the Board. In determining eligibility, the Board will consider without limitation, the performance of the Company, the Employee’s performance and prevailing market conditions. The quantum of any bonus paid must fall within 0.5% of NPAT and not to exceed 50% of an individual’s fixed remuneration. Variable remuneration - Long term incentive: On 10 November 2011 shareholders approved the issue of 250,000 Performance Rights subject to specific terms and conditions. Due to performance criteria not being met the Performance Rights lapsed on 30 June 2013.
Termination: Termination by the Company During the Initial Term (other than as set out below in relation to a “Material Diminution” or default by the Employee), the Company may terminate the agreement by notice or payment in lieu of notice of a notice period equal to: (a) the number of months remaining in the Initial Term; or (b) 12 months, if the number of months remaining in the Initial Term is less than 12. The Company may immediately terminate the agreement in certain circumstances, including if the Employee is in default of its obligations and does not remedy that default in addition to other standard default situations.
Termination by the Employee The Employee may terminate the agreement at any time by giving 3 months’ written notice or immediately in certain circumstances, including if the Company is in default of its obligations and does not remedy that default and in certain other standard default situations, in which case the Consultant will be entitled to payment in lieu of notice.
Termination by reason of Material Diminution A “Material Diminution” is a change in the Employee’s status as Managing Director of the Company, including a material change in his authority in respect of the business of the Company or any member of the Company’s group; or a change in his reporting relationship with the Board. If a Material Diminution occurs, within 3 months of this occurring, the Employee may give the Company 2 weeks’ written notice of termination of this agreement. Subject to the Corporations Act, the Company must make a payment in lieu of a notice period equal to: (a) the number of months remaining in the Initial Term; or (b) 12 months, if the number of months remaining in the Initial Term is less than 12. After expiration of the Initial Term, the Company must make a payment to the Employee in lieu of a notice period equal to 12 months.
Protection of the Company’s interests:
The Employee’s contract also contains provisions for the protection of the Company’s interest in such areas as confidentiality, conflict of interests and business dealings.

DIRECTORS’ REPORT
Page 16 of 62
(j) Employment contracts (continued)
Peter Alphonso (Company Secretary/Chief Financial Officer)
Contract description: Employment contract between the Company and Peter Alphonso (“Employee”).
Term: An initial term ending on 30 September 2015 (subject to earlier termination) (“Initial Term”). If not terminated on or prior to 30 September 2015, the agreement will continue until terminated.
Role: The Employee is initially employed in the role of Company Secretary/Chief Financial Officer and may subsequently be employed in other comparable roles as determined by the Employer. The Employee will be responsible for the day to day management of all financial, administrative and corporate functions of the Company.
Remuneration: Fixed remuneration: A$300,000 per annum (inclusive of superannuation), subject to annual review by the Board. During the review, the Board will consider the progress of the Company and comparable industry standard. Variable remuneration - Short term incentive: The Employee may be entitled to an annual bonus at the discretion of the Board. In determining eligibility, the Board will consider without limitation, the performance of the Company, the Employee’s performance and prevailing market conditions.
Termination: Termination by the Company During the Initial Term (other than as set out below in relation to a “Material Diminution” or default by the Employee), the Company may terminate the agreement by notice or payment in lieu of notice of a notice period equal to: (a) the number of months remaining in the Initial Term; or (b) 12 months, if the number of months remaining in the Initial Term is less than 12. The Company may immediately terminate the agreement in certain circumstances, including if the Employee is in default of its obligations and does not remedy that default in addition to other standard default situations.
Termination by the Employee The Employee may terminate the agreement at any time by giving 3 months’ written notice or immediately in certain circumstances, including if the Company is in default of its obligations and does not remedy that default and in certain other standard default situations, in which case the Consultant will be entitled to payment in lieu of notice.
Termination by reason of Material Diminution A “Material Diminution” is a change in the Employee’s status as Company Secretary/Chief Financial Officer of the Company, including a material change in his authority in respect of the business of the Company or any member of the Company’s group; or a change in his reporting relationship with the Board. If a Material Diminution occurs, within 3 months of this occurring, the Employee may give the Company 2 weeks’ written notice of termination of this agreement. Subject to the Corporations Act, the Company must make a payment in lieu of a notice period equal to: (a) the number of months remaining in the Initial Term; or (b) 12 months, if the number of months remaining in the Initial Term is less than 12. After expiration of the Initial Term, the Company must make a payment to the Employee in lieu of a notice period equal to 12 months.
Protection of the Company’s interests:
The Employee’s contract also contains provisions for the protection of the Company’s interest in such areas as confidentiality, conflict of interests and business dealings.
DIRECTORS’ REPORT
Page 17 of 62
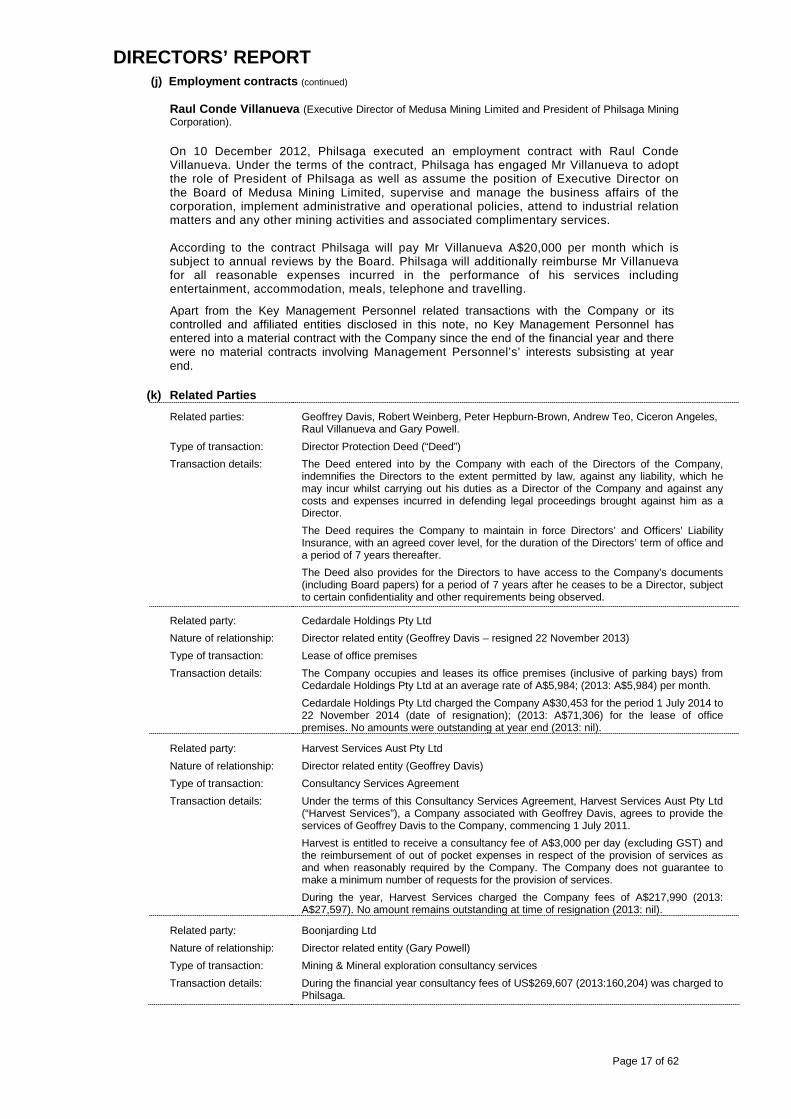
(j) Employment contracts (continued)
Raul Conde Villanueva (Executive Director of Medusa Mining Limited and President of Philsaga Mining Corporation).
On 10 December 2012, Philsaga executed an employment contract with Raul Conde Villanueva. Under the terms of the contract, Philsaga has engaged Mr Villanueva to adopt the role of President of Philsaga as well as assume the position of Executive Director on the Board of Medusa Mining Limited, supervise and manage the business affairs of the corporation, implement administrative and operational policies, attend to industrial relation matters and any other mining activities and associated complimentary services. According to the contract Philsaga will pay Mr Villanueva A$20,000 per month which is subject to annual reviews by the Board. Philsaga will additionally reimburse Mr Villanueva for all reasonable expenses incurred in the performance of his services including entertainment, accommodation, meals, telephone and travelling.
Apart from the Key Management Personnel related transactions with the Company or its controlled and affiliated entities disclosed in this note, no Key Management Personnel has entered into a material contract with the Company since the end of the financial year and there were no material contracts involving Management Personnel’s’ interests subsisting at year end.
(k) Related Parties
Related parties: Geoffrey Davis, Robert Weinberg, Peter Hepburn-Brown, Andrew Teo, Ciceron Angeles, Raul Villanueva and Gary Powell.
Type of transaction: Director Protection Deed (“Deed”) Transaction details: The Deed entered into by the Company with each of the Directors of the Company,
indemnifies the Directors to the extent permitted by law, against any liability, which he may incur whilst carrying out his duties as a Director of the Company and against any costs and expenses incurred in defending legal proceedings brought against him as a Director. The Deed requires the Company to maintain in force Directors’ and Officers’ Liability Insurance, with an agreed cover level, for the duration of the Directors’ term of office and a period of 7 years thereafter. The Deed also provides for the Directors to have access to the Company’s documents (including Board papers) for a period of 7 years after he ceases to be a Director, subject to certain confidentiality and other requirements being observed.
Related party: Cedardale Holdings Pty Ltd Nature of relationship: Director related entity (Geoffrey Davis – resigned 22 November 2013) Type of transaction: Lease of office premises Transaction details: The Company occupies and leases its office premises (inclusive of parking bays) from
Cedardale Holdings Pty Ltd at an average rate of A$5,984; (2013: A$5,984) per month. Cedardale Holdings Pty Ltd charged the Company A$30,453 for the period 1 July 2014 to 22 November 2014 (date of resignation); (2013: A$71,306) for the lease of office premises. No amounts were outstanding at year end (2013: nil).
Related party: Harvest Services Aust Pty Ltd Nature of relationship: Director related entity (Geoffrey Davis) Type of transaction: Consultancy Services Agreement Transaction details: Under the terms of this Consultancy Services Agreement, Harvest Services Aust Pty Ltd
(“Harvest Services”), a Company associated with Geoffrey Davis, agrees to provide the services of Geoffrey Davis to the Company, commencing 1 July 2011. Harvest is entitled to receive a consultancy fee of A$3,000 per day (excluding GST) and the reimbursement of out of pocket expenses in respect of the provision of services as and when reasonably required by the Company. The Company does not guarantee to make a minimum number of requests for the provision of services. During the year, Harvest Services charged the Company fees of A$217,990 (2013: A$27,597). No amount remains outstanding at time of resignation (2013: nil).
Related party: Boonjarding Ltd Nature of relationship: Director related entity (Gary Powell) Type of transaction: Mining & Mineral exploration consultancy services Transaction details: During the financial year consultancy fees of US$269,607 (2013:160,204) was charged to
Philsaga.

DIRECTORS’ REPORT
Page 18 of 62
(l) Un-issued shares under options/rights
At the date of this report, details of un-issued ordinary shares of the Company under option are as follows:
Expiry date Exercise price No. of options/rights No. of shares issued if
options/rights exercised
Employee options
3 January 2015 A$5.10 1,000,000 1,000,000
(m) Shares issued on exercise of options/rights
During or since the end of the financial year no options were exercised.
14. INDEMNIFICATION AND INSURANCE OF DIRECTORS AND OFFICERS Indemnification
The Company has agreed to indemnify the following current Directors of the Company, Messrs Davis, Hepburn-Brown, Teo, Angeles, Dr Weinberg, Villanueva and Powell and the following former Directors Messrs Cato, Mein, Tomlinson, Jones, Daniel and Dr Schiller against all liabilities to another person (other than the Company or a related body corporate) that may arise from their position as Directors of the Company and its controlled entities, except where the liability arises out of conduct involving a wilful breach of duty or improper use of information to gain a personal advantage.
No amount has been paid under any of these indemnities during the financial year under review.
Insurance premiums
During the year, the Company paid an insurance premium for Directors’ and Officers’ Liability Insurance policy, which cover all Directors, Company Secretaries and other Officers of the Company and its related entities. Details of the nature of the liabilities covered and the amount of premium paid in respect of the Directors’ and Officers’ Liability Insurance policies are not disclosed, as such disclosure is prohibited under the terms of the policy.
15. INDEMNIFICATION OF AUDITORS The Company's auditor is Grant Thornton Audit Pty Ltd (“Grant Thornton”). The Company has agreed with Grant Thornton, as part of its terms of engagement, to indemnify Grant Thornton against certain liabilities to third parties arising from a breach by the Group under the terms of engagement or as a result of reliance on information provided by the Group that is false, misleading or incomplete. The indemnity does not extend to any liability resulting from [a negligent, wrongful or wilful act or omission] of Grant Thornton.
During the financial year, the Company has not paid any premium in respect to any insurance for Grant Thornton or a body corporate related to Grant Thornton and there were no officers of the Company who were former partners or directors of Grant Thornton, whilst Grant Thornton conducted audits of the Group.
16. ENVIRONMENTAL REGULATIONS The Group's operations are subject to a number of environmental regulations in relation to its exploration, mining and processing activities in the Philippines. Details of these regulations are set out in the Review of Operations, under the section titled Environmental Management and Monitoring in the Final Annual Report.
The Directors are not aware of any significant breaches of environmental regulations during the financial year.
17. PROCEEDINGS ON BEHALF OF THE COMPANY
No person has applied for leave of Court to bring proceedings on behalf of the Company or intervene in any proceedings to which the Company is a party for the purpose of taking responsibility on behalf of the Company for all or any part of those proceedings.
The Company was not a party to any such proceedings during the financial year.


Grant Thornton Audit Pty Ltd ACN 130 913 594 a subsidiary or related entity of Grant Thornton Australia Ltd ABN 41 127 556 389
‘Grant Thornton’ refers to the brand under which the Grant Thornton member firms provide assurance, tax and advisory services to their clients and/or refers to one or more member firms, as the
context requires. Grant Thornton Australia Ltd is a member firm of Grant Thornton International Ltd (GTIL). GTIL and the member firms are not a worldwide partnership. GTIL and each member firm
is a separate legal entity. Services are delivered by the member firms. GTIL does not provide services to clients. GTIL and its member firms are not agents of, and do not obligate one another and
are not liable for one another’s acts or omissions. In the Australian context only, the use of the term ‘Grant Thornton’ may refer to Grant Thornton Australia Limited ABN 41 127 556 389 and its
Australian subsidiaries and related entities. GTIL is not an Australian related entity to Grant Thornton Australia Limited.
Liability limited by a scheme approved under Professional Standards Legislation. Liability is limited in those States where a current scheme applies.
Page 20 of 62
Level 1
10 Kings Park Road
West Perth WA 6005
Correspondence to:
PO Box 570
West Perth WA 6872
T +61 8 9480 2000
F +61 8 9322 7787
W www.grantthornton.com.au
Auditor’s Independence Declaration
To the Directors of Medusa Mining Limited
In accordance with the requirements of section 307C of the Corporations Act 2001, as lead
auditor for the audit of Medusa Mining Limited for the year ended 30 June 2014, I declare
that, to the best of my knowledge and belief, there have been:
a no contraventions of the auditor independence requirements of the Corporations Act
2001 in relation to the audit; and
b no contraventions of any applicable code of professional conduct in relation to the
audit.
GRANT THORNTON AUDIT PTY LTD Chartered Accountants
P W Warr
Partner - Audit & Assurance
Perth, 29 August 2014

STATEMENT OF PROFIT OR LOSS AND OTHER COMPREHENSIVE INCOME for the year ended 30 June 2014
Page 21 of 62
Consolidated 2014 2013 Note US$000 US$000
Revenue 2 84,196 100,680
Cost of sales (42,806) (33,551)
Exploration & evaluation expenses 3 (107) (6,849)
Administration expenses (8,265) (8,508)
Other expenses (2,358) (1,587)
Profit before income tax expense 30,660 50,185
Income tax (expense)/benefit 5 211 (4)
Profit attributable to members of the Group 6,21 30,871 50,181
Other comprehensive income, net of income tax:
Exchange differences on translation of foreign operations and other comprehensive income for the year (4,837) (6,381)
Total comprehensive income for the year 26,034 43,800
Overall operations:
Basic earnings per share (US$ per share) 6 0.154 0.266
Diluted earnings per share (US$ per share) 6 0.153 0.263
The accompanying notes form part of these financial statements
.

STATEMENT OF FINANCIAL POSITION for the year ended 30 June 2014
Page 22 of 62
Consolidated 2014 2013 Note US$000 US$000
CURRENT ASSETS
Cash & cash equivalents 22 13,063 4,698
Trade & other receivables 7 12,030 29,617
Inventories 8 18,084 18,339
Other current assets 9 512 662
Total Current Assets 43,689 53,316
NON-CURRENT ASSETS
Trade & other receivables 10 21,489 2,600
Property, plant & equipment 11 115,470 101,549
Intangible Assets 96 -
Exploration, evaluation & development expenditure 12 261,743 219,962
Deferred tax assets 15 2,983 1,603
Total Non-Current Assets 401,781 325,714
TOTAL ASSETS 445,470 379,030
CURRENT LIABILITIES
Trade & other payables 19,954 18,616
Borrowings 13 7,132 1,725
Employee benefits 14 740 1,017
Total Current Liabilities 27,826 21,358
NON-CURRENT LIABILITIES
Borrowings 13 2,202 528
Deferred tax liability 15 1,782 141
Employee benefits 14 1,354 753
Total Non-Current Liabilities 5,338 1,422
TOTAL LIABILITIES 33,164 22,780
NET ASSETS 412,306 356,250
EQUITY
Issued capital 17 102,902 73,070
Reserves 18 13,440 18,087
Retained profits 21 295,964 265,093
TOTAL EQUITY 412,306 356,250
The accompanying notes form part of these financial statements.

STATEMENT OF CHANGES IN EQUITY for the year ended 30 June 2014
Page 23 of 62
Note
Share Capital
Ordinary US$000
Retained Profits US$000
Option and
Performance rights
US$000
Foreign Currency
Translation Reserve US$000
Total
US$000
CONSOLIDATED
Balance at 30 June 2012 73,070 218,837 3,740 20,020 315,667
Comprehensive Income
Net profit after tax - 50,181 - - 50,181
Other comprehensive income - - - (6,381) (6,381)
Total comprehensive income for the year - 50,181 - (6,381) 43,800
Transactions with owners, in their capacity as owners, and other transfers
Share options issued during the period in accordance with AASB 2 - share based payment 19 - - 708 - 708
Sub-total 73,070 269,018 4,448 13,639 360,175
Dividends paid 4 - (3,925) - - (3,925)
Balance at 30 June 2013 73,070 265,093 4,448 13,639 356,250
Comprehensive Income
Net profit after tax - 30,871 - - 30,871
Other comprehensive income - - - (4,837) (4,837)
Total comprehensive income for the year - 30,871 - (4,837) 26,034
Transactions with owners, in their capacity as owners, and other transfers
Shares issued during the period 17 29,832 - - - 29,832
Share options issued during the period in accordance with AASB 2 - share based payment 19 - - 190 - 190
Sub-total 102,902 295,964 4,638 8,802 412,306
Dividends paid - - - - -
Balance at 30 June 2014 102,902 295,964 4,638 8,802 412,306
The accompanying notes form part of these financial statements.

STATEMENT OF CASH FLOWS for the year ended 30 June 2014
Page 24 of 62
Consolidated 2014 2013 Note US$000 US$000
CASH FLOWS FROM OPERATING ACTIVITIES
Receipts from customers 86,206 125,687
Payments to suppliers & employees (36,637) (30,911)
Interest received 153 26
Net cash provided by operating activities 22 49,722 94,802
CASH FLOWS FROM INVESTING ACTIVITIES
Payments for plant & equipment (20,224) (43,405)
Payments for intangible assets (96) -
Payments for exploration & evaluation activities (8,196) (10,350)
Payment for development activities (45,318) (45,682)
Net cash from (used in) investing activities (73,834) (99,437)
CASH FLOWS FROM FINANCING ACTIVITIES
Proceeds from issue of shares 29,832 -
Payments for dividends - (3,925)
Proceeds from bank loans 7,081 2,253
Net cash (used in) financing activities 36,913 (1,672)
Net (decrease) in cash and cash equivalents held 12,801 (6,307)
Cash & cash equivalents at the beginning of the financial year 4,698 12,468
Exchange rate adjustment (4,436) (1,463)
Cash & cash equivalents at the end of the financial year 22 13,063 4,698
The accompanying notes form part of these financial statements.

NOTES TO THE FINANCIAL STATEMENTS for the year ended 30 June 2014
Page 25 of 62
Contents of notes to the financial statements Page number
1. Statement of significant accounting policies 26
2. Revenue 36
3. Expenses 36
4. Dividends 36
5. Taxation 37
6. Earnings per share 37
7. Current receivables 38
8. Inventories 38
9. Other current assets 38
10. Non-Current Receivables 38
11. Property, plant and equipment 38
12. Exploration, evaluation and development expenditure 39
13. Borrowings 40
14. Employee benefits 40
15. Deferred tax 41
16. Auditors’ remuneration 42
17. Issued capital 43
18. Reserves 44
19. Share based payments 44
20. Investments in subsidiaries 46
21. Retained profits 46
22. Notes to the statement of cash flows 47
23. Financial risk management 48
24. Commitments 51
25. Events subsequent to reporting date 52
26. Segment information 53
27. Parent company information 54
28. New standards and interpretations not yet adopted 55
29. Franking account 57
30. Company details 57
NOTES TO THE FINANCIAL STATEMENTS for the year ended 30 June 2014
Page 26 of 62
1. STATEMENT OF SIGNIFICANT ACCOUNTING POLICIES
The financial report is a general purpose financial report, which has been prepared in accordance with Australian Accounting Standards, including Australian Accounting Interpretations, other authoritative pronouncements of the Australian Accounting Standards Board (AASB) and the Corporations Act 2001.
Australian Accounting Standards set out accounting policies that the AASB has concluded would result in a financial report containing relevant and reliable information about transactions, events and conditions to which they apply. Medusa Mining Limited is a for profit entity for the purpose of preparing the financial statements. Compliance with Australian Accounting Standards ensures that the financial statements and notes also comply with International Financial Reporting Standards (IFRS). Material accounting policies adopted in the preparation of this financial report are presented below. They have been consistently applied unless otherwise stated.
The financial report covers the Group of Medusa Mining Limited (“Medusa”) and controlled entities. Medusa is a listed public company, incorporated and domiciled in Australia.
The separate financial statements of the parent entity, Medusa Mining Limited, have not been presented within this financial report as permitted by the Corporations Act 2001.
The financial statements were authorised by the Directors on 26 August 2014.
Basis of preparation
Reporting Basis and Conventions
The financial report has been prepared on an accruals basis and is based on historical costs modified, where applicable, by the measurement at fair value of selected non-current assets, financial assets and financial liabilities.
(a) Principles of consolidation The Group financial statements consolidate those of the Parent Company and all of its subsidiaries as of 30 June 2014. The Parent controls a subsidiary if it is exposed, or has rights, to variable returns from its involvement with the subsidiary and has the ability to affect those returns through its power over the subsidiary. All subsidiaries have a reporting date of 30 June. All transactions and balances between Group companies are eliminated on consolidation, including unrealised gains and losses on transactions between Group companies. Where unrealised losses on intra-group asset sales are reversed on consolidation, the underlying asset is also tested for impairment from a group perspective. Amounts reported in the financial statements of subsidiaries have been adjusted where necessary to ensure consistency with the accounting policies adopted by the Group. Profit or loss and other comprehensive income of subsidiaries acquired or disposed of during the year are recognised from the effective date of acquisition, or up to the effective date of disposal, as applicable. Non-controlling interests, presented as part of equity, represent the portion of a subsidiary’s profit or loss and net assets that is not held by the Group. The Group attributes total comprehensive income or loss of subsidiaries between the owners of the parent and the non-controlling interests based on their respective ownership interests A list of controlled entities during the year ended 30 June 2014 is presented in note 20.
(b) Comparative figures Where required by Accounting Standards, comparative figures have been adjusted to conform with
changes in presentation for the current financial year.
(c) Change in accounting policy The Group has adopted the following revisions and amendments to AASB’s issued by the Australian
Accounting Standards Board which are relevant to and effective for the Group's financial statements for the annual period beginning 1July 2013.
New and revised standards that are effective for these financial statements
• A number of new and revised standards are effective for annual periods beginning on or after 1 July 2013. Information on these new standards is presented below.
AASB 10 Consolidated Financial Statements
• AASB 10 supersedes AASB 127 Consolidated and Separate Financial Statements (AASB 127) and AASB Interpretation 112 Consolidation - Special Purpose Entities. AASB 10 revises the definition of control and provides extensive new guidance on its application. These new requirements have the potential to affect which of the Group’s investees are considered to be subsidiaries and therefore to change the scope of consolidation. The requirements on consolidation procedures, accounting for changes in non-controlling interests and accounting for loss of control of a subsidiary are unchanged.

NOTES TO THE FINANCIAL STATEMENTS for the year ended 30 June 2014
Page 27 of 62
1. STATEMENT OF SIGNIFICANT ACCOUNTING POLICIES (continued)
• Management has reviewed its control assessments in accordance with AASB 10 and has concluded that there is no effect on the classification (as subsidiaries or otherwise) of any of the Group’s investees held during the period or comparative periods covered by these financial statements.
AASB 11 Joint Arrangements
• AASB 11 supersedes AASB 131 Interests in Joint Ventures (AAS 131) and AASB Interpretation 113 Jointly Controlled Entities- Non-Monetary-Contributions by Venturers. AASB 11 revises the categories of joint arrangement, and the criteria for classification into the categories, with the objective of more closely aligning the accounting with the investor’s rights and obligations relating to the arrangement. In addition, AASB 131’s option of using proportionate consolidation for arrangements classified as jointly controlled entities under that Standard has been eliminated. AASB 11 now requires the use of the equity method for arrangements classified as joint ventures (as for investments in associates).
• The Group’s does not maintain any joint arrangement within the scope of AASB 11. The application of AASB 11 did not have a material impact on the company.
AASB 12 Disclosure of interests in Other Entities
• AASB 12 integrates and makes consistent the disclosure requirements for various types of investments, including unconsolidated structured entities. It introduces new disclosure requirements about the risks to which an entity is exposed from its involvement with structured entities.
Consequential amendments to AASB 127 Separate Financial Statements and AASB 128 Investments in Associates and Joint Ventures
• AASB 127 now only addresses separate financial statements. AASB 128 brings investments in joint ventures into its scope. However, AASB 128’s equity accounting methodology remains unchanged.
AASB 13 Fair Value Measurement
• AASB 13 clarifies the definition of fair value and provides related guidance and enhanced disclosures about fair value measurements. It does not affect which items are required to be fair-valued. The scope of AASB 13 is broad and it applies for both financial and non-financial items for which other Australian Accounting Standards require or permit fair value measurements or disclosures about fair value measurements, except in certain circumstances.
• AASB 13 applies prospectively for annual periods beginning on or after 1 January 2013. Its disclosure requirements need not be applied to comparative information in the first year of application. The Group has however included as comparative information the AASB 13 disclosures that were required previously by AASB 7 Financial Instruments: Disclosures.
• The Group has applied AASB 13 for the first time in the current year.
Amendments to AASB 119 Employee Benefits
• The 2011 amendments to AASB 119 made a number of changes to the accounting for employee benefits, the most significant relating to defined benefit plans. The amendments:
Eliminate the ‘corridor method’ and requires the recognition of re-measurements (including actuarial gains and losses) arising in the reporting period in other comprehensive income;
Change the measurement and presentation of certain components of the defined benefit cost. The net amount in profit or loss is affected by the removal of the expected return on plan assets and interest cost components and their replacement by a net interest expense or income based on the net defined benefit asset or liability; and
Enhance disclosures, including more information about the characteristics of defined benefit plans and related risks.
• Under the amendments, employee benefits ‘expected to be settled wholly’ (as opposed to ‘due to be settled’ under the superseded version of AASB 119) within 12 months after the end of the reporting period are short-term benefits, and are therefore not discounted when calculating leave liabilities. As the Group does not expect all annual leave for all employees to be used wholly within 12 months of the end of reporting period, annual leave is included in ‘other long-term benefit’ and discounted when calculating the leave liability. This change has had no impact on the presentation of annual leave as a current liability in accordance with AASB 101 Presentation of Financial Statements.
• The application of AASB 119 did not have a material impact on the statement of comprehensive income, statement of financial position, statement of cash flows and on the earnings per share for the year ended 30 June 2013 and 30 June 2014.

NOTES TO THE FINANCIAL STATEMENTS for the year ended 30 June 2014
Page 28 of 62
1. STATEMENT OF SIGNIFICANT ACCOUNTING POLICIES (continued)
(d) Revenue recognition Revenue from the sale of goods is recognised in the relevant reporting period when there has been a significant transfer of risks and rewards to the customer and no further processing is required by the Group’s operations. In addition, the quality and quantity of the goods must be determined with reasonable accuracy, the price is known or determinable and collectability is probable. The point, at which risk passes, for the Group’s sales, is for the majority of the time, upon receipt of the bill of lading or equivalent when the commodity is actually delivered for shipment. Revenue is measured at the fair value of the consideration received or receivable.
Gold and silver sales
Revenue from the production of gold and silver is recognised when the group had a significant transfer of risk and rewards to the buyer.
Bill and hold sales,
Bill and hold sales in which delivery is delayed at the buyer’s request but the buyer takes title and accepts billing revenue is recognised when the buyer takes title, provided:
a) It is probable that delivery will be made b) The item on hand, identified and ready for delivery to the buyer at the time the sale is recognised
c) The buyer specifically acknowledges the deferred delivery instructions and d) The usual payment terms apply.
Interest Revenue
Interest revenue is recognised using the effective interest rate method, which for floating rate financial assets, is the rate inherent in the instrument.
(e) Income tax
The income tax expense (revenue) for the year comprises current income tax expense (income) and deferred tax expense (income).
Current income tax expense charged to the profit or loss is the tax payable on taxable income calculated using applicable income tax rates enacted, or substantively enacted, as at reporting date. Current tax
liabilities (assets) are therefore measured at the amounts expected to be paid to (recovered from) the relevant taxation authority.
Deferred income tax expense reflects movements in deferred tax asset and deferred tax liability balances during the year as well as unused tax losses.
Current and deferred income tax expense (income) is charged or credited outside profit or loss when the tax relates to items that are recognised outside profit or loss.
Deferred tax assets and liabilities are ascertained based on temporary differences arising between the tax bases of assets and liabilities and their carrying amounts in the financial statements. Deferred tax assets also result where amounts have been fully expensed but future tax deductions are available. No deferred income tax will be recognised from the initial recognition of an asset or liability, excluding a business combination, where there is no effect on accounting or taxable profit or loss.
Deferred tax assets and liabilities are calculated at the tax rates that are expected to apply to the period when the asset is realised or the liability is settled, based on tax rates enacted or substantively enacted at the reporting date. Their measurement also reflects the manner in which management expects to recover or settle the carrying amount of the related asset or liability.
Deferred tax assets relating to temporary differences and unused tax losses are recognised only to the extent that it is probable that future taxable profit will be available against which the benefits of the deferred tax asset can be utilised.
Where temporary differences exist in relation to investments in subsidiaries, branches, associates, and joint ventures, deferred tax assets and liabilities are not recognised where the timing of the reversal of the temporary difference can be controlled and it is not probable that the reversal will occur in the foreseeable future.
Current tax assets and liabilities are offset where a legally enforceable right of set-off exists and it is intended that net settlement or simultaneous realisation and settlement of the respective asset and liability will occur.

NOTES TO THE FINANCIAL STATEMENTS for the year ended 30 June 2014
Page 29 of 62
1. STATEMENT OF SIGNIFICANT ACCOUNTING POLICIES (continued)
Current tax assets and liabilities are offset where a legally enforceable right of set-off exists and it is intended that net settlement or simultaneous realisation and settlement of the respective asset and liability will occur.
Deferred tax assets and liabilities are offset where a legally enforceable right of set-off exists, the deferred tax assets and liabilities relate to income taxes levied by the same taxation authority on either the same taxable entity or different taxable entities where it is intended that net settlement or simultaneous realisation and settlement of the respective asset and liability will occur in future periods in which significant amounts of deferred tax assets or liabilities are expected to be recovered or settled.
(f) Property, Plant and Equipment
Each class of Property, plant and equipment is carried at cost less, where applicable, any accumulated depreciation and impairment losses.
Subsequent costs are included in the asset’s carrying amount or recognised as a separate asset, as appropriate, only when it is probable that future economic benefits associated with the item will flow to the Group and the cost of the item can be measured reliably. All other repairs and maintenance are charged to the profit or loss in the Statement of Profit or Loss and other Comprehensive Income during the financial period in which they are incurred.
Depreciation
Plant and equipment (excluding the Co-O mine and milling equipment) is depreciated applying the straight line method over their estimated useful lives, commencing from the time the asset is held ready for use.
Co-O mine and milling equipment ‘s useful life is estimated to approximate the expected life of the mine, the depreciation rate is based on a charge proportional to the depletion of estimated recoverable gold ounces contained in indicated and inferred resources.
Depreciation rates and methods are reviewed annually for appropriateness. When changes are made, adjustments are reflected prospectively in current and future periods only.
The depreciation rates used for each class of depreciable assets are: Class of fixed asset Depreciation method Depreciation rate (%)
Plant and equipment (excluding Co-O mine & milling equipment) Straight line 20% to 33% Office furniture and fittings Straight line 7.5% to 20%
An asset’s carrying amount is written down immediately to its recoverable amount if the asset’s carrying amount is greater than its estimated recoverable amount. Gains and losses on disposals are determined by comparing proceeds with the carrying amount. These gains and losses are included in profit or loss in the Statement of Profit or Loss and other Comprehensive Income.
(g) Impairment of non-financial assets
At each reporting date, the Group reviews the carrying values of its tangible and intangible assets to determine whether there is any indication that those assets have been impaired. If such an indication exists, the recoverable amount of the asset, being the higher of the asset’s fair value less costs to sell and value in use i.e. discounted cash flows, is compared to the asset’s carrying value. Any excess of the asset’s carrying value over its recoverable amount is expensed in the Statement of Profit or Loss and other Comprehensive Income. Impairment testing is performed annually for intangible assets with indefinite lives. Where it is not possible to estimate the recoverable amount of an individual asset, the Group estimates the recoverable amount of the cash-generating unit to which the asset belongs.
(h) Operating leases Lease payments for operating leases, where substantially all the risks and benefits remain with the lessor, are charged as straight line over the length of the lease.
Lease incentives under operating leases are recognised as a liability and amortised on a straight-line basis over the life of the lease term.

NOTES TO THE FINANCIAL STATEMENTS for the year ended 30 June 2014
Page 30 of 62
1. STATEMENT OF SIGNIFICANT ACCOUNTING POLICIES (continued)
(i) Payables Payables are initially recognised at fair value and due to their short term nature they are measured at amortised cost and not discounted.
(j) Trade and other receivables Trade receivables are initially recognised at fair value and subsequently measured at amortised cost, using the effective interest rate method, less any provision for impairment. Trade receivables are generally due for settlement within 30 days. Collectability of trade receivables is reviewed on an on-going basis. Debts which are known to be uncollectible are written off by reducing the carrying amount directly. A provision for impairment of trade receivables is raised when there is objective evidence that the consolidated entity will not be able to collect all amounts due according to the original terms of the receivables. Significant financial difficulties of the debtor, probability that the debtor will enter bankruptcy or financial reorganisation and default or delinquency in payments (more than 60 days overdue) are considered indicators that the trade receivable may be impaired. The amount of the impairment allowance is the difference between the asset’s carrying amount and the present value of estimated future cash flows, discounted at the original effective interest rate. Cash flows relating to short-term receivables are not discounted if the effect of discounting is immaterial. Other receivables are recognised at amortised cost, less any provision for impairment.
(k) Exploration and evaluation expenditure
Exploration and evaluation expenditure incurred by or on behalf of the Group is accumulated separately for each area of interest. Such expenditure comprises direct costs and does not include general overheads or administrative expenditure not having a specific nexus with a particular area of interest. Exploration expenditure for each area of interest is carried forward as an asset provided the rights to tenure of the area of interest are current and one of the following conditions is met: • The exploration and evaluation expenditures are expected to be recouped through successful
development and exploitation of the area of interest, or alternatively, by its sale; and • Exploration and evaluation activities in the area of interest have not at the reporting date reached a stage
which permits a reasonable assessment of the existence or otherwise of economically recoverable reserves, and active and significant operations in, or in relation to, the area of interest are continuing.
Exploration expenditure is written off when it fails to meet at least one of the conditions outlined above or an area of interest is abandoned. Exploration and evaluation assets are assessed for impairment when facts and circumstances suggest that the carrying amount of an exploration and evaluation asset may exceed its recoverable amount. When facts and circumstances suggest that the carrying amount exceeds the recoverable amount the impairment loss will be measured and disclosed in accordance with AASB 136 Impairment of Assets. When a decision is made to develop an area of interest, all carried forward exploration expenditure in relation to the area of interest is transferred to development expenditure.
(l) Development expenditure
Development expenditure represents the accumulated exploration, evaluation, land and development expenditure incurred by or on behalf of the Group in relation to areas of interest in which mining of a mineral resource has commenced.
When further development expenditure is incurred in respect of a mine property after commencement of production, such expenditure is carried forward as part of the mine property only when substantial future economic benefits are thereby established, otherwise such expenditure is classified as part of the cost of production. All horizontal development drives which include permanent rail and associated infrastructure are capitalised.
Amortisation of costs is provided on the unit-of-production method with separate calculations being made -for each mineral resource. The unit-of-production basis results in an amortisation charge proportional to the depletion of the estimated recoverable reserves. In some circumstances, where conversion of resources into reserves is expected, some elements of resources may be included. Where the life of the assets are shorter than the mine life their costs are amortised based on the useful life of the assets.
The estimated recoverable reserves and life of the mine and the remaining useful life of each class of asset is reassessed at least annually. Where there is a change in the reserves/resources amortisation rates are correspondingly adjusted.

NOTES TO THE FINANCIAL STATEMENTS for the year ended 30 June 2014
Page 31 of 62
1. STATEMENT OF SIGNIFICANT ACCOUNTING POLICIES (continued)
(m) Rehabilitation costs
Rehabilitation costs that are expected to be incurred are provided for as part of the cost of the exploration, evaluation, development, construction or production phases that give rise to the need for restoration. Accordingly, these costs are recognised gradually over the life of the facility as these phases occur. The costs include obligations relating to reclamation, waste site closure, plant closure and other costs associated with the rehabilitation of the site.
These estimates of the rehabilitation obligation are based on anticipated technology and legal requirements and future costs, which have been discounted to their present value. Any changes in the estimates are adjusted on a progressive basis. In determining the rehabilitation obligations, the entity has assumed no significant changes will occur in the relevant Federal, State or foreign legislation in relation to rehabilitation of such minerals projects in the future. At the reporting date, the group does not consider it has any significant unsatisfied obligations in respect to rehabilitation costs.
(n) Employee benefits
Provision is made for the Group liability for employee benefits arising from services rendered by employees to reporting date. Employee benefits expected to be settled within 12 months together with entitlements arising from wages, salaries and annual leave which will be settled after 12 months, have been measured at the amounts expected to be paid when the liability is settled plus related on-costs.
Other employee benefits payable later than 12 months have been measured at the present value of the estimated future cash outflows to be made for those benefits.
Contributions are made by the Group to several employee superannuation funds and are charged as expenses when incurred.
In respect of defined benefit plans, the cost of providing the benefits is determined using the projected unit credit method. Actuarial valuations are conducted every three years, with valuations performed on an annual basis. Consideration is given to any event that could impact the funds up to the end of the reporting period where the interim valuation is performed at an earlier date.
The amount recognised in the Statement of Financial Position represents the present value of the defined benefit obligations adjusted for any unrecognised actuarial gains and losses and unrecognised past service costs less the fair value of the plan’s assets. Any asset recognised is limited to unrecognised actuarial
losses, plus the present value of available refunds and reductions in future contributions to the plan.
Actuarial gains and losses are amortised over the expected average remaining working lives of the participating employees in the plan. Gains or losses on the curtailment or settlement of a defined benefit plan are recognised in the profit or loss in the Statement of Profit or Loss and other Comprehensive Income when the Group demonstrates commitment to the curtailment or settlement.
Past service costs are recognised when incurred to the extent that benefits are vested, and are otherwise amortised on a straight-line basis over the vesting period.
(o) Goods and services tax
Revenues, expenses and assets are recognised net of the amount of goods and services tax (“GST”), except where the amount of GST incurred is not recoverable from the Australian Tax Office (“ATO”). In these circumstances the GST is recognised as part of the cost of acquisition of the asset or as part of an item of the expense.
Receivables and payables are stated with the amount of GST included. The net amount of GST recoverable from, or payable to, the ATO is included as a current asset or liability in the Statement of Financial Position. Cash flows are included in the Statement of Cash Flows on a gross basis. The GST components of cash flows arising from investing and financing activities which are recoverable from, or payable to, the ATO are classified as operating cash flows.
(p) Operating Segments
Operating Segments are identified on the basis of internal management reports that are regularly reviewed by the entity’s chief operating decision maker, for the purposes of allocating resources and assessing performance. Segment revenues and expenses are those directly attributable to the segments. Segment assets consist principally of cash, receivables, other financial assets, property, plant and equipment, net of allowances and accumulated depreciation and mineral properties. Segment liabilities consist principally of accounts payable and provisions.

NOTES TO THE FINANCIAL STATEMENTS for the year ended 30 June 2014
Page 32 of 62
1. STATEMENT OF SIGNIFICANT ACCOUNTING POLICIES (continued)
(q) Earnings per share
Basic earnings per share ("EPS") is calculated by dividing the net profit or loss attributable to members of the Company for the reporting period, after excluding any costs of servicing equity (other than ordinary shares and converting preference shares classified as ordinary shares for EPS calculation purposes), by the weighted average number of ordinary shares of the Company, adjusted for any bonus issue.
Diluted EPS is calculated by dividing the basic EPS earnings, adjusted by the after tax effect of financing costs associated with potential ordinary shares and the effect on revenues and expenses of conversion to ordinary shares associated with potential ordinary shares, by the weighted average number of ordinary shares and potential ordinary shares adjusted for any bonus issue.
(r) Foreign currency transactions and balances
Functional and presentation currency
The functional currency of each of the Group’s entities is the currency of the primary economic environment in which that entity operates. Though the Company’s functional currency is Australian dollar the presentation currency for the Group is US dollar. The reason for using US dollar as the presentation currency is that the US dollar is the primary currency used in the global gold market.
Transaction and balances
Foreign currency transactions are translated into functional currency using the exchange rates prevailing at the date of the transaction. Foreign currency monetary items are translated at the year-end exchange rate. Non-monetary items measured at historical cost continue to be carried at the exchange rate at the date of the transaction.
Non-monetary items measured at fair value are reported at the exchange rate at the date when fair values were determined.
Exchange differences arising on the translation of monetary items are recognised in the profit before income tax in the Statement of Profit or Loss and other Comprehensive Income.
Group companies
The financial results and position of foreign operations whose functional currency is different from the Group’s presentation currency are translated as follows: - assets and liabilities are translated at year-end exchange rates prevailing at that reporting date; - income and expenses are translated at average exchange rates for the period where this approximates
rate at the transaction date; and - retained earnings are translated at the exchange rates prevailing at the date of the transaction.
Exchange differences arising on translation of foreign operations are recognised in other comprehensive income and accumulated in the foreign currency translation reserve in the Statement of Financial Position. These differences are reclassified from equity to profit or loss (as a reclassification adjustment) in the period in which the operation is disposed.
The functional currency of the parent entity, Medusa Mining Limited is Australian dollar, Mindanao Mineral Processing and Refining Corporation is United States dollar and the remaining entities are Philippine pesos. The reason for using US dollar as the presentation currency is that the US dollar is the primary currency used in the global gold market.
(s) Cash and cash equivalents
For the purpose of the Statement of Cash Flows, cash and cash equivalents include: - cash on hand and at call deposits with bank or financial institutions, net of bank overdrafts; and - investments in money market instruments with less than 30 days to maturity.
These amounts are readily convertible to known amounts of cash and which are subject to an insignificant risk of changes in value.

NOTES TO THE FINANCIAL STATEMENTS for the year ended 30 June 2014
Page 33 of 62
1. STATEMENT OF SIGNIFICANT ACCOUNTING POLICIES (continued)
(t) Financial instruments
Recognition, Initial Measurement and Derecognition
Financial assets and financial liabilities are recognised when the Group becomes a party to the contractual provisions of the financial instrument, and are measured initially at fair value adjusted by transactions costs, except for those carried at fair value through profit or loss, which are measured initially at fair value. Subsequent measurement of financial assets and financial liabilities are described below.
Financial assets are derecognised when the contractual rights to the cash flows from the financial asset expire, or when the financial asset and all substantial risks and rewards are transferred. A financial liability is derecognised when it is extinguished, discharged, cancelled or expires.
Classification and Subsequent Measurement of Financial Assets
For the purpose of subsequent measurement, financial assets other than those designated and effective as hedging instruments are classified into the following categories upon initial recognition: • Loans and receivables • Financial assets at Fair Value Through Profit or Loss (‘FVTPL’) • Held-To-Maturity (‘HTM’) investments; or • Available-For-Sale (‘AFS’) financial assets
All financial assets except for those at FVTPL are subject to review for impairment at least at each
reporting date to identify whether there is any objective evidence that a financial asset or a group of financial assets is impaired. Different criteria to determine impairment are applied for each category of financial assets, which are described below.
All income and expenses relating to financial assets that are recognised in profit or loss are presented within finance costs, finance income or other financial items, except for impairment of trade receivables which is presented within other expenses.
Loans and Receivables
Loans and receivables are non-derivative financial assets with fixed or determinable payments that are not
quoted in an active market. After initial recognition, these are measured at amortised cost using the effective interest method, less provision for impairment. Discounting is omitted where the effect of discounting is immaterial. The Group's cash and cash equivalents, trade and most other receivables fall into this category of financial instruments.
Individually significant receivables are considered for impairment when they are past due or when other objective evidence is received that a specific counterparty will default. Receivables that are not considered to be individually impaired are reviewed for impairment in groups, which are determined by reference to the industry and region of a counterparty and other shared credit risk characteristics. The impairment loss estimate is then based on recent historical counterparty default rates for each identified group.
HTM Investments
HTM investments are non-derivative financial assets with fixed or determinable payments and fixed maturity other than loans and receivables. Investments are classified as HTM if the Group has the intention and ability to hold them until maturity. The Group currently holds listed bonds designated into this category.
HTM investments are measured subsequently at amortised cost using the effective interest method. If there is objective evidence that the investment is impaired, determined by reference to external credit ratings, the financial asset is measured at the present value of estimated future cash flows. Any changes to the carrying amount of the investment, including impairment losses, are recognised in profit or loss.
Classification and subsequent measurement of financial liabilities
The Group’s financial liabilities include borrowings, trade and other payables.
Financial liabilities are measured subsequently at amortised cost using the effective interest method, except for financial liabilities held for trading or designated at FVTPL, that are carried subsequently at fair value with gains or losses recognised in profit or loss. All derivative financial instruments that are not designated and effective as hedging instruments are accounted for at FVTPL.
NOTES TO THE FINANCIAL STATEMENTS for the year ended 30 June 2014
Page 34 of 62
1. STATEMENT OF SIGNIFICANT ACCOUNTING POLICIES (continued)
(u) Inventories
Raw materials and stores, ore stockpiles and work in progress and finished gold stocks are physically measured or estimated and valued at the lower of cost and net realisable value. Net realisable value less costs to sell is assessed annually based on the amount estimated to be obtained from sale of the item of inventory in the normal course of business, less any anticipated costs to be incurred prior to its sale.
Cost comprises direct materials, direct labour and an appropriate proportion of variable and fixed overhead expenditure and depreciation and amortisation relating to mining activities, the latter being allocated on the basis of normal operating capacity. Costs are assigned to individual items of inventory on the basis of weighted average costs. Net realisable value is the estimated selling price in the ordinary course of business, less the estimated costs of completion and the estimated costs necessary to make the sale.
Inventories of consumable supplies and spare parts expected to be used in production are valued at the lower of weighted average cost, which includes the cost of purchase as well as transportation and statutory charges, or net realisable value. Any provision for obsolescence is determined by reference to specific stock items identified.
Gold Inventory is comprised of gold in circuit and gold dore held at site where risk and reward has not passed to the customer. During the exploration and development phase, where the cost of extracting the ore exceeds the likely recoverable amount, work in progress inventory is written down to net realisable value.
(v) Share based payments
The fair value of the equity to which employees become entitled is measured at grant date and recognised as an expense over the vesting period, with a corresponding increase to an equity account.
The fair value of options is ascertained using a Black-Scholes pricing model. The number of shares and options expected to vest is reviewed and adjusted at each reporting date such that the amount recognised for services received as consideration for the equity instruments granted shall be based on the number of equity instruments that eventually vest.
(w) Defined Benefit Fund
The Company has a funded non-contributory retirement plan for employees in the Philippines. The cost of providing benefits is determined using the Projected Unit Credit Method which reflects services rendered by employees to the date of valuation and incorporates assumptions concerning employees’ projected salaries.
The retirement benefit obligation recognised in the Statement of Financial Position represents the present value of the defined benefit obligation as adjusted for unrecognised past service cost, and as reduced by the fair value of plan assets.
The funding policy is to contribute an amount based on the actuarial valuation report which is carried out at regular intervals.
(x) Critical accounting estimates and judgments
The directors evaluate estimates and judgments incorporated into the financial report based on historical knowledge and best available current information. Estimates assume a reasonable expectation of future events and are based on current trends and economic data, obtained both externally and within the Group.
Key estimates - Impairment of non-financial assets
The Group assesses impairment at each reporting date by evaluating conditions specific to the Group that may lead to impairment of non-financial assets (refer note 1(g)). Where an impairment trigger exists, the recoverable amount of the asset is determined. Value-in-use calculations performed in assessing recoverable amounts incorporate a number of key estimates. Refer to details of key elements and carrying values of non-financial assets at note 11.
Key estimates - Recoverability of long lived assets
Certain assumptions are required to be made in order to assess the recoverability of capitalised development expenditure (refer to note 12). Key assumptions include the future price of gold, future cash flows, an estimated discount rate and estimates of ore reserves. In addition, cash flows are projected over the life of mine, which is based on proved and probable ore reserves. Estimates of ore reserves in themselves are dependent on various assumptions, in addition to those described above, including cut-off grades. Changes in these estimates could materially impact on ore reserves, and could therefore affect estimates of future cash flows used in the assessment of recoverable amount.

NOTES TO THE FINANCIAL STATEMENTS for the year ended 30 June 2014
Page 35 of 62
1. STATEMENT OF SIGNIFICANT ACCOUNTING POLICIES (continued)
Key estimates - Determination of ore reserves and remaining mine life
The Company estimates its ore reserves and mineral resources based on information compiled by Competent Persons (as defined in accordance with the Australian Code for Reporting of Exploration Results, Mineral Resources and Ore Reserves as revised December 2004 (the JORC code)). Reserves determined in this way are taken into account in the calculation of depreciation of mining plant and equipment (refer to note 11), amortisation of capitalised development expenditure (refer to note 12), and impairment relating to these assets.
In estimating the remaining life of the mine for the purpose of amortisation and depreciation calculations, due regard is given, not only to the amount of remaining recoverable gold ounces contained in proved and probable ore reserves, but also to limitations which could arise from the potential for changes in technology, demand, and other issues which are inherently difficult to estimate over a lengthy time frame.
Where a change in estimated recoverable gold ounces contained in proved and probable ore reserves is made, depreciation and amortisation is accounted for prospectively,
The determination of ore reserves and remaining mine life affects the carrying value of a number of the consolidated entity’s assets and liabilities including deferred mining costs and the provision for rehabilitation.
Key estimates - Exploration and evaluation expenditure
The consolidated entity’s accounting policy for exploration and evaluation expenditure (refer to note 12) results in certain items of expenditure being capitalised for an area of interest where it is considered likely to be recoverable by future exploitation or sale where the activities have not reached a stage which permits a reasonable assessment of the existence of reserves. This policy requires management to make certain estimates and assumptions as to future events and circumstances, in particular whether an economically viable extraction operation can be established. Any such estimates and assumptions may change as new information becomes available. If, after having capitalised the expenditure under the policy, a judgement is made that recovery of the expenditure is unlikely, the relevant capitalised amount will be written off to the profit and loss in the Statement of Profit or Loss and other Comprehensive Income.
Key estimates - Development expenditure
Development activities commence after project sanctioning by the appropriate level of management. Judgement is applied by management in determining when a project is economically viable. In exercising this judgment, management is required to make certain estimates and assumptions similar to those described above for capitalised exploration and evaluation expenditure. Any such estimates and assumptions may change as new information becomes available. If, after having commenced the development activity, a judgement is made that a development asset is impaired, the appropriate amount will be written off to the Statement of Profit or Loss and other Comprehensive Income.
Key estimates - Share based payments
The consolidated entity measures the cost of equity-settled transactions with employees by reference to the fair value of the equity instruments at the date at which they are granted. The fair value is determined by using the Black-Scholes model taking into account the terms and conditions upon which the instruments were granted. The accounting estimates and assumptions relating to equity-settled share-based payments would have no impact on the carrying amounts of assets and liabilities within the next annual reporting period but may impact profit or loss and equity. (Refer to note 19).
Key estimates - VAT
The company has net VAT of $30m that comprises tax credit certificates (TCC) and VAT claimable for cash. The current asset portion of VAT $17m comprises amounts that are estimated to be utilised by TCC to offset various indirect taxes within the current period. The non-current amount of VAT receivable of $13m represents the estimated amount utilised in future periods against tax liabilities of $13m.
(y) Rounding of amounts
The Company has applied the relief available to it under Class Order 98/100 and accordingly, amounts in the financial report and directors’ report have been rounded to the nearest $1,000

NOTES TO THE FINANCIAL STATEMENTS for the year ended 30 June 2014
Page 36 of 62
Consolidated 2014 2013 US$000 US$000
2. REVENUE
Operating activities:
Gold and silver sales 83,882 100,622
Non-operating activities:
Interest revenue 160 24 Foreign exchange gain 72 3 Other 82 31
Total revenue 84,196 100,680
3. EXPENSES
Profit before income tax expense/(income) has been determined after charging/(crediting) the following items:
Depreciation of non-current assets 9,062 6,121 Amortisation expense 8,479 6,934
Total depreciation & amortisation 17,541 13,055 Employee benefits expense 5,954 6,366
Defined Contribution 90 73
Defined Benefit 480 298
Exploration expenditure written off 107 6,849
Impairment losses: - assets written off 552 61
552 61
Operating lease rental: - minimum lease payments 102 87
4. DIVIDENDS
No Final dividend was declared (2013: 2 cents a share declared on 29 August 2012 and paid on 4 October 2012) - 3,925
No Interim dividend was declared - -
- 3,925

NOTES TO THE FINANCIAL STATEMENTS for the year ended 30 June 2014
Page 37 of 62
Consolidated 2014 2013 US$000 US$000
5. TAXATION
(a) The components of tax expense comprise: Current tax - 116 Deferred tax 261 (112) Under / Over (472) -
(211) 4
(b) The prima facie tax on profit before income tax is reconciled to the income tax as follows:
Operating profit before income tax 30,660 50,185 Prima facie income tax expense/(credit) at 30% (2011: 30%) on operating profit 9,198 15,056
less - tax effect of: Other non-deductible/(non-assessable) expenses 1,162 1,266 Difference of effective foreign income tax rates (10,349) (17,700) Deferred tax adjustment 250 1,382 Under / Over (472) -
Income tax expense/(benefit) (211) 4
The applicable weighted average effective tax rates are as follows 0% 0%
The reason for the 0% weighted average effective tax rate for the current year is due to the impact of the tax free holiday in Mindanao Mineral Processing and Refining Corporation, a subsidiary of the parent entity, through which sales of bullion are recorded.
(c) Deferred tax assets not brought to account, the benefits of which will only be realised if the conditions for deductibility set out in Note 1(e) occur:-
- Temporary differences 263 1,515 - Australian tax losses 3,290 2,775 - Philippine tax losses - -
3,553 4,290
The benefit of tax losses will only be obtained if:
(i) the Group derives future assessable income of a nature and of an amount sufficient to enable the benefit to be realised; (ii) the Group continues to comply with the conditions for deductibility imposed by the law; and (iii) no changes in tax legislation adversely affect the Group in realising the benefit.
6. EARNINGS PER SHARE
Earnings used to calculate basic and diluted EPS 30,871 50,181 Weighted average number of ordinary shares used in the calculation of the basic earnings per share. 200,632,560 188,903,911
Weighted average unlisted options outstanding 1,632,692 1,964,313
Weighted average of ordinary shares diluted as at 30 June 2014 202,265,252 190,868,224

NOTES TO THE FINANCIAL STATEMENTS for the year ended 30 June 2014
Page 38 of 62
Consolidated 2014 2013 US$000 US$000
7. CURRENT RECEIVABLES
Gold awaiting settlement 619 2,881
GST/VAT receivables 8,410 23,315
Other receivables 3,001 3,421
Total current receivables 12,030 29,617 Refer ageing analysis in Financial Instruments Note 25(b).
8. INVENTORIES
Consumables - at cost 9,916 9,283
Ore stockpile - at cost 2,862 3,593
Gold Inventory - at cost 5,306 5,463
Total inventories 18,084 18,339
9. OTHER CURRENT ASSETS
Prepayments 512 662
10. NON CURRENT RECEIVABLES
GST/VAT receivables 21,489 2,600
Total non-current receivables 21,489 2,600
11. PROPERTY, PLANT & EQUIPMENT
Plant & equipment:
At cost 147,660 124,010
less - accumulated depreciation (32,476) (22,832)
Total plant and equipment at net book value 115,184 101,178
Furniture & fittings:
At cost 799 769
less - accumulated depreciation (513) (398)
Total furniture & fittings at net book value 286 371
Total carrying amount at end of year 115,470 101,549
Reconciliations:
Plant and equipment:
Carrying amount at beginning of year 101,178 63,563
plus - additions 23,582 44,154
less - disposal (131) -
plus - forex differences on translation (570) 264
less - depreciation (8,875) (6,803)
Carrying amount at end of year 115,184 101,178

NOTES TO THE FINANCIAL STATEMENTS for the year ended 30 June 2014
Page 39 of 62
Consolidated 2014 2013 US$000 US$000
11. PROPERTY, PLANT & EQUIPMENT (continued)
Furniture & fittings:
Carrying amount at beginning of year 371 366
plus - additions 39 121
less - disposals (61) (61)
plus - forex differences on translation 56 55
less - depreciation (119) (110)
Carrying amount at end of year 286 371
12. EXPLORATION , EVALUATION & DEVELOPMENT EXPENDITURE
Exploration and evaluation expenditure:
At cost 29,857 29,186
Development expenditure:
At cost 264,991 215,482
less - accumulated amortisation (33,105) (24,706)
Net development expenditure 231,886 190,776
Total carrying amount at end of year 261,743 219,962
Reconciliations:
Exploration and evaluation expenditure:
Carrying amount at beginning of year 29,186 42,461
plus - costs incurred 15,768 24,017
less - transferred to development (10,949) (25,973)
less - expenditure written off (107) (6,849)
plus/(less) - forex differences upon translation (4,041) (4,470)
Carrying amount at end of year 29,857 29,186
Development expenditure:
Carrying amount at beginning of year 190,776 140,436
plus - costs incurred 36,329 34,494
plus - transferred from exploration 10,949 25,973
less - amortisation expense (8,399) (7,831)
plus - forex differences upon translation 2,231 (2,296)
Carrying amount at end of year 231,886 190,776

NOTES TO THE FINANCIAL STATEMENTS for the year ended 30 June 2014
Page 40 of 62
Consolidated 2014 2013 US$000 US$000
13. BORROWINGS
Current borrowings
Unsecured liability – Interest bearing loan 7,132 1,725
Total Current borrowings 7,132 1,725
Non-Current borrowings
Secured liability – Interest bearing loan 662 134
Unsecured liability – Interest bearing loan 1,540 394
Total Non-Current borrowings 2,202 528
Total 9,334 2,253
Metropolitan Bank and Trust Company
Philsaga Mining Corporation ("Philsaga"), a subsidiary of the Company, obtained loans from Metropolitan Bank and Trust Company in 2014 and 2013 amounting to U$13.4M and U$4.5M, respectively. These loans bear interest rates ranging from 3.75% to 4.00% and have terms of one (1) to sixty (60) months. As of June 30, 2014 and 2013, the outstanding balances of these loans amounted to U$8.2M and U$1.6M, respectively. These amounts include loans that are denominated in Euro and Dollar acquired during the year.
14. EMPLOYEE BENEFITS
Current:
Employee benefits 740 1,017
Total current employee benefit 740 1,017
Non-Current:
Retirement Benefit 1,354 753
Total current employee benefit 1,354 753
The Retirement benefit in Non-current liabilities relates to Philippine based employees defined benefit plan. The most recent actuarial valuations of plan assets and the present value of the defined benefit obligation were carried out at 30 June 2014. The present value of the defined benefit obligation and the related current service cost and past service cost was measured using the Projected Unit Credit Method.
The principal assumptions used for the purposes of the actuarial valuations were as follows:
Discount Rate 5.15% 6.14% Expected rate of salary increase 3.00% 3.00%
Assumptions were developed by management with the assistance of independent actuarial appraisers. Discount factors are determined close to year-end by reference to high quality Government bonds that are denominated in the currency in which the benefits will be paid and that have terms to maturity approximating to the terms of the related pension obligation. Other assumptions are based on management’s historical experience.

NOTES TO THE FINANCIAL STATEMENTS for the year ended 30 June 2014
Page 41 of 62
2014 2013 US$000 US$000
14. EMPLOYEE BENEFITS (continued)
Amounts recognised in profit or loss in respect of these defined benefit plans are as follows:
Current service cost 280 191
Interest on obligation 55 46
Amortisation of past service cost-non vested 40 61
Total 375 298
The amount included in the statements of financial position arising from the entity’s obligation in respect of its defined benefit plans is as follows:
Present Value of defined benefit obligation 1,745 910
Unrecognised actuarial loss (276) (40)
Unamortised past service cost-non vested (115) (117)
Total 1,354 753
Movements in the present value of the defined benefit obligation in the current period were as follows:
Balance beginning 910 739
Current service cost 280 191
Interest Cost 55 46
Unrecognised actuarial loss 313 -
Benefits paid (157) (44)
Foreign exchange gains/(loss) 344 (22)
Balance ending 1,745 910
The Company has no plan assets held by trustees but an employee retirement fund amounting to US$1,129,391(2013:US$1,145,538) was appropriated as at June 30, 2014. The employee retirement fund is presented as part of cash at bank.
Consolidated
Opening Balance
Forex on
translation
Credit/ (charged) to Income
Closing Balance
US$000 US$000 US$000 US$000
15. DEFERRED TAX
Consolidated Group
30 June 2014
Deferred tax liability
Capitalised exploration & evaluation expenditure 141 - 1,641 1,782
Deferred tax assets
Carried forward tax losses 1,451 - 2 1,453
Other 152 - 1,378 1,530
Carried forward tax losses 1,603 - 1,380 2,983

NOTES TO THE FINANCIAL STATEMENTS for the year ended 30 June 2014
Page 42 of 62
Consolidated
Opening Balance
Forex on
translation
Credit/ (charged) to Income
Closing Balance
US$000 US$000 US$000 US$000
15. DEFERRED TAX (continued)
Consolidated Group
30 June 2013
Deferred tax liability
Capitalised exploration & evaluation expenditure 257 (4) (112) 141
Deferred tax assets
Carried forward tax losses 78 233 1,321 1,632
Other 152 152
Carried forward tax losses 1,632 (29) - 1,603 Consolidated
2014 2013 US$000 US$000
16. AUDITOR’S REMUNERATION
Remuneration received or due and receivable by the Company’s auditors, Grant Thornton Audit Pty Ltd for:
• auditing or reviewing the financial reports 149 149 • other services:
- financial reporting advice - 11 - other services provided by related practice of auditor - taxation and compliance 5 15
Total auditor’s remuneration 154 175
Remuneration of other auditors of the Company’s Philippines subsidiaries for:
• auditing or reviewing the financial reports 73 67
• other services:
- other services provided by related practice of auditor - legal and taxation 5 13
Total auditor’s remuneration 78 80

NOTES TO THE FINANCIAL STATEMENTS for the year ended 30 June 2014
Page 43 of 62
Consolidated 2014 2013 US$000 US$000
17. ISSUED CAPITAL
207,794,301 ordinary shares (30 June 2013: 188,903,911) 102,902 73,070
Total issued capital 102,902 73,070
Ordinary shares
Balance at beginning of year 73,070 73,070
Ordinary shares issued during the year: (i) Ordinary shares issued - new issues 29,832 -
Balance at end of year 102,902 73,070
Ordinary shares
Ordinary shares entitle the holder to participate in dividends and the proceeds on the winding up of the company in proportion to the number of and amounts paid on the shares held. The fully paid ordinary shares have no par value.
On a show of hands every member present at a meeting in person or by proxy shall have one vote and upon a poll each share shall have one vote.
Balance at beginning of year 188,903,911 188,903,911
Ordinary shares issued during the year: 07 November 2013 @ A$1.80 9,445,195 - 25 November 2013 @ A$1.80 9,445,195 -
Balance at end of year 207,794,301 188,903,911
Capital Management
Management controls the capital of the Group by monitoring performance against budget to provide the shareholders with adequate returns and ensure that the Group can fund its operations and continue as a going concern.
The Group's liabilities and capital includes ordinary share capital, options and financial liabilities, supported by financial assets.
Management effectively manages the Group’s capital by assessing the Group’s financial risks and adjusting its capital structure in response to changes in these risks and in the market. These responses include the management of debt levels, distributions to shareholders and share issues.
Consolidated
2014 2013 US$000 US$000
Capital for the reporting period under review is summarised as follows:
Total Equity 412,306 356,250
Cash and cash equivalents (13,063) (4,698)
Capital 399,243 351,552
Total equity 412,306 356,250
Borrowings 9,334 2,253
Overall financing 421,640 358,503
Capital-to-overall financing ratio 95% 98%

NOTES TO THE FINANCIAL STATEMENTS for the year ended 30 June 2014
Page 44 of 62
Consolidated 2014 2013 US$000 US$000
18. RESERVES
Option and performance rights reserve 4,638 4,448
Foreign currency translation reserve 8,802 13,639
Total reserves 13,440 18,087
(a) Option and performance rights reserve The option reserve records items recognised as expenses on valuation of share based payments. Unlisted options over ordinary shares at 30 June 2014
(unless otherwise stated, all unlisted options and performance rights have full vesting rights) • 575,000 options expiring 3 July 2014 and exercisable at A$8.10 each
(the options were fully vested at reporting date). • 1,000,000 options expiring 3 January 2015 and exercisable at A$5.10 each
(the options were fully vested at reporting date).
The above unlisted options and performance rights do not entitle the holders to participate in any share issue of the Company.
(b) Foreign Currency Translation Reserve
The foreign currency translation reserve for the group records exchange differences arising on translation of foreign controlled subsidiaries.
19. SHARE BASED PAYMENTS
The following share based payment arrangements existed during 30 June 2014: (i) Under an agreement dated 14 September 2009, and subsequently approved by shareholders at the
Annual General Meeting held on 17 November 2010, 150,000 options to acquire fully paid ordinary shares of the Company were issued to a consultant. The options were valued at A$1.872 using a Black Scholes options pricing model. This price was calculated under this valuation model (using historical share price volatility measures) and applying the following inputs: Weighted average exercise price A$4.40 Weighted average life of option - 36 months Share price volatility - 60% Risk free rate - 5.13% Dividend Yield - 0.81%
At reporting date 140,000 options remain unexercised.
(ii) On 4 July 2011, 575,000 options were issued to Philippine based employees. The options, which hold no voting or dividend rights have an expiry date of 3 July 2014 and are exercisable at A$8.10 per option. Under the terms of the Issue the employees would be required to remain in the employment of the Company at 3 July 2012 to achieve 50% vesting of the options, with full vesting if they remain employees of the Company a year later on 3 July 2013. At reporting date all options remain unexercised.

NOTES TO THE FINANCIAL STATEMENTS for the year ended 30 June 2014
Page 45 of 62
(iii) At the Company’s Annual General Meeting on 10 November 2011 shareholders approved the issue of 250,000 Performance Rights to the Managing Director Peter Hepburn-Brown. A Performance Right entitles Mr Brown to acquire one fully paid ordinary share in the Company subject to the satisfaction of certain performance criteria, as set out in the terms of the grant of the performance right. Under the terms of the grant Mr Brown (resigned 19 august 2014) would be required to remain in the employment of the Company at the vesting date.
During the year 2013, 250,000 Performance Rights lapsed due to performance criteria not being met.
The vesting periods applicable to the Performance Rights are as follows:
Number of Tranche 1 Rights Grant Date Vesting Date
100,000 (40% of the total number of Performance
Rights)
11 November 2011 As soon as the new Co-O Plant is successfully commissioned within budget, but provided this successful commissioning of the Co-O Plant within budget occurs on or before 30 June 2013.
Number of Tranche 2 Rights Grant Date Vesting Date
Year 1
50,000 (20% of the total number of Performance
Rights)
11 November 2011 30 June 2014 or 1 year after the Vesting Date of the Tranche 1 Performance Rights (whichever is the
earlier)
Year 2
50,000 (20% of the total number of Performance
Rights)
11 November 2011 30 June 2015 or 2 years after the Vesting Date of the Tranche 1 Performance Rights (whichever is the
earlier)
Year 3
50,000 (20% of the total number of Performance
Rights)
11 November 2011 30 June 2016 or 3 years after the Vesting Date of the Tranche 1 Performance Rights (whichever is the
earlier)
(iv) On 3 January 2012, 1,000,000 options were issued to Philippine based employees. The options which hold no voting or dividend rights, have an expiry date of 3 January 2015 and are exercisable at A$5.10 per option. Under the terms of the Issue the employees would be required to remain in the employment of the Company at 3 January 2013 to achieve 50% vesting of the options, with full vesting if they remain employees of the Company a year later on 3 January 2014. At reporting date all options remain unexercised.
2014 2013
Share based options and performance rights Number of options and performance
rights
Weighted average
exercise price (A$)
Number of options and performance
rights
Weighted average
exercise price (A$)
Outstanding at start of year 1,715,000 4.4000 1,965,000 4.4000
Granted - - -
Forfeited (140,000) - (250,000) -
Exercised - - -
Outstanding at year end 1,575,000 6.0487 1,715,000 6.0487
Exercisable at year end 4.4000 927,500 4.4000
During the year 2013, 250,000 Performance Rights lapsed due to performance criteria not being met.
The options and performance rights outstanding at 30 June 2014 (all of which are unlisted) had a weighted average exercise price of A$6.1952 and a weighted average remaining contractual life of 3.99 months.
Included under administration expense in the Statement of Profit or Loss and other Comprehensive Income is US$190,547 (2013: US$707,408) and relates, in full, to equity-settled share based payment transactions relating to employees.

NOTES TO THE FINANCIAL STATEMENTS for the year ended 30 June 2014
Page 46 of 62
20. INVESTMENT IN SUBSIDIARIES
The following companies are controlled entities of Medusa Mining Limited as at 30 June 2014:
Controlled Entities Date of
incorporation Country of
incorporation % interest held
2013 2012 Medusa Exploration & Development Corporation 29 May 2003 Philippines 40% 40%
Phsamed Mining Corporation 23 Apr 2003 Philippines 40% 40%
Medusa Overseas Holding Corporation 08 May 2003 Philippines 40% 40%
Philsaga Mining Corporation 17 May 2001 Philippines 40% 40%
Mindanao Mineral Processing and Refining Corporation 03 Nov 2005 Philippines 100% 100%
Medusa Mining Limited ("Medusa") holds 40% of the issued shares of Medusa Exploration and Development Corporation ("MEDC"). As Medusa has various agreements in place and pursuant to local statutory provisions, Medusa has effective sole rights to the economic returns of MEDC and its subsidiary companies. In such circumstances, the assets and liabilities of MEDC and its subsidiaries have been attributed 100% to the Consolidated Entity.
Consolidated
2014 2013 US$000 US$000
21. RETAINED PROFITS
Retained profit at start of year 265,093 218,837
Net profit attributable to members of Company 30,871 50,181
Dividends Paid - (3,925)
Retained profits at end of year 295,964 265,093

NOTES TO THE FINANCIAL STATEMENTS for the year ended 30 June 2014
Page 47 of 62
22. NOTES TO STATEMENT OF CASH FLOWS
(a) Reconciliation of cash: For the purposes of the Statement of Cash Flows, cash includes cash on hand and short term deposits at call, net of outstanding bank overdrafts. Cash at the end of the financial year as shown in the Statement of Cash Flows is reconciled to the related items in the Statement of Financial Position as follows:-
Cash at bank 13,062 4,697 Cash on hand 1 1
Total cash assets 13,063 4,698
(b) Reconciliation of profit after income tax to net cash provided by operating activities:
Profit after income tax 30,871 50,181 add/(less)- Non-cash items: - Depreciation/amortisation 17,541 13,055 - Exploration expenses written off 106 6,849 - Recognition of share based expenses 191 707 - Foreign exchange (gain) / loss (72) (1) - VAT write off 332 - - Loss on asset disposal / write off (19) 41 - Income tax credit /(expense) (253) 4
48,697 70,836 add/(less) - Changes in assets and liabilities - Decrease in trade and other receivables (1,303) 23,746 - Decrease/(Increase) in prepayments 150 44 - (Increase) in inventories 255 (3,692) - Decrease in trade & other payables 1,662 3,955 - (decrease) in deferred taxes payable 261 (87)
Net cash provided by operating activities 49,722 94,802
(c) Restricted Funds
The Group’s total cash assets mentioned above include restricted bank accounts as follows: (i) A Rehabilitation fund of US$359,823 (2013: US$359,380) to be used at the end of life of
mine for environmental rehabilitation. (ii) An Employee Retirement fund of US$1,129,391 (2013: US$1,145,538) established to
meet employee entitlements on retirement. (iii) The Company has a Provident fund of US$258,020 (2013: US$240,895) that is intended
to be used as payment to employees upon retirement, which is unrestricted as to withdrawal.
NOTES TO THE FINANCIAL STATEMENTS for the year ended 30 June 2014
Page 48 of 62
23. FINANCIAL RISK MANAGEMENT
(a) Financial Risk Management Policies
The Group’s financial instruments consist mainly of deposits with banks, local money market instruments, short-term investments, accounts receivable and payable.
The main purpose of non-derivative financial instruments is to raise finance for Group operations.
The Group does not speculate in the trading of derivative instruments.
(i) Treasury risk management
Senior executives of the Group regularly analyse financial risk exposure and evaluate treasury management strategies in the context of the most recent economic conditions and forecasts.
The Group’s overall risk management strategy is outlined in the Corporate Governance Statement in the Director’s Report.
(ii) Financial risk exposures and management
The main risks the Group is exposed to through its financial instruments are interest rate risk, foreign currency risk, liquidity risk, credit risk and price risk.
Interest rate risk
Interest rate risk is managed by investing cash with major financial institutions in both cash on deposit and term deposit accounts. Interest rates on major deposits that are re-invested, are at a fixed rate on a monthly basis.
Price risk
The Group sells its gold produced at spot rate and no forward contracts or hedging is utilised. Whilst the Group is cognisant of its exposure to fluctuations in the gold price, the current policy of the Board is not to hedge primarily because the Group produces gold in the current economic environment at a very low cash cost. The Board’s risk management policy acknowledges that as market factors are dynamic in nature all risk positions are monitored to ensure that the Group‘s activities are consistent with the approach and strategy approved by the Board. The Board therefore regularly reviews the spot price of gold to consider whether it should adopt any measures to mitigate risk.
Liquidity risk
The Group manages liquidity risk by monitoring forecast cash flows and ensuring that adequate unutilised borrowing facilities are maintained.
Credit risk
Credit risk refers to the risk that counterparty will default on, its contractual obligations resulting in financial loss to the Group. The Group has adopted the policy of only dealing with credit worthy counterparties and obtaining sufficient collateral or other security where appropriate, as a means of mitigating the risk of financial loss from defaults.
The maximum credit risk on financial assets of the Group which have been recognised in the Statement of Financial Position, other than investment in shares, is generally the carrying amount, net of any provisions for impairment.
There are no other material amounts of collateral held as security.
The Company holds bullion in an unallocated account (referred to as “Gold awaiting settlement” in the Current Receivables of the Statement of Financial Position) with a single reputable refiner.
The consolidated group does not have any other material credit risk exposure to any single receivable or group of receivables under financial instruments entered into by the consolidated group.
Foreign currency risk
Foreign exchange risk arises from future commercial transactions and recognised assets and liabilities denominated in a currency that is not the entity’s functional currency. The risk can be measured by performing a sensitivity analysis that quantifies the impact of different assumed exchange rates on the Group’s forecast cash flows.
Whilst the Group is aware of its exposure to fluctuations in foreign currency, the current policy of the Board is not to hedge.

NOTES TO THE FINANCIAL STATEMENTS for the year ended 30 June 2014
Page 49 of 62
(b) Financial instruments
(i) Financial instrument composition and maturity analysis:
The tables below reflect the undiscounted contractual settlement terms for financial instruments of a fixed period of maturity, as well as management’s expectations of the settlement period for all other financial instruments. As such, the amounts may not reconcile to the Statement of Financial Position.
Weighted Average
Effective interest Floating Interest Rate Within 1 Year Non-Interest
Bearing Total
2014 2013 2014 2013 2014 2013 2014 2013 2014 2013 % % US$000 US$000 US$000 US$000 US$000 US$000 US$000 US$000
Consolidated Group
Financial Assets Cash & cash equivalent 0.71 0.70 12,265 4,439 - - 798 259 13,063 4,698 Loans and receivables - - - - - - 3,620 6,302 3,620 6,302
12,265 4,439 - - 4,418 6,561 16,683 11,000 Financial Liabilities Financial liabilities at amortised cost Bank Loan - Current - - - - 7,132 - - - 7,132 - Bank Loan – Non Current - - - - 2,202 2,253 - - 2,202 2,253 Trade & sundry payables - - - - - - 19,954 18,616 19,954 18,616
- - 9,334 2,253 19,954 18,616 29,288 20,869
Consolidated 2014 2013 US$000 US$000 Receivables are expected to be collected as follows: Less than 6 months 3,620 6,302 6 months to 1 year - -
3,620 6,302
As at 30 June 2014 and 2013, all receivables were neither past due nor impaired.
Trade and sundry payables are expected to be paid as follows: Less than 6 months 19,891 18,616
19,891 18,616
(ii) Net fair values
The fair value of cash and cash equivalents and non- interest bearing monetary financial assets and liabilities approximates their carrying value. The fair value of financial assets and financial liabilities is based upon market prices where a market exists or by discounting the expected future cash flows by the current interest rates for assets and liabilities with similar risk profiles.
(iii) Sensitivity analysis The Group has performed sensitivity analysis relating to its exposure to interest rate risk, foreign
currency risk and price risk at reporting date. This sensitivity analysis demonstrates the effect on the current year results and equity, which could result from a change in these risks.
Interest Rate Sensitivity Analysis At 30 June 2014, the effect on profit and equity as a result of changes in the interest rate, with all other
variables remaining constant would be as follows:

NOTES TO THE FINANCIAL STATEMENTS for the year ended 30 June 2014
Page 50 of 62
Consolidated 2014 2013
US$000 US$000
Change in profit before income tax / equity - increase in interest rate by 100 basis points 123 41
- decrease in interest rate by 100 basis points (123) (41) Foreign currency risk sensitivity analysis
Foreign exchange risk arises from future commercial transactions and recognised assets and liabilities denominated in a currency that is not the consolidated entity’s functional currency. The consolidated entity operates internationally and is exposed to foreign exchange risk arising from the United States dollar. No programs for hedging foreign exchange risk were implemented by the consolidated entity in the 2011, 2013 and 2014 financial years.
The following table shows the foreign currency risk on the financial assets and liabilities of the Groups operations denominated in currencies other than the functional currency of the operations.
Net Financial Assets/(Liabilities) in US$000
Consolidated AUD US$ PHP TOTAL US$ 2014 Functional Currency of Group Entity Australian Dollar n/a 574 - 574 US Dollar - - 707 707 Philippine Peso - 740 - 740 - 1,314 707 2021 2013 Functional Currency of Group Entity Australian Dollar n/a 35 - 35 US Dollar - n/a 162 162 Philippine Peso - 305 n/a 305 - 340 162 502
Consolidated 2014 2013 US$000 US$000
Change in profit before income tax / equity
- strengthening of A$ to US$ by 15% (75) (5) - strengthening of Philippine Peso to US$ by 15% (19) 21 (94) 16 - weakening of A$ to US$ by 15% 75 5 - weakening of Philippine Peso to by 15% 19 (21) 94 (16) Price risk sensitivity analysis
The policy of the Company is to sell gold at spot price and has not entered in hedging contracts. The Company’s revenues were exposed to fluctuations in the price of gold. If the average selling price of gold of US$1,299 (2013: US$1,690) for the financial year had increased/decreased by 10% the change in the profit before income tax for the consolidated group would have been an increase/decrease of US$8.564 million (2013: US$12.476 million). The above interest rate, foreign exchange rate and price risk sensitivity analysis has been performed on the assumption that all other variables remain unchanged.
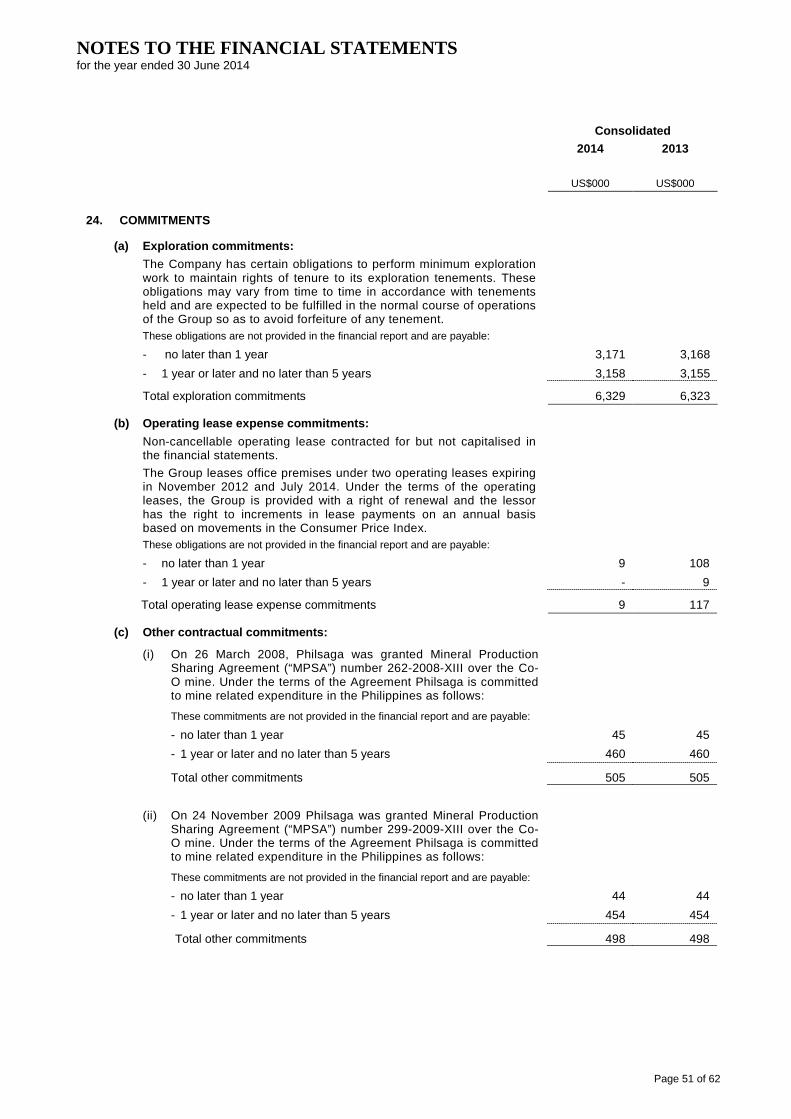
NOTES TO THE FINANCIAL STATEMENTS for the year ended 30 June 2014
Page 51 of 62
Consolidated
2014 2013
US$000 US$000
24. COMMITMENTS
(a) Exploration commitments: The Company has certain obligations to perform minimum exploration work to maintain rights of tenure to its exploration tenements. These obligations may vary from time to time in accordance with tenements held and are expected to be fulfilled in the normal course of operations of the Group so as to avoid forfeiture of any tenement. These obligations are not provided in the financial report and are payable:
- no later than 1 year 3,171 3,168 - 1 year or later and no later than 5 years 3,158 3,155
Total exploration commitments 6,329 6,323
(b) Operating lease expense commitments: Non-cancellable operating lease contracted for but not capitalised in the financial statements. The Group leases office premises under two operating leases expiring in November 2012 and July 2014. Under the terms of the operating leases, the Group is provided with a right of renewal and the lessor has the right to increments in lease payments on an annual basis based on movements in the Consumer Price Index. These obligations are not provided in the financial report and are payable:
- no later than 1 year 9 108 - 1 year or later and no later than 5 years - 9
Total operating lease expense commitments 9 117
(c) Other contractual commitments:
(i) On 26 March 2008, Philsaga was granted Mineral Production Sharing Agreement (“MPSA”) number 262-2008-XIII over the Co-O mine. Under the terms of the Agreement Philsaga is committed to mine related expenditure in the Philippines as follows:
These commitments are not provided in the financial report and are payable:
- no later than 1 year 45 45 - 1 year or later and no later than 5 years 460 460
Total other commitments 505 505
(ii) On 24 November 2009 Philsaga was granted Mineral Production Sharing Agreement (“MPSA”) number 299-2009-XIII over the Co-O mine. Under the terms of the Agreement Philsaga is committed to mine related expenditure in the Philippines as follows:
These commitments are not provided in the financial report and are payable:
- no later than 1 year 44 44 - 1 year or later and no later than 5 years 454 454
Total other commitments 498 498

NOTES TO THE FINANCIAL STATEMENTS for the year ended 30 June 2014
Page 52 of 62
25. EVENTS SUBSEQUENT TO REPORTING DATE
Mr Hepburn-Brown resigned as Managing Director and as a member of all Committees on 19 August 2014.
Mr Geoffrey Davis agreed to assume the role of Chief Executive Officer for an interim period following the resignation of Peter Hepburn-Brown as Managing Director, and will officially commence his role on 1 September 2014.
Other than the matter described above, there has not arisen in the interval between the end of the financial year and the date of this report any item, transaction or event of a material and/or unusual nature likely, in the opinion of the Directors of the Company, to affect significantly the operations of the Group, the results of those operations, or the state of affairs of the Group in subsequent financial years.
26. SEGMENT INFORMATION
The Consolidated Group has identified its reportable operating segments based on the internal management reports that are reviewed and used by the Managing Director (the chief operating decision maker) and his management team in assessing performance and in determining the allocation of resources.
The Group segments are structured as Mine, Exploration and Other. Currently the only operational mine is the Co-O mine. Other incorporates the Parent Entity’s activities
Segment Result, Segment Assets and Segment Liabilities
The measurement of segment results is in line with the basis of information presented to management for internal management reporting purposes.
Segment Result is based on the net of revenues and expenditure corresponding to the specific segment.
Segment Revenues represent gold and silver sales at spot prices.
Segments Assets are allocated to segments based on their nature and physical location.
Segment Liabilities are allocated to segments where there is a direct nexus between the incurrence of the liability and the operations of the segment. Segment Liabilities include trade and other payables.
The following items of revenue, expenses, assets and liabilities are not allocated to operating segments, as they are not considered part of the core operations of any segment:
- income tax expense; - gain on disposal of assets; - deferred tax assets and liabilities; - interest revenue; - intercompany receivables and payables.

NOTES TO THE FINANCIAL STATEMENTS for the year ended 30 June 2014
Page 53 of 62
Mining Exploration Other Total US$000 US$000 US$000 US$000
12 months to June 2014:
Segment revenue 83,882 - - 83,882
Reconciliation of segment revenue to Group revenue add: Interest income 160 Other 154 Group Revenue 84,196
Segment result 35,508 (20) (4,739) 30,749 Reconciliation of segment result to group result: add back: Gain on disposal of asset 19 Other revenue 154 Interest revenue 160 less: Income tax expense 211 Group profit 30,871
Segment assets 434,822 3,836 3,829 442,487 Reconciliation of segment asset to group assets: plus: Deferred tax assets 2,983 Total Group assets 445,470
Segment liabilities 29,373 5 2,004 31,382
Reconciliation of segment liabilities to group liabilities plus: Deferred liabilities 1,782
Total Group liabilities 33,164
12 months to June 2013:
Segment revenue 100,622 - - 100,622
Reconciliation of segment revenue to Group revenue add: Interest income 24 Other 34 Group Revenue 100,680
Segment result 56,537 (1,238) (5,180) 50,119 Reconciliation of segment result to group result: add back: Gain on disposal of asset - Other revenue 34 Interest revenue 24 less: Income tax expense 4 Group profit 50,181
Segment assets 371,846 3,943 1,638 377,427 Reconciliation of segment asset to group assets: plus: Deferred tax assets 1,603
Total Group assets 379,030
Segment liabilities 18,674 10 3,955 22,639 Reconciliation of segment liabilities to group liabilities plus: Deferred liabilities 141
Total Group liabilities 22,780

NOTES TO THE FINANCIAL STATEMENTS for the year ended 30 June 2014
Page 54 of 62
Revenue and non-current assets by geographical region Australia Philippines Total US$000 US$000 US$000
12 months to June 2014:
Segment Revenue - 83,882 83,882
Non-Current Assets 41,946 356,852 398,798
12 months to June 2013:
Segment Revenue - 100,622 100,622
Non-Current Assets 15,825 308,286 324,111
In accordance with AASB 8 disclosure requirements Non-Current Assets shown in geographical information include tangible and intangible assets but exclude financial instruments, deferred tax assets, post-employment benefit assets and rights arising under insurance contracts.
The Group sells its gold on the open market. Selection of a customer is at the Group’s discretion and there is no commitment to exclusive sales to a particular customer. During the financial year ended 30 June 2014, all of the Group's revenues depended on a single customer (2013:100%).
27. PARENT COMPANY INFORMATION 2014 2013 US$000 US$000
Parent Entity: Current Assets 3,636 1,127 Total Assets 45,707 21,709 Current Liabilities 2,004 3,956 Total Liabilities 2,004 3,956
Net Assets 43,703 17,754 Issued Capital 102,902 73,070 Option Premium Reserve 4,638 4,448 Foreign Exchange Reserve 14,596 13,965 Accumulated Losses (36,164) (31,460) Dividends paid (42,269) (42,269)
Total Equity 43,703 17,754 Profit/(loss) for the year (4,704) (5,155) Total Comprehensive Income/(loss) (4,073) (6,779)

NOTES TO THE FINANCIAL STATEMENTS for the year ended 30 June 2014
Page 55 of 62
28. NEW STANDARDS AND INTERPRETATIONS NOT YET ADOPTED
The following standards, amendments to standards and interpretations have been identified as those which may impact the entity in the period of initial application. They are available for early adoption at 30 June 2014, but have not been applied in preparing this financial report.
The AASB has issued a number of new and amended Accounting Standards and Interpretations that have mandatory application dates for future reporting period, some of which are relevant to the Group. The Group has decided not to early adopt any of the new and amended pronouncements. The Group’s assessment of the new and amended pronouncements that are relevant to the Group but applicable in future reporting periods is set out below:
AASB 9 Financial Instruments
AASB 9 introduces new requirements for the classification and measurement of financial assets and liabilities. These requirements improve and simplify the approach for classification and measurement of financial assets compared with the requirements of AASB 139.
Effective date (annual reporting periods beginning on or after 1 January 2018).
The entity has not yet assessed the full impact of AASB 9 as this standard does not apply mandatorily before 1 January 2018 and the IASB is yet to finalise the remaining phases of its project to replace IAS 39 Financial Instruments: Recognition and Measurement (AASB 139 in Australia).
AASB 2012-3 Amendments to Australian Accounting Standards – Offsetting Financial Assets and Financial Liabilities
AASB 2012-3 adds application guidance to AASB 132 to address inconsistencies identified in applying some of the offsetting criteria of AASB 132, including clarifying the meaning of “currently has a legally enforceable right of set-off” and that some gross settlement systems may be considered equivalent to net settlement.
Effective date (annual reporting periods beginning on or after 1 January 2014). • When AASB 2012-3 is first adopted for the year ending 30 June 2015, there will be no impact on the entity as
this standard merely clarifies existing requirements in AASB 132.
AASB 2013-3 Recoverable Amount Disclosures for Non-Financial Assets
These narrow-scope amendments address disclosure of information about the recoverable amount of impaired assets if that amount is based on fair value less costs of disposal. When developing IFRS 13 Fair Value Measurement, the IASB decided to amend IAS 36 Impairment of Assets to require disclosures about the recoverable amount of impaired assets. The IASB noticed however that some of the amendments made in introducing those requirements resulted in the requirement being more broadly applicable than the IASB had intended. These amendments to IAS 36 therefore clarify the IASB’s original intention that the scope of those disclosures is limited to the recoverable amount of impaired assets that is based on fair value less costs of disposal. AASB 2013-3 makes the equivalent amendments to AASB 136 Impairment of Assets.
Effective date (annual reporting periods beginning on or after 1 January 2014).
When these amendments are first adopted for the year ending 30 June 2015, they are unlikely to have any significant impact on the entity given that they are largely of the nature of clarification of existing requirements.
AASB 2014-1 Amendments to Australian Accounting Standards (Part A: Annual Improvements 2010–2012 and 2011–2013 Cycles)
Part A of AASB 2014-1 makes amendments to various Australian Accounting Standards arising from the issuance by the International Accounting Standards Board (IASB) of International Financial Reporting Standards Annual Improvements to IFRSs 2010-2012 Cycle and Annual Improvements to IFRSs 2011-2013 Cycle.
Among other improvements, the amendments arising from Annual Improvements to IFRSs 2010-2012 Cycle:
clarify that the definition of a ‘related party’ includes a management entity that provides key management personnel services to the reporting entity (either directly or through a group entity); and
amend AASB 8 Operating Segments to explicitly require the disclosure of judgements made by management in applying the aggregation criteria.
Among other improvements, the amendments arising from Annual Improvements to IFRSs 2011-2013 Cycle clarify that an entity should assess whether an acquired property is an investment property under AASB 140 Investment Property and perform a separate assessment under AASB 3 Business Combinations to determine whether the acquisition of the investment property constitutes a business combination.
When these amendments are first adopted for the year ending 30 June 2015, there will be no material impact on the entitiy.

NOTES TO THE FINANCIAL STATEMENTS for the year ended 30 June 2014
Page 56 of 62
AASB 2014-1 Amendments to Australian Accounting Standards (Part B: Defined Benefit Plans: Employee Contributions (Amendments to AASB 119))
Part B of AASB 2014-1 makes amendments to AASB 119 Employee Benefits to incorporate the IASB’s practical expedient amendments finalised in International Financial Reporting Standard Defined Benefit Plans: Employee Contributions (Amendments to IAS 19) in relation to the requirements for contributions from employees or third parties that are linked to service.
The amendments clarify that if the amount of the contributions is independent of the number of years of service, an entity is permitted to recognise such contributions as a reduction in the service cost in the period in which the related service is rendered, instead of attributing the contributions to the periods of service. In contrast, if the amount of the contributions is dependent on the number of years of service, an entity is required to attribute those contributions to periods of service using the same attribution method required by paragraph 70 of AASB 119 for the gross benefit.
Effective date (annual reporting periods beginning on or after 1 July 2014).
When these amendments are first adopted for the year ending 30 June 2015, there will be no material impact on the entitiy.
AASB 2014-1 Amendments to Australian Accounting Standards (Part E: Financial Instruments)
Part E of AASB 2014-1 makes amendments to Australian Accounting Standards to reflect the AASB’s decision to defer the mandatory application date of AASB 9 Financial Instruments to annual reporting periods beginning on or after 1 January 2018. Part E also makes amendments to numerous Australian Accounting Standards as a consequence of the introduction of Chapter 6 Hedge Accounting into AASB 9 and to amend reduced disclosure requirements for AASB 7 Financial Instruments: Disclosures and AASB 101 Presentation of Financial Statements.
Effective date (annual reporting periods beginning on or after 1 January 2015). • The entity has not yet assessed the full impact of these amendments.
IFRS 15 Revenue from Contracts with Customers
IFRS 15: • replaces IAS 18 Revenue, IAS 11 Construction Contracts and some revenue-related Interpretations • establishes a new control-based revenue recognition model • changes the basis for deciding whether revenue is to be recognised over time or at a point in time • provides new and more detailed guidance on specific topics (e.g., multiple element arrangements, variable
pricing, rights of return, warranties and licensing) • expands and improves disclosures about revenue
In the Australian context, the Australian Accounting Standards Board (AASB) is expected to issue the equivalent Australian Standard (AASB 15 Revenue from Contracts with Customers), along with a new Exposure Draft (ED) on income from transactions of Not-for-Profit (NFP) entities by September 2014.
Effective date (annual reporting periods beginning on or after 1 January 2017).
This standard is first adopted for the year ending 30 June 2018, the Company has not yet assessed the impact of the transactions and balances to be recognised in the financial statements.
Clarification of Acceptable Methods of Depreciation and Amortisation (Amendments to IAS 16 and IAS 38)
The amendments to IAS 16 prohibit the use of a revenue-based depreciation method for property, plant and equipment. Additionally, the amendments provide guidance in the application of the diminishing balance method for property, plant and equipment.
The amendments to IAS 38 present a rebuttable presumption that a revenue-based amortisation method for intangible assets is inappropriate. This rebuttable presumption can be overcome (i.e. a revenue-based amortisation method might be appropriate) only in two limited circumstances: • the intangible asset is expressed as a measure of revenue, for example when the predominant limiting factor
inherent in an intangible asset is the achievement of a revenue threshold (for instance, the right to operate a toll road could be based on a fixed total amount of revenue to be generated from cumulative tolls charged); or
• when it can be demonstrated that revenue and the consumption of the economic benefits of the intangible asset are highly correlated.
The Australian Accounting Standards Board (AASB) is expected to issue the equivalent Australian amendment shortly.
Effective date (annual reporting periods beginning on or after 1 January 2016).
When these amendments are first adopted for the year ending 30 June 2017, there will be no material impact on the transactions and balances recognised in the financial statements.

NOTES TO THE FINANCIAL STATEMENTS for the year ended 30 June 2014
Page 57 of 62
Accounting for Acquisitions of Interests in Joint Operations (Amendments to IFRS 11)
The amendments to IFRS 11 state that an acquirer of an interest in a joint operation in which the activity of the joint operation constitutes a ‘business’, as defined in IFRS 3 Business Combinations, should: • apply all of the principles on business combinations accounting in IFRS 3 and other IFRSs except principles
that conflict with the guidance of IFRS 11. This requirement also applies to the acquisition of additional interests in an existing joint operation that results in the acquirer retaining joint control of the joint operation (note that this requirement applies to the additional interest only, i.e. the existing interest is not remeasured) and to the formation of a joint operation when an existing business is contributed to the joint operation by one of the parties that participate in the joint operation; and
• provide disclosures for business combinations as required by IFRS 3 and other IFRSs.
The Australian Accounting Standards Board (AASB) is expected to issue the equivalent Australian amendment shortly.
Effective date (annual reporting periods beginning on or after 1 January 2016).
When these amendments are first adopted for the year ending 30 June 2017, there will be no material impact on the transactions and balances recognised in the financial statements. • The entity has not yet assessed the full impact of AASB 9 as this standard does not apply mandatorily before 1
January 2018.
29. FRANKING ACCOUNT
The Company has no franking credits available.
30. COMPANY DETAILS
The registered office and principal place of business of the Company is:
Suite 7 11 Preston Street Como Western Australia 6152

Grant Thornton Audit Pty Ltd ACN 130 913 594 a subsidiary or related entity of Grant Thornton Australia Ltd ABN 41 127 556 389
‘Grant Thornton’ refers to the brand under which the Grant Thornton member firms provide assurance, tax and advisory services to their clients and/or refers to one or more member firms, as the
context requires. Grant Thornton Australia Ltd is a member firm of Grant Thornton International Ltd (GTIL). GTIL and the member firms are not a worldwide partnership. GTIL and each member firm
is a separate legal entity. Services are delivered by the member firms. GTIL does not provide services to clients. GTIL and its member firms are not agents of, and do not obligate one another and
are not liable for one another’s acts or omissions. In the Australian context only, the use of the term ‘Grant Thornton’ may refer to Grant Thornton Australia Limited ABN 41 127 556 389 and its
Australian subsidiaries and related entities. GTIL is not an Australian related entity to Grant Thornton Australia Limited.
Liability limited by a scheme approved under Professional Standards Legislation. Liability is limited in those States where a current scheme applies.
Page 59 of 62
Level 1
10 Kings Park Road
West Perth WA 6005
Correspondence to:
PO Box 570
West Perth WA 6872
T +61 8 9480 2000
F +61 8 9322 7787
W www.grantthornton.com.au
Independent Auditor’s Report
To the Members of Medusa Mining Limited
Report on the financial report
We have audited the accompanying financial report of Medusa Mining Limited (the
“Company”), which comprises the consolidated statement of financial position as at 30 June
2014, the consolidated statement of profit or loss and other comprehensive income,
consolidated statement of changes in equity and consolidated statement of cash flows for
the year then ended, notes comprising a summary of significant accounting policies and
other explanatory information and the directors’ declaration of the consolidated entity
comprising the Company and the entities it controlled at the year’s end or from time to time
during the financial year.
Directors’ responsibility for the financial report
The Directors of the Company are responsible for the preparation of the financial report
that gives a true and fair view in accordance with Australian Accounting Standards and the
Corporations Act 2001. The Directors’ responsibility also includes such internal control as
the Directors determine is necessary to enable the preparation of the financial report that
gives a true and fair view and is free from material misstatement, whether due to fraud or
error. The Directors also state, in the notes to the financial report, in accordance with
Accounting Standard AASB 101 Presentation of Financial Statements, the financial
statements comply with International Financial Reporting Standards.
Auditor’s responsibility
Our responsibility is to express an opinion on the financial report based on our audit. We
conducted our audit in accordance with Australian Auditing Standards. Those standards
require us to comply with relevant ethical requirements relating to audit engagements and
plan and perform the audit to obtain reasonable assurance whether the financial report is
free from material misstatement.
Page 60 of 62
An audit involves performing procedures to obtain audit evidence about the amounts and
disclosures in the financial report. The procedures selected depend on the auditor’s
judgement, including the assessment of the risks of material misstatement of the financial
report, whether due to fraud or error.
In making those risk assessments, the auditor considers internal control relevant to the
Company’s preparation of the financial report that gives a true and fair view in order to
design audit procedures that are appropriate in the circumstances, but not for the purpose
of expressing an opinion on the effectiveness of the Company’s internal control. An audit
also includes evaluating the appropriateness of accounting policies used and the
reasonableness of accounting estimates made by the Directors, as well as evaluating the
overall presentation of the financial report.
We believe that the audit evidence we have obtained is sufficient and appropriate to provide
a basis for our audit opinion.
Electronic presentation of audited financial report
This auditor’s report relates to the financial report of Medusa Mining Limited and controlled
entities for the year ended 30 June 2014 included on Medusa Mining Limited’s web site. The
Company’s Directors are responsible for the integrity of Medusa Mining Limited’s web site.
We have not been engaged to report on the integrity of Medusa Mining Limited’s web site.
The auditor’s report refers only to the statements named above. It does not provide an
opinion on any other information which may have been hyperlinked to/from these
statements. If users of this report are concerned with the inherent risks arising from
electronic data communications they are advised to refer to the hard copy of the audited
financial report to confirm the information included in the audited financial report
presented on this web site.
Independence
In conducting our audit, we have complied with the independence requirements of the
Corporations Act 2001.
Auditor’s opinion
In our opinion:
a the financial report of Medusa Mining Limited is in accordance with the Corporations
Act 2001, including:
i giving a true and fair view of the consolidated entity’s financial position as at 30
June 2014 and of its performance for the year ended on that date; and
ii complying with Australian Accounting Standards and the Corporations
Regulations 2001; and
b the financial report also complies with International Financial Reporting Standards as
disclosed in the notes to the financial statements.

Page 61 of 62
Report on the remuneration report
We have audited the remuneration report included in pages 8 to 17 of the directors’ report
for the year ended 30 June 2014. The Directors of the Company are responsible for the
preparation and presentation of the remuneration report in accordance with section 300A of
the Corporations Act 2001. Our responsibility is to express an opinion on the remuneration
report, based on our audit conducted in accordance with Australian Auditing Standards.
Auditor’s opinion on the remuneration report
In our opinion, the remuneration report of Medusa Mining Limited for the year ended 30
June 2014, complies with section 300A of the Corporations Act 2001.
GRANT THORNTON AUDIT PTY LTD Chartered Accountants
P W Warr
Partner - Audit & Assurance
Perth, 29 August 2014

TENEMENTS SCHEULE
Page 62 of 62
Notes:
1 There has been no change to Company’s interest for any tenement during the 2013-2014 financial year and there has been no tenement acquired or disposed of during the same reporting period.
2 Assigned to Philsaga Mining Corporation ABBREVIATIONS:
Tenement Types
MPSA Granted Mineral Production Sharing Agreement APSA Application for Mineral Production Sharing Agreement
EP Granted Exploration Permit EPA Application for Exploration Permit
SSMP Granted Small Scale Mining Permit
Registered Holders
Philsaga Philsaga Mining Corporation Alcorn Alcorn Gold Resources Corporation
BMMRC Base Metals Mineral & Resources Corporation Philex Philex Gold Philippines Incorporated
Phsamed Phsamed Mining Corporation Das-Agan Das-Agan Mining Corporation
Philcord Mindanao Philcord Mining Corporation Apmedoro APMEDORO Mining Corporation
Corplex Corplex Resources Incorporated Sursur Sursur Mining Corporation
Salcedo Neptali P. Salcedo
Name Tenement ID Registered Holder Company’s Interest 1
Royalty Area (hectares)
Co-O Mine MPSA No. 262-2008-XIII Philsaga 100.0% - 2,538.79
MPSA No.299-2009-XIII Philsaga 100.0% - 2,200.36
Co-O APSA No. 00012-XIII BMMRC 100.0%2 - 339.80
APSA No. 00087-XIII Samuel Afdal 100.0%2 - 846.44
APSA No. 00088-XIII Phsamed 100.0% - 7,303.73
APSA No. 00098-XIII Philcord 100.0%2 1% net profit 1,184.38
APSA No. 00099-XIII Philcord 100.0%2 1% net profit 676.83
Saugon EP 017-XIII Philsaga 100.0% - 3,132.31
EP 031-XIII Philsaga 100.0% - 3,978.54
EP 032-XIII Philsaga 100.0% - 3,047.53
EPA No. 00066-XIII Philsaga 100.0% - 6,769.13
EPA No. 00067-XIII Samuel Afdal 100.0%2 - 1,692.69
EPA No. 00069-XIII Phsamed 100.0% - 7,789.80
EPA No. 00087-XIII Philsaga 100.0% - 764.20
Tambis MPSA No. 344-2010-XIII Philex 100.0% 7% net smelter 6,207.62
Das-Agan MPSA No. 343-2010-XIII Das-agan 100.0% 3% gross 3,809.55
Apical APSA No. 00028-XIII Apmedoro Earning 70.0% (JV) - 2,084.09
Corplex APSA No. 00054-XIII Corplex 100.0% 3% net smelter 2,118.16
APSA No. 00056-XIII Corplex 100.0% - 162.00
APSA No. 00077-XIII Corplex 100.0% 4% gross 810.00
EPA No. 00186-XIII Corplex 100.0% 3% net smelter 7,111.35
Tagbina EPA No. 00176-XIII Sursur 100.0% 3% gross 3,823.00
EPA No. 00180-XIII Sursur 100.0% 3% gross 5,948.00
EPA No. 00181-XIII Sursur 100.0% 3% gross 6,118.00
Sinug-ang EPA No. 00114-XIII Salcedo / Philsaga 100.0% - 190.38