Embed Size (px)
Citation preview

Mechanisms and Evolution of Magnetotactic Bacteria
Thesis by
Cody Nash
In Partial Fulfillment of the Requirements
for the Degree of
Doctor of Philosophy
California Institute of Technology
Pasadena, California
2008
(Defended May 22, 2008)

ii
© 2008
Cody Nash
All Rights Reserved

iii
Acknowledgements
I would like to thank first and foremost, my advisor, Joseph Kirschvink. Without
his support and encouragement I couldn’t have done this. Joe exemplifies the finest
quality of a scientist — the ability to get others excited about learning. I thank Bob Kopp
for being a friend and for the engaging discussions and so much assistance with learning
magnetometry. It was through Bob’s recognition that he could use some of my
discoveries for his own work that I began to understand how I could contribute as a
scientist.
I thank Arash Komeili and Betty Bertani for teaching me everything I know about
genetics. I would like to thank Dianne Newman for letting me be a part of her lab, and
Victoria Orphan and Ken Nealson for giving me the opportunity to work in their labs as
well.
Quite a number of people have assisted me over the years in my field work, which
is yet another chapter in Joe’s quest to find a magnetotactic Archaea. Before I got here
Megan Andrews laid the groundwork, and countless Ge1 students over the decades have
gone with Joe to Mono Lake to search for unusual bacteria. None of this would have
been possible without assistance from Tom Crowe, SNARL, and Dan Dillingess for
providing boating, sampling, and SCUBA expertise regarding Mono Lake. I thank Clint
Dodd, Michael Shearn, and M. David Henry for helping me re-acquaint myself with
SCUBA. I want to thank Radu Popa for his assistance over the years on this project.
Along the way Radu and I discovered thermophilic magnetotactic bacteria and he has let
me run with it.

iv
I also want to thank Mom for never giving up on me, my father and grandparents
who saw me start this journey, Patty and Robert for being family through it all, Elizabeth
Bent who made so many problems smaller, Sara Egner who always cheered me up, and
last but not least Dala, who never left me alone.

v
Abstract (350 Words)
Magnetotactic bacteria (MB) contain intracellular magnetic crystals of iron oxides
and/or iron sulfides. These crystals and the membranes which enclose them are together
known as magnetosomes. The crystals formed by MB fall into a narrow size range and
have species-specific crystal morphologies. Magnetosomes are physically connected to
the rest of the cell by actin-like filaments that are thought to allow the MB to take
advantage of their passive orientation in the Earth’s magnetic field to navigate more
efficiently across chemical gradients. The large excess of crystals in most strains
suggests that magnetosomes may also function as an iron reservoir or as a redox battery.
This thesis describes a number of investigations of the MB. First, a set of genes
was identified as being conserved uniquely among the MB by comparative genomics.
This method was validated by finding many of the genes already known to be involved in
magnetotaxis. Many additional genes were identified and some of these genes were
found to cluster together. Three of these clusters were genetically interrupted to
determine their role in magnetite biomineralization.
Second, a transposon mutagenesis was undertaken to identify genes necessary for
the magnetic phenotype of MB. Out of 5809 mutants screened, nineteen were found to
be non- or partially magnetic. Fourteen of these have insertion sites in genes known to be
involved in magnetotaxis. Five more were found to have insertions in previously
unsuspected genes. The mutant phenotypes of the five mutants include the complete
absence of magnetosomes, elongate crystals, reduced numbers of crystals and incomplete
mineralization. These mutant strains were used to develop ferromagnetic resonance
theory of isolated single-domain particles and biogenic particle identification.

vi
Third, MB were discovered in hot springs and in hyper-saline, hyper-alkaline
Mono Lake, CA. This extends the environmental range of MB to astro- and
paleobiologically relevant environments. Magnetotactic Archaea were tentatively
identified from Mono Lake, CA and are the first magnetotactic representatives of that
domain.

vii
Table of Contents
Summary 1
Chapter 1: Genomics 3
1.1. Comparative genomics of the MS-1 and MC-1 genome 3
1.1.1. Introduction 4
1.1.2. Methods 7
1.1.3. Results 8
1.1.4. Conclusions 18
1.2. Targeted interruptions of genomically predicted genes 19
1.2.1. Introduction 19
1.2.2. Methods 22
1.2.3. Results and Discussion 23
Chapter 2: Transposon mutagenesis analysis of magnetotactic biomineralization 28
2.1. Introduction 28
2.2. Methods 29
2.3. Results and Discussion 33
2.4. Conclusions 48
Chapter 3: Environmental Microbiology 52
3.1. Extremophilic magnetotactic bacteria and archaea 52
3.2. Degenerate PCR recovery of mamB from LA arboretum magnetic
cocci
63
References 71
Appendices 76
Introduction to appendices 76
Ferromagnetic resonance spectroscopy for assessment of magnetic anisotropy
and magnetostatic interactions: A case study of mutant magnetotactic bacteria
77
Chains, clumps, and strings: Magnetofossil taphonomy with ferromagnetic
resonance spectroscopy
92
The paleoproterozoic snowball Earth: A climate disaster triggered by the
evolution of oxygenic photosynthesis
108

viii
Experimental observation of magnetosome chain collapse in magnetotactic
bacteria: Sedimentological, paleomagnetic, and evolutionary implications
114
Bugbuster—survivability of living bacteria upon shock compression 127

1 Summary
This thesis set out to be an exploration of the magnetotactic bacteria. Going into
it my interests were evolutionary and planetary. How long had magnetotactic bacteria
been around? Which planet did they come from? The advent of nanotechnology in
society made me wonder what technologies could be enabled by understanding how
magnetotactic bacteria make their crystals. Could we make a better battery? Or a better
hard drive? How about better contrast agents for magnetic resonance imaging? Or better
standards for basic research in magnetism? Along the way through graduate school I
became aware of the ways in which magnetotactic bacteria can be of use in geobiological
investigations. The preservation of the crystals from the magnetosomes in the rock
record summons dreams of a bacterial fossil record — a new set of calibration points for
our evolutionary models. Their efficient migration back and forth through redox
gradients means they may be important in the cycling of the iron, sulfur, phosphorus, and
nitrates that are found stored in most of them. And really so little is known about them.
Can they use the iron in their magnetosomes for other cellular processes?
So I began by looking at the genomes of the magnetotactic bacteria, looking to
see which genes are correlated with the magnetotactic phenotype. After finding a far
larger set than expected, I began genetic manipulations of the genes predicted by the
genomic analysis. The targeted interruption of three different operons resulted in no
significant effect. This may be because the genes are not involved in the magnetic
phenotype, but could be due to a number of other reasons. The genes may not be
necessary under the conditions assayed or the interruptions may not have disrupted the

2 expression of downstream genes which are necessary. This work constitutes the first
chapter of my thesis.
Then I learned about transposon mutagenesis and set out to see how many genes
could be discovered by randomly knocking them out. This is the work presented in
Chapter 2. This work consisted of generating 5809 mutants and screening them with a
magnetic and PCR assay to detect non-magnetic mutants that weren’t due to the
spontaneous loss of the mamAB cluster. Nineteen non-magnetic mutants were found,
five of which have transposon insertion sites in genes outside the mam clusters. These
five mutants are insertions in a predicted radical SAM protein, a hydrolase, a
transcriptional regulator, an indole-pyruvate oxidoreductase, and a hypothetical protein.
Their phenotypes are, respectively, no magnetosome vesicles, elongate crystals, fewer
crystals, 1–2 crystals, and poorly formed crystals. Two of the mutants were the subject of
additional work described in the appendices.
Finally, two studies concerning magnetotactic bacteria in the environment are
presented in Chapter 3. The first documents a search for magnetotactic archaea, for
which the first sequences are presented. In the course of this search we discovered MB
for the first time in hot springs and present the first work describing MB from the hyper-
saline, hyper-alkaline Mono Lake, CA. This extends the relevance of MB to the geo- and
astrobiologically relevant environments of geothermal features and ancient, evaporitic
basins. Also presented is the first fragment of a gene known to be involved in
magnetotaxis from the environment — part of the mamB gene recovered from magnetic
cocci in the LA arboretum using magnetic column purification and degenerate primers.

3 Chapter One: Genomics
1.1. Comparative genomics of the MS-1 and MC-1 genome
Abstract
The biologically controlled mineralization of magnetite (BCMM) within lipid-
bilayer-bounded vesicles (magnetosomes) by some bacteria is the biophysical basis of
their magnetotactic behavior and is under genetic control. In an effort to identify genes
involved in this process we compared the genomes of two magnetotactic bacteria,
Magnetospirillum magnetotacticum MS-1 and magnetic coccus strain MC-1, to each
other and to the NCBI protein database. Our comparison focused on finding proteins
conserved particularly between these magnetotactic bacteria. We define a conserved
gene in MS-1 as a gene (i.e., gene A) with the highest sequence similarity to a gene from
MC-1, gene B, where gene B also best matches a gene from MS-1. In MS-1 and MC-1
we found 115 and 91 conserved open reading frames (ORFs), respectively, showing that
the two species use similar systems for BCMM. The conserved ORFs include 15 of the
20 genes whose products are reported to localize to the magnetosome [Grünberg et al.,
2004] and 2 of the 3 genes reported to be involved in BCMM based on transposon
mutagenesis studies [Komeili et al., 2004; Nakamura et al., 1995]. They also include a
significant number of ORFs involved in functions consistent with models of
magnetotaxis, including glycoprotein synthesis, redox reactions, inorganic ion transport,
and signal transduction. We elaborate upon previous models of magnetotaxis with
pathways deduced from the conserved ORFs and find support for the hypothesis that
BCMM is a metabolic strategy as well as a navigational one.

4 1.1.1. Introduction
The highly defined nature of biologically controlled mineralization of magnetite
(BCMM) implies strict genetic control, especially as no abiological method for
synthesizing such particles has been discovered after decades of industrial and scientific
effort [Thomas-Keprta et al., 2000]. Modern bacterial BCMM produces magnetite as
individual crystals bound within lipid-bilayer membranes (magnetosomes) and organized
into chains [Balkwill et al., 1980]. Magnetosome chains are thought to be used to take
advantage of the Earth’s magnetic field for navigation of chemical gradients [Frankel and
Bazylinski, 1994; Kirschvink, 1980], though they may also function as a redox reservoir
[Vali and Kirschvink, 1991], and/or be a metabolic by-product [Guerin and Blakemore,
1992].
The wide but sparse distribution of BCMM among the domain Bacteria suggests
that it evolved multiple times [Delong et al., 1993; Kawaguchi et al., 1995] or has been
laterally transferred. The same distribution argues against the less parsimonious
hypothesis that BCMM is ancestral to the Bacteria and most bacteria have lost it. If it did
evolve multiple times we would expect different genes to be involved in each system,
whereas if it had been laterally transferred or was ancestral we would expect to find
orthologous genes in each system. Protein separation studies indicate there are more than
18 different proteins specific to the magnetosome membrane [Grünberg et al., 2004] and
a transposon mutagenesis study suggests there may be as many as 60 different genes
involved in BCMM [Wahyudi et al., 2001]. Only a few of these genes and proteins have
been characterized. Previous studies have shown many of the genes whose products
appear to localize to the magnetosome membrane are part of a gene cluster present in

5 three different BCMM bacteria (magnetic coccus strain MC-1, Magnetospirillum
magnetotacticum MS-1, and M. gryphiswaldense MSR-1) [Grünberg et al., 2001;
Grünberg et al., 2004]. Most of the genes in this cluster are reported as having much less
similarity to genes from non-BCMM organisms than to genes from other BCMM
organisms (i.e., they appear conserved among BCMM organisms). The conservation of
these genes among the magnetospirilla and the magnetic cocci indicates that they are
using the same genetic system for BCMM.
The presence of conserved genes and gene clusters associated with the
magnetosome membrane, the indication that there are many undiscovered genes
involved, and the availability of the genomes of two BCMM bacteria (MS-1 and MC-1)
prompted us to search these genomes for other conserved genes and clusters. We
hypothesized that these genomes would contain genes that would be more similar to each
other than to any other non-BCMM organism due to conserved BCMM functionality
arising from a common evolutionary origin. MS-1 and MC-1 are well suited to this
analysis because they share few other traits besides BCMM that they do not also share
with other α-proteobacteria. They differ in habitat, cell shape, flagellar location,
aerotactic behavior, magnetite crystal form, and the guanine-cytosine (GC) content of
their genomes (see Table 1). They are also phylogenetically distinct based on 16S rRNA
sequences, with MC-1 branching off from the base of the α-Proteobacteria and MS-1
branching off deeper within the phylum. The non-BCMM α-proteobacteria genomes in
particular, as well as the rest of the Genbank database, act as a filter to identify common
genes (e.g., metabolic and information processing) which are not conserved only among
BCMM bacteria and thus not likely to be a unique part of the BCMM apparatus.

6
Table 1: Comparison of MS-1 and MC-1 Traits
Quality MS-1 MC-1 Cell Shape Spirillum [Blakemore et al.,
1979] Coccus [Meldrum et al., 1993]
Flagellar Location Polar [Frankel et al., 1997] Bilophotrichous [Frankel et al., 1997]
Aerotactic Behavior Temporal [Frankel et al., 1997]
2-Way Switch [Frankel et al., 1997]
Magnetite Crystal Form
Cubo-Octahedral [Mann et al., 1984]
Hexahedral [Meldrum et al., 1993]
Habitat Freshwater sediment [Blakemore et al., 1979]
Estuary sediment [Meldrum et al., 1993]
GC content 63.0% [Sakane and Yokota, 1994]
52–57% [Dean and Bazylinski, 1999]
Through the use of this comparative genomic strategy, called differential genome
comparison [Raymond et al., 2002], we have identified a set of open reading frames
(ORFs) likely involved in BCMM. The validity of the technique is supported by the fact
that we find most of the genes which localize to the magnetosome membrane to be
conserved. Conserved metabolic ORFs support the hypothesis that BCMM is more than
just a navigational strategy. Conserved glycoprotein synthesis ORFs support the
hypothesis that BCMM is a matrix-vesicle type biomineralization system. This set of
ORFs can act as a library of targets for future investigations of the evolution and process
of BCMM.

7 1.1.2. Methods and Definitions
Genome comparisons were made using the blastp program of the BLAST package
[Altschul et al., 1997] without the simple sequence filter and with an expectancy cutoff of
10-5. Translated ORF models for the MS-1 and MC-1 genomes were obtained from the
National Center for Biotechnology (NCBI, www.ncbi.nih.gov). Sequences of MS-1
DNA published and deposited in Genbank earlier are 98–100% consistent with the draft
sequence (data not shown). An analysis of GC content versus contig size indicates that
the larger contigs have the expected composition (data not shown). We only use 316 of
the 3880 available contigs, those which have 20x coverage or greater and thus have the
highest sequence quality. These contigs provide > 95% coverage of the genome.
Comparisons were made to Genbank’s non-redundant (nr) protein database, available
from the NCBI website (www.ncbi.nlm.nih.gov).
Conservancy for a given ORF was calculated as the difference in BLAST bit
scores between the ORF’s closest match in a given target genome and its closest match in
the nr database, excluding hits to other BCMM bacteria.
A conserved gene, gene A, in MS-1 is defined as best matching a gene from MC-
1, gene B, where gene B best matches a gene from MS-1. Conserved genes are likewise
defined for MC-1.
Genes and ORFs were mapped by contig and scaffold information obtained from
the DOE JGI. Note that contigs are fractions of the genome sequence determined from
connecting overlapping sequencing runs. Scaffolds are sequences of oriented contigs
with gaps between the contigs.

8 Operons were defined as a sequence of ORFs transcribed in the same direction
without a gap larger than 200 base pairs between any of the ORFs.
1.1.3. Results and Discussion
1.1.3.1 Conserved ORFs and clusters
Out of 4280 ORF models in MS-1, we found 115 ORFs fitting our definition of
conserved. In MC-1 we found 91 conserved ORFs out of 3677 total ORF models. The
conserved ORFs are arranged in 53 clusters and operons in MS-1 (see Figure 1) and 51
clusters and operons in MC-1. A number of conserved ORFs were found in the same
clusters in both genomes, with common functionality predicted in both genomes (see
Table 2). Several of these clusters were duplicated in one or both of the genomes.

9
Figure 1: Map of conserved ORFs in MS-1. Spikes on the outer rim represent conserved
genes, with length scaled to conservancy. Ticks represent 100kb. Scaffold position and
orientation determined by restriction mapping ([Bertani et al., 2001] and unpublished
data).

10 Table 2: Conserved Clusters
MS-1 ORF
MC-1 ORF COG Cons
210479 2713 Hypothetical protein 26 210481 2715 Predicted carbamoyl transferase, NodU family 12 210485 3211 Glycosyltransferase 76 28368 1292 ABC-type phosphate transport system, permease component 23 28369 1291 ABC-type phosphate transport system, ATPase component 8 29670 184 TRAP-type C4-dicarboxylate transport system, periplasmic component 75 29671 185 Adenylate cyclase, family 3 (some proteins contain HAMP domain) 195 29464 916 Methyl-accepting chemotaxis protein 298 29465 915 Chemotaxis response regulator: CheY-like receiver and methylesterase 65 29466 914 Methylase of chemotaxis methyl-accepting proteins 150 29467 913 Chemotaxis protein histidine kinase and related kinases 366 29468 912 Response regulators: CheY-like receiver and winged-helix DNA-binding 49.4 29469 911 Response regulator: CheY-like receiver and a GGDEF 130 29470 910 Chemotaxis signal transduction protein 47.3 29439 1756 Thiol-disulfide isomerase and thioredoxins 17 29440 1755 Predicted permeases 60 29366 1519 Hypothetical protein 172 29367 1520 Permeases of the major facilitator superfamily 485 28051 3295 Membrane-fusion protein 636 28052 3296 Membrane-fusion protein 380 28053 3297 Membrane-fusion protein 135 28054 3298 Outer membrane protein 362 27932 3297 Membrane-fusion protein 17 27933 3296 Membrane-fusion protein 101 27934 3295 Membrane-fusion protein 178 27993 2747 Membrane-fusion protein 51 27994 2746 ABC-type bacteriocin/lantibiotic exporters 320 27995 2745 ABC-type bacteriocin/lantibiotic exporters 283 27944 2613 Hypothetical protein 94 27945 2612 Adenylate cyclase, family 3 (some proteins contain HAMP domain) 212 29034 281 Hypothetical protein (MamI) 79.7 29035 267 Trypsin-like serine proteases, typically periplasmic (MamE) 170 29037 273 Actin-like ATPase involved in cell morphogenesis (MamK) 126 29039 274 Predicted Co/Zn/Cd cation transporters (MamM) 120 29041 275 Predicted permeases (MamO) 283.1 29042 276 Trypsin-like serine proteases, typically periplasmic (MamP) 161 29043 277 FOG: TPR repeat (MamA) 70.7 29046 1531 Predicted Co/Zn/Cd cation transporters (MamB) 120 29047 1530 Hypothetical protein (MamS) 79.3 29048 1529 Cytochrome c, mono- and diheme variants (MamT) 115 29050 1531 Predicted Co/Zn/Cd cation transporters 41 28108 267 Trypsin-like serine proteases, typically periplasmic (MamE duplication) 122 28110 275 Trypsin-like serine proteases, typically periplasmic (MamO duplication) 41.9

11 The distribution of conserved ORFs among COG families is significantly different
from that of a random sample of their respective genomes. Both sets of conserved ORFs
contain more cell envelope biogenesis, cell motility/secretion, inorganic ion
transport/metabolism, carbohydrate transport/metabolism, energy production, and signal
transduction ORFs. Both sets were also deficient in housekeeping ORFs (translation and
amino acid/nucleic acid/lipid metabolism).
Finding a large set of ORFs conserved particularly between MS-1 and MC-1
supports the hypothesis that they use similar mechanisms to carry out BCMM. The
presence of a large number of the conserved ORFs in clusters present in both bacteria,
sometimes with the order of ORFs conserved as well, and the fact that the distribution of
predicted functions is non-random lends support to the hypothesis that these ORFs
function together in a larger framework.
1.1.3.2. Previously documented genes
Fifteen of the genes previously cloned and sequenced from magnetotactic bacteria
are found to be conserved, all of which come from the mam cluster (see Table 3). Two
bacterioferritin genes, RubisCO, superoxide dismutase sodB, phaZ1, and mms16 are not
found in MC-1. The genes magA, recA, RNase HII, mpsA, cytochromes cb1, c-550 and
a1, and a nitrate reductase gene cluster (nap) are present in both genomes but not
conserved. Further, eight putative transposases located around the mam cluster in MSR-1
are either not conserved or absent from the MC-1 genome.

12 Table 3: Conservation of Cloned Magnetospirillum BCMM Genes
Gene Source MC-1 ORF
Bit Score NR best hit
Bit Score Cons.
MagA AMB-1 2765 169 Unknown 264 -95
MamA MSR-1 277 150 O-linked N-acetylglucosamine transferase 82.8 67.2
MamB MSR-1 1531 287 Cation efflux family protein 166 121 MamC MSR-1 269 45.1 Hypothetical protein 54.3 -9.2 MamD MSR-1 1518 71.2 Heavy-chain fibroin 70.1 1.1 MamE MSR-1 267 218 Probable serine protease 168 50 MamF MSR-1 283 81.6 - - 81.6 MamG MSR-1 - - Fibroin heavy chain precursor-like protein 65.5 -65.5 MamH MSR-1 266 414 Transporter, putative 162 252 MamI MSR-1 281 42 - - 42 MamJ MSR-1 - - Hypothetical protein 95.9 -95.9 MamK MSR-1 273 357 Unknown 208 149 MamL MSR-1 - - - - - MamM MSR-1 274 289 Predicted Co/Zn/Cd cation transporters 147 142 MamN MSR-1 - - ArsB, Arsenical pump membrane protein 189 -189 MamO MSR-1 275 290 Serine protease 90.9 199.1 MamP MSR-1 276 141 - - 141 MamQ MSR-1 1533 81.3 LemA 90.1 -8.8 MamR MSR-1 - - - - - MamS MSR-1 1530 69.3 - - 69.3 MamT MSR-1 1529 114 - - 114 MamU MSR-1 - - Hypothetical protein 159 -159 MM22 MSR-1 - - Hypothetical protein 61.6 -61.6 Mms16 AMB-1 - - Hypothetical protein 164 -164 Mms6 AMB-1 - - Fibroin heavy chain precursor-like protein 58.9 -58.9 MpsA AMB-1 125 308 Acetyl-CoA carboxylase alpha subunit 444 -136
The fact that the conserved ORFs contain 15 of the 25 genes reported to encode
magnetosome-specific proteins supports the hypothesis that conserved ORFs are
associated with BCMM. The absence of the putatively magnetosome-specific gene
mms16 from MC-1 is consistent with recent observations of Mms16’s association with
poly-hydroxy alkanoate metabolism as opposed to magnetosomes [Grünberg et al., 2004;

13 Handrick et al., 2004]. The first gene shown by mutagenesis to be necessary for BCMM,
magA [Nakamura et al., 1995], is present in MC-1, but it is not conserved. MagA is an
iron-transporter, so it is likely that while necessary for BCMM in MS-1, its use is not
restricted to BCMM. MpsA is present in MC-1, but the Magnetospirillum MpsA is most
similar to an acetyl-CoA carboxylase subunit from Rhodosprillim rubrum, arguing that
the gene plays a broader role in the cell that has been exapted to BCMM in the
magnetotactic bacteria.
1.1.3.3. BCMM model
The predicted functions of the conserved ORFs fit into previous models of BCMM
[Frankel et al., 1983; Kirschvink and Lowenstam, 1979; Mann et al., 1990]. In these
models BCMM is divided into distinct processes: magnetosome membrane formation,
iron uptake, low-density ferrihydrite formation, dehydration to a higher-density
ferrihydrite, and finally conversion to magnetite. We do not expect all of these processes
to be conserved because they will have other uses besides BCMM such that they will be
found in non-BCMM species. Iron uptake is necessary for many cellular activities, and
membrane budding and formation are essential to cell division. There are several
processes which we do expect to find conserved, namely controls of crystal morphology,
ultrastructures for maintaining the magnetosomes in a chain, mechanisms for transport
into and out of the magnetosomes, and regulatory elements for all of these activities.

14 1.1.3.3.1 Iron transport and redox control
Iron transport within the cell may be carried out by MagA, a known iron
transporter in BCMM bacteria [Nakamura et al., 1995], though it is not conserved and
may not function specifically for BCMM. MagA is involved in iron-efflux, and may be
widely used to prevent metals from building up to toxic levels in the cytoplasm. Both
MS-1 and MC-1 have non-conserved ORFs for the feo ferrous iron transporter for
transport across the cytoplasmic membrane as well as several non-conserved ferric
uptake regulators. Conserved predicted metal transporters are found only in the mam
cluster. In the mam cluster there are four conserved predicted cobalt/zinc/cadmium
cation transport ORFs. Recent work has shown cobalt can be incorporated into the
magnetosomes of three strains of magnetospirilla [Staniland et al., 2008]. These
transporters may function for iron transport in the magnetospirilla, but one or more still
have retained vestigial cobalt transport capacity. One of the conserved metal transporters
is the mamB gene, which is known to specifically localize to the magnetosome
membrane. There are several other conserved ORFs and ORF clusters encoding
predicted transporters, but the molecule to be transported was either non-metallic
(phosphate and sulfate) or not predicted.
BCMM involves the conversion of iron to a low-density ferrihydrite through a
series of metabolic reactions. Ferric iron is first reduced, a process which primarily
occurs in the periplasm in MS-1, possibly as an energy-conserving process [Guerin and
Blakemore, 1992; Paoletti and Blakemore, 1988] linked to magnetite synthesis in MS-1
[Noguchi et al., 1999]. The majority of ferrous iron is presumed to be associated with the
cell wall [Ofer et al., 1984], where it becomes re-oxidized to low-density 2-line

15 ferrihydrite. The ferrous iron may be re-oxidized by coupling to either denitrification
[Yamazaki et al., 1995] or aerobic respiration [Guerin and Blakemore, 1992].
Magnetotaxis would be an advantageous trait for navigating across environmental redox
gradients to facilitate such redox cycling of iron for metabolic purposes. Note that the
purity of BCMM magnetite may be a result of this redox processing. The ORFs
associated with the above processes include a highly similar (38–85%), but not conserved
nap-type nitrate reductase (contig 3771 in MS-1, 404 in MC-1), two other nitroreductase
family ORFs, and two hydrogenases.
1.1.3.3.2 Magnetite synthesis
After redox processing the ferrihydrite is transported to the magnetosome, not by
a ferritin storage protein[Vali and Kirschvink, 1991], but by an unknown mechanism,
perhaps by a conserved TolC-like transport complex. Once the low-density phase is in
the magnetosome it is partially dehydrated to form a higher-density, crystalline
ferrihydrite, and then converted to magnetite. All three phases have been observed
within the magnetosome in MS-1 [Frankel et al., 1983; Mann et al., 1984]. The
conversion to magnetite is thought to occur due to a ferrous iron ion bonding with the
crystalline ferrihydrite, which then collapses into a soluble intermediate. This
intermediate is further dehydrated and crystallizes as magnetite. Such conversions can
spontaneously occur given proper pH, Eh, and ionic conditions [Abe et al., 1999; Mann et
al., 1990] which could be regulated by the numerous conserved permeases and
transporters. Magnetite may thus be synthesized through carefully regulated transport of
the amorphous phase and ferrous iron ions to the magnetosome.

16 The control of crystal shape during magnetite synthesis appears to be carried out by
matrices of modified proteins. Glycoprotein matrices have been implicated in
morphological control in biomineralization in a variety of systems where the matrices are
thought to provide nucleation sites and constraints on crystal growth by binding to the
crystal itself (matrix-vesicle type biomineralization) [Boskey, 1998]. Conserved ORFs
encode glycosyltransferases, sugar epimerases, and D-alanine exporters, all of which are
members of glycoprotein synthesis and cross-linking pathways. The conserved mms6,
mamC, and mamD ORFs have been shown to be tightly associated with the magnetite
crystals within the magnetosome [Arakaki et al., 2003]. Further, mms6 has been shown
to control crystal shape in magnetite precipitation experiments [Arakaki et al., 2003].
The sequence similarity of these three ORFs with fibroin is very interesting as
glycoprotein/fibroin matrices are a major component of other biomineralization systems
[Levi-Kalisman et al., 2001; Pereira-Mouries et al., 2002].
The magnetosomes exist as chains in MS-1 and MC-1 and therefore must have some
structure for maintaining the chain orientation of the magnetite crystals, as otherwise the
chains would collapse upon themselves into a lower energy state [Kirschvink, 1982]. The
mam cluster contains a conserved mreB -like gene (actin-homolog, contig 3824 ORF 4 in
MS-1, ORF 619 in MC-1) which may be used for supporting magnetosome chains. This
has been demonstrated in AMB-1 [Komeili et al., 2006].

17 1.1.3.3.3. Regulation of BCMM
Some aspects of BCMM are not unique to BCMM (e.g., iron uptake, vesicle
formation, and chemotaxis) and would not be expected to be conserved but would be
expected to have conserved regulatory systems (If they are distinct from other regulatory
systems). Approximately one fifth of the conserved ORFs are associated with
chemotactic and cyclic nucleotide mono-phosphate signal transduction mechanisms,
common methods for regulation of choice of metabolic pathways and response to
external chemical signals. The conserved signal transduction elements include cheB,
cheR, cheW, and cheY elements, as well as several histidine kinases and methyl-accepting
chemotaxis proteins. There are also conserved elements of a cAMP signaling pathway,
including adenyl cyclases and phosphodiesterases. These conserved signaling ORFs may
also be used for regulation of conditions within the magnetosome and/or of choice of
position in the environmental redox gradient appropriate to their energy needs.
1.1.3.4 Qualifications
It is important to note that not all ORFs involved in BCMM would be expected to
turn up in our analysis. The aspect of a protein that makes it specific to BCMM may be
of such short sequence length that other variations in sequence would hide the short
conserved signal. Also some ORFs may not be specific to BCMM and are used for other
functions which MS-1 and MC-1 share with other bacteria such that the ORFs do not
appear conserved. Most importantly one must not make too much of the absence of
ORFs from one or both genomes until the final assembly is complete, as rearrangements
and gap closure will likely reveal more ORFs. Another danger is that there are sequenced

18 organisms which are not currently known to carry out BCMM but actually do, which
would mask out ORFs important to BCMM. There is recent evidence that a close relative
of the sequenced Shewanella oneidensis, S. putrefaciens, creates intracellular, membrane-
bounded iron oxides [Glasauer et al., 2002]. Other qualifications to note are: (1) by only
comparing protein sequences we may have missed important similarities at the nucleotide
level, such as promoter regions or ORFs not identified during draft analysis, and (2)
protein function similarity and sequence similarity are not always correlated.
1.1.4. Conclusions
• We have identified a large set of conserved ORFs which fit into previous BCMM
models.
• The presence and nature of the conserved ORFs indicates that MS-1 and MC-1
are using largely similar genetic mechanisms for BCMM and magnetotaxis.
• The finding of conserved metabolic ORFs lends support to the idea that BCMM is
not just for navigational purposes but is also a metabolic strategy.
• These metabolic ORFs also lend support to evolutionary speculations where
BCMM arose first as a metabolic strategy and was later exapted for navigation.
The conserved ORFs and the model developed will hopefully provide a useful
framework for further elucidation of the mechanisms and evolution of BCMM. These
ORFs prompt specific computational, genetic, and biochemical experiments which could
accelerate the pace of discovery of BCMM mechanisms. It will be interesting to see if
other BCMM organisms with different cellular structures and/or different habitats use
similar genetic machinery.

19 Chapter One: Genomics
1.2. Targeted interruptions of genomically predicted genes
1.2.1. Introduction
To test the predictions generated by the comparison of the MS-1 and MC-1
genomes I undertook targeted interruptions of three conserved operons to see if this
affected the phenotype. By inserting a drug resistance marker into the first gene of the
operon I hoped to disrupt the synthesis of magnetite. Below are descriptions of the three
operons selected for targeted interruptions.
Chemotaxis Pathway
There is a cluster of seven conserved genes in both MS-1 and MC-1 which
encodes many components of a chemotaxis pathway (see Figure 2). Chemotaxis
pathways are a means by which bacteria seek their optimal growth conditions, and the
conservation of this chemotaxis pathway may be the result of similar growth
requirements for MS-1 and MC-1. This seems unlikely as there are many other alpha-
proteobacterial genomes sequenced which are phylogenetically between MS-1 and MC-1
and from organisms which share similar metabolic drives (e.g., microaerophily).
Chemotaxis pathways are able to convey temporal information for transcriptional
regulation and are able to interact with other protein complexes besides the flagellar
motor. As such this chemotaxis pathway may be a mechanism for regulating the state of
the magnetosome (e.g., redox poise or ionic concentrations). Another possibility is that

20 this conserved gene cluster is part of the hypothesized magnetosome battery, which
would explain the unique metabolic requirements conserved only among MB.
Figure 2: Chemotaxis gene cluster. Targeted interruption site is marked with the black
box.
TolC Transporter Complex
This cluster (see Figure 3) encodes subunits of a TolC transport complex. This
complex is normally used for the export of toxins and is also a channel through which
phages are known to enter bacteria. The TolC complex spans both the outer and
cytoplasmic membranes, and so is a direct channel to the cytoplasmic space. The
conserved TolC complex in magnetotactic bacteria might function as a transport pathway
across the cytoplasmic and magnetosome membranes to facilitate iron transport.

21
Figure 3: Cluster encoding predicted TolC transport complex. Targeted Interruption sites
are marked with black boxes.
Hydrogenases 1 and 2
Large and small subunits of Hydrogenases 1 and 2 are conserved between MS-1
and MC-1 (See Figure 4). Hydrogenase 1 (HyaA and HyaB) is used by other bacteria for
H2 uptake, and Hydrogenase 2 (HybA and HybB) generates H2 during fermentation of
formate [Maness and Weaver, 2001]. It is not yet clear whether MS-1 or MC-1 are
capable of hydrogen metabolism. It has been shown that there are several substrate-
specific metabolisms (iron, nitrate, oxygen) which affect magnetite production, and it
may be that hydrogen is another one.

22
Figure 4: Conserved hydrogenase gene cluster. Targeted interruption site is marked with
the black box.
1.2.2. Methods
Construction of Targeted Insertion Strains
Approximately 500 bp of the target gene was PCR amplified from AMB-1 DNA,
purified and cloned into the TOPO vector (QIAGEN, USA). The target sequence was
digested out of the TOPO vector with SpeI and NotI, purified, and ligated into the pAK31
vector. This plasmid was cloned into E. coli DH5α and transformed into donor strain E.
coli wm3064. The donor strain was then mated with AMB-1 and transconjugants were
selected for with kanamycin. Proper insertion was checked by PCR using a forward
primer for the start of the interrupted gene and reverse primer reading out of the insertion.
Magnetization Assay
For the magnetization assay, stocks stored at -80˚ C were used to inoculate 1.5 ml
of AMB-1 media without added iron in Eppendorf tubes and incubated at 30˚ C. After
three days (late log phase) these cultures were added to 13.5 ml of AMB-1 medium
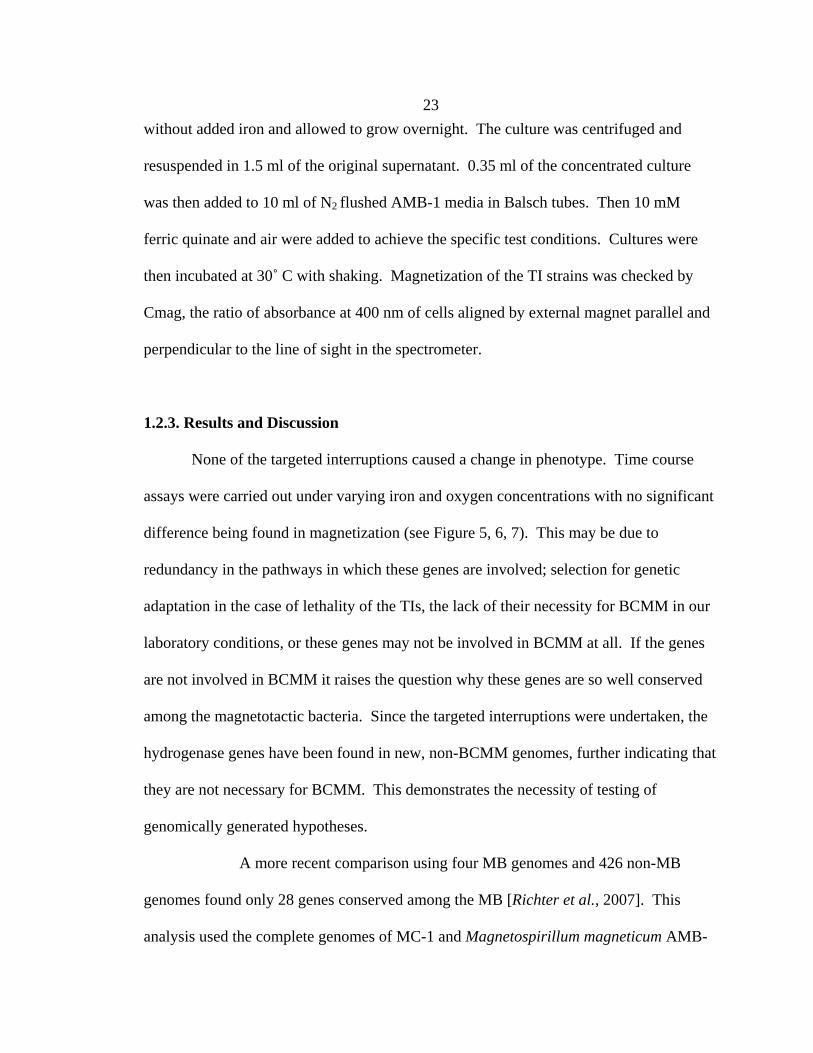
23 without added iron and allowed to grow overnight. The culture was centrifuged and
resuspended in 1.5 ml of the original supernatant. 0.35 ml of the concentrated culture
was then added to 10 ml of N2 flushed AMB-1 media in Balsch tubes. Then 10 mM
ferric quinate and air were added to achieve the specific test conditions. Cultures were
then incubated at 30˚ C with shaking. Magnetization of the TI strains was checked by
Cmag, the ratio of absorbance at 400 nm of cells aligned by external magnet parallel and
perpendicular to the line of sight in the spectrometer.
1.2.3. Results and Discussion
None of the targeted interruptions caused a change in phenotype. Time course
assays were carried out under varying iron and oxygen concentrations with no significant
difference being found in magnetization (see Figure 5, 6, 7). This may be due to
redundancy in the pathways in which these genes are involved; selection for genetic
adaptation in the case of lethality of the TIs, the lack of their necessity for BCMM in our
laboratory conditions, or these genes may not be involved in BCMM at all. If the genes
are not involved in BCMM it raises the question why these genes are so well conserved
among the magnetotactic bacteria. Since the targeted interruptions were undertaken, the
hydrogenase genes have been found in new, non-BCMM genomes, further indicating that
they are not necessary for BCMM. This demonstrates the necessity of testing of
genomically generated hypotheses.
A more recent comparison using four MB genomes and 426 non-MB
genomes found only 28 genes conserved among the MB [Richter et al., 2007]. This
analysis used the complete genomes of MC-1 and Magnetospirillum magneticum AMB-
24 1, and the draft genomes of MS-1 and M. gryphiswaldense MSR-1. Richter et al. found
15 of the mam genes conserved as well as 13 genes outside of the mam cluster. We
found 13 of their 15 mam genes conserved in our study — we did not find the short
proteins mamQ or mamC conserved. We only found 7 of the 13 genes they found outside
of the mam cluster. This includes mtxA, mmsF, and mamX as well as two predicted
hemerythrins, a mamH-like gene, and a phage.
There are a number of differences in the methods that could account for the
different set of genes found between this study and Richter et al.’s 2007 study. First, they
used expectation values to compare BLAST hits. Expectation values are based in part on
the size of the database used for searching, and thus will change from one search to the
next. Our use of bit scores, which aren’t tied to database size, facilitate consistent
comparisons. Ideally one would use an alignment and scoring algorithm with a rigorous
statistical base, such as HMMER (http://hmmer.wustl.edu). The second, and perhaps
greatest difference, is the way they searched the non-magnetotactic genomes. They
restricted their conserved genes (their “MTB-related genes”) to not having a BLAST hit
outside of the MB with an E-value less than 1e-50. This eliminates many of the proteins
identified in our study as they were found to have significant similarity to proteins
outside of the MB, though not as high a similarity to other MB proteins. When they
included significant hits (i.e., E-value < 1e-80) to Rhodospirillum rubrum, the
phylogenetically closest non-MB genome to the magnetospirilla, they found only one
gene conserved. Finally, their use of twice as many MB genomes and non-MB genomes
in their analysis likely eliminated some of the genes we identified in our more limited
analysis.

25
Magnetization, 50 uM Iron, 0.5% Oxygen
0.91
1.11.21.31.41.51.61.71.8
0 500 1000 1500 2000
Time (Min)
Cm
ag
wtchehydtolC
Figure 5: Time course of acquisition of magnetization by TI strains (che: Chemotaxis
cluster, hyd: Hydrogenase cluster, tolC: TolC cluster) versus wild-type (wt). High iron
concentration and low oxygen allowed the cultures to become very magnetic. Error bars
are the average of 3 subcultures of a culture passaged under the same conditions.

26
Magnetization, 20 uM Iron, 2% Oxygen
0.98
1
1.02
1.04
1.06
1.08
1.1
1.12
0 500 1000 1500 2000 2500
Time (Min)
Cm
ag
WTCheHydTolC
Figure 6: Time course of acquisition of magnetization by TI strains (che: Chemotaxis
cluster, hyd: Hydrogenase cluster, tolC: TolC cluster) versus wild-type (wt). Lower iron
and higher oxygen reduced the total magnetization acquired and delayed the onset of
magnetization. Error bars are the average of 3 subcultures of a culture passaged under
the same conditions.

27
Magnetization, 6 uM Iron, 0.5% Oxygen
0.991
1.011.021.031.041.051.061.071.081.091.1
0 100 200 300 400 500
Time (Min)
Cm
ag
WTCheHydTolC
Figure 7: Time course of acquisition of magnetization by TI strains (che: Chemotaxis
cluster, hyd: Hydrogenase cluster, tolC: TolC cluster) versus wild-type (wt). Very low
iron and low oxygen reduced the total magnetization acquired without delaying the onset
of magnetization. Error bars are the average of 3 subcultures of a culture passaged under
the same conditions.
28 Chapter Two: Genetics
2. Transposon Mutagenesis Analysis of Magnetotactic Biomineralization
Cody Z. Nash, Arash Komeili, Robert E. Kopp, Atsuko Kobayashi, Hojatollah Vali,
Dianne K. Newman, and Joseph L. Kirschvink
2.1. Introduction
Magnetotactic bacteria (MB) are distinguished from other bacteria by their ability
to synthesize intracellular magnetic crystals in the single-domain size range. In
laboratory strains of MB the crystals are mainly composed of the iron oxide magnetite
(Fe3O4) with minor amounts of other iron oxides. These crystals occur within lipid-
membrane-bounded spaces termed magnetosomes, which have a distinct population of
proteins from that of the other cell membranes. These crystals are generally chemically
pure, have no crystallographic defects, and are arranged into chains. Different strains of
magnetotactic bacteria form different shapes of crystals, and some strains produce the
magnetic iron sulfide Greigite. Within each strain the shape and composition of crystals
is uniform, which suggests that there is genetic control over their synthesis.
A number of studies have identified the genes involved by using transposon
mutagenesis. In this technique bacteria are mutated by introducing a transposon to them
through conjugation with a donor strain. The transposon carries a drug resistance marker
which allows the transconjugants to be isolated. The resulting population can then be
screened in various ways to isolate mutants in a specific phenotype. The gene
responsible can then be discovered by determining the insertion site of the transposon.

29 Previous studies have demonstrated the role of several genes necessary for the
magnetotactic phenotype, including iron transporters, flagellum, and regulatory genes.
In this study we screened through 5809 mutants to identify more of the genes
involved in the process. Nineteen non-magnetic or partially magnetic mutants were
identified. Fourteen of these were in the mam cluster, an island of genes which encode
many of the proteins found in abundance in the magnetosome membrane. The other five
mutants have insertions in genes outside of the mam cluster. The necessity of genetic
machinery outside of the mam cluster indicates that magnetotaxis may not be as easily
laterally transferred as has been previously speculated. It also suggests a number of
previously unsuspected pathways may be involved in the magnetotactic phenotype.
2.2. Methods
Mutagenesis
To generate mutants, the Mariner transposon was introduced to Magnetospirillum
magneticum AMB-1 through conjugation with a donor strain, Escherichia coli β2155, as
previously described [Komeili et al., 2004]. Selection was done with Kanamycin at 5
μg/ml. Transconjugation rates of up to 5e-05 were achieved. Timing was critical to
prevent spontaneous mutants.

30 Magnetic Screen
Mutants were screened by growing them in 96-well plates and, after grown,
placing them over an array of magnets, as previously described [Komeili et al., 2004].
Magnetic mutants were pulled to the sides of the wells, while non-magnetic mutants
remained at the bottom (See Figure 1).
Figure 1: Magnetic screen for non-magnetic mutants. (a) A plate of transconjugants
placed over an array of magnets to pull the MB to the side of the wells. (b) Close-up of a
magnetic and non-magnetic mutant
PCR Screen
Due to the high rate of spontaneous mutation in strain AMB-1, non-magnetic
mutants were checked for deletions in the mam cluster. Mutants were initially screened
for the presence of mamA, and then along 16 kb of the mam cluster. PCR was used to
amplify 1–3 kb sections of the mam cluster to determine their presence, absence, or
change in length. Amplifications were carried out with Promega 2X PCR mix (Promega
Corporation, Madison, WI, USA) with 30 cycles and a 56˚ C annealing temperature.

31
List of Primers for PCR screen:
MamA-up 5' GGCGAATTCATGTCTAGCAAGCCGTCGGA 3'
MamA-down 5' GGCGGATCCGACCGAGGCCCCTTCGTCAAGT 3'
ClBeg 5' GTTCAGGTCGGTGGGTTTTT 3'
ORF2-2 5' GTTCGGCAAGACCGAAATTA 3'
ORF2-1 5' GCGTGGAAGAGGTCGAGA 3'
ORF5-2 5' CTTGTATCTCCGGCTTCTCG 3'
ORF5-1 5' CGTCAATGTGGCCATGTATT 3'
ORF7d 5' ACATTGCCCTTGACCACATT 3'
ORF7c 5' CGAGAAGTTCCTGCATTTCC 3'
AQ2 5' ACGGCCAGATCGTACTTTTG 3'
AQ1 5' GGGAATCGCCTATGTGAAGA 3'
ORF11-2 5' GCGACAGATTTTCCAAAACG 3'
ORF11-1 5' ACGTCAAGTCGATCCAGGTC 3'
ClEnd 5' CTCGCAAACACTCAAGACACTCAG 3'
Magnetization Measurements
For time-course experiments, magnetization was measured by absorbance at 400
nm wavelength. Magnetic cultures have a higher absorbance when they are aligned
parallel to the line of sight than when aligned perpendicularly. Alignment was induced
by placing a large stir bar magnet adjacent to the culture during measurement. The ratio
of parallel to perpendicular absorbance is defined as Cmag.

32 For moment per cell measurements, 1600 mT isothermal remnant magnetization
was measured on 1.5 ml cultures in Eppendorf tubes with a 2G Enterprises SQUID
magnetometer. Culture density was determined by direct cell counts.
TEM Imaging
Conventional TEM and HAADF/STEM/EDX analysis was carried out on a
Tecnai G2 F20 Twin (FEI, Holland), as described previously [Kobayashi et al., 2006].
Cryo-TEM was carried out with a JEOL JEM-2000FX TEM as previously described
[Komeili et al., 2004].
Complementation
The pAK4 vector, a modified pBBR1MCS4 vector containing a tac promoter,
was used as the base for complementation plasmids. Sequences to be complemented
were PCR amplified with the high fidelity polymerase EHF (Roche, Switzerland), ligated
into the pAK4 backbone, cloned into DH5α λpir, transformed into donor strain wm3064,
and then into the mutant strain. Selection was done with Ampicillin or Carbenicillin.
Targeted Interruption
The pWM91 vector was used as the base for targeted interruptions [Metcalf et al.,
1996]. 1 kb target sites were amplified with ThermoPol polymerase (NEB, USA), ligated
into the pWM91 backbone, cloned into DH5α λpir, transformed into donor strain
wm3064, and then inserted into the chromosome of wild-type Magnetospirillum

33 magneticum AMB-1 via homologous recombination. Selection was done with
Kanamycin.
Strains and Plasmids Used:
Magnetospirillum magneticum AMB-1 [Matsunaga et al., 1991]
E. coli DH5a cloning strain for vector construction [Sambrook et al., 1989]
E. coli wm3064 donor strain for mutagenesis [Dehio and Meyer, 1997]
E. coli b2155 for mutagenesis
PSC189 — hyperactive mariner transposon [Chiang and Rubin, 2002]
pAK [Komeili et al., 2004]
2.3. Results and Discussion
Out of 5809 mutants screened, 192 were initially found to be non-magnetic. Most
of these were found to be spontaneous mutants during the PCR screen. The rate of
spontaneous mutation decreased from 11% to 0.5% when care was taken to minimize the
amount of time in stationary phase the AMB-1 cultures experienced prior to mating. This
is consistent with previous work showing a correlation between time in stationary phase
and spontaneous mutation in MB, probably due to native transposon activity [Schübbe et
al., 2003; Ullrich et al., 2005]. 19 of the 192 were found to be non- or partially magnetic
and not due to deletions of all or part of the mamAB cluster based on the PCR assay. Of
the 19 non-magnetic mutants, 14 had insertion sites inside the mamAB cluster in six
different genes (see Figure 2). The five mutants with insertion sites outside of the
mamAB cluster are discussed individually below.

34
Figure 2: Map of insertion sites in the mamAB cluster in AMB-1. Locus numbers are
inside the genes, map position below the scale, gene names below the scale, and insertion
sites are marked with the arrowheads.
MNM9
Mutant MNM9 has a transposon insertion site 99088 base pairs from the origin of
the chromosome, near the beginning of predicted gene amb0089. Magnetic
measurements show that it is completely non-magnetic. HAADF TEM showed an
absence of magnetite (See Figure 3a). Cryo-TEM also shows an absence of magnetite,
but further shows that MNM9 lacks magnetosomes entirely, membranes and all (See
Figure 3b & 3c).
35
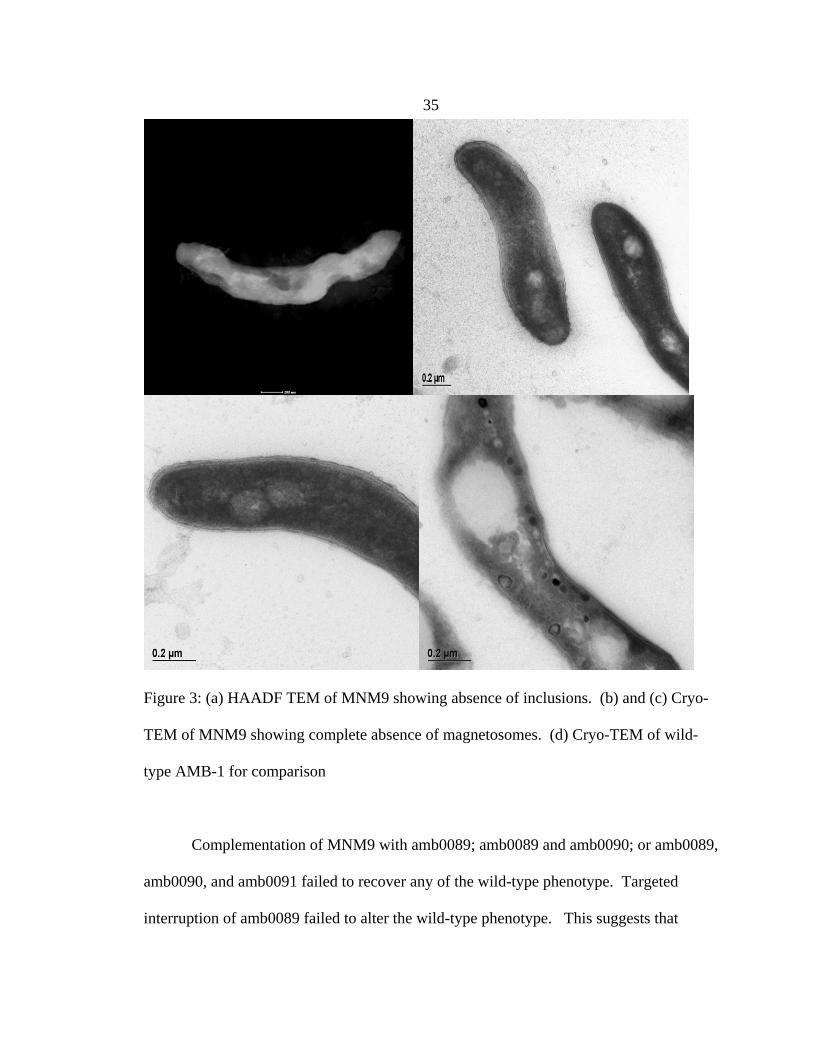
Figure 3: (a) HAADF TEM of MNM9 showing absence of inclusions. (b) and (c) Cryo-
TEM of MNM9 showing complete absence of magnetosomes. (d) Cryo-TEM of wild-
type AMB-1 for comparison
Complementation of MNM9 with amb0089; amb0089 and amb0090; or amb0089,
amb0090, and amb0091 failed to recover any of the wild-type phenotype. Targeted
interruption of amb0089 failed to alter the wild-type phenotype. This suggests that

36 MNM9’s phenotype may be due to a spontaneous mutation in some other part of the
chromosome, although large-scale deletions in the mamAB cluster were ruled out by the
PCR screen. The discovery and development of efficient native promoters in AMB-1
may allow better complementation in the future [Yoshino and Matsunaga, 2005]. The
failure of the targeted interruption to replicate the MNM9 phenotype may be because the
interruption did not replicate necessary polar effects.
The predicted gene amb0089 is a predicted Fe-S oxidoreductase and falls into the
Radical SAM protein superfamily. These proteins have an iron-sulfur center which
generates organic radicals from the S-adenosylmethionine (SAM) molecule (for reviews,
see [Fontecave et al., 2004; Layer et al., 2004]). Radical SAM proteins can act in a
regulatory role by catalyzing the methylation of DNA, hormones, neurotransmitters, and
signal transduction systems. They also play a role in numerous biosynthetic pathways by
catalyzing the addition of parts of the SAM molecule to the substrate. Many of the
predicted genes near amb0089 which code in the same direction belong to the sialic acid
biosynthesis pathway (See Figure 4). Sialic acid is a terminal sugar residue on
glycoproteins which is expressed on the outer surface of membranes in eukaryotes to
regulate vesicle transport. Sialic acid is also commonly used by pathogenic bacteria to
evade an immune response. What sialic acid is doing in AMB-1 is still a mystery.

37
Figure 4: Location of transposon insertion for MNM9. Locus numbers are inside the
genes, map position below the scale, predicted product below the scale, and the insertion
site is marked with the arrowhead.
MNM13
Mutant MNM13 has an insertion site at 197516 bp along the AMB-1
chromosome, in the middle of gene amb0172. Magnetization assays showed it to have a
weakly magnetic phenotype. Cryo-TEM shows MNM13 to have isolated, elongate
crystals (See Figure 5) in contrast to the equant crystals produced by wild-type AMB-1.
Figure 5: Cryo-TEM of MNM13 showing isolated, elongate crystals

38
Complementation of gene amb0172 or amb0172 and amb0173 failed to change
the phenotype of MNM13. Gene amb0172 is a predicted hydrolase or acyltransferase,
and the adjacent genes coding in the same direction are a hypothetical protein and a
predicted aldehyde dehydrogenase (see Figure 6).
Figure 6: Transposon insertion site for MNM13. Locus numbers are inside the genes,
map position below the scale, predicted product below the scale, and the insertion site is
marked with the arrowhead.
MNM16
MNM16 has its transposon insertion site at 225328 bp along the AMB-1
chromosome near the end of predicted gene amb0200. Magnetization assays indicated it
was partially magnetic (see Figure 7) and conventional TEM revealed fewer crystals
scattered along the magnetosome chain, with each crystal appearing normal (see Figure
8).

39
Magnetization
1
1.1
1.2
1.3
1.4
1.5
1.6
1.7
1.8
0 5 10 15 20 25
Hours
Cm
ag
wt 1% O2wt 0% O216 1% O216 0% O2
Figure 7: Magnetization assays of MNM16 under 0% and 1% O2 in headspace, as
compared to wild-type. Error bars are the average of 3 subcultures of a culture passaged
under the same conditions.
Figure 8: TEM of MNM16 showing fewer crystals than in wild type
Complementation of gene amb0200 did not have any significant effect on the
phenotype, while complementation of genes amb0200 through amb0196 (on the

40 complementary strand) partially restored the phenotype both in Cmag and IRM
measurements of magnetization (see Figures 9 and 10).
16 comp 1%
11.051.1
1.151.2
1.251.3
1.351.4
0 2 4 6 8 10
hrs
cmag
apq.116pB16P
16 comp 0%
1
1.05
1.1
1.15
1.2
1.25
1.3
0 2 4 6 8 10
hrs
cmag
apq.116pB16P
Figure 9: Time course of complementation of MNM16. (a) Experiments with 1% O2 in
headspace of Balsch tubes. (b) Experiments with 0% O2 in headspace of Balsch tubes.
16pB is mutant mnm16 carrying an empty complementation vector to confer Ampicillin
resistance. 16P is complemented for the mutated gene and downstream genes (see text
for discussion). APQ.1 is wild-type AMB-1 carrying the Ampicillin and Kanamycin
resistance carrying plasmid APQ.1. Growth curves are from single cultures.

41
Complementation
0.00E+00
2.00E-14
4.00E-14
6.00E-14
8.00E-14
1.00E-13
1.20E-13
16pB 16G 16P 18pB 18G 18P 20pB 20P APQ.1
Mom
ent/C
ell
Figure 10: Complementation assays for MNM16, MNM18, and MNM20. 16pB, 18pB,
and 20pB are mutants mnm16, 18, and 20 carrying an empty complementation vector to
confer Ampicillin resistance. 16G and 18G are mnm16 and 18 with only the mutated
gene complemented. 16P, 18P, and 20P are complemented for the mutated gene and
downstream genes (see text for discussion). APQ.1 is wild-type AMB-1 carrying the
Ampicillin and Kanamycin resistance carrying plasmid APQ.1. Error bars are the
average of 3 subcultures of a culture passaged under the same conditions.
MNM16’s insertion is in a predicted transcriptional regulator. Complementation
of this gene alone did not significantly change the phenotype, while complementation of
amb0200 and four of the downstream genes did have a significant effect. This suggests
that one of the downstream genes is responsible for the phenotype. These genes are
predicted to be of various and uncharacterized functions (see Figure 11), and in that way

42 resemble the genes of the mamAB cluster. This diversity of predicted function may be
how a new pathway appears in annotation.
The reduced number of crystals seen in MNM16 is similar to that seen in AMB-1
when mamA is knocked out [Komeili et al., 2004]. It would be very interesting to see if
the expression of the mam genes is affected in the same manner in both MNM16 and
mamA deletions.
Figure 11: Transposon insertion site of MNM16 and nearby genes. Locus numbers are
inside the genes, map position below the scale, predicted product below the scale, and the
insertion site is marked with the arrowhead.
MNM18
The transposon insertion site of MNM18 is at base pair 3494968 in gene
amb3233. MNM18 is partially magnetic (see Figure 12) and is the only mutant to display
a growth defect. TEM shows that MNM18 produces 1–2 equant crystals per cell (See
Figure 13).

43
Growth Curves of Wild-type AMB-1 and MNM18
0
0.05
0.1
0.15
0.2
0.25
0 5 10 15 20 25 30 35
Hours
Abs
orba
nce
at 4
00 n
m
Figure 12: Growth curves of MNM18 versus wild-type. Wild-type is in black, MNM18
is in light grey. Curves are not averaged so that the individual behavior of each culture
can be examined. The 3 wild-type and mnm18 cultures are subcultures of a single culture
passaged under the same conditions as the experiment.

44
Figure 13: TEM of MNM18 showing one large equant crystal and one small, poorly
formed crystal
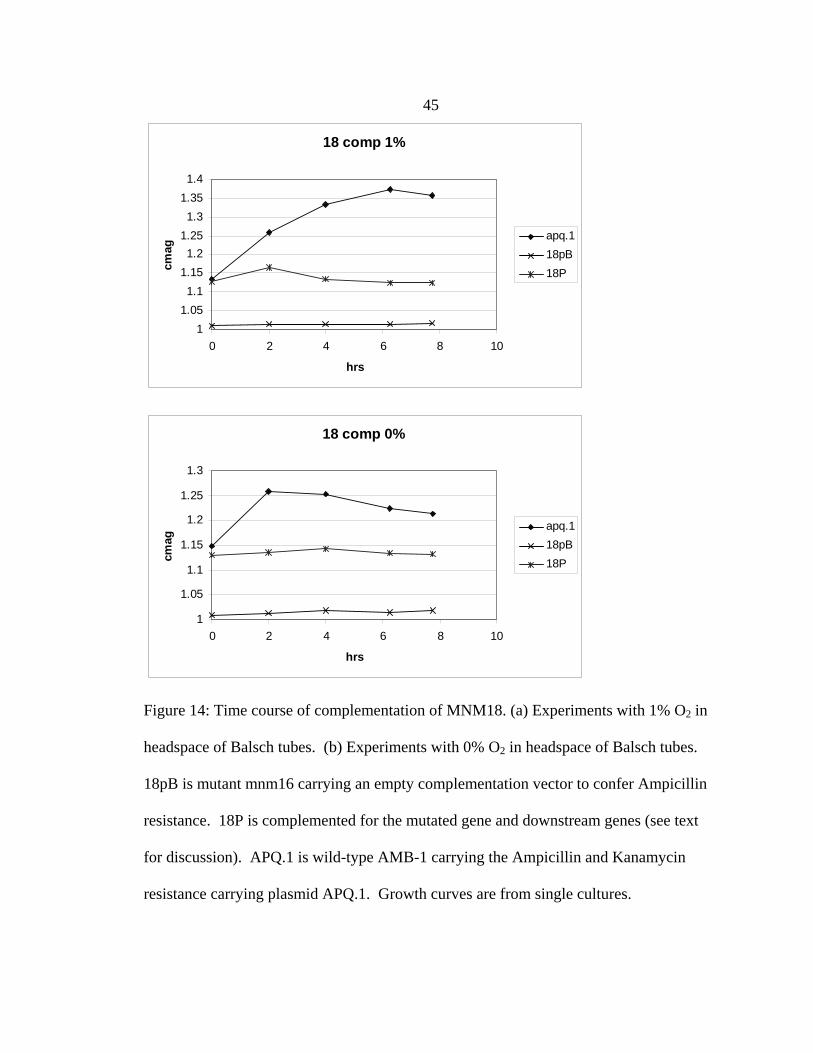
Complementation of amb3233 alone did not have a significant effect, but
complementation of genes amb3233, amb3234, and amb3235 significantly restored the
phenotype in both time course Cmag and IRM magnetization assays (see Figures 10 &
14). The complementation did not restore the growth defect. This may be due to the low
level of complementation achieved for the magnetization. Complementation of the
growth defect may be too low to detect with this construct.
45
18 comp 1%
11.051.1
1.151.2
1.251.3
1.351.4
0 2 4 6 8 10
hrs
cmag
apq.118pB18P
18 comp 0%
1
1.05
1.1
1.15
1.2
1.25
1.3
0 2 4 6 8 10
hrs
cmag
apq.118pB18P
Figure 14: Time course of complementation of MNM18. (a) Experiments with 1% O2 in
headspace of Balsch tubes. (b) Experiments with 0% O2 in headspace of Balsch tubes.
18pB is mutant mnm16 carrying an empty complementation vector to confer Ampicillin
resistance. 18P is complemented for the mutated gene and downstream genes (see text
for discussion). APQ.1 is wild-type AMB-1 carrying the Ampicillin and Kanamycin
resistance carrying plasmid APQ.1. Growth curves are from single cultures.

46 The gene amb3233 is a predicted to encode the α and β subunits of a
pyruvate/ferredoxin oxidoreductase. The downstream genes are the γ-subunit and a cheY
gene, and the upstream gene is a predicted transcriptional regulator (see Figure 15). The
genes flanking this cluster code on the opposite strand. The growth defect of MNM18 is
consistent with a disruption of metabolic genes.
Figure 15: Insertion site of MNM18. Locus numbers are inside the genes, map position
below the scale, predicted product below the scale, and the insertion site is marked with
the arrowhead.
MNM20
MNM20 has its insertion site at position 553134, in gene amb0516.
Magnetization assays show MNM20 to be partially magnetic and HAADF TEM shows
that it has many poorly formed and amorphous crystals (see Figure 16).
MNM20 sometimes grows without any defect in magnetization, and it is not clear
what growth conditions are necessary to produce the mutant phenotype. It is possible
that the frequent spontaneous mutations AMB-1 experiences are able to revert MNM20
to the wild-type phenotype.

47
Figure 16: HAADF TEM images of MNM20 showing many poorly formed and
amorphous crystals
The gene amb0516 is a hypothetical protein with few matches outside of the
Magnetospirilla. The downstream gene amb0517 is even more unusual in that it is
similar to many eukaryotic proteins. This gene cluster (see Figure 17) again displays the

48 trait of genes with various and poorly characterized functions, suggesting involvement in
a poorly understood pathway.
Figure 17: Insertion site of MNM20. Locus numbers are inside the genes, map position
below the scale, predicted product below the scale, and the insertion site is marked with
the arrowhead.
2.4. Conclusions
Out of 5809 mutants screened, 19 were identified as non- or partially magnetic
and did not have large deletions in the mamAB cluster. Fourteen of these are insertions in
the mamAB cluster, demonstrating its role in the magnetic phenotype of magnetotactic
bacteria. Five mutants have insertions in genes outside the mamAB cluster, suggesting
that the genetic systems necessary for the wild-type magnetic phenotype are not restricted
to a few clusters of genes. The difference between the genes identified in this
mutagenesis and others may be due to the different transposons used. In comparing this
study with other transposon mutagenesis studies in magnetotactic bacteria, this is the only
one to use a PCR screen, which may account for the lower total number of non-magnetic
mutants seen (see Table 1).

49 The absence of insertions in the mamGFDC cluster, another cluster of genes
which encode magnetosomal proteins, is consistent with recent results that these genes
are not necessary for a magnetic phenotype [Scheffel et al., 2008]. The absence of
insertions in the mamJ and mamK genes is also consistent with recent work showing that
these genes affect magnetosome localization but not magnetite formation in the
magnetospirilla [Komeili et al., 2006; Scheffel et al., 2006].
There are a number of methods which future investigators could use to examine
the role of these genes in magnetotaxis. One could test recently developed high-
efficiency native promoters to try to improve the complementation of the mutants
[Yoshino and Matsunaga, 2005]. Another route to conclusively testing the role of these
genes would be to carry out knock outs of the genes, which would eliminate the
possibility of read-through from the drug resistance marker inserted during targeted
interruptions. Targeted interruptions can also generate incomplete versions of the protein
they interrupt, either from the fragment before or after the insertion. These incomplete
versions may retain full functionality in the conditions assayed or may interfere with
other cellular processes to mask any effect on magnetite biomineralization. A knock out
avoids these possibilities.
Finally, another way to examine these mutants is to look at the mRNA levels of
the relevant genes. Through reverse transcriptase PCR (RT PCR) one could check the
expression levels of mam genes to see which, if any of the mutants has altered regulation
of these genes known to be involved in magnetotaxis. RT PCR would also allow one to
determine how effective complementation is relative to the mutant expression levels of
the mutated genes. It could also be used to compare expression levels of the mam genes

50 between mutants, targeted interruptions, and knock outs to see if the latter two methods
are replicating the mutant phenotype at the RNA level.

51 Table 1: Transposon Mutagenesis Studies in Magnetotactic Bacteria
Strain Transposon Mutants Screened
Non-magnetic
Insertion sites identified
Ref
AMB-1 Mini-Tn5 118 5 amb3990 (magA) [Matsunaga et al., 1992; Nakamura et al., 1995]
AMB-1 Mini-Tn5 5762 69 amb0192, amb0291, amb0503, amb0521, amb0676, amb0741, amb0759, amb1309, amb1394, amb1482, amb1692, amb1722, amb1790, amb2051, amb2087, amb2504, amb2554, amb2611, amb2660, amb2765, amb2922, amb3184, amb3268, amb3279, amb3295, amb3450, amb3458, amb3672, amb3734, amb3742, amb3766, amb4107, amb4111, amb4543
[Matsunaga et al., 2005; Wahyudi et al., 2001]
MSR-1 Mini-Tn5 ? 2 AAX11190 (CheY) (~amb0983)
[Li et al., 2005]
AMB-1 Mariner 700 2 amb0968 (mamN), amb0972 (mamQ)
[Komeili et al., 2004]
AMB-1 Mariner 5809 19 amb0089, amb0172, amb0200, amb0516, amb3233, amb0963 (mamE), amb0967 (mamM), amb0968 (mamN), amb0969 (mamO), amb0971 (mamA), amb0972 (mamQ)
This Study

52 Chapter 3: Environmental Microbiology
3.1. Extremophilic Magnetotactic Bacteria and Archaea
Nash, C. Z.1, Popa, R.2, Kobayashi, A.3, and J. L. Kirschvink1
1Division of Geological and Planetary Sciences, California Institute of Technology,
Pasadena, CA, 91125, USA. 2Portland State University, Portland, OR, 97207, USA.
3Photonics Research Institute, National Institute of Advanced Industrial Science and
Technology, Osaka, Japan.
Magnetotactic bacteria (MB) form nanoscale crystals of the ferrimagnetic
minerals magnetite (Fe3O4) or greigite (Fe3S4) inside intracellular lipid-membrane-
bounded vesicles termed magnetosomes. All reports since their initial discovery
[Blakemore, 1975] have been in freshwater, marine, and soil environments at near
neutral pH and temperatures below 30° C [Bazylinski and Frankel, 2004]. Only two
of the 150+ 16S rDNA sequences of MB lie outside of the bacterial phylum
Proteobacteria. These two belong to the genus Magnetobacterium in the phylum
Nitrospirae. In order to better understand the diversity and environmental range
of MB we examined samples from two extreme environments. Here we report the
discovery of several magnetotactic extremophiles: a thermophile from Little Hot
Creek (LHC), (37.69º N, 118.84º W), and four from the hyper-alkaline, hyper-saline
waters of Mono Lake (37.98º N 119.12º W). Analysis of the 16S rRNA gene indicates
that the thermophilic organism groups with the genus Magnetobacterium in the
phylum Nitrospirae, whereas one species of MB from Mono Lake (MonoEub) lies
with the γ-proteobacteria. We also report the first evidence for magnetotactic
Archaea, in three clones from Mono Lake: ML1, ML3, and ML4. Our findings

53 extend the environmental range of these fossil-forming organisms to include
environments expected to have existed on early Earth and will facilitate geo- and
astrobiological investigations. Our findings also extend the phylogenetic breadth of
magnetotactic microorganisms to include all three domains of life. We anticipate
these organisms to be targets for further analysis to investigate the evolution and
origins of magnetotaxis.
We conducted an initial survey of the LHC site by taking 10 microliter samples
with a pipette and checking them microscopically for a response to a magnetic field. We
checked a range of temperatures from 40o to 80º C at every spring within the group. We
only observed magnetotactic bacteria at one freshwater spring, in 45º–55º C mats
adjacent to the main flow channel. These microbial mats were ~ 1 cm thick, dominated
by a red layer on the surface. We observed MB throughout these mats, but in higher
densities ~ 5 mm from the surface. Microscopic examination of biofilms from similar hot
springs in central California revealed the presence of MB in microbial mats at
temperatures up to 58º C.
We collected small cores of mats and sediments that were kept at 50º C during
transport to, and in, the lab. We observed MB bacteria in these samples over several
months, indicating that they are able to live at these temperatures. Using the magnetic
racetrack technique [Wolfe et al., 1987], we then isolated pellets of MB. We amplified,
cloned, and sequenced DNA using standard techniques, employing either universal
bacterial or archaeal primers. RFLP analysis of 6–10 clones from each sample showed
they were homogenous. Phylogenetic analysis of the sequences obtained was carried out

54 with ARB (see Figure 1). The LHC sequences belong to a group of Nitrospirae that
contains two other MB, as well as clones from other hot springs (see Figure 2).
Samples from Mono Lake (pH of 9.8 and salinity 80.8 g/l) were collected from the
shore to depths up to 40 m using a gravity corer or SCUBA. Cores were stored at room
temperature and MB were observed over a period of months. MB were extracted and
analyzed as with the LHC samples. The closest relatives of the archaeal sequences are
clones from deep-sea hydrothermal surveys, while the closest relatives to the MonoEub
sequence are from Mono Lake and other basic, salty locales (see Figures 3–5).
HRTEM and HAADF/STEM/EDX examination (Tecnai F20 G2Twin) of these
organisms revealed prismatic or bullet-shaped magnetite crystals organized in string-like
bundles; no Greigite magnetosomes were detected (see Figures 6 and 7). The ability of
these bacteria to form magnetite in extremes of temperature, salinity and alkalinity may
prove useful in manufacturing magnetic nanoparticles for many existing applications
[Šafarík and Šafaríková, 2002].
As the deepest branches of the tree of life are composed of thermophiles, these
discoveries, coupled with the wide phyletic distribution of magnetite-precipitating
organisms shown in Figure 1, indicate that magnetotaxis could be a very ancient trait,
perhaps even pre-dating the divergence of the Bacterial, Archaeal, and Eukaryal
Domains.
Sediments of hydrothermal origin are known in the geological record as far back as
3.5 Ga [Brasier et al., 2002], so there is the potential for tracing the fossil remains of
these bacteria into Archean time. Currently unequivocal magnetofossils have been found
in sediments dating back to the Cretaceous, and potential ones as old as the

55 Paleoproterozoic [Chang et al., 1989; Kopp and Kirschvink, 2008]. The ability to identify
these biomarkers in environments found on the early Earth and thought to exist elsewhere
in the universe provides a new tool to look for ancient and alien life.
Author Contributions C.Z.N., R.P., and J.L.K. performed the sampling. C.Z.N.
performed the molecular and phylogenetic work. A.K.K. performed the electron
microscopy. All authors discussed the results and commented on the manuscript.
Figure 1: Small subunit rRNA phylogenetic tree. Groups containing species which
synthesize magnetic minerals highlighted in grey and labelled. Sequences obtained from
this study shown in dark grey.

56
Figure 2: Phylogenetic tree of 16S rRNA sequences closest to the magnetotactic bacterial
sequence obtained from Little Hot Creek, CA. They fall into the Nitrospirae phylum, a
diverse group of nitrite oxidizing, sulfate reducing organisms from contaminated and
thermal environments. The closest clone to our sequences, BcrEubac, is from the outflow
channel of Octopus Springs, Yellowstone National Park, WY [Kopczynski et al., 1994].
Saltmarsh clone LCP-6 is an unpublished sequence from a contaminated site. The next
two closest relatives are both MB from lakes in Bavaria [Flies et al., 2005; Spring et al.,
1993]. Note the closest isolates are Thermodesulfovibrio spp. from hot springs in
Yellowstone and Iceland. Tree was constructed using ARB, with alignments manually
curated and sequences added to the tree in interactive parsimony mode [Ludwig et al.,
2004].

57
Figure 3: Phylogenetic tree of 16S rRNA sequences closest to the magnetotactic bacterial
sequence obtained from Mono Lake, CA, marked with the asterisk. Note the closest
isolates are Marinospirillum minutulum and M. megaterium, both from a low oxygen,
high nitrogen, moderate salinity environment — a fermented brine [Satomi et al., 1998].
Tree was constructed using ARB, with alignments manually curated and sequences added
to the tree in interactive parsimony mode [Ludwig et al., 2004].

58
Figure 4: Phylogenetic tree of 16S rRNA sequences closest to the first putative archaeal
sequence obtained from Mono Lake, CA, marked with the asterisk. There are no isolates
closely related to ML1. The nearby clones, UncArc16 and AhaVC21, are both from deep
sea hydrothermal vent samples and belong to marine benthic group B [Reysenbach et al.,
2000; Teske et al., 2002]. This tree was constructed using ARB, with alignments
manually curated and sequences added to the tree in interactive parsimony mode [Ludwig
et al., 2004].

59
Figure 5: Phylogenetic tree of 16S rRNA sequences closest to the other putative archaeal
sequences obtained from Mono Lake, CA, marked with the asterisk. There are no
isolates closely related to either ML3 or ML4. ML3’s neighbors, VC2.1 Arc6 and an
unidentified archaeon are both from deep sea hydrothermal vent samples [Reysenbach et
al., 2000; Takai and Horikoshi, 1999]. ML4’s neighbors are single clone from the
methanogenic zone of a contaminated sediment (WCHD3-16, [Dojka et al., 1998]) and a

60 dominant clone from high salinity, deep sea brines (KTK4A, [Eder et al., 1999]). The
nearest isolates are Thermoplasma acidophilum and Picrophilus oshimae, both meso- to
thermophilic acidophiles [Golyshina and Timmis, 2005]. This tree was constructed using
ARB, with alignments manually curated and sequences added to the tree in interactive
parsimony mode [Ludwig et al., 2004].

61
Figure 6: HAADF/EDX of ML and LHC samples. (A) HAADF image of Mono Lake
sample. Region boxed in red analyzed with EDX. (B) EDX Analysis of sample from
Mono Lake shows Fe and O, suggesting magnetite. (C) HAADF image of LHC sample.
(D) EDX analysis of sample from LHC shows Fe and O, suggesting magnetite.

62
Figure 7: HRTEM/FFT of LHC sample. (A) HRTEM from one of LHC crystals in 2C
showing lattice spacing characteristic of magnetite (B) Fast Fourier Transform pattern of
the crystal in A confirms magnetite.

63 Chapter 3: Environmental Microbiology
3.2. Degenerate PCR recovery of mamB fragment from LA Arboretum magnetic
cocci.
3.2.1. Introduction
The phylogenetic distribution of MB includes all of the phyla Nitrospirae,
Proteobacteria, and possibly even Firmicutes. Genes which are known to be involved in
magnetosome formation have so far only been retrieved from three magnetospirilla and
one magnetic coccus (strain MC-1), all of which are in the α-Proteobacteria. This project
was an effort to retrieve some of these genes from other MB.
For this we chose two targets. The first was a magnetic cocci found in the Los
Angeles Arboretum tentatively named ARB-1 [Cox et al., 2002]. ARB-1 was chosen
both because of its great abundance in the environment and because of its phylogenetic
position. ARB-1 is distant from both MC-1 and the magnetospirilla, yet still within the
magnetic coccus clade of the α-Proteobacteria.
The second target is Desulfovibrio magneticus RS-1 [Sakaguchi et al., 1993;
Sakaguchi et al., 2002]. RS-1 is a δ-Proteobacteria and the only MB in pure culture
which is not an α-Proteobacteria.
The genes chosen were mamA, mamB, and mamC. These genes were chosen
because of their presence in both the magnetospirilla and MC-1 and their position at the
beginning of the mam cluster, which encodes many of the proteins that are abundant in
the magnetosome membrane. More recent work on mamA and mamC has demonstrated

64 that these genes affect the number and shape of crystals in the magnetospirilla, but are not
necessary for magnetite formation [Komeili et al., 2004; Scheffel et al., 2008].
3.2.2. Methods
Enrichment of ARB-1
Sediment samples were collected from Lake Baldwin in the Los Angeles
Arboretum in Arcadia, CA. Magnetic cocci were observed to be in the highest
abundance in the most sapropelic muds, based on hanging drop observations. MB were
enriched by placing magnets on the outside of the sample bottles, shaking the jar until all
sediment was suspended and then allowing it to settle for 2 hours. 1 ml of water and
magnetic material was collected from each the north and south magnets and run over
superparamagnetic columns (Miltenyi Biotec, Germany). 10 ml aliquots of 0.2 μm
filtered sample water were used to rinse non-MB from the column; washing was carried
out five times until no bacteria were observed in the elution. The magnets were then
removed from the column and two 10 ml aliquots of 0.2 μm filtered sample water were
flushed through to collect the MB. Samples were centrifuged and re-suspended in 1 ml
of the original supernatant. DNA was then extracted from the sample using an Ultraclean
Soil DNA Kit (Mo Bio Laboratories, USA).
RS-1
Desulfovibrio magneticus RS-1 was obtained from the DSMZ (Germany) and
cultured anaerobically as described previously [Sakaguchi et al., 2002]. DNA was
extracted using a standard phenol-chloroform extraction [Sambrook et al., 1989].

65
Degenerate PCR
Degenerate primers were designed based on the mamA, mamB, and mamC
sequences from MS-1 and MC-1 using the CODEHOP software [Rose et al., 1998].
Various PCR conditions were tested. Promega 2X reaction solution was used with 1–10
μL of template DNA, with 30–50 amplification cycles, with annealing temperatures of
52–58˚ C. Products were purified with QIAGEN gel extraction kit, cloned with TOPO
TA 2.1 cloning vector into DH5α cells, and minipreped with QIAGEN miniprep kit for
sequencing.
Primers Used:
Adeg4 5' TGAATGATGATTATCGTCAGGTGTATTATmgngayaargg 3'
Adeg5 5' GATTATCGTCAGGTGTATTATCGTgayaarggnat 3'
Adeg6R 5' CCATGCCCAGACGATAATGAayrttraartt 3'
Adeg7R 5' CTGAAAGGCATCAATCgcytcrtcrwa 3'
Bdeg1 5' CCCTGAAAATTTCCAACAGAccngcngayga 3'
Bdeg2 5' CGGCGATTATGGCGaaygcntggga 3'
Bdeg3 5' GCGATTATGGCGAACgcntgggayaa 3'
Bdeg4 5' GGCGAACGCGtgggayaaymg 3'
Bdeg5R 5' CATCGGAACGGTTAtcccangcrtt 3'
Bdeg6R 5' AACGCATCGGAACGGttrtcccangc 3'
Bdeg7R 5' GAGGAAAACGCATCGGAAckrttrtccca 3'
Bdeg8R 5' CCAAAGGTGGCAAAAATCacnccnaycat 3'

66 Bdeg9R 5' CCGGGGAGGCAtccatnarncc 3'
Cdeg1 5' ACCAACACAGAAGCGGTGathgayacngg 3'
Cdeg2 5' CAACACAGAAGCGGTGATTgayacnggnaa 3'
Cdeg3 5' AACACAGAAGCGGTGATTGATacnggnaarga 3'
Cdeg4 5' AAGCGGTGATTGATACCggnaargarrc 3'
Cdeg5R 5' TGATCCATGCCATAATCCcangcrtaytt 3'
Cdeg6R 5' TGATCCATGCCATAATcccangcrtayt 3'
Cdeg7R 5' TGATCCATGCCATAAtcccangcrta 3'
3.2.3. Results and Discussion
After magnets were left on the shaken sample jar for two hours, 1 ml samples
were taken. Approximately 103 magnetic cocci were observed in the 10 μL sub-samples,
or ~ 105 total magnetic cocci (see Figure 8a). After running onto the magnetic column
and flushing five times, no bacteria were visible in the elutant (see Figure 8b–c). The
magnets were removed from the column and washed twice, yielding ~ 104 magnetic cocci
per ml (see Figure 8d). The sample was centrifuged and resuspended in 1/20th of the
supernatant (see Figure 8e) and then checked for non-magnetotactic cells (see Figure 9).

67
Figure 8: Enrichment of magnetic cocci: (a) un-enriched sample; (b) 1st negative
selection; (c) 5th negative selection; (d) positive selection; (e) 20x concentrated positive
selection

68
Figure 9: Checking sample for non-magnetotactic bacteria. The applied field is towards
the top left of the image. Note the population of south-seeking MB, as previously
observed [Cox et al., 2002].
Degenerate PCR
Numerous products were obtained, but by screening the PCR products for the
expected size most false positives could be excluded. The rest were examined by
sequencing. Some of the false positives obtained on sequencing had no similarity to any
genes from MB at either the DNA or protein level and included fragments which best
matched a xanthine/uracil permease from Pseudomonas fluorescens, a hypothetical

69 protein from Nostoc punctiformis, and a glycosyltransferase from Geobacter
metallireducens. The degenerate primers for mamA repeatedly recovered fragments that
were > 95% identical to sequences from the magnetospirilla. This is likely due to
magnetospirilla being present in the magnetically enriched samples from which DNA
was extracted. It is also possible the arboretum magnetic cocci have Magnetospirillum
versions of their mamA gene. This could be determined through larger scale sequencing
or probing for the mamA gene and the 16S rRNA gene with fluorescent probes. The
degenerate primers for mamC failed to amplify any products of the expected size.
The primer Bdeg1 with either Bdeg5R or Bdeg7R was able to retrieve a 247 bp
sequence whose translation is 80% similar to the MC-1 MamB and 73% similar to the
MS-1 MamB protein. MamB is a protein known to localize to the magnetosome
[Grünberg et al., 2001] and is predicted to be a heavy metal transporter similar to the
cobalt/zinc/cadmium transporter CzcD. The arboretum MamB sequence groups with the
MamB genes from magnetotactic bacteria, and broadly follows the 16S rDNA gene
phylogeny (see Figure 10). Note that although it broadly follows the 16S tree, there are
clear instances of LGT: Porphyromonas has an archaeal version, Methanococcus and
Pyrococcus have a bacterial version. Also note MS-1 has one close duplicate and MC-1
has two duplicates.

70
Figure 10: Phylogeny of MamB and CzcD proteins. This is a strict-consensus tree of
100 bootstrap replicates of a Neighbor-Joining/Distance tree using the Kimura 2-
parameter correction with 301 characters in the alignment, made using the PHYLIP
package. Branches with less than 90% bootstrap support were collapsed. The scale is
arbitrary, only branching order is informative.

71 References
Abe, M., et al. (1999), Magnetite Film Growth at 30°C on Organic Monomolecular
Layer, Mimicking Bacterial Magnetosome Synthesis, Journal of Applied Physics, 85(8), 5705–5707.
Altschul, S. F., et al. (1997), Gapped BLAST and PSI-BLAST: A New Generation of Protein Database Search Programs, Nucleic Acids Research, 25(17), 3389–3402.
Arakaki, A., et al. (2003), A Novel Protein Tightly Bound to Bacterial Magnetic Particles in Magnetospirillum magneticum strain AMB-1, Journal of Biological Chemistry, 278(10), 8745–50.
Balkwill, D. L., et al. (1980), Ultrastructure of a Magnetotactic Spirillum, Journal of Bacteriology, 141(3), 1399–1408.
Bazylinski, D. A., and R. B. Frankel (2004), Magnetosome Formation in Prokaryotes, Nature Reviews Microbiology, 2, 217–230.
Bertani, L. E., et al. (2001), Physical and genetic characterization of the genome of Magnetospirillum magnetotacticum, strain MS-1, Gene, 264(2), 257–263.
Blakemore, R. (1975), Magnetotactic Bacteria, Science, 190(4212), 377–379. Blakemore, R. P., et al. (1979), Isolation and Pure Culture of a Freshwater Magnetic
Spirillum in Chemically Defined Medium, Journal of Bacteriology, 140(2), 720–729.
Boskey, A. L. (1998), Biomineralization: Conflicts, challenges, and opportunities, Journal of Cellular Biochemistry, 30–31, 83–91.
Brasier, M. D., et al. (2002), Questioning the evidence for Earth's oldest fossils, Nature, 416(6876), 76–81.
Chang, S. B. R., et al. (1989), Biogenic Magnetite in Stromatolites .2. Occurrence in Ancient Sedimentary Environments, Precambrian Research, 43(4), 305–315.
Chiang, S. L., and E. J. Rubin (2002), Construction of a mariner-based transposon for epitope-tagging and genomic targeting, Gene, 296(1–2), 179–85.
Cox, B. L., et al. (2002), Organization and elemental analysis of P-, S-, and Fe-rich inclusions in a population of freshwater magnetococci, Geomicrobiology Journal, 19(4), 387–406.
Dean, A. J., and D. A. Bazylinski (1999), Genome analysis of several marine, magnetotactic bacterial strains by pulsed-field gel electrophoresis, Current Microbiology, 39(4), 219–225.
Dehio, C., and M. Meyer (1997), Maintenance of broad-host-range incompatibility group P and group Q plasmids and transposition of Tn5 in Bartonella henselae following conjugal plasmid transfer from Escherichia coli., Journal of Bacteriology, 179(2), 538–40.
Delong, E. F., et al. (1993), Multiple Evolutionary Origins of Magnetotaxis in Bacteria, Science, 259(5096), 803–806.
Dojka, M. A., et al. (1998), Microbial diversity in a hydrocarbon- and chlorinated-solvent-contaminated aquifer undergoing intrinsic bioremediation, Applied and Environmental Microbiology, 64(10), 3869–3877.

72 Eder, W., et al. (1999), Novel 16S rRNA gene sequences retrieved from highly saline
brine sediments of Kebrit Deep, Red Sea, Archives of Microbiology, 172(4), 213–218.
Flies, C. B., et al. (2005), Diversity and vertical distribution of magnetotactic bacteria along chemical gradients in freshwater microcosms, FEMS Microbiology Ecology, 52(2), 185–195.
Fontecave, M., et al. (2004), S-adenosylmethionine: nothing goes to waste, Trends in Biochemical Sciences, 29(5), 243–249.
Frankel, R. B., et al. (1983), Fe3O4 Precipitation in Magnetotactic Bacteria, Biochimica Et Biophysica Acta, 763(2), 147–159.
Frankel, R. B., and D. A. Bazylinski (1994), Magnetotaxis and Magnetic Particles in Bacteria, Hyperfine Interactions, 90(1–4), 135–142.
Frankel, R. B., et al. (1997), Magneto-aerotaxis in marine coccoid bacteria, Biophysical Journal, 73(2), 994–1000.
Glasauer, S., et al. (2002), Intracellular iron minerals in a dissimilatory iron-reducing bacterium, Science, 295(5552), 117–119.
Golyshina, O. V., and K. N. Timmis (2005), Ferroplasma and relatives, recently discovered cell wall-lacking archaea making a living in extremely acid, heavy metal-rich environments, Environmental Microbiology, 7(9), 1277–1288.
Grünberg, K., et al. (2001), A Large Gene Cluster Encoding Several Magnetosome Proteins is Conserved in Different Species of Magnetotactic Bacteria, Applied and Environmental Microbiology, 67(10), 4573–4582.
Grünberg, K., et al. (2004), Biochemical and proteomic analysis of the magnetosome membrane in Magnetospirillum gryphiswaldense, Applied and Environmental Microbiology, 70(2), 1040–1050.
Guerin, W. F., and R. P. Blakemore (1992), Redox Cycling of Iron Supports Growth and Magnetite Synthesis by Aquaspirillum magnetotacticum, Applied and Environmental Microbiology, 58(4), 1102–1109.
Handrick, R., et al. (2004), Unraveling the function of the Rhodospirillum rubrum activator of polyhydroxybutyrate (PHB) degradation: the activator is a PHB-granule-bound protein (phasin), Journal of Bacteriology, 186(8), 2466–2475.
Kawaguchi, R., et al. (1995), Phylogenetic Analysis of a Novel Sulfate-Reducing Magnetic Bacterium, RS-1, Demonstrates its Membership of the δ-Proteobacteria, FEMS Microbiology Letters, 126(3), 277–282.
Kirschvink, J. L., and H. A. Lowenstam (1979), Mineralization and Magnetization of Chiton Teeth — Paleomagnetic, Sedimentologic, and Biologic Implications of Organic Magnetite, Earth and Planetary Science Letters, 44(2), 193–204.
Kirschvink, J. L. (1980), South-Seeking Magnetic Bacteria, Journal of Experimental Biology, 86(JUN), 345–347.
Kirschvink, J. L. (1982), Paleomagnetic Evidence for Fossil Biogenic Magnetite in Western Crete, Earth and Planetary Science Letters, 59(2), 388–392.
Kobayashi, A., et al. (2006), Experimental observation of magnetosome chain collapse in magnetotactic bacteria: Sedimentological, paleomagnetic, and evolutionary implications, Earth and Planetary Science Letters, 245(3–4), 538–550.

73 Komeili, A., et al. (2004), Magnetosome vesicles are present before magnetite formation,
and MamA is required for their activation, Proceedings of the National Academy of Sciences of the United States of America, 101(11), 3839–3844.
Komeili, A., et al. (2006), Magnetosomes are cell membrane invaginations organized by the actin-like protein MamK, Science, 311(5758), 242–245.
Kopczynski, E. D., et al. (1994), Recognition of chimeric small subunit ribosomal DNAs composed of genes from uncultivated microorganisms, Applied and Environmental Microbiology, 60(2), 746–748.
Kopp, R. E., and J. L. Kirschvink (2008), The identification and biogeochemical interpretation of fossil magnetotactic bacteria, Earth-Science Reviews, 86(1–4), 42–61.
Layer, G., et al. (2004), Structure and function of radical SAM enzymes, Current Opinion in Chemical Biology, 8(5), 468–476.
Levi-Kalisman, Y., et al. (2001), Structure of the nacreous organic matrix of a bivalve mollusk shell examined in the hydrated state using Cryo-TEM, Journal of Structural Biology, 135(1), 8–17.
Li, F., et al. (2005), Cloning and functional analysis of the sequences flanking mini-Tn5 in the magnetosomes deleted mutant NM6 of Magnetospirillum gryphiswaldense MSR-1, Science in China Series C-Life Sciences, 48(6), 574–584.
Ludwig, W., et al. (2004), ARB: a software environment for sequence data, Nucleic Acids Research, 32(4), 1363–1371.
Maness, P. C., and P. F. Weaver (2001), Evidence for three distinct hydrogenase activities in Rhodospirillum rubrum, Applied Microbiology and Biotechnology, 57(5–6), 751–6.
Mann, S., et al. (1984), Structure, Morphology and Crystal-Growth of Bacterial Magnetite, Nature, 310(5976), 405–407.
Mann, S., et al. (1990), Magnetotactic Bacteria — Microbiology, Biomineralization, Paleomagnetism and Biotechnology, Advances in Microbial Physiology, 31, 125–181.
Matsunaga, T., et al. (1991), Magnetite Formation by a Magnetic Bacterium Capable of Growing Aerobically, Applied Microbiology and Biotechnology, 35(5), 651–655.
Matsunaga, T., et al. (1992), Gene-Transfer in Magnetic Bacteria — Transposon Mutagenesis and Cloning of Genomic DNA Fragments Required for Magnetosome Synthesis, Journal of Bacteriology, 174(9), 2748–2753.
Matsunaga, T., et al. (2005), Complete genome sequence of the facultative anaerobic magnetotactic bacterium Magnetospirillum sp strain AMB-1, DNA Research, 12(3), 157–166.
Meldrum, F. C., et al. (1993), Electron-Microscopy Study of Magnetosomes in a Cultured Coccoid Magnetotactic Bacterium, Proceedings of the Royal Society of London Series B—Biological Sciences, 251(1332), 231–236.
Metcalf, W. W., et al. (1996), Conditionally Replicative and Conjugative Plasmids Carrying lacZa for Cloning, Mutagenesis, and Allele Replacement in Bacteria, Plasmid, 35, 1–13.

74 Nakamura, C., et al. (1995), An Iron-Regulated Gene, magA, Encoding an Iron Transport
Protein of Magnetospirillum sp. Strain AMB-1, Journal of Biological Chemistry, 270(47), 28392–28396.
Noguchi, Y., et al. (1999), Iron reductase for magnetite synthesis in the magnetotactic bacterium Magnetospirillum magnetotacticum, Journal of Bacteriology, 181(7), 2142–2147.
Ofer, S., et al. (1984), Magnetosome Dynamics in Magnetotactic Bacteria, Biophysical Journal, 46(1), 57–64.
Paoletti, L. C., and R. P. Blakemore (1988), Iron Reduction by Aquaspirillum magnetotacticum, Current Microbiology, 17(6), 339–342.
Pereira-Mouries, L., et al. (2002), Soluble silk-like organic matrix in the nacreous layer of the bivalve Pinctada maxima, European Journal of Biochemistry, 269(20), 4994–5003.
Raymond, J., et al. (2002), Whole-Genome Analysis of Photosynthetic Prokaryotes, Science, 298, 1616–1620.
Reysenbach, A. L., et al. (2000), Novel bacterial and archaeal lineages from an in situ growth chamber deployed at a Mid-Atlantic Ridge hydrothermal vent, Applied and Environmental Microbiology, 66(9), 3798–3806.
Richter, M., et al. (2007), Comparative genome analysis of four magnetotactic bacteria reveals a complex set of group-specific genes implicated in magnetosome biomineralization and function, Journal of Bacteriology, 189(13), 4899–4910.
Rose, T. M., et al. (1998), Consensus-degenerate hybrid oligonucleotide primers for amplification of distantly related sequences, Nucleic Acids Research, 26(7), 1628–1635.
Šafarík , I., and M. Šafaríková (2002), Magnetic Nanoparticles and Biosciences, Monatshefte Fur Chemie, 133(6), 737–759.
Sakaguchi, T., et al. (1993), Magnetite Formation by a Sulfate-Reducing Bacterium, Nature, 365(6441), 47–49.
Sakaguchi, T., et al. (2002), Desulfovibrio magneticus sp. nov., a novel sulfate-reducing bacterium that produces intracellular single-domain-sized magnetite particles, International Journal of Systematic and Evolutionary Microbiology, 52, 215–221.
Sakane, T., and A. Yokota (1994), Chemotaxonomic Investigation of Heterotrophic, Aerobic and Microaerophilic Spirilla, the Genera Aquaspirillum, Magnetospirillum and Oceanospirillum, Systematic and Applied Microbiology, 17(1), 128–134.
Sambrook, J., et al. (1989), Molecular cloning: a laboratory manual, 2nd ed., Cold Spring Harbor Laboratory Press, Cold Spring Harbor, NY.
Satomi, M., et al. (1998), Marinospirillum gen. nov., with descriptions of Marinospirillum megaterium sp. nov., isolated from kusaya gravy, and transfer of Oceanospirillum minutulum to Marinospirillum minutulum comb. nov, International Journal of Systematic Bacteriology, 48, 1341–1348.
Scheffel, A., et al. (2006), An acidic protein aligns magnetosomes along a filamentous structure in magnetotactic bacteria, Nature, 440(7080), 110–114.
Scheffel, A., et al. (2008), The major magnetosome proteins MamGFDC are not essential for magnetite biomineralization in Magnetospirillum gryphiswaldense but

75 regulate the size of magnetosome crystals, Journal of Bacteriology, 190(1), 377–386.
Schübbe, S., et al. (2003), Characterization of a Spontaneous Nonmagnetic Mutant of Magnetospirillum gryphiswaldense Reveals a Large Deletion Comprising a Putative Magnetosome Island, Journal of Bacteriology, 5779–5790.
Spring, S., et al. (1993), Dominating Role of an Unusual Magnetotactic Bacterium in the Microaerobic Zone of a Fresh Water Sediment, Applied and Environmental Microbiology, 59(8), 2397–2403.
Staniland, S., et al. (2008), Controlled cobalt doping of magnetosomes in vivo, Nature Nanotechnology, 3(3), 158–162.
Takai, K., and K. Horikoshi (1999), Genetic diversity of archaea in deep-sea hydrothermal vent environments, Genetics, 152(4), 1285–1297.
Teske, A., et al. (2002), Microbial diversity of hydrothermal sediments in the Guaymas Basin: Evidence for anaerobic methanotrophic communities, Applied and Environmental Microbiology, 68(4), 1994–2007.
Thomas-Keprta, K. L., et al. (2000), Elongated prismatic magnetite crystals in ALH84001 carbonate globules: Potential Martian magnetofossils, Geochimica Et Cosmochimica Acta, 64(23), 4049–4081.
Ullrich, S., et al. (2005), A hypervariable 130 kilobase genomic region of Magnetospirillum gryphiswaldense comprises a magnetosome island which undergoes frequent rearrangements during stationary growth, Journal of Bacteriology, 187(21), 7176–7184.
Vali, H., and J. L. Kirschvink (1991), Observations of Magnetosome Organization, Surface Structure, and Iron Biomineralization of Undescribed Magnetic Bacteria: Evolutionary Speculations, in Iron Biominerals, edited by R. Blakemore, Plenum Press, New York, pp. 97–116.
Wahyudi, A. T., et al. (2001), Isolation of Magnetospirillum magneticum AMB-1 Mutants Defective in Bacterial Magnetic Particle Synthesis by Transposon Mutagenesis, Applied Biochemistry and Biotechnology, 91–3, 147–154.
Wolfe, R. S., et al. (1987), A Capillary Racetrack Method for Isolation of Magnetotactic Bacteria, FEMS Microbiology Ecology, 45(1), 31–35.
Yamazaki, T., et al. (1995), Nitrite Reductase from the Magnetotactic Bacterium Magnetospirillum magnetotacticum — a Novel Cytochrome-cd1 with Fe(II)-Nitrite Oxidoreductase Activity, European Journal of Biochemistry, 233(2), 665–671.
Yoshino, T., and T. Matsunaga (2005), Development of efficient expression system for protein display on bacterial magnetic particles, Biochemical and Biophysical Research Communications, 338(4), 1678–1681.

76 Introduction to Appendices
Five papers of which I am co-author are included as appendices to my thesis. Here I will briefly describe my contribution to each of the papers. For “Ferromagnetic resonance spectroscopy for assessment of magnetic anisotropy and magnetostatic interactions: A case study of mutant magnetotactic bacteria” and “Chains, clumps, and strings: Magnetofossil taphonomy with ferromagnetic resonance spectroscopy” I carried out the mutagenesis described in Chapter 2 of this thesis. For “The paleoproterozoic snowball Earth: A climate disaster triggered by the evolution of oxygenic photosynthesis” I was involved in the discussion and development of the manuscript, particularly the biochemical arguments. For “Experimental observation of magnetosome chain collapse in magnetotactic bacteria: Sedimentological, paleomagnetic, and evolutionary implications” I was involved in the discussion and development of the manuscript. For “Bugbuster—survivability of living bacteria upon shock compression” I assisted with the microscopic examination of the samples, development of the project, and discussion of the manuscript.

Ferromagnetic resonance spectroscopy for assessment
of magnetic anisotropy and magnetostatic interactions:
A case study of mutant magnetotactic bacteria
Robert E. Kopp,1 Cody Z. Nash,1 Atsuko Kobayashi,2 Benjamin P. Weiss,3
Dennis A. Bazylinski,4 and Joseph L. Kirschvink1
Received 25 May 2006; revised 28 September 2006; accepted 25 October 2006; published 28 December 2006.
[1] Ferromagnetic resonance spectroscopy (FMR) can be used to measure the effectivemagnetic field within a sample, including the contributions of both magnetic anisotropyand magnetostatic interactions. One particular use is in the detection of magnetiteproduced by magnetotactic bacteria. These bacteria produce single-domain particles withnarrow size and shape distributions that are often elongated and generally arranged inchains. All of these features are detectable through FMR. Here, we examine their effectson the FMR spectra of magnetotactic bacteria strains MV-1 (which produces chains ofelongate magnetite crystals), AMB-1 (which produces chains of nearly equidimensionalmagnetite crystals), and two novel mutants of AMB-1: mnm13 (which producesisolated, elongate crystals) and mnm18 (which produces nearly equidimensional crystalsthat are usually isolated). Comparison of their FMR spectra indicates that the positivemagnetic anisotropy indicated by the spectra of almost all magnetotactic bacteria is aproduct of chain alignment and particle elongation. We also find correlations betweenFMR properties and magnetic measurements of coercivity and magnetostatic interactions.FMR thus provides a rapid method for assessing the magnetic properties of assemblages ofparticles, with applications including screening for samples likely to contain bacterialmagnetofossils.
Citation: Kopp, R. E., C. Z. Nash, A. Kobayashi, B. P. Weiss, D. A. Bazylinski, and J. L. Kirschvink (2006), Ferromagnetic
resonance spectroscopy for assessment of magnetic anisotropy and magnetostatic interactions: A case study of mutant magnetotactic
bacteria, J. Geophys. Res., 111, B12S25, doi:10.1029/2006JB004529.
1. Introduction
[2] Ferromagnetic resonance spectroscopy (FMR), a formof electron spin resonance spectroscopy, can serve as a rapidtechnique for assessing the magnetic anisotropy of andmagnetostatic interactions between individual particles ina polycrystalline sample. It is based upon the Zeeman effect,which is the splitting between electron spin energy levelsthat occurs in the presence of a magnetic field. The Zeemaneffect allows a ground state electron to absorb a photon withenergy equal to the splitting between the energy states. In amagnetic material, magnetic anisotropy (whether magneto-crystalline, shape, or stress induced) and interparticle inter-actions contribute to the energy of the particles within a
sample and thereby alter the resonance energy. As a result,FMR can be used to probe these parameters [Griscom, 1974,1981; Kittel, 1948; Kopp et al., 2006; Schlomann, 1958;Weiss et al., 2004].[3] Techniques for measuring anisotropy and magneto-
static interactions have a number of applications in the fieldof rock magnetism. The example on which we will focushere is the identification of magnetite produced by magneto-tactic bacteria, a topic of great interest for understanding themagnetization of sediments. Fossil magnetotactic bacteriamay also serve as paleoenvironmental indicators of bothstrong magnetic fields and local redox gradients [Chang andKirschvink, 1989; Kirschvink and Chang, 1984]. Thesebacteria are a phylogenetically diverse group that biominer-alize intracellular crystals of magnetic minerals (magnetiteor greigite) which orient the bacteria passively in thegeomagnetic field. Natural selection has led these bacteriato optimize the magnetic moment produced for the amountof iron used. Among the traits present in magnetite pro-duced by many magnetotactic bacteria are a narrow distri-bution of particle sizes within the single-domain stabilityfield, particle elongation, and the arrangement of particles inchains [Thomas-Keprta et al., 2000]. The biophysicalproblem of keeping strongly magnetic particles aligned in
JOURNAL OF GEOPHYSICAL RESEARCH, VOL. 111, B12S25, doi:10.1029/2006JB004529, 2006ClickHere
for
FullArticle
1Division of Geological and Planetary Sciences, California Institute ofTechnology, Pasadena, California, USA.
2Photonics Research Institute, National Institute of Advanced IndustrialScience and Technology, Osaka, Japan.
3Department of Earth, Atmospheric, and Planetary Sciences, Massa-chusetts Institute of Technology, Cambridge, Massachusetts, USA.
4Department of Biochemistry, Biophysics, and Molecular Biology, IowaState University, Ames, Iowa, USA.
Copyright 2006 by the American Geophysical Union.0148-0227/06/2006JB004529$09.00
B12S25 1 of 15
77

a chain may also have driven the evolution of a variety ofcytoskeletal supporting mechanisms, including an intracel-lular ‘‘sheath’’ [Kobayashi et al., 2006], actin-like cytoskel-etal filaments [Scheffel et al., 2006] and/or directattachments to the periplasmic membrane [Komeili et al.,2006].[4] The adaptive traits possessed by these biogenic mag-
netic particles at a microscopic level generate distinctmagnetic properties that are identifiable with macroscopictechniques. The particles’ narrow distribution within thesingle-domain size range is typically observed in analysesof coercivity spectra, including the measurement of theacquisition of isothermal remanent magnetization and thedemagnetization of remanent magnetizations [Chang et al.,1989; Pan et al., 2005]. Egli [2004] used the unmixing ofcoercivity spectra to determine the biogenic contribution tolacustrine sedimentary magnetization.[5] Anhysteretic susceptibility, which provides a qualita-
tive measure of inverse interaction strength when comparingsingle-domain particles of similar volumes [Dunlop et al.,1990; Egli and Lowrie, 2002], has also been used todistinguish bacterial magnetite chains from abiogenic mag-netite [Kopp et al., 2006; Moskowitz et al., 1993]. Anhyste-retic magnetization is acquired by the application of a smallbiasing field in the presence of a decaying alternating field.In the absence of thermal effects, noninteracting single-domain particles would have infinite anhysteretic suscepti-bility; they should become magnetized in the direction ofthe biasing field as soon as the alternating field decreasesbelow their microcoercivity [Dunlop and Ozdemir, 1997;Egli and Lowrie, 2002]. In fact, thermal effects cause moreelongate and smaller particles to have lower anhystereticremanent magnetization (ARM) susceptibility than lesselongate or larger single-domain particles [Egli and Lowrie,2002]. The shielding effects of magnetostatic interactionsoperating in three dimensions also lower anhystereticsusceptibility.[6] In many strains of magnetotactic bacteria, however,
linear magnetostatic interactions cause an entire chain ofparticles to behave in a magnetically coherent fashion[Hanzlik et al., 2002; Penninga et al., 1995]. Intact cellsof magnetotactic bacteria therefore have low three-dimensional magnetostatic interactions and thus relativelyhigh anhysteretic susceptibility, so high anhysteretic rema-nent magnetization/isothermal remanent magnetization(ARM/IRM) ratios are characteristic of the presence ofmagnetite chains. Collapsed magnetosome chains, withstronger three-dimensional magnetostatic interactions, havelower ARM/IRM ratios.[7] Another test that is indicative of the presence of
chains is the delta-delta test of Moskowitz et al. [1993],which uses the ratio of magnetization lost upon warmingthrough the �90–120 K Verwey transition in saturatedsamples that have been cooled in a strong field to themagnetization lost after cooling in zero field. While previ-ous data indicate that this test does identify chains ofbiogenic magnetite [Moskowitz et al., 1993; Weiss et al.,2004], it is susceptible to false negatives and the underlyingphysical mechanisms are incompletely understood [Carter-Stiglitz et al., 2004].[8] Ferromagnetic resonance spectroscopy is capable of
rapidly distinguishing biogenic magnetite chains based on
three traits: (1) a narrow range of particle size, shape, andarrangement, (2) chain structure, and (3) particle elongation[Kopp et al., 2006; Weiss et al., 2004]. Samples with narrowdistributions of size, shape, and arrangement have narrowFMR peaks. Chain structure and particle elongation producepositive uniaxial anisotropy, which can be distinguishedfrom the negative cubic magnetocrystalline anisotropy thatdominates isolated, equidimensional magnetite.[9] Bacterial mutagenesis is a central technique in
molecular microbiology. By disabling regions of thegenome, it probes the roles of different genes in theproduction of a phenotype. Our attempts to understandthe molecular mechanism of magnetite biosynthesis (whichwill be described in a follow up paper by C. Z. Nash et al.)led us to create mutant strains of the magnetotactic bacte-rium Magnetospirillum magneticum strain AMB-1, whosewild-type creates chains of almost equidimensional cubo-octahedral crystals. Two of these mutants produce crystalsthat are usually isolated and are either approximatelyequidimensional (mutant mnm18) or elongate (mutantmnm13). We used these mutants, along with cells of wild-type AMB-1 and the magnetotactic marine vibrio MV-1,which produces chains of elongate hexaoctahedral crystals,to investigate the contributions of magnetic anisotropyand magnetostatic interactions to ferromagnetic resonancespectra. These different strains allow us for the first time toseparate directly the effects of chain structure on FMR androck magnetic properties from those of single crystal traits.
2. Methods
2.1. Mutagenesis
[10] To generate the mutants, transposon mutagenesis wasperformed on AMB-1 following previously described pro-cedures [Komeili et al., 2004]. Mutants were grown up onplates, and single colonies were then picked and grown upin 96-well plates in sealed jars with 2% oxygen/98%nitrogen atmospheres. After 3–5 days of growth, weaklymagnetic and nonmagnetic mutants were identified byplacing the plates on an array of magnets. Mutants thatwere not drawn toward the side of the well were subculturedfor further analysis. For mutant mnm13, sequencing ofgenomic DNA indicated that an interruption by the intro-duced transposon occurred in a gene encoding for a hypo-thetical protein. For mnm18, sequencing indicated that theinterruption occurred in a pyruvate/ferredoxin oxidoreduc-tase gene. Time course experiments indicate that mnm18 isa growth defective mutant that takes 1–2 days longer toreach stationary phase than the wild type.
2.2. Growth Conditions and Lysis
[11] Cells of strain MV-1 were grown anaerobically withnitrous oxide as the terminal electron acceptor underheterotrophic conditions as previously described [Deanand Bazylinski, 1999]. Cells were harvested at early sta-tionary phase, at a cell density of about 1.5 � 109 cells/mL,by centrifugation at 5000 � g at 4�C for 10 min and thenresuspended in ice cold artificial seawater containing 20mM Tris-HCl pH 7.0. Cells were recentrifuged and theresultant pellet of cells was frozen and shipped on dry ice tothe California Institute of Technology (Caltech), where itwas thawed. A fraction of the cell mass was resuspended in
B12S25 KOPP ET AL.: FERROMAGNETIC RESONANCE SPECTROSCOPY
2 of 15
B12S25
78

Tris buffer, from which point it was subject to the sametreatments as AMB-1.[12] Two liters each of AMB-1 wild-type and mutants
mnm13 and mnm18 were grown up to early stationaryphase, at a cell density of about 108 cells/mL, using standardculture conditions [Komeili et al., 2004]. The cultures weredivided into thirds (A1, A2, and A3 for the wild type; B1,B2, and B3 for mnm13; C1, C2, and C3 for mnm18; V1,V2, and V3 for MV-1), spun down, and resuspended in�5 mL 100 mM Tris buffer at pH 7. Five microliters ofb-mercaptoethanol and �250 mg of sodium dodecyl sulfate(SDS) were added to subsamples A3, B3, C3, and V3.Subsamples A2, A3, B2, B3, C2, C3, V2, and V3 were thensubjected to ultrasonication with a Fisher Scientific SonicDismembrator 550 for about 6 min, with pulses of 0.5 salternating with pauses of equal duration. Ultrasonicationshould destroy cell membranes while leaving magnetosomemembranes intact. SDS treatment should destroy both cellmembranes and magnetosome membranes, thereby freeingthe magnetite particles from organic structures.[13] The samples were then spun down, frozen, and
freeze-dried. In a set of experiments analogous to thedilution experiments described by Kopp et al. [2006], V2was diluted at �1 part per thousand in sucrose. It wasinitially measured as sample V2a, then was diluted by mix-ing with a mortar and pestle for 4 min to form subsampleV2b. Sample V3 was similarly diluted at �1 part perthousand as sample V3a, diluted by mixing for 1 min toform sample V3b, and then mixed for four additionalminutes to form sample V3c.
2.3. Electron Microscopy
[14] Specimens were dispersed on hydrophilic coppertransmission electron microscopy (TEM) grids and air-dried. The grids were inserted into a beryllium TEMspecimen holder for energy dispersive X-ray spectroscopy(EDS) analysis. TEM and high angle annular dark field/scanning transmission electron microscopy (HAADF/STEM) images were obtained with a Tecnai G2 F20 Twin(FEI, Holland), operating at 200 kV and equipped withGatan energy filter GIF2001 and HAADF/STEM detectingunit. The HAADF/STEM/EDS analysis was performed byan EDX detecting unit (EDAX, Inc.). Histograms ofparticle size/shape distributions were made by measuringthe maximum length and widths of magnetite crystalsvisible in the TEM images in a similar fashion to that ofKirschvink and Lowenstam [1979] and Devouard et al.[1998]. Because of the sharp decay in field strength withdistance (1/r3), particles were grouped into chains if theywere positioned within less than one grain diameter froman adjacent crystal.
2.4. Ferromagnetic Resonance Spectra
[15] Ferromagnetic resonance spectra were acquired usingan X-band Bruker ESP 300E EPR Spectrometer housedat Caltech. Except for particularly strong samples (V3a,V3b, and V3c), microwave power was set at 640 mW andspectra were integrated over three sweeps of the appliedfield from 0 to 600 mT. For strong samples, power was setat 64 mW and only one spectrum was acquired. Tosummarize spectral characteristics, we use the empiricalparameters developed by Weiss et al. [2004] and Kopp et
al. [2006]: geff, A, DBFWHM, and a. The effective g factor,geff, is the g factor associated with maximum absorptionwhich is given by geff = hn/bBeff, where Beff is the fieldvalue of maximum absorption. The asymmetry ratio isdefined as A = DBhigh/DBlow, where DBhigh = Bhigh � Beff,DBlow = Beff � Blow, and Bhigh and Blow are the fields ofhalf maximum absorption at low-field and high-fieldsides of the absorption peak, respectively. The full widthat half maximum, DBFWHM, is defined as DBFWHM =Bhigh + B low. Although all these parameters arederived from the integrated absorption spectrum, FMRspectra are generally displayed as derivative spectra, whichmagnify fine detail. The empirical parameter a, whichserves as a proxy for the line width of symmetric Gaussianbroadening caused by factors including heterogeneity ofparticle size, shape, and arrangement, is defined as a =0.17A + 9.8 � 10�4 DBFWHM/mT.[16] The empirical parameters defined above differ from
the physical parameters that control the spectral shape(g, Ban, K2/K1, and s) and which we estimate using themodels discussed in section 3. The MATLAB routines usedfor data analysis and fitting are available in the auxiliarymaterial.1
2.5. Room Temperature Remanent MagnetizationExperiments
[17] Room temperature remanent magnetization experi-ments were performed using a 2G Enterprises Supercon-ducting Rock Magnetometer housing in a magneticallyshielded room at Caltech and equipped with in-line coilsfor degaussing, DC pulsing, and applying weak DC biasingfields. Starting with an AF-demagnetized sample, anhyste-retic remanent magnetization (ARM) was acquired in a100 mT alternating field (AF) and a DC biasing field thatwas raised in 0.05 mT steps to 1 mT. The ARM was thenremoved by stepwise AF demagnetization up to 250 mT inlogarithmically spaced steps (where the steps were multiplesof 100.1 mT). The sample was then imparted an isothermalremanent magnetization (IRM) by pulsing with a 100 mTfield. This IRM was then removed by stepwise AF demag-netization. Finally, an IRM was imparted stepwise in loga-rithmically spaced steps up to 980 mT and then removed byAF demagnetization.[18] To produce coercivity spectra from the stepwise AF
and IRM curves, we took the derivative of the curves withrespect to the log of the applied field and smoothed thecurves with a running average. We report the followingparameters: the coercivity of remanence Hcr, the Cisowskicrossover R value, the median acquisition field of IRM(MAFIRM), the median destructive fields of IRM (MDFIRM)and ARM (MDFARM), and the ARM ratio kARM/IRM.[19] The parameters Hcr and R are determined from the
IRM stepwise acquisition and demagnetization curves. Hcr
is the field value at which the two magnetization curvescross, and R is the ratio of magnetization to saturation IRM(SIRM) at that field [Cisowski, 1981]. For noninteractingsingle-domain particles (or magnetically coherent chains ofparticles that do not interact with other chains), R = 0.5,while decreasing values indicate increasing magnetostatic
1Auxiliary materials are available in the HTML. doi:10.1029/2006JB004529.
B12S25 KOPP ET AL.: FERROMAGNETIC RESONANCE SPECTROSCOPY
3 of 15
B12S25
79

interactions. The median acquisition and destructive fieldsare defined as the fields required to yield half of themaximum remanent magnetization, where the IRM valueis taken from the stepwise IRM curve and the ARM value istaken from the ARM demagnetization curve. We reportARM susceptibility as kARM/IRM, the ARM acquired perA/m of biasing field (as measured in a biasing field of0.1 mT (79.6 A/m) and an alternating field of 100 mT),normalized to the IRM acquired in a field of 100 mT.
2.6. Low-Temperature Rock Magnetic Experiments
[20] Low-temperature rock magnetic experiments wereperformed using a Quantum Design Magnetic PropertiesMeasurement System (MPMS) housed in the MolecularMaterials Resource Center of the Beckman Institute atCaltech. Following the procedure of Moskowitz et al.[1993], field cooled and zero-field cooled curves wereacquired by cooling the sample either in a 3 T field or inzero field to 5 K, respectively, followed by pulsing with a3 T field and then measuring the remanence magnetizationduring warming to room temperature in zero field. Low-temperature cycling curves when then acquired by pulsingthe sample with a 3 T field at room temperature and thenmeasuring the remanent magnetization as the sample wascooled to 10 K and then warmed to room temperature.[21] The results of the low-temperature experiments are
reported as the parameters dZFC, dFC, and fLTC. The param-eters d = (J80K � J150K)/J80K were assessed for the zero-field-cooled and field-cooled curves, respectively, whereJ80K and J150K are the moments measured at 80 K and150 K, respectively. A ratio dFC/dZFC > 2.0 passes theMoskowitz test and is considered to be an indicator of thepresence of magnetosome chains, although partial oxidationand mixing can cause intact chains to fail the test [Mosko-witz et al., 1993; Weiss et al., 2004]. Magnetization retainedthrough low-temperature cycling (LTC) is expressed as thememory parameter fLTC = JLTC/J0, where J0 and JLTC are theroom temperature magnetization measured before and after,respectively, cycling the samples to 10 K.
3. Models
[22] The models used to fit FMR spectra in this paper area generalization of prior models [Griscom, 1974, 1981;Kopp et al., 2006]. They derive from the resonance condi-tion [Smit and Beljers, 1955, equation 7]:
h�
gb
� �2
¼ 1
M2s sin
2 #
@2G
@#2
@2G
@82� @2G
@# @8
� �ð1Þ
where hn is the energy of the microwave photons, g is thespectroscopic g factor of an isolated particle with allanisotropy effects removed, b is the Bohr magneton (9.37 �10�24 A m2), Ms is the saturation magnetization, G is thefree energy of the system, and # and 8 are the polarcoordinates of the magnetization vector in its minimumenergy orientation.[23] Neglecting thermal energy, which is isotropic and
therefore does not appear in equation (1), the free energy Gof a system composed of noninteracting, single-domainparticles can be written as a sum of the magnetostaticenergy �M . B and the anisotropy energy. When the
reference frame is defined such that the anisotropy axis isdirected along (#, 8) = (0, 0) as shown in Figure 1, the freeenergy is given by
G ¼ Ms
�� Bapp sin # sin q cos f� 8ð Þ þ cos# cos q½ :
þ 1
2BanF #;8ð Þ
�ð2Þ
where (q, f) are the polar coordinates of the experimentallyapplied field Bapp with respect to the anisotropy axis, Ban isan effective anisotropy field, and F(#, 8) is a geometricfactor expressing the variation of the anisotropy energy as afunction of the direction of the magnetization vector.[24] Ban and F vary depending on the source of the
anisotropy. For magnetocrystalline anisotropy, Ban is2K1/Ms, where K1 is the first-order anisotropy constant(generally written as K 0
1 for uniaxial anisotropy). Foruniaxial shape anisotropy, Ban is m0MsDN, where m0 is themagnetic permeability of free space (4p � 10�7 N/A2) andDN is the difference between the demagnetization factorsNk and N1 parallel and perpendicular to the elongate axis.For uniaxial anisotropy, regardless of the source,
F #ð Þ ¼ sin2 #þ K 02
K 01
sin4 # ð3Þ
while for cubic anisotropy,
F #;8ð Þ ¼ sin4 # sin2 8 cos2 8þ sin2 # cos2 #
þ K2
K1
sin4 # cos2 # sin2 8 cos2 8 ð4Þ
Figure 1. Angles used in the derivation of the resonanceconditions. The origin of the reference frame is defined withrespect to the anisotropy axis. The applied field Bapp isoriented at azimuthal angle q and declination f. Themagnetization M is oriented at azimuthal angle # anddeclination 8.
B12S25 KOPP ET AL.: FERROMAGNETIC RESONANCE SPECTROSCOPY
4 of 15
B12S25
80

where K2 is the second-order anisotropy constant (generallywritten as K 0
2 for uniaxial anisotropy) [Dunlop and Ozdemir,1997].[25] By using a first-order approximation to calculate the
equilibrium orientation of the magnetization vector andconsidering only terms that are first order in Ban/Bres, wearrive at equation A.3 of Schlomann [1958]:
h�
gbBres
� �2
¼ 1þ Ban
2Bres
a ð5Þ
where Bres is the applied field at which a particle in anarbitrary orientation achieves resonance and
a ¼ @2F
@#2þ @2F
@82 1
sin2 qþ @F
@#cot q ð6Þ
Solving the quadratic expression in equation (5) yields anexpression for Bres as a function of orientation:
Bres ¼
ffiffiffiffiffiffiffiffiffiffiffiffiffiffiffiffiffiffiffiffiffiffiffiffiffiffiffiffiffiffiffiffiffiffiffiffih�
gb
� �2
þ aBan
4
� �2s
� aBan
4ð7Þ
For uniaxial anisotropy,
auniaxial ¼ 6 cos2 q� 2þ K 02
K 01
16 cos2 q sin2 q� 4 sin4 q� �
ð8Þ
while for cubic anisotropy,
acubic ¼ 4
1� 5 cos2 q sin2 qþ sin4 q sin2 f cos2 f� �
þ K2
2K1
cos2 q sin2 qþ sin4 q sin2 f cos2 f
�21 sin4 q cos2 q sin2 f cos2 f
0@
1A
0BBB@
1CCCAð9Þ
When the second-order anisotropy terms in equation (9) andthe second term under the radical in equation (7) areignored, the resonance conditions thus computed areidentical to those of [Griscom, 1974]. When only thesecond term under the radical is ignored, the cubic anisot-ropy condition is identical to that of Griscom [1981], exceptthat in equation (9) we drop the third-order anisotropy termin K3 introduced by Griscom. The resonance conditions thatwe have derived are strictly correct to first order in terms ofBan/Bres for dilute powders of single-domain particles.[26] To compute the powder absorption spectrum at Bapp,
we apply a Gaussian broadening function of line width sand numerically integrate the spectra over all solid angles:
A Bapp
� �¼
Zp=2q¼0
Z2pf¼0
exp � Bapp � Bres q;fð Þ� �2
=2s2� �
ffiffiffiffiffiffi2p
ps
df sin q dq
ð10Þ
The Gaussian broadening incorporates a number of physicaleffects, including those associated with heterogeneity ofsize, shape, arrangement, and composition within the
sample population. To reflect the physics more accurately,the spectroscopic g factor and the anisotropy parametersought to have population distributions associated with themindividually. However, attempting to fit experimental spec-tra to a model that employed population distributions foreach of these terms would almost always be a problemwithout a unique solution.[27] We fit measured spectra to simulated spectra using
nonlinear least squares fitting. For each magnetic compo-nent included, the models have four parameters that can beadjusted to fit the spectra: g, Ban, K2/K1, and s. Whenappropriate, the spectra can be fit to two components, inwhich case K2/K1 is set to zero for both components in orderto limit the number of additional degrees of freedomintroduced.[28] For most of the samples, we attempted fits with both
cubic and uniaxial models, as well as models combiningtwo uniaxial components, two cubic components, or auniaxial component and a cubic component. Except whenjBanj � s, substituting a cubic component for a uniaxialcomponent did not significantly improve or degrade thegoodness of the fit. We suspect this is because the Gaussianbroadening conceals the underlying physics in a fashion thatmakes it difficult to discriminate between samples best fitwith a cubic component and those best fit with a uniaxialcomponent.[29] The substitution often had only slight effects on the
fitted parameters as well, but sometimes did vary theparameters outside the confidence intervals on the uniaxialfits. Because the anisotropy field expected from the cubicmagnetocrystalline anisotropy of stoichiometric magnetite(K1 = �1.35 � 104 J/m3, Ms = 480 kA/m) is about �56 mT[Dunlop and Ozdemir, 1997], we report the fitted parame-ters using cubic anisotropy for components with Ban
between approximately �56 and 0 mT. (The dominantcomponents of samples C1 and C2 are the only componentsthat fit this criterion.) The underlying physics in fact reflectsneither purely uniaxial nor purely cubic anisotropy but amore complicated combination of approximately uniaxialshape anisotropy and cubic magnetocrystalline anisotropy,which would be reflected in a more complete form ofequation (2). Some of the Gaussian broadening likelyresults from our simplified treatment of the anisotropy.[30] The decision as to whether to represent a measured
spectrum with a one-component spectrum or the sum of twomodel spectra was made heuristically, based upon the levelof the improvement of fit when a second spectrum wasadded, how physically realistic the two spectra identified bythe fitting routine are, and the size of the confidenceintervals around fit parameters. In interpreting the models,it is important to remember that, if properly modeled,multiple components in a fit reflect multiple end-membersmixed together (e.g., isolated particles and particles inchains, or particles in chains and particles in clumps); theydo not reflect multiple aspects of the anisotropy of a singleend-member.
4. Results
4.1. Electron Microscopy
[31] Consistent with the work of Devouard et al. [1998],our TEM images indicate that MV-1 produces chains of
B12S25 KOPP ET AL.: FERROMAGNETIC RESONANCE SPECTROSCOPY
5 of 15
B12S25
81

magnetite crystals with a mean single-crystal length of�75 nm and a mean length-to-width ratio of �1.8(Figure 2). The untreated cells of MV-1 that we measuredexperienced some chain collapse, perhaps due to the freez-ing of the sample. As can be seen in Figure 2a, some chainscollapsed into zero stray field loop configurations, while inother chains some of the particles have fallen into side-by-side arrangements. About 10% of the crystals appearsufficiently separated from other crystals to be magneticallyisolated. Collapse features are greatly enhanced by ultra-sonication (Figure 2b). Few of the chains in the ultra-sonicated sample V2 are unaffected; most are bent orinterwoven with other chains. Only a small number ofcrystals are magnetically isolated. Treatment with SDS(sample V3) led to near complete collapse of chains intoclumps (Figure 2c).[32] There appears to be a greater tendency for chain
collapse to occur in strain MV-1 than in M. magneto-tacticum strain MS-1, a strain related to AMB-1 thatproduces more equidimensional particles than MV-1[Kobayashi et al., 2006]. In the case of MS-1, ultrasonica-tion does not produce many side-by-side crystal pairs.Instead, ultrasonication of MS-1 tends to cause chains tostring together in a head-to-tail fashion. The differencebetween the collapse styles of MV-1 and MS-1 is likelyattributable to the energetic differences between elongateand equidimensional particles.[33] Cells of wild-type AMB-1 produce magnetite par-
ticles with a mean particle length of �35 nm and length-to-width ratio �1.2 (Figures 3a, 3d, and 3f). In powder A1,derived from freeze-dried wild-type AMB-1, �65% byvolume of the crystals we measured were in chains of atleast 2 particles and �35% were isolated. Previous obser-vations of whole cells of wild-type AMB-1 indicate thatsingle cells often produce chains with segments of any-where between 1 and 21 crystals separated by gaps. Thepresence of isolated crystals in the freeze-dried powder islikely due to a combination of gaps in chains producedby single cells and disaggregation during the freeze-dryingprocess.[34] Cells of the AMB-1 mutant mnm13 produce elon-
gated crystals, with a mean length of �25 nm and a meanlength-to-width ratio of �1.5 (Figures 3b, 3e, and 3h).About 90% by volume of the crystals produced bymnm13 are isolated and �10% are in chains of 2 or more
particles. Among particles with a length >25 nm, whichdominate by volume and control the magnetic properties,the mean length-to-width ratio is �1.75. Some of the biastoward greater elongation in larger crystals is likely obser-vational; an elongate particle, viewed down the axis ofelongation, appears to have a width/length ratio of 1 and ashorter length than its true length.[35] Cells of the mutant mnm18 produce more equidi-
mensional crystals, similar to those produced by the wildtype, with a mean length of �40 nm and a mean length-to-width ratio of �1.2 (Figures 3c, 3f, and 3i). By volume,�65% of the particles are isolated and �35% are in chains.Though most of the chains consist of only two particles,they can grow significantly longer. The longest mnm18chain we observed consisted of seven particles, whichsuggests that a small fraction of mnm18 cells exhibit thewild-type phenotype.
4.2. Ferromagnetic Resonance Spectroscopy
[36] Our measurements of the FMR spectra of intactMV-1 and wild-type AMB-1 agree with those of Weiss etal. [2004], exhibiting distinctive asymmetric spectra that areextended in the low-field direction. MV-1 has a broaderspectrum than AMB-1, which reflects the greater anisotropyof its magnetite chains, generated by particle elongation aswell as chain alignment (Table 1 and Figures 4 and 5).MV-1 also has three characteristic maxima in the derivativespectrum, seen in samples V1, V2a, and V2b at �180,�300, and �350 mT. Our one-component model spectra areunable to reproduce this trait. Our attempts to fit these threespectra with two-component models, however, yieldeddisparate secondary fit components with no clear physicalinterpretation. This disparity suggests the values thus deter-mined were artifacts, and we therefore report the single-component fits in Table 2. A more complete physical modelcapable of including multiple sources of anisotropy mightexplain the distinctive triple maxima of MV-1 spectra.[37] On the basis of the demagnetization factors derived
by Osborn [1945] and assuming that the anisotropy isdominated by uniaxial shape anisotropy, the Ban value of171 mT fitted to the spectrum of intact MV-1 (sample V1) isthat expected from prolate spheroids of stoichiometricmagnetite (Ms = 480 kA/m) with length-to-width ratios of�2.35. The calculated ratio is significantly larger than thatobserved for individual particles under TEM and therefore
Figure 2. Transmission electron micrographs of MV-1. (a) Sample V1, untreated, (b) sample V2a,ultrasonicated, and (c) sample V3a, lysed with SDS. Scale bar is 100 nm.
B12S25 KOPP ET AL.: FERROMAGNETIC RESONANCE SPECTROSCOPY
6 of 15
B12S25
82

likely reflects the joint contribution of particle elongationand chain structure. The large, positive Ban value indicatesthat the negative contribution of magnetocrystalline anisot-ropy is overwhelmed by the positive contributions of shapeanisotropy and chain structure.[38] Ultrasonication of MV-1 broadens the FMR spec-
trum, with DBFWHM increasing from 127 mT in sample V1to 219 in sample V2a. This broadening, which is reflected inthe spectral fits by an increase of s from 17 mT to 27 mTdespite a slight decline in Ban, suggests an increase in theheterogeneity of particle arrangement without the formationof strongly interacting clumps. Although dilution (sampleV2b) produces a significant increase in anhysteretic suscep-tibility (see discussion below), it results in little change inthe FMR spectrum.[39] In contrast, lysis of MV-1 cells with SDS produces a
drastic change in the FMR spectrum, as it causes theparticles to collapse into clumps. The FMR spectra of theseclumps, like the FMR spectra of similarly treated AMB-1
observed by Weiss et al. [2004] and Kopp et al. [2006] andin the present work, are broad and exhibit high-fieldextended asymmetry reflective of a negative effectiveanisotropy field. The negative anisotropy may reflect theanisotropy of the surface of particle clumps or the oblate-ness of the clumps. Although modeling clumps withexpressions derived for isolated particles is far from ideal,the fitted Ban value of �120 mT corresponds to thatpredicted for oblate spheroids with a length-to-width ratioof �0.62. [Griscom et al., 1988] observed similar traits inthe spectra of powders of magnetite nanoparticles exhibitingplanar interactions.[40] Subsequent dilution causes the gradual reappearance
of positive anisotropy, again as in the case of AMB-1 [Koppet al., 2006]. After 1 min of dilution, the spectrum is best fitby a two-component model, with 84% of the absorptioncaused by a component with Ban of �130 mT and 16%caused by a component with Ban of 157 mT. The formercomponent likely corresponds to particles in clumps, while
Figure 3. Transmission electron micrographs of and summary statistics for AMB-1 strains. (a–c) TEMimages of freeze-dried powders of wild type (Figure 3a), mnm13 (Figure 3b), and mnm18 (Figure 3c). InFigures 3a and 3c, scale bar is 100 nm; in Figure 3b, scale bar is 50 nm. (d–f) Histograms of particlelength for magnetite produced by wild type (Figure 3d), mnm13 (Figure 3e), and mnm18 (Figure 3f).(g–i) Histograms of particle width/length ratios for magnetite produced by wild type (Figure 3g),mnm13 (Figure 3h), and mnm18 (Figure 3i). In Figures 3d–3g and 3i, dark bars represent particlesin chains and light bars represent isolated particles. In Figure 3h, dark bars represent particles withlength � 25 nm and light bars represent particles with length <25 nm.
B12S25 KOPP ET AL.: FERROMAGNETIC RESONANCE SPECTROSCOPY
7 of 15
B12S25
83
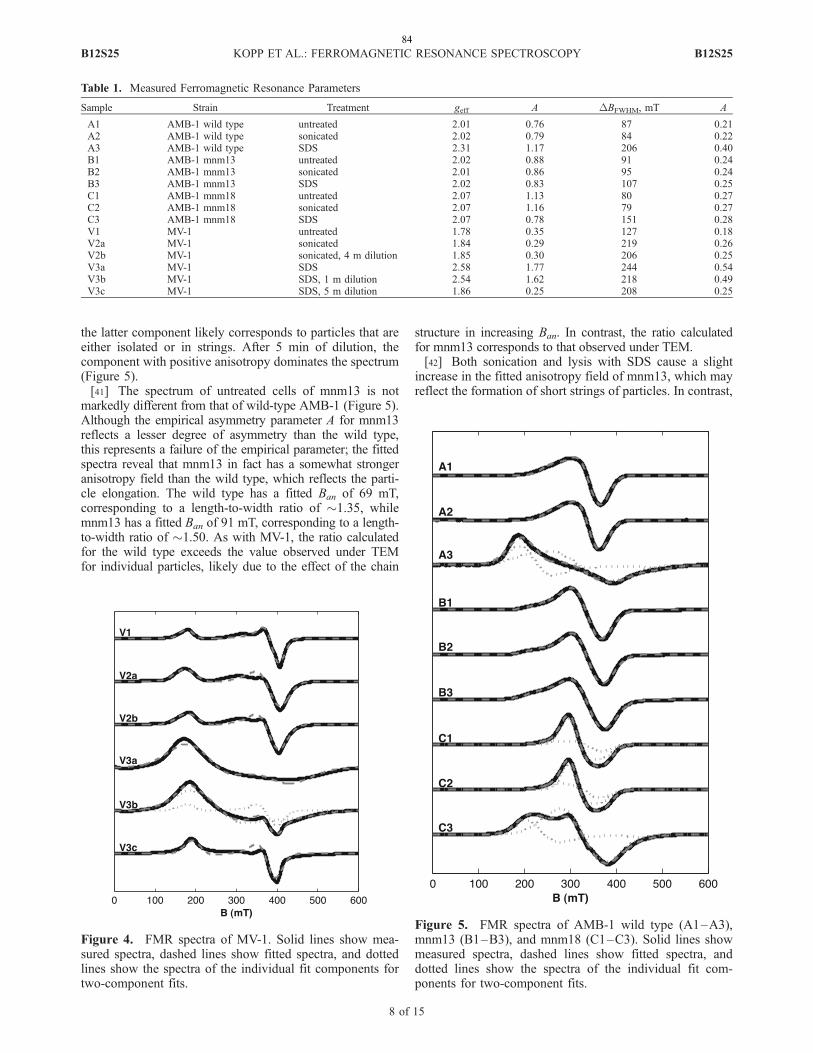
the latter component likely corresponds to particles that areeither isolated or in strings. After 5 min of dilution, thecomponent with positive anisotropy dominates the spectrum(Figure 5).[41] The spectrum of untreated cells of mnm13 is not
markedly different from that of wild-type AMB-1 (Figure 5).Although the empirical asymmetry parameter A for mnm13reflects a lesser degree of asymmetry than the wild type,this represents a failure of the empirical parameter; the fittedspectra reveal that mnm13 in fact has a somewhat strongeranisotropy field than the wild type, which reflects the parti-cle elongation. The wild type has a fitted Ban of 69 mT,corresponding to a length-to-width ratio of �1.35, whilemnm13 has a fitted Ban of 91 mT, corresponding to a length-to-width ratio of �1.50. As with MV-1, the ratio calculatedfor the wild type exceeds the value observed under TEMfor individual particles, likely due to the effect of the chain
structure in increasing Ban. In contrast, the ratio calculatedfor mnm13 corresponds to that observed under TEM.[42] Both sonication and lysis with SDS cause a slight
increase in the fitted anisotropy field of mnm13, which mayreflect the formation of short strings of particles. In contrast,
Figure 4. FMR spectra of MV-1. Solid lines show mea-sured spectra, dashed lines show fitted spectra, and dottedlines show the spectra of the individual fit components fortwo-component fits.
Figure 5. FMR spectra of AMB-1 wild type (A1–A3),mnm13 (B1–B3), and mnm18 (C1–C3). Solid lines showmeasured spectra, dashed lines show fitted spectra, anddotted lines show the spectra of the individual fit com-ponents for two-component fits.
Table 1. Measured Ferromagnetic Resonance Parameters
Sample Strain Treatment geff A DBFWHM, mT A
A1 AMB-1 wild type untreated 2.01 0.76 87 0.21A2 AMB-1 wild type sonicated 2.02 0.79 84 0.22A3 AMB-1 wild type SDS 2.31 1.17 206 0.40B1 AMB-1 mnm13 untreated 2.02 0.88 91 0.24B2 AMB-1 mnm13 sonicated 2.01 0.86 95 0.24B3 AMB-1 mnm13 SDS 2.02 0.83 107 0.25C1 AMB-1 mnm18 untreated 2.07 1.13 80 0.27C2 AMB-1 mnm18 sonicated 2.07 1.16 79 0.27C3 AMB-1 mnm18 SDS 2.07 0.78 151 0.28V1 MV-1 untreated 1.78 0.35 127 0.18V2a MV-1 sonicated 1.84 0.29 219 0.26V2b MV-1 sonicated, 4 m dilution 1.85 0.30 206 0.25V3a MV-1 SDS 2.58 1.77 244 0.54V3b MV-1 SDS, 1 m dilution 2.54 1.62 218 0.49V3c MV-1 SDS, 5 m dilution 1.86 0.25 208 0.25
B12S25 KOPP ET AL.: FERROMAGNETIC RESONANCE SPECTROSCOPY
8 of 15
B12S25
84

while sonication has only slight effect on the wild type,treatment of the wild type with SDS leads to a broaderspectrum that is best fit by a two-component model in which61% of particles have positive anisotropy (Ban = 87 mT)and 39% have negative anisotropy (Ban = �171 mT). Thelatter component may reflect clumping. The absence ofclumps in SDS-treated mnm13 suggests that the greater di-luteness of the particles prevents them from clumping.[43] The mutant mnm18 has an extremely distinctive
spectrum (Figure 5). It is the only untreated magnetotacticbacterium measured so far that has A > 1, which reflectsthe negative magnetocrystalline anisotropy of isolated par-ticles of equidimensional magnetite. It provides the bestexample of a spectrum that can be fitted as a mixture, as it isthe mixture of two components with clear physical inter-pretations corresponding to TEM observations. The intactmnm18 is a mixture composed 70% of a component withnegative anisotropy (Ban = �47 mT) and 30% of a positiveanisotropy component with parameters closely resemblingthose of the wild type (Ban = 76 mT). From the FMR data,we can predict that, by volume, the sample consists 70% ofisolated crystals and 30% of chains of at least 2 crystals inlength. These proportions are in close agreement with thevalues (65% and 35%) estimated from the TEM images,which confirms the proposal by Weiss et al. [2004] that theuniquely asymmetric FMR spectrum of magnetotactic bac-teria results primarily from the alignment of crystals inchains. We can also use this composition to unmix theisolated crystals from the other rock magnetic parameters,taking the properties of the wild type to represent those ofthe fraction in chains.[44] The isolated component has a narrower Gaussian line
width (s = 20 mT) than is typical of most magnetotacticbacteria, which may reflect that lesser degree of heteroge-neity possible with isolated crystals than with arrangementsof crystals. The anisotropy measured for isolated crystals ofmnm18 is slightly less than that expected for isolatedcrystals of stoichiometric magnetite dominated by cubicanisotropy, which would have Ban of about �56 mT. The
reduced anisotropy constant (K1 � 1.1 � 104 J/m3) mayresult from minor nonstochiometry (�0.4% cation deple-tion) [Kakol and Honig, 1989], which is consistent withthe reduced Verwey transition temperature of �100 Kobserved in AMB-1 magnetite (Figure 6e) [Muxworthyand McClellan, 2000].[45] Sonication of mnm18 cells leads to a slight increase
in the proportion in chains, while treatment with SDSdrastically alters the spectrum. SDS-treated cells ofmnm18 come to resemble those of the wild-type moreclosely, because the sample becomes dominated by shortlinear strings of particles, the anisotropy of which is con-trolled primarily by particle arrangement. The fitted spec-trum consists 68% of a component with positive anisotropy(Ban = 50 mT) and 32% of a component with strongnegative anisotropy (Ban = �142 mT) comparable to thoseof clumps formed in SDS treatment of wild-type AMB-1and MV-1. Thus the comparison of the unmixed compo-nents of intact and SDS-treated mnm18 provides powerfulinsight into the role of chain formation in controlling themagnetic properties of magnetotactic bacteria.
4.3. Isothermal Remanent Magnetization
[46] The room temperature IRM acquisition coercivityspectra for cells of wild-type AMB-1 and MV-1, regardlessof treatment, agree in general shape, though not in preciseparameterization, with the biogenic soft and biogenic hardcomponents recognized by Egli [2004] (Figure 6a andTable 3). MV-1 has a narrow peak centered at a median fieldof 55 mT, while AMB-1 has a broader peak centeredat 27 mT. The mutant mnm13 is slightly softer than the wildtype (median field of 23 mT), which may be due to thesmaller volume of mnm13 particles. The mutant mnm18 isboth softer and has a broader spectrum than the other strains(median field of 16 mT). When FMR analyses and TEMobservations are used to guide the unmixing of the chains andsolitary particles in mnm18, the solitary particles are revealedto have a spectrum with a median coercive field of 11 mT.The drastic difference between the isolated, equidimensional
Table 2. Ferromagnetic Resonance Spectral Fitsa
Sample Component Weight, % g Ban, mT K2/K1 s, mT
A1 100 2.07 ± 0.00 69.1 ± 0.8 �0.12 ± 0.01 24.2 ± 0.2A2 100 2.07 ± 0.00 63.6 ± 0.7 �0.13 ± 0.01 23.5 ± 0.2A3 61 2.15 ± 0.03 87.4 ± 10.1 55.5 ± 2.4
39 2.38 ± 0.01 �171.2 ± 4.3 31.7 ± 1.5B1 100 2.08 ± 0.00 90.9 ± 2.5 �0.32 ± 0.02 31.1 ± 0.3B2 100 2.09 ± 0.00 104.3 ± 2.5 �0.31 ± 0.01 31.8 ± 0.2B3 100 2.10 ± 0.00 99.7 ± 1.5 �0.23 ± 0.01 34.2 ± 0.2C1 70 2.05 ± 0.00 �47.3 ± 0.8 19.2 ± 0.1
30 2.12 ± 0.01 76.1 ± 1.1 22.1 ± 0.8C2 57 2.06 ± 0.00 �43.0 ± 0.6 18.4 ± 0.2
43 2.09 ± 0.01 64.1 ± 3.1 28.2 ± 0.6C3 68 2.05 ± 0.01 50.2 ± 5.4 43.1 ± 0.8
32 2.34 ± 0.01 �142.3 ± 3.3 30.4 ± 0.9V1 100 2.21 ± 0.01 170.9 ± 2.6 �0.03 ± 0.01 17.3 ± 0.3V2a 100 2.26 ± 0.01 164.0 ± 3.2 0.01 ± 0.01 26.7 ± 0.6V2b 100 2.24 ± 0.01 160.4 ± 2.7 0.00 ± 0.01 24.9 ± 0.4V3a 100 2.35 ± 0.01 �120.0 ± 2.3 0.23 ± 0.02 56.9 ± 0.8V3b 84 2.37 ± 0.01 �129.9 ± 2.6 58.3 ± 0.9
16 2.24 ± 0.01 157.4 ± 2.5 21.2 ± 0.7V3c 100 2.24 ± 0.01 132.6 ± 3.4 0.08 ± 0.02 20.6 ± 0.6aThe dominant components of C1 and C2 are modeled using cubic anisotropy. All other components are modeled using uniaxial anisotropy.
B12S25 KOPP ET AL.: FERROMAGNETIC RESONANCE SPECTROSCOPY
9 of 15
B12S25
85

particles produced by mnm18 and the elongate particles ofmnm13, as well as the chains of equidimensional particles inthe wild-type cells, highlights the role of these traits instabilizing the magnetic moments of magnetotactic bacteria.
[47] For all samples of unlysed cells of AMB-1, both wild-type and mutant, acquisition and demagnetization curvesalign fairly closely (Figure 6b); Cisowski R values are all� 0.42, and the median destructive field falls within 5 mT of
Figure 6. Rock magnetic measures of selected samples. (a–b) Coercivity spectra determined fromstepwise IRM acquisition (Figure 6a) and stepwise AF demagnetization of IRM (Figure 6b). The dashedline C1’ in Figure 6a, 6b, and 6d indicates the unmixed isolated particle component of C1, producedusing the proportions of isolated and chain components determined from the FMR spectra to remove thechain component. (c–d) ARM acquisition curves of MV-1 (Figure 6c) and AMB-1 wild type and mutants(Figure 6d). (e–f) Low-temperature demagnetization curves. Figure 6e shows the demagnetization uponwarming of a magnetization acquired by saturation at 5 K of samples cooled in a 3 T field. Magnetizationvalues are shown normalized to the magnetization at 5 K. Figure 6f shows the demagnetization uponcooling and subsequent warming of a magnetization acquired by saturation at 300 K. Magnetizationvalues are shown normalized to the initial room temperature magnetization.
B12S25 KOPP ET AL.: FERROMAGNETIC RESONANCE SPECTROSCOPY
10 of 15
B12S25
86

the median acquisition field. This is not the case for the SDS-treated mutants and both the SDS-treated and the ultra-sonicated wild types, which reflects greater interparticlemagnetostatic interactions in the wild types than in themutants. Notably, the IRM acquisition curve of SDS-treatedmnm18 closely resembles that of the wild type (median fieldof 27 mT), while the demagnetization curve remains closer tothat of the untreated mnm18. As FMR data indicate theformation of linear strings of particle in the SDS-treatedmnm18, the observation may suggest that IRM acquisitioncoercivity is more strongly affected by chain structures thanis demagnetization coercivity.
4.4. Anhysteretic Remanent Magnetization
[48] The ARM acquisition curves for wild-type AMB-1and MV-1 are consistent with previous measurements[Moskowitz et al., 1993, 1988] (Figures 6c and 6d andTable 3). MV-1 has markedly lower anhysteretic suscepti-bility than AMB-1. Two factors likely contribute to thisdifference. First, as seen in the TEM images, untreatedMV-1 has undergone a greater degree of chain collapse thanuntreated AMB-1, due to the intrinsic instability of chainsof elongate particles. The increased three-dimensional mag-netostatic interactions in collapsed chains serve to lowerARM susceptibility. Second, elongate particles have ahigher switching field and thus lower intrinsic ARM sus-ceptibility than more equidimensional particles of the samevolume [see Egli, 2003, Figure 11].[49] The pattern of variation of ARM susceptibility of
lysed MV-1 shows some notable differences from parallelexperiments previously reported for AMB-1 [Kopp et al.,2006]. For both strains, ultrasonicated bacteria exhibit alower susceptibility than untreated bacteria and a highersusceptibility than SDS-treated bacteria. However, whereasdilution of ultrasonicated AMB-1 produced little change inARM susceptibility, dilution of ultrasonicated MV-1 produ-ces significant change. Undiluted ultrasonicated MV-1exhibits a similar susceptibility to SDS-treated MV-1 dilutedfor 1 min, and ultrasonicated MV-1 diluted for 4 min exhibitsa similar susceptibility to SDS-treated MV-1 diluted for5 min. The difference between the strains again likely reflectsdifferences in collapse style between equidimensional
particles and elongate particles; the strings produced byultrasonication of AMB-1 are less likely to be reconfiguredduring dilution than the meshes produced by ultrasonicationof MV-1.[50] The crystals produced by mnm13 have even lower
anhysteretic susceptibility than MV-1, a reflection of thecombined influence of their elongation and their smallersize. In fact, their ARM susceptibility lies significantlyabove what would be predicted based on TEM measure-ments. Egli and Lowrie [2002] calculate that a particle witha length-to-width ratio of 1.9 and a cube root of volume of�20 nm should have a kARM/IRM ratio of about 0.5 mm/A,whereas the measured value is 1.4 mm/A. Given themeasured median destructive field, the ARM susceptibilitymeasured would be expected for particles with a length of45 nm and a length-to-width ratio of 1.3.[51] The isolated particles in untreated cells of mnm18
produce one of the highest ARM susceptibilities that wehave ever observed. With a kARM/IRM of 4.0 mm/A, theylie among the highest sediment values tabulated by Egli[2004], and above previously measured magnetotactic bac-teria [Moskowitz et al., 1993]. Given the similarity of thecrystals produced by mnm18 to those produced by the wildtype, the high kARM/IRM is likely due to the absence ofmagnetostatic interactions. Although they have less effectthan three-dimensional interactions, even the linear inter-actions in wild-type AMB-1 appear to lower lower ARMsusceptibility slightly.[52] At biasing fields below 300 mT, the ARM/IRM
curves of ultrasonicated mnm13 (B2), SDS-treatedmnm13 (B3), and SDS-treated mnm18 (C3) are almostidentical, whereas above 300 mT they diverge, with B2 >B3 > C3. The divergence may reflect the presence of agreater proportion of more strongly interacting particles(which acquire ARM in higher biasing fields) in the moreseverely treated samples.
4.5. Low-Temperature Magnetic Properties
[53] Regardless of treatment, the MV-1 samples have lowdFC/dZFC: the untreated and ultrasonicated samples havedFC/dZFC of 1.4, while the SDS-treated MV-1 has dFC/dZFCof 1.1 (Figure 6e and Table 4). On the basis of the criterion
Table 3. Room Temperature Rock Magnetic Parametersa
Sample Hcr, mT R MAF of IRM, mT MDF of IRM, mT MDF of ARM, mT kARM/IRM, mm/A Predicted Switching Field, mT
A1 24.0 0.44 26.5 21.6 22.2 2.93 30.3A2 22.0 0.43 24.0 19.8 21.1 2.07 27.8A3 16.6 0.29 24.1 10.2 17.4 0.64 59.8B1 21.3 0.42 23.4 19.3 19.3 1.37 31.0B2 23.9 0.42 26.6 22.2 22.3 1.26 35.7B3 26.0 0.39 30.7 21.8 24.2 1.29 38.2C1 14.5 0.47 15.7 13.8 13.7 3.55 26.7C1’ 10.7 0.44 10.6 9.9 10.5 3.99 22.3C2 14.7 0.44 16.6 13.8 13.8 3.25 24.4C3 21.7 0.35 26.7 16.6 21.9 1.38 39.8V1 57.8 0.42 55.3 61.2 65.8 1.79 82.9V2a 55.1 0.27 63.3 45.9 58.1 0.41 82.8V2b 48.4 0.31 55.0 41.7 49.8 1.59 80.2V3a 28.4 0.14 43.2 17.0 24.7 0.10 73.8V3b n.d. n.d. n.d. n.d. 52.7 0.66 67.2V3c 52.3 0.34 52.5 46.5 56.3 1.68 71.6aC10 is the unmixed end-member of C1 composed of isolated particles. Stepwise IRM curves were not measured for V3b. Predicted switching field is
calculated from the FMR fit parameters as described in the text; n.d., not determined.
B12S25 KOPP ET AL.: FERROMAGNETIC RESONANCE SPECTROSCOPY
11 of 15
B12S25
87

of Moskowitz et al. [1993], dFC/dZFC > 2 indicates thepresence of chains. The reason why our untreated MV-1fails this test is unclear, although such low values havepreviously been observed for some fresh cultures of MV-1(B. Moskowitz, personal communication, 2006). The lowvalues may be related to the partial chain collapse previ-ously described, but they stand in contrast to FMR dataindicating the presence of chains. They are not a product ofaccidental sample oxidation; the absolute values of dFC anddZFC are relatively large.[54] The untreated cells of mutant mnm13 fail the Mos-
kowitz test, with dFC/dZFC = 1.9, consistent with the absenceof chains in this sample. Inspection of its low-temperaturedemagnetization curves indicates that the sample’s low-temperature properties are dominated by the unblocking ofsuperparamagnetic grains, in agreement with the smallergrain size observed in the TEM images. In contrast, theuntreated cells of mnm18 have dFC/dZFC = 2.6, whichslightly exceeds the wild-type value of 2.5 even thoughless than half of the crystals present are in chains. Theunexpected result cannot be explained by nonstoichiometry,which would increase dFC/dZFC while at the same timedecreasing dFC and dZFC [Carter-Stiglitz et al., 2004]. Nosuch drop in dFC and dZFC is observed. Furthermore, whereasSDS treatment of mnm18 produces an FMR spectrum
reflecting the presence of linear particle arrangements, italso causes dFC/dZFC to drop to 1.2, comparable to the SDS-treated wild type [Kopp et al., 2006]. The elevated dFC/dZFCratios of mnm18 may occur because the chain componentwithin the sample has a higher dFC/dZFC than the wild-typeAMB-1 that we measured; previously observed dFC/dZFCratios for AMB-1 range as high as 5.9 [Weiss et al., 2004].Alternatively, the distinctive dFC/dZFC ratios of magneto-tactic bacteria may be due, at least in part, to same factorother than chain structure and nonstoichiometry.[55] Consistent with prior measurements of wild-type
AMB-1 [Kopp et al., 2006], SDS-treated mnm18 exhibitsan increase in remanence on cooling through the Verweytemperature, while intact mnm18 exhibits a decrease inremanence. In contrast, both intact and SDS-treated MV-1,like intact AMB-1, exhibit a decrease in remanence uponcooling through the Verwey transition (Figure 6f). We haveno explanation for this phenomenon.
5. Discussion
[56] As measures of magnetic anisotropy and magneto-static interaction, FMR parameters should be related toother magnetic properties that are a function of these char-acteristics. In so far as it possible to fit spectra well and thusobtain an accurate measurement of the anisotropy field of asample, it is possible to use FMR spectra to estimate theswitching field distribution of a sample. Neglecting thermalenergy, the median coercive field of a sample is given byBc � 1
2jBan(1 + K2=K1
)j [Dunlop and Ozdemir, 1997]. A plotof the calculated Bc against the median acquisition field ofIRM acquisition is shown in Figure 7a.[57] There is a good correlation between the two
parameters, although the estimates derived from the FMRspectra are significantly higher than the measured values.The discrepancy is largely accounted for by the thermal
Table 4. Low-Temperature Magnetic Parameters
Sample dZFC dFC/dZFC fLTC
A1 0.13 2.53 0.98B1 0.17 1.07 0.97C1 0.16 2.57 0.83C3 0.35 1.24 0.86V1 0.29 1.40 0.90V2a 0.29 1.42 0.94V3a 0.61 1.10 0.77
Figure 7. FMR parameters compared to rock magnetic parameters for the samples discussed in thispaper. (a) Predicted switching field, determined from the weighted average of Bc � 1
2jBan(1 +
K2=K1)j of fit
components for each sample, plotted against the median acquisition field of IRM. The dashed linerepresents a line fitted through the points for mnm13 and mnm18 with slope fixed at 1. The line has a yintercept of 9.7 mT and a coefficient of determination r2 = 0.89. (b) DBFWHM plotted against theCisowski R parameter, which measures magnetostatic interactions. The dashed line represents a line fittedto all samples and is given by DBFWHM = 373 mT � 632 mT � R. It has a coefficient of determinationr2 = 0.84.
B12S25 KOPP ET AL.: FERROMAGNETIC RESONANCE SPECTROSCOPY
12 of 15
B12S25
88
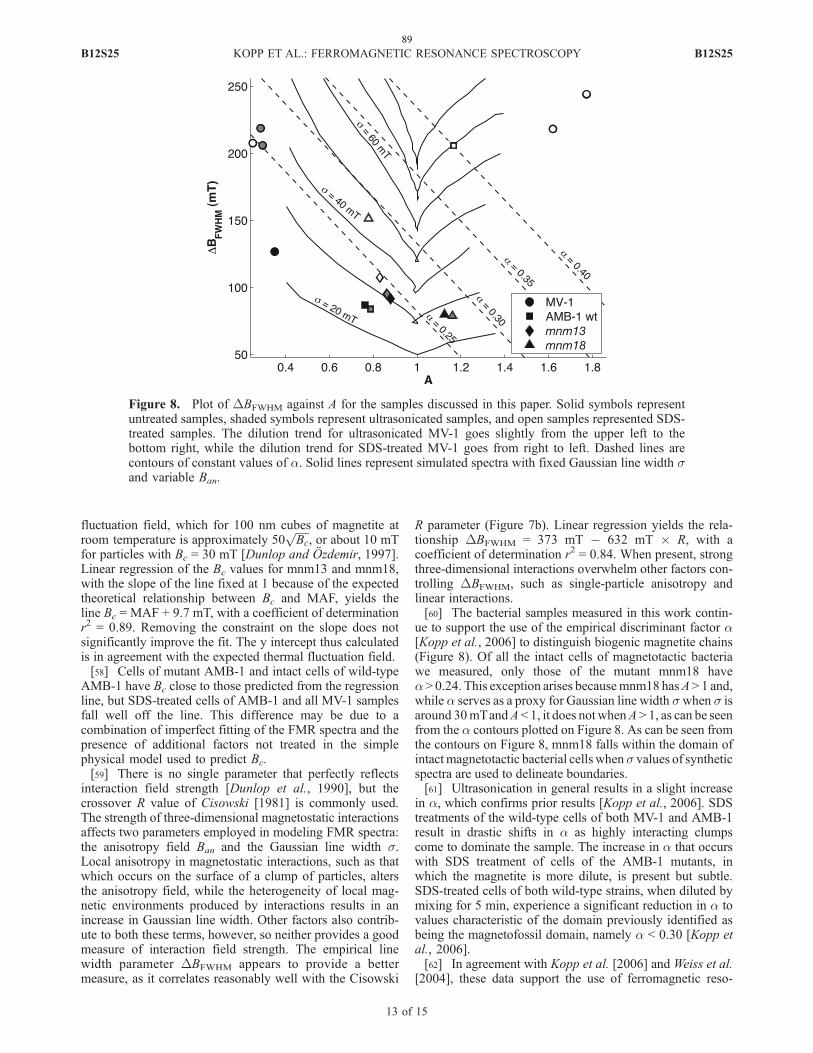
fluctuation field, which for 100 nm cubes of magnetite atroom temperature is approximately 50
ffiffiffiffiffiBc
p, or about 10 mT
for particles with Bc = 30 mT [Dunlop and Ozdemir, 1997].Linear regression of the Bc values for mnm13 and mnm18,with the slope of the line fixed at 1 because of the expectedtheoretical relationship between Bc and MAF, yields theline Bc = MAF + 9.7 mT, with a coefficient of determinationr2 = 0.89. Removing the constraint on the slope does notsignificantly improve the fit. The y intercept thus calculatedis in agreement with the expected thermal fluctuation field.[58] Cells of mutant AMB-1 and intact cells of wild-type
AMB-1 have Bc close to those predicted from the regressionline, but SDS-treated cells of AMB-1 and all MV-1 samplesfall well off the line. This difference may be due to acombination of imperfect fitting of the FMR spectra and thepresence of additional factors not treated in the simplephysical model used to predict Bc.[59] There is no single parameter that perfectly reflects
interaction field strength [Dunlop et al., 1990], but thecrossover R value of Cisowski [1981] is commonly used.The strength of three-dimensional magnetostatic interactionsaffects two parameters employed in modeling FMR spectra:the anisotropy field Ban and the Gaussian line width s.Local anisotropy in magnetostatic interactions, such as thatwhich occurs on the surface of a clump of particles, altersthe anisotropy field, while the heterogeneity of local mag-netic environments produced by interactions results in anincrease in Gaussian line width. Other factors also contrib-ute to both these terms, however, so neither provides a goodmeasure of interaction field strength. The empirical linewidth parameter DBFWHM appears to provide a bettermeasure, as it correlates reasonably well with the Cisowski
R parameter (Figure 7b). Linear regression yields the rela-tionship DBFWHM = 373 mT � 632 mT � R, with acoefficient of determination r2 = 0.84. When present, strongthree-dimensional interactions overwhelm other factors con-trolling DBFWHM, such as single-particle anisotropy andlinear interactions.[60] The bacterial samples measured in this work contin-
ue to support the use of the empirical discriminant factor a[Kopp et al., 2006] to distinguish biogenic magnetite chains(Figure 8). Of all the intact cells of magnetotactic bacteriawe measured, only those of the mutant mnm18 havea> 0.24. This exception arises becausemnm18 hasA> 1 and,while a serves as a proxy for Gaussian line width swhen s isaround 30mTandA< 1, it does not whenA > 1, as can be seenfrom the a contours plotted on Figure 8. As can be seen fromthe contours on Figure 8, mnm18 falls within the domain ofintact magnetotactic bacterial cellswhen s values of syntheticspectra are used to delineate boundaries.[61] Ultrasonication in general results in a slight increase
in a, which confirms prior results [Kopp et al., 2006]. SDStreatments of the wild-type cells of both MV-1 and AMB-1result in drastic shifts in a as highly interacting clumpscome to dominate the sample. The increase in a that occurswith SDS treatment of cells of the AMB-1 mutants, inwhich the magnetite is more dilute, is present but subtle.SDS-treated cells of both wild-type strains, when diluted bymixing for 5 min, experience a significant reduction in a tovalues characteristic of the domain previously identified asbeing the magnetofossil domain, namely a < 0.30 [Kopp etal., 2006].[62] In agreement with Kopp et al. [2006] and Weiss et al.
[2004], these data support the use of ferromagnetic reso-
Figure 8. Plot of DBFWHM against A for the samples discussed in this paper. Solid symbols representuntreated samples, shaded symbols represent ultrasonicated samples, and open samples represented SDS-treated samples. The dilution trend for ultrasonicated MV-1 goes slightly from the upper left to thebottom right, while the dilution trend for SDS-treated MV-1 goes from right to left. Dashed lines arecontours of constant values of a. Solid lines represent simulated spectra with fixed Gaussian line width sand variable Ban.
B12S25 KOPP ET AL.: FERROMAGNETIC RESONANCE SPECTROSCOPY
13 of 15
B12S25
89
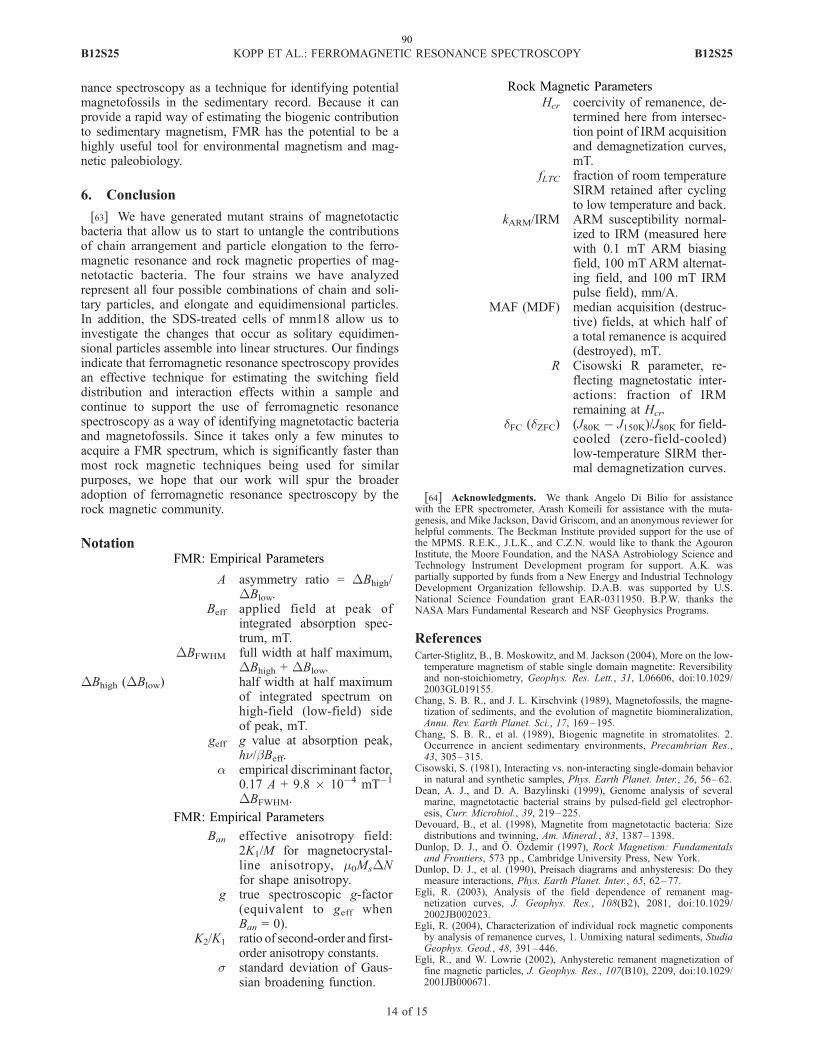
nance spectroscopy as a technique for identifying potentialmagnetofossils in the sedimentary record. Because it canprovide a rapid way of estimating the biogenic contributionto sedimentary magnetism, FMR has the potential to be ahighly useful tool for environmental magnetism and mag-netic paleobiology.
6. Conclusion
[63] We have generated mutant strains of magnetotacticbacteria that allow us to start to untangle the contributionsof chain arrangement and particle elongation to the ferro-magnetic resonance and rock magnetic properties of mag-netotactic bacteria. The four strains we have analyzedrepresent all four possible combinations of chain and soli-tary particles, and elongate and equidimensional particles.In addition, the SDS-treated cells of mnm18 allow us toinvestigate the changes that occur as solitary equidimen-sional particles assemble into linear structures. Our findingsindicate that ferromagnetic resonance spectroscopy providesan effective technique for estimating the switching fielddistribution and interaction effects within a sample andcontinue to support the use of ferromagnetic resonancespectroscopy as a way of identifying magnetotactic bacteriaand magnetofossils. Since it takes only a few minutes toacquire a FMR spectrum, which is significantly faster thanmost rock magnetic techniques being used for similarpurposes, we hope that our work will spur the broaderadoption of ferromagnetic resonance spectroscopy by therock magnetic community.
Notation
A asymmetry ratio = DBhigh/DBlow.
Beff applied field at peak ofintegrated absorption spec-trum, mT.
DBFWHM full width at half maximum,DBhigh + DBlow.
DBhigh (DBlow) half width at half maximumof integrated spectrum onhigh-field (low-field) sideof peak, mT.
geff g value at absorption peak,hn/bBeff.
a empirical discriminant factor,0.17 A + 9.8 � 10�4 mT�1
DBFWHM.
Ban effective anisotropy field:2K1/M for magnetocrystal-line anisotropy, m0MsDNfor shape anisotropy.
g true spectroscopic g-factor(equivalent to geff whenBan = 0).
K2/K1 ratio of second-order and first-order anisotropy constants.
s standard deviation of Gaus-sian broadening function.
Rock Magnetic ParametersHcr coercivity of remanence, de-
termined here from intersec-tion point of IRM acquisitionand demagnetization curves,mT.
fLTC fraction of room temperatureSIRM retained after cyclingto low temperature and back.
kARM/IRM ARM susceptibility normal-ized to IRM (measured herewith 0.1 mT ARM biasingfield, 100 mT ARM alternat-ing field, and 100 mT IRMpulse field), mm/A.
MAF (MDF) median acquisition (destruc-tive) fields, at which half ofa total remanence is acquired(destroyed), mT.
R Cisowski R parameter, re-flecting magnetostatic inter-actions: fraction of IRMremaining at Hcr.
dFC (dZFC) (J80K � J150K)/J80K for field-cooled (zero-field-cooled)low-temperature SIRM ther-mal demagnetization curves.
[64] Acknowledgments. We thank Angelo Di Bilio for assistancewith the EPR spectrometer, Arash Komeili for assistance with the muta-genesis, and Mike Jackson, David Griscom, and an anonymous reviewer forhelpful comments. The Beckman Institute provided support for the use ofthe MPMS. R.E.K., J.L.K., and C.Z.N. would like to thank the AgouronInstitute, the Moore Foundation, and the NASA Astrobiology Science andTechnology Instrument Development program for support. A.K. waspartially supported by funds from a New Energy and Industrial TechnologyDevelopment Organization fellowship. D.A.B. was supported by U.S.National Science Foundation grant EAR-0311950. B.P.W. thanks theNASA Mars Fundamental Research and NSF Geophysics Programs.
ReferencesCarter-Stiglitz, B., B. Moskowitz, and M. Jackson (2004), More on the low-temperature magnetism of stable single domain magnetite: Reversibilityand non-stoichiometry, Geophys. Res. Lett., 31, L06606, doi:10.1029/2003GL019155.
Chang, S. B. R., and J. L. Kirschvink (1989), Magnetofossils, the magne-tization of sediments, and the evolution of magnetite biomineralization,Annu. Rev. Earth Planet. Sci., 17, 169–195.
Chang, S. B. R., et al. (1989), Biogenic magnetite in stromatolites. 2.Occurrence in ancient sedimentary environments, Precambrian Res.,43, 305–315.
Cisowski, S. (1981), Interacting vs. non-interacting single-domain behaviorin natural and synthetic samples, Phys. Earth Planet. Inter., 26, 56–62.
Dean, A. J., and D. A. Bazylinski (1999), Genome analysis of severalmarine, magnetotactic bacterial strains by pulsed-field gel electrophor-esis, Curr. Microbiol., 39, 219–225.
Devouard, B., et al. (1998), Magnetite from magnetotactic bacteria: Sizedistributions and twinning, Am. Mineral., 83, 1387–1398.
Dunlop, D. J., and O. Ozdemir (1997), Rock Magnetism: Fundamentalsand Frontiers, 573 pp., Cambridge University Press, New York.
Dunlop, D. J., et al. (1990), Preisach diagrams and anhysteresis: Do theymeasure interactions, Phys. Earth Planet. Inter., 65, 62–77.
Egli, R. (2003), Analysis of the field dependence of remanent mag-netization curves, J. Geophys. Res., 108(B2), 2081, doi:10.1029/2002JB002023.
Egli, R. (2004), Characterization of individual rock magnetic componentsby analysis of remanence curves, 1. Unmixing natural sediments, StudiaGeophys. Geod., 48, 391–446.
Egli, R., and W. Lowrie (2002), Anhysteretic remanent magnetization offine magnetic particles, J. Geophys. Res., 107(B10), 2209, doi:10.1029/2001JB000671.
FMR: Empirical Parameters
FMR: Empirical Parameters
Rock Magnetic Parameters
B12S25 KOPP ET AL.: FERROMAGNETIC RESONANCE SPECTROSCOPY
14 of 15
B12S25
90

Griscom, D. L. (1974), Ferromagnetic resonance spectra of lunar fines:Some implications of line shape analysis, Geochim. Cosmochim. Acta,38, 1509–1519.
Griscom, D. L. (1981), Ferromagnetic resonance condition and powderpattern analysis for dilute, spherical, single-domain particles of cubiccrystal structure, J. Magn. Reson., 45, 81–87.
Griscom, D. L., et al. (1988), Ferromagnetic-resonance studies of iron-implanted silica, Nucl. Instrum. Methods Phys. Res., Sect. B, 32, 272–278.
Hanzlik, M., et al. (2002), Pulsed-field-remanence measurements on indi-vidual magnetotactic bacteria, J. Magn. Magn. Mater., 248, 258–267.
Kakol, Z., and J. M. Honig (1989), Influence of deviations from idealstoichiometry on the anisotropy parameters of magnetite Fe3(1�d)O4,Phys. Rev. B, 40, 9090–9097.
Kirschvink, J. L., and S. B. R. Chang (1984), Ultrafine-grained magnetite indeep-sea sediments: Possible bacterial magnetofossils, Geology, 12,559–562.
Kirschvink, J. L., and H. A. Lowenstam (1979), Mineralization and mag-netization of chiton teeth: Paleomagnetic, Sedimentologic, and biologicimplications of organic magnetite, Earth Planet. Sci. Lett., 44, 193–204.
Kittel, C. (1948), On the theory of ferromagnetic resonance absorption,Phys. Rev., 73, 155–161.
Kobayashi, A., et al. (2006), Experimental observation of magnetosome chaincollapse in magnetotactic bacteria: Sedimentological, paleomagnetic, andevolutionary implications, Earth Planet. Sci. Lett., 245, 538–550.
Komeili, A., et al. (2004), Magnetosome vesicles are present before mag-netite formation, and MamA is required for their activation, Proc. Natl.Acad. Sci. U.S.A., 101, 3839–3844.
Komeili, A., et al. (2006), Magnetosomes are cell membrane invaginationsorganized by the actin-like protein MamK, Science, 311, 242–245.
Kopp, R. E., et al. (2006), Chains, clumps, and strings: Magnetofossiltaphonomy with ferromagnetic resonance spectroscopy, Earth Planet.Sci. Lett., 10–25.
Moskowitz, B. M., et al. (1988), Magnetic properties of magnetotacticbacteria, J. Magn. Magn. Mater., 73, 273–288.
Moskowitz, B. M., et al. (1993), Rock magnetic criteria for the detection ofbiogenic magnetite, Earth Planet. Sci. Lett., 120, 283–300.
Muxworthy, A. R., and E. McClellan (2000), Review of the low-temperature magnetic properties of magnetite from a rock magneticperspective, Geophys. J. Int., 140, 101–114.
Osborn, J. A. (1945), Demagnetizing factors of the general ellipsoid, Phys.Rev., 67, 351–357.
Pan, Y. X., et al. (2005), Rock magnetic properties of uncultured magne-totactic bacteria, Earth Planet. Sci. Lett., 237, 311–325.
Penninga, I., et al. (1995), Remanence measurements on individual magne-totactic bacteria using a pulsed magnetic-field, J. Magn. Magn. Mater.,149, 279–286.
Scheffel, A., et al. (2006), An acidic protein aligns magnetosomes along afilamentous structure in magnetotactic bacteria, Nature, 440, 110–114.
Schlomann, E. (1958), Ferromagnetic resonance in polycrystal ferrites withlarge anisotropy: General theory and application to cubic materials with anegative anisotropy constant, J. Phys. Chem. Solids, 6, 257–266.
Smit, J., and H. G. Beljers (1955), Ferromagnetic resonance absorption inBaFe12O19, a highly anisotropic crystal, Philips Res. Rep., 10, 113–130.
Thomas-Keprta, K. L. (2000), Elongated prismatic magnetite crystals inALH84001 carbonate globules: Potential Martian magnetofossils, Geo-chim. Cosmochim. Acta, 64, 4049–4081.
Weiss, B. P., et al. (2004), Ferromagnetic resonance and low temperaturemagnetic tests for biogenic magnetite, Earth Planet. Sci. Lett., 224,73–89.
�����������������������D. A. Bazylinski, Department of Biochemistry, Biophysics, and
Molecular Biology, Iowa State University, Ames, IA 50011, USA.J. L. Kirschvink, R. E. Kopp, and C. Z. Nash, Division of Geological and
Planetary Sciences, California Institute of Technology, 170-25, Pasadena,CA 91125, USA. ([email protected])A. Kobayashi, Photonics Research Institute, National Institute of
Advanced Industrial Science and Technology, 1-8-31 Midorigaoka, Ikeda,Osaka 563-8577, Japan.B. P. Weiss, Department of Earth, Atmospheric, and Planetary Sciences,
Massachusetts Institute of Technology, Cambridge, MA 02139, USA.
B12S25 KOPP ET AL.: FERROMAGNETIC RESONANCE SPECTROSCOPY
15 of 15
B12S25
91

etters 247 (2006) 10–25www.elsevier.com/locate/epsl
92
Earth and Planetary Science L
Chains, clumps, and strings: Magnetofossil taphonomy withferromagnetic resonance spectroscopy
Robert E. Kopp a,⁎, Benjamin P. Weiss b, Adam C. Maloof b,1, Hojotollah Vali c,d,Cody Z. Nash a, Joseph L. Kirschvink a
a Division of Geological and Planetary Sciences, California Institute of Technology, Pasadena, CA 91125, USAb Department of Earth, Atmospheric, and Planetary Sciences, Massachusetts Institute of Technology, Cambridge, MA 02139, USA
c Department of Anatomy and Cell Biology and Facility for Electron Microscopy Research, McGill University, Montréal, QC, Canada H3A 2B2d Department of Earth and Planetary Sciences, McGill University, Montréal, QC, Canada H3A 2A7
Received 15 February 2006; received in revised form 26 April 2006; accepted 1 May 2006
Editor: S. King
Abstract
Magnetotactic bacteria produce intracellular crystals of magnetite or greigite, the properties of which have been shaped byevolution to maximize the magnetic moment per atom of iron. Intracellular bacterial magnetite therefore possesses traits amenableto detection by physical techniques: typically, narrow size and shape distributions, single-domain size and arrangement in linearchains, and often crystal elongation. Past strategies for searching for bacterial magnetofossils using physical techniques havefocused on identifying samples containing significant amounts of single domain magnetite or with narrow coercivity distributions.Searching for additional of traits would, however, increase the likelihood that candidate magnetofossils are truly of biologicalorigin. Ferromagnetic resonance spectroscopy (FMR) is in theory capable of detecting the distinctive magnetic anisotropyproduced by chain arrangement and crystal elongation. Here we present analyses of intact and lysed magnetotactic bacteria,dilutions of synthetic magnetite, and sedimentary samples of modern carbonates from the Great Bahama Bank, Oligocene–Miocene deep-sea muds from the South Atlantic, and Pleistocene lacustrine deposits from Mono Basin, California. We demonstratethat FMR can distinguish between intact bacterial magnetite chains, collapsed chains, and linear strings of magnetite formed byphysical processes. We also show that sediments in which the magnetization is likely carried by bacterial magnetite have FMRspectra resembling those of intact or altered bacterial magnetite chains.© 2006 Elsevier B.V. All rights reserved.
Keywords: magnetotactic bacteria; biogenic magnetite; ferromagnetic resonance; magnetofossils
⁎ Corresponding author. Division of Geological and PlanetarySciences, MC 170-25, California Institute of Technology, Pasadena,CA 91125, USA. Tel.: +1 626 395 2949; fax: +1 626 568 0935.
E-mail addresses: [email protected] (R.E. Kopp),[email protected] (B.P. Weiss), [email protected] (A.C. Maloof),[email protected] (H. Vali), [email protected] (C.Z. Nash),[email protected] (J.L. Kirschvink).1 Present address: Department of Geosciences, Princeton University,
Princeton, NJ 08544, USA.
0012-821X/$ - see front matter © 2006 Elsevier B.V. All rights reserved.doi:10.1016/j.epsl.2006.05.001
1. Introduction
Magnetotactic bacteria are a polyphyletic group oforganisms that, uniquely among the bacteria, engage inbiologically organized mineralization. They precipitateintracellular crystals of ferrimagnetic iron minerals,either magnetite (Fe3O4) or greigite (Fe3S4), withinmembrane-bound organelles called magnetosomes.

11R.E. Kopp et al. / Earth and Planetary Science Letters 247 (2006) 10–25
93
Although magnetosomes likely have multiple functions[1,2], one major role is the passive alignment ofbacterial cells with the geomagnetic field. Magnetotacticbacteria tend to live in regions with well-defined redoxgradients. Everywhere except on Earth’s geomagneticequator, the geomagnetic field has a vertical component;by swimming along the field lines, the bacteria reduce athree-dimensional search for optimal chemical condi-tions to a one-dimensional search [3–5].
Because natural selection can lead magnetotacticlineages to maximize their magnetic sensitivity for theamount of iron used, magnetite crystals produced bymagnetotactic bacteria have a number of distinctivetraits that facilitate their identification as magnetofossilsin sedimentary deposits [6]. Not all magnetotacticorganisms produce magnetite with all of these traits,and abiotic processes can produce crystals with some ofthem, but the greater the number of traits present, thehigher the degree of confidence with which one canidentify magnetite as biogenic. The following traits havebeen identified so far. Magnetite from magnetotacticbacteria is generally chemically pure and lacking incrystallographic defects (but see the relatively rareanomalies described by [7]). It almost always has anarrow size and shape distribution, is stably or meta-stably single domain, and is arranged in chains ofparticles. The crystals also tend to have unusual crystalmorphologies that increase the single domain stabilityfield [8,9]: sometimes elongated along the magneto-crystalline easy axis, and often with truncated crystaledges.
Because magnetotactic bacteria prefer specific chem-ical environments, their fossils convey informationabout paleoclimate and paleoecology [10,11]. Magne-tofossils also have a major advantage over otherbacterial fossils: because the fossils are magnetic,samples likely to contain magnetofossils can potentiallybe identified using physical techniques rather than time-consuming electron microscopy surveys. Nevertheless,the pre-Quaternary fossil record of magnetotacticbacteria is sparse. The oldest samples with chains ofsingle domain particles with distinctively biologicalmorphologies are Cretaceous chalks from England [12],although a few putative Precambrian magnetofossilshave also been identified [4,13].
Previous attempts to search for magnetofossils in pre-Quaternary sediments with physical techniques haverelied on the use of basic rock magnetic proceduresdesigned to identify single domain magnetite [e.g. 13].However, single domain magnetite may be precipitatedor concentrated by abiotic processes and is not unique tomagnetofossils. Finding additional characteristic traits
would greatly strengthen identifications. New techni-ques for unmixing coercivity spectra [14,15] allowdetermination of the degree of variation within popula-tions of magnetic particles, and thus allow detection ofthe narrow particle size and shape distributionscharacteristic of magnetotactic bacteria and magneto-fossils. Acquiring high-resolution coercivity spectra is atime-intensive process, however. Although the processcan be abbreviated for examining stratigraphic variationwithin a section where the end-member componentshave been identified [11], its time requirements maylimit its utility in surveying the deep-time magnetofossilrecord.
The magnetofossil chain structure and magnetosomecrystal elongation should exert distinctive influences onmicroscale magnetic anisotropy and should therefore bedetectable using physical techniques. For instance,Moskowitz et al. [16] proposed that the relativemagnitude of demagnetization upon warming acrossmagnetite's Verwey transition under field cooled andzero-field cooled conditions is an indicator of chainstructure. While their test did successfully distinguishfresh bacterial magnetite from other sources of magne-tite, it is highly susceptible to crystal oxidation and thusto false negatives. In application to sediments, it alsoneeds to be corrected for mixing of materials [15].
Isolated, equidimensional magnetite particles aredominated by negative cubic magnetocrystalline anisot-ropy, such that particle energy is highest whenmagnetization is aligned along the principal axes ofthe cubic crystal system and lowest when magnetizationis aligned with the family of [111] crystal axes. Positiveuniaxial shape anisotropy related to crystal elongationand particle organization in linear chains, in contrast,minimizes magnetostatic energy when the magnetiza-tion is aligned parallel to the crystal or chain elongationaxis and maximizes magnetostatic energy when themagnetization is orthogonal to the crystal or chainelongation axis. Lowering the magnetostatic energy isequivalent to applying a field along the direction ofmagnetization, while increasing the energy of a state isequivalent to applying a field against the magnetization.Thus, a physical technique capable of assessing theeffective field felt by a particle should be sensitive tochain structure and elongation. Ferromagnetic reso-nance spectroscopy (FMR) is such a technique [17–20].
FMR is a form of electron spin resonance, alsoknown as electron paramagnetic resonance (EPR) [21].FMR is based on the Zeeman effect, which causes theenergy of an electron with spin aligned with a magneticfield to be lower than that of an electron with spinaligned against the field. The energy splitting is given by

Fig. 1. Synthetic FMR spectra. Generated with g=2.12, and (A) nomagnetic anisotropy, (B) cubic Ban=−55 mT, as expected for non-interacting cubic magnetite, (C) uniaxial Ban=100 mT, (D) uniaxialBan=−100 mT, and (E) uniaxial Ban=100 mT. For (A–D), σ=25 mT;for (E), σ=50 mT. Thick lines show derivative spectra and thin linesshow integrated absorption spectra with Gaussian broadening loweredto σ=3 mT. Sharp spectra with positive uniaxial anisotropy, as in (C),have two local maxima on the low field side, while sharp spectra withnegative uniaxial anisotropy, as in (D), have two local minima on thehigh field side; these features can be obscured by spectral broadening,as seen in comparison of (C) and (E).
12 R.E. Kopp et al. / Earth and Planetary Science Letters 247 (2006) 10–25
94
ΔE=gβB, where g is the spectroscopic g-factor, β is theBohr magneton (9.37×10⁻²⁴ Am2), and B is the fieldfelt by the electron. The spectroscopic g-factor is 2.0023for a free electron and 2.12 for an electron in magnetite[21,22]. The electron can therefore absorb a photon withenergy hν=gβB.
In a conventional EPR spectrometer, a sample isplaced in a resonating cavity situated inside anelectromagnet. A microwave radiation source withlimited frequency adjustability (typically X-band,∼9.0–9.8 GHz) generates photons. A detector measuresthe first derivative of absorption as the electromagnetsweeps the magnetic field strength across a range ofvalues [21]. For a single crystal, the resonant field isshifted to lower values when magnetization is alignedalong a magnetically easy direction (e.g., along the [111]crystal axis of magnetite, or along the elongation axis ofan elongate crystal or chain) and to higher values whenthe magnetization is aligned along a hard direction.
Most samples of geological interest are not singlecrystals, but are composed of particles in a variety ofarrangements and orientations with respect to theapplied magnetic field. The spectrum of a powder ofmagnetostatically non-interacting, spherical (isotropic)particles is simply a broadened form of the single crystalspectrum (Fig. 1A), but for powders of anisotropicparticles, the spectrum not only broadens but alsodevelops asymmetry (Fig. 1B and E). Consider the caseof a powder of elongate magnetite crystals, withelongation axes distributed uniformly in all directions(Fig. 1C). From simple geometrical considerations,there will be a small number of particles with elongationaxes closely aligned with the direction of the appliedfield, and many more with elongation axes aligned closeto the plane perpendicular to the applied field. Thosewith elongation axes aligned with the applied field willabsorb at lower fields than would isotropic particles,while those with elongation axes in the normal planewill absorb at higher fields. Thus, compared to thespectrum of a powder of isotropic particles, the peakabsorption will be shifted to higher field values (i.e.,lower effective g-factor) but will have a tail asymmet-rically extended in the low field direction. Conversely, apowder of particles with negative anisotropy will haveincreased effective g-factors and high field extendedasymmetry (Fig. 1B and D).
As can be seen in Fig. 1C and D, the derivativespectrum of a powder of particles with uniaxialanisotropy has two peaks on the asymmetricallyextended side. The one closer to the zero crossing isassociated with the rise to the peak of absorption, whilethe one farther from the zero crossing is associated with
the transition from zero absorption to positive absorp-tion. Samples with more complex anisotropies may haveadditional peaks. These differences, however, can beobscured by factors that symmetrically broaden line-width, such as magnetostatic interactions and sampleheterogeneity (Fig. 1E).
Weiss et al. [20] found that bacterial magnetite chainshave FMR spectra distinct from abiotic magnetite. Theypostulated that the unique spectra of magnetosomechains result from the positive magnetic anisotropy ofthe chain structure (Fig. 1C), which contrasts with thenegative cubic magnetocrystalline anisotropy of room-temperature magnetite (Fig. 1B). They demonstrated,

13R.E. Kopp et al. / Earth and Planetary Science Letters 247 (2006) 10–25
95
through measurements of laboratory cultures, that intactmagnetotactic bacteria have spectra with low-fieldextended asymmetry, as well as effective g-factorsshifted below the standard magnetite value of 2.12 andtwo local maxima. Weiss et al. [20] also showed thatlysed (broken) chains do not have the distinct FMRsignature of intact chains, which suggests that the chainstructure plays a major role in the FMR signature.However, because the crystals in the lysed chains intheir experiments were clumped and highly magnetos-tatically interacting, Weiss et al. were unable to measurethe FMR spectra of isolated magnetosomes and thus todemonstrate that the characteristic FMR spectra ofmagnetosome chains arises from the chain structurerather than from some trait of the individual crystals.
In this paper, we investigate the effects of chainstructure and crystal elongation on FMR spectra and theextent to which these features can be mimicked byprocess other than the growth of chains of magnetitewithin magnetotactic bacteria. We examined intact anddisrupted chains of magnetite from Magnetospirillummagneticum strain AMB-1, as well as dilutions ofmagnetite from lysed AMB-1 and of abiogenicmagnetite strung out into linear features. We alsoexamined sediments from a modern carbonate platformin the Bahamas, Oligocene–Miocene clays and calcar-eous oozes from the Atlantic Ocean, and lacustrine siltsand muds from Mono Basin, California, in an attempt todetermine whether these features corresponded to thoseobserved in nature.
2. Samples
2.1. Bacterial cultures
For the lysis experiments, 2 L of M. magneticumstrain AMB-1 (ATCC strain 700264) was grown to earlystationary phase, at ∼108 cells/ mL, using standardculture conditions [23] and then spun down into threesubsamples, which were resuspended in 5 mL Trisbuffer. Five microliters of β-mercaptoethanol was addedto subsample A3. The samples were frozen at −20 °Cand then thawed at 5 °C. Then, 270 mg of sodiumdodecyl sulfate (SDS) was added as a detergent to A3,which was incubated at room temperature for 10 min.A2 and A3 were subjected to ultrasonication with aFischer Scientific Sonic Dismembrator 550 for 6 min,with pulses of 0.5 s alternated with pauses of 0.5 s.
Next, the samples were spun down, frozen, andfreeze-dried. Half of A3 was diluted to ∼0.1% inpowdered sucrose by grinding in an agate mortar andpestle, first for 1 min (to form subsample A3b) and then
for 5min (to form subsample A3c). Halves ofsubsamples A1 and A2 were similarly diluted bygrinding for 5 min to form subsamples A1b and A2b.
Based on rock magnetic data and transmissionelectron microscope images acquired in previous studiesfrom the related magnetotactic bacterium M. magneto-tacticum strain MS-1 [24,25], we expect that ultra-sonicated AMB-1 contains chains of magnetite crystalsliberated from cells but remains bound by magnetosomemembranes. The crystals are likely strung together incomposite chains formed by linkage of individual chainsfrom different cells, with some of the chains closed toform loops (see Fig. 1 of [25]). Closed loops representthe minimum energy configuration for four or moreequidimensional magnetite crystals [26].
SDS treatment, in contrast, destroys both cytoplas-mic and magnetosome membranes. As a consequence,the crystals in SDS-treated samples collapse intoagglomerates with strong three-dimensional magneto-static interactions. We predict that, when progressivelydispersed to lower density, the crystals minimize theirenergy by transitioning to increasingly linear “stringy”arrangements, with magnetic dipoles oriented in a head-to-tail fashion [26].
2.2. Synthetic magnetite dilutions
TMB-100 is a synthetic magnetite powder producedby the Toda Industrial Company. The powder containspredominantly equidimensional, octahedral crystals of80–200 nm diameter. In concentrated form, the crystalsform magnetostatically interacting masses with dia-meters of several microns [20].
Aliquots of TMB-100 were mixed in a tube withpowdered sucrose. Each mixture was shaken to dispersethe magnetite through the sucrose. Undispersed accu-mulations of magnetite were removed with a smallNdFeB magnet. The final mass ratios of magnetite tosucrose were approximately 6%, 6000 ppm, and400 ppm (for samples T1, T2, and T3 respectively).Subsamples of each mixture were powdered with anagate mortar and pestle for 1 min and then for 4 min.
2.3. Sedimentary samples
Holocene–Recent peritidal carbonate mud sampleswere collected from a 210 cm core (C51: N 25 °1.35′W78 °9.9′ in the WGS84 datum) through a levee crest inthe Triple Goose Creek region of Andros Island, theBahamas. The core was extracted using a Livingstonepiston corer provided to us by the LimnologicalResearch Center, University of Minnesota. The core

14 R.E. Kopp et al. / Earth and Planetary Science Letters 247 (2006) 10–25
96
was separated into halves and sediment was collected innon-magnetic plastic boxes from interior sediment thathad not been in contact with any metal objects. Theupper 3 cm of the core is characterized by activemicrobial mats, containing the morphologically-identi-fied filamentous cyanobacteria Schizothrix [27]. Theactive microbial mat is underlain by 29 cm of tan,faintly-laminated mud, which is in turn underlain by178 cm of grey, bioturbated carbonate mud, withvariable concentrations of <1 cm long cerithid gastro-pod shells.
Samples of Oligocene–Miocene deep-sea clay andcalcareous nanofossil ooze from the southern AtlanticOcean were taken from the Deep Sea Drilling Projectsite 522, cores 12–20 (44–80 mbsf) [28]. The magneticmineralogy of these samples, which is dominated bybiogenic magnetic, was described by Vali and Kirsch-vink [29]. Samples were provided by the Ocean DrillingProgram (ODP), which is sponsored by the U. S.National Science Foundation (NSF) and participatingcountries under management of Joint OceanographicInstitutions (JOI), Inc.
Samples of the Pleistocene Wilson Creek Formationof Mono Basin, California [30], were collected withpermission of the Forest Service in May 2005 at theformation's type section northwest of Mono Lake (N38 ° 1.3′ W 119 ° 7.5′ in the WGS 84 datum). Asidefrom a few ash layers and sand lenses, the sediments ofthe Wilson Creek Formation are dominantly laminated(unbioturbated) muds and silts derived from thecrystalline rocks of the Sierra Nevada to the west.
3. Methods
3.1. Rock magnetic measurements
Room temperature magnetic remanence experimentswere performed using a 2G Enterprises SQUIDmagnetometer housed in a magnetically-shieldedroom. Anhysteretic remanent magnetization (ARM)was acquired in a 100 mT alternating field and a DCbiasing field progressively varied in steps from 0 to1 mT and was then removed by progressive alternatingfield demagnetization (AF) up to 160 mT. Isothermalremanent magnetization (IRM) at 100 mT was thenacquired and removed by AF.
The ARM susceptibility of non-interacting singledomain particles is a function of temperature, particlemoment, and particle switching field [31]. Three-dimensional interparticle magnetostatic interactionssignificantly reduce ARM susceptibility [32], socomparison of the ARM susceptibility of similar
particles in different arrangements reflects changes inparticle arrangement. We report ARM susceptibility askARM/IRM, the ARM acquired per A/m2 with a biasingfield of 0.1 mT (79.6 A/m) and an alternating field of100 mT, normalized to the IRM acquired in a field of100mT. Typical freeze-dried magnetotactic bacteria(weakly interacting) have kARM/IRM=2.5 mm/A,while a typical chiton tooth (strongly interacting) haskARM/IRM=0.09 mm/A.
Low-temperature experiments were performed usinga Quantum Design Magnetic Properties MeasurementSystem in the Molecular Materials Resource Center ofthe Beckman Institute at Caltech. Field cooled andzero-field cooled curves were acquired by cooling thesample either in a 3 T field or in zero field to 5 K,respectively, followed by pulsing with a 3 T field andthen measuring the remanence magnetization duringwarming to room temperature in zero field. Thecombination of field cooled and zero field cooledmeasurements constitute the Moskowitz test [16,20].The sample was then cycled through low-temperatureby pulsing it with a 3 T field at room temperature andthen measuring the remanent magnetization as thesample was cooled to 10 K and then warmed to roomtemperature.
The results of the low-temperature experiments arereported as the parameters δZFC, δFC, and fLTC. Theparameters δ=(J80K−J150K)/J80K assessed for the zero-field cooled and field cooled curves respectively,where J80K and J150K are the moments measured at80 K and 150 K, respectively. A ratio δFC/δZFC>2.0passes the Moskowitz test and is considered to be anindicator of the presence of magnetosome chains,although partial oxidation and mixing can cause intactchains to fail the test [16,20]. Magnetization retainedthrough low-temperature cycling is expressed as thememory parameter fLTC=JLTC/J0, where J0 and JLTCare respectively the room-temperature magnetizationmeasured before and after cycling the samples to10 K.
3.2. Ferromagnetic resonance spectroscopy
Ferromagnetic resonance spectra were acquiredusing an X-band Bruker ESP 300E EPR Spectrometerhoused at Caltech. Except for particularly strongsamples, microwave power was set at 640 μW andspectra were integrated over three sweeps of the appliedfield from 0 to 600 mT. For the strongest samples,microwave power was set at 64 μWand one sweep wasperformed. The spectra were measured at ∼9.8 GHz.For 77 K measurements, samples were loaded in a

15R.E. Kopp et al. / Earth and Planetary Science Letters 247 (2006) 10–25
97
quartz glass dewar filled with liquid nitrogen and spectrawere measured at ∼9.4 GHz.
FMR spectra are rich in detail; to extract all theinformation they convey, they must be examinedindividually. As a first order summary of spectralcharacteristics, we use three parameters [20]: geff, A, andΔBFWHM (Fig. 2). The effective g-factor, geff, is the g-factor associated with maximum absorption which isgiven by geff=hν/βBeff, where Beff is the field value ofmaximum absorption. The asymmetry ratio is defined asA=ΔBhigh/ΔBlow, where ΔBhigh=Bhigh−Beff, ΔBlow=Beff−Blow, and Bhigh and Blow are the fields of halfmaximum absorption at low-field and high-field sides ofthe absorption peak, respectively. The full width at halfmaximum, ΔBFWHM, is defined as ΔBFWHM=Bhigh
+Blow. Although all these parameters are derived fromthe integrated absorption spectrum, FMR spectra aregenerally displayed as derivative spectra, which revealmuch greater detail upon inspection. The empiricalparameter á, generated by linear discriminant analysis[33] to maximize the difference between magneto-some chains and detrital magnetite in A vs. ΔBFWHM
space and discussed at length later, is defined asα=0.17 A+9.8×10⁻⁴ ΔBFWHM/mT.
3.3. Simulation of ferromagnetic resonance spectra
We used MATLAB code, written following Griscom[34,35], to simulate FMR spectra and thereby allow usto understand the relationship between the empiricalparameters and physical parameters. We assume that the
Fig. 2. Definitions of basic FMR parameters. Illustrated on a syntheticFMR spectrum of non-interacting, equidimensional magnetite(g=2.12, σ=30 mT, cubic Ban=−55 mT, K2/K1=0.21). The darkline shows the derivative spectrum and the light line shows theintegrated spectrum.
simulated material is a powder of dilute single-domainparticles, small with respect to the microwave skin depth(∼5 μm in magnetite [34]), with the particles uniformlydistributed in all orientations, and that, at resonance, theorientation of the moment vector approximates the fieldorientation. Magnetostatic interactions were neglectedexcept as a source of anisotropy, and all anisotropy,whether arising from magnetocrystalline anisotropy,shape anisotropy, or particle arrangement, was treatedthrough a single pair of anisotropy constants, K1 and K2.
The orientation of an individual particle is defined bythe angles θ and φ, where θ is the angle between theapplied DC field and the axis of the particle and φ is theangle of the axis out of the plane defined by themicrowave field and the applied DC field. For a particlewith uniaxial anisotropy, the first-order resonancecondition (derived from the anisotropy energy E=K1
sin2 θ+K2 sin4 θ following the approaches of [18,35]) is
given by
Bres;uniðhÞ ¼ Btrue−12Ban � ½3cos2h−1
þ ðK2=K1Þð8cos2hsin2h−2sin4hÞ�
where Btrue=hν/βgtrue is the resonance field in theabsence of anisotropy, Ban is the anisotropy field 2K1/Ms, K1 and K2 are the first-order and second-orderuniaxial anisotropy constants, and Ms is the saturationmagnetization. For cubic anisotropy, the resonancecondition of [35] was used.
To compute the powder absorption at applied fieldBapp, a Gaussian broadening function of linewidth σ isapplied and spectra are numerically integrated over allsolid angles:
AðBappÞ ¼Z k=2
h¼0
Z 2k
/¼0
expð−ðBapp−Bresðh;/ÞÞ2=2r2Þffiffiffiffiffiffiffiffi2kr
p d/
� sinh dh
Several physical effects are subsumed in theGaussian broadening; in natural samples, a majorcause of broadening is heterogeneity in particle size,shape, and arrangement [36].
While not capable of fitting our observed spectraperfectly, nonlinear least square fitting using thesemodel spectra provides reasonably good approxima-tions. For almost all our samples, second-order uniaxialfits were better than second-order cubic fits, and theynever were significantly worse. We would expect this tobe the case for samples in which magnetostaticinteractions or shape anisotropy dominated the internalmagnetic environment.

16 R.E. Kopp et al. / Earth and Planetary Science Letters 247 (2006) 10–25
98
3.4. Transmission electron microscopy (TEM)
We prepared replicas, composed of a 1–2 nm thickmetal thin film of 95% platinum and 5% carbon and asupporting carbon film 15–20 nm thick, of the syntheticmagnetite dilutions to allow us to remove the sucrosedilutant while preserving the relationship between thedilutant and the magnetite. Ten microliters of∼20 mg ofpowder dispersed in 99% pure methanol was transferredonto a freshly cleaved mica thin plate. As the powdersettled, the fluid was removed by blotting with filterpaper. The replica was prepared in a freeze-fracture unit(Baltec 60, Lichtenstein) at room temperature underhigh vacuum (10–6 Torr), as described in [37], bydepositing a fine granular Pt-C film from an evaporatingsource at an incident angle of 30 ° and a distance of15 cm to the mica plate. Variable densities of Pt-Caccumulate along the topographic slopes of thespecimen that are facing, oblique to, or shielded fromthe source, emphasizing the topographic contrast forTEM imaging. To strengthen the ultra-thin Pt films andpreserve their integrity during cleaning steps, asupporting carbon film was immediately condensed onthe Pt film by a vertical electron beam gun sputtering acarbon rod perpendicular to and 12 cm away from thesurface of the specimen. The replicas were cleaned withdistilled water to remove the sucrose and transferredonto 200 mesh formvar-coated Cu grids.
Imaging was carried out in bright-field illuminationwith a JEOL JEM-2000FX transmission electronmicroscope, at an accelerating voltage of 80 kV andmagnifications from 5000×–50,000×, and a Gatan 792Bioscan 1 k×1 k Wide Angle Multiscan CCD camera.
4. Results
4.1. Lysis of magnetotactic bacteria
When comparing different arrangements of similarparticles, ARM susceptibility quantifies magnetostaticinteractions. Three-dimensional magnetostatic interac-tions shield particles from the DC biasing field, whichcauses materials with greater interactions to exhibitlower ARM susceptibility. (This is not the case formaterials with one-dimensional magnetostatic interac-tions, as in magnetosome chains.) As expected fromthese considerations, the ARM susceptibilities of thesamples are ordered: intact AMB-1 (samples A1a andA1b)>ultrasonically disrupted AMB-1 (samples A2aand samples A2b)>dispersed, SDS-treated AMB-1(sample A3c) > concentrated, SDS-treated AMB-1(samples A3b and A3a) (Fig. 3A, Table 1).
Ferromagnetic resonance spectra of the disruptedAMB-1 samples reflect a shift from linear chains tohighly interacting clumps (Fig. 3B, Table 1). Theultrasonically disrupted AMB-1 (sample A2a) exhibitslittle change in spectrum shape or in the spectralparameters compared to intact AMB-1 (sample A1a).This suggests that, although the magnetostatic interac-tions as revealed by the ARM curves have increasedrelative to the intact cells, the local magneticenvironment felt by each individual crystal remainsdominated by head-to-tail axial interactions; the chainsare still intact, although they are no longer separatedfrom one another by cell material (see Fig. 1 of [25]).In contrast, the spectrum of the SDS-treated cellsexhibits a high-field extended asymmetry and high geff(sample A3a), consistent with the observations ofWeiss et al. [20].
The diluted SDS-treated cells (sample A3c) exhibit aspectrum that more closely resembles that of the intactand ultrasonicated samples, although the spectrum ofA3c is a bit wider. One key trait of this spectrum that isnot readily apparent from the parameterization is itsdegree of sharpness. The derivative spectra of intact andultrasonicated AMB-1 (A1a and A2a) have two localmaxima, which indicate a low degree of peak broaden-ing caused by heterogeneous particle arrangements.Each particle experiences roughly the same magneticanisotropy produced by particle interactions within thechain, because the magnetite chains are produced underbiological control. In contrast, the dispersed, SDS-treated AMB-1 (A3c) has only one local maximum,likely because the particles are arranged in one-dimensional strings that form through physical process-es and therefore have more heterogeneous magneticanisotropy. The same effect is seen in comparing Fig. 1Cand E.
All the AMB-1 spectra are fairly well fit by second-order uniaxial model spectra. The intact, ultrasonicated,and dispersed SDS-treated samples have Ban valuesaround 80 mT. Following the method of Butler andBanerjee [38,39], this value is equivalent to the shapeanisotropy of an elongate magnetite crystal with a 2.2:1length-to-width ratio. Since the crystals produced byAMB-1 are equidimensional, the apparent shapeanisotropy must be due to linear magnetostatic interac-tions. The −81 mT Ban value of the concentrated SDS-treated sample is equivalent to a single crystal with a1:1.1 length-to-width ratio, and may be due to planarmagnetostatic interactions, as on the surface of a clump.All SDS-treated samples have larger σ values than intactand ultrasonicated samples, which likely reflect greaterheterogeneity of particle arrangement.

Fig. 3. Measurements of intact and altered AMB-1. (A) ARM acquisition curves, (B) ferromagnetic resonance spectra, and (C) low-temperaturecycling curves of cultures of AMB-1. In (A), the lower dashed line is a chiton tooth standard for highly interacting magnetite. In (B), thick linesrepresent room-temperature measurements, thin lines represent 77 K measurements (where performed), and dashed lines indicate spectral fits.
17R.E. Kopp et al. / Earth and Planetary Science Letters 247 (2006) 10–25
99
The FMR spectra measured at 77 K are consistentwith these findings (Fig. 3B, Table 2). Below theVerwey transition, which, as measured in the FC andZFC curves (not shown; see also [20]), occurs at∼100 K in magnetite from AMB-1, magnetite shifts
Table 1Summary of FMR and magnetic parameters of bacterial samples
Sample FMR spectrum FMR uniax
ID Treatment geff A ΔB(mT)
α gfit Ba
(m
A1a Intact 2.01 0.79 96 0.23 2.08 8A1b Intact, pwd. 2.01 0.83 93 0.23 2.08 8A2a Ultra. 2.01 0.73 112 0.23 2.10 8A2b Ultra., pwd. 2.02 0.78 103 0.23 2.09 8A3a SDS, conc. 2.25 1.13 208 0.40 2.20 −8A3b SDS, pwd 1m 2.14 0.89 188 0.34 2.17 −6A3c SDS, pwd 5m 2.07 0.76 148 0.27 2.14 7
from a cubic crystal system to a monoclinic crystalsystem and experiences a large increase in magneto-crystalline anisotropy, with the anisotropy constantsbecoming positive [40,41]. Thus, the spectra broadenconsiderably, geff shifts to higher values, and A becomes
ial fit Magnetic properties
n
T)K2/K1 σ
(mT)kARM/IRM(mm/ A)
δZFC δFC/δZFC fLTC
1 −0.13 27 2.48 0.14 2.44 0.986 −0.20 29 2.364 −0.06 30 1.34 0.16 1.94 0.895 −0.14 31 1.311 0.43 48 0.36 0.37 1.21 0.830 0.65 48 0.369 0.01 50 0.66 0.26 1.39 0.86
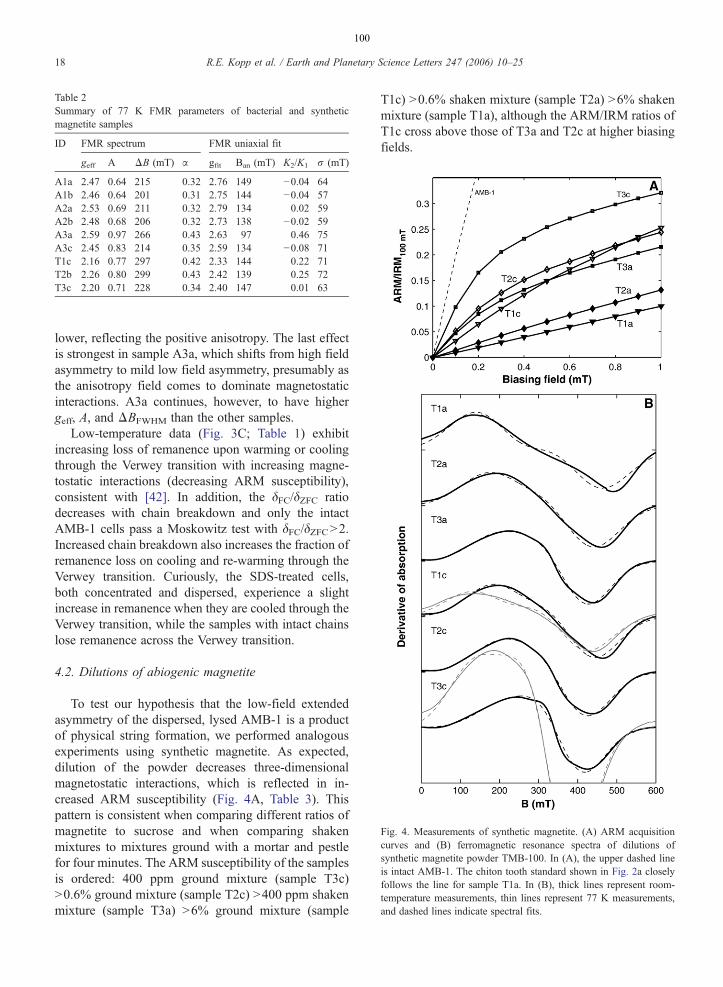
Table 2Summary of 77 K FMR parameters of bacterial and syntheticmagnetite samples
ID FMR spectrum FMR uniaxial fit
geff A ΔB (mT) α gfit Ban (mT) K2/K1 σ (mT)
A1a 2.47 0.64 215 0.32 2.76 149 −0.04 64A1b 2.46 0.64 201 0.31 2.75 144 −0.04 57A2a 2.53 0.69 211 0.32 2.79 134 0.02 59A2b 2.48 0.68 206 0.32 2.73 138 −0.02 59A3a 2.59 0.97 266 0.43 2.63 97 0.46 75A3c 2.45 0.83 214 0.35 2.59 134 −0.08 71T1c 2.16 0.77 297 0.42 2.33 144 0.22 71T2b 2.26 0.80 299 0.43 2.42 139 0.25 72T3c 2.20 0.71 228 0.34 2.40 147 0.01 63
Fig. 4. Measurements of synthetic magnetite. (A) ARM acquisitioncurves and (B) ferromagnetic resonance spectra of dilutions ofsynthetic magnetite powder TMB-100. In (A), the upper dashed lineis intact AMB-1. The chiton tooth standard shown in Fig. 2a closelyfollows the line for sample T1a. In (B), thick lines represent room-temperature measurements, thin lines represent 77 K measurements,and dashed lines indicate spectral fits.
18 R.E. Kopp et al. / Earth and Planetary Science Letters 247 (2006) 10–25
100
lower, reflecting the positive anisotropy. The last effectis strongest in sample A3a, which shifts from high fieldasymmetry to mild low field asymmetry, presumably asthe anisotropy field comes to dominate magnetostaticinteractions. A3a continues, however, to have highergeff, A, and ΔBFWHM than the other samples.
Low-temperature data (Fig. 3C; Table 1) exhibitincreasing loss of remanence upon warming or coolingthrough the Verwey transition with increasing magne-tostatic interactions (decreasing ARM susceptibility),consistent with [42]. In addition, the δFC/δZFC ratiodecreases with chain breakdown and only the intactAMB-1 cells pass a Moskowitz test with δFC/δZFC>2.Increased chain breakdown also increases the fraction ofremanence loss on cooling and re-warming through theVerwey transition. Curiously, the SDS-treated cells,both concentrated and dispersed, experience a slightincrease in remanence when they are cooled through theVerwey transition, while the samples with intact chainslose remanence across the Verwey transition.
4.2. Dilutions of abiogenic magnetite
To test our hypothesis that the low-field extendedasymmetry of the dispersed, lysed AMB-1 is a productof physical string formation, we performed analogousexperiments using synthetic magnetite. As expected,dilution of the powder decreases three-dimensionalmagnetostatic interactions, which is reflected in in-creased ARM susceptibility (Fig. 4A, Table 3). Thispattern is consistent when comparing different ratios ofmagnetite to sucrose and when comparing shakenmixtures to mixtures ground with a mortar and pestlefor four minutes. The ARM susceptibility of the samplesis ordered: 400 ppm ground mixture (sample T3c)>0.6% ground mixture (sample T2c) >400 ppm shakenmixture (sample T3a) >6% ground mixture (sample
T1c) >0.6% shaken mixture (sample T2a) >6% shakenmixture (sample T1a), although the ARM/IRM ratios ofT1c cross above those of T3a and T2c at higher biasingfields.
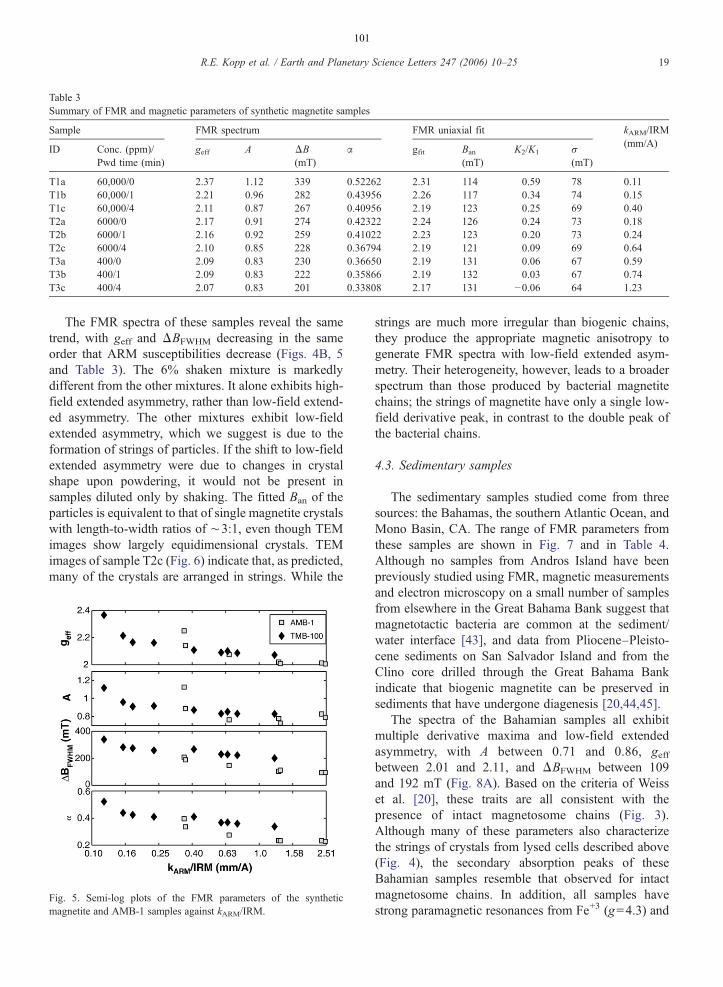
Table 3Summary of FMR and magnetic parameters of synthetic magnetite samples
Sample FMR spectrum FMR uniaxial fit kARM/IRM(mm/A)
ID Conc. (ppm)/Pwd time (min)
geff A ΔB(mT)
α gfit Ban
(mT)K2/K1 σ
(mT)
T1a 60,000/0 2.37 1.12 339 0.52262 2.31 114 0.59 78 0.11T1b 60,000/1 2.21 0.96 282 0.43956 2.26 117 0.34 74 0.15T1c 60,000/4 2.11 0.87 267 0.40956 2.19 123 0.25 69 0.40T2a 6000/0 2.17 0.91 274 0.42322 2.24 126 0.24 73 0.18T2b 6000/1 2.16 0.92 259 0.41022 2.23 123 0.20 73 0.24T2c 6000/4 2.10 0.85 228 0.36794 2.19 121 0.09 69 0.64T3a 400/0 2.09 0.83 230 0.36650 2.19 131 0.06 67 0.59T3b 400/1 2.09 0.83 222 0.35866 2.19 132 0.03 67 0.74T3c 400/4 2.07 0.83 201 0.33808 2.17 131 −0.06 64 1.23
19R.E. Kopp et al. / Earth and Planetary Science Letters 247 (2006) 10–25
101
The FMR spectra of these samples reveal the sametrend, with geff and ΔBFWHM decreasing in the sameorder that ARM susceptibilities decrease (Figs. 4B, 5and Table 3). The 6% shaken mixture is markedlydifferent from the other mixtures. It alone exhibits high-field extended asymmetry, rather than low-field extend-ed asymmetry. The other mixtures exhibit low-fieldextended asymmetry, which we suggest is due to theformation of strings of particles. If the shift to low-fieldextended asymmetry were due to changes in crystalshape upon powdering, it would not be present insamples diluted only by shaking. The fitted Ban of theparticles is equivalent to that of single magnetite crystalswith length-to-width ratios of ∼3:1, even though TEMimages show largely equidimensional crystals. TEMimages of sample T2c (Fig. 6) indicate that, as predicted,many of the crystals are arranged in strings. While the
Fig. 5. Semi-log plots of the FMR parameters of the syntheticmagnetite and AMB-1 samples against kARM/IRM.
strings are much more irregular than biogenic chains,they produce the appropriate magnetic anisotropy togenerate FMR spectra with low-field extended asym-metry. Their heterogeneity, however, leads to a broaderspectrum than those produced by bacterial magnetitechains; the strings of magnetite have only a single low-field derivative peak, in contrast to the double peak ofthe bacterial chains.
4.3. Sedimentary samples
The sedimentary samples studied come from threesources: the Bahamas, the southern Atlantic Ocean, andMono Basin, CA. The range of FMR parameters fromthese samples are shown in Fig. 7 and in Table 4.Although no samples from Andros Island have beenpreviously studied using FMR, magnetic measurementsand electron microscopy on a small number of samplesfrom elsewhere in the Great Bahama Bank suggest thatmagnetotactic bacteria are common at the sediment/water interface [43], and data from Pliocene–Pleisto-cene sediments on San Salvador Island and from theClino core drilled through the Great Bahama Bankindicate that biogenic magnetite can be preserved insediments that have undergone diagenesis [20,44,45].
The spectra of the Bahamian samples all exhibitmultiple derivative maxima and low-field extendedasymmetry, with A between 0.71 and 0.86, geffbetween 2.01 and 2.11, and ΔBFWHM between 109and 192 mT (Fig. 8A). Based on the criteria of Weisset al. [20], these traits are all consistent with thepresence of intact magnetosome chains (Fig. 3).Although many of these parameters also characterizethe strings of crystals from lysed cells described above(Fig. 4), the secondary absorption peaks of theseBahamian samples resemble that observed for intactmagnetosome chains. In addition, all samples havestrong paramagnetic resonances from Fe+3 (g=4.3) and
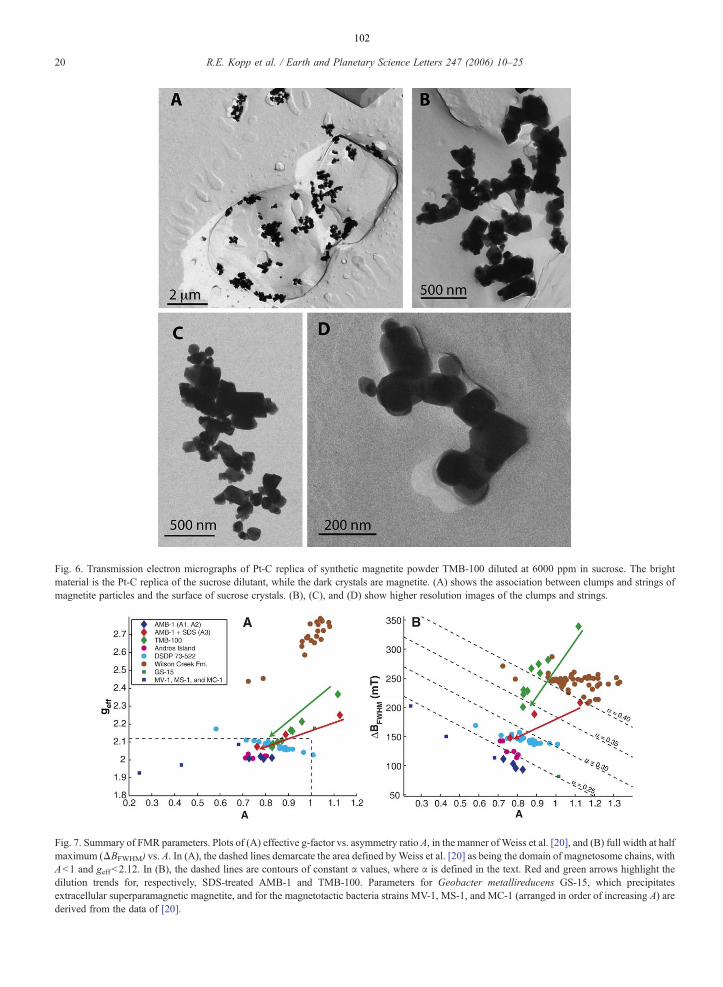
Fig. 6. Transmission electron micrographs of Pt-C replica of synthetic magnetite powder TMB-100 diluted at 6000 ppm in sucrose. The brightmaterial is the Pt-C replica of the sucrose dilutant, while the dark crystals are magnetite. (A) shows the association between clumps and strings ofmagnetite particles and the surface of sucrose crystals. (B), (C), and (D) show higher resolution images of the clumps and strings.
Fig. 7. Summary of FMR parameters. Plots of (A) effective g-factor vs. asymmetry ratio A, in the manner of Weiss et al. [20], and (B) full width at halfmaximum (ΔBFWHM) vs. A. In (A), the dashed lines demarcate the area defined by Weiss et al. [20] as being the domain of magnetosome chains, withA<1 and geff<2.12. In (B), the dashed lines are contours of constant α values, where α is defined in the text. Red and green arrows highlight thedilution trends for, respectively, SDS-treated AMB-1 and TMB-100. Parameters for Geobacter metallireducens GS-15, which precipitatesextracellular superparamagnetic magnetite, and for the magnetotactic bacteria strains MV-1, MS-1, and MC-1 (arranged in order of increasing A) arederived from the data of [20].
20 R.E. Kopp et al. / Earth and Planetary Science Letters 247 (2006) 10–25
102

Table 4Summary of parameters of environmental samples
Sample FMR spectrum kARM/IRM(mm/A)
geff A ΔB(mT)
α
Andros island C516 cm 2.03 0.72 143 0.26 2.5414 cm 2.01 0.71 143 0.26 2.5522 cm 2.01 0.78 124 0.25 3.0831 cm 2.01 0.74 124 0.25 2.4942 cm 2.02 0.80 118 0.25 1.2152 cm 2.02 0.80 114 0.25 0.96
Andros islandMean 2.04 0.77 140 0.27 1.97Min. 2.01 0.71 109 0.25 0.96Max. 2.11 0.86 192 0.32 3.08
DSDP 73-522Mean 2.08 0.83 146 0.28 1.31Min. 2.03 0.58 136 0.26 1.07Max. 2.17 1.01 169 0.31 1.62
Wilson CreekMean 2.88 1.11 242 0.43 0.25Min. 2.58 0.96 207 0.40 0.25Max. 3.34 1.33 287 0.47 0.38
21R.E. Kopp et al. / Earth and Planetary Science Letters 247 (2006) 10–25
103
Mn+2 (g=2.0). The latter obscure the magnetite signalin the derivative curve, but due to the sharp peaks ofthe Mn+2 sextet, the Mn+2 signal is readily removed bycurve smoothing (Fig. 7A).
A close examination of core C51 reveals changeswith depth suggestive of the progressive alteration ofmagnetosome chains. The first local maximum of thederivative spectrum in the 6 cm and 14 cm samples iswell defined. In the 22 and 31 cm samples, it is presentbut diminished in strength relative to the second localmaximum. In the 42 and 52 cm samples, the first localmaximum is not present, and ARM susceptibility ismarkedly diminished compared to shallower samples(Fig. 8B and C). These changes suggest the progressivedegradation of magnetosome chains with depth, al-though they could alternatively represent the mixing oftwo discrete magnetic materials in the upper sediments,and the loss of one of these with depth.
The deep-sea sediments studied contain magneto-fossils of a variety of morphologies, some partiallydissolved [29]. TEM images of magnetic extracts fromthese samples often produced interlocking meshes andlinked strings more closely resembling those present inour dilutions of abiogenic magnetite than the chainspresent in intact bacteria. Excluding one outlier, all theDSDP Leg 73 samples have A of 0.72–1.01, geff of
2.03–2.11, and ΔBFWHM of 136–157 mT. A typicalspectrum is shown in Fig. 9A. It is similar to that of thedispersed, SDS-treated AMB-1 (sample A3c; dashedline in Fig. 9A). Like sample A3c, it lacks the secondlocal maximum characteristic of intact bacterial culturesand the laminated Bahamian sediments. Instead, it isconsistent with more heterogeneous sediments wherethe magnetization is dominated by bacterial magnetite inwhich many of the chains have been broken up but theparticles have largely remained associated in roughlylinear low-energy configurations — precisely whatTEM images [29] reveal.
The samples from the Pleistocene Wilson CreekFormation (Fig. 9B) were deposited in Lake Russell, thelate Pleistocene predecessor of modern Mono Lake.Microbiological research in Mono Lake has revealed avariety of magnetotactic organisms (C. Z. Nash,unpublished results), but due to the basin's location inthe Sierra Nevada, sedimentary flux into the basin andthus sediment magnetization is dominated by detritalmaterial derived from Sierran intrusive bodies. Thesesamples exhibit a broad range of A values (0.73–1.33;all but two compositionally anomalous samples, an ashand sand lens, have A≥0.96), have geff well above thoseof all other samples considered in this paper (2.44–3.34;all but the two anomalous samples have geff≥2.58), andΔBFWHM larger than the samples dominated by bacterialmagnetite (207–287 mT).
5. Discussion
Weiss et al. [20] suggested that the magnetosomechain structure led cultures of magnetotactic bacteria toproduce FMR spectra with multiple derivative maxima,A<1 and geff<2.12 (the true g-factor for magnetite). Ourresults support these claims: our bacterial samples withintact chains had multiple maxima, A≤0.84 andgeff = 2.02. With two exceptions, our sedimentarysamples in which magnetofossils are believed to be amajor carrier of magnetization had A≤0.97 andgeff≤2.11 (Fig. 6A; Tables 1 and 4), although not allhad multiple maxima. Yet while A≤1 and geff≤2.12may be necessary conditions for a FMR spectrum to be aspectrum of magnetofossils, they are not sufficient. Wewere able to produce abiogenic samples with A≤0.87and geff≤2.11 by dispersing magnetite in a non-magnetic matrix, thus causing the crystals to string outin minimum energy head-to-tail configurations (Table3). This finding strengthens the claim that A≤1 andgeff≤2.12 reflect linear arrangements of crystals, butindicates that these criteria alone cannot uniquelyidentify magnetofossils.
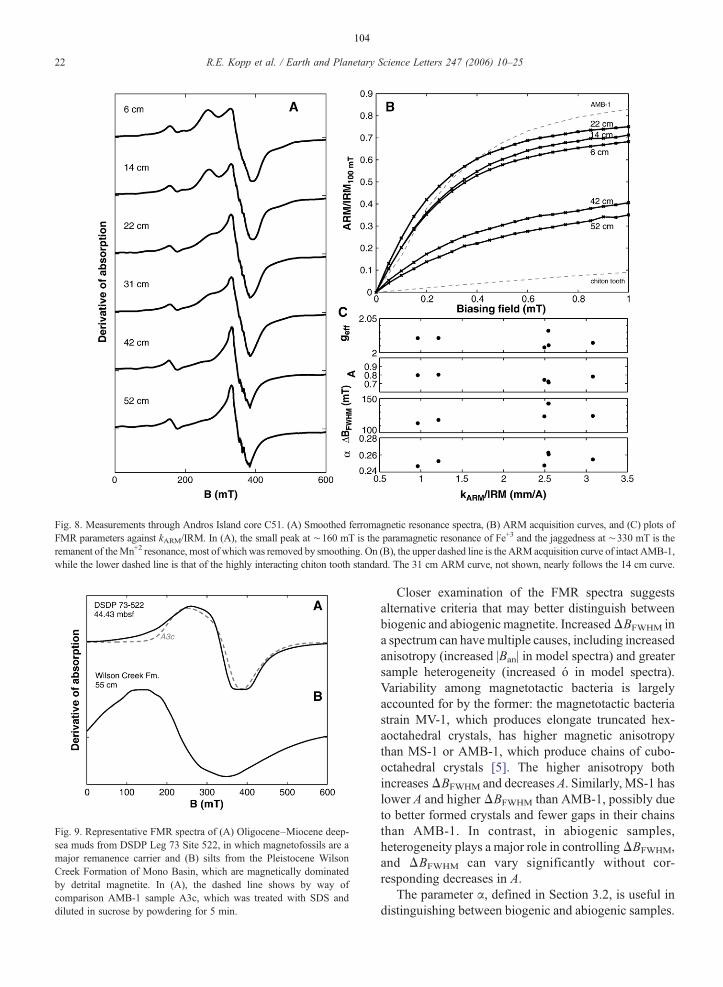
Fig. 8. Measurements through Andros Island core C51. (A) Smoothed ferromagnetic resonance spectra, (B) ARM acquisition curves, and (C) plots ofFMR parameters against kARM/IRM. In (A), the small peak at ∼160 mT is the paramagnetic resonance of Fe+3 and the jaggedness at ∼330 mT is theremanent of theMn+2 resonance, most of whichwas removed by smoothing. On (B), the upper dashed line is the ARMacquisition curve of intact AMB-1,while the lower dashed line is that of the highly interacting chiton tooth standard. The 31 cm ARM curve, not shown, nearly follows the 14 cm curve.
Fig. 9. Representative FMR spectra of (A) Oligocene–Miocene deep-sea muds from DSDP Leg 73 Site 522, in which magnetofossils are amajor remanence carrier and (B) silts from the Pleistocene WilsonCreek Formation of Mono Basin, which are magnetically dominatedby detrital magnetite. In (A), the dashed line shows by way ofcomparison AMB-1 sample A3c, which was treated with SDS anddiluted in sucrose by powdering for 5 min.
22 R.E. Kopp et al. / Earth and Planetary Science Letters 247 (2006) 10–25
104
Closer examination of the FMR spectra suggestsalternative criteria that may better distinguish betweenbiogenic and abiogenic magnetite. IncreasedΔBFWHM ina spectrum can havemultiple causes, including increasedanisotropy (increased |Ban| in model spectra) and greatersample heterogeneity (increased ó in model spectra).Variability among magnetotactic bacteria is largelyaccounted for by the former: the magnetotactic bacteriastrain MV-1, which produces elongate truncated hex-aoctahedral crystals, has higher magnetic anisotropythan MS-1 or AMB-1, which produce chains of cubo-octahedral crystals [5]. The higher anisotropy bothincreasesΔBFWHM and decreases A. Similarly, MS-1 haslower A and higher ΔBFWHM than AMB-1, possibly dueto better formed crystals and fewer gaps in their chainsthan AMB-1. In contrast, in abiogenic samples,heterogeneity plays a major role in controllingΔBFWHM,and ΔBFWHM can vary significantly without cor-responding decreases in A.
The parameter α, defined in Section 3.2, is useful indistinguishing between biogenic and abiogenic samples.

23R.E. Kopp et al. / Earth and Planetary Science Letters 247 (2006) 10–25
105
All the bacterial samples with intact chains, includingmagnetotactic strains MV-1, MS-1 and MC-1 measuredby Weiss et al. [20], possess α<0.25, while almost allthe lithogenic samples from the Wilson Creek Forma-tion have α>0.40. With only two exceptions, the DSDPand Bahamian samples, as well as the most dispersedSDS-treated AMB-1, have α between 0.25 and 0.30.The most dispersed synthetic magnetite sample weproduced had α=0.34, and the trend from the mostconcentrated to the most dilute falls roughly upon astraight line in ΔBFWHM vs. A space.
Although α is an empirical parameter, it serves as aproxy for the physically meaningful Gaussian linewidthσ. In the domain of parameter space occupied bymagnetotactic bacteria and magnetofossils, α of syn-thetic spectra varies almost linearly with σ, and for mostvalues of Ban, α increases monotonically as σ increases(Fig. 10). The intact magnetotactic bacteria have nearlyconstant α values, which suggests that the differencesamong their spectra are predominantly caused byvariations of Ban. The Ban and σ parameters obtainedby fitting the bacterial and synthetic samples (Tables 1and 2) support this hypothesis; the intact and ultra-sonicated AMB-1 have σ≈30 mT, while SDS-treatedAMB-1 have σ≈50 mT and the synthetic magnetitepowders have σ≥64 mT. We propose that α<0.30suggests the presence of magnetofossils, with lower αvalues reflecting more intact chains.
At the moment, the data are not strong enough tosupport firm claims about the presence or absence ofbiogenic magnetite based on ferromagnetic resonance
Fig. 10. The factor α for model spectra. α is plotted for syntheticspectra with first-order uniaxial anisotropy specified by Ban. Contourlines show values of σ ranging from 20 mT to 120 mT in 10 mT steps.In the region occupied by measured magneotactic bacteria andmagnetofossil-bearing samples (Ban≥75 mT, α<0.30), α varies nearlylinearly with σ.
spectra alone, except perhaps in the case of bacteria thathave undergone minimal diagenetic alteration. None-theless, FMR provides a useful guide in the search formagnetofossils, and in sediments in which biogenicmagnetite is known to be a major contributor tomagnetization, FMR allows rapid assessment of thedegree to which the magnetite chains have beendisrupted. Its speed may also make it a useful tool inunmixing the magnetic components of sediments,although further work in this area is needed. Further-more, as TEM of sedimentary biogenic magnetiterequires the extraction of magnetite from the sediments,FMR provides the only known technique for detectingthe presence of linear arrangements of magnetitecrystals in situ.
6. Conclusions
1. Linear arrangements of magnetite crystals generallyyield FMR spectra with geff<2.12 and A<1. To date,all intact magnetosome chains and almost allsedimentary samples believed to have a significantmagnetofossil component fall within this domain, asdo physically generated magnetite strings producedby dilution of lysed bacterial magnetite or syntheticmagnetite.
2. Intact, biogenic magnetite chains yield derivativespectra with multiple low-field local maxima becausetheir constituent particles experience fairly uniformmagnetic anisotropy. Physically generated magnetitestrings, which have more heterogeneous magneticanisotropy, do not exhibit multiple local maxima.
3. Among the magnetotactic bacteria, greater crystalanisotropy produces both higher ΔBFWHM and lowerA. MV-1, which produces chains of elongatetruncated hexa-octahedral crystals, and MS-1 andAMB-1, which produce chains of cubo-octahedralcrystals, have nearly identical values of α=0.17A+9.8×10⁻⁴ ΔBFWHM/mT, which is an empiricalproxy for symmetric spectral broadening causedby factors such as sample heterogeneity. Allmagnetotactic bacteria measured have α<0.25,while almost all sedimentary samples believed tocontain significant biogenic magnetite have αbetween 0.25 and 0.30. We suggest that, in samplescontaining magnetofossils, increasing α reflects alower magnetofossil content and/or increased dia-genetic alteration.
4. FMR provides a powerful tool for searching forsamples likely to contain magnetofossils and forassessing the degree of alteration of magnetofossilsin samples known to contain them.

24 R.E. Kopp et al. / Earth and Planetary Science Letters 247 (2006) 10–25
106
Acknowledgements
We thank J. Grotzinger for access to the Bahamiansamples, J. Ewing for field assistance in the Bahamas,G. Rossman, S. Kim, T. Raub, and two anonymousreviewers for helpful discussion, B. Brunschweig and A.Di Bilio for technical assistance with the MPMS andEPR spectrometer, respectively, and the BeckmanInstitute for funding the use of the MPMS. REK wassupported by a NSF Graduate Research Fellowship anda Moore Foundation Fellowship, BPW by the NASAMars Fundamental Research and NSF GeophysicsPrograms, ACM and CZN by the Agouron Institute,HV by the Natural Sciences and Engineering ResearchCouncil of Canada, and JLK by NASA Exobiologygrant NAG5-10618 and the NASA AstrobiologyInstitute.
References
[1] R.E. Kopp, C.Z. Nash, J.L. Kirschvink, J.R. Leadbetter, Apossible magnetite/maghemite electrochemical battery in themagnetotactic bacteria, Eos 85 (2004) (Abst. GP34A-06).
[2] S.L. Simmons, D.A. Bazylinski, K.J. Edwards, South-seekingmagnetotactic bacteria in the northern hemisphere, Science 311(2006) 371–374.
[3] J.L. Kirschvink, South-seeking magnetic bacteria, J. Exp. Biol.86 (1980) 345–347.
[4] S.B.R. Chang, J.L. Kirschvink, Magnetofossils, the magnetiza-tion of sediments, and the evolution of magnetite biomineraliza-tion, Annu. Rev. Earth Planet. Sci. 17 (1989) 169–195.
[5] D.A. Bazylinski, B.M. Moskowitz, Microbial biomineralizationof magnetic iron minerals: Microbiology, magnetism andenvironmental significance, Geomicrobiology: interactions be-tween microbes and minerals, Rev. Miner. 35 (1997) 181–223.
[6] K.L. Thomas-Keprta, D.A. Bazylinski, J.L. Kirschvink, S.J.Clemett, D.S. McKay, S.J. Wentworth, H. Vali, E.K. Gibson, C.S.Romanek, Elongated prismatic magnetite crystals in ALH84001carbonate globules: potential Martian magnetofossils, Geochim.Cosmochim. Acta 64 (2000) 4049–4081.
[7] A.P. Taylor, J.C. Barry, R.I. Webb, Structural and morphologicalanomalies in magnetosomes: possible biogenic origin formagnetite in ALH84001, J. Microsc. 201 (2001) 84–106.
[8] J.L. Kirschvink, A seventh criterion for the identification ofbacterial magnetofossils, Eos 82 (2001) S131.
[9] A. Witt, K. Fabian, U. Bleil, Three-dimensional micromagneticcalculations for naturally shaped magnetite: octahedra andmagnetosomes, Earth Planet. Sci. Lett. 233 (2005) 311–324.
[10] T. Yamazaki, H. Kawahata, Organic carbon flux controls themorphology of magnetofossils in marine sediments, Geology 26(1998) 1064–1066.
[11] R. Egli, Characterization of individual rock magnetic componentsby analysis of remanence curves: 3. Bacterial magnetite andnatural processes in lakes, Phys. Chem. Earth 29 (2004) 869–884.
[12] P. Montgomery, E.A. Hailwood, A.S. Gale, J.A. Burnett, Themagnetostratigraphy of Coniacian late Campanian chalksequences in southern England, Earth Planet Sci. Lett. 156(1998) 209–224.
[13] S.B.R. Chang, J.F. Stolz, J.L. Kirschvink, S.M. Awramik,Biogenic magnetite in stromatolites: 2. Occurrence In ancientsedimentary environments, Precambrian Res. 43 (1989)305–315.
[14] R. Egli, Analysis of the field dependence of remanentmagnetization curves, J. Geophys. Res. 108 (2003).
[15] R. Egli, Characterization of individual rock magnetic compo-nents by analysis of remanence curves: 1. Unmixing naturalsediments, Stud. Geophys. Geod. 48 (2004) 391–446.
[16] B.M. Moskowitz, R.B. Frankel, D.A. Bazylinski, Rock magneticcriteria for the detection of biogenic magnetite, Earth Planet. Sci.Lett. 120 (1993) 283–300.
[17] C. Kittel, On the theory of ferromagnetic resonance absorption,Phys. Rev. 73 (1948) 155–161.
[18] E. Schlömann, Ferromagnetic resonance in polycrystal ferriteswith large anisotropy: general theory and application to cubicmaterials with a negative anisotropy constant, J. Phys. Chem.Solids 6 (1958) 257–266.
[19] A.H. Morrish, The Physical Principles of Magnetism, J. Wiley,New York, 1965.
[20] B.P. Weiss, S.S. Kim, J.L. Kirschvink, R.E. Kopp, M. Sankaran,A. Kobayashi, A. Komeili, Ferromagnetic resonance and lowtemperature magnetic tests for biogenic magnetite, Earth Planet.Sci. Lett. 224 (2004) 73–89.
[21] G. Calas, Electron paramagnetic resonance, Rev. Miner. 18(1988) 513–571.
[22] L.R. Bickford Jr., Ferromagnetic resonance absorption inmagnetite single crystals, Phys. Rev. 78 (1950) 449–457.
[23] A. Komeili, H. Vali, T.J. Beveridge, D.K. Newman, Magneto-some vesicles are present before magnetite formation, andMamA is required for their activation, Proc. Natl. Acad. Sci.U. S.A. 101 (2004) 3839–3844.
[24] Y.A. Gorby, T.J. Beveridge, R.P. Blakemore, Characterization ofthe bacterial magnetosome membrane, J. Bacteriol. 170 (1988)834–841.
[25] A. Kobayashi, J.L. Kirschvink, C.Z. Nash, R.E. Kopp, D.A.Sauer, L.E. Bertani, W.F. Voorhout, T. Taguchi, Experimentalobservation of magnetosome chain collapse in magnetotacticbacteria: sedimentological, paleomagnetic, and evolutionaryimplications, Earth Planet. Sci. Lett. 245 (2006) 538–550.
[26] A.P. Philipse, D. Maas, Magnetic colloids from magnetotacticbacteria: chain formation and colloidal stability, Langmuir 18(2002) 9977–9984.
[27] L.A. Hardie, Sedimentation on the Modern Carbonate Tidal Flatsof Northwest Andros Island, Bahamas, Johns Hopkins UniversityPress, Baltimore, 1977, 202 pp.
[28] K.J. Hsü, J.L. LaBrecque, M.F. Carman, A.M. Gombos, A.Karpoff, J.A. McKenzie, S.F. Percival, N.P. Petersen, K.A.Pisciotto, R.Z. Poore, E. Schreiber, L. Tauxe, P. Tucker, H.J.Weissert, Initial Reports of the Deep Sea Drilling Project, vol.73, U.S. Govt. Printing Office, Washington, 1984, 798 pp.
[29] H. Vali, J.L. Kirschvink, Magnetofossil dissolution in apaleomagnetically unstable deep-sea sediment, Nature 339(1989) 203–206.
[30] C.R. Denham, A. Cox, Evidence that the Laschamp polarityevent did not occur 13,300–30,400 years ago, Earth Planet. Sci.Lett. 13 (1971) 181–190.
[31] R. Egli, W. Lowrie, Anhysteretic remanent magnetization of finemagnetic particles, J. Geophys. Res. 107 (2002).
[32] S. Cisowski, Interacting vs. non-interacting single-domainbehavior in natural and synthetic samples, Phys. Earth Planet.Inter. 26 (1981) 56–62.

25R.E. Kopp et al. / Earth and Planetary Science Letters 247 (2006) 10–25
107
[33] E.S. Keeping, Introduction to Statistical Inference, Dover, NewYork, 1995, 451 pp.
[34] D.L. Griscom, Ferromagnetic resonance spectra of lunar fines:some implications of line shape analysis, Geochim. Cosmochim.Acta 38 (1974) 1509–1519.
[35] D.L. Griscom, Ferromagnetic resonance condition and powderpattern analysis for dilute, spherical, single-domain particles ofcubic crystal structure, J. Magn. Res. 45 (1981) 81–87.
[36] L.E. Drain, The broadening of magnetic resonance lines due tofield inhomogeneities in powdered samples, Proc. Phys. Soc. 80(1962) 1380–1382.
[37] U. Zeile, Fundamentals of cryo preparation and replicatechnique, 7th Asia-Pacific Electron Microscopy Conference,Singapore, 2000, pp. 342–357.
[38] R.F. Butler, S.K. Banerjee, Theoretical single-domain grain sizerange in magnetite and titanomagnetite, J. Geophys. Res. 80(1975) 4049–4058.
[39] J.C. Diaz Ricci, J.L. Kirschvink, Magnetic domain state andcoercivity predictions for biogenic greigite (Fe3S4): a compari-
sion of theory with magnetosome observations, Geophys. J. Res.97 (1992) 17309–17315.
[40] A.R. Muxworthy, E. McClellan, Review of the low-temperaturemagnetic properties of magnetite from a rock magneticperspective, Geophys. J. Int. 140 (2000) 101–114.
[41] K. Abe, Y. Miyamoto, S. Chikazumi, Magnetocrystallineanisotropy of low-temperature phase of magnetite, J. Phys.Soc. Jpn. 41 (1976) 1894–1902.
[42] J.G. King, W. Williams, Low-temperature magnetic properties ofmagnetite, J. Geophys. Res. 105 (2000) 16427–16436.
[43] D.F. McNeill, Biogenic magnetite from surface Holocenecarbonate sediments, Great Bahama Bank, J. Geophys. Res. 95(1990) 4363–4371.
[44] D.F. McNeill, R.N. Ginsburg, S.B.R. Chang, J.L. Kirschvink,Magnetostratigraphic dating of shallow-water carbonates fromSan-Salvador, Bahamas, Geology 16 (1988) 8–12.
[45] D.F. McNeill, J.L. Kirschvink, Early dolomitization of platformcarbonates and the preservation of magnetic polarity, J. Geophys.Res. 98 (1993) 7977–7986.

The Paleoproterozoic snowball Earth: A climate disastertriggered by the evolution of oxygenic photosynthesisRobert E. Kopp*, Joseph L. Kirschvink, Isaac A. Hilburn, and Cody Z. NashDivision of Geological and Planetary Sciences, California Institute of Technology 170-25, Pasadena, CA 91125
Communicated by Paul F. Hoffman, Harvard University, Cambridge, MA, June 14, 2005 (received for review April 8, 2004)
Although biomarker, trace element, and isotopic evidence have been used to claim that oxygenic photosynthesis evolved by 2.8giga-annum before present (Ga) and perhaps as early as 3.7 Ga, a skeptical examination raises considerable doubt about the pres-ence of oxygen producers at these times. Geological features suggestive of oxygen, such as red beds, lateritic paleosols, and the re-turn of sedimentary sulfate deposits after a �900-million year hiatus, occur shortly before the �2.3–2.2 Ga Makganyene ‘‘snowballEarth’’ (global glaciation). The massive deposition of Mn, which has a high redox potential, practically requires the presence of envi-ronmental oxygen after the snowball. New age constraints from the Transvaal Supergroup of South Africa suggest that all three gla-ciations in the Huronian Supergroup of Canada predate the Snowball event. A simple cyanobacterial growth model incorporating therange of C, Fe, and P fluxes expected during a partial glaciation in an anoxic world with high-Fe oceans indicates that oxygenic pho-tosynthesis could have destroyed a methane greenhouse and triggered a snowball event on timescales as short as 1 million years. Asthe geological evidence requiring oxygen does not appear during the Pongola glaciation at 2.9 Ga or during the Huronian glacia-tions, we argue that oxygenic cyanobacteria evolved and radiated shortly before the Makganyene snowball.
oxygen � Makganyene glaciation � Huronian glaciations � cyanobacteria
After the rise of life itself, themost radical transformation ofEarth’s biogeochemical cyclesoccurred in the transition from
an anoxic to an oxic world. This trans-formation took place in three phases.First, oxygenic photosynthesis evolvedand brought into the world locally oxicenvironments. Second, oxygen became amajor component of the atmosphere;some authors (1, 2) have suggested thatthis period was a protracted phase dur-ing which the ocean became euxinic.Finally, the whole ocean–atmospheresystem took on its modern oxygen-dominated cast.
Although the timing of and relation-ship between the three stages have beentopics of active research for many de-cades, there is still a wide divergence ofopinion. Evidence from organic biomar-kers (3–5) and arguments concerningtrace element mobility (6) and biologicalproductivity (7) have convinced manythat O2-generating cyanobacteria andaerobic eukaryotes evolved no later than�2.78 giga-annum before present (Ga)and perhaps as long ago as 3.7 Ga.Meanwhile, the developing record ofmass-independent fractionation (MIF)of sulfur isotopes in the sedimentaryrecord, as well as some other geochemicaltracers, has been interpreted as supportinga protracted atmospheric oxygenationover the period of �2.5–2.2 Ga (8).
An early origin for oxygenic photosyn-thesis demands an explanation of howsurface oxidation was muted for perhapsas long as 1,500 million years (My), untilcyanobacteria finally surmounted somegeochemical, environmental, or ecologicalbarrier and successfully oxidized theplanet. Perhaps this scenario is correct,
and some abiotic change, such as thelong-term escape of hydrogen to space(9), was the direct cause of planetary oxy-genation. We suggest, however, that thedata are also consistent with scenarioswithout oxygenic photosynthesis in theArchean. Herein we discuss an alternatehypothesis, one in which the evolution ofcyanobacteria destroyed a methane green-house and thereby directly and rapidlytriggered a planetary-scale glaciation, the�2.3–2.2 Ga Makganeyene ‘‘snowballEarth.’’
Geological SettingThe earliest evidence for glaciation comesfrom the late Archean and early Protero-zoic, which suggests Earth at this timeexperienced global temperatures not muchdifferent from those today. The oldestknown midlatitude glaciation, recorded inthe Pongola Supergroup diamictite, oc-curred at 2.9 Ga (10). The period from2.45 Ga until some point before 2.22 Gasaw a series of three glaciations recordedin the Huronian Supergroup of Canada(11) (Fig. 1). The final glaciation in theHuronian, the Gowganda, is overlain byseveral kilometers of sediments in theLorrain, Gordon Lake, and Bar Riverformations (Fms.). The entire sequence ispenetrated by the 2.22 Ga Nipissing dia-base (12); the Gowganda Fm. is thereforesignificantly older than 2.22 Ga.
In its eastern domain, the TransvaalSupergroup of South Africa contains twoglacial diamictites, in the Duitschland andBoshoek Fms. The base of the TimeballHill Fm., which underlies the BoshoekFm., has a Re-Os date of 2,316 � 7 Myago (13). The Boshoek Fm. correlateswith the Makganyene diamictite in thewestern domain of the Transvaal Basin,
the Griqualand West region. The Makg-anyene diamictite interfingers with theoverlying Ongeluk flood basalts, whichare correlative to the Hekpoort volca-nics in the eastern domain and have apaleolatitude of 11° � 5° (14). In its up-per few meters, the Makganyene diamic-tite also contains basaltic andesite clasts,interpreted as being clasts of the Onge-luk volcanics. The low paleolatitude ofthe Ongeluk volcanics implies that theglaciation recorded in the Makganyeneand Boshoek Fms. was planetary in ex-tent: a snowball Earth event (15). Con-sistent with earlier whole-rock Pb–Pbmeasurements of the Ongeluk Fm. (16),the Hekpoort Fm. contains detrital zir-cons as young as 2,225 � 3 My ago (17),an age nearly identical to that of theNipissing diabase in the Huronian Su-pergroup. As the Makganyene glaciationbegins some time after 2.32 Ga andends at 2.22 Ga, the three Huronianglaciations predate the Makganyenesnowball.
In contrast to the Makganyene Fm.,the three Huronian diamictites are un-constrained in latitude. Poles from theMatachewan dyke swarm, at the base ofthe Huronian sequence, do indicate alatitude of �5.5° (18), but �2 km ofsedimentary deposits separate the baseof the Huronian from the first glacialunit (19), which makes it difficult todraw conclusions about the latitude ofthe glacial units based on these poles.
Abbreviations: Ga, giga-annum before present; My, millionyears; BIF, banded iron formation; Fm., formation; MIF,mass-independent fractionation.
*To whom correspondence should be addressed. E-mail:[email protected].
© 2005 by The National Academy of Sciences of the USA
www.pnas.org�cgi�doi�10.1073�pnas.0504878102 PNAS � August 9, 2005 � vol. 102 � no. 32 � 11131–11136
PE
RS
PE
CT
IVE
108

Low latitude poles in the Lorrain Fm.(20, 21), which conformably overlies theGowganda diamictite, are postdeposi-tional overprints (22).
MIF of SulfurThe recent discovery of MIF of S iso-topes in Archean and early Proterozoicrocks has provided a major constrainton atmospheric O2. Large MIF of S (upto several hundred permil) is producedby photolysis of SO2 to S by light ofwavelengths of �200 nm, which wouldhave been unable to penetrate to thelower atmosphere had O2 levels beenabove a few percent of the present at-mospheric level (23). To preserve MIF,multiple atmospheric S species must bemaintained as partially isolated reser-voirs rather than being homogenized byoxidation of reduced species like hydro-gen sulfide and polysulfur, as would oc-cur at greater than �10�5 present atmo-spheric level O2 (24). Mixing anddilution of the atmospherically fraction-ated component, both in the atmosphereand in the oceans, presumably yields theobserved Archean MIF values of up to�10‰ (25). An active oceanic S cycle,as would exist at moderately high O2levels, also would likely prevent thepreservation of MIF.
Before the deposition of the �2.32Ga Rooihogite and Timeball Hill Fms.in the Transvaal Supergroup (13, 26)
and the McKim Fm. in the HuronianSupergroup,† sedimentary sulfides oftendisplay MIF (8, 26, 27) over an order ofmagnitude larger than the largest valuesobserved in modern sulfate aerosols (25,28). One plausible interpretation of thediminished MIF observed in the Roo-ihogite, Timeball Hill, and McKim Fms.is a rise in atmospheric O2. At present,only glaciers record the MIF sometimespresent in sulfate aerosols; in the marineenvironment, with riverine input compos-ing �90% of sulfate input and aerosolscomposing �10%, MIF is not preserved(25). The small range of MIF could re-flect an environment in which atmo-spheric chemistry began to approachmodern conditions, decreasing the mag-nitude of MIF, but in which aerosolsformed the major component of marinesulfate input, allowing its preservation.
The small range of MIF also permitsan opposite interpretation. Rather thana decrease in atmospheric fractionation,the diminution could be a product ofincreased continental input and ocean�atmosphere mixing driven by glacialconditions. The period of 2.5–2.2 Gawas a time of glaciations. Enhanced gla-cial weathering could have made unfrac-tionated S from igneous sources a larger
part of the marine S budget, whereassharper thermal gradients would havedriven homogenization of the S pool.Both effects would have decreased sedi-mentary MIF. If this interpretation iscorrect, only the final decrease of MIFafter �2.09 Ga may reflect the rise ofatmospheric O2, and the oxygenationevent may have been more rapid thanthe length of Farquhar and Wing’s (8)MIF Stage II (2.45–2.09 Ga) indicates.
Appearance of Local O2
Both the Huronian and the TransvaalSupergroups contain features suggestiveof, but not demanding, the first appear-ance of O2 in the period between theGowganda and Makganyene glaciations.As noted in ref. 8, MIF in the Huronianrocks examined so far is at diminishedvalues compatible with either increasedatmospheric O2 or enhanced glacialweathering and ocean�atmosphere mix-ing. The Lorrain Fm. contains red beds,as well as a hematitic paleosol at Ville-Marie, Quebec, and the Bar River Fm.contains pseudomorphs after gypsum,consistent with an increase in sulfatelevels from oxidative weathering of sul-fide minerals on land. In the TransvaalSupergroup, the upper Timeball HillFm., like the Lorrain Fm., contains redbeds.
Stronger evidence for O2 appears af-ter the Makganyene glaciation. The On-geluk Fm. is overlain by the HotazelFm., which consists predominantly ofbanded iron formation (BIF). The basalhalf meter of the Hotazel Fm. containsdropstones (29) (see Supporting Text,which is published as supporting infor-mation on the PNAS web site), whichsuggests it was deposited toward the endof the glacial period. The Hotazel Fm.hosts a massive Mn member (29): ablanket of Mn deposition unmatched byany other known in the world, �50 mthick and with an erosional remnant, theKalahari Mn Field, measuring �11 � 50km in extent (30).
The Kalahari Mn Field indicates therelease of large quantities of O2 into theocean and therefore suggests a highlyactive postglacial aerobic biosphere. Inseawater at circumneutral pH, onlyNO3
� and O2 can chemically oxidizesoluble Mn2� to produce insolubleMn(IV) (31) (Table 1). Although aMn2� oxidizing phototroph also couldproduce Mn(IV), no such organism hasever been identified. Given the high re-dox potential of the Mn(IV)�Mn(II)couplet, it is likely that no such organ-ism exists. The unexcited P870 reactioncenter in purple bacteria has a redoxpotential too low to accept electronsfrom Mn(II) (Table 1), but no knownphotosystem reaction center aside from
†Wing, B. A., Brabson, E., Farquhar, J., Kaufman, A. J.,Rumble, D., III, & Bekker, A. (2002) Geochim. Cosmochim.Acta 68, A840 (abstr.).
Fig. 1. Proposed correlation of the Huronian Supergroup and the upper Transvaal Supergroup. Thethree Huronian glacial units, penetrated and capped by the Nipissing diabase, predate the Makganyenediamictite in the Transvaal. The uppermost Huronian glacial unit, the Gowganda Fm., is overlain byhematitic units, perhaps reflecting a rise in O2. The basal Timeball Hill Fm. contains pyrite with minimal MIF(26), whereas the upper Timeball Hill Fm., which we suggest is correlative to the Lorrain or Bar River Fms.,contains red beds. The Makganyene diamictite records a low-latitude, snowball glaciation (29), perhapstriggered by the destruction of a CH4 greenhouse. It is overlain by the Kalahari Mn Field in the Hotazel Fm.,the deposition of which requires free O2. Transvaal stratigraphy is based on ref. 17; Huronian stratigraphyis based on ref. 19.
11132 � www.pnas.org�cgi�doi�10.1073�pnas.0504878102 Kopp et al.
109

the P670 reaction center of photosystemII has a higher redox potential. Photo-synthetic reduction of Mn(IV) thereforewould likely require a two-part photo-system akin to that involved in oxygenicphotosynthesis.
One plausible interpretation of thesequence of events leading up to thePaleoproterozoic snowball Earth isshown in Fig. 1 and is as follows.
1. Three glaciogenic units were depos-ited in the Huronian. The extent ofthe glaciations is not constrained, butthey generally lack the lithographicfeatures associated with snowballEarths, such as a sharp transitionfrom a diamictite to a cap carbonate(32). Although the Espanola carbon-ate (33) could be a cap for the Bruceglaciation, without paleomagneticdata or additional lithographic fea-tures, its presence alone is insuffi-cient to conclude that the Bruceglaciation was a snowball event.
2. Some of the earliest continental redbeds were deposited in the Firstbrookmember of the Gowganda Fm. and inthe Lorrain and Bar River Fms. inCanada, as well as in the upperTimeball Hill Fm. in South Africa.The basal Timeball Hill Fm. has re-cently been dated at 2,316 � 7 Myago (13). In our proposed correla-tion, all of the red bed-bearing unitswere deposited after the last Huro-nian glaciation and before the Makg-anyene glaciation. The formation ofthe red beds could involve local O2,although it does not demand it (34).Syngenetic pyrite from the basal
Timeball Hall Fm. shows only slightMIF of S (26), consistent with theinitiation of planetary oxygenation orenhanced glacial activity.
3. The low-latitude glaciation thatformed the Makganyene andBoshoek diamictites (14) was initi-ated when the production of O2 trig-gered the collapse of a methanegreenhouse. Although Pavlov et al.(35) proposed a similar trigger, theyassumed a delay of at least �400 Mybetween the onset of oxygenic photo-synthesis and its surficial expression.We suggest a more immediate linkage.
4. The Nipissing diabase intruded intothe Huronian sequence (36), andthe Ongeluk and Hekpoort volcanicswere deposited (16).
5. The Hotazel Fm., which includes BIFand Mn members, was deposited inoxygenated waters in the aftermathof the snowball.
6. The upper siderite facies of the Ho-tazel Fm. and perhaps also part ofthe overlying Mooidrai dolomite weredeposited as cap carbonates in theprocess of removing CO2 from athick postsnowball greenhouse (29).
Timescale for Methane GreenhouseCollapseFor cyanobacteria to be directly responsi-ble for triggering a planetary glaciation,they must have been able to produceenough O2 to destroy the methane green-house before the carbonate–silicateweathering cycle could compensate. Onsufficiently long timescales, global coolingwould slow silicate weathering and car-bonate precipitation, thereby allowingCO2 to build up in the atmosphere (37).The response time of the carbonate–silicate weathering cycle is generally esti-mated at �1 My (38), although the timeto replace the greenhouse capacity lost ina methane greenhouse collapse may belonger. To estimate the timescale for de-struction of the methane greenhouse, weconstructed a steady-state ocean biogeo-chemistry model based on the assump-tions that biological productivity was con-trolled by P and N and that Fe(II)oxidation was the main inorganic O2 sink(see Supporting Text).
The critical P�Fe flux ratio for netoxidation of the surface ocean increaseswith the burial rate of C (see Fig. 2a,which is published as supporting infor-mation on the PNAS web site). For a Pflux similar to today’s value of �8 �1010 mol�y (39) and a burial fraction of2 � 10�2, similar to modern anoxic en-vironments, the model results indicatethat the critical value is �1�50. The cur-rent ratio of P flux to hydrothermal Feflux is �1�2, whereas the ratio of P fluxto hydrothermal and terrigenous Fe flux
is �1�64 (1). Rare earth element pat-terns of BIFs (40) and the stability ofterrestrial ferrous sulfides in an anoxicatmosphere suggest that the main sourceof reactive Fe in the Archean was hy-drothermal, so the P�Fe ratio may havebeen closer to 1�2 than 1�64.
When the P�Fe ratio falls below thecritical value, essentially all O2 producedis captured by Fe2�. Above the criticalP�Fe value, there is a net release of O2(Fig. 2a). Other dissolved O2 sinks, suchas Mn2�, H2, and CH4, will consumesome O2, but hydrothermal fluxes ofthese reductants are up to an order ofmagnitude less than the flux of Fe2�
(41). At today’s levels, these are capableof consuming �7 � 1010 mol of O2 pery, equivalent to 4 � 10�10 bar�y. Al-though the flux of H2S from vent fluidsin today’s high sulfate oceans is compa-rable to that of Fe2�, in an ocean whereFe2� is the main electron donor, H2Slevels would be lower. A formaldehyderainout flux of �1012 mol�y (24) wouldbe the largest O2 sink, capable of ad-sorbing �6 � 10�9 bar of O2 per y, butwould be nullified by H2O2 rainout onceeven a small amount of O2 accumulatedin the atmosphere. O2 production in ex-cess of �6 � 10�9 bar�y (1 bar � 100kPa) would therefore be sufficient toinitiate CH4 oxidation, and, once begun,net O2 production in excess of �4 �10�10 bar�y would suffice to continue it.At the rates predicted by our model,destruction of a 1-mbar methane green-house, if it occurred at all, would likelyoccur within a few My, a timescale com-parable with the carbonate–silicateweathering cycle. Therefore, either cya-nobacteria did not evolve until shortlybefore the oxygenation event, or thenutrient flux did not reach sufficientlyhigh levels at any point after the evolu-tion of cyanobacteria until then.
If cyanobacteria were present duringthe Huronian glaciations, the increasedP flux into the oceans generated by gla-cial weathering (42) should have trig-gered the oxygenation event. Instead,the oxygenation event seems to corre-late with the later Makganyene glacia-tion; this finding suggests the evolutionof cyanobacteria occurred in the intervalbetween the Huronian glaciations andthe Makganyene glaciation.
Whether N limitation could have de-layed the destruction of a methane green-house‡ depends on the Fe demand of theN2 fixers and the ability of cyanobacteriato capture Fe before it reacted with O2and sank beneath the photic zone as aferric precipitate. With anoxic deep waters
‡Falkowski, P. G., Follows, M. & Fennel, K. (2003) EOS Trans.Am. Geophys. Union 84, Suppl., abstr. U52C-01.
Table 1. Midpoint potentials of relevantredox couplets
Redox couplet
E, mV
pH 7 pH 8
CO2�CH4*† �230 �289SO4
2��HS�‡ �217 �284Fe(OH)3 (ferrihydrite)�Fe2�‡ �5 �183UO2(CO3)2
2��UO2 (uraninite)
� CO2*§
�18 �137
NO3��NH4
�‡ �366 �292P870�P870
� (purple bacteria) ��450MnO2 (pyrolusite)�Mn2�‡ �490 �372NO3
��N2‡ �717 �646
O2�H2O �815 �756P680�P680
�
(Photosystem II)��1,100
All reactants not specifically noted are at stan-dard state. Thermodynamic constants are fromrefs. 76 and 77. Photosystem potentials are fromref. 78.*Calculated for pCO2 � 100 mbar.†Calculated for pCH4 � 1 mbar.‡Calculated with all aqueous reactants at 1 mM.§Calculated with dissolved U species at 20 nM.
Kopp et al. PNAS � August 9, 2005 � vol. 102 � no. 32 � 11133
110

providing a large source of Fe to the pho-tic zone, life for an early Proterozoic dia-zotroph would have been easier than formodern diazotrophs that must subsist offof Fe transported from the continents.C�Fe ratios in N2-fixing populations ofTrichodesmium range from �2,000 to50,000 (43). If early cyanobacteria wereinefficient at both capturing and using Fe(e.g., C�Fe � 2,000; capture efficiency �1%), then N limitation could have pro-tected the methane greenhouse, but undermore optimistic assumptions (either ahigher capture efficiency or a higher C�Feratio), it would not have done so (Fig. 2b).The geologic record, not computationalmodels, must ultimately decide.
Implications of the Possible LateEvolution of CyanobacteriaThe interpretation presented here sug-gests that planetary oxygenation beganin the interval between the end of theHuronian glaciations and the onset ofthe Makganyene glaciation and that thePaleoproterozoic snowball Earth was thedirect result of a radical change in thebiosphere. In the Archean and earliestProterozoic oceans, life may have beenfueled predominantly by Fe, with Fe(II)used as the electron donor for photosyn-thesis and Fe(III) as the main electronacceptor for respiration. The sedimentstherefore would be moderately oxidizingand the surface waters reduced (34).Because the redox potential for Mn2�
oxidation is much higher than that ofFe2�, Mn would have to be removedfrom the oceans in reduced form. Thecarbonates precipitated at this time con-tain up to �2% Mn (30), indicating thatMn2� reached shallow waters and copre-cipitated with Ca�2; oxidized Mn is ex-tremely rare. The atmosphere was likelyreducing. Astrophysical models predictthe Sun was substantially dimmer thantoday, but a CH4 greenhouse (44) pro-duced by methanogens living in a re-duced upper ocean would have kept theplanet warm enough to allow for thepresence of liquid water without leadingto massive siderite precipitation (45).
This world would have been over-thrown when cyanobacteria capable ofoxygenic photosynthesis evolved, whichmolecular phylogenies indicate occurredlater than the main bacterial radiation(46). The surface waters became oxidiz-ing and more productive. Reduced Caccumulated in the sediments; methano-genesis moved from the surface oceanto the deep ocean, where it was isolatedfrom the atmosphere. Methanotrophy inthe ocean and photochemistry in theatmosphere used O2 to transform atmo-spheric CH4 to CO2, a less effectivegreenhouse gas. The rise of O2 thusmight have triggered a glacial interval
without the �400 My delay assumed byothers (35).
Phosphate flux into the oceans corre-lates with increased continental weather-ing during glacial intervals (42), so in-creased continental weathering producedby the glaciations may have increased nu-trient availability above the threshold fornet O2 release into the atmosphere. Be-cause of the relatively low global tempera-ture, it would have taken only a trace ofOH radicals from the oxygenic bloomproduced when cyanobacteria appeared ina high-P ocean to damage the CH4 green-house enough to bring average globaltemperatures to �0°C. During the at least�35 My (29, 47) it took to build up a suf-ficient CO2 greenhouse to escape fromthe snowball, hydrothermal fluxes wouldhave built up a rich supply of nutrients inthe oceans. When the planet finallywarmed, the oceans were ripe for a cya-nobacterial bloom. The O2 produced bythe bloom cleared out tens of My worthof accumulated reductants and thus pro-duced the Kalahari Mn field (29).
Biomarker Counterevidence forArchean O2
Despite the parsimony of cyanobacterialevolution occurring within a few My be-fore the onset of the Paleoproterozoicsnowball Earth, some organic biomarkerevidence and indirect sedimentologicaland geochemical arguments have beenused to suggest that the origin of cya-nobacteria dates to far earlier times: atleast 2.78 Ga and maybe as long ago as3.7 Ga.
The critical piece of evidence placingthe origin of cyanobacteria and locallyoxic environments in the Archean is thediscovery in bitumens from rocks as oldas 2.78 Ga of organic biomarkers appar-ently derived from lipids used by cya-nobacteria and eukaryotes in their cellmembranes. Although Brocks et al. (48)concluded that the bitumens were likelysyngenetic, they could not exclude thepossibility that they were postdepositionalcontaminants. Even if the biomarkers areas old as their host rocks, however, theuniformitarian extrapolation of modernlipid distributions to the Archean shouldbe viewed cautiously.
Hopanes. Among modern organisms,2-methyl-bacteriohopanepolyol is pro-duced predominantly by cyanobacteriaand in trace quantities by methylotrophslike Methylobacterium organophilum(3). Hopanes derived from 2-methyl-bacteriohopanepolyol can be preservedin sedimentary rocks, where they havebeen used as tracers for cyanobacteria(3). Hopanol synthesis has traditionallybeen assumed, based on the understoodmodern distribution of hopanols, to oc-
cur only in aerobic organisms. Fischeret al. (79) recently demonstrated, how-ever, that Geobacter sulfurreducens cansynthesize diverse hopanols, althoughnot 2-methyl-hopanols, when grown un-der strictly anaerobic conditions. Thus,fossil hopanes do not necessarily implythe presence of O2-producing organisms,and nothing about 2-methyl-hopanolssuggests that they are any different inthis respect. Archean 2-methyl-hopanesalso might have been produced by an-cestral cyanobacteria that predated oxy-genic photosynthesis.
Steranes. Produced by eukaryotes for usein the cell membrane, sterols are pre-served in the rock record as steranes.Brocks et al. (4, 5) recovered steranes,along with 2-methyl-bacteriohopane-polyol, from 2.78 Ga Pilbara Cratonshales. Because there is no known an-aerobic sterol synthesis pathway, theyused their discovery to argue for thepresence of O2.
Cholesterol biosynthesis in modernorganisms is a long biochemical path-way that employs the following fourO2-dependent enzymes: (i) squaleneepoxidase, (ii) lanosterol 14-�-methyldemethylase cytochrome P450, (iii)sterol-4-�-methyl oxidase, and (iv) latho-sterol oxidase (49). These O2-dependentenzymes perform reactions that, al-though not currently known to occurbiochemically in anaerobic organisms,could feasibly occur without O2. More-over, the substitution of an O2-depen-dent enzyme for an anaerobic step in abiosynthetic pathway appears to be acommon evolutionary occurrence. Ray-mond and Blankenship (50) found that,of the 473 O2-dependent enzymaticallycatalyzed reactions in the BioCyc data-base (www.biocyc.org), 20 have at leastone O2-independent counterpart thatperforms the same reaction. For in-stance, AcsF catalyzes an O2-dependentcyclization step in the synthesis of chlo-rophyll and bacteriochlorophyll, a path-way that must have existed before theevolution of oxygenic photosynthesis.The O2-independent enzyme BchE per-forms the same reaction as AcsF butuses vitamin B12 in place of O2 (50).The assumption that sterol synthesis isalways O2-dependent and always hasbeen therefore merits close inspection.
Indeed, the Hamersley bitumens in-clude their own cautionary messageabout the application of uniformitarianassumptions to fossil lipids. Dinosteraneis generally accepted to be characteristicof dinoflagellates and is interpreted as adinoflagellate biomarker in Phanerozoicrocks (51). Yet even though an Archeanorigin for dinoflagellates seems implau-sible, because it would indicate the Ar-
11134 � www.pnas.org�cgi�doi�10.1073�pnas.0504878102 Kopp et al.
111

chean origin of modern eukaryoticgroup not known in the fossil recorduntil at least the Paleozoic (52), Brockset al. (5) found dinosterane. They inter-preted the molecule as being producedby eukaryotes of unknown affinities,although an alternative explanation isthat these modern-style putative Ar-chean biomarkers are contaminants.
Indirect Counterevidence for Archean O2
Although organic biomarkers may bedifficult to interpret, they are a signifi-cant improvement on several other geo-logical tracers that have been used toargue for the presence of cyanobacteriaand environmental O2, including micro-fossils, stromatolites, BIFs, and assortedisotopic fractionations.
Microfossils. Before 2 Ga, when diversi-fied assemblages with affinities to majorgroups of cyanobacteria first appear inthe fossil record, the microfossil recordis murky (53). Some have interpretedfilamentous forms in earlier rocks ascyanobacterial remains (54–56), butBrasier et al. (57) recently questionedthe biogenic nature of these objects.Moreover, cyanobacteria cannot beidentified solely by a filamentous form.Many nonoxygenic bacteria are also fila-mentous, including some mat-forminggreen nonsulfur and purple sulfur bacte-ria (58, 59) and a methanogenic archeon(60). The wide variety of filamentousprokaryotes highlights a problem inidentifying fossil microbes lacking clearevidence of cell differentiation based onmorphology: Any given form has proba-bly arisen many times in Earth history,both in extant and extinct organisms.
Stromatolites and BIFs. Two types of lateArchean rock Fms. have often been in-terpreted as indicating cyanobacterialactivity: stromatolites and BIFs. DesMarais (7) argued that large stromatolitereefs indicate the presence of cyanobacte-ria and therefore a locally aerobic envi-ronment, but large reefs also can formunder anaerobic conditions. Populationsof anaerobic methane oxidizers, forinstance, have built massive reefs at meth-ane seeps in the Black Sea (61). In addi-tion, the Archean and Paleoproterozoicoceans were likely more supersaturatedwith respect to calcite and aragonite thanthe modern oceans (62), which wouldhave facilitated the precipitation of largereefs even without biological participation.Indeed, abiotic processes may have playeda major role in the formation of manyPrecambrian stromatolites (63). Moreover,although the deposition of ferric iron inBIFs has traditionally been taken to implythe presence of free O2 (40, 64, 65), BIFsalso could have formed in a O2-free envi-
ronment, either by photooxidation (66) orby Fe(II)-oxidizing phototrophic bacteria(67, 68).
Isotopic Evidence. Rosing and Frei (6)argued based on isotopic evidence that�3.7 Ga metashale from West Green-land preserves signs of an aerobic eco-system. They found organic C with �13Cvalues of �25.6‰ in the same sedi-ments as Pb with isotopic ratios indicat-ing that the samples were originallyenriched in U with respect to Th andinterpreted this finding as reflecting anenvironment in which U could be cycledbetween its reduced, insoluble U(IV)form and its oxidized, soluble U(VI)form. They concluded the light C wasproduced by oxygenic phototrophs andthat biogenic O2 had permitted the re-dox cycling of U. However, all biologicalC fixation pathways and some abioticmechanisms can produce light C, and,just like the Fe(III) in BIFs, U(VI) canform in the absence of O2. At circum-neutral pH values, the midpoint poten-tial of the U(VI)�U(IV) couplet is �0V, similar to the Fe(III)�Fe(II) coupletand considerably less oxidizing thanMn(IV)�Mn(II), NO3
��N2, or O2�H2O(see Table 1).
A strong negative �13C excursion inorganic C at �2.7 Ga has been inter-preted as evidence for the evolution ofaerobic methanotrophy (69). Such lightC suggests repeated fractionation: firstin the production of CH4 subsequentlyoxidized to CO2, then in re-reduction bya primary producer; similar fraction-ations are observed today in environ-ments with methanotrophs. But al-though CH4 oxidation was once thoughtto require O2, geochemical measure-ments (70) and recent microbiologicalwork (71, 72) have demonstrated thatCH4 oxidation also can occur with alter-native electron acceptors, so O2 is notneeded to explain the isotopic excur-sions. Although the anaerobic methaneoxidizing bacteria studied today rely onsulfate, which is unlikely to have beenavailable in a high-Fe Archean ocean,thermodynamics permits a variety ofelectron acceptors, including Fe(III), tobe used for CH4 oxidation.
S isotope data indicate local spikes insulfate concentration starting �3.45 Ga(73, 74). Canfield et al. (75) argued thatthese spikes were produced in high-O2environments. But given the low redoxpotential of the sulfide�sulfate couplet,local sulfate spikes can be explained byscenarios that do not involve O2. More-over, sedimentary sulfate deposits, whichdisappear in the rock record after �3.2Ga (75), do not reappear until after theHuronian glaciations, which suggests thathigh sulfate conditions were rare.
None of these indirect lines of evi-dence necessitate oxygenic photosynthe-sis. The case for cyanobacteria and lo-cally oxic environments existing beforethe disappearance of MIF of S isotopesand the massive deposition of Mn in theKalahari Mn Field rests, at the moment,solely on steranes.
Future DirectionsOur model for a Paleoproterozoic originof cyanobacteria is testable by severalmethods. It suggests that sterols in Ar-chean rocks, if they are original, weresynthesized by anaerobic reactions. Ittherefore should be possible to find orengineer enzymes capable of synthesizingcholesterol under anaerobic, biochemi-cally plausible conditions. In addition, acontinuous biomarker record thatstretches back from time periods whenO2 is definitely present into the Archeanmight reveal transitions in communitycomposition. Current work with samplesfrom recent drilling programs targetingthe late Archean and the Paleoprot-erozic has begun this task. An intensivesearch for biomarkers with definite rela-tionships to metabolism, such as thosederived from the pigment molecules ofphototrophic bacteria, also would pro-duce a more convincing record. Asearch for cyanobacterial or eukaryoticfossils that predate 2.0 Ga yet have af-finities to modern groups would comple-ment the geochemical approaches.
With respect to the record of MIF ofS, the timeline we propose for a rapidoxygenation scenario suggests that de-creased fractionation during the intervalof the Huronian glaciations may be abyproduct of enhanced glacial weather-ing and ocean�atmosphere mixing. Ifthis scenario is correct, a similar phe-nomenon should have occurred in asso-ciation with the Pongola glaciation at�2.9 Ga. Investigation of the Huroniandeposits where low-MIF S is foundshould reveal these deposits to be sedi-mentologically immature, reflecting gla-cial input. Additionally, the syngenicityof the MIF values should be testedthrough techniques such as the paleo-magnetic search for significantly post-depositional formation of sulfides.
Finally, our model predicts that theMakganyene snowball Earth was a singu-lar event. Convincing paleomagnetic evi-dence (including positive syn-sedimentaryfield tests) that demonstrated the Huro-nian glaciations were low-latitude wouldcontradict our model and instead supporta protracted episode of planetary oxygen-ation with multiple snowball events notdirectly triggered by a singular event, theevolution of cyanobacteria.
Kopp et al. PNAS � August 9, 2005 � vol. 102 � no. 32 � 11135
112

SummaryBecause of the importance of the evolu-tion of cyanobacteria and the planetaryoxygenation event in Earth history, it isparticularly useful to consider multipleworking hypotheses about these events.We propose a model that takes a skepti-cal attitude toward the evidence for Ar-chean cyanobacteria and a protractedearly Proterozoic planetary oxygenation.In our alternative scenario, an evolu-tionary accident, the genesis of oxygenic
photosynthesis, triggered one of theworld’s worst climate disasters, the Pa-leoproterozoic snowball Earth. Intensiveinvestigation of the time period of thePaleoproterozoic glaciations may revealwhether a novel biological trait is capa-ble of radically altering the world andnearly bringing an end to life on Earth.
We thank R. Adler, N. Beukes, R. Blanken-ship, J. Brocks, H. Dorland, A. Kappler, J.Kasting, A. Maloof, D. Newman, S. Ono, A.
Sessions, D. Sumner, T. Raub, B. Weiss, andthree anonymous reviewers for advice anddiscussion; R. Tada for help with fieldwork inthe Huronian; A. Pretorius and AssmangLimited for access to Nchwaning Mine; andP. Hoffman for communicating this manu-script. This work was supported in part bythe Agouron Institute and by a NationalAeronautics and Space Administration Astro-biology Institute cooperative agreement withthe University of Washington. R.E.K. wassupported by a National Science FoundationGraduate Research Fellowship and a MooreFoundation Fellowship.
1. Canfield, D. E. (1998) Nature 396, 450–453.2. Anbar, A. D. & Knoll, A. H. (2002) Science 297,
1137–1142.3. Summons, R. E., Jahnke, L. L., Hope, J. M. &
Logan, G. A. (1999) Nature 400, 554–557.4. Brocks, J. J., Logan, G. A., Buick, R. & Summons,
R. E. (1999) Science 285, 1033–1036.5. Brocks, J. J., Buick, R., Summons, R. E. & Logan,
G. A. (2003) Geochim. Cosmochim. Acta 67, 4321–4335.
6. Rosing, M. T. & Frei, R. (2004) Earth Planet. Sci.Lett. 217, 237–244.
7. Des Marais, D. J. (2000) Science 289, 1703–1705.8. Farquhar, J. & Wing, B. A. (2003) Earth Planet.
Sci. Lett. 213, 1–13.9. Catling, D. C., Zahnle, K. J. & McKay, C. P. (2001)
Science 293, 839–843.10. Nhelko, N. (2004) D.Phil. thesis (Rand Afrikaans
University, Johannesburg).11. Young, G. M., von Brunn, V., Gold, D. J. C. &
Minter, W. E. L. (1998) J. Geol. 106, 523–538.12. Corfu, F. & Andrews, A. J. (1986) Can. J. Earth
Sci. 23, 107–109.13. Hannah, J. L., Bekker, A., Stein, H. J., Markey,
R. J. & Holland, H. D. (2004) Earth Planet. Sci.Lett. 225, 43–52.
14. Evans, D. A., Beukes, N. J. & Kirschvink, J. L.(1997) Nature 386, 262–266.
15. Tajika, E. (2003) Earth Planet. Sci. Lett. 214,443–453.
16. Cornell, D. H., Schutte, S. S. & Eglington, B. L.(1996) Precambrian Res. 79, 101–123.
17. Dorland, H. (2004) D.Phil. thesis (Rand AfrikaansUniversity, Johannesburg).
18. Bates, M. P. & Halls, H. C. (1990) Can. J. EarthSci. 27, 200–211.
19. Young, G. M., Long, D. G. F., Fedo, C. M. &Nesbitt, H. W. (2001) Sediment. Geol. 141, 233–254.
20. Williams, G. E. & Schmidt, P. W. (1997) EarthPlanet. Sci. Lett. 153, 157–169.
21. Schmidt, P. & Williams, G. (1999) Earth Planet.Sci. Lett. 172, 273–285.
22. Hilburn, I. A., Kirschvink, J. L., Tajika, E., Tada,R., Hamano, Y. & Yamamoto, S. (2005) EarthPlanet. Sci. Lett. 232, 315–332.
23. Farquhar, J., Savarino, J., Airieau, S. & Thiemens,M. H. (2001) J. Geophys. Res. Planets 106, 32829–32839.
24. Pavlov, A. A. & Kasting, J. F. (2002) Astrobiology2, 27–41.
25. Ono, S., Eigenbrode, J. L., Pavlov, A. A., Khare-cha, P., Rumble, D., Kasting, J. F. & Freeman,K. H. (2003) Earth Planet. Sci. Lett. 213, 15–30.
26. Bekker, A., Holland, H. D., Wang, P.-L., Rumble,D., III, Stein, H. J., Hannah, J. L., Coetzee, L. L.& Beukes, N. J. (2004) Nature 427, 117–120.
27. Farquhar, J., Bao, H. & Thiemens, M. (2000)Science 289, 756–758.
28. Savarino, J., Romero, A., Cole-Dai, J., Bekki, S. &Thiemens, M. H. (2003) Geophys. Res. Lett. 30,2131.
29. Kirschvink, J. L., Gaidos, E. J., Bertani, L. E.,Beukes, N. J., Gutzmer, J., Maepa, L. N. &Steinberger, R. E. (2000) Proc. Natl. Acad. Sci.USA 97, 1400–1405.
30. Cairncross, B., Beukes, N. & Gutzmer, J. (1997)The Manganese Adventure: The South African Man-ganese Fields (Associated Ore & Metal Corp. Ltd.,Johannesburg).
31. Gaidos, E. J., Nealson, K. H. & Kirschvink, J. L.(1999) Science 284, 1631–1633.
32. Hoffman, P. F. & Schrag, D. P. (2002) Terra Nova14, 129–155.
33. Bernstein, L. & Young, G. M. (1990) Can. J. EarthSci. 27, 539–551.
34. Walker, J. C. G. (1987) Nature 329, 710–712.35. Pavlov, A. A., Brown, L. L. & Kasting, J. F. (2001)
J. Geophys. Res. Planets 106, 23267–23287.36. Noble, S. R. & Lightfoot, P. C. (1992) Can. J. Earth
Sci. 29, 1424–1429.37. Walker, J. C. G., Hays, P. B. & Kasting, J. F. (1981)
J. Geophys. Res. Oceans Atmos. 86, 9776–9782.38. Berner, R. A., Lasaga, A. C. & Garrels, R. M.
(1983) Am. J. Sci. 283, 641–683.39. Bjerrum, C. J. & Canfield, D. E. (2002) Nature
417, 159–162.40. Klein, C. & Beukes, N. J. (1992) in The Proterozoic
Biosphere, ed. Klein, C. (Cambridge Univ. Press,Cambridge, U.K.), pp. 147–152.
41. Elderfield, H. & Schultz, A. (1996) Annu. Rev.Earth Planet. Sci. 24, 191–224.
42. Follmi, K. B. (1995) Geology 23, 503–506.43. Kustka, A., Carpenter, E. J. & Sanudo-Wilhelmy,
S. A. (2002) Res. Microbiol. 153, 255–262.44. Pavlov, A. A., Kasting, J. F., Brown, L. L., Rages,
K. A. & Freedman, R. (2000) J. Geophys. Res.Planets 105, 11981–11990.
45. Rye, R., Kuo, P. H. & Holland, H. D. (1995)Nature 378, 603–605.
46. Olsen, G. J., Woese, C. R. & Overbeek, R. (1994)J. Bacteriol. 176, 1–6.
47. Pierrehumbert, R. T. (2004) Nature 429, 646–649.48. Brocks, J. J., Buick, R., Logan, G. A. & Summons,
R. E. (2003) Geochim. Cosmochim. Acta 67, 4289–4319.
49. Risley, J. M. (2002) J. Chem. Ed. 79, 377–384.50. Raymond, J. & Blankenship, R. E. (2004) Geobi-
ology 2, 199–203.51. Moldowan, J. M. & Jacobson, S. R. (2000) Int.
Geol. Rev. 42, 805–812.52. Falkowski, P. G., Katz, M. E., Knoll, A. H., Quigg,
A., Raven, J. A., Schofield, O. & Taylor, F. J. R.(2004) Science 305, 354–360.
53. Amard, B. & Bertrand-Sarfati, J. (1997) Precam-brian. Res. 81, 197–221.
54. Awramik, S. M., Schopf, J. W. & Walter, M. R.(1983) Precambrian. Res. 20, 357–374.
55. Schopf, J. W. & Packer, B. M. (1987) Science 237,70–73.
56. Schopf, J. W. (1993) Science 260, 640–646.57. Brasier, M. D., Green, O. R., Jephcoat, A. P.,
Kleppe, A. K., Van Kranendonk, M. J., Lindsay,J. F., Steele, A. & Grassineau, N. V. (2002) Nature416, 76–81.
58. Pierson, B. K. (1994) in Early Life on Earth, NobelSymposium, ed. Bengtson, S. (Columbia Univ.Press, New York), No. 84, pp. 161–180.
59. D’Amelio, E. D., Cohen, Y. & Des Marais, D. J.(1987) Arch. Microbiol. 147, 213–220.
60. Joulian, C., Patel, B. K. C., Ollivier, B., Garcia,J. L. & Roger, P. A. (2000) Int. J. Syst. Evol.Microbiol. 50, 525–528.
61. Michaelis, W., Seifert, R., Nauhaus, K., Treude,T., Thiel, V., Blumenberg, M., Knittel, K.,Gieseke, A., Peterknecht, K., Pape, T., et al. (2002)Science 297, 1013–1015.
62. Grotzinger, J. P. & Kasting, J. F. (1993) J. Geol.101, 235–243.
63. Grotzinger, J. P. & Knoll, A. H. (1999) Annu. Rev.Earth Planet. Sci. 27, 313–358.
64. Cloud, P. (1973) Econ. Geol. 68, 1135–1143.65. Holland, H. D. (1973) Econ. Geol. 68, 1169–1172.66. Cairns-Smith, A. G. (1978) Nature 276, 807–808.67. Widdel, F., Schnell, S., Heising, S., Ehrenreich, A.,
Assmus, B. & Schink, B. (1993) Nature 362, 834–836.
68. Kappler, A. & Newman, D. K. (2004) Geochim.Cosmochim. Acta 68, 1217–1226.
69. Hayes, J. M. (1994) in Early Life on Earth, ed.Bengtson, S. (Columbia Univ. Press, New York),Vol. 84, pp. 220–236.
70. Barnes, R. O. & Goldberg, E. D. (1976) Geology4, 297–300.
71. Boetius, A., Ravenschlag, K., Schubert, C. J.,Rickert, D., Widdel, F., Gieseke, A., Amann, R.,Jorgensen, B. B., Witte, U. & Pfannkuche, O.(2000) Nature 407, 623–626.
72. Orphan, V. J., House, C. H., Hinrichs, K. U.,McKeegan, K. D. & DeLong, E. F. (2002) Proc.Natl. Acad. Sci. USA 99, 7663–7668.
73. Canfield, D. E., Habicht, K. S. & Thamdrup, B.(2000) Science 288, 658–661.
74. Shen, Y. A., Buick, R. & Canfield, D. E. (2001)Nature 410, 77–81.
75. Huston, D. L. & Logan, G. A. (2004) Earth Planet.Sci. Lett. 220, 41–55.
76. Drever, J. I. (1997) The Geochemistry of NaturalWaters: Surface and Groundwater Environments(Prentice–Hall, Englewood Cliffs, NJ).
77. Langmuir, D. (1978) Geochim. Cosmochim. Acta42, 547–569.
78. White, D. (2000) The Physiology and Biochemistryof Prokaryotes (Oxford Univ. Press, New York).
79. Fischer, W. W., Summons, R. E. & Pearson, A.(2005) Geobiology 3, 33–40.
11136 � www.pnas.org�cgi�doi�10.1073�pnas.0504878102 Kopp et al.
113

tters 245 (2006) 538–550www.elsevier.com/locate/epsl
114
Earth and Planetary Science Le
Experimental observation of magnetosome chain collapse inmagnetotactic bacteria: Sedimentological, paleomagnetic,
and evolutionary implications
Atsuko Kobayashi a,⁎, Joseph L. Kirschvink b, Cody Z. Nash b, Robert E. Kopp b,David A. Sauer b,1, L. Elizabeth Bertani c, Wim F. Voorhout d, Takahisa Taguchi a
a Research Institute for Cell Engineering, National Institute of Advanced Industrial Science and Technology,1-8-31 Midorigaoka, Ikeda, Osaka 563-8577, Japan
b Division of Geological and Planetary Sciences, California Institute of Technology 170-25, Pasadena, CA 91125, USAc Division of Biology, California Institute of Technology 170-25, Pasadena, CA 91125, USA
d FEI Electron Optics, Applications Laboratory, P.O. Box 80066, 5600KA, Eindhoven, The Netherlands
Received 6 December 2005; received in revised form 16 March 2006; accepted 23 March 2006Available online 9 May 2006
Editor: V. Courtillot
Abstract
Magnetotactic bacteria precipitate intracellular crystals of single-domain magnetite (Fe3O4) and/or greigite (Fe3S4), whichhave often been implicated in carrying the natural remanent magnetization (NRM) of freshwater and marine sediments. In vivo,the magnetic crystals are usually aligned in chains such that their moments add together, generating net cellular moments highenough to rotate the cells passively to align with the geomagnetic field. A magnetostatic/biophysical analysis demonstrates thatthis arrangement is out of dynamic equilibrium and would collapse spontaneously without a support mechanism. Past rockmagnetic analyses of shallow water marine carbonates suggest that partial collapse does occur during diagenesis anddolomitization.
To calibrate this effect we induced magnetosome chain collapse in Magnetospirillum magnetotacticum strain MS-1 byprogressive sonification and treatment with detergents and monitored the changes with rock magnetic analysis and TEM. Althoughit has been speculated that the cell wall and associated membrane structures act to prevent magnetosome chain collapse, our dataindicate that magnetosome linearity persists long after cells are disrupted. This is consistent with prior observations that in somemagnetotcocci the magnetosome chains pass through the cell interior, precluding continuous contact with the cell wall andimplying additional support structures exist in some species.
Using TEM tomographic reconstructions prepared with a magnetic technique that prevents chain collapse, we examined thethree dimensional ultrastructure of magnetosomes without the problem of post-mortem magnetosome motion. This methodrevealed the presence of an intracellular organic sheath beyond that of actin-like filaments reported recently that follows the chainof magnetosomes, which we postulate evolved to hold the crystals in place and enhances their ability to preserve NRM insediments. As the genomes of two magnetotactic bacteria contain several apparent homologues of known eukaryotic cytoskeletalproteins, natural selection for magnetotaxis may have played a role in the evolution of precursors to the eukaryotic cytoskeleton.
⁎ Corresponding author. Tel.: +81 72 751 9524; fax: +81 6 6844 0595.E-mail address: [email protected] (A. Kobayashi).
1 Present address: Department of Pathology, Oregon Health and Science University, Portland, OR 97202, USA.
0012-821X/$ - see front matter © 2006 Elsevier B.V. All rights reserved.doi:10.1016/j.epsl.2006.03.041

539A. Kobayashi et al. / Earth and Planetary Science Letters 245 (2006) 538–550
115
The presence of this sheath is also consistent with the observation of electron translucent material associated with putativemagnetofossil chains in ALH84001.© 2006 Elsevier B.V. All rights reserved.
Keywords: rock magnetism; paleomagnetism; magnetotactic bacteria; cytoskeleton; evolution
1. Introduction
In living magnetotactic bacteria, individual magnetitecrystals are formed within a string of vesicles, each ofwhich is a lipid-bilayer membrane [1–3]. Numerousoptical and behavioral observations show that the invivo magnetite crystals are aligned in linear chains,allowing virtually all of their dipole magnetic momentsto sum linearly, bringing the total magnetic moment percell to values close to that expected from the quantity ofsingle domain magnetite or greigite within them [3–9].Natural selection for magnetotaxis has presumablyoptimized the use of iron within many of these cells,as it is a scarce nutrient that, in aerobic environments,requires an energy-expensive active transport system[10]. However, the ability to keep the magnetosomesaligned is a biophysical puzzle because lipid-bilayermembranes are fluidic, and the magnetite crystals oughtto be able to move and rotate freely within their vesicles.Similarly, magnetite-containing vesicles should be ableto move relative to each other in response to localmagnetostatic interactions unless otherwise constrained[11].
One model suggests that the apparent stability ofmagnetosome chains may be due to a combination of themagnetosome shape and elastic properties of biologicalmembranes [12,13]. This model is based on 2D TEMimages of in situ magnetosomes that suggested thecrystal shapes were simple right cylinders or rectangularprisms with flat ends. However, subsequent HRTEMstudies of magnetosomes have revealed that the endsare, in fact, not square – they are typically ‘rounded’ bythe expression of {100}, {110}, {111} and possiblyother crystal faces [14,15]. This geometry acts tominimize the stabilizing effect of the flat ends andimplies that magnetosome chains are intrinsicallyunstable – as the rounded ends of two adjacent crystalsstart to rotate out of linear alignment, there is no barrierto inhibit chain collapse. Thermal fluctuations in themembrane surface also appear large enough to initiatechain collapse [16]. This rounding at magnetosome endshas been explained as a mechanism for improving thesaturation magnetization, and hence the biologicalefficiency of iron utilization, by eliminating spin-vortex‘flower-structures’ that arise near sharp corners ofsingle-domain crystals [17,18].
Although numerous TEM images show rapidly fixedmagnetotactic bacteria with apparently linear chains,Vali and Kirschvink [19] note that this is not always thecase in many bacteria. Despite the evidence for linearchains in vivo, chains do collapse during typicalpreparation for TEM; this has been independentlypredicted and observed by Philipse and Maas [20]. Inparticular, even apparently linear images of such chains,when viewed via a single 2D electron shadow image in aTEM, cannot detect oscillations in the vertical plane.Linear chains can in principle provide a strong andstable natural remanent magnetization (NRM), whereashighly interacting clumps of SD particles would haveboth lower intensity and lower stability. The ability toavoid clumping is critically important for understandinghow magnetofossil-rich sediments are able to preserveNRM.
Using rock magnetic techniques, McNeill andKirschvink [21] have documented magnetofossil chaincollapse in carbonaceous marine sediments from theBahamas, where the process reduces the intensity andstability of the NRM. In particular, increasing levels ofdiagenesis, calcification, and dolomitization inhibitedthe acquisition of anhysteretic remanent magnetization(ARM), implying that the magnetostatic interactionbetween magnetic particles was increasing [22]. How-ever, it was not clear from that study how themicroscopic arrangements of the magnetofossils werechanging, as the procedures for extracting the bacterialmagnetite particles (magnetofossils) from sedimentsresult in clumped aggregates of particles.
Without some form of rigid support, linear chains ofsingle-domain magnetite crystals will collapse sponta-neously because they are physically unstable. Forelongate crystals, magnetostatic energy calculations[10,20] show that the collapse of chains into clumpsof crystals is favored strongly, as, by reducing thecenter-to-center spacing of the dipoles, it can reduce themagnetostatic potential energy of the cell by ∼104kT(where kT, the product of the Boltzmann constant andthe absolute temperature, is the one-dimensional thermalbackground energy). Paired anti-parallel magnetosomecrystals have been seen in TEM images of cells withelongate crystal morphologies (e.g., [19]). Althoughequant crystals are more stable in a chain configurationthan in the paired anti-parallel configuration, for any

540 A. Kobayashi et al. / Earth and Planetary Science Letters 245 (2006) 538–550
116
crystal shape the overall magnetostatic energy of longchains of particles is minimized when the chainscollapse into small loops.
At least two mechanisms could prevent the collapseof these chains. First, proteins or some other organicmacromolecules could hold adjacent crystals togetherlike strings by anchoring themselves into the internalstructure of each crystal. These anchor strings wouldhave to pass completely through two lipid bilayermembranes, be of the correct length to minimize in-chain wobble, and be strong or numerous enough toovercome forces producing chain collapse. The ends ofthe chain would then be attached to the structuralcomponents of the cell wall, to transmit the rotationalmagnetic torque to the entire cell body [5]. The otherpossibility is that the cells might produce a largerorganic ‘sheath’ that would enclose the entire chain ofmagnetosomes within a rigid superstructure, preventingtheir collapse [23,24]. If held in a line, individualcrystals would be inhibited from rotating within theirencapsulating membrane by magnetic interactions withadjacent particles, rather than with embedded strings.This sheath structure could then be anchored to variouscytoskeletal filaments that run along the inside of thebacterial cell membranes to provide cell shape andrigidity [25,26], thereby transferring the magnetictorque needed for navigation to the entire cell. A proteinin the magnetosome membrane, MamJ, has been shownto be necessary for alignment of magnetosomes along afilamentous structure in the magnetotactic bacteriaMagnetospirillum gryphiswaldense [27], and inMagne-tospirillum magneticum filaments of an actin-likeprotein, MamK, appear to run the length of the cell[28], supporting the idea that external structuresconstrain the motion of the magnetosomes
To distinguish between these possibilities, we firstperformed a series of experiments with cultures of M.magnetotacticum strain MS-1, which we subjected toincreasing cellular disruption using ultrasonic andchemical methods; TEM imaging and rock magneticexperiments were coupled to monitor the progress ofchain collapse. Next, we developed a simple methodto inhibit the magnetostatic motion of the chainsduring preparation for TEM, from which we can thenderive accurate parameters such as magnetosomevolume and spacing using energy-filtered TEM.These data are then used to estimate the energiesand forces involved in the stability of magnetosomechains. Next, we report on the tomographic 3Dreconstructed imaging of cells prepared in this fashion.Finally, we report results of our search for supportingstructures along the magnetosome chains.
2. Materials and methods
2.1. Materials
Cultures of the magnetotactic bacterium M. magne-totacticum strain MS-1 were obtained from theAmerican Type Culture Collection (ATCC 31632), andgrown according to their recommendations. Whencultures had reached their log-growth phase, magneto-tactic cells were harvested from aggregations accumu-lating next to magnets held at the side of the cultureflasks using Pasteur pipettes modified to have a bent tip,as done by Moench and Konetzka [29].
2.2. Disaggregation method
About 30 μl aliquots of cell pellets were placed inacid-washed plastic Eppendorf tubes, and diluted in anequal volume of deionized water. Disruption began byinserting the stainless-steel probe of a Fischer ScientificSonic Dismembrator 550® into the liquid, at increasinglevels of exposure/pulse cycles. To further disrupt thecells by disrupting the membranes, we added stepsincluding sodium dodecyl sulfate (SDS). In order ofprogressive disruption, our samples reported here weretreated in the following sequence: (a) wild-type cellswith no disruption, (b) disruption with 200 pulses at 8 seach, (c) 400 pulses at 7 s each, (d) 0.05% SDS, and75 pulses at 5 s each, and (d) 0.05% SDS, and pulsedevery 4 s for 10 min. The pellets frozen in the Eppendorftubes were subjected to a standard series of rockmagnetic analyses as noted below.
2.3. Magnetometry measurements
These rock magnetic experiments were done at−20 °C, using a vertically mounted 2G Enterprises®SQUIDmagnetometer housed in amagnetically shieldedclean room at Caltech, which was equipped with arefrigerated sample access chamber. A stepping motorraised and lowered the sample from above on thinmonofilament line, moving it between the coils and theSQUID sense region. Experiments involved the follow-ing techniques: (1) Alternating-field (AF) demagnetiza-tion up to 100mTwas done with a commercial degausser(Applied Physics Systems® of Menlo Park, CA), using asolenoid mounted at the top of the sample path. (2) Tosupply DC biasing fields between 0 and 2 mT, a custom-built Lee-Whiting-4 coil system [30,31] was mountedover the Af solenoid, but within the μ-metal shielding.(3) Isothermal remanent magnetizations (IRMs) wereapplied using a capacitive impulse magnetizer (ASC
541A. Kobayashi et al. / Earth and Planetary Science Letters 245 (2006) 538–550
117
Scientific®, Model IM-10, with the design of Kirschvink[32]), which discharged through a solenoid mountedalong the sample path above the AF coil. All of thesedevices were run automatically by a dedicated computerthat had been programmed to do, in sequence, thefollowing progressive magnetization and demagnetiza-tion experiments: (1) ARM acquisition in a 100 mT AFfield, with biasing fields up to 2 mT; (2) AF of themaximumARMup to 100 mT; (3) IRM acquisition up to100mT; and (4) AF of the IRM. These data constitute thebasic magnetic granulometry techniques of Cisowski[22] and the ARM modification of the Lowrie–Fullertest [33]. Control measurements were done with similaracid-washed Eppendorf tubes filled with sterile growthmedia to ensure that the magnetic signals were due to thebacteria and not to the contaminants from the culturemedia or disposable labware [34].
2.4. Transmission electron microscopy
For the disaggregation experiments, we preserved thedisrupted configurations for both TEM and rock magneticexperiments by rapidly blotting small drops of the cellsuspension onto hydrophilic TEM grids, while at the sametime freezing the remaining cell suspension rapidly inliquid nitrogen for rock magnetic analyses. The grids wereexamined at moderate magnification on a Zeiss-9 TEM toassess chain linearity vs. clumping. For the experimentswith aligned chains, the samples were prepared by negativestaining or conventional embedding procedures (e.g., [35])as described elsewhere. We stabilized magnetotacticbacteria with a strong background magnetic field main-tained during the entire fixation and TEM samplepreparation process to prevent chain collapse with a pairof NdFeB disc magnets, 2 mm in diameter separated by a3.7 mm gap, which produced a measured minimummagnetic field in the center of ∼100 mT (see Fig. 3 fordetails). The magnetostatic alignment of the chains alsofacilitates TEM-based ultrastructural analysis, as ultrathinsections can be made from embedded samples with adiamond knife cutting parallel to the chain length.
Samples were prepared by negative staining orconventional embedding procedures (e.g., [35]). Allcells collected by magnets were first fixed with 1%glutaraldehyde and 4% paraformaldehyde in 0.1 Mphosphate buffer (PB) at pH 7.4 for half an hour. Cellswere then post-fixed in 1% osmic acid/0.1 M PB for 1 hand run through the standard epon embedding proce-dure. Samples were cut into 200 nm thin sections and70 nm ultrathin sections parallel to the chain length by aLeica Ultracut UCT with a diamond knife. Eachspecimen was collected on Cu grid supported by carbon
films, then post-stained with 2% uranyl acetate/leadcitrate. A few cells were negatively stained withtungsten phosphate as noted below.
We used a Tecnai F20G2Twin, equipped with Gatanenergy filter GIF2002 and multi-scan CCD camera(1024×1024, 24 μm/pixel), comprising a phosphorfiber-optically coupled, operating at 100 kV. The filterwas tuned for the chromatic–geometric aberrations,prior to image acquisitions at the magnification. Theimages of iron were acquired with an energy filter slitwidth of 25 eV for mapping the Fe–L edge at 708 eV.Weobtained images with acquisition times of 30 s; ourinstrument sample holder has an rms maximum drift of∼0.5 nm/min. We corrected for baseline change usingthe standard 3-window correction method that producesan optimum isolation of the Fe-signal from thebackground. All images were corrected for the CCD'sdark current and gain variations and processed by DigitalMicrograph 3.3 for size determinations.
2.5. Electron tomographic imaging
In the magnetotactic bacteria, structures supporting themagnetosome chains should be visible with suitable TEMtechniques, assuming that the spatial relationship betweenthe crystal chains and the supporting materials can bepreserved post-mortem. Automated electron microscopictomographic imaging [36,37] can then provide anothertool for examining the continuity between the magneto-some chains and internal cellular structures, particularlywhen the structure has a directional irregularity. A seriesof projection images is acquired by tilting the specimenincrementally to high tilt angles around an axis perpen-dicular to the electron beam. From this series of images, a3D tomogram with nanometer-scale resolution can bereconstructed. For our tomographic study, we used aTecnai Sphera with a sample holder, tilting at 1°increments through ±65°, operating at 200 kV. For a200 nm spherical sample incrementally tilted up to ±65°with 1° steps, the limiting resolution is around 5 nm [38].The drift of the holder position was calibrated prior to thedata acquisition for experimental samples. Image datawere processed using Xplore3D software fort 3Dreconstruction and further processes were done with theAMIRA 3.0 software package.
3. Results
3.1. Dispersion of aligned chains
Figs. 1 and 2 show representative TEM and rockmagnetic results from the dispersion experiments. As

Fig. 1. TEM images of the progressive collapse of the magnetosome chain structures in cells of M. magnetotacticum strain MS-1. The order ofprogressive disruption is arranged vertically such that (a)< (b)<(c)< (d)< (e). Note that both the outer and plasma lipid-bilayer membranessurrounding the cell are lost at the first ultrasonic disruption step used in the (b) preparation; although the magnetosome chains start to bend, they donot collapse. For scale, note that magnetosomes in this strain have a center-to-center separation of approximately 57 nm.
542 A. Kobayashi et al. / Earth and Planetary Science Letters 245 (2006) 538–550
118
the cells or cell fragments were observed optically toadhere tightly to the hydrophilic surface of the TEMgrids before air drying, and the freezing was rapid, itis reasonable to assume that the transfer and freezingprocedures had minimal effect on the magnetosome
organization, other than compressing 3D loops andclusters onto a 2D TEM grid. Undisrupted cells areshown in Fig. 1a, and the red curves labeled (a) inFig. 2. The TEM images reveal that progressivelyincreasing levels of ultrasonic disruption and detergent

Fig. 2. Rock-magnetic experiments on aliquots of the cells imaged inFig. 1, with color patterns in rainbow order of increasing disruption. (a)Acquisition of anhysteretic remanent magnetization, (b) Lowrie–Fuller ARM test, (c) comparison of coercivity gain/loss between IRMand ARM.
543A. Kobayashi et al. / Earth and Planetary Science Letters 245 (2006) 538–550
119
destruction of the membranes led to an increasingfrequency of closed flux-loops and dense clumps.Although the first ultrasonic disruption (b) destroyedmost visible cell structures (presumably by poppingboth the lipid-bilayer membranes which form the cell
wall/envelope in Gram-negative bacteria), the chainsthemselves did not collapse immediately into disor-dered clumps. Instead, they remain associated withfragments of the cytoplasm until that could beremoved by the action of detergents and higher levelsof ultrasonic treatment.
Rock magnetic data display a trend of increasinginteraction effects that increase with cell disruption,including a lowering of the ARM acquisition rate (Fig.2a) and a rather abrupt decrease of the median coercivity(Fig. 2b, c). This loss of coercivity is intriguing, becausethe rather sharp drop-off of the IRM–AF curve between35 and 45 mT (Fig. 2b and c) happens before theintersection point of the acquisition/demagnetizationdrops (the interaction “R” value of Cisowski [22]). Allof the samples pass the Lowrie–Fuller ARM test forsingle-domain behavior (Fig. 2c): the ARM–AF curveslie above those of the IRM–AF.
3.2. Electron microscopy
As shown in Figs. 3–5, the strong-field embeddingtechnique provides samples with remarkably straightand uniformly parallel magnetosome chains, maximiz-ing the ability to observe cellular material in theirvicinity. Close examination of the TEM images preparedin this fashion indicates that the magnetite crystal chainsin MS-1 are associated with an electron translucentsheath; this is indicated on the 50–70 nm thick wedge ofFig. 3a and b. Fig. 3c shows results from an electronmicroscope image of a negatively stained, fixed MS-1whole cell prepared in this fashion; Fig. 3d is a higherresolution image of one end of this chain. Small redarrows in Fig. 3b and d show the somewhat irregularmargins of this apparent sheath material. Detailedmeasurements indicate that the margins of this sheathare somewhat irregular, but that the sheaths areapproximately 100 nm in diameter. This implies that itis not simply an extension of the lipid-bilayer magneto-some membrane that covers each magnetite crystal[1,2], which should only extend ∼6 nm from the crystalsurfaces, but that it is composed of additional material.Two movies of the tomographic reconstructions areavailable from the online supplemental information, andstereo pairs of images extracted from these are shown inFig. 4. An additional tomographic reconstructed imagein the Appendix shows the high degree of internalcontrol on the magnetosome spacing and positioning inthe bacterial cell.
To estimate the fraction of the cellular volumeoccupied by the magnetosome chain assembly, wemodeled the magnetosomes of Figs. 3 and 5 as regular

Fig. 3. TEM images of intact cells of MS-1, prepared in the presence of a static, strong magnetic field designed to prevent magnetosome chaincollapse. The magnetostatic orientation energy (Emo, in cgs units) of each magnetosome in an external magnetic field, B, is given by their vector dotproduct, −μ·B, where μ is the particle magnetic moment. (For simplicity in magnetostatic calculations, we prefer to use the Gaussian cgs system andtranslate our results back into SI units.) If this exceeds the collapse energy (Ec) between two particles separated by a distance x, given by −μ2/x3 (seeSection 3.3 regarding the biophysics), the chain structure is stabilized; for magnetosomes ofM. magnetotacticum, strain MS-1, this critical thresholdfield is ∼16 mT. (a and b) ∼70 nm thick ultra-thin section of wedge of magnetotactic bacteria embedded in epon, cut parallel to the direction of theapplied magnetic field direction. (c) Negatively stained TEM image of an intact bacterial cell, showing the linear chain of electron densemagnetosomes. (d) Enlarged view of the right-hand margin of the magnetosome chain in (c). Red arrow tips in (b) and (d) show the margin of theorganic ‘sheath’ that envelopes the magnetosome chain structures. Only the cells in (c) and (d) were negatively stained with tungsten-phosphate(Nano-W, Nanoprobes).
544 A. Kobayashi et al. / Earth and Planetary Science Letters 245 (2006) 538–550
120
truncated octahedra (‘cubo-octahedra’ using the termi-nology of [39]), and the sheath as a simple cylindersurrounding the magnetosome chain. In the magne-tospirilla, numerous studies have shown that thecrystals tend to be aligned with their crystal axesparallel to the [111] cubic direction (i.e., they haveparallel sets of {111} crystal faces perpendicular to thechain axis). This is not surprising because the [111]axis is the magnetically ‘easy’ direction, and crystal-lites growing in the strong local field at the end of amagnetosome chain will spontaneously align in thisorientation [11]. As the plane of our TEM sectionsshown in Figs. 3 and 5 were cut parallel to thedirection of the strong field applied by the rare-earthmagnets, the crystal dimension measured along thechain axis provides an estimate of the spacing betweenparallel {111} planes. Since the energy loss at the Fe–L edge at 708 eV is very sharp and our samples havea large signal/noise ratio, we measured the crystal sizeand spacing by locating the full width half-maximum(FWHM) intensity point in the Fe spectra as shown onthe line profile in our Fig. 5.
Measurements of 15 mature crystals from twomagnetosome chains like those shown in Fig. 4 yield
a mean plane separation of 43.1±4.5 nm, with a center-to-center spacing of 56.8±3.7 nm (1σ errors); theaverage interparticle gap of ∼13.7±2.1 nm is consistentwith two unit membranes. This size distribution is ingood agreement with the measurements of Devouard etal. [39], who also did not use negative staining but hadno 3D control of the chain warping. Our measuredinterparticle spacing, however, is significantly largerthan the 10.0 nm (2×5.0 nm) spacing reported by Gorbyet al. [1], which may be a result of the negative stainingprocedure enhancing the apparent size of the crystals.(Although small, this is an important difference becausethe magnetostatic forces vary as the inverse fourthpower of particle separation.)
To convert from this on-axis {111} planar separa-tion to an estimate of the cubo-octahedral crystalvolume involves using geometry; the length of any ofthe twelve edges of a regular octahedron is √6 timesthat of the distance from the center to the midpoint ofany of the faces. Using a right triangle, the 43 nmaverage planar spacing corresponds to a regularoctahedron with a full vertex-to-vertex edge lengthof 53 nm. Although the M. magnetotacticum crystalsare somewhat variable, the six octahedral vertices are

Fig. 4. Stereo frames extracted from tomographic reconstructions of two samples ofM. magnetotacticum strain MS-1, using 11° tilt between frames.Samples for (a) and (b) are cells from fresh cultures grown with the same techniques, but embedded in the absence and presence, respectively, of astrong magnetic field for keeping the magnetosome chains from collapsing, as mentioned in the text. The specimens were prepared by 200 nm thicksectioning. These correspond to the supplementary data in the Appendix and are available at http://www.gps.caltech.edu/~nascz/Movie_A.mov andhttp://www.gps.caltech.edu/~nascz/Movie_B.mov.
545A. Kobayashi et al. / Earth and Planetary Science Letters 245 (2006) 538–550
121
truncated by {100} and equivalent planes, removingabout a third of each edge length at each vertex. Thistruncation reduces the volume of a perfect octahedronby that of 6 square-based prisms located at each vertex,giving a best volume estimate per crystal of about62,500 nm3. For comparison, the diameter of a spherewith an equal volume is about 49 nm. The volume ofeach magnetosome (magnetite plus membrane) is foundin a similar fashion to be about 142,500 nm3, a bit morethan double that of the magnetite alone. Using ∼100 nmdiameter for the observed sheath, with the length of∼2000 nm seen in Fig. 3a, implies that the entiremagnetosome and sheath assembly has a cylindricalvolume of ∼15.7 million nm3, which is about 3% oftotal volume of the cell. This is a significantly largerestimate for the cellular volume devoted to magneto-taxis than previous estimates of about 0.5%, which onlyconsidered the magnetosomes [6].
3.3. Biophysics
In vector notation the magnetostatic energy for a pairof interacting magnetic dipoles, μ1 and μ2, separatedcenter-to-center by a displacement vector, x, is given by:
E1;2 ¼Yμ1 d
Yμ2 � 3ðYμ1 dYn ÞðYμ2 d
Yn Þjxj3
ð1Þ
where n is a dimensionless unit direction vector parallelto x [40]. For a pair of equal magnetic dipoles alignedhead-to-tail in parallel, the magnetostatic interactionenergy (Eparallel) reduces to E=−2μ2/x3. Similarly, theforce (F) between the particles is the spatial gradient ofthe energy, F=6μ2/x4. These values are halved forparticles that are clumped with their moments in a side-to-side antiparallel configuration; when μ1 and μ2 areantiparallel, and both are perpendicular to n, E=−μ2/x3
and F=3μ2/x4. Hence, for two interacting uniformly

Fig. 5. Image of intact cells of MS-1 for size measurement. (a) Energy-filtered image of iron. (b). Zero loss image of (a). (c) Intensity profileof (a), taken between points A and B in (a). The crystal size isdetermined by the distance between two edge points at full width half-maximum (FWHM).
546 A. Kobayashi et al. / Earth and Planetary Science Letters 245 (2006) 538–550
122
magnetized spheres the minimum energy configurationis a head-to-tail configuration. However, for elongatechains of spheres in a negligible background field (e.g.,[41]), the magnetostatic energy stored in the field itselfbecomes large, and this can be reduced by curling thechains into arcs or loops, as clearly happened in thebacterium shown in Fig. 4a.
As noted above, magnetite crystals produced byMagnetospirillum strain MS-1 are equivalent to spheresof ∼57 nm diameter, and have about 13.7 nm of organicmaterial holding them apart. High-purity, low-defectmagnetite such as that precipitated by the magnetotacticbacteria has a saturation magnetization of 4.8×10⁵ A/m(480 emu/cm3, [42]). This yields magnetic moments ofthe particles of ∼4.3×10⁻¹⁷ A/m2, and an interparticlecompressional force at this separation of about 120 pN.The head-to-tail binding energy is about −550 kT,implying that the arrangement is quite stable againstthermal disruption.
4. Discussion
In biomagnetic and rock magnetic studies, the insitu packing geometry of single domain grains is an
important, but commonly difficult, parameter todetermine. The calibrations shown in Figs. 1 and 2provide a qualitative guide to how these interactioneffects vary as a function of the packing geometry,and provide a start at how to interpret data fromnatural samples like Recent muds from the Bahamas[21,43]. Of particular interest is the immediatebroadening of the coercivity spectra with the initiationof chain curling (the (a) to (b) steps of Figs. 1 and 2).This is accompanied by an abrupt decrease in mediancoercive field from about 40 to 30 mT, but without asignificant drop in the R value (the intersection pointof the IRM and AF of IRM curves in Fig. 2b, ameasure of interparticle interaction [22]). The drop incoercivity is presumably due to the disruption of thelinear chain structure – bends in the chains will reducethe stabilizing influence of adjacent magneticmoments to each particle, making it easier for theirmoments to flip. Upon further disaggregation (the (b)to (c) steps of Figs. 1 and 2), the TEM images indicatethat the magnetosomes start to form more regionswhere the chains line up next to each other in parallelstrings; this is accompanied by a slight increase inmedian coercivity (from about 30 to 35 mT), but witha decrease in the R value from 0.42 to 0.32 in Fig. 2b.We suspect that this slight increase in coercivity maybe due to the effect of single-domain grains in pairs ofadjacent chains stabilizing each other against theexternal magnetic field (AF or pulse) that is attempt-ing to change their magnetic direction. The drop in Rvalue is an indication of the increase in interparticleinteraction [22]. Further disruptions including treat-ment with SDS (the (d) and (e) steps of Figs. 1 and 2)start to destroy the chains, and result in dense 3Dclusters of strongly interacting particles. These yieldrock magnetic results that progressively resemble theend member of the chiton tooth (Cryptochiton stelleri)standard [22,44].
We were surprised at the difficulty of disruptingmagnetosome chains in lab cultures. Our initial hopewas to disrupt them so completely with the powerfulultrasonic treatment that individual magnetite crystalswould separate from each other and become magneti-cally isolated in the medium, which would allow us todistinguish the magnetic properties of the individualcrystals from the properties that arise due to the chainorganization. Were this to happen, we would expect thatthe ARM acquisition curve shown in Fig. 2a wouldsteepen. Instead, progressive disruption from the chainstructures dramatically increased the interaction effects,eventually producing the clumped aggregates and loopsshown in Fig. 1e.

Fig. 6. (a) Magnetic coccus from a freshwater pond near the town ofLandshut in Germany (from Vali and Kirschvink [19], reproduced withpermission). This is a freeze-etched replica from a transverse sectionthrough the center of one of these cells; the large spherical structure is aphosphate granule that has been transacted near its full dimension,indicating that the fracture plane penetrated near the center of thenearly spherical cell. The small arrow indicates the location of themagnetosome chains, which is located in the interior of the cell awayfrom the wall and therefore lacking support. The scale bar is 0.5 μm inlength. (b) Schematic diagram of the freeze-fracture image of (a),showing the location of the intracellular storage granules and themagnetosome chain. The central portion of the chain is not adjacent tothe cell membrane, but goes through the center of the cell.
547A. Kobayashi et al. / Earth and Planetary Science Letters 245 (2006) 538–550
123
Comparing these data with the rock-magnetic studyof Recent sediments of the Bahama banks [21] indicatesthat the majority of the Bahama samples have notreached total chain collapse. In this configuration, theparticle clumps will still have a net magnetic momentthat can align in the geomagnetic field, and, as thesediments are lithified by the precipitation of carbonatecements, this will preserve a stable but weaker NRM, asis often observed in shallow-water carbonates [43]. Wealso note that post-depositional growth of organismslike Geobacter that precipitate extracellular magnetite(e.g., [45]) might also produce this change in the ARMproperties of sediments with depth; however, this wouldlead to an increase in the IRM intensity which is notobserved [21].
An important observation here is the fact that theinitial disruption of the periplasmic and cytoplasmicmembranes did not lead to total collapse of themagnetosome chains. At present, we do not know howthese are held together within the cell, although it isoften suggested that chain stabilization in the magneto-tactic bacteria is produced by continuous physical linksbetween the chain structure and the hydrostaticallysupported cell walls [1,3,6,46]; this has apparently beenobserved recently inM. magneticum strain AMB-1 [28].However, if these connections to the membrane were theonly method of support, the chains should collapseimmediately once the membranes are disrupted. The factthat this collapse requires much more severe treatment,including chemical denaturation agents, demands thepresence of additional cytoplasmic and ultrastructuralsupporting structures that are resistant to disaggregation.
Recent work has demonstrated the presence offilamentous structures along which magnetosomes arealigned in the closely related species M. gryphiswal-dense MSR-1 [27] and M. magneticum AMB-1 [28].Using cryo-electron tomography, both groups observedfilaments that spanned the length of the cell, identifiedas most likely as the actin homolog, mamK [28], andapparently held in place by the protein product of genemamJ [27]. In wild-type cells the magnetosomes werealigned along this filament, while in MamJ-deficientmutants the magnetosomes were not associated with thefilament, instead forming clumps. With their technique,no sheath structure was observed even in the wild-type.While AMB-1, MSR-1, and MS-1 are closely related,they do have different populations of magnetosomemembrane proteins [47], such that they may havedifferent support structures for their magnetosomechains. An intriguing possibility, however, is thatMamJ is required for sheath formation, or is one ofmany components of the sheath itself.
Further evidence for the existence of such supportingstructures comes from past freeze-fracture replicastudies of magnetic cocci which reveal the presence oflinear magnetosome chains that are structurally distantfrom the cell wall [19]. As shown in Fig. 6a (Fig. 3c ofVali and Kirschvink [19]), these cocci contain large,spherical intracellular storage granules up to 1 μm insize. The freeze-fracture plane in Fig. 6a not onlytransected the entire cell, exposing a chain of magneto-somes, it also cut through one of these storage granulesnear its maximum diameter. Hence, the freeze-fractureplane went through the center of the cell, not simplytangential to the edge. As shown schematically in Fig.6b, the storage sphere contacts the cell membrane onone side, and the magnetosome chain on its other side.In a spherical cell the center does not come near the

548 A. Kobayashi et al. / Earth and Planetary Science Letters 245 (2006) 538–550
124
bubble-like membrane, so the magnetosome chainshown in Fig. 6a cannot be in contact with it, exceptpossibly at the ends. Since the central portion of themagnetosome chain is not adjacent to the cellmembrane, it must have some other means of support,and a significant fraction of the magnetosomes in thesemagnetococci cannot be attached to the periplasmicmembrane as they apparently are in AMB-1 [28]. Inaddition to our tomographic preparations of Figs. 3 and5, there are hints of this sheath material present – but notcommented upon – in several past publications contain-ing TEM images of various magnetotactic bacteria. Inparticular, Schübbe et al. [48] report a spontaneousmutant of M. gryphiswaldense (MRS-1B) that lost an∼80 kb segment of the magnetosome island andproduced no magnetosome vesicles or magnetitecrystals. However, as seen on their Fig. 1a, these mutantcells still retain a clear ghost of organic material runningalong the length of the cells, where the magnetosomechains should have been.
Comparison of the known genetics between themagnetic cocci and magnetospirilla suggests that theyprobably use similar structures to prevent magnetosomechain collapse. Although uncultured, virtually allmagnetic cocci that have been reported so far aremembers of the alpha-proteobacterial sub-phylum,which also contain the magnetospirilla. The nearlycomplete genome of the magnetic cocci MC-1 containsvirtually all of the genes in the magnetosome islandfound in the magnetospirilla, indicating that they sharelarge elements of their magnetosome formation path-ways. However, the genomes of the closely relatedmagnetospirilla strains AMB-1 and MS-1 differ in sizeby nearly 300 kb [49,50], The apparent association ofthe magnetosome chain structures with the cytoplasmicmembrane in the magnetospirilla most likely resultsfrom the cell shape. A 2 μm long rod, placed inside aright circular cylinder of about the same length that isthen twisted a turn or two (producing the typicalstructure of a spirillum), will appear to be tangent to thecell wall. Hence a genetic defect that inhibits orminimizes separation of new magnetosome vesiclesbudding off from the membrane might not be selectedagainst strongly in the magnetospirilla, but wouldgreatly damage the magnetococci. As noted by Valiand Kirschvink [19], endocytosis of this sort wasthought to be an exclusively eukaryotic trait.
Although the structure remains uncharacterized, ourTEM study of uncollapsed cells reveals the presence ofan intracellular magnetosome sheath structure thatoccupies a significant fraction of the cellular volume.Our failure to image eukaryotic-style internal cytoskel-
etal fibers using fixing and staining techniques capableof detecting them in eukaryotes [26] implies that eitherthese proteins are only rarely expressed in strain MS-1or are not generally assembled in the same fashion asthey are in the closely related strains GSR-1 and AMB-1or in their eukaryotic cousins. As noted earlier, the MS-1genome is missing ∼300 kb compared to AMB-1, andalthough the mamJ and mamK genes are present, theirexpression could be quite different. In this light it isinteresting to note that our tomographic results ofstained, epon-embedded cells complement and extendthe recent studies of Scheffel et al. and Komeili et al.[27,28], who both used cryoTEM on unstained cells ofM. gryphiswaldense (with incomplete information fromthe missing-wedge effect due to the limited tilt-range of±60°) andM. magneticum. Although the classic stainingand embedding techniques risk loss of resolution at thesub 5-nm scale, organic structures have such extraordi-narily low contrast under any sort of TEM examinationthat heavy-metal staining is needed to enhance them. Itis for this reason that the much larger scale structure ofthe sheath is apparent in our images.
The recently sequenced genome of M. magneto-tacticum contains 4 ftsZ homologues of tubulin andtwo mreB homologues of actin. Of these genesencoding potential structural proteins, one mreB geneis highly conserved among the genomes of magneticcoccus MC-1, M. magnetotacticum, and M. gryphis-waldense. The highly conserved actin homologue isalso part of a larger group (the magnetosome island) ofconserved genes containing 18 proteins known to belocated on the magnetosome [47,51]. The conservedMreB-like protein, named MamK in M. gryphiswal-dense, is not bound to the magnetosome membrane inextracted magnetosomes [47]. The sequence similarityof MamK to MreB and its disconnection from themagnetosome have led to the speculation that it maybe involved in the structural control of the magneto-some chain [48]. On the other hand, it is possible thatMamK is not involved in the sheath structure and thatthe sheath is composed of something entirely different,such as a glycoprotein matrix. Future biochemical andgenetic work will be able to determine the composi-tion of the sheath.
The nearly identical appearance of magnetosomechains in bacteria to those widespread in eukaryoticcells ranging from protists [52,53] to the magnetor-eceptor cells of animals [54–57] has led to thehypothesis that the mechanisms for producing magneto-somes share a common ancestry [58]. Hence the jumpfrom cytoskeletal filaments arranged along the internalcell wall of bacteria to the role of positioning and

549A. Kobayashi et al. / Earth and Planetary Science Letters 245 (2006) 538–550
125
organizing intracellular vacuoles may have been drivenby natural selection for magnetotaxis as well asendosymbiotic events in the evolution of the eukaryoticcell. Although there may be no direct homologybetween the proteins in the magnetosome sheath andthe eukaryotic cytoskeleton, the magnetosome struc-tures could provide a stabilizing framework for theevolution of these other scaffolding materials.
The presence of this sheath is also compatible withthe observation of Friedmann et al. [13] that the chainsof magnetite crystals observed in the magnetite-richrims of carbonate blebs in the Martian meteoriteALH84001 are, on occasion, encapsulated by anelectron-transparent layer of presumed organic compo-sition. If their interpretation of these structures asmagnetofossil chains is correct, this transparent materialcould be the degradation product of the sheath reportedhere.
Acknowledgments
This work was partially supported by funds from aNEDO (New Energy and Industrial Technology Devel-opment Organization, Japan) Fellowship to A.K., grantsNIH 1-RO1-ES-06652, and EPRI-RP2965 to JLK. Wethank H. Vali of McGill University for permission to useFig. 6a.
Appendix A. Supplementary data
Supplementary data associated with this article canbe found, in the online version, at doi:10.1016/j.epsl.2006.03.041.
References
[1] Y.A. Gorby, T.J. Beveridge, R.P. Blakemore, Characterization ofthe bacterial magnetosome membrane, J. Bacteriol. 170 (1988)834–841.
[2] N. Nakamura, K. Hashimoto, T. Matsunaga, Immunoassaymethod for the determination of immunoglobulin-G usingbacterial magnetic particles, Anal. Chem. 63 (1991) 268–272.
[3] D.A. Bazylinski, R.B. Frankel, Magnetosome formation inprokaryotes, Nat. Rev., Microbiol. 2 (2004) 217–230.
[4] A.J. Kalmijn, R.P. Blakemore, The magnetic behavior of mudbacteria, in: K. Schmidt-Koenig, W.T. Keeton (Eds.), AnimalMigration, Navigation and Homing, Springer Verlag, New York,1978, pp. 354–355.
[5] R.B. Frankel, R.P. Blakemore, Navigational compass in magneticbacteria, J. Magn. Magn. Mater. 15 (1980) 1562–1564.
[6] R.P. Blakemore, Magnetotactic bacteria, Annu. Rev. Microbiol.36 (1982) 217–238.
[7] M. Hanzlik, M. Winklhofer, N. Petersen, Spatial arrangement ofchains of magnetosomes in magnetotactic bacteria, Earth Planet.Sci. Lett. 145 (1996) 125–134.
[8] R.E. Dunin-Borkowski, M.R. McCartney, R.B. Frankel, D.A.Bazylinski, M. Posfai, P.R. Buseck, Magnetic microstructure ofmagnetotactic bacteria by electron holography, Science 282(1998) 1868–1870.
[9] M. Hanzlik, M. Winklhofer, N. Petersen, Pulsed-field-remanencemeasurements on individual magnetotactic bacteria, J. Magn.Magn. Mater. 248 (2002) 258–267.
[10] J.L. Kirschvink, Paleomagnetic evidence for fossil biogenicmagnetite in western crete, Earth Planet. Sci. Lett. 59 (1982)388–392.
[11] J.L. Kirschvink, On the magnetostatic control of crystalorientation and iron accumulation in magnetosomes, Automedica14 (1992) 257–269.
[12] V.P. Shcherbakov, M. Winklhofer, M. Hanzlik, N. Petersen,Elastic stability of chains of magnetosomes in magnetotacticbacteria, Eur. Biophys. J. Biophys. Lett. 26 (1997) 319–326.
[13] E.I. Friedmann, J. Wierzchos, C. Ascaso, M. Winklhofer, Chainsof magnetite crystals in the meteorite ALH84001: evidence ofbiological origin, Proc. Natl. Acad. Sci. U. S. A. 98 (2001)2176–2181.
[14] P.R. Buseck, R.E. Dunin-Borkowski, B. Devouard, R.B. Frankel,M.R. McCartney, P.A. Midgley, M. Posfai, M. Weyland,Magnetite morphology and life on Mars, Proc. Natl. Acad. Sci.U. S. A. 98 (2001) 13490–13495.
[15] S.J. Clemett, K.L. Thomas-Keprta, J. Shimmin, M. Morphew,J.R. McIntosh, D.A. Bazylinski, J.L. Kirschvink, S.J. Went-worth, D.S. McKay, H. Vali, E.K. Gibson, C.S. Romanek,Crystal morphology of MV-1 magnetite, Am. Mineral. 87 (2002)1727–1730.
[16] F.L.H. Brown, Regulation of protein mobility via thermalmembrane undulations, Biophys. J. 84 (2003) 842–853.
[17] J.L. Kirschvink, A seventh criterion for the identification ofbacterial magnetofossils, EOS, Trans.-Am. Geophys. Union 82(2001) s131.
[18] A. Witt, K. Fabian, U. Bleil, Three-dimensional micromagneticcalculations for naturally shaped magnetite: octahedra andmagnetosomes, Earth Planet. Sci. Lett. 233 (2005) 311–324.
[19] H. Vali, J.L. Kirschvink, Observations of magnetosome organi-zation, surface structure, and iron biomineralization of unde-scribed magnetic bacteria: evolutionary speculations, in: R.Blakemore (Ed.), Iron Biominerals, Plenum Press, New York,1991, pp. 97–116.
[20] A.P. Philipse, D. Maas, Magnetic colloids from magnetotacticbacteria: chain formation and colloidal stability, Langmuir 18(2002) 9977–9984.
[21] D.F. McNeill, J.L. Kirschvink, Early dolomitization of platformcarbonates and the preservation of magnetic polarity, J. Geophys.Res., [Solid Earth] 98 (1993) 7977–7986.
[22] S. Cisowski, Interacting vs. non-interacting single-domainbehavior in natural and synthetic samples, Phys. Earth Planet.Inter. 26 (1981) 56–62.
[23] A. Kobayashi, T. Taguchi, Biological control of magnetite crystalformation in the magnetotactic bacteria: hints concerning thepossible evidence from ALH84001 for life on Mars, Geochim.Cosmochim. Acta 66 (2002) A408.
[24] A. Kobayashi, T. Taguchi, Ultrastructure of the magnetite crystalchains in Magnetospirillum magnetotacticum (MS-1): evidencefrom TEM tomography for cytoskeletal supporting structures,Geochim. Cosmochim. Acta 67 (2003) A222.
[25] J. Kurner, A.S. Frangakis, W. Baumeister, Cryo-electrontomography reveals the cytoskeletal structure of Spiroplasmamelliferum, Science 307 (2005) 436–438.

550 A. Kobayashi et al. / Earth and Planetary Science Letters 245 (2006) 538–550
126
[26] O. Medalia, I. Weber, A.S. Frangakis, D. Nicastro, G. Gerisch,W. Baumeister, Macromolecular architecture in eukaryotic cellsvisualized by cryoelectron tomography, Science 298 (2002)1209–1213.
[27] A. Scheffel, M. Gruska, D. Faivre, A. Linaroudis, J.M. Plitzko,D. Schuler, An acidic protein aligns magnetosomes along afilamentous structure in magnetotactic bacteria, Nature 440(2006) 110–114.
[28] A. Komeili, Z. Li, D.K. Newman, G.J. Jensen, Magnetosomesare cell membrane invaginations organized by the actin-likeprotein MamK, Science 311 (2006) 242–245.
[29] T.T. Moench, W.A. Konetzka, A novel method for the isolationand study of a magnetotactic bacterium, Arch. Microbiol. 119(1978) 203–212.
[30] G.E. Lee-Whiting, Uniform magnetic fields, in: L. AtomicEnergy of Canada, (Ed) report CRT-673, Chalk River ProjectResearch and Development, 1957, p. 8p.
[31] J.L. Kirschvink, Uniform magnetic fields and double-wrappedcoil systems: improved techniques for the design of biomagneticexperiments, Bioelectromagnetics 13 (1992) 401–411.
[32] J.L. Kirschvink, Ch. 14. Biogenic ferrimagnetism: a newbiomagnetism, in: S. Williamson (Ed.), Biomagnetism: AnInterdisciplinary Approach, Plenum Press, New York, NY,1983, pp. 501–532.
[33] H.P. Johnson, W. Lowrie, D.V. Kent, Stability of ARM in fineand course grained magnetite and maghemite particles, Geophys.J. R. Astron. Soc. 41 (1975) 1–10.
[34] A.K. Kobayashi, J.L. Kirschvink, M.H. Nesson, Ferromagnetsand EMFs, Nature 374 (1995) 123.
[35] A. Komeili, H. Vali, T.J. Beveridge, D.K. Newman, Magneto-some vesicles are present before magnetite formation, andMamA is required for their activation, Proc. Natl. Acad. Sci.U. S. A. 101 (2004) 3839–3844.
[36] K. Dierksen, D. Typke, R. Hegerl, A.J. Koster, W. Baumeister,Towards automatic electron tomography, Ultramicroscopy 40(1992) 71–87.
[37] J. Frank, T. Wagenknecht, B.F. McEwen, M. Marko, C.E. Hsieh,C.A. Mannella, Three-dimensional imaging of biologicalcomplexity, J. Struct. Biol. 138 (2002) 85–91.
[38] J. Frank, Three Dimensional Electron Microscopy of Macro-molecular Assemblies, Oxford University Press, Oxford, 2005,400 pp.
[39] B. Devouard, M. Posfai, X. Hua, D.A. Bazylinski, R.B. Frankel,P.R. Buseck, Magnetite from magnetotactic bacteria: sizedistributions and twinning, Am. Mineral. 83 (1998) 1387–1398.
[40] C. Kittel, Introduction to Solid State Physics, JohnWiley & Sons,Inc., New York, 1976, 608 pp.
[41] J.S. Yang, C.R. Chang, Magnetic relaxation in chain-of-spheresferromagnetic particles, J. Magn. Magn. Mater. 239 (2002)73–75.
[42] D.J. Dunlop, O. Ozdemir, Rock Magnetism: Fundamentals andFrontiers, Cambridge University Press, New York, 1997, 573 pp.
[43] M. Schwartz, S.P. Lund, D.E. Hammond, R. Schwartz, K. Wong,Early sediment diagenesis on the Blake/Bahama Outer Ridge,North Atlantic Ocean, and its effects on sediment magnetism, J.Geophys. Res., [Solid Earth] 102 (1997) 7903–7914.
[44] J.L. Kirschvink, H.A. Lowenstam, Mineralization and magneti-zation of chiton teeth: paleomagnetic, sedimentologic, andbiologic implications of organic magnetite, Earth Planet. Sci.Lett. 44 (1979) 193–204.
[45] H. Vali, B. Weiss, Y.L. Li, S.K. Sears, S.S. Kim, J.L.Kirschvink, L. Zhang, Formation of tabular single-domainmagnetite induced by Geobacter metallireducens GS-15, Proc.Natl. Acad. Sci. U. S. A. 101 (2004) 16121–16126.
[46] D.L. Balkwill, D. Maratea, R.P. Blakemore, Ultrastructure of amagnetotactic spirillum, J. Bacteriol. 141 (1980) 1399–1408.
[47] K. Grünberg, E.C. Muller, A. Otto, R. Reszka, D. Linder,M. Kube, R. Reinhardt, D. Schüler, Biochemical andproteomic analysis of the magnetosome membrane inMagnetospitillum gryphiswaldense, Appl. Environ. Microbiol.70 (2004) 1040–1050.
[48] S. Schübbe, M. Kube, A. Scheffel, C. Wawer, U. Heyen, A.Meyerdierks, H. Madkour, F. Mayer, R. Reinhardt, D. Schüler,Characterization of a spontaneous nonmagnetic mutant ofMagnetospirillum gryphiswaldense reveals a large deletioncomprising a putative magnetosome island, J. Bacteriol. (2003)5779–5790.
[49] T. Matsunaga, Y. Okamura, Y. Fukuda, A.T. Wahyudi, Y.Murase, H. Takeyama, Complete genome sequence of thefacultative anaerobic magnetotactic bacterium Magnetospirillumsp. strain AMB-1, DNA Res. 12 (2005) 157–166.
[50] L.E. Bertani, J. Weko, K.V. Phillips, R.F. Gray, J.L. Kirschvink,Physical and genetic characterization of the genome ofMagnetospirillum magnetotacticum, strain MS-1, Gene 264(2001) 257–263.
[51] K. Grünberg, C. Wawer, B.M. Tebo, D. Schüler, A large genecluster encoding several magnetosome proteins is conserved indifferent species of magnetotactic bacteria, Appl. Environ.Microbiol. 67 (2001) 4573–4582.
[52] D.A. Bazylinski, D.R. Schlezinger, B.H. Howes, R.B. Frankel,S.S. Epstein, Occurrence and distribution of diverse populationsof magnetic protists in a chemically stratified coastal salt pond,Chem. Geol. 169 (2000) 319–328.
[53] R.B. Frankel, F.F.T. Dearaujo, M.A. Pires, C.E.M. Bicudo,Magnetotaxis and magnetite in algae, Biophys. J. 49 (1986) A75.
[54] S. Mann, N.H.C. Sparks, M.M. Walker, J.L. Kirschvink,Ultrastructure, morphology and organization of biogenic mag-netite from sockeye salmon, Oncorhynchus nerka – implicationsfor magnetoreception, J. Exp. Biol. 140 (1988) 35–49.
[55] C.E. Diebel, R. Proksch, C.R. Green, P. Nielson, M.M. Walker,Magnetite defines a magnetoreceptor, Nature 406 (2000)299–302.
[56] J.L. Kirschvink, M.M. Walker, C.E. Diebel, Magnetite-basedmagnetoreception, Curr. Opin. Neurobiol. 11 (2001) 462–467.
[57] M.M. Walker, T.E. Dennis, J.L. Kirschvink, The magnetic senseand its use in long-distance navigation by animals, Curr. Opin.Neurobiol. 12 (2002) 735–744.
[58] J.L. Kirschvink, J.W. Hagadorn, A grand unified theory ofbiomineralization, in: E. Bäuerlein (Ed.), The Biomineralisationof Nano- and Micro-Structures, Wiley-VCH Verlag GmbH,Weinheim, Germany, 2000, pp. 139–150.

tters 247 (2006) 185–196www.elsevier.com/locate/epsl
127
Earth and Planetary Science Le
Bugbuster—survivability of living bacteria upon shock compression
M.J. Willis a, T.J. Ahrens a,⁎, L.E. Bertani b, C.Z. Nash c
a Lindhurst Laboratory of Experimental Geophysics, Caltech 252-21, Pasadena, CA 91125, United Statesb Division of Biological Sci., Caltech 156-29, Pasadena, CA 91125, United States
c Division of Geol. Planet. Sci., Caltech 170-25, Pasadena, CA 91125, United States
Received 2 April 2005; received in revised form 31 March 2006; accepted 31 March 2006Available online 16 June 2006
Editor: K. Farley
Abstract
Shock recovery experiments were conducted on suspensions of 106/ml E. coli bacteria contained in a water-based medium thatis emplaced within stainless steel containers. The water is shocked and recovered. These experiments simulate the environment ofbacteria residing either in surface bodies of water or in subsurface water-filled cracks in rocks. Early Earth life is likely to haveexisted in such environments. However, the E. coli are not believed to be representative of early life and are merely used here forinitial experiments. Some 10−2 to 10−4 of the bacteria population survived initial (800 ns duration) shock pressures in water of 220and 260 MPa. TEM images of shock recovered bacteria indicate cell wall rupture and delamination. This appears to be themortality mechanism.
The TEM images indicate cell wall indentations may be occurring as would be consistent with Rayleigh–Taylor or Richtmyer–Meshkov fluid instabilities. In the present case, we consider the experiments as representing three layers of fluids: (1) The water-based medium, a stronger and possibly denser cell wall medium, and the interior of the cell cytoplasm. Variations of only 10–15%are expected in density. (2) A second mechanism that may cause cell wall failure is the multiple shock (nearly isentropic)compression freezing of liquid water medium into ice VI or ice VII high pressure phase that are 20% to 25% denser than the liquid.The decrease in volume associated with the transformation is expected to induce overpressures in the still liquid cell cytoplasm.
Cell dynamic tensile wall strength thus appears to be a critical parameter from either of the above failure modes. Because thestrain rate dependence of cell wall tensile strength is unstudied, we utilize the Grady and Lipkin [D.E. Grady, L. Lipkin, Criteria forimpulsive rock fracture, Geophys. Res. Lett. 7 (1980) 255–258] model of tensile failure versus time scale (strain rate). Our singledatum is fit to this law and we assume that at low strain rates, overpressures exceeding the cell Turgor pressure require on the orderof ∼103 s. This model which has been applied to brittle media and metals for describing failure may permit application of shortduration laboratory experiments as in the present ones to infer responses of organisms to much lower shock pressures, but forlonger time scales (100 to 103 s) of planetary impacts.
Using the present data for E. coli and applying the Grady and Lipkin model, we find that a 1.5 km diameter impactor will causemortality of bacteria within a radius of 102 km but upon stress related attenuation the subsurface bacteria outside of this radiusshould survive.© 2006 Published by Elsevier B.V.
Keywords: bacteria; shock compression; origin of life; astrobiology
⁎ Corresponding author.E-mail address: [email protected] (T.J. Ahrens).
0012-821X/$ - see front matter © 2006 Published by Elsevier B.V.doi:10.1016/j.epsl.2006.03.054

186 M.J. Willis et al. / Earth and Planetary Science Letters 247 (2006) 185–196
128
1. Introduction
Life on Earth has existed since the emergence ofclement surface conditions. For the first 500–700 Myrfollowing its formation 4.6 Gyr ago, the Earth wassubjected to heavy and continuous impacts frommeteoroids which created an environment whollyinhospitable to the survival of primitive organisms, aninterval known as the Hadean period. Evidence fromlunar cratering indicates that the period of heavybombardment ended ∼3.8 Gyr before the present (e.g.[2,3]). Correspondingly, it is generally accepted fromfossil evidence that life has existed on Earth for∼3.5 Gyr (e.g. [4]) and it has been argued that carbonisotopic ratios in rocks from early Archean terranes inAustralia and Greenland are evidence of life as far backas ∼3.85 Gyr before the present [5], although suchevidence remains controversial [6,7].
Numerous efforts have been made to express theinitiation of conditions favorable to the origin anddevelopment of life in terms of the frequency andseverity of impacts. Maher and Stevenson [8] used thelunar cratering record to define a limiting impact ratebelow which life was able to develop. An alternativeapproach by Sleep et al. [6] associated the commence-ment of life with the time of the most recent planet-sterilizing impact; they reasoned that for an impact to besterilizing it was necessary to vaporize the Earth'soceans. The general framework for evaluating thesurvival of Mars bacteria upon impact delivery to theEarth was studied by Mileikowsky et al. [9]. Wells et al.[10], reasoning that the Earth's surface would be heatedduring impacts to an extent that would preclude thesurvival of organisms, suggested that bacteria may havebeen able to survive by being ejected into space byimpacts and falling back to the Earth after conditions
Table 1Summary of previous experimental studies
Author Type of experiment Bacteria used
Burchell et al. [13], [15] Impact using light gas gun RhodococcusBacillus subtil
Mastrapa et al. [16] Acceleration in centrifuge Bacillus subtilDeinococcus rMastrapa et al. [16] Projectile impact
Horneck et al. [17] Shock compressionbetween quartz platens
Bacillus subtil
This work Recovery of shockedliquid medium
Escherichia co
(a) Sample partial dried and deposited on porous alumina.n/a Not applicable to centrifuge experiment.(b) Sample placed in cavity in lead bullet.nd+ Pressure/stress on bacteria upon impact of bullet not calculable as conta
were once again clement. It is generally understood thatlarge impacts pose a threat to life through effects such asthe generation of large quantities of dust and aerosolswhich will reduce the level of sunlight and ignition oflarge-scale wildfires (e.g. [11]).
Although early giant impacts would be lethal toorganisms on the Earth's surface, it is well known thatlife can survive at large distances below ground.Organisms have been found in rock crevices up to3 km underground, obtaining necessary nutrients fromrocks (e.g. [12]). These would have been sheltered fromthe sterilizing effects at the surface during an impact,namely impact heating and physical disruption. How-ever, a shock compression wave will be produced at thepoint of impact which will travel deep into the Earth.The survivability of organisms to shock compressionevents may therefore be relevant to understanding theonset and development of life on the early Earth.
In the present bacteria were held in a water-basedmedia, shocked, and the liquid containing bacteria wasrecovered for analysis. In contrast, in previous studiesbacteria were on or in a solid medium. Previous studiesare summarized in Table 1.
Burchell et al. [13] impacted bacteria-laden ceramicprojectiles into nutrient-rich targets using a two-stagelight gas gun, achieving survival at velocities of 5 km s−1.The shock pressure quoted in Table 1 is that at theceramic projectile-agar interface. This does not necessar-ily have any relation to stress exerted on the bacteria asthese are “protected” by the relatively strong grains ofceramic. Burchell et al. [14] have extended this work tothe case of bacteria being ejected from icy surfaces duringimpact, and have also recently determined the bacteriasurvival rate over a wide range of shock pressures [15].Mastrapa et al. [16] employed a centrifuge to subjectbacteria spores to accelerations of up to 5×10⁶ ms2.
Shock pressure(GPa)
Acceleration(m s−2)
Survivalrate
erythropolis/is
3–78 (a) 1.6×10⁹ 10−4–10−7
is/adiodurans
n/a 4×10⁶ 10−1 after 65nd+ 1–5×10⁶ 0.4–1.0
is (spores) 32 1.2×10⁹ 10−4
li 0.26 2.6×10⁷ 10−2–10−4
cted geometry between lead bullet and carried bacteria not defined.

Fig. 1. Comparison between previous experimental studies ofsurvivability of subsurface bacteria during an asteroid impact andcurrent work. Previous studies (Burchell et al. [13,14], Horneck et al.[17]) considered dry bacteria between grains, in rock. In these casesnon-hydrostatic strain affects bacteria. In this work bacteria areimmersed in water and subjected to only dynamic hydrostaticpressures.
Fig. 2. Structure of E. coli cell.
187M.J. Willis et al. / Earth and Planetary Science Letters 247 (2006) 185–196
129
Impact induced deceleration of dried B. subtilis sporesand D. radiodurans bacteria carried in a fluid mediumdemonstrated nearly complete survival upon exposure toshort duration (5 ms) ballistic tests.
Horneck et al. [17] used a quartz sandwich todynamically compress dried bacterial spores and wassuccessfully able to culture the spores afterwards.Again, pressures and accelerations apply to the quartzand not bacteria are quoted.
One situation which merits investigation is thedegree to which organisms immersed in water insubsurface rock crevices are shielded from the effectsof shock induced non-hydrostatic strains. Bacteriawithin water would be subjected primarily to hydrostaticstrain as illustrated in Fig. 1. Recent experiments bySharma et al. [18] are examining microbial viability inliquid under static hydrostatic compression. In this case,bacteria are able to withstand significant hydrostaticpressures and in some cases survived incorporation intoplanetary ices.
In this paper we describe an experimental work inwhich shock recovery experiments were performed onlive samples of Escherichia coli (E. coli) bacteria,suspended in a water-based buffer solution. Section 2describes the sample preparation, experimental methodand results. In Section 3, we discuss possible mechan-isms that induce cell mortality apparently via cell wallrupture. We suggest a cell wall failure model that mayallow extrapolation of the tensile stress associated with
failure in short duration laboratory loadings (such asconducted here) to long duration, lower stress condi-tions associated with planetary impact.
Finally, Section 4 summarizes the main conclusionsof this work, namely that the live E. coli bacteria cansurvive shock pressures of 0.2 GPa for the very shortduration (0.8 μs) of the present experiments.
2. Experimental work
2.1. The bacteria
The bacteria sample used in this experiment were E.coli. This species was chosen on account of its rapidgrowth rate and the fact that it is not normally found inlaboratory environments, so it should not be confusedwith any contaminant. However, E. coli should not beconsidered similar to any wild species that reside withinregimes of early microbial life, but is rather a commonorganism living in the intestines. In constructingscenarios for early life, many have suggested that lifedeveloped in anaerobic, reducing environments duringplanetary accretion, and possibly, at elevated tempera-tures. The standard E. coli strain MC-4100 F- araD139Δ (argF-lac)U169 rpsL1 relA1 deoC1 ptsF25 rboRflb5301 λ− [15] was used. The structure of a typical E.coli cell is shown in Fig. 2. Cells of E. coli are lozenge-shaped, being ∼2 μm long and ∼0.5 μm in diameter.They consist of a central nucleoid, which contains thecell's DNA, surrounded by a cytoplasmic fluid. This isencased in a cytoplasmic membrane and a cell wall. Theparticular strain of E. coli we used was geneticallymodified to be resistant to the antibiotic streptomycin.This meant that any recovered samples could be treatedwith streptomycin to distinguish the original samplefrom contaminants. Bacteria were cultivated in LBbroth, a rich nutrient growth medium composed of

Fig. 3. Illustration of projectile and target. Lexan projectile holds alexan disk forming flyer plate. A foam disk supports flyer. Stainlesssteel sample recovery chamber has a 0.5 mm thick cavity holdingbacteria sample in water-based medium.
188 M.J. Willis et al. / Earth and Planetary Science Letters 247 (2006) 185–196
130
tryptone and yeast extract. Samples containing ∼2×10⁷
bacteria were centrifuged to remove the LB broth, andthe resultant pellet was suspended in 10 m MTris, 1 mMEDTA.
2.2. Experimental procedure
The recovery chamber used to house the bacteriasamples is displayed in Fig. 3. The prepared bacteriasamples were loaded into a 10 μl cavity in a stainlesssteel retainer. This was screwed into a stainless steelholder piece with a press fit to seal the liquid sample inplace, with an airtight fit provided by a knife-edgearound the rim of the cavity in the retainer. Thisassembly was screwed on to a stainless steel housingcomponent. The chamber design follows that used byBlank et al. [19] for liquid-recovery shock experiments.
The assembled target chamber was mounted on to theend of the barrel of the 20 mm powder gun in theLindhurst Laboratory of Experimental Geophysics atCaltech. The gun was used to launch a projectile at thetarget chamber at velocities of 0.6–1.5 km s−1. Theprojectile, shown in Fig. 3, was composed of lexan andwas 80 mm in length. On the front end of the projectile,a 1.5 mm thickness disk was mounted, which acted asthe flyer plate to drive a planar shock wave through the
Table 2Summary of shock recovery experiments
Shot#
Projectiletype
Impact velocity(km s−1)
Initial shock pressurein liquid water (MPa)
Pe(G
1 Steel 0.74 1955 142 Lexan and foam 0.76 259 23 Lexan and foam 0.67 217 24 Lexan and foam 0.63 199 2
target assembly containing the bacteria sample. For Shot1 this flyer plate was composed of stainless steel, but inlater shots a lexan flyer plate was used to reduce theshock pressure (see Table 2). For the lexan flyer plates, a4 mm thickness disk of polycarbonate foam wasmounted behind the flyer. This was inserted to inducea well-defined, nearly rectangular stress versus timeshock pulse and to attenuate shock reverberations afterthe initial shock to reduce the risk of killing bacteriacells which had survived the main shock.
Four shots, plus a control test were carried out usingthis setup. The experimental conditions for each shot aresummarized in Table 2. Initial shock pressures in thebacterial median, assumed to have the properties ofliquid water, and the multi-reflected shock pressuresassumed to be equal to that of the initial shock pressurein the stainless steel. These were all obtained by theimpedance matching method technique [20] using shockand particle velocity data for the various materialsinvolved listed in Table 3. Reflected shock pressures inthe samples ranged from 2.2 to 14.9 GPa.
Following the shot, the chamber was opened toremove the bacterial sample. In order to separate thesample holder and retainer pieces, it was necessary todrill radially into the holder to loosen the fit. When theretainer had been removed, any liquid bacteria sampleremaining in the chamber was extracted using a pipette.It was found that there was not always liquid presentafter the shot. In this case, 10 μl of TE buffer was addedto the retainer and was stirred to resuspend the residue.Recovered- or resuspended-samples were mixed with50 μl of LB nutrient broth and spread onto a petri dishcontaining LB agar medium. The dish was left for∼ 16 h at 37 °C to allow any surviving bacteria to grow.
2.3. Results and analysis
The results of the four shots carried out aresummarized in Table 2. Because Shot 1 used a stainlesssteel flyer plate, the shock pressure was considerablygreater in this case than in the others. Shot 3 was theonly experiment in which liquid sample was recoveredfrom the chamber; in the others, the interior of the
ak pressurePa)
Liquid samplerecovered?
Result Survivalrate
.94 No No bacteria observed 0
.81 No Dead bacteria observed 0
.40 Yes Live bacteria recovered ∼ 10−2
.23 No Live bacteria recovered ∼ 10−4

Fig. 4. Control, unshocked (left) and post-shot (right) E. coli bacteriacolony plates from Shot 4. Control plate has been diluted by a factor of106 from the original sample.
189M.J. Willis et al. / Earth and Planetary Science Letters 247 (2006) 185–196
131
sample retainer was found to be dry and so additionalTE buffer was used to resuspend the residue.
2.3.1. Colony countsIn Shots 1 and 2 no live bacteria were recovered. The
petri dish containing recovered sample from Shots 3 and4, having been mixed with LB broth, spread on agar andleft at 37 °C overnight. On each of the plates, whitespots were observed, which are colonies formed byindividual surviving bacteria cells. The number ofcolonies on these plates provides a direct measure ofthe survival rate for each shot.
For comparison, a dish containing a control sampleof the same bacteria (which was not impacted) wascultivated. Each of the control samples were diluted by afactor of 106, whereas the shocked samples were not.The control samples for Shots 3 and 4 each contained∼103 colonies, consistent with a 1 ml sample of 109
bacteria being diluted by a factor of 106. The post-shotsamples are undiluted from an initial 10 μl sample of107 cells, so the number of colonies on these plates is thetotal number of surviving bacterial from each shot. Thepost-shot sample from Shot 3 proved to have such alarge number of surviving bacteria that in some areas ofthe plate their colonies merged into a continuum,making an accurate colony count difficult. A value of8×104 determined from the number density of colonies
Table 3aAnalysis of bacteria colonies from contamination test (Shot #5)
Colony#
Colony diam.(mm)
Colonycolor
Cellshape
Cell diam(μm)
1 6 Off-white Rod 10–202–4, 6 2 White Round 15, 7, 8 2 Yellow Round 1
in a region where the colonies are not quite saturated istherefore a lower limit, and the true number of survivingcells is likely ∼105; the survival rate in the sample istherefore ∼10−2. The post-shot sample from Shot 4,shown in Fig. 4 next to the control sample, contains∼103 colonies, leading to a survival rate of ∼10−4.From Fig. 4 it will be observed that an interesting featureof the post-shot colonies from Shot 4 is theirheterogeneity in size. Compared to the colonies on thecontrol plate, the shocked colonies vary from beingroughly the same size as the unshocked colonies tobeing considerably smaller. The presence of smallercolonies suggests that these organisms might havesustained some damage during the shock process thathad to be repaired before they could begin to multiplyand produce colonies.
It will be noted from Table 2 that a significant issueregarding the recovery of live bacteria was the fact thatin only one of the four samples was the original liquidrecovered, and the other three had to be resuspended.This is a possible factor in the failure to recover any livebacteria in Shots 1 and 2, and the lower survival rate inShot 4. We presume that liquid was not recovered inthree of the shots because of leakage through the fitbetween the sample retainer and holder. The survivalrate in Shot 3 may therefore be representative of that foran impact where bacteria are immersed in water in anenclosed crevice.
2.3.2. Testing for contaminationIn order to verify that the bacteria colonies observed
on the post-shot sample plates in Shots 3 and 4 werecells from the original sample and not due to externalcontamination, a test shot, #5, was performed using theTE buffer suspension medium only, without any E.colibeing added. In this shot #5, 13 μl of the medium wassealed into a stainless steel recovery chamber andimpacted on by a lexan flyer plate at 0.67 km s−1, with alayer of polycarbonate foam behind the flyer plate as inShots 3 and 4. Following the test shot, dried residue inthe chamber was resuspended in TE buffer and spreadon a petri dish containing LB agar, being left at 37 °C for16 h, as in previous shots, to allow any bacteria coloniesto grow.
. Lambda coliphagesensitivity
Streptomycinresistant?
Possibleidentification
No No BacillusNo No MicrococcusNo No Staphylococcus

Table 3bAnalysis of bacteria colonies from contamination test (Shot #5)
Colony#
Colony diam.(mm)
Colonycolor
Cellshape
Cell diam.(μm)
Lambda coliphagesensitivity
Streptomycinresistant?
Possibleidentification
E. coli 1 White Rod 1 Yes Yes E. coli
Fig. 5. Illustration of how DAPI staining highlights position of bacteriacells. E. coli are soaked in (lethal) DAPI fluorescent stain. Stain bindsto DNA and thus indicates where cells are concentrated upon UV lightillumination.
190 M.J. Willis et al. / Earth and Planetary Science Letters 247 (2006) 185–196
132
Having been left overnight, 8 bacteria colonies werefound to have grown on the petri dish. Various tests wereperformed to determine whether any of these were E.coli; the results of this analysis are summarized in Table3a. First, the appearance of the colonies themselves wascompared with the expected characteristics of coloniesproduced by E. coli. From Table 3b it will be observedthat while E. coli colonies are white and 2 mm indiameter after 16 h, colony 1 is off-white and 6 mm indiameter, and colonies 5, 7 and 8 are yellow. From thecolony appearance only 2–4 and 6 remain as E. colicandidates.
The second test was observation of cellular mor-phology. The colonies consist of a large number of cells,so to observe the cells in a given colony it was necessaryto take a portion of the colony, suspend it in TE bufferand place a drop of the resultant solution onto amicroscope slide. The sample was then studied using anoptical microscope at 400× magnification. As will beseen in Fig. 2, E. coli cells are rod-shaped and ∼1 μm indiameter. It will be observed that the cells from colony 1,while being rod-shaped, are much larger (10–20 μm)than E. coli cells, and cells from colonies 2 to 8,although the correct size, are round in shape. Thereforenone of the observed colonies have cell morphologiesconsistent with E. coli.
Another test was to determine their bacteriophagesensitivity. Bacteria are the unwilling hosts to a varietyof bacteriophages, or bacterial viruses. Different typesof bacteria are sensitive to (i.e. can be killed by) specificbacteriophages: E. coli is sensitive to coliphages, but noother types of bacteria are. Hence, this bacteriophagecan be used to test whether a given colony consists of E.coli. All of the contaminants were tested for sensitivityto a typical coliphage called “lambda”. As will be notedfrom Table 3, none were found to be sensitive,indicating that none are E. coli.
The final test performed on the colonies from the testshot was resistance to streptomycin. The strain of E. coliused in Shots 1–4 was given a resistance to the antibioticstreptomycin. It was found that when streptomycin wasadded to each of the contaminant colonies, the colonieswere killed. As none of the colonies in the test shot haveresistance to streptomycin, none are consistent with thebacteria samples from Shots 1 to 4.
We conclude from the various tests performed thatnone of the observed colonies are produced by E. coli,and thus the E. coli colonies recovered from shots 3 to 4do not originate from external contamination.
2.3.3. Optical microscopy with stainHaving extracted a sample to test for the presence of
live bacteria, the interior of the sample retainer wascoated with a fluorescent staining dye (DAPI: 4′,6-Diamidino-2-phenylindole) and examined under anoptical microscope. The dye binds to DNA and thereforeallows organisms to show up by their strong fluores-cence. As the dye is lethal to the bacteria so it wasmerely used to determine the physical presence ofbacteria in the recovered sample. The process by whichthe stain allows cell identification is illustrated in Fig. 5.
Fig. 6 displays a series of epifluorescence micro-scope images of DAPI-stained bacteria in the sampleretainer after shooting, with ultraviolet light being shoneon the sample. Images of Shot 2 are shown in Fig. 6(a)and (b) and Shot 4 in Fig. 6(c) and (d). For comparison,an image of a DAPI-stained unshocked E. coli sampleon a microscope slide is shown in Fig. 6(e). In each ofthe images, individual E. coli cells are visible as brightdots. In Fig. 6(a) cells are present in the upper right ofthe image, with a heavy concentration visible as a brightstreak. In Fig. 6(b) a small number of cells appear in theupper right, with an additional concentration towards

Fig. 6. Images of interior of sample recovery chambers, using DAPI fluorescent stain to identify position of bacteria cells. (a) and (b) are from Shot 2,and (c) and (d) are from Shot 4. Bacteria cells show up as tiny bright dots, sometimes concentrated in localized regions. For comparison, moreuniform distribution of E. coli unshocked is shown in (e).
191M.J. Willis et al. / Earth and Planetary Science Letters 247 (2006) 185–196
133
the bottom of the picture. Shot 4, Fig. 6(c) and (d),display bacteria cells all over the images, with (c) havinga higher concentration towards the lower part of theimage. In the comparison picture of unshocked bacteriain Fig. 6(e), cells appear as uniformly distributed brightdots.
From Fig. 6 it will be seen that bacteria cells areclearly visible in the recovery chambers from Shots 2to 4. It appears from Fig. 6(a) and (b) that only asmall quantity of the original bacteria sample was
still in the chamber after Shot 2, while after Shot 4most of the original sample was still visible. Thesequalitative observations of post-shock bacteria popu-lation are consistent with the results of Table 2 andFig. 4.
2.3.4. TEM analysisA further analysis technique to examine the physical
damage to E. coli cells from shock compressionemployed the use of transmission electron microscopy

Fig. 7. Transmission electron microscope (TEM) images of control sample of E. coli bacteria, at (a) 25,000× and (b) 75,000× magnification; and post-shot samples from Shot 4 at (c), (d) 25,000× and (e) to (g) 75,000× magnification.
192 M.J. Willis et al. / Earth and Planetary Science Letters 247 (2006) 185–196
134
(TEM). Using the Phillips 201 TEM facility (atoperating voltage of 60 kV) in Caltech's Division ofBiological Sciences we analyzed control and post-shotsamples of E. coli cells from Shot 4. Each sample wasprepared by replacing the liquid in the sample withprogressively more viscous polymers until a solid wasproduced. After this, a 30 nm section was cut from thesample and a beam of electrons was used for imaging.The resultant images from this process are shown inFig. 7. Fig. 7(a) and (b) are TEM images taken of thecontrol sample, at a magnification of 25,000× and75,000× respectively. In each image individual cells ofE. coli show up as ovals or circles, and their internalstructure is clearly visible. Fig. 7(c) and (d) are TEMimages of the post-shot sample at a magnification of25,000×, and Fig. 7(e) to (g) show post-shot TEM
images at 75,000× magnification. Comparison of eachof the post-shot images with the control sample imagesillustrates that very few cells are still visible.Furthermore, the surviving cells show clear signs ofdamage: there is evidence of cell wall rupture and adelineation.
3. Possible shock-induced mortality mechanismsand planetary scaling
In this section we first note the nature of damage tocells, formulate two possible cell mortality mechanisms,and on this basis suggest a scaling model. The TEMimages, Fig. 7(e), (f), and (g), show broken cell wallsand partial defoliation of cell wall material from themain cell mass.

193M.J. Willis et al. / Earth and Planetary Science Letters 247 (2006) 185–196
135
We suggest on the basis of these images that:
(1) Either local overpressurization followed by ten-sile failure of cell walls occurred. One possiblemechanism for cell wall overpressurization is toassume that the water media surrounding the cellhas transformed to a denser ice VI or ice VII withthe density increase of 20–25%, but the water inthe cell cytoplasm has not. This transformation inwater has been observed by Dolan and Gupta[21]. This transformation is also observed bySharma et al. [18] in a static study of compressionof E. coli.
(2) The undulation of cell walls suggests that thesemay be remnants of Richtmyer–Meshkov instabi-lities induced by the marked shock acceleration ofthe material when encompassed by the shock or inthe case of slightly different media, we canconsider three different layers: the higher imped-ance cell walls and the lower impedance cyto-plasm—in the interior of the cells, as well as thelower impedance media outside the cells. In thegeneral case where the accelerations may notnecessarily be occurring as a result of beingencompassed by the shock, these types ofinstabilities are called Rayleigh–Taylor. Bothcontrasts in density and viscosity appear to giverise to the growth of these types of instabilities.Contrasts in viscosity can be related to differencesin yield strength. At a given strain rate, these maybe related to the stresses discussed inducingplastic deformation as discussed by Colvin et al.[22]. Since tensile strength can be considered acontrolling parameter in both mechanisms, weassume the Grady and Lipkin [1] tensile behavioris given by:
rcw ¼ a=t1=bd ð1Þ
where a and b are positive constants and td isstress duration. Thus an equation of the form ofEq. (1) implies that the dynamic tensile strengthof the cell wall (σcw) can be substantially higherwhen a short duration stress is applied.
The present experiments provide a critical shockpressure in water that we assume, equals the cell walltensile strength, at a very short time duration. Thus, toconstrain the a and b parameters, we assume the onsetof mass mortality for very high stresses and very short(800 ns) durations occurs in our experiment for Shot3, at 218 MPa. Obviously, another plausible constraint
is required. We also assume that at very long timesthere is a minimal stress that will just induce cell walltensile failure. To quantify the long time scale failurecondition, we assume this occurs over a very longtime scale that is comparable to those occurring inplanetary impacts. For example, an impactor with avery large diameter such as ∼103 km induces suchlong duration stresses. The time scale of the stresspulse will then be ∼103 s in the case of, for example,a porous impactor which has a very low shockvelocity. We assume that the tensile strength of thecell wall approaches the Turgor (cell interior) pressureat these long time scales. Turgor pressures in bacteria,such as E. coli are measured at 0.15 MPa [23]. Thesealso depend in detail on salt content of the cellcytoplasm. Assuming the above two tensile stressesand times in Eq. (1), we obtain a=1.26 and b=2.72,where td is in seconds and σcw is in MPa.
We note that the value of b of 2.72, is comparable to,but slightly lower than, the values of 3–4 measured fornon-biogenic materials [1,24].
The tensile stress in the cell wall, in this case, isconsidered as a membrane surrounding a pressurizedfluid (cell cytoplasm). Thus we assume that theeffective tensile strength of the cell wall varies withtime duration of the transient stress pulse, and henceeffectively the size of this impactor. The time durationof the stress pulse is approximated by
tdi2d=U ps ð2Þ
where d is the impactor diameter and Usp is the shock
velocity in the impactor calculated from the impedancematch solution of the projectile target shock interaction[25].
4. Application to shock pressure decay for impactson the earth
As a planetary impact is sketched in Fig. 1, werequire knowledge of the survivability of bacteria withincracks in the Earth upon impact. We assume thatsurviving bacteria are located beyond the radius wherethe dynamic pressure exceeds the cell wall tensile stressusing the same logic as previously discussed for lifesurvival by Cabrol et al. [26], where a very similarmodel also based on Ahrens and O'Keefe [27] scaling.For a radius, r, around the impact site, comparable to theimpactor radius, r1, the shock pressure is given by theimpedance match solution. For Earth impact, where theimpact velocities of projectiles with r1≥10 m are

Table 4Shock and particle velocity data
Material ρ0 C0 S Source
Stainlesssteel 304
7.87 4.58 1.49 Duffy [28]
Lexan 1.191 2.427 1.498 Marsh [29]Water 0.998 1.502 1.966 Marsh [29],
Rybakov andRybakov [30]
Gabbro 2.98 4.88 1.21 Marsh [29]
194 M.J. Willis et al. / Earth and Planetary Science Letters 247 (2006) 185–196
136
greater than Earth escape velocity (11.2 km s−1), theshock pressures in the impedance match region aresufficiently high that they always exceed the cell wallstrength. Outside r1, the shock pressure, P, decays and isapproximated by
P ¼ P0ðr=r1Þn ð3Þ
where
ni−0:625 log10½Viðkm=sÞ�−0:125 ð4Þ
Upon shock decay when P≤σcw, the bacteriumsurvives. As an example, we calculate survival radii asin Table 5 for several impact velocities and assumedimpactor properties: a gabbro impactor at 11 and 20 kms−1, and an ice impactor at 30 km s−1, with impactordiameters between 1.5 mm (our experimental condition)and 50 km. These were calculated using the shock waveparameters of Table 4.
Table 5 demonstrates that a 1.5 km diameterprojectile induces a shock wave with a hundred kmkill radius. Upon increasing the impactor radius to giantimpact, we find that in the 50 km diameter range, the killradius becomes close to the Earth diameter (12,800×103 m) implying that no bacteria is sustainable forimpacts larger than this value. Here we are simplysuggesting order of magnitude of the dimensions of thekill zone. Obviously, we are not taking into accountwave reflection for a free-surface that also controlsdynamic stresses. Predictive results such as shown inTable 5 may allow investigation of the effects of a range
Table 5Predicted kill radius for various impactors
Impactormaterial
Impact velocity(km s−1)
Peak pressure atpoint of impact(GPa)
Kill radius forimpactor D=1.5 mm(m)
Gabbro 11 189 0.0096Gabbro 20 506 0.0120Ice 30 540 0.0099
of impactor diameters such projectiles could beexpected in an actual planetary impact history.
5. Conclusions
Impact experiments conducted on colonies of 107 E.coli bacteria concentrated in 10 mm3 water-basedgrowth media contained within stainless steel wereconducted. Initial shock pressures of 200–300 MParesulted in mortality of organisms. Some 10−2 and 10−4
survived 218 and 258 MPa, respectively, for durationsof 800 ns. TEM images suggest that mortality wasinduced by overpressurizing cell cytoplasm, possibly asa result of transformation of water medium surroundingthe cell to ice VI or ice VII. Another hypothesis is thatmortality was induced by strong acceleration of materialby the shock front and differentially affecting thevarying densities of the media in the cell. HereRichtmyer–Meshkov instabilities deformed cell walls.The degree that leakage of impacted water media fromthe samples could affect the statistics of bacterialsurvival has not been studied, but clearly this may beanother factor. We believe our experimental arrange-ment has similarities to the sighting of early lifeorganisms living in water-filled cracks in rock. Weassume for short time scale pulses (800 ns) the criticalshock pressures (200–300 MPa) in water reflect over-pressures and these equal dynamic tensile strengths ofcell wall media. We assume that tensile failure strengthσcw depends on time scale of the impact event, tdaccording to the Grady–Lipkin (Eq. 1) relationspreviously observed in non-biogenic media. Where aand b are constants evaluated from σ1cw= 218 MPa andt=800 ns (laboratory conditions) and σ2cw=150 kPaand t2=10
3 s corresponding to Turgor pressure of E. coliand the radii (∼103 km) of the largest Earth impactorobject, yielding time scales of loading of ∼103 s. Thesevalues should be considered as very speculativeexamples.
Future experimentationmay allow determining a and bparameters for different organisms and shock (duration)loading systems. Using the bounds given above yield:a=1.26 and b=2.72 where σcw is in MPa and td in
Kill radius forimpactor D=1.5 km(m)
Kill radius forimpactor D=15 km(m)
Kill radius forimpactor D=50 km(m)
127×103 1980×103 8350×103
129×103 1940×103 7980×103
93.8×10³ 1390×103 5660×103

195M.J. Willis et al. / Earth and Planetary Science Letters 247 (2006) 185–196
137
seconds. The rate effect on tensile strength observed hereis slightly greater than the 3<b<4 values that are obtainedpreviously [1,24] for various non-biogenic media.
If the above models are valid, using the shockpressure decay model of Ahrens and O'Keefe [27] forEarth impactors suggests that for 1.5 km diameterobjects induce kill radii of 94–129 km whereas giant,50 km diameter impactors induced kill radii close toEarth's diameter, and hence approach total subsurfacemicrobial mortality.
Acknowledgments
This research is supported by the National Aero-nautics and Space Administration under Grant No.NNG04GI07G issued through NASA/Goddard SpaceFlight Center. We thank Editor Kenneth Farley for hisencouragement and patience, reviewer, Rachel Maestra,an anonymous reviewer, for a series of helpfulcomments and suggestions, and Professor CarrineBlank. Professors Joseph Kirschvink and DianneNewman also proffered comments and advice. Divisionof Geological and Planetary Sciences contribution#9089.
References
[1] D.E. Grady, L. Lipkin, Criteria for impulsive rock fracture,Geophys. Res. Lett. 7 (1980) 255–258.
[2] W.K. Hartmann, G. Ryder, K. Dones, D. Grinspoon, The time-dependent intense bombardment of the primordial Earth/Moonsystem, in: R.M. Canup, K. Righter (Eds.), Origin of theEarth and Moon, University of Arizona Press, Tucson, 2000,pp. 493–512.
[3] D. Stöffler, G. Ryder, Stratigraphy and isotope ages of lunargeologic units: chronological standard for the inner solar system,Space Sci. Rev. 96 (2001) 9–54.
[4] E.G. Nisbet, The Beginnings of Life, Chapt. 4, The Young Earth:An Introduction to Archaen Geology, Allen and Unwin, Boston,1987.
[5] S.J. Mojzsis, G. Arrhenius, K.D. McKeegan, T.M. Harrison, A.P.Nutman, C.R.L. Friend, Evidence for life on Earth before 3,800million years ago, Nature 384 (1996) 55–59.
[6] N.H. Sleep, K.J. Zahnle, K.F. Kasting, H.J. Morowitz,Annihilation of ecosystems by large asteroid impacts on theearly Earth, Nature 342 (1989) 139–142.
[7] M.D. Brasier, O.R. Green, A.P. Jephcoat, A.K. Kleppe, M.J. VanKranendonk, J.F. Lindsay, A. Steel, N.V. Grassieau, Questioningthe evidence for Earth's oldest fossils, Nature 416 (2002) 76–81.
[8] K.A. Maher, D.J. Stevenson, Impact frustration of the origin oflife, Nature 331 (1988) 612–614.
[9] C. Mileikowsky, F.A. Cucinotta, J.W. Wilson, B. Gladman, G.Horneck, L. Lindegren, J. Melosh, H. Rickman, M. Valtonen,J.Q. Zheng, Natural transfer of viable microbes in space: 1.from Mars to Earth and Earth to Mars, Icarus 145 (2000)391–427.
[10] L.E. Wells, J.C. Armstrong, G. Gonzalez, Reseeding of earlyEarth by impacts of returning ejecta during the late heavybombardment, Icarus 162 (2003) 38–46.
[11] R.A.F. Grieve, Extraterrestrial impacts on Earth: the evidence andthe consequences, in: M.M. Grady, R. Hutchison, G.J.H. McCall,D.A. Rotherey (Eds.), Meteorites: Flux with Time and ImpactEffects. Special Publication, vol. 140Geological Society ofLondon, London, 1998, pp. 105–131.
[12] M.R. Fisk, M.C. Storrie-Lombardi, S. Douglas, R. Popa, G.McDonald, C. Di Meo-Savoie, Evidence of biological activity inHawaiian subsurface basalts, Geochem. Geophys. Geosyst. (G3)4 (2003) 1103, doi:10.1029/2002GC000387.
[13] M.J. Burchell, J. Mann, A.W. Bunch, P.F.B. Brandão, Surviv-ability of bacteria in hypervelocity impact, Icarus 154 (2001)545–547.
[14] M.J. Burchell, J.A. Galloway, A.W. Bunch, P.F.B. Brandão,Survivability of bacteria ejected from icy surfaces afterhypervelocity impact, Orig. Life Evol. Biosph. 33 (2003)53–74.
[15] M.J. Casadaban, Transposition and fusion of LAC genes toselected promoters in Escherichia coli using Bacteriophase-Lambda and Bacteriophase-Mu, J. Mol. Biol. 104 (1976)541–555.
[16] R.M.E. Mastrapa, H. Glanzberg, J.N. Head, H.J. Melosh, W.L.Nicholson, Survival of bacteria exposed to extreme acceleration:implications for panspermia, Earth Planet. Sci. Lett. 189 (2001)1–8.
[17] G. Horneck, D. Stöffler, U. Eschweiler, U. Hornemann, Bacterialspores survive simulated meteorite impact, Icarus 149 (2001)285–290.
[18] A. Sharma, J.H. Scott, G.D. Cody, M.L. Fogel, R.M. Hazen, R.J.Hemley, W.T. Huntress, Microbial activity at gigapascalpressures, Science 295 (2002) 1514–1516.
[19] J.G. Blank, G.H. Miller, M.J. Ahrens, R.E.Winans, Experimentalshock chemistry of aqueous amino acid solutions and thecometary delivery of prebiotic compounds, Origins of Life andEvolution of the Biosphere, vol. 31, Kluwer Acad. Publ., TheNetherlands, 2001, pp. 15–51.
[20] Y.B. Zel'dovich, Y.P. Raizer, Physics of Shock Waves and High-Temperature Hydrodynamic Phenomena, Academic, New York,1967, 916 pp.
[21] D.H. Dolan, Y.M. Gupta, Time-dependent freezing of waterunder dynamic compression, Chem. Phys. Lett. 374 (2003)608–612.
[22] J.D. Colvin, M. Legrand, B.A. Remington, G. Schurtz, S.V.Weber, A model for instability growth in accelerated solid metals,J. Appl. Phys. 93 (2003) 5287–5301.
[23] D.S. Cayley, H.J. Guttman, M.T. Record Jr., Biophysicalcharacterization of changes in amounts and activity ofEscherichia coli cell and compartment water and turgorpressure in response to osmotic stress, Biophys. J. 78 (2000)1748–1764.
[24] H.-A. Ai, T.J. Ahrens, Dynamic tensile strength of terrestrialrocks and application to impact cratering, Meteorit. Planet. Sci.39 (2004) 233–246.
[25] T.J. Ahrens, Shock wave techniques for geophysics and planetaryphysics, in: C.G. Sammis, T.L. Henyey (Eds.), Methods ofExperimental Physics 24, Part A, Academic Press, New York,1987, pp. 185–235.
[26] N.A. Cabrol, D.D. Wynn-Williams, D.A. Crawford, E.A. Grin,Recent aqueous environments in Martian impact craters: anastrobiological perspective, Icarus 154 (2001) 98–112.

196 M.J. Willis et al. / Earth and Planetary Science Letters 247 (2006) 185–196
138
[27] T.J. Ahrens, J.D. O'Keefe, Impact on the Earth, ocean, andatmosphere, Int. J. Impact Eng. 5 (1987) 13–32.
[28] T.S. Duffy, Elastic properties of metals and minerals under shockcompression, Ph.D., California Institute of Technology, Pasa-dena, CA, 1992.
[29] S.P. Marsh (Ed.), LASL Shock Hugoniot Data, University ofCalifornia Press, Berkeley, 1980, 658 pp.
[30] A.P. Rybakov, I.A. Rybakov, Polymorphism of shocked water,Eur. J. Mech. B, Fluids 14 (1995) 323–332.