Embed Size (px)
Citation preview
MECHANISM OF PINHOLE FORMATION IN MEMBRANE ELECTRODE ASSEMBLIES FOR PEM FUEL CELLS
Vesna Stanic Teledyne Energy Systems, Inc., West Palm Beach, FL, 33417
Mark Hoberecht NASA Glenn Research Center, Cleveland, OH, 44135
ABSTRACT
The pinhole formation mechanism was studied with a variety of MEAs using ex-situ and in-situ methods. The ex-situ tests included the MEA aging in oxygen and MEA heat of ignition. In-situ durability tests were performed in fuel cells at different operating conditions with hydrogen and oxygen. After the in-situ failure, MEAs were analyzed with an Olympus BX 60 optical microscope and Cambridge 120 scanning electron microscope. MEA chemical analysis was performed with an IXRF EDS microanalysis system. The MEA failure analyses showed that pinholes and tears were the MEA failure modes. The pinholes appeared in MEA areas where the membrane thickness was drastically reduced. Their location coincided with the stress concentration points, indicating that membrane creep was responsible for their formation. Some of the pinholes detected had contaminant particles precipitated within the membrane. This mechanism of pinhole formation was correlated to the polymer blistering.
INTRODUCTION
Durability of polymer electrolyte membrane (PEM) fuel cells is one of the main problems impeding commercialization of this technology for any application. Reliability of power systems based on PEM fuel cell technology is mostly dependent on membrane electrode assembly (MEA) durability. The probability of PEM fuel cells to replace other energy conversion devices will definitively increase if longer life is verified by achieving durability targets. This is especially important for space applications where safety and reliability are the most important factors. In space applications PEM fuel cells operate on pure hydrogen and oxygen, a very aggressive environment that affects durability drastically. The minimum required life for space applications is 10,000h with other application being much higher. This is still a challenge to be demonstrated at the system level.
The most common failure mode of PEM fuel cells is gas crossover caused by pinhole formation in MEAs. Possible reasons for pinhole formation are material flaws introduced during MEA processing and conditions imposed during fuel cell operation. There are several different explanations reported to date for pinhole causes. One of the earliest attempts to identify them was done by Irvin et al.[l]. They identified small cracks in two areas and correlated their formation to the local membrane shrinkage caused by drying. The membrane drying was caused by limited water transport due to the decomposition of
This is a preprint or reprint of a paper intended for presentation at a conference. Because changes may be made before formal publication, this is made available with the understanding that it will not be cited or reproduced without the permission of the author.
https://ntrs.nasa.gov/search.jsp?R=20050198939 2018-06-27T23:03:09+00:00Z
Dacron@ wicks. In the study performed by La Conti et al. [2] failure of MEAs was assigned to peroxide formation in membranes. Peroxide radicals formed electrochemically in the membrane degraded the polymer, caused its dissolution, and failure. In addition to membrane drying and peroxide attack, the most recent work [3] correlated the surface roughness of gas diffusion layers (GDLs) with the number of pinholes. Stucki et al. [4] demonstrated that pinholes formed not only in PEM fuel cell, but also in PEM electrolyzers. They explained that pinhole formation was caused by membrane dissolution triggered by local stress.
The approach used in this paper was based on assumptions that the membrane aging, excessive heat generated locally, fuel cell configuration (design and components), and operating conditions mutually contribute to the pin hole formation. The objectives were to identify the causes and failure mechanism of pinhole formation by studying the effects of these factors individually. For this purpose the MEA mechanical degradation in oxygen and heat of ignition were studied separately in ex-situ tests, while the effects of operating conditions and fuel cell configurations were evaluated in various fuel cell tests. The MEA failure modes were analyzed by optical and scanning electron microscopes.
EXPERIMENTAL
MEAs studied
For this study MEAs with extruded and cast polymer membranes were used. They were made from 1100EW persulfonated tetrafluoroethylene (Nafion type) polymer. The membrane thicknesses ranged from - 30 pm to 170 pm. The hydrogen and oxygen electrocatalyst was platinum supported on carbon. Gas diffusion layers used were Toray TGHP-90 carbon fiber paper. More than 120 MEAs were tested in - 30 fuel cell durability trials.
Ex-situ test procedures
Aging of three different MEAs with cast and extruded membranes was performed in wet and dry oxygen at 70°C and 3Opsig. They were assembled in a fuel cell and tested without electrical load. Each experiment was carried out for 1000h. They were stopped every - lOOh and small MEA samples were cut out for microstructure analysis. When the experiments were completed, the MEA bursting strength was tested [ 5 ] . This test was performed on unsupported samples in a specially designed tool. The nitrogen gas was pressurized from one side of the sample at a rate of 2Opsi/s until it burst.
MEA heat of ignition was determined by a cone calorimeter test [6]. This test measured MEA properties in response to heat and flame under controlled conditions. The properties included heat flux, time to ignite the MEA, and temperature on the MEA surface at ignition. Two MEAs, one with a cast and a second with an extruded membrane, with the same catalyst loadings were tested. The thickness ratio of these two MEAs was - 1:1.8.
, '.
In-situ test procedure
All MEAs selected for this durability study were tested in 4-cell fuel cell stacks with hydrogen and oxygen reactants. More than 30 tests were performed at different operating conditions. To complete tests within a reasonable experimental time, the conditions were selected to accelerate the MEA failure. Assuming that reactant relative humidity is a primary factor determining MEA life, failure location and mode, two accelerated test matrices with different gas inlet relative humidities were generated. One set of accelerated tests was performed with - 100% humidified reactants, while the second set was performed with dry gases. The stacks were tested at constant current load. Variables identified in these tests as additional key factors for MEA durability, were changed and implemented in long-term tests.
The stacks were periodically leak checked for gas crossover. The measurements were performed on non-operational stacks at room temperature with nitrogen at 5 psid. When the gas cross over was - 10 times MEA intrinsic permeability [7 ] , it was considered that the MEA failed the test.
MEA failure analysis
The MEA microstructures were evaluated after failure in fuel cell tests. Evaluation of failure modes was done on MEA cross sections at the regions weakened during fuel cell operation. Other samples were crushed in liquid nitrogen for cross section analysis.
The analysis of MEA failure modes was performed with an Olympus BX60 optical microscope in different light modes and magnifications. For MEA examination at higher magnifications, a Cambridge Instruments Stereoscan 120 scanning electron microscope was used. Chemical analysis was done with an IXRF EDS 2004 microanalysis system.
RESULTS AND DISCUSSION
MEA Aging in Oxygen
MEA electrocatalyst microstructure changed during tests with dry and wet oxygen. Dry oxygen caused catalyst cracking, while humidified gas increased surface roughness. The changes that occurred during test with dry gas can be explained with MEA shrinkage. MEA components (electrocatalyst layers and membrane) have different shrinkage rates upon drying. Since catalysts layers are more porous, they dry much faster than the polymer membrane. This difference may stimulate the formation and propagation of cracks in catalyst layers. However, MEA swelling in wet oxygen increases electrocatalyst roughness. When the membrane swells its thickness increases. Since it is under constant compression, it fills out voids located on the surface of GDLs. This process creates bulges and indents on the catalyst layer, resulting in rougher surface.
The results of burst tests with MEAs aged in dry and wet oxygen show that the MEA mechanical properties did not degrade during these tests. The burst strength for MEAs with 50pm thick cast and extruded membrane is - 620 Wa. This result is in agreement
with once previously reported [8] that also indicates the resistance of Nafion type polymers to the chemical attack of oxygen.
MEA
1
MEA heat of ignition
MEMBRANE THICKNESS HEAT TIME TO IGNITION TEMPERA FLUX IGNITION HEAT TURE AT
IGNITION (Pm) (W/cmz) (Seconds) (Ws/cmz) ("C)
CAST T 1.3 6.81 8.85 296
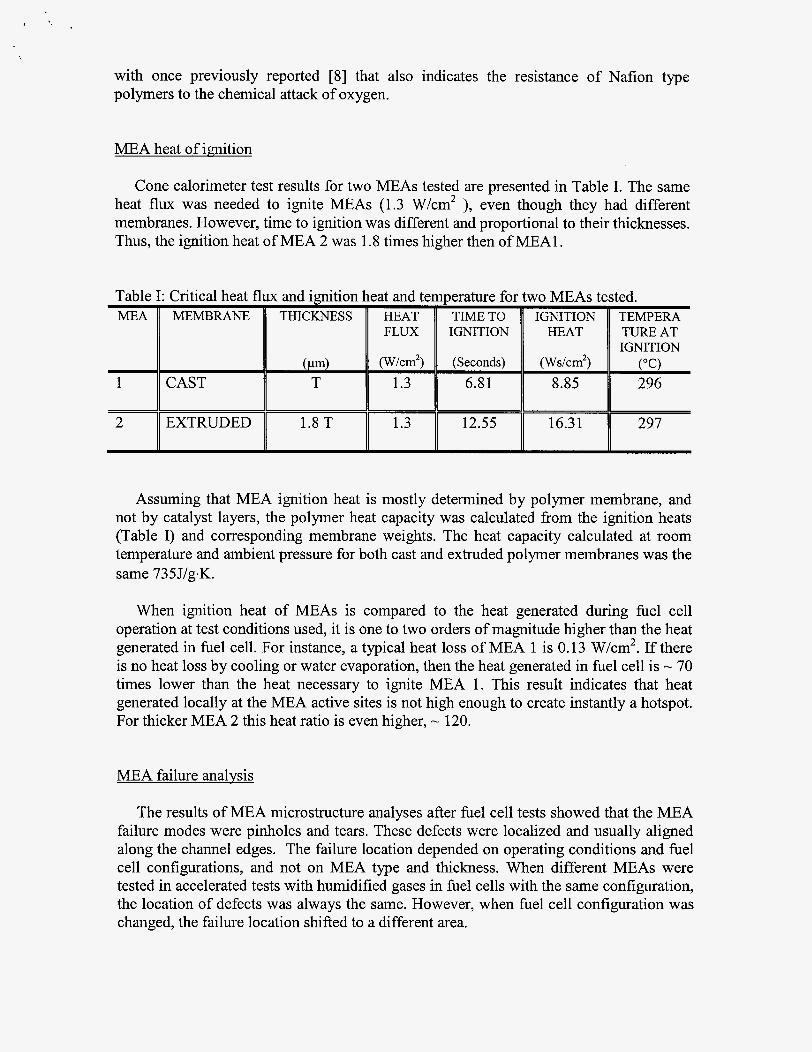
Cone calorimeter test results for two MEAs tested are presented in Table I. The same heat flux was needed to ignite MEAs (1.3 W/cm2 ), even though they had different membranes. However, time to ignition was different and proportional to their thicknesses. Thus, the ignition heat of MEA 2 was 1.8 times higher then of MEA1 .
Assuming that MEA ignition heat is mostly determined by polymer membrane, and not by catalyst layers, the polymer heat capacity was calculated from the ignition heats (Table I) and corresponding membrane weights. The heat capacity calculated at room temperature and ambient pressure for both cast and extruded polymer membranes was the same 735 J1g.K.
When ignition heat of MEAs is compared to the heat generated during fuel cell operation at test conditions used, it is one to two orders of magnitude higher than the heat generated in fuel cell. For instance, a typical heat loss of MEA 1 is 0.13 W/cm2. If there is no heat loss by cooling or water evaporation, then the heat generated in fuel cell is - 70 times lower than the heat necessary to ignite MEA 1. This result indicates that heat generated locally at the MEA active sites is not high enough to create instantly a hotspot. For thicker MEA 2 this heat ratio is even higher, - 120.
MEA failure analysis
The results of MEA microstructure analyses after fuel cell tests showed that the MEA failure modes were pinholes and tears. These defects were localized and usually aligned along the channel edges. The failure location depended on operating conditions and fuel cell configurations, and not on MEA type and thickness. When different MEAs were tested in accelerated tests with humidified gases in fuel cells with the same configuration, the location of defects was always the same. However, when fuel cell configuration was changed, the failure location shifted to a different area.
Accelerated tests vvith dry gases were cmied out with As md k e % cell failure foeations
h ~ i ~ ~ ~ e d and s cbse to the reactant in8etss, Since the e ~ e ~ t r ~ c h ~ ~ i c a ~ r e ~ c t ~ o n rate is
~ o ~ c e ~ t r a t i o ~ ~ the MEAs have bigher reaction rates at these nsities and further
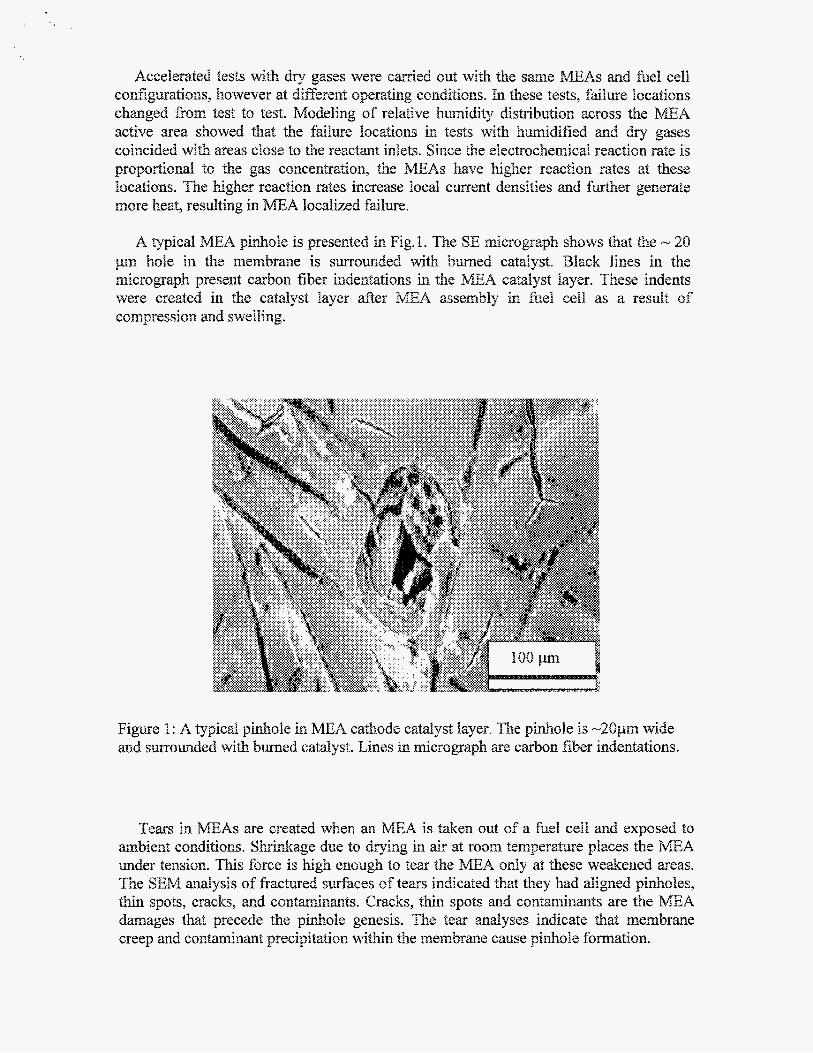
Figure 1: A typical pi de catalyst layer. The p i ~ o l e is -2Opm wide and s ~ ~ o ~ ~ e d with b a e d catalyst. Lines in ~ ~ r o ~ r a ~ ~ are carbon fiber ~ ~ d e ~ t a t i o n s .
Tears in MEAs a e created when an MEA is taken out of a fuel cell and exposed to e to drying in air at room temp
mder tension. This forc n~ugh to tear the MEA only at analysis of fractured aces of teas indicated that they had aligned pinholes,
damages that precede the pidole genesis. The tea analyses indicate that membrane creep and c ~ n ~ i n ~ t ~ r e c i ~ i ~ a t i o n within the m e ~ b r ~ e cause ~ ~ ~ o ~ e ation ion.
spots, cracks, md con inants. Cracks, thin spots md c o n ~ ~ i ~ ~ t s are the MEA
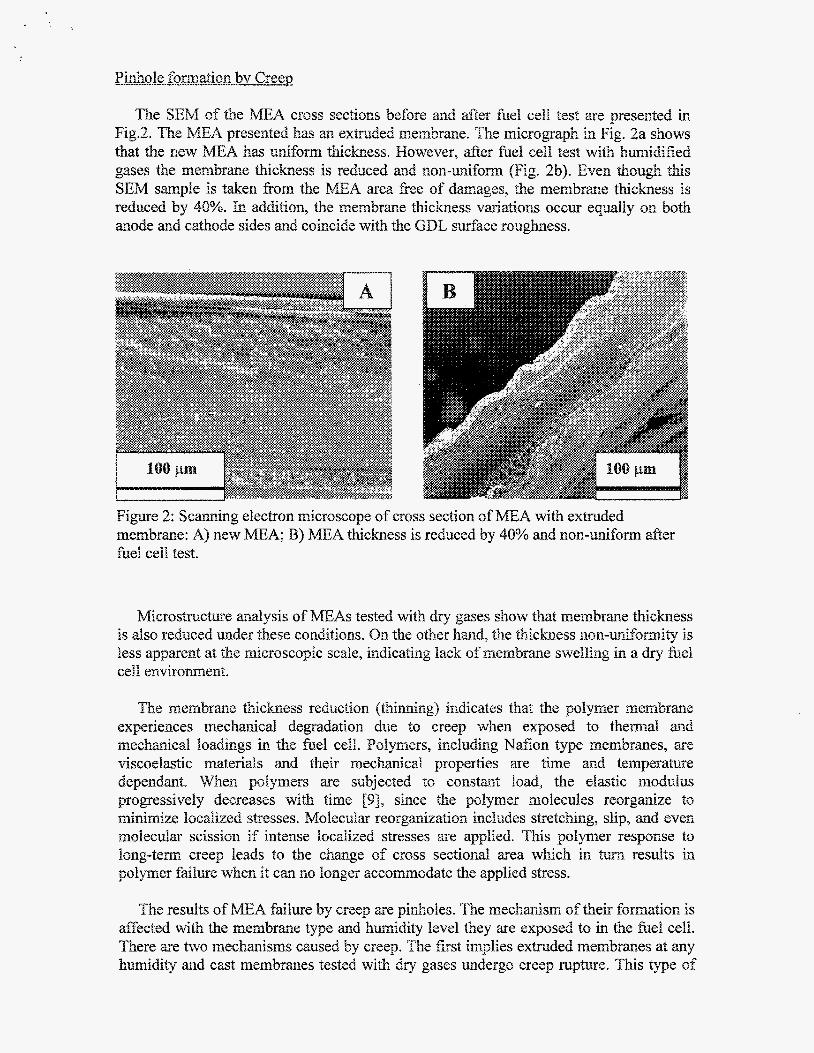
crosc5~e of cross section af m e ~ ~ r ~ e : A) new MEA; B) MEA thickness is reduced by 40% md n ~ ~ - ~ n i f o ~ after fael cell test.
M i c r o s ~ c t ~ e ~ a ~ ~ s i s of MEAs tested with dry gases show that ~ e ~ ~ r ~ e ~ c k n e s s is a h reduced under these c ~ n ~ ~ t i ~ ~ s ~ 8xr the other hmd, the t h ~ c ~ ~ s s n o ~ - ~ n ~ f ~ ~ i ~ is less apparent at the m ~ c ~ ~ s c o ~ i c scale, i n d i c ~ t ~ n ~ lack ~f m e ~ ~ r ~ e swelling in a cell ~ n v ~ o ~ e n t .
The results of MEA failme by creep are pinholes. The m e c h ~ s ~ ~ of their f o ~ a t ~ o ~ is affected with the ~ e ~ b r ~ e e m d h ~ ~ c l i ~ level they me exposed to in the fuel cell. There are ~o m ~ c ~ ~ i s ~ ~ caused by creep. The first implies extruded m e m ~ r ~ e s at my ~ ~ ~ d i ~ mcl cast ~ e ~ b r ~ e s tested with dry gases ~ m ~ e r ~ o creep ~ ~ ~ e . This type of

creep failwe involves crac ~ e ~ e ~ o ~ ~ e n t when the critical this critical n ~ b e ~ is 75% for both exmd
de~ected in fractured s in both exmde cast ~ e ~ b r a n e s are
ess reductio~ is reached. cast m e ~ b r ~ e $ ~ Cracks
on mode side. n e y agate under con reate a le& path for the gases. Since h y ~ o g e n m d ~ x y ~ e n chemica~ e ~ o ~ e ~ i c (285 kJ/mo1e of hydro~en~, he2t produced even with small
~ y d r o ~ e n c~ossovers can i ite the MEA. Thus, to create a pinhole in an e ~ e ~ b r a n e r resented in Fig. TSb, a h ~ ~ r o ~ e n flow rate should be only flow rate is cakedated based on the pinh51e size m d MEA nitio ion heat (Table 0,
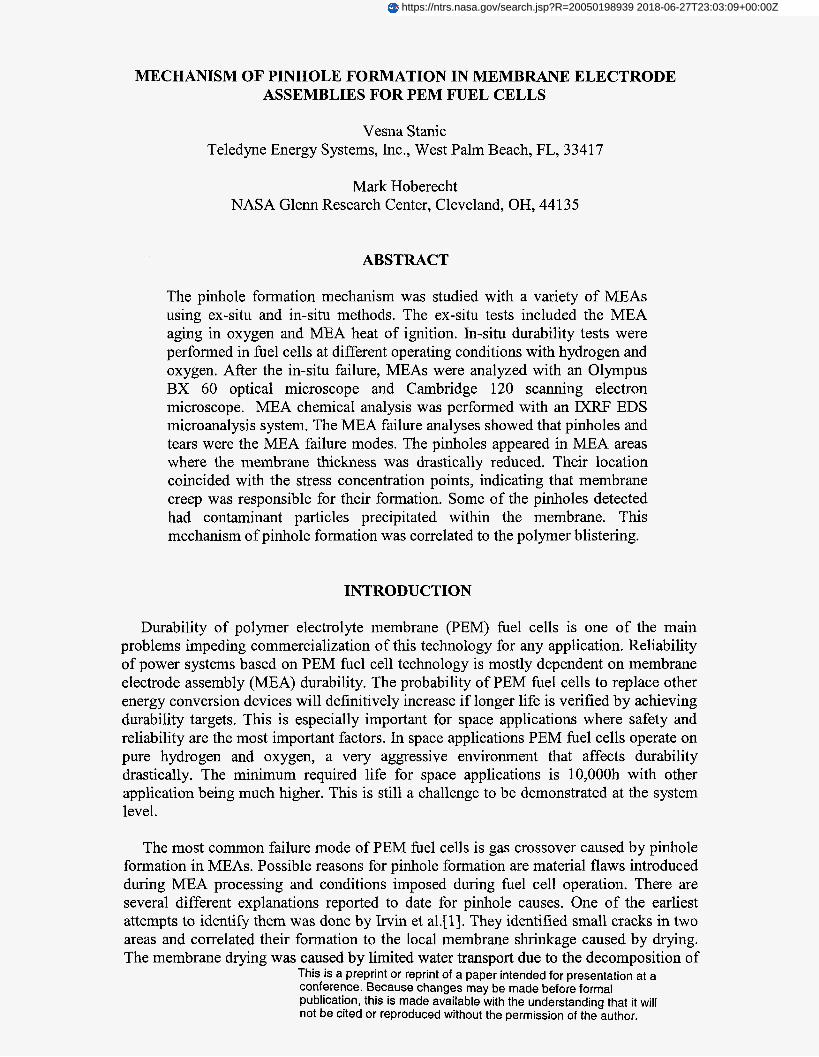
ing electron ~ e r o s c ~ ~ e mbrme and is tested wi
ed surlt2ce oftear in MEA. This MEA ed gases: A) two
from mode to cathode side. The ~ e ~ ~ r ~ e thickness is reduced by A pidlole in the same MEA
The second ~ e c ~ a ~ s ~ o f pinhsle f o ~ a t i o n by creep that occurs in cast ~ e m b r ~ e s tested with ~ ~ i ~ i ~ e d gases is caused by m e ~ ~ r a n e thichess re~uc~ion ~ ~ ~ ~ ~ n g ~ . The results of ~ i c r o s t ~ c t ~ e malysis showed that ~ e ~ ~ r ~ e t h ~ c ~ e s s decrease by ~~~
before it collapses. Spots only 5pm thick are detected in a cast ~ e ~ ~ r ~ e . m e n ~ e ~ b ~ m e colla~ses it becomes too thin, and is no longer a barrier to the mixing of gases. They react c ~ e ~ c a € l y and create a pihole.
The failwe analysis o localized. Fuel cell e ~ ~ e r i m e n ~ ~ results indi EA is ~echanical1y m d ~ h e ~ m a l ~ ~ overstressed. The anisotropic co~press~on md heat d i s t ~ b ~ t ~ o n in fuel cell at the ~ a c r o s ~ o ~ ~ c level, caused by ~ m p r o ~ ~ r stack c o ~ i ~ ~ a ~ i o n and water ~ a n a ~ e ~ e n ~ , create MEA. areas that are more active and thus generate more heat. Any i ~ ~ e ~ e c ~ ~ o ~ that exists in the MEA 513 the microscale results in ~ i ~ o l e ~ o ~ a t i ~ ~ . The reason for this i s &e ~ccelera~ion 5f creep [lo]. Thus, locations that operate under hi er c ~ m ~ ~ e s s i 5 n md t ~ ~ p e r a t ~ e fail faster. Stress ~ o ~ ~ e n ~ ~ a ~ i o n points in the MEA may be caused by GBL surface ~ o ~ ~ ~ e s § , broken carbon fibers, or debris localized at the ~~~~B~
EAs show that tears md ~ ~ ~ o ~ e s that they appear in areas where

In a d ~ t i o n to failure caused by ~ e ~ ~ ~ ~ e creep, As ~ S Q failed due to eleckon ~ i ~ r o ~ a ~ h ~
cross sec~~on with c ; i - aon t~ in~ t particles. The ed surface of a tea. The micro
c o n t ~ i n ~ t ~ preci~itate~ within &e m e ~ ~ r ~ e . The sc
e ~ a ~ i c l e s with similar sizes, The ter- Similar, but smaller b en the adjacent ox
A ~ o n t ~ i ~ ~ a t i o n was a reason for gi~hole ~ o ~ a t i o n ~ the %el cell losses were i ~ e a s ~ a % l e ~ Indeed, they d e ~ o n s ~ a t e d a %I
increase of 20 p V h The volt e increase was directly ~ r o ~ ~ ~ i o ~ ~ ~ to the r e s i s t~ce decay. The resist e drog~ed from 0.983 to 0 * ~ ~ ~ ~ ~ m ~ ' This result i~dicated that the membr ~ n t ~ i n a n ~ s were lo in n ~ o w IEQSPeS dong the c h a e l s where the MEA failed.
The results of EDX c ~ e ~ i c a l analysis of c o ~ t ~ i ~ ~ t particles d e ~ o n s ~ a t e that they contain a metal oxide, ~ivalent cation I%IH~+ is leached out tpy liquid water that C Q M ~ S into
crystal n ~ c l e a t i ~ n sites with -SO3-. Since the sulfonic 6- goups are Exed to the ~ o l ~ e r ~ o l e c ~ l e s , they c m o t ~ a ~ i ~ i ~ a t e in the crystal . Thus, the metal oxide c ~ ~ t a ~ ~ t e s c o ~ ~ i n ~ e to liquid water and oxyg
colltac$ With a c Q n t ~ i l l ~ ~ SOWCe. The I%IH2+ laces EX+ in the membrane and m
within the ~ e m % r ~ e being constant~y s ~ ~ ~ l i e d by &e gas stream, In the areas where the cation con
er, such as the inlet channels of oxygen and h y ~ o ~ e ~ , the crystals are much larger ng the ~ ~ a ~ ~ ~ s where the cation ~;i-aon~entration is d

9
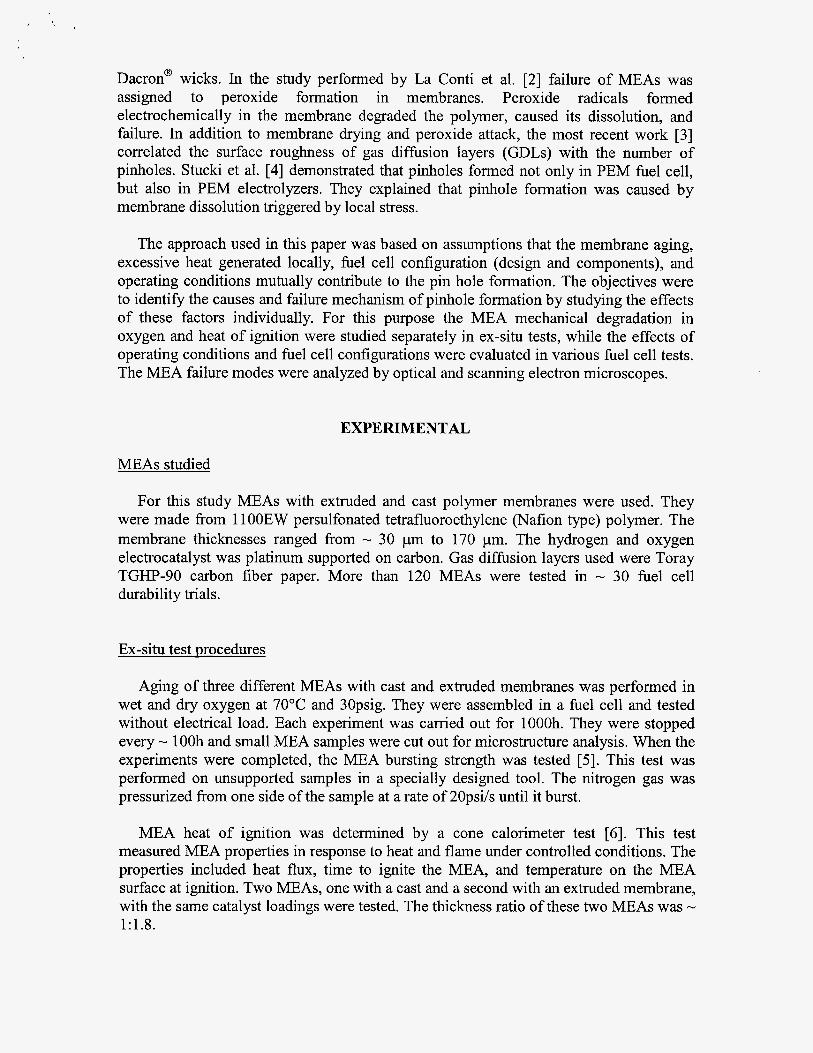
Figure 4: ~ c ~ n g electron graphs of c o n ~ ~ i n ~ t particles m d blisters in ~ e m b r ~ e created a l
m e m b r ~ e ~ c> two small particles in the ole created due to ~ o n t ~ i ~ ~ t p r e ~ i ~ i ~ t i o n and
The presence of co cles in the ~ e ~ ~ r ~ e causes blister f o ~ a ~ i o n ~ ~ ~ i § ~ e r ~ ~ ~ is a well-ho e ~ e c ~ a n ~ ~ m [BPI c m also be used to explain the ~ ~ ~ o ~ e ~ o ~ a t i o ~ in Nafion type m e m ~ r a ~ g . The icles that exist ~i~ the m e m ~ r ~ e create small voids ~o~~ them These voids are filled with ~ i ~ ~ ~ d water.
en. the cell is heated from room t e m p e r a ~ ~ e to the he8 cell Qpera~in~ t e m p e r ~ ~ g ~ the water vapor partid. presswe increases in tbese voids, an expmds them, Since the processes of the pmicle and blister ~~~~ are c o n ~ ~ ~ ~ o ~ ~ the small blisters (Fig. 4b) will eventually coalesce md large ones Fig, 4a). Large blisters such as this, allow
sults in their chemical reaction m d p h b k f ~ ~ a t i ~ ~
CONCLUSIONS
Failure analyses of MEAs indicate that mechanical and chemical changes in MEA cause pinholes. The mechanical changes are related to the membrane creep. Depending on the membrane type and humidification level in fuel cell tests, two different mechanisms of pinhole formation by creep are identified. The first mechanism includes crack development and propagation that leads to the reactant gas crossover. This mechanism is typical for extruded membranes at any humidity condition as well as cast membranes at dry conditions. The creep of cast membranes tested with humidified gases results in a different mechanism. It involves the reduction of membrane cross sectional thickness until it no longer acts as a gas barrier.
Accelerated durability tests with dry and humid hydrogen and oxygen suggest that anisotropic distribution of compression and heat across the MEA active area causes failures. These non-uniform conditions are the result of the fuel cell configuration and operating conditions. However, the stress concentration points localized at the MENGDL interface cause compression and heat variation on the microscopic level. When their effect is superimposed on the heat and compression variations on the macro scale, then pinholes are created in localized areas of MEA.
In addition to pinholes created by creep, some are formed due to MEA chemical failure. This failure is a consequence of proton replacement in the polymer membrane with larger cations leached out with liquid water from the fuel cell or system components. This mechanism of pinhole formation occurs through several steps. The first step includes contaminant particle nucleation and growth within the membrane from cations and oxygen provided with fluid streams coming into the fuel cell. When they begin to form, the particles are surrounded with small voids. During fuel cell therm0 cycles, these voids enlarge and create blisters. Blisters create a path for gases to crossover and mix.
The weak spots in membrane created by either mechanical or chemical failure mode, such as cracks, thin spots or blisters, allow gas mixing. The chemical reaction of hydrogen and oxygen generates enough heat to melt the polymer, bum the catalyst and form a pinhole in MEA.
ACKNOWLEDGEMENT
The authors gratefully acknowledge the financial support of NASA Glenn Research Center (contract # NAS 3-02093 and NAS 3-02203).
REFERENCES
1. L. F. Irvin, Evaluation of an Ion Exchange Membrane Fuel cell For Space Power,
2. A. B. La Conti, A.R. Fragala, and J. R. Boyack, in Proceedings of the Symposium on (1974) p. 1-13.
Electrode Materials and Processes for Energy Conversion and Storage, J. D. E.

Mcintyre, S. Srinivasan, and F. G. Will, Editors, p.354, The Electrochemical Society Proceeding Series, Princeton, NJ (1977).
3. V. Peinecke, J. von der Osten-Fabeck, J. R. Gordon, H. R. Haas, US Patent 6,716,551, April 6,2004.
4. S. Stucki, G. G. Sherer, S. Schlagowski, E. Fischer, J. Applied Elchem., 28, 1041 (1 998).
5. ASTM D3662.
7. J. L Larminie, A. Dicks, Fuel cell Systems Explained, p.47, John Wiley & Sons, Ltd.,
8. S. Stucki, G. Theis, R. Kotz, H. Devantay, H.J. Christen, J. Electrochem. SOC., 132,
9. J. Scheirs, Composition and Failure Analysis of Polymers, p. 3 15, John Wiely & Sons,
10. D. R. Askeland, The Science and Engineering of Materials, p.488, PWS Publishing
1 1. J. St-Pierre, D.P. Wilkinson, S. Knights, M.L. Boss, J. New Mat. Electrochem.
6. ASTM E-1354-97
Chichester (2000).
1041 (1985).
Ltd., New York (2000).
Company, Boston (1994).
Systems, 3,99 (2000).

. *. . 4
Keywords: MEA pinholes, MEA durability, Pinhole formation, PEM durability