Embed Size (px)
Citation preview
MECHANICS OF DEFORMATION AND FRACTURE OF SILICON ELECTRODES IN
HIGH-CAPACITY LITHIUM-ION BATTERIES
BY
HAORAN WANG
DISSERTATION
Submitted in partial fulfillment of the requirements
for the degree of Doctor of Philosophy in Aerospace Engineering
in the Graduate College of the
University of Illinois at Urbana-Champaign 2018
Urbana Illinois
Doctoral Committee
Assistant Professor Huck Beng Chew Chair
Professor John Lambros
Professor Philippe H Geubelle
Associate Professor Elif Ertekin
ii
ABSTRACT
Lithium ion batteries a high energy density system store energy by insertion of Li ions into
solid electrodes Silicon is one of the most promising electrode materials for high performance
lithium ion batteries since it has a specific capacity of ~10 times higher than conventional
graphite electrodes During lithiation the Si electrodes form LixSi compounds and undergo a
huge volume expansion of ~300 The inhomogeneous deformation during charge-discharge
cycles will subject the Si electrodes to large stresses massive cracking and subsequent loss of
capacity The objective of my PhD dissertation is to elucidate the mechanisms of deformation
and failure of the Si electrodes during the electrochemical cycling process using atomistic
simulations comprising of density functional theory (DFT) calculations and molecular dynamics
(MD) simulations The specific objectives are to (i) quantify the deformation behavior of the Si
electrodes as a function of Li concentration (ii) understand the mechanisms underlying the
eventual delamination of the Si electrode from the current collector after a number of charge-
discharge cycles and (iii) elucidate the properties of the solid electrolyte interphase (SEI) formed
between Si electrodes and the electrolyte and understand how this interphase layer influences
the lithiation-deformation behavior of Si electrodes
The stress-strain response of lithiated Si electrodes LixSi was calculated with DFT and the
underlying mechanisms explaining the brittle-to-ductile transition of LixSi with increasing x was
uncovered Results show that plasticity initiates at x lt 05 with the formation of a craze-like
network of nanopores separated by Si-Si bonds while subsequent failure is still brittle-like with
the breaking of Si-Si bonds Transition to ductile behavior occurs at higher Li concentration of x
ge 1 due to the increased density of highly stretchable Li-Li bonds which delays nanopore
iii
formation and stabilizes nanopore growth At a higher length scale these changes in the bonding
properties ultimately translate into significantly higher flaw tolerance of LixSi alloys as revealed
by large-scale MD simulations
Other studies have successfully demonstrated the mitigation of Si electrode cracking through
the use of small-sized electrodes However the delamination of crack-free electrodes from the
current collector was still reported after a number of charge cycles resulting in the loss of
electrical contact and subsequent capacity fade To gain insights into this delamination process
ab initio calculations were used to reconstruct the interdiffused Li-Si-Cu interphase structure
between the lithiated Si electrode and a Cu current collector Under shear deformation induced
by Si expansion well-delineated and weakly bonded Si-Cu and Li-Cu crystalline atomic layers
form within this interphase structure and then sliding can happen between the electrode and the
current collector This interfacial sliding will help release stresses introduced by the lithiation
process However it can be terminated by the formation of LiSi3 compounds across the Si-Cu
and Li-Cu atomic layers causing the build-up of interfacial stresses and eventual delamination of
the Si electrode from current collector
One other consequence of the huge volume expansion of LixSi electrodes during charge
cycling is the cracking of the ~100 nm thick SEI layer To understand how strain is transferred
from LixSi to the SEI and induce cracking DFT calculations were performed to quantify the
stress-strain response of two major inorganic SEI components-LiF and Li2O-bonded to LixSi
Results show that LiF effectively bonded on LixSi at x gt 1 enables the entire LiF-LixSi interface
structure to deform plastically by forming delocalized stable voids and thus can better
accommodate the volume changes of the Si electrodes In contrast Li2O tightly bonded to LixSi
iv
is stiffer and deforms rigidly across all x These results explain the significantly improved
ductility of SEI with higher LiF versus Li2O content per experimental observation
v
ACKNOWLEDGEMENTS
Since I came to UIUC in spring 2014 until now Irsquove had a very unforgettable PhD life And I
want to thank many people who have been part of my wonderful life journey here in Champaign-
Urbana IL
I would like to first appreciate my PhD advisor Prof Huck Beng Chew who brought me to
the new field of multiscale computation and the interesting research topic of Li-ion batteries He
spent a lot of time discussing research with me through which I learned how to approach a
research problem how to formulate a research paper and how to make a professional
presentation
I would then like to thank Prof Geubelle Prof Lambros and Prof Ertekin for serving on my
Doctoral committee and also for their sound suggestions for my research Besides I also had the
fortune to take courses from some other famous solid mechanics scholars such as Prof
Sehitoglu Prof Masud Prof Sofronis and Prof Starzewski I spent many sleepless nights when
taking those courses and I also gained lots of unique knowledge that makes the study experience
at UIUC different from others
I want to thank my group colleagues We discussed about research and course studies We
also share lots of interesting life memories
I also want to acknowledge the support of National Science Foundation (Grant No NSF-
CMMI-1300805) as well as super-computational resources provided by TACC (Grant No
TGMSS130007) and Blue Waters at NCSA
At the end I want to thank my family for their support and encouragement
vi
TABLE OF CONTENTS
CHAPTER 1 INTRODUCTION 1
CHAPTER 2 LITERATURE REVIEW 5
CHAPTER 3 MECHANICAL BEHAVIOR OF LITHIATED SILICON ELECTRODES 12
CHAPTER 4 INTERFACIAL SLIDING AND DELAMINATION OF SILICON
ELECTRODES ON CURRENT COLLECTOR 48
CHAPTER 5 NANOMECHANICS OF SOLID ELECTROLYTE INTERPHASE ON
SILICON ELECTRODES 67
CHAPTER 6 CONCLUSIONS AND FUTURE WORK 80
REFERENCES 88
APPENDIX ABAQUS SUBROUTINE FOR LITHIATION AND DEFORMATION OF
SILICON ELECTRODE 97
1
CHAPTER 1 INTRODUCTION
Li-ion battery was first developed by Sony in 1992 marking a great leap forward in
rechargeable battery technologies1 Figure 11 compares the energy density of Li-ion batteries
against conventional lead-acid rechargeable batteries and nickel-cadmium rechargeable
batteries2 A Li-ion battery comprises of the cathode anode and electrolyte The cathode is
typically Li-containing crystalline compounds During charging the cathode loses Li atoms and
the Li atoms are decomposed into Li ions and electrons The electrons flow through an external
circuit and the Li ions diffuse into electrolyte towards the anode which is conventionally
graphite but is taken to be Si as the purpose of this dissertation At the interface between the
electrolyte and the anode Li ions will combine with electrons flowing through the external
circuit to form Li atoms prior to diffusing (intercalating) into the anode A schematic of the
cathode-electrolyte-anode structure of Li-ion battery and the electrochemical reaction during
charging is shown in Figure 12 Prior to the intercalation of Li atoms into the anode Li atoms
can first react with the electrolyte during the initial few charging cycles to form a ~10-100 nm
thin passivating film on the surface of anode3 called solid-electrolyte-interphase (SEI) as shown
in Figure 12 Once formed the SEI prevents further decomposition of the electrolyte and
consumption of Li ions which is important for Li-ion battery operation
Commercial Li-ion batteries are based on conventional graphite anodes a typical insertion-
reaction electrode4 During charging Li atoms diffuse into the graphene interlayer spacing
allowing each Li atom to bond with six carbon atoms on average This yields a volumetric
(gravimetric) energy density of 770 Whl-1 (260 Whkg-1) which is far below the US Department
of Energyrsquos target of 400 Whkg-1 by the current year 20175 Furthermore as shown in Figure 13
2
current Li-ion battery technologies based on conventional graphite electrodes are fast
approaching the physicochemical limit implying that new electrode materials are needed In
comparison Si anodes operate under a conversion-reaction process and stores Li atoms by
forming amorphous LixSi alloys (0ltxlt375) Since each Si can theoretically bond with 375 Li
atoms its specific capacity of ~3500 mAhg-1 is ~10-fold that of conventional graphite
electrodes6 In addition to its widespread availability Si is therefore an ideal alternative electrode
material for high-capacity Li-ion batteries Because of its high specific capacity however fully-
lithiated Si can undergo ~300 volume expansion The large inhomogeneous deformation of the
Si electrode can lead to (a) mechanical degradation and cracking of the electrode (b)
delamination of the electrode from its current collector and (c) fracture of the SEI interphase
layer on the surface of the electrode7 These three factors in combination contribute to capacity
fade of the Li-ion battery and are current outstanding roadblocks to the use of silicon-based
electrodes
Figure 11 Comparison of different battery technologies in terms of volumetric and gravimetric
energy density2
3
Figure 12 Schematic of Li-ion battery structures and the electrochemical process during
charging
Figure 13 The development of Li-ion batteriesrsquo energy density in the past 20 years10
The goal of this dissertation research is to elucidate the micro-mechanisms of deformation
and failure of the Si electrodes during the electrochemical cycling process using density
functional theory (DFT) calculations and molecular dynamics (MD) simulations The specific
objectives are to (i) quantify the deformation properties and failure behavior of the Si electrodes
as a function of lithium concentration (ii) understand the mechanisms underlying the eventual
4
delamination of the Si electrode from the current collector after a number of charge-discharge
cycles and (iii) elucidate the properties of the passivating solid electrolyte interphase (SEI)
formed between Si electrodes and the electrolyte The organization of this dissertation is as
follows
Chapter 1 An introduction of the current technologies and mechanical degradation problems
of Si-based Li-ion batteries
Chapter 2 An overview of the most recent studies on Si electrodes in high-capacity Li-ion
batteries
Chapter 3 Evolution of Si electrodesrsquo mechanical properties at different charging (lithiation)
stages and its influence on the fracture behavior
Chapter 4 Atomic scale mechanisms of interfacial sliding and delamination between Si
electrodes and Cu current collector
Chapter 5 The contributions of the primary compositions of SEI (LiF and Li2O) to the strain
transfer mechanisms across the Si electrodeSEI interface
Chapter 6 Conclusions of my dissertation research and future work towards the design of
next-generation high-capacity batteries
5
CHAPTER 2 LITERATURE REVIEW
21 Mechanical Failure of Li-ion Batteries
Studies have shown that the ~300 volume expansion of the Si electrode after complete
lithiation leads to massive cracking and pulverization of the electrode Figure 21 shows a Si thin
film electrode before lithiation and after the 10th charge cycle Massive cracking of the electrode
can be observed in the latter8 Cracking in the thin film initiates during the first charge-discharge
cycle9 and the cracks become deeper and more densely distributed with continued cycling
Studies have attempted to quantify the fracture toughness of Si electrodes at different lithiation
stages Pharr et al obtained the stress variation of a ~300 nm thick Si film on an elastic substrate
at different lithiation stages by monitoring the curvature change during a charge-discharge cycle
They reported that both unlithiated and lithiated Si electrodes share similar fracture toughness
values of ~5-9 Jm29 More recent nanoindentation experiments however demonstrated that the
fracture toughness of LixSi increases with Li content (x) and resulted in ultra-high flaw tolerance
of the electrode10 Using atomistic simulations Khosrownejad and Curtin subjected LixSi (x =
05 10 and 15) alloys with an initial 20 nm long crack to a mode I K-field displacement loading
and showed that the LixSi alloys for all three Li concentrations underwent ductile fracture by
void nucleation growth and coalescence The measured critical fracture toughness (KIC) of LixSi
was shown to decrease slightly with increasing x but the energy release rate (JIC) remained
constant11
6
Figure 21 SEM top-view images of the thin film Si electrode (a) before lithiation (b-c) after
10th charge8
The inconsistencies in the above-mentioned studies stem from a lack of understanding of the
mechanistic processes underlying the deformation and fracture of LixSi alloys at varying x The
first insights were provided by early DFT calculations to quantify the elastic constants of LixSi at
various x It was shown that the Youngrsquos modulus of amorphous LixSi decreases from 100 GPa
at x = 0 to ~20 GPa at x = 37512 This elastic-softening behavior was also reported
experimentally from tensile and ex-situ indentation testing of LixSi13 14 In addition the lithiated
Si electrodes are observed to undergo plastic deformation which is in contrast to the brittle
nature of unlithiated Si Experimental studies have shown that Li15Si4 nanowires could undergo
~70 tensile strain prior to fracture with residual plastic strain of ~52 remaining on the wire
after fracture15 Building on these studies my dissertation research in Chapter 3 aims to elucidate
the underlying atomistic mechanisms of plasticity in amorphous LixSi alloys and to understand
how this plasticity process ultimately influences the fracture behavior of the electrode
22 Interfacial Sliding and Delamination of Si Electrodes from Current Collector
There is now increasing evidence that the mechanical degradation of Si electrodes under
electrochemical cycling can be mitigated through the use of electrodes of small feature sizes
such as nanowires nanoparticles porous configurations thin films and core-shell structures16-19
7
Such nanostructured Si electrodes display significantly higher reversible charge capacity and
longer cycle life because the small characteristic dimensions of these electrodes lead to reduced
energy release rate which is insufficient to drive crack propagation However even though
electrode cracking can indeed be mitigated through the use of nanostructured electrodes such
electrodes still exhibit capacity fade after a critical number of charge cycles Figure 22(a) shows
the Scanning Electron Microscopy (SEM) image of a Si thin film electrode after 30 charge
cycles20 Cracking initiates during the initial charge cycle but the electrode still maintains its
charge-carrying capacity since the fractured Si electrodes remain connected to the Cu current
collector After the 30 charge cycles observe that many of the cracked Si islands are now
detached from the Cu current collector and pile up at region 3 while the remaining Si islands
remain well adhered to the current collector at region 1 Figure 22(b) shows the variation of
specific capacity with respect to cycle number It is noted that (a) the film thickness influences
the specific capacity and (b) the capacity is well maintained during the first 20-30 cycles but
suddenly fades in a steady manner after a critical number of cycles
Figure 22 (a) SEM morphology of 1 μm Si film after 30th charge cycle at ~C25 rate indicates
3 regions (1) well adhered Si islands (2) detached Si islands and (3) Si islands pileup (b)
Specific capacity decays with charge cycles at ~C25 rate3
8
The delamination of Si electrodes from current collector is still an unresolved problem in the
design of Si-based lithium ion batteries Haftbardaran et al proposed to use patterned thin-film
islands of Si21 and demonstrated that delamination was mitigated when the Si island adhered on
current collector was smaller than 7-10 μm They explained this phenomenon on the basis of a
shear lag model by borrowing the well-accepted concept used to explain stress transfer at fiber-
matrix interface in composite materials Based on the shear-lag model a ~35 μm shear lag zone
exists at the edge of each Si island During lithiation the Si island within the shear lag zone can
slide with respect to the current collector to release the stress induced the volume expansion once
shear stress at the interface reaches 40 MPa This enables Si islands smaller than 7 μm in
dimensions to freely slide on the current collector without delamination For larger Si islands
however the silicon-current collector interface outside the shear lag zone will be subjected to
large interfacial stresses which can induce delamination To date however much is still
unknown about the interface bonding the silicon electrode and a metal current collector such as
copper Stournara et al showed that Li atoms tend to segregate along a well-delineated
amorphous lithiated-silicon and crystalline-copper interface which dramatically reduced the
sliding resistance22 However significant intermixing of Cu Si and Li atoms at the interface
between a silicon film and a copper substrate has been reported during electrochemical cycling20
and the following questions remain to be answered (a) what is the exact composition at this Cu-
Si-Li interphase and (b) how the interphase structure influences the deformation behavior at the
Si electrodeCu current collector interface In addition (c) why delamination happens only after
a critical charge-cycle is also unknown My dissertation research in Chapter 4 addresses these
open questions (a)-(c)
9
23 Solid Electrolyte Interphase
The solid electrolyte interphase (SEI) is a thin film of ~10 to 100 nm thick at the anode-
electrolyte interface of a Li-ion battery It is formed by irreversible decomposition of the
electrolyte upon first charging of a pristine Li-ion battery The formation of a stable SEI film is
crucial to the operation of a Li-ion battery since it passivates the anode surface against further
reactions with the electrolyte but allows for Li ion conduction The mechanical integrity of the
SEI is particularly important in the case of Si electrodes Studies have shown that the SEI film
cracks because of the ~300 volume expansion of Si anode during charge cycling which
exposes new Si surface to the electrolyte23 The subsequent formation of new SEI layer
irreversibly consumes Li ions Repeated cracking of the SEI film has been proposed as a primary
mechanism which leads to eventual capacity fade24 Figure 23 (a) shows atomic force
microscopy (AFM) imaging of SEI film cracking after the 3rd cycle of lithiation25 Figure 23 (b)
shows the composition of Si electrode after 100th lithiation cycle26 The unreacted Si (white) is
surrounded by several hundred nm thick LiF (green) which is a major component of SEI The
parasitic reactions of forming SEI and trapping Li were proposed to be the most important reason
for capacity fade of the Li-ion battery26 This problem is exacerbated through the use of
nanostructured Si anode materials due to the increased surface area available for SEI to form
Hence the formation of a chemically and mechanically stable SEI film remains an open
challenge and constitutes a major step towards achieving high-capacity Li-ion batteries
10
Figure 23 (a) Atomic force microscope image of SEI cracking on a Si electrode after 3rd
lithiation cycle (b) Unreacted Si (white) is surrounded by very thick SEI (green) obtained from
scanning transmission electron microscopy and electrode energy loss measurement1213
Previous studies have primarily focused on the reaction pathways rates and byproducts of
the electrolyte decomposition reactions in the formation of SEI3 27-33 Si anode surface is found
to participate in the chemical reaction with electrolyte resulting in the formation of a significant
amount of LixSiOy This consumption of Si atoms through the chemical reaction of Si with the
electrolyte results in a loss of charge-carrying capacity of the electrode26 To prevent capacity
loss fluoroethylene carbonate (FEC) has been widely used as an additive to the electrolyte30 31
34-36 The resulting SEI film containing abundant LiF is believed to have improved chemical
stability and structural integrity29 37 Other studies have focused on the use of varying electrical
potential to tune the SEI film thickness and morphological roughness of the SEI38 It was shown
that thinner and smoother SEI formed by fast initial reaction was less resistant to the ion
conduction and more stable but was stiffer which makes SEI less tolerant to deformation This
was found to be related to the different compositional percentages of LiF and Li2CO3Li2O
within the SEI film which are the major inorganic components in SEI More recent studies have
11
proposed the use of artificial SEI film coatings on the Si anodes to provide more effective
protection39-44 However the relation of the SEI composition to its structural integrity has not
been adequately quantified
The SEI comprises a soft porous organic layer on the side of the electrolyte and a stiffer
denser inorganic layer on the side of the silicon electrode The inorganic layer provides the
primary functionality of the SEI and is made up of LiF Li2O Li2CO3 and lithium alkyl
carbonate phases that are postulated to be assembled in a mosaic-like pattern Because Li2CO3
and lithium alkyl carbonate phases are less stable phases that decompose to Li2O + CO2 the
focus in this dissertation will be on LiF and Li2O as the primary SEI components of interest In
fact there is now increasing evidence relating the structural integrity of the SEI to the
compositional proportions of LiF and Li2O (or Li2CO3) within the inorganic layer My
dissertation research in Chapter 5 examines (a) the interfacial reaction of LiF and Li2O (SEI)
with LixSi (Si anode) as a function of Li content (x) (b) the bonding characteristics of these SEI-
electrode interfaces and (c) how stress is transferred across the interface from the Si electrode to
the SEI film
12
CHAPTER 3
MECHANICAL BEHAVIOR OF LITHIATED SILICON ELECTRODES1
My dissertation research in this section quantifies the mechanical behavior of LixSi alloys
which is essential to understanding the fracture and failure behavior of Si electrodes The focus is
on amorphous rather than crystalline LixSi because (a) amorphous Si is demonstrated to be
more fracture resistant than crystalline Si due to its isotropic lithiation reaction45-47 and (b)
crystalline LixSi phase is known to exist under some very special conditions eg by limiting the
lithiation voltage to sim60 mV48 First-principle calculations have been used to characterize the
elastic modulus of amorphous LixSi alloys12 but studies specifically focusing on the plastic
response49 have been limited to relatively low Li concentrations of up to Li05Si at the time of this
research In this regard the plasticity mechanisms for LixSi can be very different following the
transition from a Si dominant configuration (x lt 1) to a Li dominant configuration (x gt 1) The
first part of this section adopts DFT calculations to investigate the mechanical behavior of LixSi
alloys at various x as representative of the Si electrode material at various lithiation stages The
second part of this section adopts massively-parallel MD simulations to study the mechanical
behavior of Si electrodes at a much larger (experimentally-accessible) scale which can include
~millions of atoms versus ~150 atoms in DFT
31 DFT Computation
311 Computational methods
1 Part of the research presented in this chapter has been published in the following research publications
bull Haoran Wang Xueju Wang Shuman Xia and Huck Beng Chew Brittle-to-ductile Transition of Lithiated Silicon
Electrodes Crazing to Stable Nanopore Growth The Journal of Chemical Physics 143 (10) 104703 2015
bull Haoran Wang Huck Beng Chew Molecular Dynamics Simulations of Plasticity and Cracking in Lithiated
Silicon Electrodes Extreme Mechanics Letters 9 (3) 503-513 2016
13
The first principle calculations are performed using VASP50 51 with the Projector-
Augmented-Wave (PAW)52 method and Perdew-Burke-Ernzerhof (PBE)53 form of the
generalized gradient approximation (GGA) for exchange and correlation We create five
amorphous LixSi model structures ndash Si LiSi2 LiSi Li12Si7 Li15Si4 ndash via a rapid heating and
quenching scheme based on density functional theory (DFT) formalism54 As an example we
show the atomic configurations of the LiSi model structure in Figure 31 at various stages during
the rapid heating and quenching process We start with an initial amorphous LixSi structure
created by randomly introducing Li and Si atoms within a supercell of predefined dimensions
indicated in Table 1 to approximate a stress-free configuration (Figure 31(a)) These predefined
supercell dimensions are determined based on the expected volume expansion of the LixSi alloy
when lithiated54 Using ab-initio molecular dynamics (MD) as implemented in VASP we
perform an NVT calculation by subjecting each LixSi supercell to a temperature of 3000 K while
keeping the box dimensions fixed the temperature is maintained by a Nose thermostat for 5000
MD time steps each time step corresponding to 3 fs This temperature far exceeds the melting
point of Si Li and their respective compounds and allows for sufficient intermixing between
the Li and Si atoms in the supercell to create the amorphous structure (Figure 31(b)) The entire
supercell is subsequently quenched to a target temperature of 300 K at a rate of 1 K per time
step12 and is equilibrated at this temperature for a further 1000 time steps (Figure 31(c)) Both
the heating and quenching processes are performed using a plane wave basis set with an energy
cutoff of 300 eV Thereafter we relax the shape and volume of the supercell to achieve a stress-
free configuration and indicate in Table 3-1 the final dimensions of the supercell for each LixSi
alloy Finally we quantum-mechanically relax the structure to its local minimum energy state
with DFT using an atomic force tolerance of 001 eVnm and a plane wave expansion kinetic
14
energy cutoff of 400 eV (Figure 31) Although our convergence analysis shows that the earlier
300 eV energy cutoff is sufficiently accurate this larger 400 eV kinetic energy cutoff is
implemented to allow for more precise calculation of the stress tensor in VASP and is used in
subsequent tensile loading calculations In all our calculations we employ a Gamma-centered
2times2times2 and a 2times1times2 uniform MonkhorstminusPack k-point sampling taken over the Brillouin zone for
pure Si and LixSi structures respectively which is accurate due to our relatively large supercell
size We have selectively performed calculations with 4times2times4 k-point sampling for several LixSi
alloys and have found the differences in the calculated total energy to be small The atomic
configurations of the five amorphous LixSi model systems created with the above process are
shown in Figure 32
We subject the five amorphous LixSi structures to uniaxial straining by rigidly constraining
the in-plane dimensions of the supercell in the x- and z-directions and uniformly stretching the
out-of-plane dimension in the y-direction in 2 strain increments Each strain increment is
followed by quantum-mechanical relaxation of the supercell in DFT This more stable strain-
controlled loading is used in place of conventional stress-controlled loading to allow us to trace
the complete stress-strain response of the LixSi structures including potential softening behavior
We remark that this first-principle-based approach to ascertain the stress-strain response of the
LixSi alloys is highly computational-intensive Creating each amorphous LixSi model structure of
~150 atoms via the rapid heating and quenching approach and deforming each structure to
tensile strains of up to 40 requires over 35000 CPU hours on available supercomputing
clusters
15
Figure 31 Atomic configurations for the amorphous LiSi model structure at four stages of the
rapid heating and quenching process (a) initial structure (b) after heating at 3000 K (c) after
rapid quenching to 300 K and (d) final amorphous structure after relaxation The Li and Si
atoms are colored in yellow and orange respectively
Table 3-1 Simulation details of the five amorphous LixSi model structures
Structure LiSi
ratio
No of atoms Initial model
dimensions
(xtimesytimesz Aring3)
Final stress-free
model dimensions
(xtimesytimesz Aring3) Si Li
Si 000 64 0 120times100times120 120times119times98
LiSi2 050 100 50 120times190times120 121times186times117
LiSi 100 75 75 120times170times120 120times170times120
Li12Si7 171 56 96 120times170times120 121times169times119
Li15Si4 375 32 120 120times170times120 120times169times122
Figure 32 Atomic configurations for the five amorphous LixSi model structures (a) Si (b) LiSi2
(c) LiSi (d) Li12Si7 and (e) Li15Si4 The Li and Si atoms are colored in yellow and orange
respectively
16
Figure 33 shows the elastic modulus and yield strength of the respective LixSi structures
obtained from computations of the von Mises effective stress-strain response (black symbol) To
validate our model structures we compare our results with those from first-principle
calculations101123 as well as experiments8122627 We find our measured properties to be in good
agreement with these results which suggests that these model structures are effective
representations of true amorphous LixSi alloys In particular our results show that the elastic
modulus dramatically decreases with initial increase in lithium fraction from 0 to 033 due to
elastic softening but later saturates Interestingly the elastic modulus of LiSi (lithium fraction
05) is even slightly higher than LiSi2 (lithium fraction 033) which contradicts the rule-of-
mixtures predictions
Figure 33 (a) Elastic modulus and (b) initial yield strength as a function of lithium fraction from
uniaxial tensile straining of the amorphous LixSi model structures (black symbols) with
comparison to the literature values from first principle calculations and experiments
This non-monotonic behavior has been reported experimentally and is likely associated with the
higher density of Li-Si bonds in the LiSi structure which affects the average inter-atomic bond
stiffness14 The calculated initial yield strength similarly displays a sharp initial decrease with
17
initial increase in lithium content and saturates at lithium fraction of 05 and higher The
predicted yield strengths are in good agreement with available experimental data at high lithium
fractions812 and are remarkably similar to those from previous DFT calculations11 even though
an entirely different approach was used to create the amorphous LixSi structures
312 Brittle-to-ductile transition of LixSi
Figure 34(a) examines the evolution of the axial stress σ22 versus strain ϵ22 for four LixSi
structures We observe the expected brittle-failure response for unlithiated Si which undergoes
an instantaneous loss of stress-carrying capacity after yielding The LiSi2 structure however
undergoes appreciable plasticity beginning at ϵ22 = ~01 but experiences a sudden loss of
stress-carrying capacity at ϵ22 = 02 The LiSi and Li15Si4 structures also undergo significant
plasticity and continue to remain load-bearing even at strains beyond ϵ22 gt 03 implying that
such structures are truly ductile To quantify the evolving damage in these LixSi structures we
calculate the nanopore volume 119881 at each strain increment Since the equilibrium bond distance
for Si-Si Li-Si and Li-Li bonds is 24 Aring 27 Aring and 27 Aring respectively we define the ldquoporousrdquo
regions to be at least 2 Aring away from the nearest Si and Li atoms We subdivide the supercell of
each LixSi structure into regular (002)3 nm3 grid elements and sum up the grid elements which
are within the porous region to obtain V we confirm that 119881 does not appreciably change with
further refinement of the subdivision volume The evolving porosity 119891 of each LixSi structure
indicative of the damage extent is then obtained by normalizing 119881 with the current deformed
volume of the supercell 1198810 in Figure 34(b) Observe that unlithiated Si has the largest initial
porosity due to its open sp3 tetrahedral structure Increasing Li content significantly decreases
this free volume and a fully-dense undeformed structure is achieved for LiSi and Li15Si4 The
porosity for unlithiated Si increases linearly with ϵ22 due to elastic stretching of the Si-Si bonds
18
but experiences a sudden jump at the failure point due to breaking of Si-Si bonds For LiSi2
appreciable increase in f only occurs during plastic deformation (ϵ22 gt 01) Like unlithiated Si
a substantial jump in f coincides with the sudden loss of stress-carrying capacity which indicates
catastrophic brittle-failure of the LiSi2 structure despite its ability to deform plastically In
contrast the structures for LiSi and Li15Si4 remain fully-dense up to ϵ22 gt 015 the nucleated
nanopores subsequently undergo very stable growth even at applied strains beyond ϵ22 gt 03
Figure 34 Evolution of the (a) axial stress σ22 and (b) porosity f versus the applied strain ϵ22 for
four LixSi structures subjected to uniaxial straining
Figure 35 shows the details of the porosity (damage) distribution within the LiSi2 LiSi and
Li15Si4 structures the nanopores in each configuration are represented by a collection of blue
spheres each of diameter 002 nm We also display the covalent Si-Si bonds as brown lines each
Si-Si bond pair is operationally defined as having a bond distance of le 26 Aring per our bond
analysis later discussed in Section 32 For LiSi2 no significant nanopore growth is observed
during the initial elastic deformation (compare ϵ22 = 0 and 008) The onset of plasticity
however induces rapid nanopore growth (ϵ22 = 016) The resulting structure comprises of
interpenetrating nanopores and Si-Si covalent bonds which closely resembles the network of
19
microvoids and fibrils in polymer crazing55 Like polymer crazing this network of strong Si-Si
covalent bonds (fibrils) prevents the neighboring nanopores from coalescing damage is therefore
delocalized as seen by the spread of discrete nanopores in the structure At this point the LiSi2
structure is still load-bearing since the Si-Si bonds stretch but do not break This mechanism of
plastic deformation by nanoscale crazing absorbs fracture energy and likely increases the
toughness of the LiSi2 structure Once sufficient tensile load is applied to locally break the Si-Si
covalent bonds (fibrils) the sudden coalescence of neighboring nanopores causes failure to be
brittle-like (ϵ22 = 024) With increasing Li concentrations craze plasticity is no longer possible
since the chains of Si-Si atoms are no longer continuous (Figure 35(b-c)) These discontinuous
Si-Si chains also result in the lower tensile yield strengths of LiSi and Li15Si4 The extensive
ductility of these structures on the other hand can be attributed to the delayed nucleation and
subsequent stable growth of nanopores Even when nanopore link-up occurs as in ϵ22 = 032
for Li15Si4 the coalescence process occurs gradually compared to that in LiSi2 and the structure
continues to be load-bearing We further observe that the covalent Si-Si bonds for all three LixSi
structures remain largely intact during the deformation process except at the final failure point
of LiSi2 implying that the nanopores grow by either the breaking of weaker Li-Si or Li-Li bonds
20
Figure 35 Distribution of nanopores (filled with blue spheres) within each (a) LiSi2 (b) LiSi
and (c) Li15Si4 supercell at four applied strains (ɛ22) Atomic configurations are filtered to include
SindashSi bonds (brown lines)
21
313 Bonding characteristics of LixSi
The distinct transitions in the plastic behavior of LixSi structures with increasing Li content
above can be explained in terms of the density and type of bonds present covalent Si-Si bonds
ionic Li-Si bonds and metallic Li-Li bonds in order of decreasing bond strength We performed
a pair distribution analysis for each of these bond types in the LiSi2 LiSi and Li15Si4 structures
akin to the partial radial distribution function analysis elsewhere54 56 57 Figure 36 shows the
nearest-neighbor bond length distributions (119887) normalized by the equilibrium bond distance (1198870)
which is taken to be 24 Aring 27 Aring and 27 Aring for Si-Si Li-Si and Li-Li bonds respectively The
Si-Si bond lengths in all the deformed LixSi structures are found to be limited to within ~5
bond extension the peak number of Si-Si bonds lies within 1 le 119887 1198870frasl le 105 even after
significant deformation In contrast the Li-Si bond stretch is shown to depend on the Li content
A significant number of Li-Si bonds (gt 50) are stretched to ~15 for LiSi2 but are stretched to
only ~10 for Li15Si4 According to Paulingrsquos rule58 the electrostatic Li-Si bond strength
defined by the charge on the ion versus the coordination number is the same for LiSi2 LiSi and
Li15Si4 This infers that the Li-Si bonds in all three alloys can be stretched to the same extent
The fact that the Li-Si bonds in Li15Si4 are not stretched to the fullest extent possible suggests
that most of the strain is accommodated by the Li-Li bonds instead Compared to Si-Si and Li-Si
bonds the Li-Li bonds are the most stretchable For example the few Li-Li bonds for LiSi2 can
be locally stretched to 25 strains corresponding to the distribution peak at 119887 1198870frasl = 125 under
deformation For LiSi and Li15Si4 the peak Li-Li bond distribution continuously shifts to the
right with deformation and a significant proportion of Li-Li bonds are now stretched to 20-30
These highly stretchable Li-Li bonds are responsible for the increased ductility of the LixSi
structures with increasing Li content In addition much sharper Li-Li Li-Si and Si-Si bond
22
length distribution peaks are observed for Li15Si4 compared to LiSi and LiSi2 implying more
delocalized deformation behavior at higher Li concentrations
Figure 36 Distributions of the nearest-neighbor SindashSi LindashSi and LindashLi bond lengths (b)
normalized with respect to the equivalent bond lengths (b0) for LiSi2 LiSi and Li15Si4 structures
at three applied strains (ϵ22) The symbols reflect the number of SindashSi LindashSi and LindashLi atom
pairs in the respective supercells which are within 5 deviation from the
corresponding bb0 values
23
This can be attributed to the delocalized nature of metallic bonds itself as well as the high
mobility of Li ions29 to accommodate the strain-induced deformation Given the low density of
Si-Si bonds in the Li15Si4 structure much of the strength comes from the Li-Si ionic bonds In
contrast the absence of significant proportion of Li-Li bonds in LiSi2 implies that ductility will
be limited though its tensile strength ndash originating from the high density of interconnected Si-Si
bonds ndash will be the highest
The correlation between the bond typedensity in the structure versus the formation and
growth of nanopores can be understood by considering the proportion of Si-Si Si-Li and Li-Li
bonds in each structure as a function of the applied strain in Figure 37 In obtaining these results
we define the Si-Si Si-Li and Li-Li bonds in the respective LixSi structures to have maximum
119887 1198870frasl of 11 115 and 135 respectively based on our bond analysis above Observe that
majority of the bonds in LiSi2 LiSi and Li12Si7 are of Li-Si type while Li-Li bonds are dominant
for Li15Si4 The results further show a clear transition in the dominant nanopore
formationgrowth mechanism from the initial breaking of Li-Si bonds for LiSi2 LiSi and Li12Si7
to the breaking of Li-Li bonds for Li15Si4 This trend can be explained by examining the
weakest-link in the structure Covalent Si-Si bonds are undoubtedly the strongest and the
proportion of Si-Si bonds across all LixSi structures do not change much with deformation
Compared to the Si-Si bonds the ionic Li-Si bonds for LiSi2 and LiSi structures are much
weaker breaking of these bonds as shown by the decrease in the proportion of Li-Si bonds
allows the nanopores to nucleate and grow For Li12Si7 the proportion of Li-Si bonds decreases
up to ϵ22 = ~02 beyond which the breaking of Li-Li bonds become the dominant nanopore
growth mechanism this transition is consistent with the ability of Li-Li bonds to tolerate local
strains of ~20-30 For Li15Si4 the nanopore growth is solely caused by the breaking of these
24
weaker metallic Li-Li bonds these Li-Li bonds are able to tolerate significant strains before
breaking which retards nanopore formation and stabilizes its growth
Figure 37 Evolution of the proportion of SindashSi LindashSi and LindashLi bonds with deformation in four
LixSi structures obtained by normalizing the current number of bonds of the same type by the
total number of bonds in the undeformed structure The SindashSi LindashSi and LindashLi bonds in the
respective structures are defined to have maximum bb0 of 11 115 and 135 respectively
314 Strain recovery during unloading
Continuum plasticity approaches to model the deformation response of LixSi alloys are based
on classical elasto-plastic or visco-plastic assumptions59 60 Our results however demonstrate
25
that the ability of LixSi alloys to undergo plasticity stems from the breaking of Li-Si andor Li-Li
bonds which results in nanopore formation and growth this necessitates the development of
Gurson-type porous material models61 to correctly describe the plastic response of these alloys
In addition unlike continuum plasticity theories where the plastic part of the deformation is
permanent unloading the LixSi structure can allow the nanopores to shrink and in turn the
broken bonds to reform
Figure 38 (a) and (b) show the axial stress-strain loading and unloading profiles for LiSi and
Li15Si4 ndash two structures that undergo substantial plasticity during tensile deformation Unloading
the LiSi structure from strains of ϵ22UL = 016 and 032 results in axial plastic strains of ϵp = 002
and 005 respectively which are remarkably smaller than expected due to the ability of the
nanopores to shrink and some bonds to reform The atomic configurations during the unloading
process from ϵ22UL = 016 in Figure 8(c) shows the reforming of Li-Si bonds (A-B) during the
collapse of the nanopore The gradual unloading stress-strain response of LiSi from a highly
porous state (ϵ22UL = 032) is due to stiffening of the structure with decreasing porosity This is in
contrast to Li15Si4 which unloads with a constant stiffness over a substantial portion of the
deformation due to the much lower porosity Interestingly kinks are consistently observed in the
unloading stress-strain curves for Li15Si4 near the point of collapse of the nanopores These kinks
reflect the competition between the loss of surface energy associated with the collapse of the
nanopores and the increased elastic strain energy due to the stretching of newly-reformed Li-Li
bonds across the surface of the nanopores The atomic configurations for ϵ22UL = 026 in Figure
8(d) shows rearrangement of Li atoms (K) to enable bonding across the void surface (H-K) this
process causes local Li-Li bond stretching (H-L and K-L) which contributes to a sudden albeit
small increase in σ22 as the structure is unloaded Note that the axial strain for Li15Si4 is almost
26
fully recovered when the structure is unloaded from strains of up to ϵ22UL = 026 At higher strains
of ϵ22UL = 034 however large axial plastic strain of ϵp = 01 is observed when the structure is
first unloaded to σ22 = 0 since the existing nanopores shrink but do not completely close
Figure 38 (a) and (b) Loading and unloading axial stress-strain response for LiSi and Li15Si4
structures (c) and (d) Deformed atomic configurations of LiSi and Li15Si4 structures when
unloaded from strains of UL22 =016 and 026 respectively The Li and Si atoms are colored in
yellow and orange while the nanopores are filled with blue spheres
27
32 MD Simulations
321 Computational methods
The above DFT calculations are limited by the size of the supercell that can be simulated To
complement these DFT results MD simulations are performed on the same LixSi alloy structures
using the Large-scale AtomicMolecular Massively Parallel Simulator (LAMMPS)62 albeit with
larger system size The interatomic interactions are governed by MEAM and ReaxFF
interatomic potentials specifically developed to describe the deformation behavior of pure Si
andor LixSi alloys63-65 We create amorphous Si LiSi2 LiSi Li12Si7 and Li15Si4 model structures
via a rapid heating and quenching method first introduced in aforementioned DFT studies in
Section 3166 We start with realistic initial model structures obtained by replicating and
truncating the final periodic atomic LixSi configurations obtained from DFT66 to achieve six
fully-periodic cubic simulation boxes with initial edge dimensions of d = 25 4 7 10 12 and 15
nm for each LixSi alloy We perform an NVT calculation by subjecting each model structure to a
temperature of 3000 K while keeping the box dimensions fixed the temperature is maintained by
a Berendson thermostat for 10000 MD steps This temperature is higher than the melting point
of Li Si and their compounds and allows for sufficient intermixing between the Li and Si atoms
Each amorphous model structure is then quenched to the target temperature of 300 K (or 0 K)
within 20000 MD steps We then perform an NPT calculation by equilibrating the structure at
300 K (or 0 K) for a further 30000 MD steps while allowing the simulation box to relax with a
Berendson barostat to achieve a stress-free configuration The final relaxed atomic
configurations for a ~4times4times4 nm3 MD simulation box based on the MEAM and ReaxFF
interatomic potentials are shown in Figure 39 All our simulations use a fixed time step of 1 fs
28
We perform a pair correlation analysis to quantify the bonding characteristics for the Si-Si
Li-Si and Li-Li bonds within each LixSi model structure in Figure 39 We show in Figure 310
the radial distribution function (RDF) for each bond type In general the location of the RDF
peaks for all three bond types corresponds to the equilibrium Si-Si Li-Si and Li-Li bond
distances of 0245 0265 and 0270 nm respectively as shown by dashed lines
Figure 39 Final relaxed atomic configurations of amorphous Si LiSi2 LiSi Li12Si7 and Li15Si4
after rapid heating and quenching in MD The simulations are conducted using sim4 times 4 times 4 nm3
MD simulation boxes and are based on the (a) MEAM and (b) ReaxFF interatomic potentials
The Si and Li atoms are colored in orange and yellow respectively
Interestingly both the MD model structures created using the MEAM and ReaxFF potentials
have quantitatively very similar RDF distributions even though both these potentials were
formulated on very different theoretical foundations The spread of the RDF for Si-Si bonds is
consistently very narrow (plusmn 002 nm) indicating that Si-Si bonds are inherently stiff and have
low stretchability of ~8 The spread of the RDF for Li-Si bonds is much larger (plusmn 004 nm)
with bond stretchability of ~15 The spread of the RDF for Li-Li bonds is the largest (plusmn 006
29
nm) and is again consistent across all three LixSi structures This implies that Li-Li bonds have
the highest bond stretchability of ~22 The location of the RDF peaks and distribution of the
RDFs are both in close agreement with model structures created by our prior DFT study66 with
exceptions of the DFT-calculated RDFs for Li-Li bonds of LiSi2 and Si-Si bonds of Li15Si4 due
to the limited number of Li and Si atoms in the respective DFT supercells
Figure 310 Comparison of the RDF distributions for SindashSi LindashSi and LindashLi bonds within LiSi2
LiSi and Li15Si4 alloys created by MD simulations based on the ReaxFF (red) and MEAM
potentials (blue) as well as prior DFT calculations (black) Dashed vertical lines denote the
equilibrium bond distance for the corresponding bond type
30
We deform each of the above amorphous LixSi model structures by stretching the simulation
box in the out-of-plane (x2) direction while rigidly constraining the in-plane dimensions of the
box MD simulations reveal that the deformation of LixSi can be driven by a competition
between cavitation induced by hydrostatic stress and shear yielding induced by deviatoric stress67
Here our imposed uniaxial strain state subjects each LixSi structure to combined hydrostatic and
deviatoric stresses This strain-controlled loading state was previously used in our prior DFT
calculations 66 in favor of conventional (uniaxial) stress-controlled loading to achieve more
stable and complete stress-strain curves This is especially important for LixSi alloys with high Li
content which undergo significant post-peak softening due to the nucleation and growth of
nanopores The use of the same loading state here facilitates direct comparison between our MD
and DFT results In our DFT calculations uniaxial straining was imposed quasi-statically by
subjecting the supercell to incremental 2 strain in the out-of-plane direction and allowing the
atoms to relax to their equilibrium position quantum-mechanically after each increment These
calculations therefore resemble those from molecular statics at 0 K Similarly we incrementally
deform our MD simulation box with 01 strain by remapping all the atoms proportionally in
the out-of-plane direction and allowing the atoms to relax to their local minimum energy
configuration at 0 K before the next increment This quasi-static loading eliminates the effect of
strain rate on the deformation response We obtain the ldquomacroscopicrdquo stress-strain curve by
averaging the atomic virial stresses of the Li and Si atoms over the entire deformed box volume
We also obtain the deformation response of the LixSi alloys at 300 K by incrementally deforming
the structure with 01 strain but equilibrating the structure at a target temperature of 300 K
which is maintained by a Berendson thermostat for 05 ps after each increment
31
322 Interatomic potential comparison MEAM vs ReaxFF
To ascertain the accuracy of the MEAM and ReaxFF interatomic potentials in describing the
deformation response of LixSi alloys we compare the stress-strain curves obtained from MD
simulations using these potentials against those from prior DFT calculations detailed in Section
31 66 Figure 311 shows the von Mises stress-strain relationship for LiSi2 LiSi and Li15Si4
alloys obtained from MD simulations based on the MEAM potential These stress-strain curves
are computed from MD model structures with edge dimensions of d = 4 nm at 0 K as well as d =
4 7 and 15 nm at 300 K The corresponding stress-strain results from DFT calculations are
denoted by open symbols interconnected by dashed lines The stress-strain curves from DFT
display an initial linear elastic response followed by plastic yielding to reach peak stresses of 3
25 and 15 GPa for LiSi2 LiSi and Li15Si4 respectively Beyond this point the LiSi2 alloy
undergoes sudden loss of stress-carrying capacity which suggests catastrophic failure while the
LiSi and Li15Si4 alloys exhibit more gradual softening due to the cavitation and growth of
nanopores The stress-strain curves obtained from our MD simulations at 0 K for all three LixSi
alloys are remarkably in good agreement with DFT calculations This suggests that the MEAM
potential well captures the theoretical elasto-plastic behavior of LixSi alloys although the MD
simulations at 0 K are unable to capture the failuresoftening response exhibited by DFT
32
Figure 311 Comparison of the von Mises effective stressndashstrain response for (a) LiSi2 (b) LiSi
and (c) Li15Si4 from MD simulations based on the MEAM potential versus DFT calculations
33
At temperatures of 300 K the tensile yield stresses for all three LixSi alloys are reduced by
several-folds and now exhibit a distinct loss of stress-carrying capacity beyond a critical strain
Because of the statistical nature of the associated failurecavitation process this critical strain
decreases with increasing model size d at least up to a certain point although d has no visible
influence on the elasto-plastic properties Therefore a sufficiently large MD simulation box is
needed to simulate the failure of LixSi alloys We further note that the critical strains for d = 15
nm at 300 K are very close to those predicted by DFT calculations at 0 K Figure 312 compares
the von Mises stress-strain relationship from MD simulations based on the ReaxFF potential
versus DFT calculations for LiSi2 LiSi and Li15Si4 alloys The ReaxFF-based MD simulations
correctly predict the elastic softening and decreasing yield strength of LixSi with increasing Li
content Unlike the MEAM-based MD results however the peak tensile stress values at 0 K
obtained with ReaxFF are quantitatively different from those from DFT calculations Specifically
the ReaxFF-based MD simulations at 0 K over-predict the peak yield stress values for LiSi2 and
LiSi by 44 and 36 respectively but accurately predict the yield stress value of ~12 GPa for
Li15Si4
34
Figure 312 Comparison of the von Mises effective stressndashstrain response for (a) LiSi2 (b) LiSi
and (c) Li15Si4 from MD simulations based on the ReaxFF potential versus DFT calculations
We summarize in Figure 313 the elastic modulus and peak tensile yield stress values versus
the lithium fraction (defined as the ratio of Li atoms to the total number of atoms) of five LixSi
35
model structures obtained from our MEAM- and ReaxFF-based MD simulations conducted at 0
K and 300 K These results are based on our d = 4 nm MD simulation box though we note that
both the elastic modulus and yield stress are independent of d To account for statistical
variations we conducted MD simulations to obtain the stress-strain response of 5 different
amorphous LixSi configurations We find the error bars for both the elastic modulus and yield
strength to be negligible for our d = 4 nm model structure We also include the results of DFT
calculations 66 as well as those from experimental measurements 14 15 68 69 for comparisons with
our 0 K and 300 K MD results respectively Results from our ReaxFF- and MEAM-based MD
simulations show that the elastic modulus and yield strength of LixSi both decrease linearly with
Li content and closely follow the rule-of-mixtures In fact the elastic modulus predictions from
both potentials are very similar and are generally in good agreement with DFT calculations at 0
K but slightly under-predict the experimental values at 300 K The ReaxFF-based prediction of
the tensile strength of pure Si at 0 K is in very good agreement with DFT calculations We
remark that pure amorphous Si does not actually undergo yielding but fails in a brittle manner
without plastic deformation and 120590119910 here for pure Si represents the tensile strength With this
exception the MEAM-based MD simulations are found to more accurately match the DFT
results for lithiated Si at 0 K More importantly the tensile yield strength predictions from these
MEAM-based MD simulations at 300 K are also in perfect agreement with experimental yield
strength measurements In addition to the high accuracy of the MEAM potential we find the
computations based on this potential to be ~40 times faster than those based on ReaxFF potential
Our MD simulations in the following will be based on the MEAM potential
36
Figure 313 Summary of elastic modulus and tensile yield strength of LixSi alloys at different
lithium fractions from MEAM- and ReaxFF-based MD simulations DFT calculations and
experiments
323 Porosity and size effect
In previous DFT calculations in Section 31 it was concluded that the surprising plasticity
behavior of LixSi in contrast to the brittle behavior of pure Si is due to the nucleation and
growth of nanopores66 Because of the limited size scale of the supercells in DFT however the
observed porosity is in fact angstrom-sized voids caused by localized bond breaking Using MD
simulations we seek to understand how these angstrom-scale voids develop into actual
nanometer-scale voids and how these nanopores in turn grow and coalesce Figure 314 shows
the evolution of porosity f versus the applied strain 12059822 for different MD model sizes of d = 25 7
10 12 and 15 nm We again focus on LiSi2 LiSi and Li15Si4 alloys which cover the spectrum
of model structures with low intermediate and high Li content For each alloy we divide the
deformed MD simulation box into regular grids each of (015)3 nm3 We consider each grid as a
void if there are no atoms within a 03 nm radius which is slightly larger than the equilibrium Li-
Li Li-Si and Si-Si bond distances We then sum up the total void volume in the box and divide
37
this by the current deformed box volume to get f For all three LixSi alloys the porosity versus
strain curves become model-size-independent only with d = 12 nm and larger
Figure 314 Simulation box size effects d on the porosity evolution versus applied strain for (a)
LiSi2 (b) LiSi and (c) Li15Si4 alloys
38
For the LiSi2 alloy the porosity remains negligible up to a critical strain of 12059822= 02 as seen for
d = 12 or 15 nm upon which f dramatically increases indicating catastrophic brittle-like fracture
we remark that the use of smaller model sizes of d = 25 nm may lead to the incorrect
interpretation of a more gradual failure response For the LiSi alloy the critical strain for the
onset of pore growth occurs much earlier at 12059822= 008 the pore growth rate is also more gradual
suggesting a stable ductile failure response For the fully-lithiated Li15Si4 alloy nucleation of
nanopores is delayed and initiates only at 12059822= 012 At this critical strain the initial void growth
rate is fairly rapid though not catastrophic as in LiSi2 further loading slows down the pore
growth rate to reach a steady state similar to LiSi
324 Large scale MD simulations of mechanical behavior
Next we examine the nanopore nucleation growth and coalescence process for LiSi2 LiSi
and Li15Si4 alloys We adopt relatively large d = 15 nm MD model structures where the porosity
evolution across all three alloys becomes model-size independent (Figure 314) For each of
these model structures we filter the deformed MD box to display only the voids within the
structure which are shaded grey in Figure 315a-317a a cross-sectional cut (dashed lines) of the
corresponding atomic configurations and bonding structures in Figure 315(b)-317(b) For the
LiSi2 alloy in Figure 315 damage initiates at 12059822 = 0195 Within 15 strain increment this
damage spreads across the entire cross-section of the simulation box to cause cleavage fracture
The deformed atomic configurations at 12059822 = 0195 show the presence of incipient nanopores
(angstrom-sized voids) which become more well-defined at 12059822 = 020 Close-up view shows
that these incipient nanopores originate from the breaking of Si-Li bonds which result in the
plasticity behavior of LiSi2 (Figure 311(a)) Observe that these incipient nanopores are well-
separated by interconnected chains of Si-Si bonds which prevent them from developing into true
39
nanometer-sized pores The Si-Si chains separating the incipient nanopores eventually break at
12059822 = 02Cracks subsequently form and propagate along the path which locally has the highest
density of weaker Li-Si bonds as evidenced by the broken Li and Si bonds along the sharp
fracture surface
Figure 315 Cleavage fracture process for LiSi2 (a) Porosity evolution within the model
structure at three instances (b) Cross-sectional views of the atomic configurations taken along
the dashed lines in (a) The Si and Li atoms are colored in orange and yellow respectively
For the LiSi alloy in Figure 316 significant void growth already occurs at 12059822 = 012 as
shown by the presence of two adjacent ~2 and ~4 nm diameter nanopores within the structure
40
These nanopores stably grow and coalesce at 12059822 = 014 The eventual formation of a void sheet
at 12059822 = 016 results in the softening stress-strain response (Figure 311(b)) This ductile fracture
process results in a much rougher fracture surface as compared to the brittle failure response of
LiSi2 The corresponding cross-sectional views of the deformed atomic configurations (Figure
316(b)) and the associated close-up views of the bonding configurations (Figure 316(c)) show
that the nanopores primarily grow and coalesce by the breaking of Li-Li and Li-Si bonds while
the few Si-Si bonds in the LiSi structure remain mostly intact
For the fully-lithiated Li15Si4 alloy in Figure 317 a distinct ~1 nm diameter nanopore first
nucleates at 12059822 = 012 Three additional nanopores of diameters ~1-2 nm subsequently nucleate
at 12059822 = 013 each growing independently of one another This delocalized growth of nanopores
explains why the porosity evolution curves for Li15Si4 in Figure 314(c) are not as strongly
dependent on the model size d as compared to LiSi or LiSi2 The nanopores eventually coalesce
at 12059822 = 014 causing the loss of stress-carrying capacity for Li15Si4 (Figure 311(c)) The cross-
sectional view of the deformed atomic configuration at 12059822 = 012 shows distinct clusters of Li
rich regions encapsulated by networks of Si-Si and Si-Li chains This clustering of Li atoms is
unlike our prior Li15Si4 structures obtained from DFT where the 32 Si atoms are relatively
evenly-dispersed among the 120 Li atoms due to the limited supercell size as shown by the RDF
peaks in Figure 310 Close-up view shows that strain is localized within these Li-rich clusters
which are potential sites for nucleation of nanopores Since these Li-rich clusters are evenly
distributed throughout the entire MD simulation box the damage process is more delocalized
41
Figure 316 Ductile fracture process for LiSi (a) Porosity evolution within the model structure at
three instances (b) Cross-sectional views of the atomic configurations taken along the dashed
lines in (a) (c) Close-up view of the LindashLi and LindashSi bond breaking process The Si and Li
atoms are colored in orange and yellow respectively
42
At 12059822 = 013 the breaking of Li-Li bonds within the Li-rich clusters results in the sudden
formation of multiple discrete nanopores within the structure While this causes a sudden spike
in the porosity in Figure 314(c) the nanopores do not immediately coalesce because they are
encapsulated by strong Si-Si and Si-Li bond networks Instead coalescence occurs gradually in a
controlled fashion by the breaking of Li-Si bonds as shown at 12059822 = 014
Figure 317 Ductile fracture process for Li15Si4 (a) Porosity evolution within the model
structure at three instances (b) Cross-sectional views of the atomic configurations taken along
the dashed lines in (a) The Si and Li atoms are colored in orange and yellow respectively
43
325 Fracture behavior
Our above results demonstrate that the plasticity and cracking of LixSi alloys are closely-
related to the fraction of Si-Si Si-Li and Li-Li bonds within the structure At low Li
concentrations the peak tensile yield strength of the LixSi alloy is at its highest since the
structure primarily comprises of covalent Si-Si bonds The breaking of weaker ionic Li-Si bonds
allows the alloy to undergo plasticity but these broken Li-Si bonds are unable to fully-develop
into nanopores because of the interconnected chains of Si-Si bonds within the structure The
eventual scission of Si-Si bonds results in brittle fracture and the fracture surface remains very
sharp due to the absence of significant void growth during plasticity At intermediate Li
concentrations plasticity of the LixSi alloy occurs by the breaking of Li-Si bonds orand the
breaking of even weaker metallic Li-Li bonds Since the fraction of Si-Si bonds is now smaller
the broken Li-Si or Li-Li bonds readily develop into nanopores which explains the early onset of
void growth in Figure 314(b) These nanopores in turn grow and coalesce to form a void sheet
This juncture at x~1 marks the transition in the fracture behavior of LixSi from brittle to ductile
At high Li concentrations the LixSi alloy is now able to undergo extreme deformations due to
the high proportion of Li-Li bonds which have bond stretchability of ~22 compared to ~15
and ~8 for Si-Li and Si-Si bonds (Figure 310) This high bond stretchability delays the
development of nanopores (compare Figure 314(c) with Figure 314(b)) Once these nanopores
form resulting in the observed initial jump in porosity subsequent void growth occurs more
gradually (Figure 314(c)) Each nanopore now grows independently of the surrounding
nanopores again because of the high Li-Li bond stretchability which delays void coalescence
and failure Hence the fully-lithiated Li15Si4 alloy will be considerably more ductile compared to
44
LiSi Much of the strength of this alloy now comes from the fewer Li-Si bonds within the
structure giving rise to the low tensile yield strength
Our study demonstrates a sharp transition in the deformation behavior of LixSi from brittle to
ductile as lithiation progresses However ductility and fracture toughness are two related but
different quantities since the latter refers to the alloyrsquos flaw tolerance Are LixSi alloys with high
Li content truly more flaw-tolerant than those with low Li content Our recent nanoindentation
experiments appear to support this notion 10 though earlier experiments have alluded that the
fracture toughness of LixSi alloys is independent of x 9 Here we introduce an initial flaw in the
form of a 15 nm by 05 nm through-crack located in the center of the periodic MD simulation
box of d = 15 nm for the LiSi2 LiSi and Li15Si4 model structures To prevent the flaw from
closing we impose an initial uniaxial strain of 5 by proportionally displacing the atoms in the
simulation box and allowing the system to relax at the temperature of 300 K Thereafter we
continue deforming each LixSi structure and show snapshots of the atomic configurations at
various instants in Figure 318 At 12059822 = 01 the initial sharp flaw becomes oblate for LiSi2 but
is distinctly more circular for Li15Si4 At 12059822 = 02 crack propagates through and separates the
entire LiSi2 structure but only propagates partially through the LiSi structure For the fully-
lithiated Li15Si4 structure however the flaw now becomes a cylindrical void and continues to
grow with no signs of necking We attribute this high flaw tolerance of Li15Si4 alloys to the large
proportion of Li-Li bonds within the structure which can tolerate high stretches of ~22 without
breaking Therefore these MD simulations demonstrate that the flaw tolerance of LixSi alloys
indeed increases with x which is in agreement with our recent experimental results 10
45
Figure 318 Snapshots of the atomic configurations for (a) LiSi2 (b) LiSi and (c) Li15Si4 each
with the same pre-existing flaw within the model structure demonstrating increasing flaw
tolerance with Li content The Si and Li atoms are colored in orange and yellow respectively
We remark that the MD simulations conducted here have provided mechanistic insights into
the plasticity and cracking behavior of LixSi alloys at scales not within the capabilities of DFT
46
This opens up unique possibilities for future simulation-based nanostructured electrode design
The accuracy of these MD simulations hinges on the interatomic potentials The bulk of our
current MD studies was carried out using the MEAM potential by Cui et al 64 This MEAM
potential was found to be highly accurate in replicating the elasto-plastic responses from DFT
calculations at 0 K and experimental measurements at 300 K (Figure 313) More impressively
the associated bond-breaking mechanisms from these MD simulations were found to be in very
good agreement with our prior DFT studies 66 In comparison the MD simulations based on the
ReaxFF potential by Ostadhossein et al 65 tend to over-predict the yield strengths of LixSi alloys
(Figure 313(b)) Nevertheless the ReaxFF potential is specifically designed to account for
chemical bond breaking and bond formation processes and we find the underlying plasticity and
cracking mechanisms associated with the ReaxFF potential to be largely similar to those from
our MEAM-based MD simulations
33 Conclusions
The DFT calculations in this section demonstrate that bond-breaking-induced nanopore
nucleation growth and coalescence play the key role in the plastic deformation of LixSi alloys
from craze plasticity resulting in brittle failure response (LiSi2) to extensive ductility (Li15Si4)
resulting from the high density of stretchable Li-Li bonds which delays nanopore nucleation and
stabilizes nanopore growth The nanopores evolve by the breaking of Li-Si bonds at low to
moderate Li concentrations and by the breaking of Li-Li bonds at high Li concentrations In
addition the LixSi structures are capable of exhibiting substantial strain recovery when unloaded
within certain deformation limits These newly-uncovered plasticity mechanisms have important
implications in the design of nanostructured Si electrodes to mitigate fracture and failure
Complementing these DFT calculations MD simulations have provided quantitative insights into
47
the deformation behavior of LixSi alloys at much larger scales (150 atoms in DFT versus several
million atoms in MD) The MEAM-based MD simulations at 0 K correctly reproduce the stress-
strain response of LixSi alloys from DFT calculations while matching the yield strength data
from experiments at 300 K These MD simulations demonstrate the brittle-to-ductile transition of
LixSi alloys as well as the increasing flaw tolerance with increasing Li content This transition
is largely associated with increasing proportion of highly-stretchable Li-Li bonds at the expense
of stiffer Si-Si bonds In addition these simulations have identified the breaking of Li-Li andor
Li-Si bonds as the precursor for nanopore nucleation and growth These atomistic mechanisms
fully explain the macroscopic plasticity and fracture behavior of LixSi alloys
48
CHAPTER 4 INTERFACIAL SLIDING AND DELAMINATION OF
SILICON ELECTRODES ON CURRENT COLLECTOR1
Much of the focus in the literature has been on mitigating fracture of the Si electrode during
electrochemical cycling21 70-72 However capacity fade of the electrode is commonly associated
with the delamination of the Si electrode from the Cu current collector after several charging
cycles20-22 45 This phenomenon has not been well-studied In addition much is still unknown
about the inter-diffused Cu-Si-Li interface separating the silicon electrode and the copper current
collector In this section the focus of my dissertation research is to elucidate how the atomic
compositions within this interdiffused interface correlates with the ability of the interface to
undergo mechanical sliding as demonstrated experimentally and how interfacial delamination
initiates to cause loss of electrical contact between the electrode and current collector
41 Computational Methods
Similar to Section 31 DFT calculations for the study in this section are performed using the
Vienna ab initio simulation package (VASP)2021 with the Projector Augmented Wave (PAW)2223
method and the Perdew-Burke-Ernzehof (PBE)24 form of the generalized gradient approximation
for exchange and correlation Throughout our simulations we employ a 2times2times1 uniform
Monkhorst-Pack k-point sampling taken over the Brillouin zone This mesh is accurate due to
our relatively large supercell For validation purposes we have also performed calculations
based on 4times4times1 k-point samplings and have found the difference in the total energy to be small
(lt 01 eV) We start with a periodic monoclinic supercell comprising of three initially unmixed
1 Part of the research presented in this chapter has been published in the following research publication
bull Haoran Wang Binyue Hou Xueju Wang Shuman Xia and Huck Beng Chew Atomic-Scale Mechanisms of
Sliding along an Interdiffused Li-Si-Cu Interface Nano Letters 15 (3) 1716-1721 2015
49
slabs of crystalline Cu Si and Li atoms (Figure 41(i) for Li15Si4-Cu) The in-plane lattice vectors
of the supercell correspond to 3aCu
2[101] and
3aCu
2[011] in the x1 and x2 directions which
enforces the in-plane periodicity of the Cu(111) slab where aCu = 3610 Å denotes the lattice
constant of Cu The height of the supercell in the x3 direction corresponds to the combined height
of the initial Cu slab and an equivalent stress-free amorphous LixSiy slab as depicted in Section
3125 Simulation details for the respective LixSiy-Cu structures can be found in Table 4-1 The
corresponding atomic density distributions for this structure are included in Figure 42(i) Each
distribution profile is obtained by dividing the supercell along its x3 height into equal-sized bins
of thickness radic2aCu 2frasl corresponding to the distance between close-pack planes of FCC Cu atoms
and averaging the densities of Li Si and Cu atoms within each bin The bottom 3 close-pack
planes of Cu (111) atoms in the supercell are rigidly fixed to represent the crystalline copper
current collector Using ab-initio molecular dynamics (AIMD) as implemented in VASP we
allow intermixing among the remaining Li Si and Cu atoms by performing constant volume and
temperature (NVT) calculations at 5000 K this temperature far exceeds the melting points of Cu
Si Li and their known compounds The system is equilibrated at this temperature by a Nose
thermostat for 5000 MD time steps (each MD time step of 3 fs) The resulting atomic
configuration at the end of this process is shown in Figure 41(ii) The corresponding atomic
density distributions for this structure are included in Figure 42(i) Each distribution profile is
obtained by dividing the supercell along its x3 height into equal-sized bins of thickness radic2aCu 2frasl
corresponding to the distance between close-pack planes of FCC Cu atoms and averaging the
densities of Li Si and Cu atoms within each bin
50
Figure 41 Atomic configurations for the Li15Si4-Cu phase structure at different simulation
stages from AIMD and DFT
Table 4-1 Simulation details for the four interdiffused Li-Si-Cu structures
System Bulk LiSi ratio Initial supercell
height Aring
Number of atoms in supercell
Cu Si Li
LiSi2-Cu 050 36 72 40 20
LiSi-Cu 100 41 72 40 40
Li12Si7-Cu 171 39 72 28 48
Li15Si4-Cu 375 59 72 20 75
It is noted that the atomic distribution profiles are not significantly different with a longer
equilibration time implying that the process has sufficiently allowed for intermixing among all
three types of atoms Subsequently the intermixed structure is quenched down to 0 K with a fast
cooling rate of 1 K per MD time step Both the heating and quenching processes are performed
51
using a plane wave basis set with an energy cutoff of 300 eV based on convergence studies The
atomic structure in Figure 41(iii) and atomic density distributions in Figure 42(ii) show that the
quenching process results in the formation of a lithium-rich zone at the top of the periodic
supercell which is due to the presence of the rigid crystalline copper substrate at the bottom
Figure 42 Density distributions of Li Si and Cu atoms along the equilibrium Li15Si4-Cu phase
structure at different simulation stages from AIMD and DFT
52
This segregation of Li atoms at a crystalline copper substrate interface has been previously
reported1719 To reduce this periodic box effect we introduce a 15 nm thick vacuum layer at the
top of the supercell after quenching Then the structure is quantum-mechanically relaxed to its
equilibrium state with an atomic force tolerance of 001 eVnm and a plane wave expansion
kinetic energy cutoff of 400 eV This final process significantly reduces the fluctuations in the
atomic density distribution profiles as shown in Figure 42(iii) since the interdiffused atomic
configuration is now at a local energy minimum It is further noted that the final relaxed height
(volume) of the interdiffused Li-Si-Cu compound in Figure 41(iv) is not very different from that
of a well-segregated crystalline Cu and amorphous Li-Si structure first assumed in our periodic
supercell in Figure 41(i-iii)
42 Characterization of the Interfacial Structures
The above simulation procedure is used to obtain the atomic configurations of four LixSiy-Cu
structures LiSi2-Cu LiSi-Cu Li12Si7-Cu and Li15Si4-Cu We divide the x3 height of each LixSiy-
Cu structure into equal-sized bins with the height of each bin corresponding to (i) the close-pack
spacing of FCC Cu and (ii) the equilibrium Li-Si bond distance of 028 nm to calculate (i) the
average density of Cu atoms 120588 normalized with respect to the density of perfect FCC Cu 1205880 and
(ii) the LiSi atom ratio respectively We show the distribution plots for (i) and (ii) in Figure 43
along with the corresponding atomic configurations of the LixSiy-Cu structures Results show
that each LixSiy-Cu structure comprises of three distinct regions (a) a crystalline FCC Cu at the
bottom of the supercell which is interdiffused with substitutional Si and occasionally Li atoms
(b) an amorphous phase above the crystalline region with an intermixed distribution of Li Si
and Cu atoms (c) an amorphous Li-Si region closer towards the surface where the density of Cu
atoms tapers off and the LiSi ratios approach those in the bulk ie LixSiy Regions (a) to (c)
53
above collectively represent the interface structure connecting the Cu current collector
(crystalline Cu) and the lithiated Si electrode (bulk LixSiy) The interdiffused phase structure in
region (b) displays atomic mixing distributions which are in close agreement with experiments
Specifically the tapering off of the density of Cu (Si) atoms across the interface towards the Si
electrode (Cu current collector) indicating the presence of a finite interdiffused interphase as
observed by Maranchi et al6 and Santhanagopalan et al19 Our LixSiy-Cu structures in Figure 43
also consistently show an elevated LiSi ratio at the interface between regions (a) and (b)
compared to the LiSi ratio in the bulk (dashed black lines) The peak LiSi ratio for LiSi2-Cu is
nearly two-fold higher compared to bulk LiSi2 and increases to LiSi = 3 for LiSi-Cu LiSi = 5
for Li12Si7-Cu and LiSi = 7 for Li15Si4-Cu Interestingly the exact same ratio of LiSi = 7 has
been reported by time-of-flight secondary ion mass spectrometer (SIMS) depth profile
measurements through the thickness of a fully-lithiated Li15Si4 film on Cu17 Therefore our
LixSiy-Cu phase structures exhibit all the characteristic features observed experimentally despite
the fact that the interdiffused region (b) spans a mere 1-3 nm in our simulations compared to
~275 nm in experiments due to the limited investigation system size of ~130-170 atoms because
of the high computational cost of DFT
54
Figure 43 Atomic configurations of four LixSiy-Cu phase structures with the corresponding
distributions of LiSi ratio and normalized Cu density 120588 1205880frasl along the x3 depth of each structure
(a) LiSi2-Cu (b) LiSi-Cu (c) Li12Si7-Cu and (d) Li15Si4-Cu The individual LixSiy-Cu structures
comprises of a crystalline region an interdiffused Li-Si-Cu amorphous region and a bulk
amorphous Li-Si region
55
43 Work of Separation
The intermixing among Li Si and Cu atoms in LixSiy-Cu creates a finite phase structure with
unknown interfacial properties Here we examine the work of separation 119882119904 at seven discrete
cross-sectional cuts along the depth of the interdiffused structure as shown by dashed lines in
Figure 44 We define
119882119904 = (1198640 minus 1198641 minus 1198642) 119860frasl (4-1)
where 1198640 is the total energy of the structure 1198641 and 1198642 the energies of the individual relaxed
parts created by separating the structure along an ldquointerfacerdquo plane and A the cross-sectional
area of the interface In addition we include the electron localized function (ELF) contours as
viewed along three individual Cu(110) planes in the supercell to provide a general overview of
the atomic interactions in the phase structure The value of ELF ranges between 0 and 1
Qualitatively a large ELF value close to one (red) corresponds to a region with a high
probability of finding electron localization as in covalent bonding whereas an ELF close to one-
half (green) corresponds to a region of electron gas-like behavior as in metallic bonding An
intermediate ELF value of 075 (yellow) in turn corresponds to ionic bonding For clarity we
superpose the nearest Si Li and Cu atoms on these ELF plots
In general the work of separation is relatively high in the crystalline layers (region (a))
across the different LixSiy-Cu phase structures with 119882119904 reaching ~25 Jm2 for pure crystalline
Cu(111) (cut 1 in Figure 44(iii) cuts 1 amp 2 in Figure 44(iv)) which is in perfect agreement with
previous DFT studies73 With the interdiffusion of substitutional Si atoms within the crystalline
Cu structure 119882119904 drops to ~19 Jm2 (cut 2 in Figure 44(ii)) which is close to the values reported
for the crystalline silane compound formed at the interface between Cu(111) and Si(111)73
56
Slightly lower values of ~15 Jm2 are observed for LiSi2-Cu along cut 1 in Figure 44(i) due to
the presence of vacancy defects in the atomic layer above In comparison the interdiffusion of
substitutional Li atoms within crystalline Cu does not cause any significant reduction in 119882119904 as
shown along cut 3 for the fully-lithiated Li15Si4-Cu phase in Figure 44(iv) The corresponding
ELF contours demonstrate that this is due to the larger extent of metallic bonding (green
contours) with increasing Li density As the structure transitions from a crystalline phase (region
(a)) to an amorphous phase (region (b)) the less dense packing of atoms causes 119882119904 to drop to
around 15ndash17 Jm2 for LiSi2-Cu (cut 2) LiSi-Cu (cut 3) and Li12Si7-Cu (cut 3) in Figure 44(i-
iii) For Li15Si4-Cu in Figure 44(iv) however a high 119882119904 value of ~25 Jm2 is maintained (cut 4)
despite the increased porosity Close examination of the ELF contours near the vicinity of cut 4
in Figure 44(iv) shows preferential bonding between Si-Cu atoms (polar-covalent bond) and Li-
Cu (metallic bond) atoms rather than Li-Si atoms (ionic bond) This higher than expected 119882119904
along cut 4 in Figure 44(iv) may be attributed to both the directional polar-covalent Si-Cu
bonding as well as the delocalized metallic Li-Cu and Li-Li bonding which is enhanced by the
high density of Li atoms The former is also responsible for the slight increase in 119882119904 for LiSi2-Cu
along cuts 2 to 3 (17 Jm2 to 2 Jm2) and Li12Si7-Cu along cuts 4 to 5 (15 Jm2 to 18 Jm2)
When these interdiffused structures transition to bulk amorphous LixSiy in region (c) the bonding
between Si and the small number of remaining Cu atoms now changes from directionally polar-
covalent (one-to-one) to more delocalized metallic (one-to-many) this dramatic change in the
bonding type is responsible for the abrupt drop in 119882119904 as displayed in Figure 44(ii-iv) The work
of separation eventually reaches a constant value of ~10ndash12 Jm2 representing that of bulk
amorphous LixSiy (region (c)) We remark that 119882119904 for bulk LixSiy does not significantly change
with increasing Li content though the bonding characteristics displayed by the ELF contours in
57
region (c) are very different the covalent Si-Si bonds (interconnected chains of red) are
increasingly replaced by ionic Li-Si bonds (rings of yellow) from Figure4(i-iv)
Figure 44 ELF contours on three individual Cu[1 10] planes of the four LixSiy-Cu phase
structures with the corresponding distributions of the work of separation along the x3 depth of
each structure (i) LiSi2-Cu (ii) LiSi-Cu (iii) Li12Si7-Cu and (iv) Li15Si4-Cu
58
In fact Si-Si bonds in region (c) of Li15Si4-Cu are virtually non-existent each Si atom (4 valence
electrons per Si) is now surrounded by 4 to 6 Li atoms (1 valence electron per Li atom)
suggesting a fully-lithiated structure The work of separation 119882119904 in equation (4-1) represents the
intrinsic fracture toughness Γ0 of the interdiffused phase structure and does not account for
background plasticity effects Γ119901
We have also performed tensile deformation simulations on the four LixSiy-Cu phase structures
by pre-stretching the structure in fixed strain increments of 2 and quantum-mechanically
relaxing the structure with fixed grips imposed at the bottom and top of the structure For LiSi2-
Cu and LiSi-Cu no significant rearrangement of atoms is observed prior to final brittle
separation occurring in region (c) For Li12Si7-Cu and Li15Si4-Cu atoms within regions (a) and
(b) maintain their original configuration while significant rearrangement of Li atoms occurs
within region (c) This leads to the formation of nanopores near the interface plane with the
lowest 119882119904 denoted by cut 6 in Figure 44(iii) and cut 5 in Figure 44(iv) respectively and a
brittle-ductile type of interface fracture is expected for these structures
44 Interfacial Sliding
Amorphous silicon thin films deposited on copper substrates are reported to exhibit near
theoretical capacities for a limited number of charge cycles even though massive cracking of the
silicon film occurs during the initial few cycles6 The silicon film eventually delaminates after 20
to 30 cycles and the loss of electrical contact results in the loss of charge capacity This cycle-
dependent delamination behavior of Si thin films is very unusual since one would expect that the
high compressive stresses in the film during lithiation would induce buckling-delamination of the
film from the substrate even during early cycles Maranchi et al6 postulated that the nucleation
59
of a lithium compound based on the interdiffusion of Si and Cu could be responsible for the
delamination failure of the Si electrode Our calculated 119882119904 along each of the four LixSiy-Cu
interphase structures in Figure 44 however is not significantly different from that in bulk LixSiy
which suggests that other mechanisms may be at play Potentially the sliding along the lithiated
SiCu interface could play a role in limiting the film stresses to help mitigate buckling-
delamination but exactly how interface sliding occurs and why the film eventually delaminates
under repeated cycling remain unclear
The interface sliding planes along the finite LixSiy-Cu phase structures are unknown While
the 119882119904 distributions in Figure 44 point to the rigid-ductile interface separating regions (b) and (c)
as the likely fracture plane the interface sliding plane may be completely different Here we
subject each LixSiy-Cu structure to simple shear along the Cu [110] direction by imposing
incremental shear strains of 3 After each shear strain increment we rigidly fix the bottom
three rows of Cu(111) atoms as well as several top layers of Li-Si atoms near the free surface
and quantum-mechanically relax the structure We calculate the nominal shear stress at each
strain increment after full relaxation using the stress-tensor approach implemented in VASP and
the summarize the resulting shear stress versus shear strain plots in Figure 45
For the LiSi2-Cu structure which has the lowest Li concentration the shear stress 120591119904
monotonically increases with the applied shear strain 120574119904 up to the peak stress of ~17 GPa
Beyond this point sliding occurs to relieve the shear stress which drops to ~08 GPa Subsequent
shear deformation causes 120591119904 to reach a second peak of ~13 GPa before sliding and this cycle of
stress build-up and stress release by interface sliding is repeated For LiSi-Cu the sliding
resistance (peak 120591119904) continuously increases from ~1 GPa during the first cycle to ~18 GPa in the
second cycle and to ~23 GPa in the third cycle In contrast the peak 120591119904 for Li12Si7-Cu is
60
maintained at ~06 GPa but subsequently increases to beyond 14 GPa with no further signs of
sliding For the fully lithiated structure represented by Li15Si4-Cu the peak 120591119904 is now ~12 GPa
but decreases to ~07 GPa during subsequent sliding cycles Interface sliding for LiSi2-Cu occurs
along the weakest plane within the crystalline Cu structure in region (a) (cut 1 in Figure 44(i))
but requires high shear stress of ~13 to 17 GPa Given that lithiated silicon has a yield stress of
~12 to 15 GPa7 interface sliding for LiSi2-Cu is unlikely to happen In contrast interface
sliding is optimal for Li12Si7-Cu given its consistently low sliding resistance of ~06 GPa Figure
46(a) shows snapshots of the deformed atomic configurations for Li12Si7-Cu at shear strains of
120574119904 = 009 012 018 024 and 033 Prior to 120574119904 = 009 no significant changes to the atomic
configurations of Li12Si7-Cu are observed indicating that the structure undergoes elastic shear
deformation up to this point From 120574119904 = 009 to 012 sliding occurs along the interface between
the crystalline phase (region (a)) and the amorphous Li-Si-Cu phase (region (b)) Close
examination shows that this sliding process begins with significant rearrangement of the layer of
atoms directly above the sliding plane which transforms from an initially amorphous
configuration to possess a more crystalline order At 120574119904 = 018 local rearrangement of atoms
near the plane with the lowest 119882119904 (cut 6 in Figure 44(iii)) marked by blue dashed lines results
in the relaxation of 120591119904 At 120574119904 = 024 interface sliding again occurs along the same sliding plane
as in 120574119904 = 012 However interface sliding appears to be partially obstructed and the shear
stresses do not completely relax to zero Further shear deformation at 120574119904 = 033 results in the
build-up of 120591119904 to levels approaching the yield stress of bulk lithiated silicon with no observable
interface sliding or atomic reconfiguration
61
Figure 45 Shear stress 120591119904 versus shear strain 120574119904 plots of four LixSiy-Cu phase structures
subjected to simple shear along Cu[110]
62
Figure 46 Atomic configurations of Li12Si7-Cu phase structure subjected to simple shear along
Cu[110] (a) Snapshots of the structure at five different shear strains 120574119904 Sliding along the
interface plane denoted by red dashed lines is observed at 120574119904 = 012 and 024 while
reconfiguration of atoms occurs at 120574119904 = 018 near the blue dashed lines (bc) Top view of the
sliding process during quantum-mechanical relaxation at strain rates of (b) 120574119904 = 012 and (c)
120574119904 = 024 Atomic configurations are filtered to include only the atomic layers directly above
and below the sliding plane The periodic supercell is highlighted by blue dashed lines (d) Tilted
view of the sliding interface planes at 120574119904 = 009 012 and 024
63
To understand the interface sliding mechanism for Li12Si7-Cu we show three snapshots of
the atomic rearrangement process along the interface plane during DFT relaxation at 120574119904 = 012
in Figure 46(b) as viewed from the top For clarity we include only atoms in the upper and
lower atomic layers bounding the sliding plane Observe that interface sliding occurs by the
concurrent motion of Li (yellow) and Cu (orange) atoms in the upper atomic layer from one FCC
close-packed site on the lower atomic layer to the next While the Si atoms (purple A) in the
upper atomic layer do not slide relative to the lower atomic layer the motion of Cu atoms (B and
D) to neighboring FCC sites displaces the Si atoms (A) upward to the next atomic layer above
This movement of Si atoms creates vacancy sites within the atomic layer above the sliding plane
which further facilitates interface sliding See the tilted view of the atomic structure of the upper
and lower atomic layers bounding the sliding plane in Figure 46(d) before (120574119904 = 009) and after
interface sliding (120574119904 = 012) Throughout this sliding process the configuration of atoms within
the lower atomic layer remain the same
Figure 46(c) shows three top-view snapshots of the atomic rearrangement process along the
same interface plane during the second sliding event at 120574119904 = 024 Again sliding occurs by the
motion of Li and Cu atoms on the atomic layer above the sliding plane from one FCC close-
packed site to another However the Li atoms labeled H are immobile during this sliding process
we note that these atoms also do not move during the previous sliding event at 120574119904 = 012 Close
examination shows the presence of vacancy sites in the atomic layer directly below each of these
Li atoms each vacancy site is surrounded by three Si atoms (purple) within the same atomic
layer and is formed simply to accommodate the size-differences between Si and Cu atoms
(lattice spacing of 5431 Aring versus 3610 Aring) The Li atom above the vacancy site is tetragonally
bonded to the three Si atoms below and is visibly lowered vertically relative to the other atoms
64
within the upper atomic layer See the tilted view for 120574119904 = 024 in Figure 46(d) Our calculations
show that each Li atom (H) has an equilibrium bond distance of 292 Aring with respect to each of
the three Si atoms in the atomic layer below which is comparable to the equilibrium ionic Li-Si
bond distance of 275‒290 Aring Because of the strong Li-Si ionic bonding in this LiSi3 compound
the Li atom (H) remains locked to the atomic layer below At 120574119904 = 024 the practically
immobile Li atom (H) serves to obstruct the motion of surrounding Li and Cu atoms along the
interface and no further sliding occurs even at higher strains of 120574119904 = 033 See the pile-up of
atoms behind atom H marked in the side profiles for 120574119904 = 012 to 120574119904 = 033 in Figure 46(a) It is
remarked that the probability of Li atoms in the upper atomic layer bonding with three Si atoms
in the layer below to form LiSi3 increases with each sliding process This results in the increase
in density of LiSi3 compounds along the interface with the number of charge cycles Once a
critical density of LiSi3 is sufficiently formed to obstruct interface sliding the build-up of high
interfacial stresses potentially leads to buckling-induced delamination failure of the Si electrode
This explains the abrupt drop in the charge capacities of silicon electrodes after a critical number
of charge cycles is reached6
These simulations consistently show that sliding occurs along the interface separating the
crystalline (region (a)) and amorphous phases (region (b)) with exception of LiSi2-Cu due to its
low lithium content During interface sliding the randomly-positioned atoms in the atomic layer
above the sliding plane are reconfigured into a well-ordered crystalline arrangement albeit with
vacancies which facilitate the in-plane motion of these atoms with respect to the more densely-
packed atomic layer below Figure 47 shows the post-sliding configurations of the lower and
upper atomic layers bounding the sliding interface (red dashed lines) for LiSi-Cu Li12Si7-Cu
and Li15Si4-Cu Observe that interface sliding generally occurs between a Si-rich (lower) atomic
65
layer and a Li-rich (upper) atomic layer For Li12Si7-Cu well-segregated Si-Cu (lower) and Li-
Cu (upper) atomic layers are formed The Si-Cu atoms within the lower layer have strong polar-
covalent bonding which do not allow for any internal rearrangement of these atoms In contrast
the metallic Li-Cu Li-Li and Cu-Cu bonds within the upper atomic layer are considerably
weaker Together with the presence of vacancy point defects created during the amorphous to
crystalline transition which expels Si atoms to the layer above the atoms within the upper atomic
layer are able to rearrange themselves internally by hopping from one FCC close-packed site to
another The strong Si-Cu polar covalent bonding within the lower atomic layer also weakens
any Si-Li bonding between the lower and upper atomic layers which results in the relatively low
shear resistance of ~06 GPa for sliding We note that this upper atomic layer above the sliding
plane is strongly bonded to the next atomic layer above which comprises of an even mixture of
Li Si and Cu atoms and moves with it For LiSi-Cu the lower atomic layer to the sliding plane
comprises entirely of polar-covalent Si-Cu bonds but the upper atomic layer has Si atoms in
addition to Li and Cu atoms The strong covalent bonding between Si-Si atoms and to a lesser
extent Si-Cu atoms across the sliding plane leads to very high shear resistance of ~1 GPa For
Li15Si4-Cu the larger depth of Li intercalation in Cu compared to LiSi-Cu and Li12Si7-Cu
ultimately results in a more densely packed Li-Cu layer representing the atomic layer above the
sliding plane the density of Si atoms in the atomic layer below is also much lower The resulting
Li-Li and Li-Cu metallic bonding between these lower and upper atomic layers coupled with the
absence of vacancies in the upper atomic layer results in a higher interface sliding resistance of
~12 GPa
66
Figure 47 Atomic configurations of the interface sliding planes after the first instant of sliding
for (a) LiSi-Cu (b) Li12Si7-Cu and (c) Li15Si4-Cu Well-segregated Si-Cu and Si-Li atomic
layers are formed below and above the sliding plane (red dashed lines) particularly for (b) which
is near optimal for interface sliding
45 Conclusions
The first principle calculations in this Section show that the interdiffused Li-Si-Cu phase
which exists at the interface between the Si electrode and the Cu current collector is responsible
for interface sliding and final delamination failure of the electrode Interfacial sliding is optimal
at intermediate LiSi ratios of ~17 which limits the build-up of interfacial stresses to ~06 GPa
The sliding process is facilitated by the presence of well-delineated and weakly-bonded Cu-Si
and Cu-Li crystalline atomic layers within this phase structure The formation of LiSi3
compounds across these atomic layers can impede further sliding and the subsequent build-up of
interfacial stresses can lead to buckling-induced delamination failure of the silicon electrode
Understanding these mechanisms will pave the way for the design of SiCu interface structures to
improve the cycle life of high capacity lithium ion batteries
67
CHAPTER 5 NANOMECHANICS OF SOLID ELECTROLYTE
INTERPHASE ON SILICON ELECTRODES1
Aside from cracking of the Si electrode and its delamination from the current collector the
300 volumetric changes of the electrode also results in cracking of the solid electrolyte
interphase (SEI) which is the thin passivation film of ~10 to 50 nm thick at the electrode-
electrolyte interface of a Li-ion battery38 It is naturally formed by irreversible decomposition of
the electrolyte upon first charging of a pristine Li-ion battery The formation of a stable SEI film
is crucial to the operation of a Li-ion battery since it passivates the anode surface against further
reactions with the electrolyte but allows for Li ion conduction The mechanical integrity is of
particular importance in the case of Si Studies have shown that the SEI film cracks because of
the ~300 volume expansion of Si anode during charge cycling which exposes new Si surface to
the electrolyte25 The subsequent formation of new SEI layer consumes Li ions and thus repeated
cracking of the SEI film eventually results in capacity fade26 This problem is exacerbated by the
use of nanostructured Si anode materials due to the increased relative surface area available for
SEI to grow Hence the formation of a chemically and mechanically stable SEI layer is a key
step towards achieving high-capacity Li-ion batteries SEI is generally accepted to comprise a
soft porous organic layer on the side of electrolyte and a stiff dense inorganic layer on the side of
Si anodes32 The protection of Si anodes is mostly performed by the inorganic layer since itrsquos
conductive to the Li ions and resistant to the electrons while the organic layer is conductive to
both of them Moreover the inorganic layer is the dominant load bearing part during the volume
1 Part of the research presented in this chapter has been published in the following research publication
bull Haoran Wang Huck Beng Chew Nanoscale Mechanics of the Solid Electrolyte Interphase on Lithiated-Silicon
Electrodes ACS Applied Materials and Interfaces 9(31) 25662-25667 2017
68
change of Si anodes Thus study of the inorganic layer alone should be sufficient for us to
understand SEIrsquos properties The inorganic layer of naturally formed SEI contains four major
components lithium fluoride (LiF) lithium oxide (Li2O) lithium carbonate (Li2CO3) and lithium
alkyl carbonate assembled in a mosaic structure model26 74 The lithium carbonate (Li2CO3) and
lithium alkyl carbonate are not stable and can easily decompose into Li2O and CO233 37 In this
section of my dissertation research the focus will be on how the strain is transferred from
lithiated Si electrodes to the two primary inorganic SEI components LiF and Li2O
51 Computational Methods
DFT calculations are performed using the Vienna Ab initio Simulation Package (VASP)
with the Projector-Augmented-Wave (PAW) method and Perdew-Burke-Ernzerhof (PBE) form
of the generalized gradient approximation (GGA) for exchange and correlation To create the
LiF-LixSi and Li2O-LixSi interfacial structures we start with initial structures comprised of
evenly mixed LixSi slabs and the crystalline LiF or Li2O slabs placed above The predefined
initial dimensions of the LiF-LixSi and Li2O-LixSi supercells (Table 5-1) are determined based on
the stress-free volume of crystalline LiF and Li2O as well as the expanded volume of the Si
electrodes when lithiated54 75
Using ab-initio molecular dynamics (MD) in VASP with a plane wave energy cutoff of 300
eV we freeze the top LiF or Li2O slabs and create the amorphous LixSi structure by subjecting
the bottom LixSi slabs to a temperature of 3000 K while keeping the dimensions of the supercell
fixed the temperature is maintained with a Nose thermostat for 3000 MD time steps with each
time step of 3 fs This temperature far exceeds the melting point of Si Li and their respective
compounds and allows for sufficient intermixing between the Si and Li atoms while confined
69
within the fixed periodic LiF or Li2O slabs Thereafter the temperature of the LixSi slabs is
quenched to the target temperature of 300 K at a rate of 1 K per MD time step The entire
structure including the LiF and Li2O slabs is then equilibrated at 300 K for an additional 1000
MD time steps which allows significant rearrangement of atoms near the LiF-LixSi or Li2O-
LixSi interfaces Afterwards the shape and volume of the supercell is relaxed to achieve a stress-
free configuration with the final dimensions of the supercell as shown in Table 5-1 Finally the
supercell is quantum-mechanically relaxed to its local minimum energy state with DFT using an
atomic force tolerance of 001 eVnm and a plane wave expansion kinetic energy cutoff of 500
eV This higher plane wave energy cutoff allows for more precise calculation of stress tensors
and interfacial energies The process of creating the model structures is shown in Figure 51 In
all calculations a Gamma-centered 3times3times1 uniform Monkhorst-Pack k-point is employed
sampling taken over the entire Brillouin zone
Table 5-1 Modeling details of the LiF-LixSi and Li2O-LixSi interface structures
Structure
LiSi
ratio
No of atoms
Initial model
dimensions
Final stress-free
model dimensions
Si Li FO (xtimesytimesz Aring3) (xtimesytimesz Aring3)
LiF-Si 000 64 75 75 99times99times230 103times103times253
LiF-LiSi2 050 52 101 75 99times99times260 100times104times262
LiF-LiSi 100 40 115 75 99times99times260 103times101times261
LiF-Li15Si4 375 20 150 75 99times99times290 104times102times281
Li2O-Si 000 64 96 48 92times92times250 95times95times254
Li2O-LiSi2 050 52 122 48 92times92times280 93times94times286
Li2O-LiSi 100 40 136 48 92times92times280 95times94times290
Li2O-Li15Si4 375 20 171 48 92times92times310 93times93times317
70
Figure 51 The algorithm used to create the interface of (a) SEI-LiF and (b) SEI-Li2O (I) Initial
structures (II) After heating to 3000K and then quenching to 300K with LiFLi2O fixed (III)
After equilibrating the whole structures at 300K for 3 picoseconds and (IV) After quantum-
mechanical relaxation of the whole structures to achieve stress-free configurations
52 Characterization of the Interfacial Structures
The LiF-LixSi and Li2O-LixSi supercells comprise of (100)-oriented crystalline slabs of LiF
or Li2O directly bonded to slabs of amorphous LixSi as shown in Figure 52 with x = 0 05 1
and 375 representing four different lithiation stages Note that two distinct interfaces (dashed
lines) exist for each periodic model structure For LiF-LixSi both these interfaces exhibit similar
bonding characteristics since the amorphous LixSi is exposed to the same (100)-oriented LiF
surface structure For Li2O-LixSi however Li- and O-terminated interfaces are possible on the
71
side of the (100)-oriented Li2O crystal and we consider both these interface types in our periodic
model structures To provide a general overview of the atomic interactions we also include
contours of the electron localized function (ELF) for the various LiF-LixSi and Li2O-LixSi
interface structures in Figure 52 Qualitatively a large ELF value close to 1 (red) corresponds to
a region with high probability of finding electron localization as in covalent bonding whereas an
ELF close to 05 (green) corresponds to a region of electron gas-like behavior as in metallic
bonding An intermediate ELF value of 075 (yellow) can be interpreted to correspond to ionic
bonding
For LiF-Si model structure (Figure 52(a)-i) Si-Si covalent bonding and Li-F ionic bonding
are dominant within the bulk Si and LiF phases respectively while there is lack of significant
interfacial bonding across these two phases with exception of isolated Si-F bonds Increasing
extents of lithiation (x) however allows Li atoms to segregate to the LiF-LixSi interface to form
an increasingly seamless interface (Figure 52(a)-ii to iv) These segregated Li atoms act as ldquogluerdquo
between LiF and LixSi29 by forming strong ionic bonds with crystalline LiF on one side of the
interface and with Si atoms on the other side of the interface In the case of Li2O-Si (Figure
52(b)-i) strong Si-O and Si-Li ionic bonding is observed across both the O- and Li-terminated
interfaces Increasing x also increases the segregation of Li atoms to the O-terminated interface
(Figure 52(b)-ii to iv) the Si-O bonds across the interface are gradually replaced by O-Li-Si
bonds Li atoms completely saturate the O-terminated interface for Li2O-Li15Si4 (Figure 52(b)-
iv) which effectively transforms this interface type to a Li-terminated one
72
Figure 52 Atomic configurations and contours of the electron localized function for (a) LiF-
LixSi and (b) Li2O-LixSi interface structures with (i)-(iv) representing x = 0 05 1 and 375
Blue dashed lines denote planar cuts representing LiF-LixSi interfaces magenta and red dashed
lines denote planar cuts representing Li- and O-terminated Li2O-LixSi interfaces
73
The work of separation Γ is quantified along the interfaces of LiF-LixSi and Li2O-LixSi as a
function of lithiation extent x in Figure 53 Here Γ is defined as the change of energy per unit
area caused by rigid separation along the selected interface (dashed lines in Figure 52) followed
by quantum-mechanical relaxation of the separated structure in DFT Γ of the two interfaces is
averaged within each LiF-LixSi model structure while Γ of the Li- and O-terminated interfaces
for Li2O-LixSi is separately calculated For comparison purposes we also include the average Γ
taken along bulk LixSi in Figure 5366 Observe that Γ for LiF-Si is close to 0 due to negligible
bonding between LiF and Si However Γ increases with x because of increasing Li segregation
to the interface (blue line) Once Li atoms fully saturate the LiF-LixSi interface as in x = 375 Γ
associated with Li-Li and Li-Si bonding across the interface then approaches that of bulk Li15Si4
In the case of Li-terminated interface for Li2O-LixSi (green line) Γ decreases with increasing x
since stronger ionic Li-Si bonds are increasingly replaced by weaker metallic Li-Li bonds While
the same general trend is exhibited by bulk LixSi (black line) Γ for the Li-terminated interface of
Li2O-LixSi remains consistently higher because of the highly-ordered arrangement of Li atoms
on the side of the Li2O crystal The interfacial energy associated with the O-terminated interface
for Li2O-Si is almost 3-fold higher than that of bulk Si because of the highly-ordered Si-O
bonding across the interface At x = 05 the segregation of Li atoms to the interstitial sites along
the Li2O-LiSi2 interface further improves the interfacial bonding as shown by the slight increase
in Γ However increased segregation of Li atoms to the interface results in a dramatic drop in Γ
at x = 1 due to preferential Li-O bonding (bond length ~21 Aring) over Si-O bonding (bond length
~16 Aring) associated with the high coordination number of Li atoms at the interface (see ELF
contours in Figure 52(b)-iii) Once sufficient Li atoms have segregated to the interface at x =
375 Γ for both interface types are now similar confirming that the original O-terminated
74
interface is now effectively Li-terminated Herein we focus only on the O-terminated interface
of Li2O-LixSi because of the similarity in bonding structure between O-terminated Li2O-Li15Si4
and Li-terminated Li2O-LixSi
Figure 53 Interface energy Γ versus Li fraction within the amorphous LixSi phase for bulk LixSi
(black lines) LiF-LixSi (blue) and O- and Li-terminated Li2O-LixSi (red and magenta lines)
Calculation of Γ taken along planar cuts denoted by corresponding colored dashed lines in Figure
52
53 Stress Response under Deformation
The LiF-LixSi and Li2O-LixSi interface structures are subjected to uniaxial tensile
deformation by uniformly stretching the out-of-plane x2 dimension of the supercells in 1 strain
increments while constraining the in-plane x1-x3 dimensions After each strain increment atoms
bounding the topbottom interface of both LiF-LixSi and Li2O-LixSi are rigidly fixed while the
remaining atoms are subjected to quantum-mechanical relaxation in DFT Figure 54 shows the
75
von Mises effective strain-strain relationship for LiF-LixSi (blue line) and Li2O-LixSi (red line)
as compared to bulk LixSi (black line)66 at various lithiation instances The applied tensile strain
of the interface structures can be accommodated by both the bulk LixSi and Li2OLiF phases as
well as by interface separation For LiF-Si (Figure 54(a)) the weak interface separates easily
resulting in low effective strength The interfacial bonding between the LiF and LixSi phases
becomes stronger at higher x but the effective stress remains consistently lower than that of bulk
LixSi at the same applied strain Bulk LixSi is known to exhibit significant plasticity by nanopore
growth at x ge 1 these nanopores initiate by the breaking of Li-Si and Li-Li bonds66 76 For LiF-
LiSi and LiF-Li15Si4 (Figure 54(c) and (d)) the ~2-fold lower tensile strength suggests that
considerable strain is accommodated by the LiF phase andor by interface separation in addition
to the plastically-deforming LixSi
Figure 54 Von Mises effective stress versus applied tensile strain for LiF-LixSi (blue curves)
Li2O-LixSi (red curves) and bulk LixSi (black curves) with (a)-(d) representing x = 0 05 1 and
375
76
In contrast the effective stress-strain curves for Li2O-LixSi structures up to x = ~05 are
comparable to bulk LixSi (Figure 54(a) and (b)) Beyond x ge 1 the consistently higher effective
stress for Li2O-LixSi versus the plastically-deforming bulk LixSi suggests that the companion
Li2O phase deforms rigidly with limited interface separation
The deformed atomic configurations are examined for LiF-LixSi and Li2O-LixSi at a fixed
applied strain of 12057622 = 02 in Figure 55 For clarity the porous low-bond-density regions are
highlighted in grey26 Observe that the weakly-bonded LiF-Si interface separates cleanly (Figure
55(a)-i) In the case of LiF-LiSi2 (Figure 55(a)-ii) distinct interfacial voids separated by chains
of F-Li-Si bonds now develop For LiF-LiSi deformation is no longer confined to the interface
allowing significant strain to be accommodated by both the LiF and LiSi phases (Figure 55(a)-
iii) Pores now develop along the LiF-LiSi interface as well as within the LiF phase by the
breaking of Li-F bonds but limited porosity is observed within the LiSi phase which suggests the
earlier onset of plasticity for LiF versus LiSi For LiF-Li15Si4 stable pores now develop
homogeneously within LiF and Li15Si4 as well as along the interface (Figure 55(a)-iv) This
enhanced plasticity of LiF-Li15Si4 results in significant softening of the stress-strain response in
Figure 54(d) since deformation can now be accommodated in-part by the presence of these
voids In contrast to the weakly-bonded LiF-Si or LiF-LiSi2 interface structures the much
stronger interfacial bonding for Li2O-LixSi across all x allows strain to be accommodated by both
Li2O and LixSi phases Unlike LiF however the much stiffer Li2O phase only deforms
elastically even at applied strains of 12057622 = 02 For Li2O-Si the high ~8 GPa yield strength of Si
allows both phases to elastically stretch (Figure 55(b)-i)25 Increasing x however significantly
lowers the yield strength to ~34 GPa for LiSi2 ~25 GPa for LiSi and ~14 GPa for Li15Si425
Coupled with the two- to three-fold larger stiffness of Li2O versus LixSi strain becomes
77
increasingly localized within the LixSi phase with increasing x causing fracture to consistently
develop within the LixSi phase (Figure 55(b)-ii to iv)
Figure 55 Deformed atomic configurations and corresponding porosity distributions
(highlighted in gray) within (a) LiF-LixSi and (b) Li2O-LixSi interface structures at a fixed
applied strain of ɛ22 = 02 with (i)-(iv) representing x = 0 05 1 and 375
54 Comparison with Experiments
Recent experiments report rapid SEI growth between 10 (Li04Si) and 30 (Li11Si)
lithiation state of the silicon electrode after which the SEI film stabilizes and Li insertion in the
electrode dominates Li uptake77 The simulations here clearly show the segregation of Li atoms
along both LiF-LixSi and Li2O-LixSi interfaces this segregation of Li atoms along the respective
interfaces should precede significant lithiation of the silicon electrodes in agreement with
experiments
78
In the case of LiF-LixSi the weak bonding between LiF and LixSi for 119909 lt 05 suggests that
LiF can only form on LixSi with 119909 ge 05 In contrast Li2O strongly bonds with LixSi across all x
At 119909 lt 05 ionic Si-O bonds form between the O-terminated interface of Li2O and LixSi at 119909 ge
05 Li segregates at the interface and form Li-Si bonds by breaking Si-O bonds Therefore the
formation of Li2O over LiF is expected to be more favorable during the early stages of lithiation
(small x) or at slow lithiation rates This is in agreement with experimental studies which report
the formation of more uniform SEI containing higher compositional proportion of LiF with fast
lithiation of the silicon electrode38 Studies have also subjected fully-lithiated Si nanoparticles to
fluorinated compounds to create LiF-based artificial SEI which has been proven to be highly
effective in maintaining the cyclic capacity44 the results above suggest that pre-lithiation is in
fact a necessary condition to achieve proper adhesion between LiF and LixSi It is remarked that
the results here pertain to the lithiation of pure amorphous Si without its native oxide layer
Previous studies have shown that the SiO2 layer on Si can be very stable and cause high first-
cycle capacity loss27 30 On the other hand reducing this SiO2 layer by chemical etching
significantly improves the electrochemical performance of the battery25 The contributing effects
of this native oxide layer is a subject of future work Experiments have consistently shown that
increasing the composition of LiF in SEI via the addition of FEC in the electrolyte or by tuning
the cycling conditions significantly improves the fracture resistance of SEI and the cycle life of
the battery30 35 78 For a strongly-bonded SEI film on LixSi the stress built-up in the SEI caused
by volumetric changes of LixSi scales with the stiffness of the SEI considering the deformation
to be elastic The [100]-oriented LiF has an elastic modulus of ~819 GPa which is comparable
to that of LixSi As shown in Figure 55 LiF readily deforms plastically through the formation of
delocalized stable voids which significantly limits the build-up of stresses and results in
79
improved damage tolerance Compared to LiF [100]-oriented Li2O has a two-fold higher elastic
modulus of ~1976 GPa and deforms only elastically The rigid Li2O phase in SEI therefore
places significant constraints on the expandingcontracting of LixSi electrode which exacerbates
the build-up of interfacial stresses to cause cracking
55 Conclusions
The first principle calculations here reveal contrasting mechanical responses of LiF-LixSi and
Li2O-LixSi interface structures which are relevant to the deformation of SEI on silicon
electrodes It is shown that LiF only bonds with LixSi after sufficient Li segregation to the LiF-
LixSi interface with x gt ~1 Once formed LiF imparts significant ductility to the SEI film by
inducing plasticity through the formation of delocalized stable voids within the entire interfacial
structure In contrast Li2O imparts rigidity to the SEI film and thus is less strain-tolerant and
promotes brittle-like interfacial failure These results explain the experimentally-observed
improvements in fracture toughness of the SEI films with increasing compositional proportion of
LiF versus Li2O Understanding the relationship between the composition of the SEI and its
deformation response provides important insights into the engineering of artificial SEI layers on
silicon electrodes with improved damage tolerance
80
CHAPTER 6 CONCLUSIONS AND FUTURE WORK
In this dissertation density functional theory calculations and molecular dynamics
simulations were used to investigate three critical aspects concerning the deformation mechanics
of Si electrodes in high-capacity Li-ion batteries (a) transitions in the deformation and failure
mechanics of LixSi alloys with increasing x (b) mechanisms underlying the sliding and
delamination of the Si electrode from the current collector as well as (c) mechanical properties
of the SEI and how its deformation behavior is coupled to the lithiation response of the
underlying Si electrode The major conclusions of this dissertation research are as follows
From first principle calculations my research has shown that the lithiated silicon electrodes
represented by LixSi alloys undergo a brittle-to-ductile transition with increasing extents of
lithiation (x) which is in contrast to the brittle nature of pure Si Plasticity of LixSi initiates at x =
~05 through the formation of nanopores separated by a Si-Si bond-network under deformation
Continued loading results in the breaking of these covalent Si-Si bonds in a brittle fashion When
x ge 1 the deformation response transitions to ductile behavior due to the increased density of
highly-stretchable Li-Li bonds which can sustain large deformation and stabilize nanopore
growth As such the deformation can be accommodated by the formation of delocalized stable
voids throughout the highly-lithiated structure To observe these deformation characteristics of
LixSi at a higher length-scale MD simulations were performed using both the reactive force-field
potential and the modified embedded atom method potential ndash predictions from both these
interatomic potentials were compared against prior experiments as well as DFT calculations
These MD simulations have confirmed the high damage tolerance of highly-lithiated LixSi alloys
even in the presence of a pre-existing defect
81
My dissertation research has uncovered the atomistic mechanisms underpinning sliding and
delamination of a lithiated Si electrode from Cu current collector Using ab-initio MD and DFT
the complex interdiffused Li-Si-Cu interphase structure connecting lithiated Si electrode and the
Cu current collector was recreated by a rapid heating and quenching technique Shear
deformation studies show that the formation of well-delineated and weakly bonded Si-Cu and Li-
Cu crystalline atomic layers within this interdiffused interphase allows for interfacial sliding
Such interfacial sliding between the Si electrode and the Cu current collector prevents the
buildup of high interfacial stresses caused by volumetric changes of the electrode during
electrochemical cycling Nevertheless interfacial sliding is terminated after several cycles due to
the formation of highly stable LiSi3 compounds across the Si-Cu and Li-Cu sliding planes
Accordingly this termination of sliding leads to the build-up of high interfacial stresses which
explains the delamination of the electrode from the current collector reported experimentally
after a number of cycles
In addition to cracking of the Si electrode and delamination of the electrode from the current
collector the 300 volumetric changes of the electrode during charge cycling can lead to
cracking of the passivating SEI layer My research has quantified how strain is transferred from
lithiated Si electrodes to LiF and Li2O two primary inorganic SEI components DFT calculations
reveal that LiF imparts significant ductility to the SEI film by inducing plasticity through the
formation of delocalized stable voids within the entire interface structure while Li2O imparts
rigidity to the SEI film and thus is less strain-tolerant and promotes brittle-like interfacial failure
However LiF only bonds with LixSi when x gt 1 suggesting that pre-lithiation is necessary to
form a LiF-rich interface between Si electrodes and SEI
82
The research in this dissertation helps us to better understand the mechanical degradation of
Si electrodes in large-capacity Li-ion batteries The focus has been on the mechanical behavior
of Si electrodes the interface between Si electrodes and current collector and the interface
between Si electrodes and SEI layer However in actual Li-ion batteries the deformation
mechanics is closely coupled to electrochemical reaction during charge cycling Elucidating the
fundamental properties of the LixSi electrodes and the interfacial mechanics between the
electrodecurrent collector and the electrodeSEI paves the way for future work to model the
coupled lithiation-deformation behavior of a full-scale lithium ion battery comprising of the
cathode anode and electrolyte Such calculations will have to be performed at the continuum
(finite element) level with properties informed by atomistic simulations detailed in this thesis
Some preliminary research has been performed to examine the close-coupling between the
SEI-film and the Si electrode during lithiation using a finite element framework incorporating
finite strains plastic flow and the effect of mean stress on the diffusion of lithium Depending
on the chemical composition of the SEI film (related to the electrolyte composition and initial
cycling conditions) the film can have different thickness morphology and stiffness all of which
can result in very different deformation characteristics of both the SEI film and the Si electrode
during electrochemical cycling The SEI film places some constraint on the deformation of the
underlying Si electrode which can influence the Li diffusion response within the electrode
Changes in the deformation characteristics of the electrode can in turn influence the stress-
transfer to the SEI film Some potential questions that can be answered by the finite element
simulations include (a) why SEI film cracking initiates from the edges of a Si island as shown
by recent in situ and operando studies23 (b) how Li diffusion is affected by the constraint effects
of both the current collector and SEI (c) what other failure modes can be observed for SEI films
83
of different thickness or stiffness and (d) if the development of cracks on the SEI can propagate
through the underlying Si electrode
In this preliminary study a 2D finite element model was constructed which included a 4 μm
times 400 nm Si thin film sandwiched by a4 μm times 2 μm Cu current collector at the bottom and an
SEI thin film of various thicknesses at the top with tightly-bonded electrodecurrent collector
and electrodeSEI interfaces Following prior studies 49 the constitutive response of all three
components follow an elastic-perfectly-plastic deformation behavior based on the J2 flow theory
The mechanical and lithium diffusion properties from this preliminary study are based on prior
experimental or DFT studies56667576798081 The above constitutive equations are numerically
implemented in the commercial finite element solver ABAQUS through the UMAT user
subroutine for the finite strain elasto-plastic deformation and the UMATHT subroutine for the
Li diffusion process For brevity the Fortran codes of these USER Subroutines are included in
Appendix More details of the finite element modeling can be found in a previous publication82
The preliminary results are summarized as follows
Figure 61 show the distribution of Li concentration ie x in LixSi for Si thin film attached
on Cu current collector with different SEI thicknesses after lithiation of 140 s The properties of
the SEI thin film are taken to be that of LiF In all the four cases a sharp reaction front is
observed which is consistent with experimental observation464784-86 To quantify how the
lithiation reaction front forms during the initial lithiation process the normalized Li
concentration distribution along the top surface of the electrode as a function of time is shown
in Figure 62 Note that the location x = 0 denotes the center of the Si electrode (the symmetric
dashed line in Figure 61) At the initial lithiation stage of t = 30 s (blue dashed line) the Li
concentration increases uniformly along the top surface with exception of the significantly
84
higher Li concentration at the corner of the electrode due to the lower constraint (lower
compressive stresses) at the free-edges which permit more rapid lithiation In the absence of the
SEI layer in Figure 61(a) lithiation rapidly saturates at the corner-edge ndash a phenomenon termed
as surface locking83 Depending on the thickness of the SEI layer the location of this edge-
lithiation cluster can shift slightly inwards More interestingly the SEI layer directly above this
fast saturation lithiation region displays considerable necking and is the potential site for
initiation of SEI film cracking Recent experiments have confirmed that the SEI film indeed
cracks close to this location as shown in Figure 63
Figure 61 Normalized Li concentration contour within Si electrodes with an SEIrsquos thickness 119889119894
of (a) 0 nm (b) 30 nm (c) 60 nm and (d) 100nm after 140 s lithiation
85
Figure 62 Normalized Li concentration distribution within Si electrodes with different SEI
thicknesses of (a) 0 nm (b) 30 nm (c) 60 nm and (d) 100nm at various lithiation times
Figure 63 Atomic force microscopy imaging of the SEI thin film on Si electrodes after the first
lithiation cycle with distinct cracks observed near the corner edges 25
86
Figure 64 summarizes the cracking location L-xf as labeled in the inset as a function of SEI
thickness It shows that the cracking location shifts inwards with increasing SEI film thickness
Above an SEI film thickness of 100 nm this saturated lithiation cluster near the edge rapidly
merges with the lithiation front growing from the center as shown in Figure 61(d) As a result
cracking of the SEI layer is potentially suppressed
Figure 64 The cracking location on the SEI layer (L-xf) vs SEI thickness
The above preliminary results confirm that full-scale finite element analyses can provide
important insights into the coupled deformation-lithiation response of the SEIelectrodecurrent-
collector system In addition such full-scale finite element studies can be utilized together with
3D printing techniques for the topological-optimized design of future electrode materials to
mitigate cracking Depending on the unique microstructures of these electrode materials such
calculations should also be tied to fundamental studies at the atomistic level For example the
use of nanostructured Si electrodes has been known to mitigate cracking but the large surface
area of these electrode materials implies that the surface diffusion of Li ions on these Si
87
electrode nanostructures are now important and have to be incorporated in the higher-scale
models This is a subject of future work
88
REFERENCES
1 Gasteiger H al e Lithium batteries advanced technologies and applications 1 ed John
Wiley amp Sons Inc Hoboken New Jersey 2013
2 Tarascon J M Armand M Issues and challenges facing rechargeable lithium batteries
Nature 2001 414 (6861) 359-367
3 Gauthier M Carney T J Grimaud A Giordano L Pour N Chang H H Fenning D
P Lux S F Paschos O Bauer C Magia F Lupart S Lamp P Shao-Horn Y Electrode-
Electrolyte Interface in Li-Ion Batteries Current Understanding and New Insights Journal of
Physical Chemistry Letters 2015 6 (22) 4653-4672
4 Manthiram A An Outlook on Lithium Ion Battery Technology ACS Central Science 2017 3
(10) 1063-1069
5 Janek J Zeier W G A solid future for battery development Nature Energy 2016 1 4
6 Kasavajjula U Wang C Appleby A J Nano- and bulk-silicon-based insertion anodes for
lithium-ion secondary cells Journal of Power Sources 2007 163 (2) 1003-1039
7 Beaulieu L Y Eberman K W Turner R L Krause L J Dahn J R Colossal reversible
volume changes in lithium alloys Electrochemical and Solid State Letters 2001 4 (9) A137-
A140
8 Wang Y He Y Xiao R Li H Aifantis K E Huang X Investigation of crack patterns
and cyclic performance of Ti-Si nanocomposite thin film anodes for lithium ion batteries
Journal of Power Sources 2012 202 236-245
9 Pharr M Suo Z Vlassak J J Measurements of the Fracture Energy of Lithiated Silicon
Electrodes of Li-Ion Batteries Nano Letters 2013 13 (11) 5570-5577
10 Wang X Fan F Wang J Wang H Tao S Yang A Liu Y Chew H B Mao S X
Zhu T Xia S High damage tolerance of electrochemically lithiated silicon Nature
Communications 2015 6
89
11 Khosrownejad S M Curtin W A Crack growth and fracture toughness of amorphous Li-
Si anodes Mechanisms and role of chargingdischarging studied by atomistic simulations
Journal of the Mechanics and Physics of Solids 2017 107 542-559
12 Shenoy V B Johari P Qi Y Elastic softening of amorphous and crystalline Li-Si Phases
with increasing Li concentration A first-principles study Journal of Power Sources 2010 195
(19) 6825-6830
13 Boles S T Thompson C V Kraft O Moenig R In situ tensile and creep testing of
lithiated silicon nanowires Applied Physics Letters 2013 103 (26)
14 Hertzberg B Benson J Yushin G Ex-situ depth-sensing indentation measurements of
electrochemically produced Si-Li alloy films Electrochemistry Communications 2011 13 (8)
818-821
15 Kushima A Huang J Li J Quantitative Fracture Strength and Plasticity Measurements of
Lithiated Silicon Nanowires by In Situ TEM Tensile Experiments ACS Nano 2012 6 (11)
9425-9432
16 Lee S W McDowell M T Berla L A Nix W D Cui Y Fracture of crystalline
silicon nanopillars during electrochemical lithium insertion Proceedings of the National
Academy of Sciences of the United States of America 2012 109 (11) 4080-4085
17 Liu X Zheng H Zhong L Huan S Karki K Zhang L Liu Y Kushima A Liang
W Wang J Cho J H Epstein E Dayeh S A Picraux S T Zhu T Li J Sullivan J P
Cumings J Wang C Mao S X Ye Z Zhang S L Huang J Y Anisotropic Swelling and
Fracture of Silicon Nanowires during Lithiation Nano Letters 2011 11 (8) 3312-3318
18 Takamura T Ohara S Uehara M Suzuki J Sekine K A vacuum deposited Si film
having a Li extraction capacity over 2000 mAhg with a long cycle life Journal of Power
Sources 2004 129 (1) 96-100
19 Graetz J Ahn C C Yazami R Fultz B Highly reversible lithium storage in
nanostructured silicon Electrochemical and Solid State Letters 2003 6 (9) A194-A197
20 Maranchi J P Hepp A F Evans A G Nuhfer N T Kumta P N Interfacial properties
of the a-SiCu active-inactive thin-film anode system for lithium-ion batteries Journal of the
Electrochemical Society 2006 153 (6) A1246-A1253
90
21 Haftbaradaran H Xiao X Verbrugge M W Gao H Method to deduce the critical size
for interfacial delamination of patterned electrode structures and application to lithiation of thin-
film silicon islands Journal of Power Sources 2012 206 357-366
22 Stournara M E Xiao X Qi Y Johari P Lu P Sheldon B W Gao H Shenoy V B
Li Segregation Induces Structure and Strength Changes at the Amorphous SiCu Interface Nano
Letters 2013 13 (10) 4759-4768
23 Kumar R Tokranov A Sheldon B W Xiao X Huang Z Li C Mueller T In Situ
and Operando Investigations of Failure Mechanisms of the Solid Electrolyte Interphase on
Silicon Electrodes ACS Energy Letters 2016 1 (4) 689-697
24 Nadimpalli S P V Sethuraman V A Dalavi S Lucht B Chon M J Shenoy V B
Guduru P R Quantifying capacity loss due to solid-electrolyte-interphase layer formation on
silicon negative electrodes in lithium-ion batteries Journal of Power Sources 2012 215 145-
151
25 Kumar R Tokranov A In Situ and Operando Investigations of Failure Mechanisms of the
Solid Electrolyte interphase on Silicon Electrodes ACS Energy Letters 2016 1 4
26 Dupre N Moreau P De Vito E Quazuguel L Boniface M Bordes A Rudisch C
Bayle-Guillemaud P Guyomard D Multiprobe Study of the Solid Electrolyte Interphase on
Silicon-Based Electrodes in Full-Cell Configuration Chemistry of Materials 2016 28 (8) 2557-
2572
27 Ferraresi G Czornomaz L Villevieille C Novak P El Kazzi M Elucidating the
Surface Reactions of an Amorphous Si Thin Film as a Model Electrode for Li-Ion Batteries ACS
Applied Materials amp Interfaces 2016 8 (43) 29791-29798
28 Leung K Soto F Hankins K Balbuena P B Harrison K L Stability of Solid
Electrolyte Interphase Components on Lithium Metal and Reactive Anode Material Surfaces
Journal of Physical Chemistry C 2016 120 (12) 6302-6313
29 Okuno Y Ushirogata K Sodeyama K Tateyama Y Decomposition of the
fluoroethylene carbonate additive and the glue effect of lithium fluoride products for the solid
electrolyte interphase an ab initio study Physical Chemistry Chemical Physics 2016 18 (12)
8643-8653
91
30 Young B T Heskett D R Nguyen C C Nie M Y Woicik J C Lucht B L Hard
X-ray Photoelectron Spectroscopy (HAXPES) Investigation of the Silicon Solid Electrolyte
Interphase (SEI) in Lithium-Ion Batteries ACS Applied Materials amp Interfaces 2015 7 (36)
20004-20011
31 Nie M Abraham D P Chen Y Bose A Lucht B L Silicon Solid Electrolyte
Interphase (SEI) of Lithium Ion Battery Characterized by Microscopy and Spectroscopy Journal
of Physical Chemistry C 2013 117 (26) 13403-13412
32 Chan C K Ruffo R Hong S S Cui Y Surface chemistry and morphology of the solid
electrolyte interphase on silicon nanowire lithium-ion battery anodes Journal of Power Sources
2009 189 (2) 1132-1140
33 Aurbach D Zinigrad E Cohen Y Teller H A short review of failure mechanisms of
lithium metal and lithiated graphite anodes in liquid electrolyte solutions Solid State Ionics 2002
148 (3-4) 405-416
34 Elazari R Salitra G Gershinsky G Garsuch A Panchenko A Aurbach D Li Ion
Cells Comprising Lithiated Columnar Silicon Film Anodes TiS2 Cathodes and Fluoroethyene
Carbonate (FEC) as a Critically Important Component Journal of the Electrochemical Society
2012 159 (9) A1440-A1445
35 Lindgren F Xu C Niedzicki L Marcinek M Gustafsson T Bjorefors F Edstrom K
Younesi R SEI Formation and Interfacial Stability of a Si Electrode in a LiTDI-Salt Based
Electrolyte with FEC and VC Additives for Li-Ion Batteries ACS Applied Materials amp
Interfaces 2016 8 (24) 15758-15766
36 Etacheri V Haik O Goffer Y Roberts G A Stefan I C Fasching R Aurbach D
Effect of Fluoroethylene Carbonate (FEC) on the Performance and Surface Chemistry of Si-
Nanowire Li-Ion Battery Anodes Langmuir 2012 28 (1) 965-976
37 Zhang Q Pan J Lu P Liu Z Verbrugge M W Sheldon B W Cheng Y-T Qi Y
Xiao X Synergetic Effects of Inorganic Components in Solid Electrolyte Interphase on High
Cycle Efficiency of Lithium Ion Batteries Nano Letters 2016 16 (3) 2011-2016
92
38 Tokranov A Sheldon B W Li C Minne S Xiao X In Situ Atomic Force Microscopy
Study of Initial Solid Electrolyte Interphase Formation on Silicon Electrodes for Li-Ion Batteries
ACS Applied Materials amp Interfaces 2014 6 (9) 6672-6686
39 Hu Z L Zhang S Dong S M Li W J Li H Cui G L Chen L Q Poly(ethyl
alpha-cyanoacrylate)-Based Artificial Solid Electrolyte Interphase Layer for Enhanced Interface
Stability of Li Metal Anodes Chemistry of Materials 2017 29 (11) 4682-4689
40 Kozen A C Lin C F Zhao O Lee S B Rubloff G W Noked M Stabilization of
Lithium Metal Anodes by Hybrid Artificial Solid Electrolyte Interphase Chemistry of Materials
2017 29 (15) 6298-6307
41 Liu Y Y Lin D C Yuen P Y Liu K Xie J Dauskardt R H Cui Y An Artificial
Solid Electrolyte Interphase with High Li-Ion Conductivity Mechanical Strength and Flexibility
for Stable Lithium Metal Anodes Advanced Materials 2017 29 (10)
42 Ma L Kim M S Archer L A Stable Artificial Solid Electrolyte Interphases for Lithium
Batteries Chemistry of Materials 2017 29 (10) 4181-4189
43 Zhi J Yazdi A Z Valappil G Haime J Chen P Artificial solid electrolyte interphase
for aqueous lithium energy storage systems Science Advances 2017 3 (9)
44 Zhao J Lu Z Wang H Liu W Lee H-W Yan K Zhuo D Lin D Liu N Cui Y
Artificial Solid Electrolyte Interphase-Protected LixSi Nanoparticles An Efficient and Stable
Prelithiation Reagent for Lithium-Ion Batteries Journal of the American Chemical Society 2015
137 (26) 8372-8375
45 Berla L A Lee S W Ryu I Cui Y Nix W D Robustness of amorphous silicon
during the initial lithiationdelithiation cycle Journal of Power Sources 2014 258 253-259
46 McDowell M T Lee S W Harris J T Korgel B A Wang C M Nix W D Cui Y
In Situ TEM of Two-Phase Lithiation of Amorphous Silicon Nanospheres Nano Letters 2013
13 (2) 758-764
47 Wang J He Y Fan F Liu X Xia S Liu Y Harris C T Li H Huang J Mao S
X Zhu T Two-Phase Electrochemical Lithiation in Amorphous Silicon Nano Letters 2013 13
(2) 709-715
93
48 Li J Dahn J R An in situ X-ray diffraction study of the reaction of Li with crystalline Si
Journal of the Electrochemical Society 2007 154 (3) A156-A161
49 Zhao K Pharr M Cai S Vlassak J J Suo Z Large Plastic Deformation in High-
Capacity Lithium-Ion Batteries Caused by Charge and Discharge Journal of the American
Ceramic Society 2011 94 S226-S235
50 Kresse G Furthmuller J Efficiency of ab-initio total energy calculations for metals and
semiconductors using a plane-wave basis set Computational Materials Science 1996 6 (1) 15-
50
51 Kresse G Furthmuller J Efficient iterative schemes for ab initio total-energy calculations
using a plane-wave basis set Physical Review B 1996 54 (16) 11169-11186
52 Kresse G Joubert D From ultrasoft pseudopotentials to the projector augmented-wave
method Physical Review B 1999 59 (3) 1758-1775
53 Perdew J P Burke K Ernzerhof M Generalized gradient approximation made simple
Physical Review Letters 1996 77 (18) 3865-3868
54 Johari P Qi Y Shenoy V B The Mixing Mechanism during Lithiation of Si Negative
Electrode in Li-Ion Batteries An Ab lnitio Molecular Dynamics Study Nano Letters 2011 11
(12) 5494-5500
55 OrsquoConnell P A Mckenna G B Encyclopedia of Polymer Science and Technology 3 ed
John Wiley and Sons Inc Hoboken New Jersey 2004 p 657-681
56 Pan J Zhang Q Li J Beck M J Xiao X Cheng Y-T Effects of stress on lithium
transport in amorphous silicon electrodes for lithium-ion batteries Nano Energy 2015 13 192-
199
57 Chou C-Y Kim H Hwang G S A Comparative First-Principles Study of the Structure
Energetics and Properties of Li-M (M = Si Ge Sn) Alloys Journal of Physical Chemistry C
2011 115 (40) 20018-20026
58 Pauling L THE NATURE OF THE CHEMICAL-BOND AND THE STRUCTURE OF
MOLECULES AND CRYSTALS - AN INTRODUCTION TO MODERN STRUCTURAL
CHEMISTRY Current ContentsEngineering Technology amp Applied Sciences 1985 (4) 16-16
94
59 Bower A F Guduru P R Sethuraman V A A finite strain model of stress diffusion
plastic flow and electrochemical reactions in a lithium-ion half-cell Journal of the Mechanics
and Physics of Solids 2011 59 (4) 804-828
60 Brassart L Suo Z Reactive flow in solids Journal of the Mechanics and Physics of Solids
2013 61 (1) 61-77
61 Gurson A L CONTINUUM THEORY OF DUCTILE RUPTURE BY VOID
NUCLEATION AND GROWTH 1 YIELD CRITERIA AND FLOW RULES FOR POROUS
DUCTILE MEDIA Journal of Engineering Materials and Technology-Transactions of the
ASME 1977 99 (1) 2-15
62 Plimpton S FAST PARALLEL ALGORITHMS FOR SHORT-RANGE MOLECULAR-
DYNAMICS Journal of Computational Physics 1995 117 (1) 1-19
63 Baskes M I MODIFIED EMBEDDED-ATOM POTENTIALS FOR CUBIC
MATERIALS AND IMPURITIES Physical Review B 1992 46 (5) 2727-2742
64 Cui Z Gao F Cui Z Qu J A second nearest-neighbor embedded atom method
interatomic potential for Li-Si alloys Journal of Power Sources 2012 207 150-159
65 Ostadhossein A Cubuk E D Tritsaris G A Kaxiras E Zhang S L van Duin A C
T Stress effects on the initial lithiation of crystalline silicon nanowires reactive molecular
dynamics simulations using ReaxFF Physical Chemistry Chemical Physics 2015 17 (5) 3832-
3840
66 Wang H Wang X Xia S Chew H B Brittle-to-ductile transition of lithiated silicon
electrodes Crazing to stable nanopore growth Journal of Chemical Physics 2015 143 (10)
67 Ding B Li X Zhang X Wu H Xu Z Gao H Brittle versus ductile fracture
mechanism transition in amorphous lithiated silicon From intrinsic nanoscale cavatation to shear
banding Nano Energy 2015 18 8
68 Berla L A Lee S W Cui Y Nix W D Mechanical behavior of electrochemically
lithiated silicon Journal of Power Sources 2015 273 41-51
95
69 Sethuraman V A Chon M J Shimshak M Srinivasan V Guduru P R In situ
measurements of stress evolution in silicon thin films during electrochemical lithiation and
delithiation Journal of Power Sources 2010 195 (15) 5062-5066
70 Haftbaradaran H Gao H J Ratcheting of silicon island electrodes on substrate due to
cyclic intercalation Applied Physics Letters 2012 100 (12)
71 Soni S K Sheldon B W Xiao X C Verbrugge M W Ahn D Haftbaradaran H
Gao H J Stress Mitigation during the Lithiation of Patterned Amorphous Si Islands Journal of
the Electrochemical Society 2012 159 (1) A38-A43
72 Xiao X Liu P Verbrugge M W Haftbaradaran H Gao H Improved cycling stability
of silicon thin film electrodes through patterning for high energy density lithium batteries
Journal of Power Sources 2011 196 (3) 1409-1416
73 Wang X G Smith J R SiCu interface structure and adhesion Physical Review Letters
2005 95 (15)
74 Zhang Q Xiao X Zhou W Cheng Y-T Verbrugge M W Toward High Cycle
Efficiency of Silicon-Based Negative Electrodes by Designing the Solid Electrolyte Interphase
Advanced Energy Materials 2015 5 (5)
75 Jain A Ong S P Hautier G Chen W Richards W D Dacek S Cholia S Gunter
D Skinner D Ceder G Persson K A Commentary The Materials Project A materials
genome approach to accelerating materials innovation APL Materials 2013 1 (1)
76 Wang H Chew H B Molecular dynamics simulations of plasticity and cracking in
lithiated silicon electrodes Extreme Mechanics Letters 2016 9 (3) 11
77 Bordes A De Vito E Haon C Secouard C Montani A Marcus P Investigation of
Lithium Insertion Mechanisms of a Thin-Film Si Electrode by Coupling Time-of-Flight
Secondary-Ion Mass Spectrometry X-ray Photoelectron Spectroscopy and Focused-Ion-
BeamSEM ACS Applied Materials amp Interfaces 2015 7 (50) 27853-27862
78 Xu C Lindgren F Philippe B Gorgoi M Bjorefors F Edstrom K Gustafsson T
Improved Performance of the Silicon Anode for Li-Ion Batteries Understanding the Surface
Modification Mechanism of Fluoroethylene Carbonate as an Effective Electrolyte Additive
Chemistry of Materials 2015 27 (7) 2591-2599
96
79 Ding N Xu J Yao Y X Wegner G Fang X Chen C H Lieberwirth I
Determination of the diffusion coefficient of lithium ions in nano-Si Solid State Ionics 2009 180
(2-3) 222-225
80 Zhu J Y Feng J M Guo Z S Mechanical properties of commercial copper current-
collector foils RSC Advances 2014 4 (101) 57671-57678
81 Kuznetsov V Zinn A H Zampardi G Borhani-Haghighi S La Mantia F Ludwig A
Schuhmann W Ventosa E Wet Nanoindentation of the Solid Electrolyte lnterphase on Thin
Film Si Electrodes ACS Applied Materials amp Interfaces 2015 7 (42) 23554-23563
82 Chew H B Hou B Wang X Xia S Cracking mechanisms in lithiated silicon thin film
electrodes International Journal of Solids and Structures 2014 51 (23-24) 4176-4187
83 Haftbaradaran H Gao H J Curtin W A A surface locking instability for atomic
intercalation into a solid electrode Applied Physics Letters 2010 96 (9)
84 Gao H Nix W D Surface roughening of heteroepitaxial thin films Annual Review of
Materials Science 1999 29 173-209
85 Soni S K Sheldon B W Xiao X C Tokranov A Thickness effects on the lithiation of
amorphous silicon thin films Scripta Materialia 2011 64 (4) 307-310
86 Wang H Chew H B Nanoscale Mechanics of the Solid Electrolyte Interphase on
Lithiated-Silicon Electrodes ACS Applied Materials amp Interfaces 2017 9 (31) 25662-25667
97
APPENDIX
ABAQUS SUBROUTINE FOR LITHIATION AND DEFORMATION OF
SILICON ELECTRODE
SUBROUTINE UMATHT(UDUDTDUDGFLUXDFDTDFDG 1 STATEVTEMPDTEMPDTEMDXTIMEDTIMEPREDEFDPRED 2 CMNAMENTGRDNSTATVPROPSNPROPSCOORDSPNEWDT 3 NOELNPTLAYERKSPTKSTEPKINC) C INCLUDE ABA_PARAMINC C CHARACTER80 CMNAME DIMENSION DUDG(NTGRD)FLUX(NTGRD)DFDT(NTGRD) 1 DFDG(NTGRDNTGRD)STATEV(NSTATV)DTEMDX(NTGRD) 2 TIME(2)PREDEF(1)DPRED(1)PROPS(NPROPS)COORDS(3) double precision omega kT D double precision Exp rou_0 double precision ksm_x1(200004) ksm_x2(200004) COMMON K_My ksm_x1 ksm_x2 D = 100(20) nm2s kT = 41368810(-30) GPa nm3 omega = 16810(-20) nm3ion C rou_0 = 7874602 Li ionnm3 DUDT = 10STATEV(4) DU=DUDTDTEMP U = U + DU if (STATEV(7) EQ 10 OR (TEMP LT 00001) OR (TEMP GT 275)) then FLUX(1) = -DDTEMDX(1)STATEV(4) FLUX(2) = -DDTEMDX(2)STATEV(4) DFDT(1) = 00 DFDT(2) = 00 DFDG(11) = -DSTATEV(4) DFDG(22) = -DSTATEV(4) else FLUX(1) = (-DDTEMDX(1) + omegaTEMPDkTksm_x1(NOELNPT))STATEV(4) FLUX(2) = (-DDTEMDX(2) + omegaTEMPDkTksm_x2(NOELNPT))STATEV(4) DFDT(1) = omegaDkTksm_x1(NOELNPT)STATEV(4) DFDT(2) = omegaDkTksm_x2(NOELNPT)STATEV(4)
98
DFDG(11) = -DSTATEV(4) DFDG(22) = -DSTATEV(4) endif STATEV(5) = ksm_x1(NOELNPT) STATEV(6) = ksm_x2(NOELNPT) RETURN END SUBROUTINE UMATHT SUBROUTINE URDFIL(LSTOPLOVRWRTKSTEPKINCDTIMETIME) C INCLUDE ABA_PARAMINC C DIMENSION ARRAY(513)JRRAY(NPRECD513)TIME(2) Double precision sm(30000) Integer elm node c(30000) node_max Integer elm_max inc(200004) Double precision coor(300002) Integer i j k no_elm_x Double precision x(42) s_g(2) sc(4) Double precision ksm_x1(200004) ksm_x2(200004) EQUIVALENCE (ARRAY(1)JRRAY(11)) COMMON K_My ksm_x1 ksm_x2 PARAMETER(TOL=0001) C C FIND CURRENT INCREMENT c write() here111221111111 CALL POSFIL(KSTEPKINCARRAYJRCD) write() KSTEP KINC c write(6) Here333 sm = 00 c = 0 DO K1=199999999 CALL DBFILE(0ARRAYJRCD) IF (JRCD NE 0) GO TO 110 KEY=JRRAY(12) IF (KEY EQ 1) THEN if (count == 4) count = 0 elm = JRRAY(13) node = JRRAY(14) count = count + 1 c if (KSTEP == 1 AND KINC == 1) inc(elmcount) = node ENDIF IF (KEY EQ 11) THEN sm(node) = sm(node) + (ARRAY(3) + ARRAY(4) + ARRAY(5))30 c(node) = c(node) + 1
99
ENDIF IF (KEY EQ 107) THEN coor(JRRAY(13)1) = ARRAY(4) coor(JRRAY(13)2) = ARRAY(5) node_max = JRRAY(13) ENDIF ENDDO 110 CONTINUE c write() here11111111 if (KINC100 NE KINC101000) THEN LOVRWRT = 1 Endif write() node_max HERE1 Do i = 1 node_max c write(6) i sm(i) c(i) node_max sm(i) = sm(i)(c(i)10) Enddo write() node_max HERE2 c Finding stress gradient Do i = 1 elm Do j = 1 2 x(1j) = coor(inc(i1)j) x(2j) = coor(inc(i2)j) x(3j) = coor(inc(i3)j) x(4j) = coor(inc(i4)j) Enddo Do k = 1 4 if (k == 1) then eta1 = -SQRT(30)30 eta2 = -SQRT(30)30 elseif (k == 2) then eta1 = SQRT(30)30 eta2 = -SQRT(30)30 elseif (k == 4) then eta1 = SQRT(30)30 eta2 = SQRT(30)30 elseif (k == 3) then corrected based on Abq documentation eta1 = -SQRT(30)30 eta2 = SQRT(30)30 endif sc(14) = sm(inc(i14)) Call K_GRAD(sc x eta1 eta2 s_g)
100
ksm_x1(ik) = s_g(1) ksm_x2(ik) = s_g(2) Enddo Enddo write() HERE KSTEP KINC RETURN END SUBROUTINE URDFIL SUBROUTINE K_GRAD(sc x eta1 eta2 sc_g) INTEGER i Double precision sc(4) x(42) eta1 eta2 sc_g(2)dNe(42)dxe(22) dNx(42) dex(22) a b c d e f g h ii dNe(11) = 025(-10)(1-eta2) dNe(12) = 025(-10)(1-eta1) dNe(21) = 025(10)(1-eta2) dNe(22) = 025(10+eta1)(-10) dNe(31) = 025(1+eta2) dNe(32) = 025(1+eta1) dNe(41) = 025(-10)(1+eta2) dNe(42) = 025(1-eta1)(10) dxe = 00 Do i = 12 Do j = 12 Do k = 14 dxe(ij) = dxe(ij) + dNe(kj)x(ki) Enddo Enddo Enddo Call K_inv(dxe dex) Do i = 1 4 Do j = 12 dNx(ij) = dNe(i1)dex(1j) + dNe(i2)dex(2j) Enddo Enddo sc_g = 00 Do i = 1 2 Do k = 1 4 sc_g(i) = sc_g(i) + dNx(ki)sc(k) Enddo
101
Enddo RETURN END SUBROUTINE K_GRAD Subroutine K_inv(DF DF_INV) Double precision DF(22) DF_INV(22) DET Double precision abcdefghi a = DF(11) b = DF(12) c = DF(21) d = DF(22) DF_INV(11) = d DF_INV(12) = -b DF_INV(21) = -c DF_INV(22) = a DF_INV = DF_INV (ad - bc) RETURN END Subroutine K_inv UMAT FOR ABAQUSSTANDARD INCORPORATING ELASTIC-PLASTIC LINEAR ISOTROPIC HARDENING LARGE DEFORMATION FORMULATION FOR PLANE STRAIN AND AXI-SYMMETRIC ELEMENTS IMPLICIT INTEGRATION WITH CONSISTENT JACOBIAN USER SUBROUTINE SUBROUTINE UMAT(STRESSSTATEVDDSDDESSESPDSCD 1 RPLDDSDDTDRPLDEDRPLDT 2 STRANDSTRANTIMEDTIMETEMPDTEMPPREDEFDPREDCMNAME 3 NDINSHRNTENSNSTATVPROPSNPROPSCOORDSDROTPNEWDT 4 CELENTDFGRD0DFGRD1NOELNPTLAYERKSPTKSTEPKINC) C INCLUDE ABA_PARAMINC C CHARACTER80 CMNAME C C DIMENSION STRESS(NTENS)STATEV(NSTATV) 1 DDSDDE(NTENSNTENS)DDSDDT(NTENS)DRPLDE(NTENS) 2 STRAN(NTENS)DSTRAN(NTENS)TIME(2)PREDEF(1)DPRED(1) 3 PROPS(NPROPS)COORDS(3)DROT(33)DFGRD0(33)DFGRD1(33) C C PARAMETER (ZERO=0D0 ONE=1D0 TWO=2D0 THREE=3D0 SIX=6D0 1 ENUMAX=4999D0 NEWTON=10 TOLER=10D-6M=3N=3ID=3NINE=9D0) C DIMENSION XIDEN(MN)XNV(4)DPSTRAN(4) STRESSOLD(4) 3D + DESTRAN(4) DSTRESS(4) XNDIR(MN) 3D + STR(MN)DSTR(MN) DPSTRN(MN) EELAS(6)EPLAS(6)FLOW(6) HARD(3)
102
Double precision alpha_0 alpha_i alpha emod_i ebulk3_i 1 xk_i eg2_i eg_i elam_i DELDSE(44) ETHERM(4) DTHERM(4) 1 a b c d e f g h i temp_e(4) temp_p(4) 3D E = 1000 ENU = 026 TMAX =25 SIGY0 = 360-0768temp if (temp GT TMAX OR (temp+dtemp) GT TMAX) then SIGY0 = 360-0768TMAX endif alpha_0 = 015664 alpha_i = log(alpha_0temp+10)temp alpha = log(alpha_0(temp+dtemp)+10)(temp+dtemp) if (temp+dtemp LT 0001 OR (temp LT 0001 )) then alpha_i = alpha_0 alpha = alpha_0 elseif (temp GT 25 OR temp+dtemp GT 25) then alpha_i = log(alpha_025+10)25 alpha = log(alpha_025+10)25 endif C LOCAL ARRAYS C ---------------------------------------------------------------- C EELAS - ELASTIC STRAINS C EPLAS - PLASTIC STRAINS C FLOW - DIRECTION OF PLASTIC FLOW C ---------------------------------------------------------------- C C C ---------------------------------------------------------------- C UMAT FOR ISOTROPIC ELASTICITY AND ISOTROPIC MISES PLASTICITY C CANNOT BE USED FOR PLANE STRESS C ---------------------------------------------------------------- C PROPS(1) - E C PROPS(2) - NU C PROPS(3) - SYIELD AN HARDENING DATA C CALLS UHARD FOR CURVE OF YIELD STRESS VS PLASTIC STRAIN C ---------------------------------------------------------------- C C ELASTIC PROPERTIES C if (TEMP GT 25) then EMOD_i = E - 500 else EMOD_i = E - 200TEMP endif EBULK3_i = EMOD_i(ONE-TWOENU) EG2_i = EMOD_i(ONE+ENU) EG_i = EG2_iTWO EG3_i = THREEEG_i ELAM_i = (EBULK3_i-EG2_i)THREE
103
if (TEMP+DTEMP GT 25) then EMOD = E - 500 else EMOD = E - 200(TEMP+DTEMP) endif EBULK3 = EMOD(ONE-TWOENU) EG2 = EMOD(ONE+ENU) EG = EG2TWO EG3 = THREEEG ELAM = (EBULK3-EG2)THREE C C ELASTIC STIFFNESS C DO K1=1 NDI DO K2=1 NDI DDSDDE(K2K1)=ELAM DELDSE(K2K1)=ELAM-ELAM_i END DO DDSDDE(K1K1)=EG2+ELAM DELDSE(K1K1)=EG2+ELAM-EG2_i-ELAM_i END DO DO K1=NDI+1 NTENS DDSDDE(K1K1)=EG DELDSE(K1K1)=EG-EG_i END DO C C thermal strain and strain increment C DO K1 = 1 NDI if (TEMP GT 25 OR TEMP+DTEMP GT 25) then ETHERM(K1) = alpha_i25 DTHERM(K1) = 000 else ETHERM(K1) = alpha_i(TEMP) DTHERM(K1) = alphaDTEMP endif ENDDO DO K1=NDI+1 NTENS ETHERM(K1) = 00 DTHERM(K1) = 00 ENDDO C RECOVER ELASTIC AND PLASTIC STRAINS AND ROTATE FORWARD C ALSO RECOVER EQUIVALENT PLASTIC STRAIN C if (time(2) LT 001) then CALL ROTSIG(STATEV(1) DROT EELAS 2 NDI NSHR) CALL ROTSIG(STATEV(2) DROT EPLAS 2 NDI NSHR) else CALL ROTSIG(temp_e DROT EELAS 2 NDI NSHR) CALL ROTSIG(temp_p DROT EPLAS 2 NDI NSHR) endif EQPLAS=STATEV(3)
104
C C CALCULATE PREDICTOR STRESS AND ELASTIC STRAIN C DO K1=1 NTENS DO K2=1 NTENS STRESS(K2) = STRESS(K2) + DDSDDE(K2K1)(DSTRAN(K1) - DTHERM(K1)) + DELDSE(K2K1)( STRAN(K1) - ETHERM(K1)) END DO EELAS(K1)=EELAS(K1)+DSTRAN(K1) - DTHERM(K1) END DO DO K1=1 NDI DDSDDT(K1) = -DDSDDE(K1K1)alpha ENDDO DO K1=NDI+1 NTENS DDSDDT(4) = 00 ENDDO C C CALCULATE EQUIVALENT VON MISES STRESS C SMISES=(STRESS(1)-STRESS(2))2+(STRESS(2)-STRESS(3))2 +(STRESS(3)-STRESS(1))2 DO K1=NDI+1NTENS SMISES=SMISES+SIXSTRESS(K1)2 END DO SMISES=SQRT(SMISESTWO) C C GET YIELD STRESS FROM THE SPECIFIED HARDENING CURVE C SYIEL0 = SIGY0 C C DETERMINE IF ACTIVELY YIELDING C IF (SMISESGT(ONE+TOLER)SYIEL0) THEN C C ACTIVELY YIELDING C SEPARATE THE HYDROSTATIC FROM THE DEVIATORIC STRESS C CALCULATE THE FLOW DIRECTION C SHYDRO=(STRESS(1)+STRESS(2)+STRESS(3))THREE DO K1=1NDI FLOW(K1)=(STRESS(K1)-SHYDRO)SMISES END DO DO K1=NDI+1 NTENS FLOW(K1)=STRESS(K1)SMISES END DO C C SOLVE FOR EQUIVALENT VON MISES STRESS C AND EQUIVALENT PLASTIC STRAIN INCREMENT USING NEWTON ITERATION C SYIELD=SYIEL0 DEQPL=ZERO DO KEWTON=1 NEWTON RHS=SMISES-EG3DEQPL-SYIELD DEQPL=DEQPL+RHS(EG3+0000) IF(ABS(RHS)LTTOLERSYIEL0) GOTO 10 END DO C
105
C WRITE WARNING MESSAGE TO THE MSG FILE C C WRITE(72) NEWTON C 2 FORMAT(30XrsquoWARNING - PLASTICITY ALGORITHM DID NOT rsquo C 1 rsquoCONVERGE AFTER rsquoI3rsquo ITERATIONSrsquo) 10 CONTINUE C C UPDATE STRESS ELASTIC AND PLASTIC STRAINS AND C EQUIVALENT PLASTIC STRAIN C DO K1=1NDI STRESS(K1)=FLOW(K1)SYIELD+SHYDRO EPLAS(K1)=EPLAS(K1)+THREETWOFLOW(K1)DEQPL EELAS(K1)=EELAS(K1)-THREETWOFLOW(K1)DEQPL END DO DO K1=NDI+1NTENS STRESS(K1)=FLOW(K1)SYIELD EPLAS(K1)=EPLAS(K1)+THREEFLOW(K1)DEQPL EELAS(K1)=EELAS(K1)-THREEFLOW(K1)DEQPL END DO EQPLAS=EQPLAS+DEQPL C C CALCULATE PLASTIC DISSIPATION C SPD=DEQPL(SYIEL0+SYIELD)TWO C C FORMULATE THE JACOBIAN (MATERIAL TANGENT) C FIRST CALCULATE EFFECTIVE MODULI C EFFG=EGSYIELDSMISES EFFG2=TWOEFFG EFFG3=THREETWOEFFG2 EFFLAM=(EBULK3-EFFG2)THREE EFFHRD=EG3HARD(1)(EG3+HARD(1))-EFFG3 DO K1=1 NDI DO K2=1 NDI DDSDDE(K2 K1)=EFFLAM END DO DDSDDE(K1 K1)=EFFG2+EFFLAM END DO DO K1=NDI+1 NTENS DDSDDE(K1 K1)=EFFG END DO DO K1=1 NTENS DO K2=1 NTENS DDSDDE(K2 K1)=DDSDDE(K2 K1)+EFFHRDFLOW(K2)FLOW(K1) END DO END DO ENDIF C C STORE ELASTIC AND (EQUIVALENT) PLASTIC STRAINS C IN STATE VARIABLE ARRAY C DO K1=1 NTENS temp_e(K1)=EELAS(K1) temp_p(K1)=EPLAS(K1) END DO STATEV(3)=EQPLAS
106
C Determine Jacobian(volume change ratio) from Deformation tensor a = DFGRD1(11) b = DFGRD1(12) c = DFGRD1(13) d = DFGRD1(21) e = DFGRD1(22) f = DFGRD1(23) g = DFGRD1(31) h = DFGRD1(32) i = DFGRD1(33) STATEV(4) = aei + bfg + cdh - gec - hfa - idb 3D C RETURN END
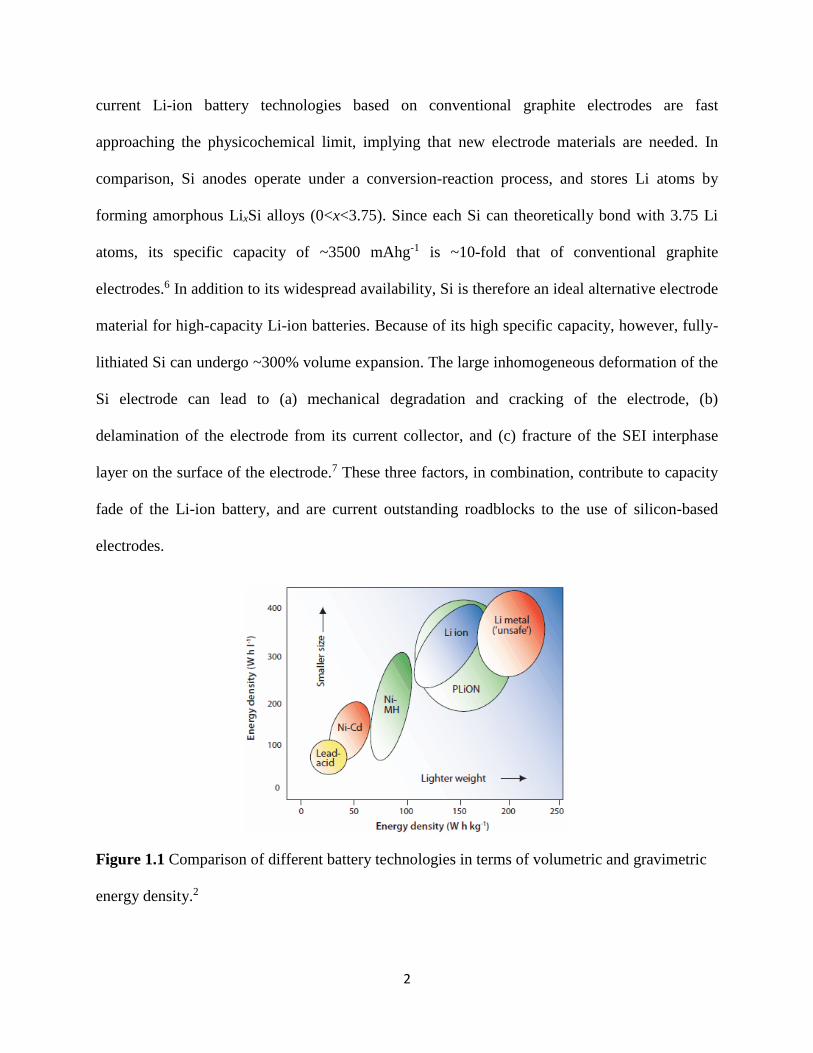
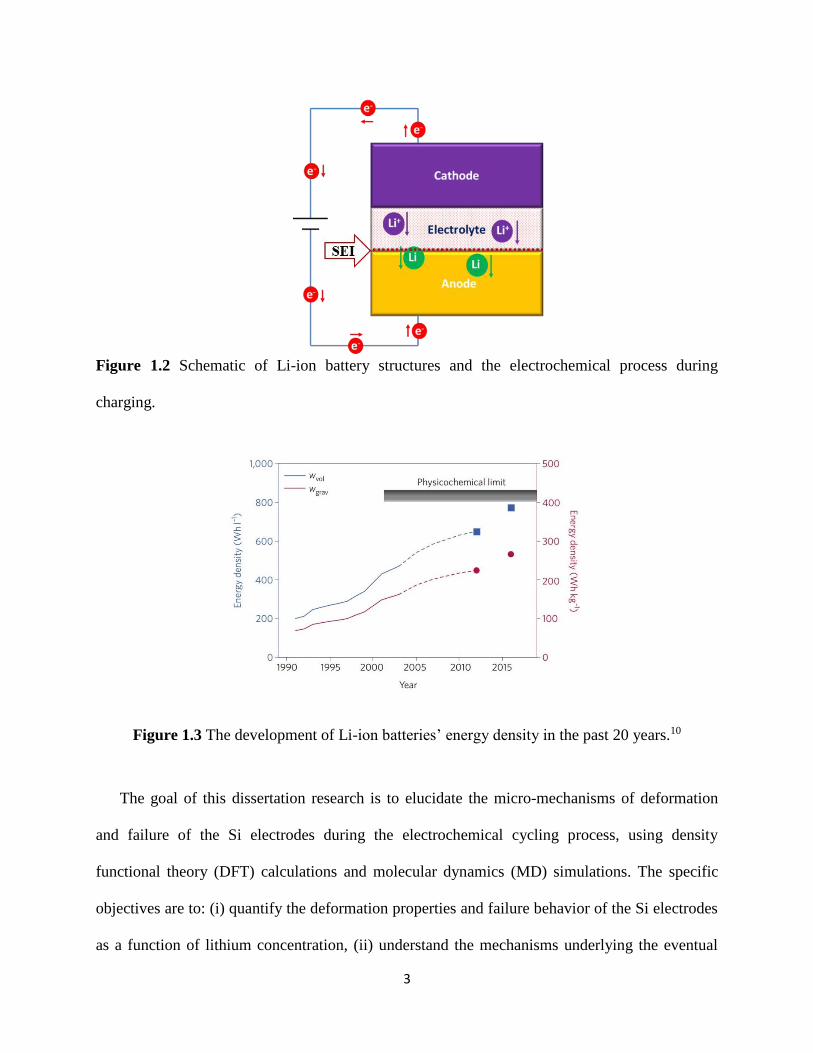
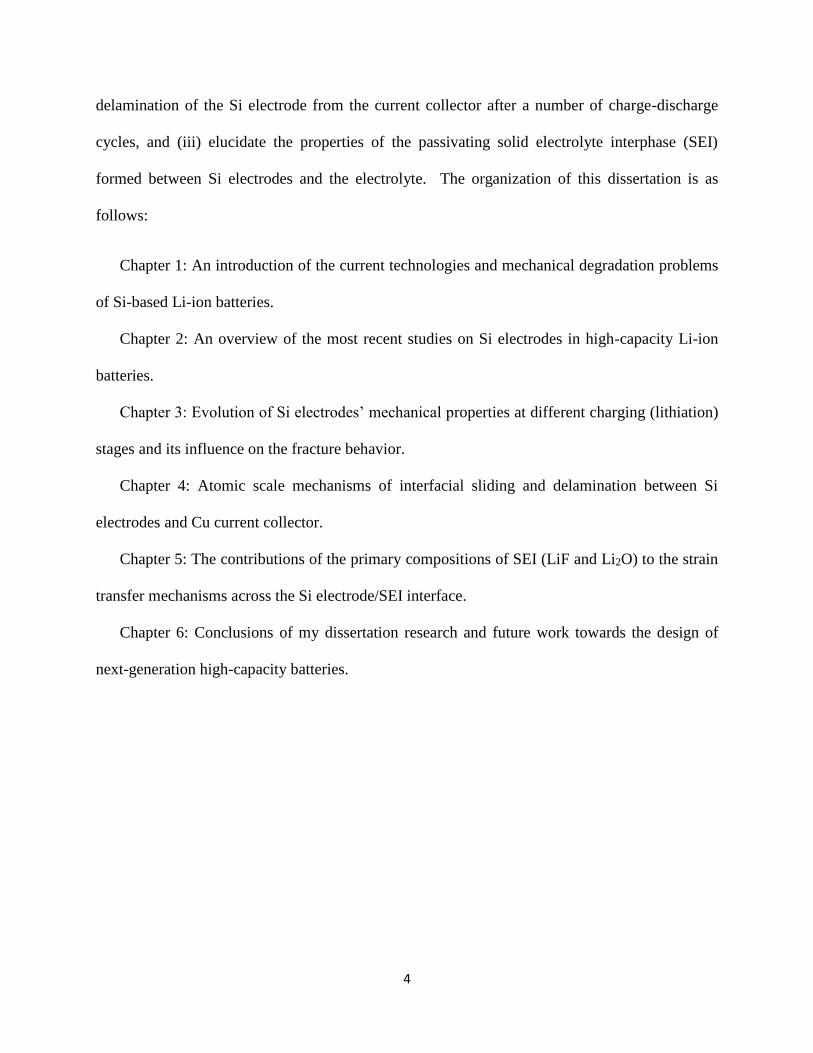
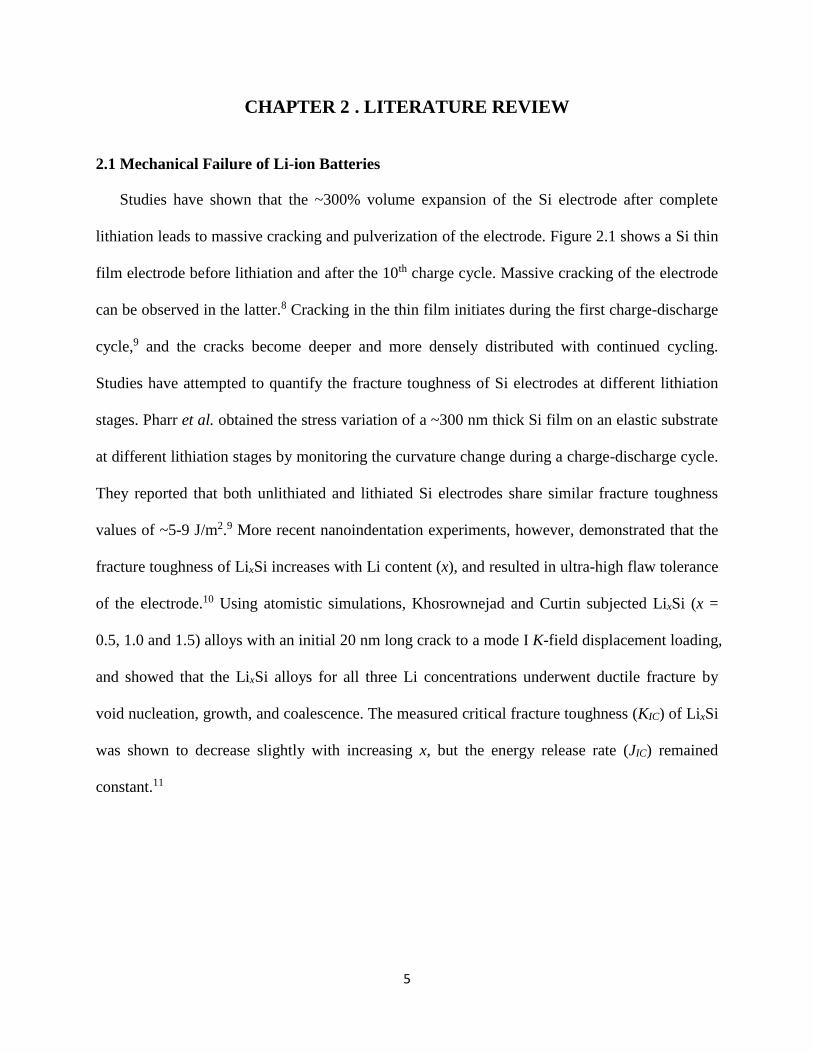
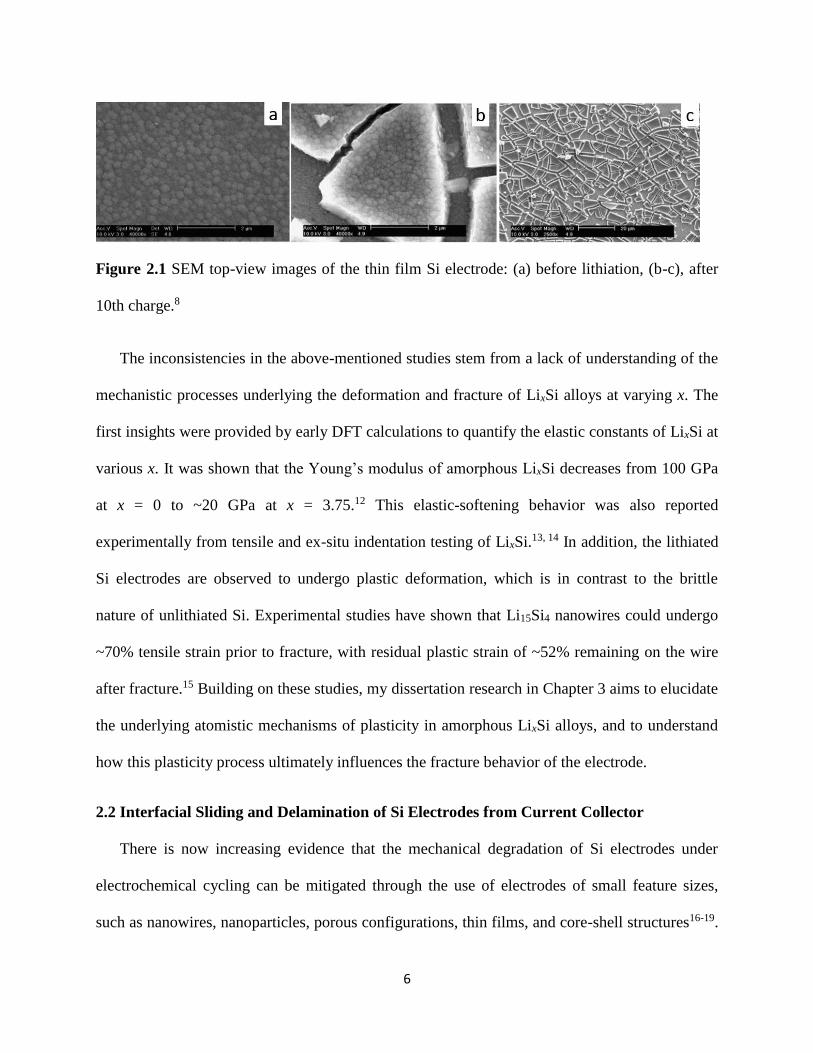
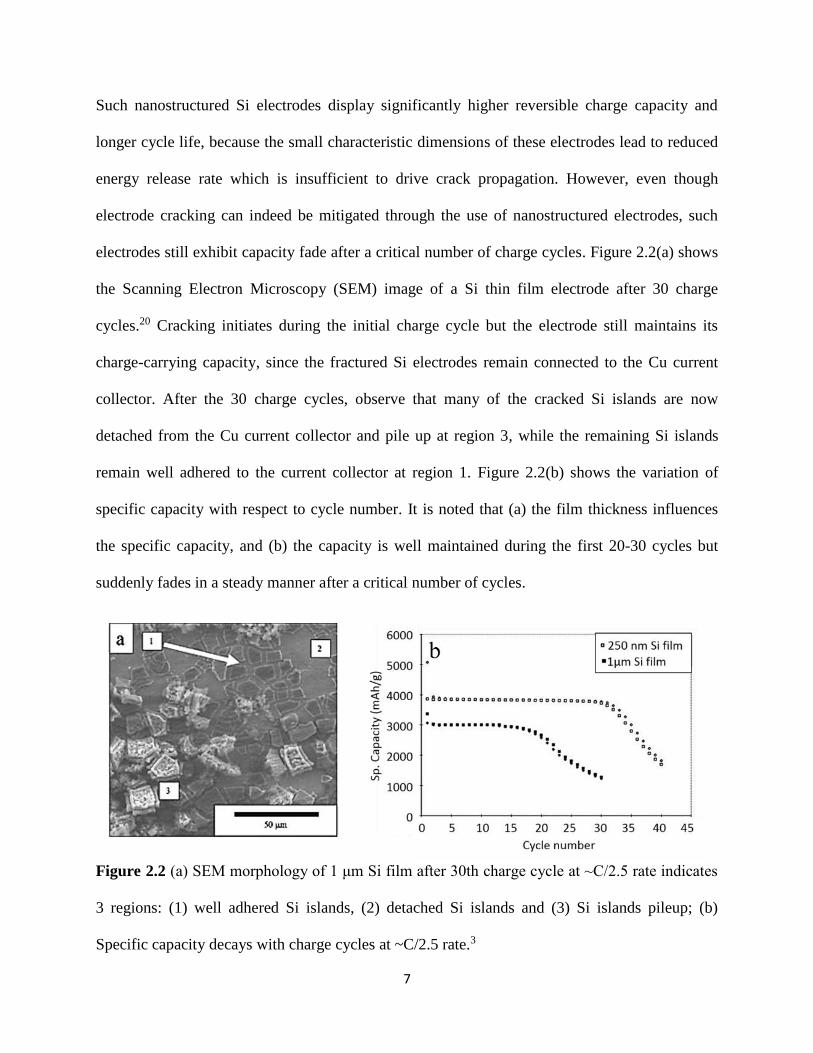
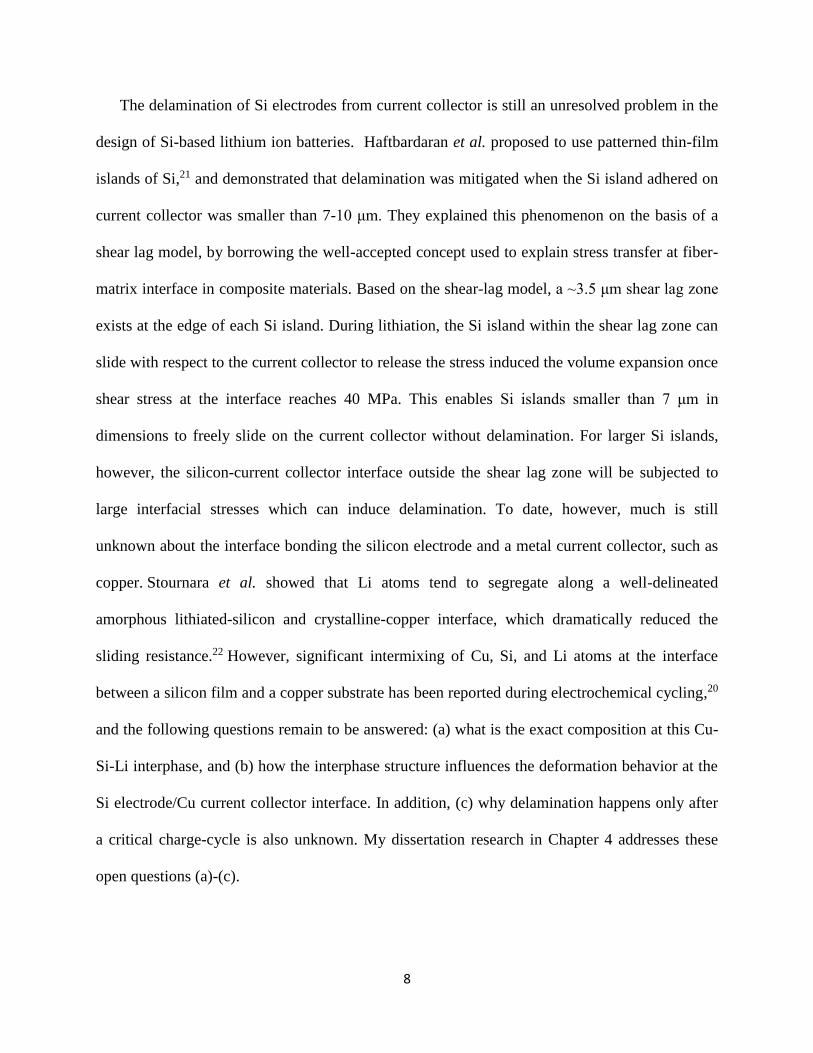
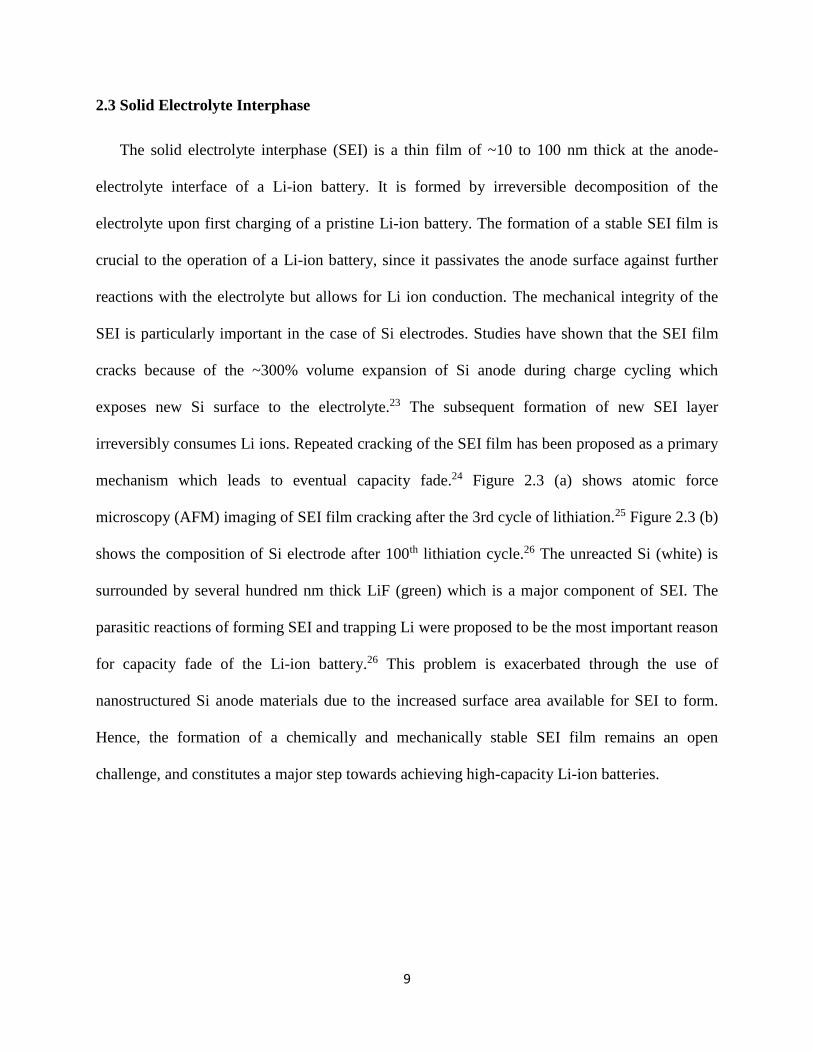
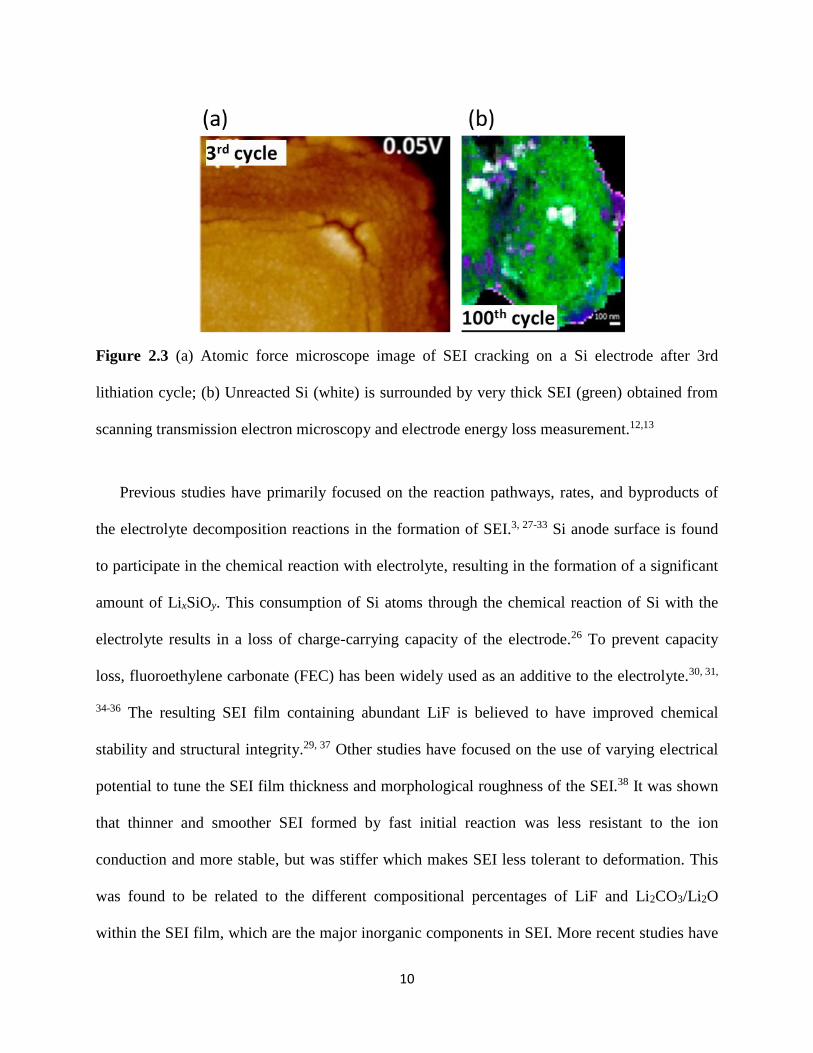
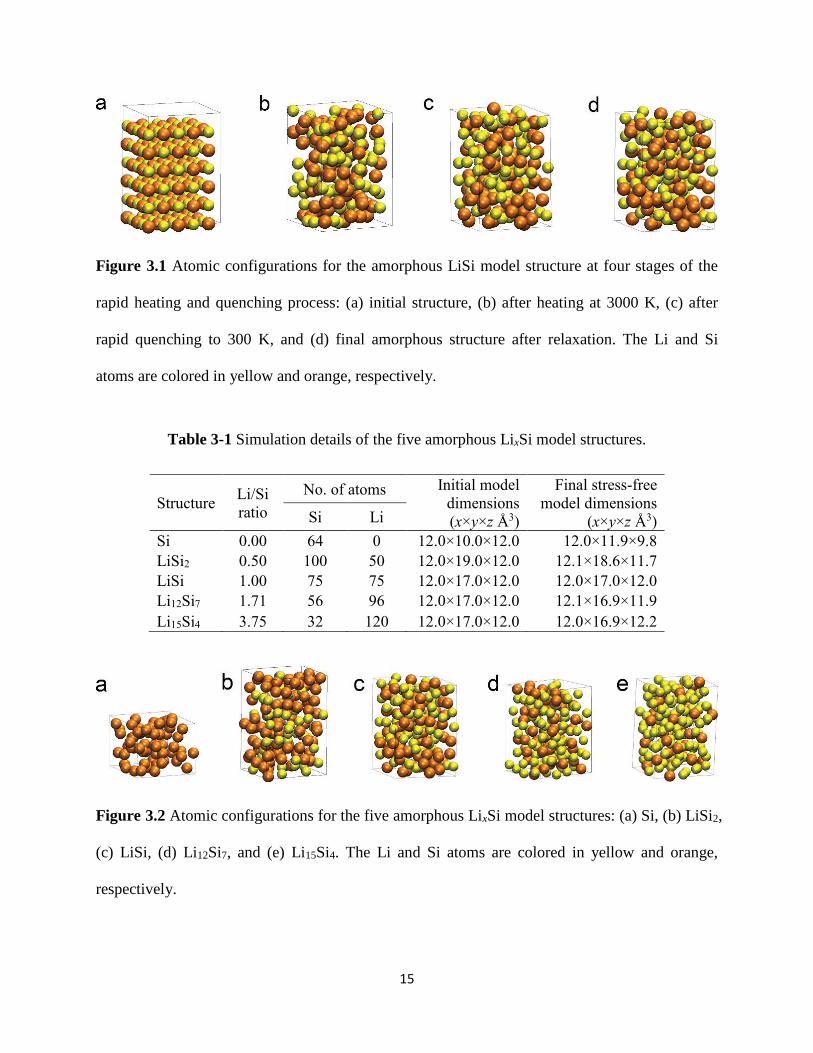
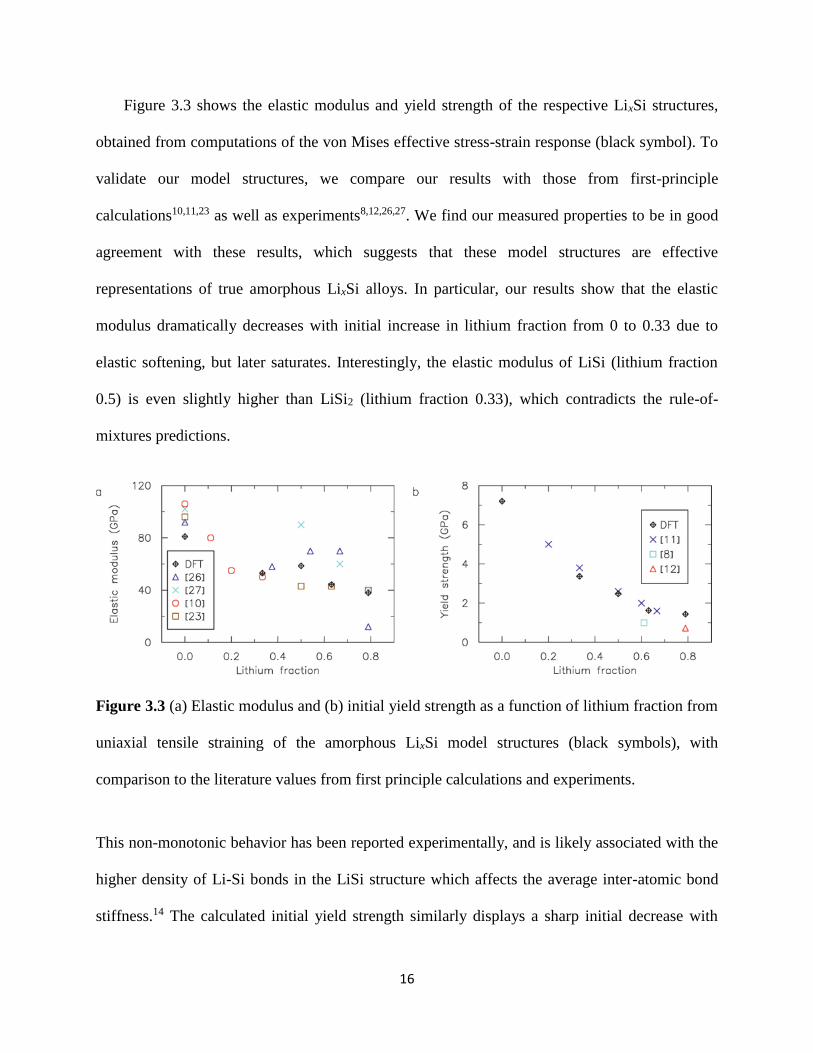
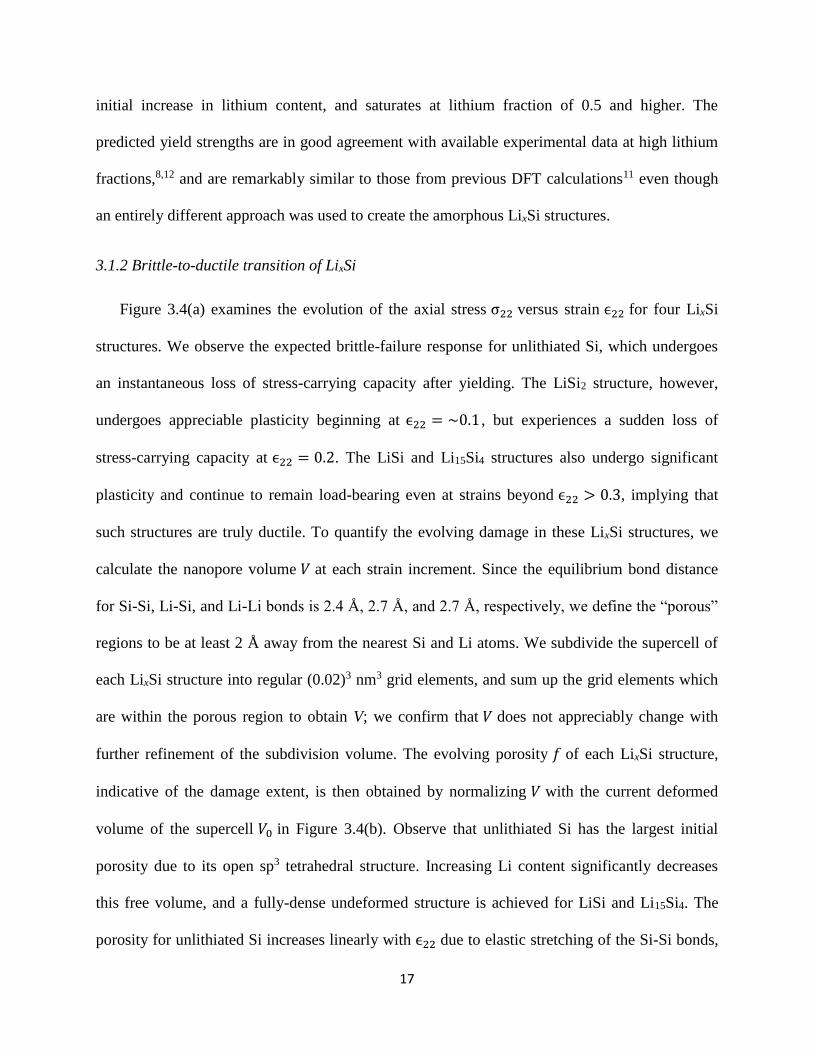
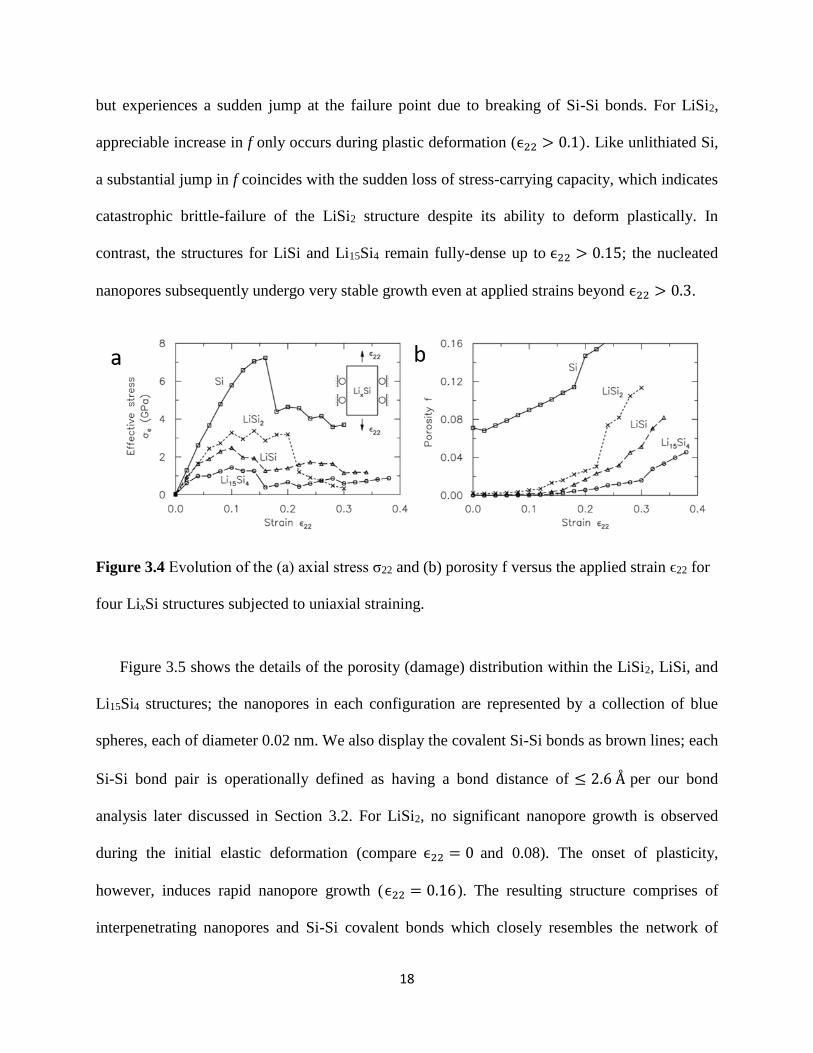
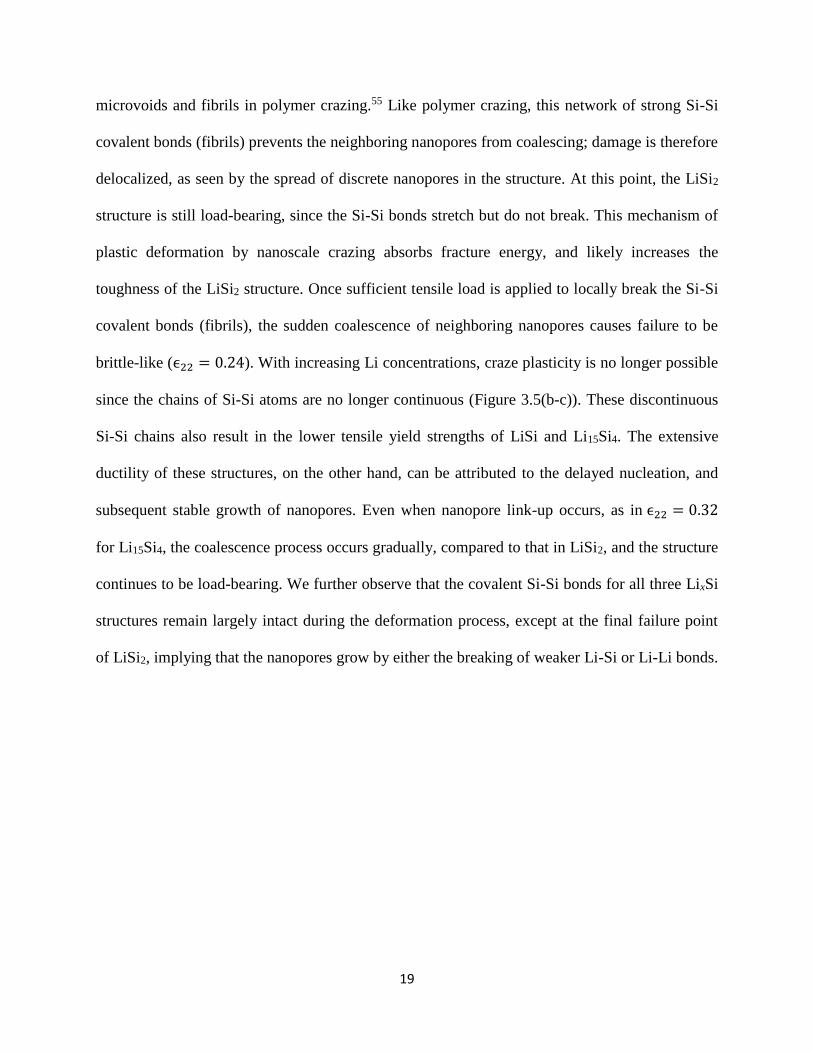
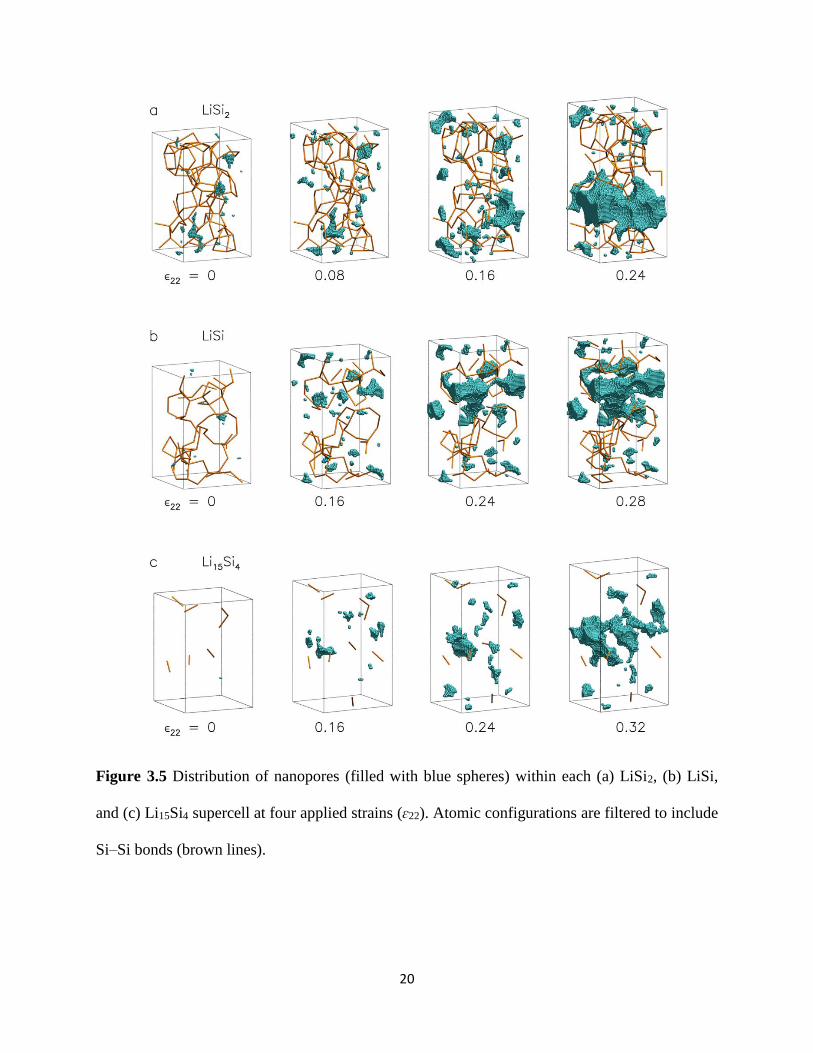
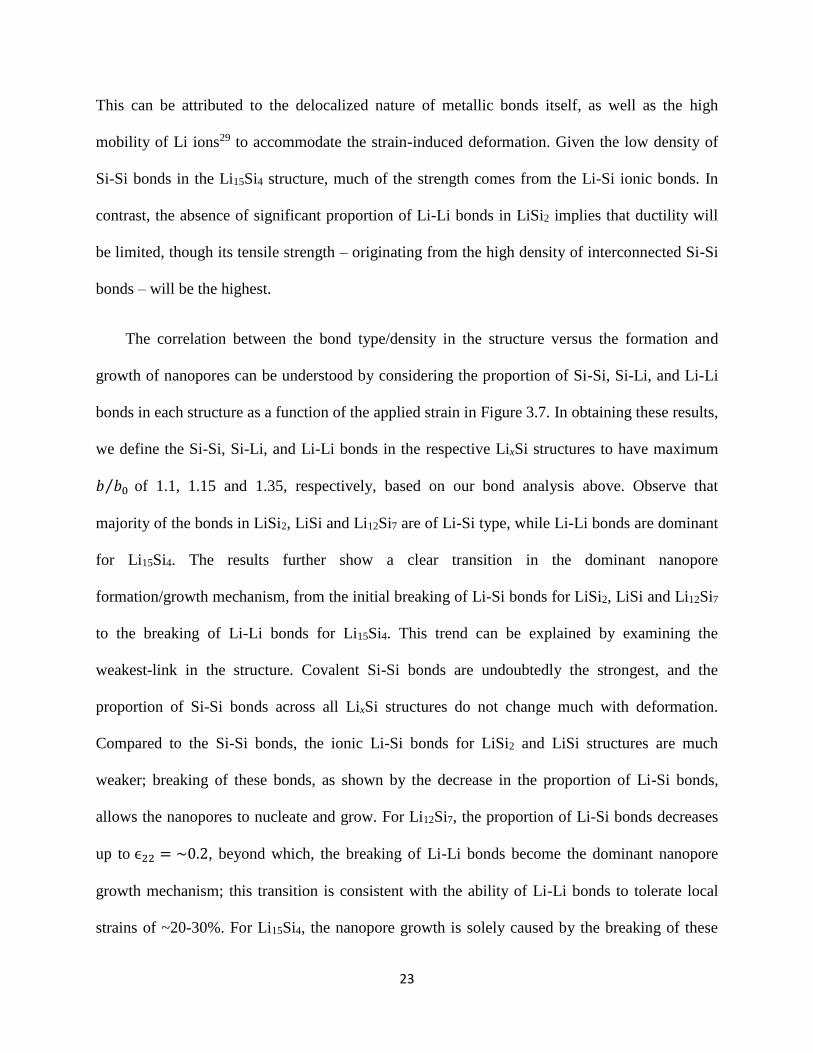
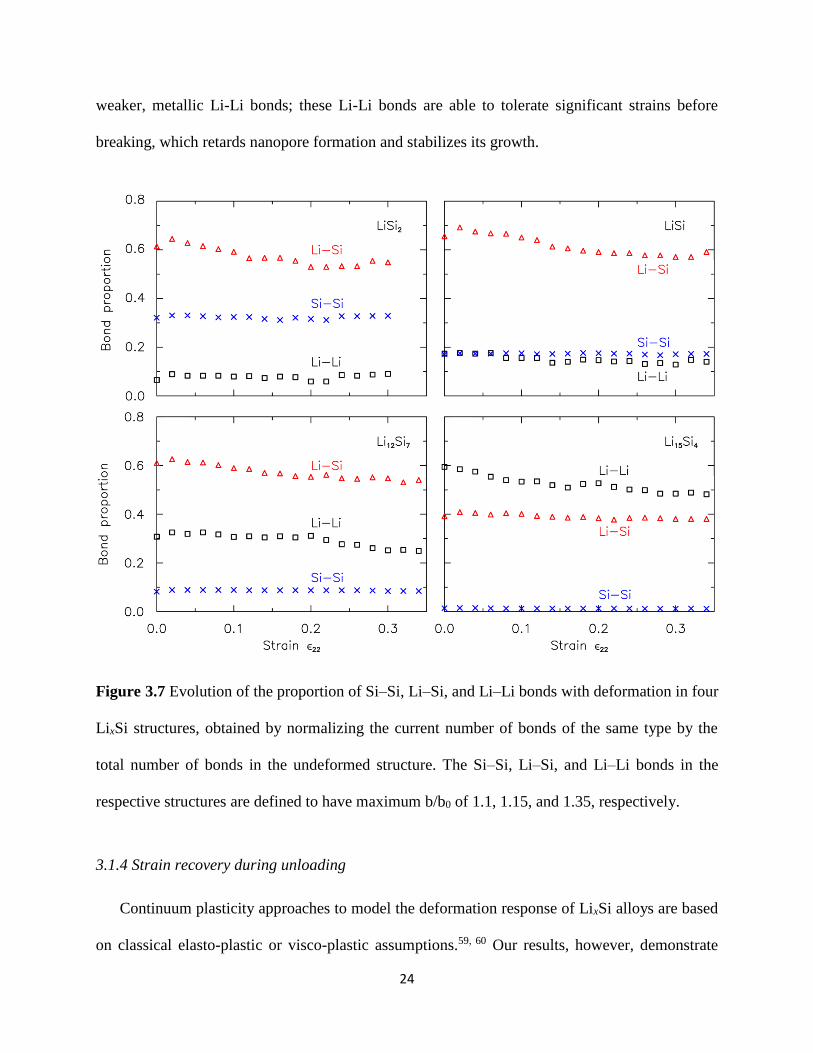
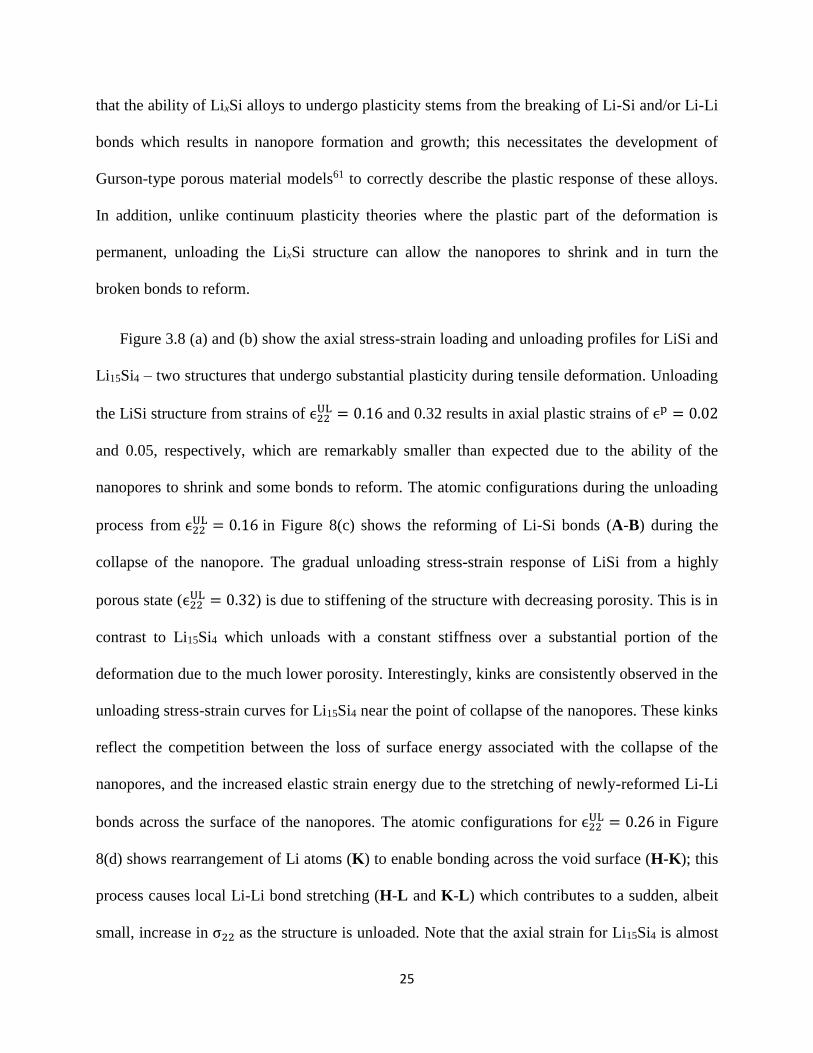
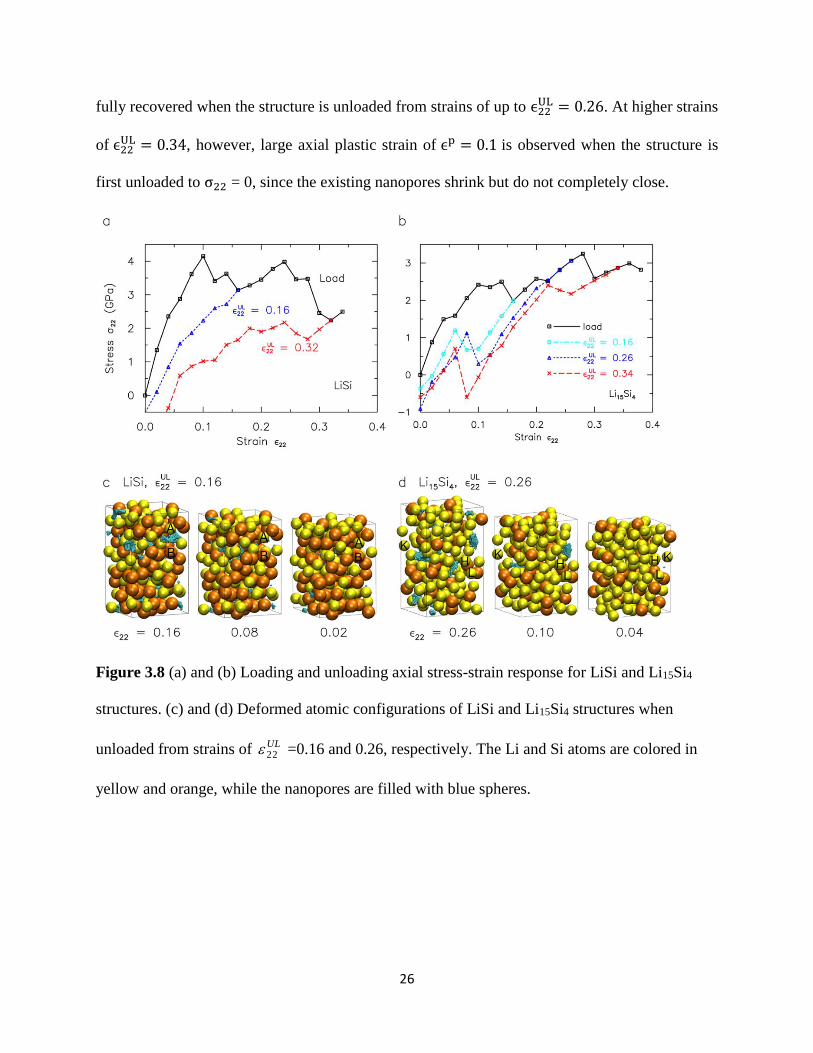
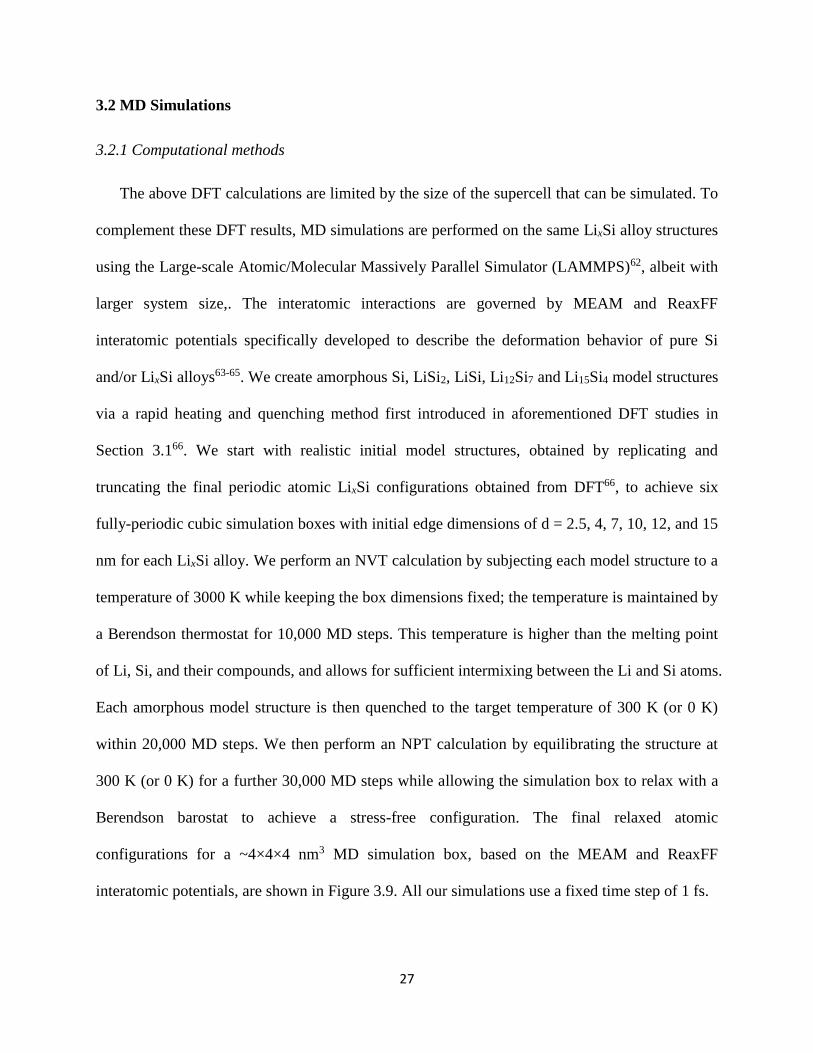
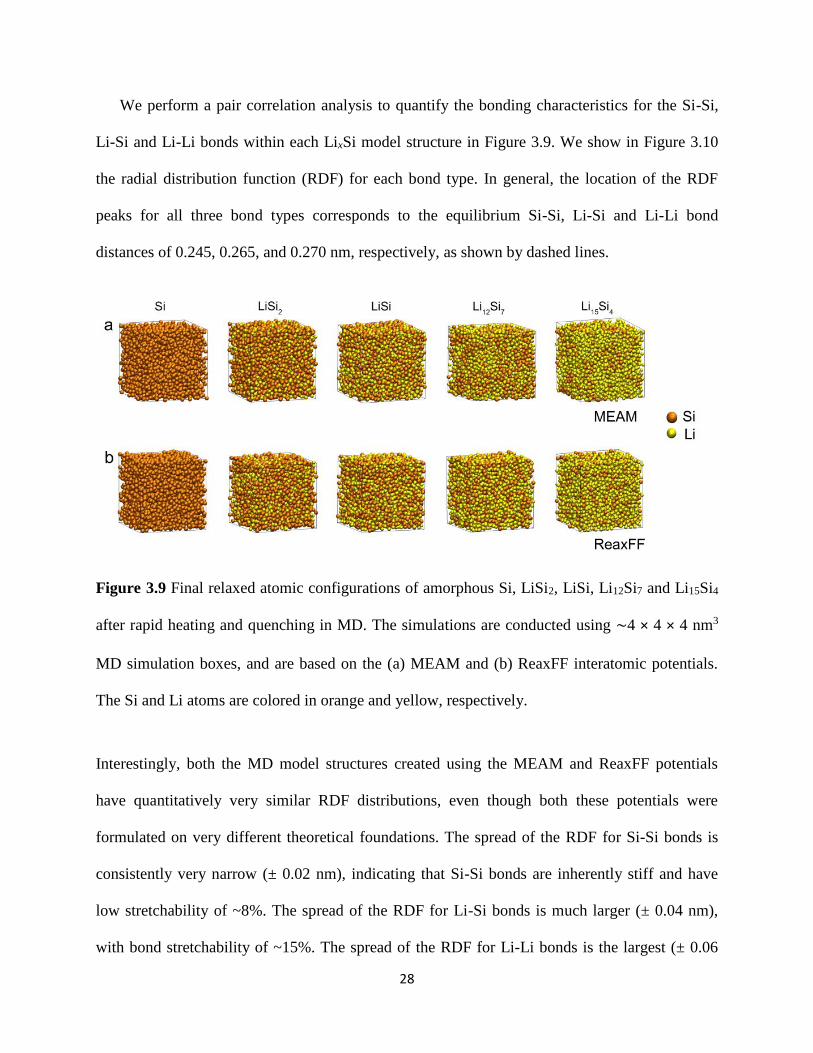
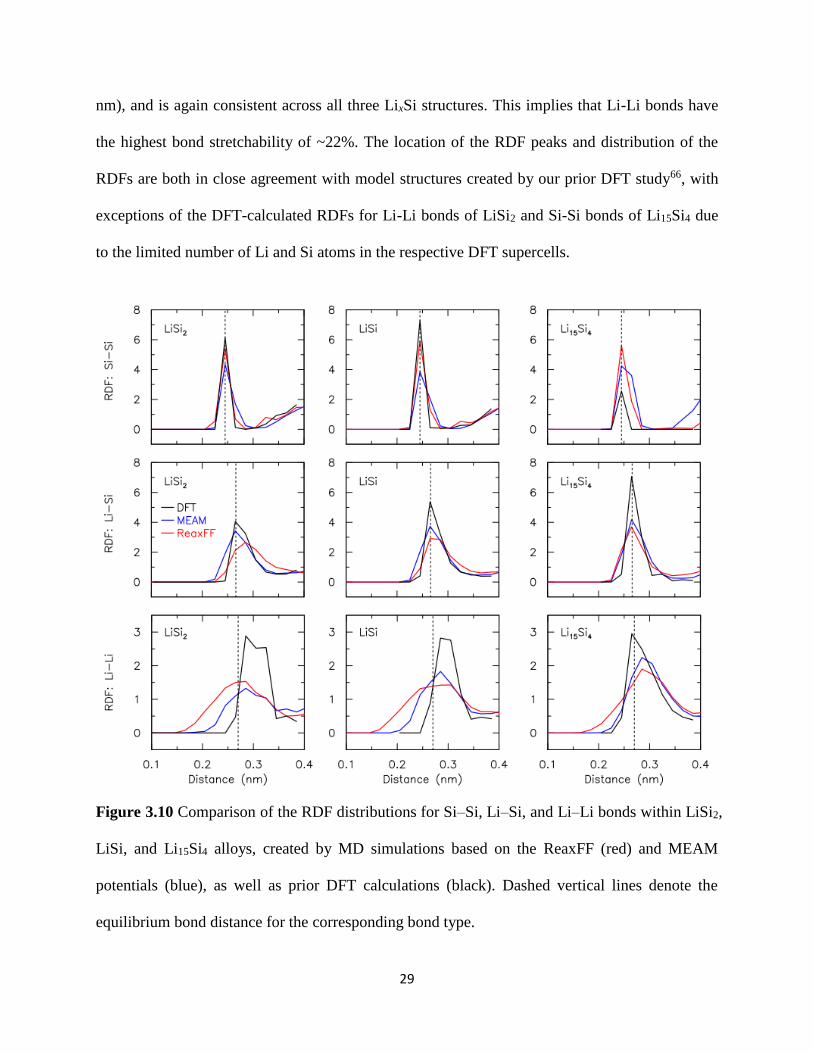
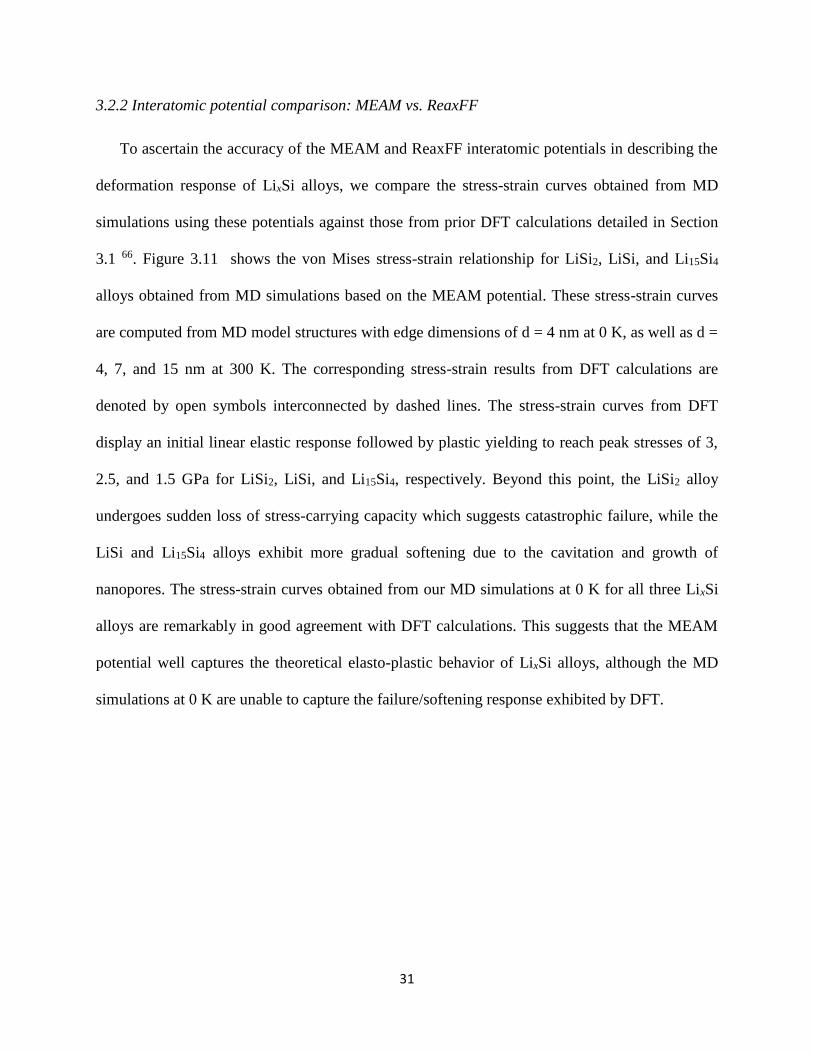
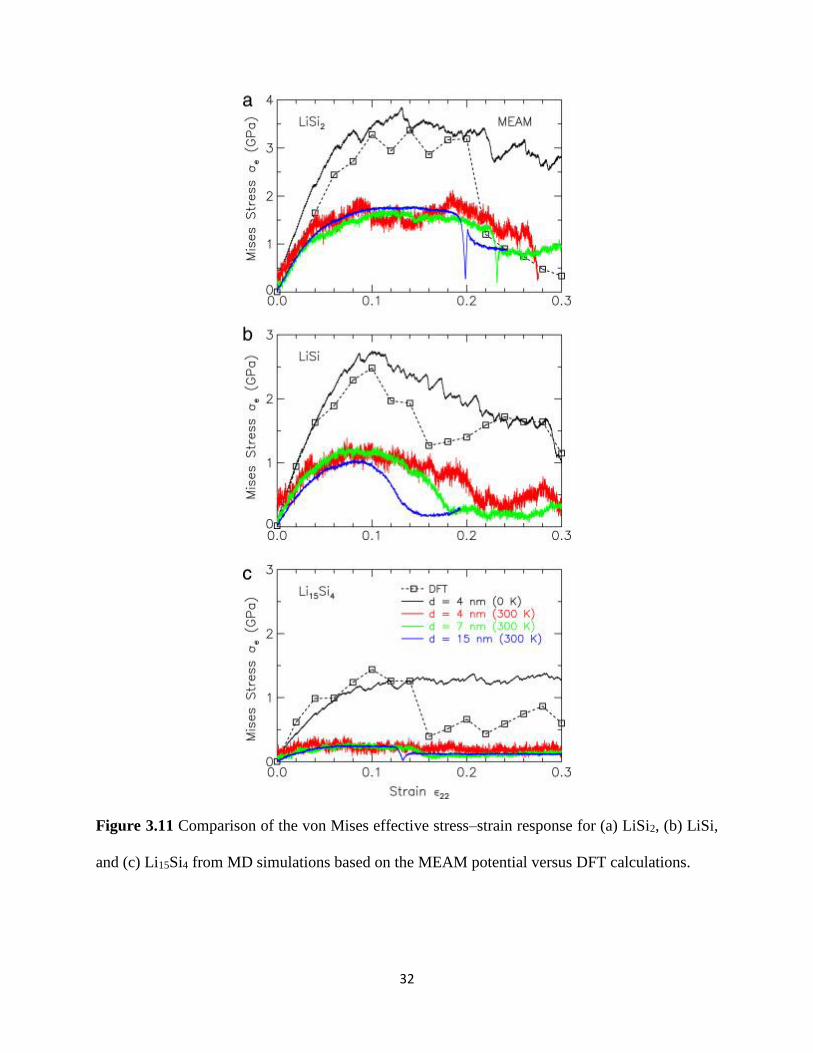
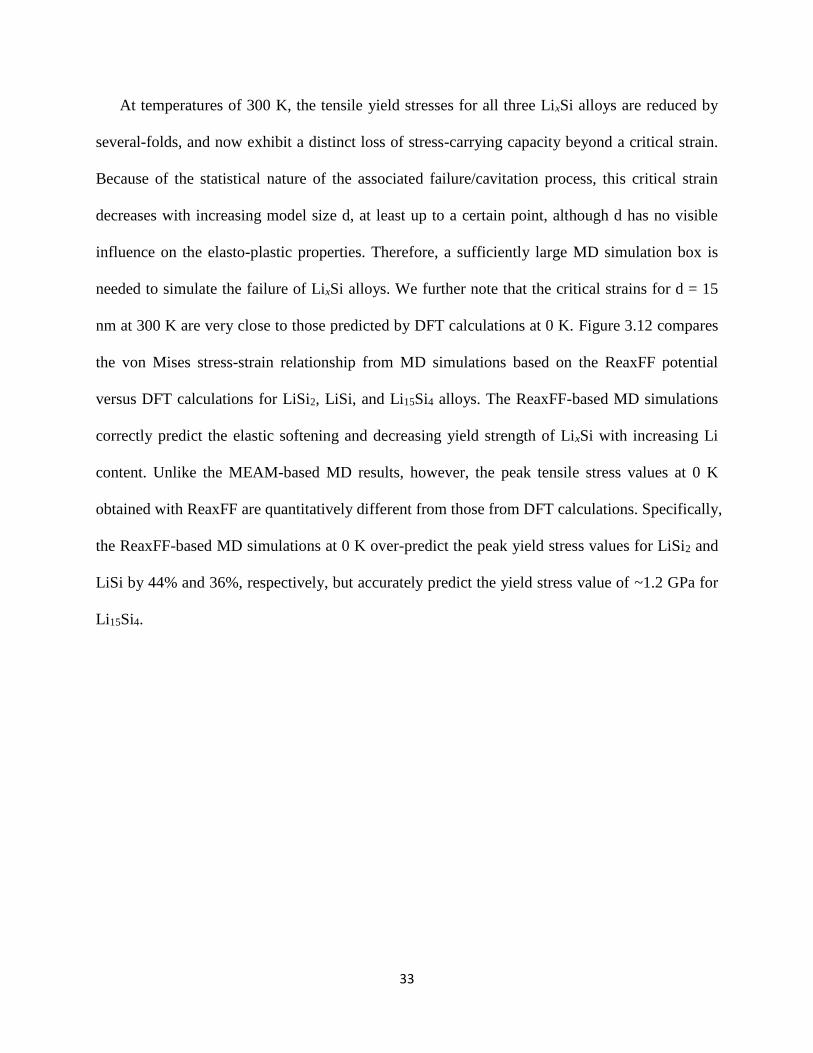
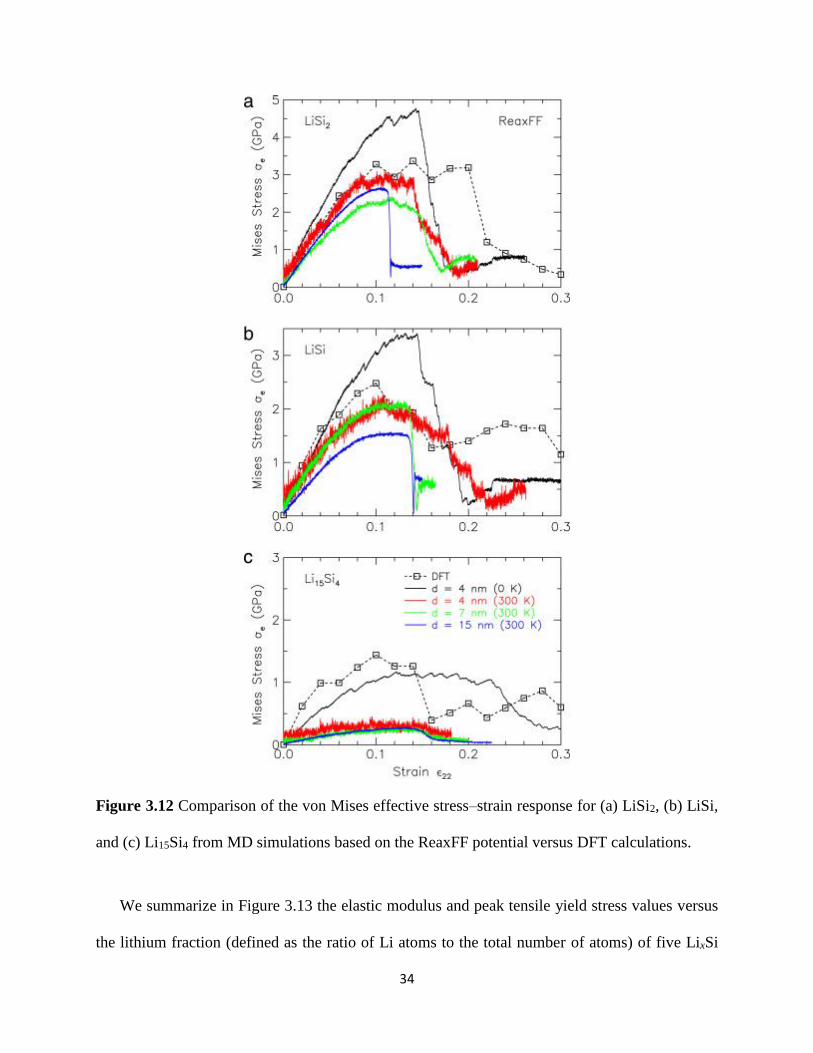
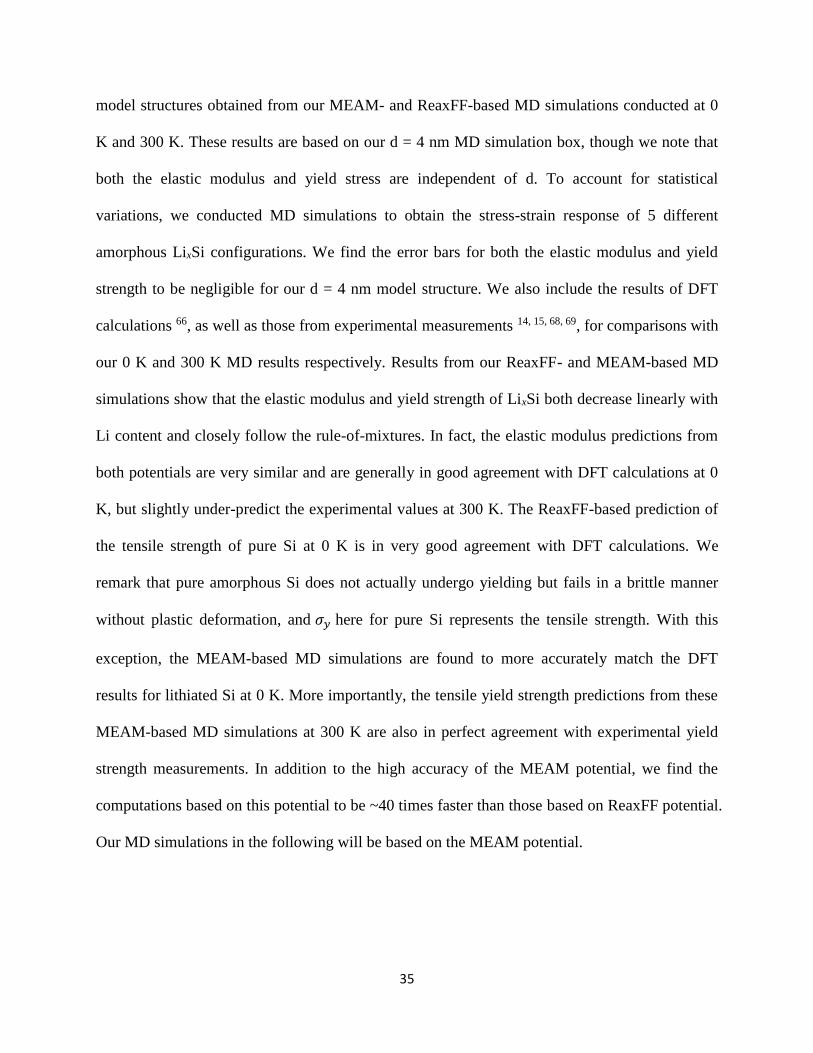
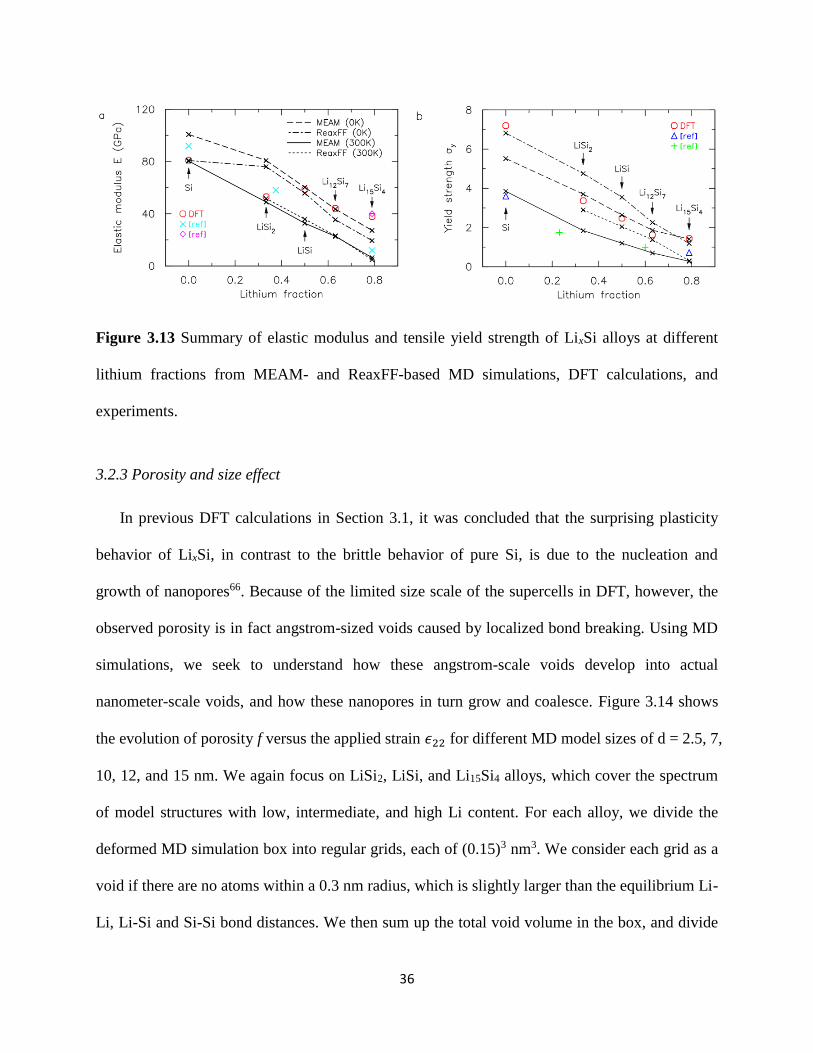
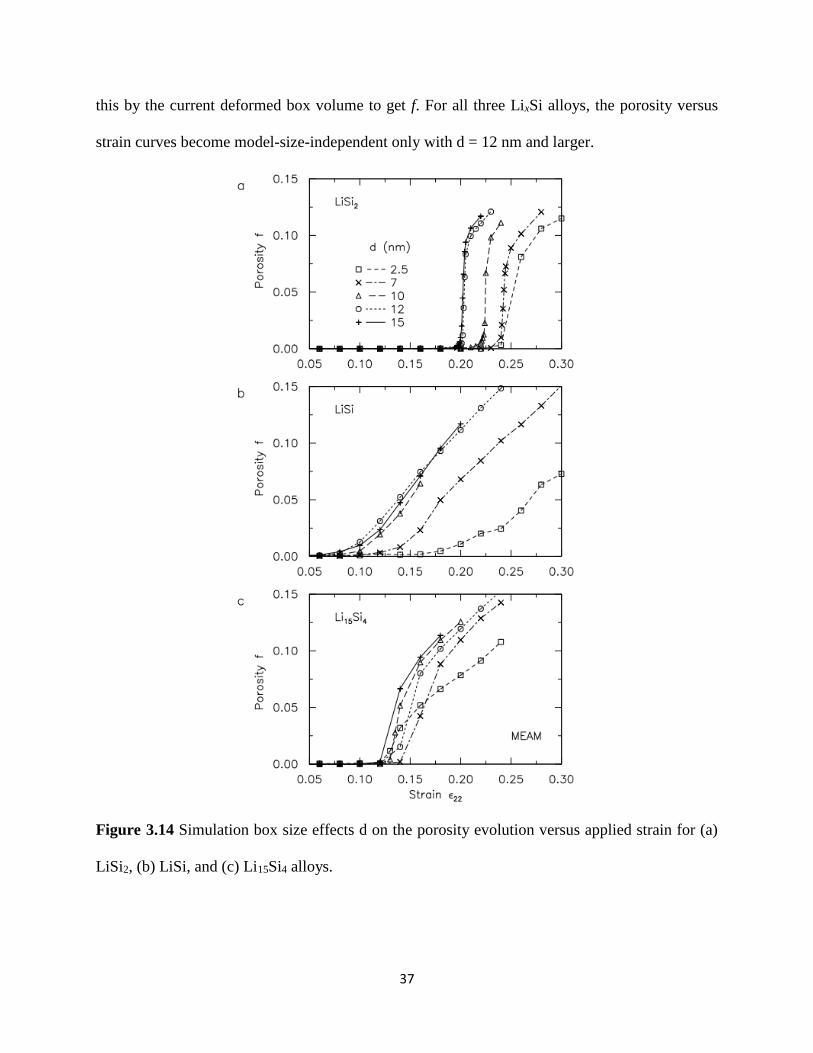
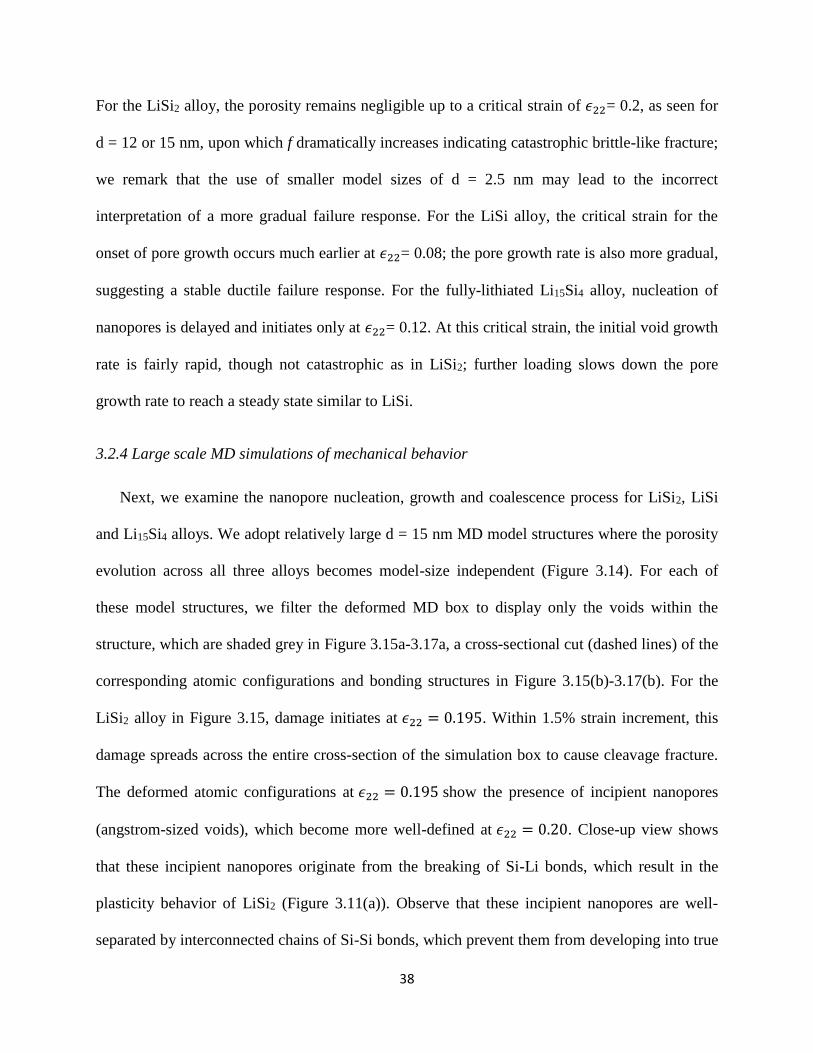
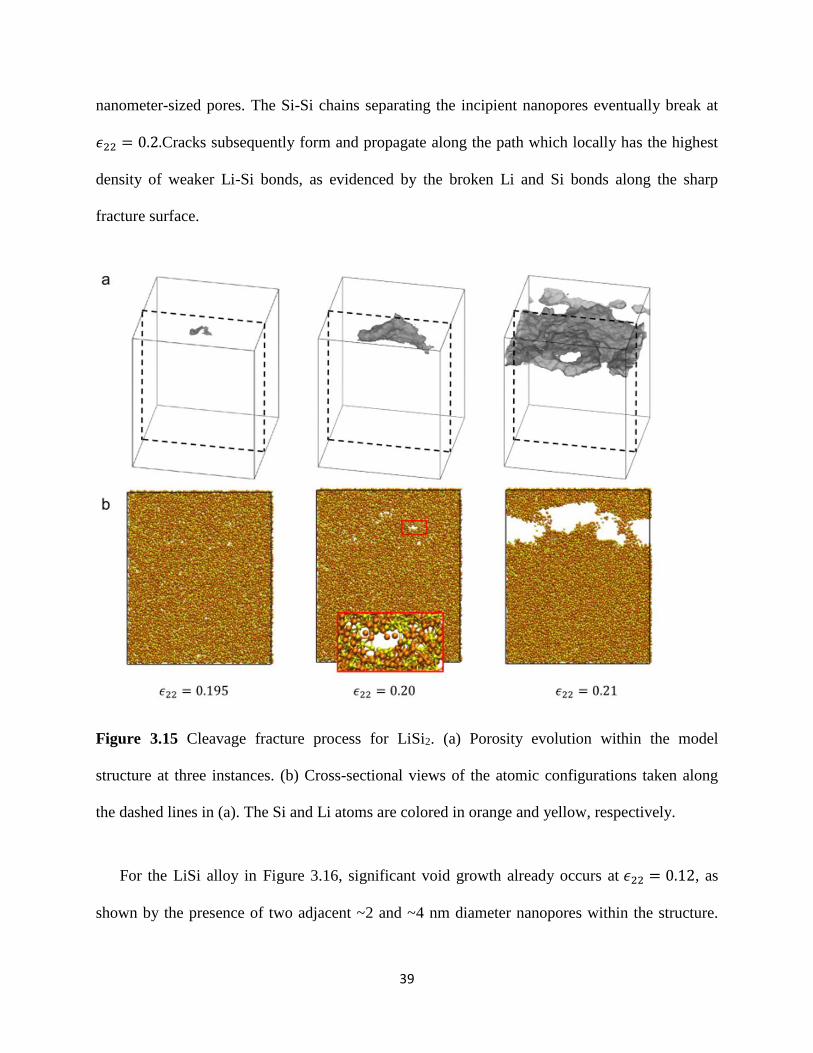
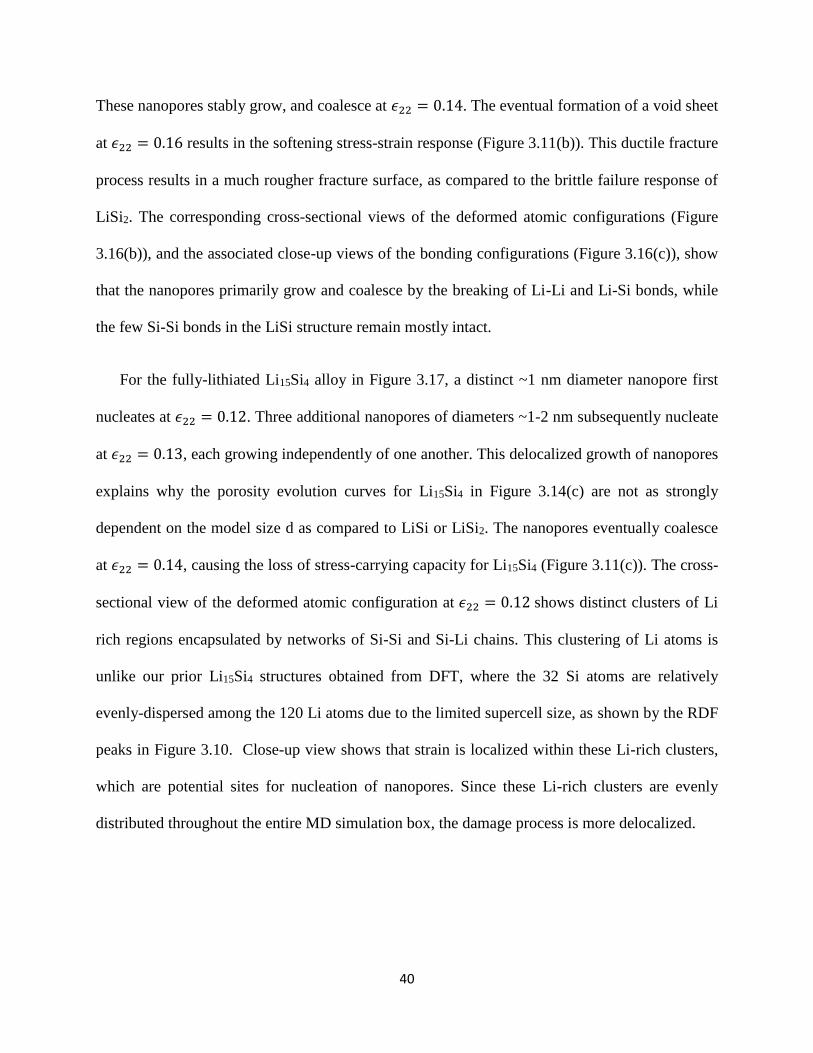
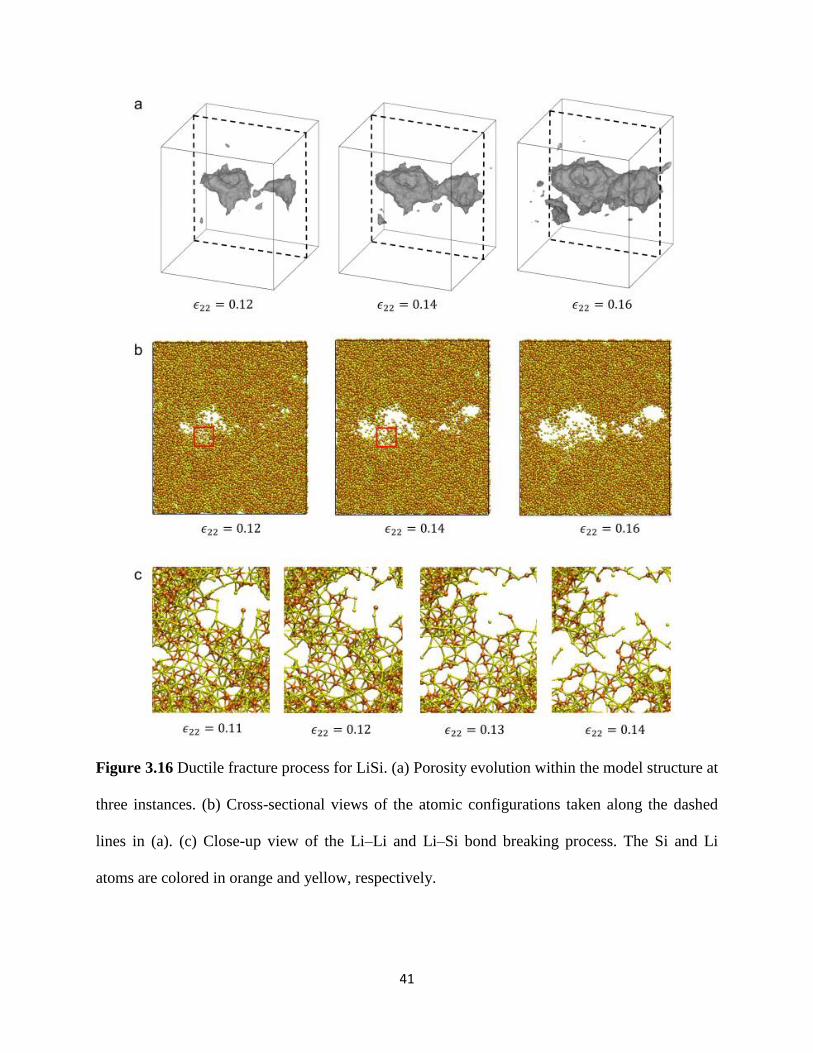
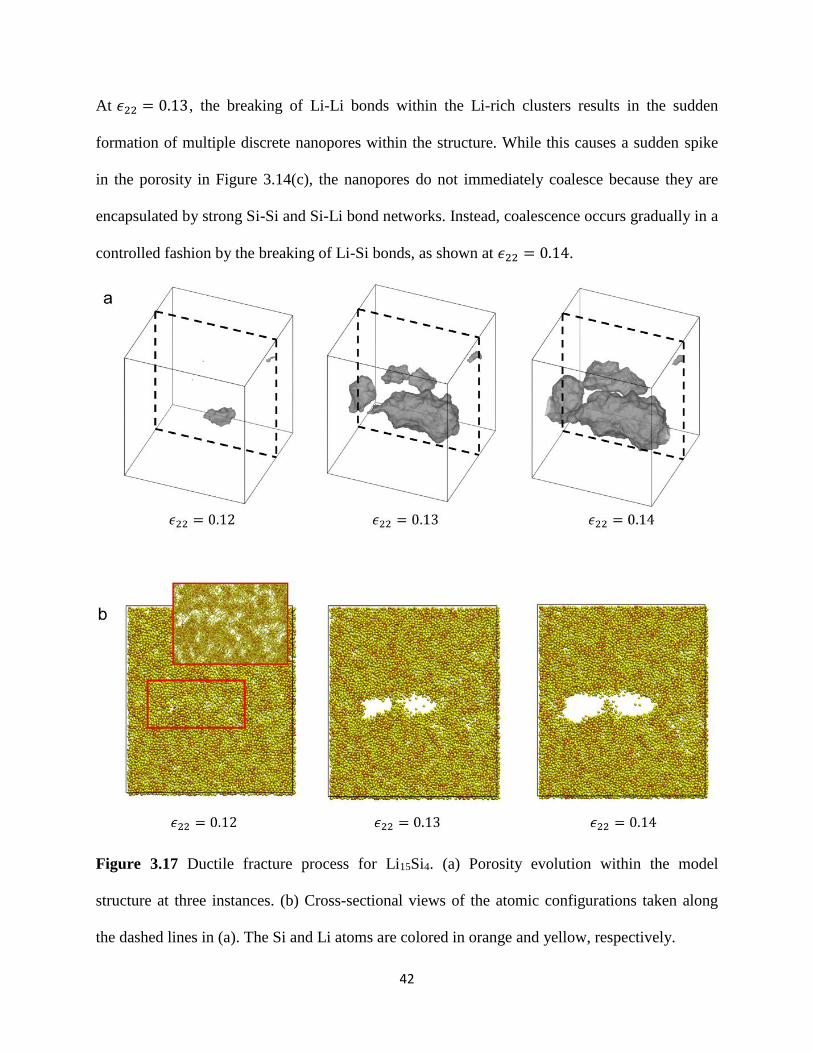
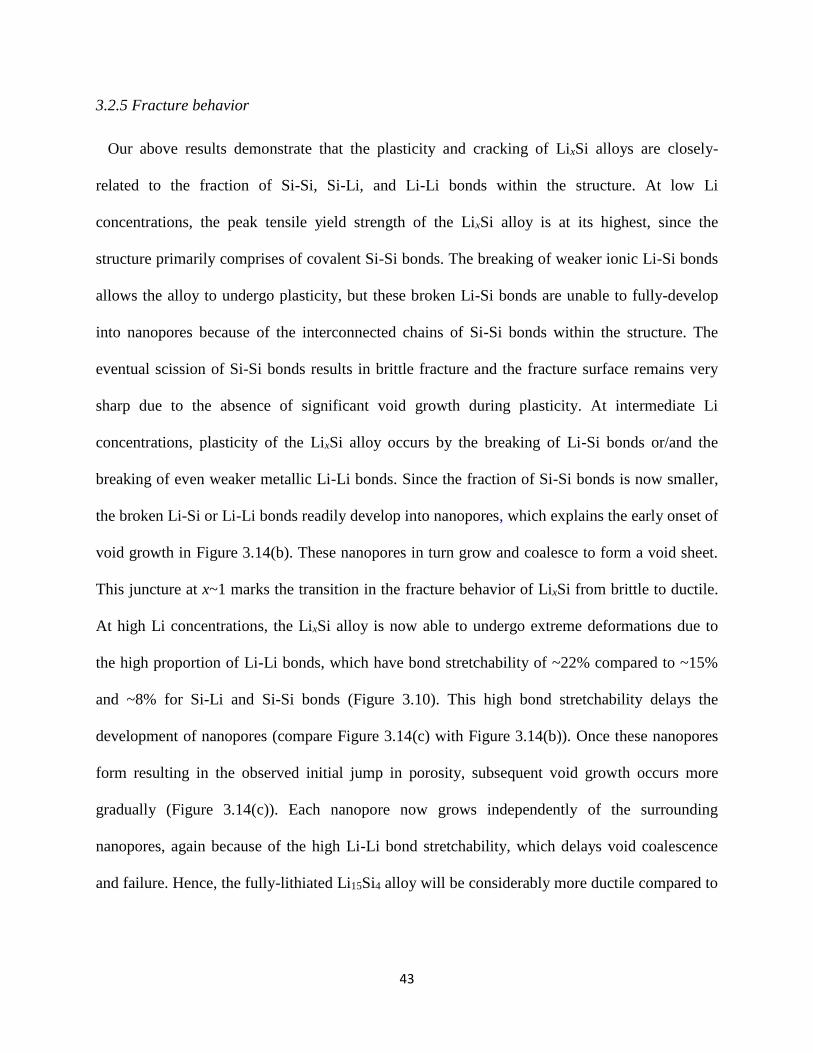
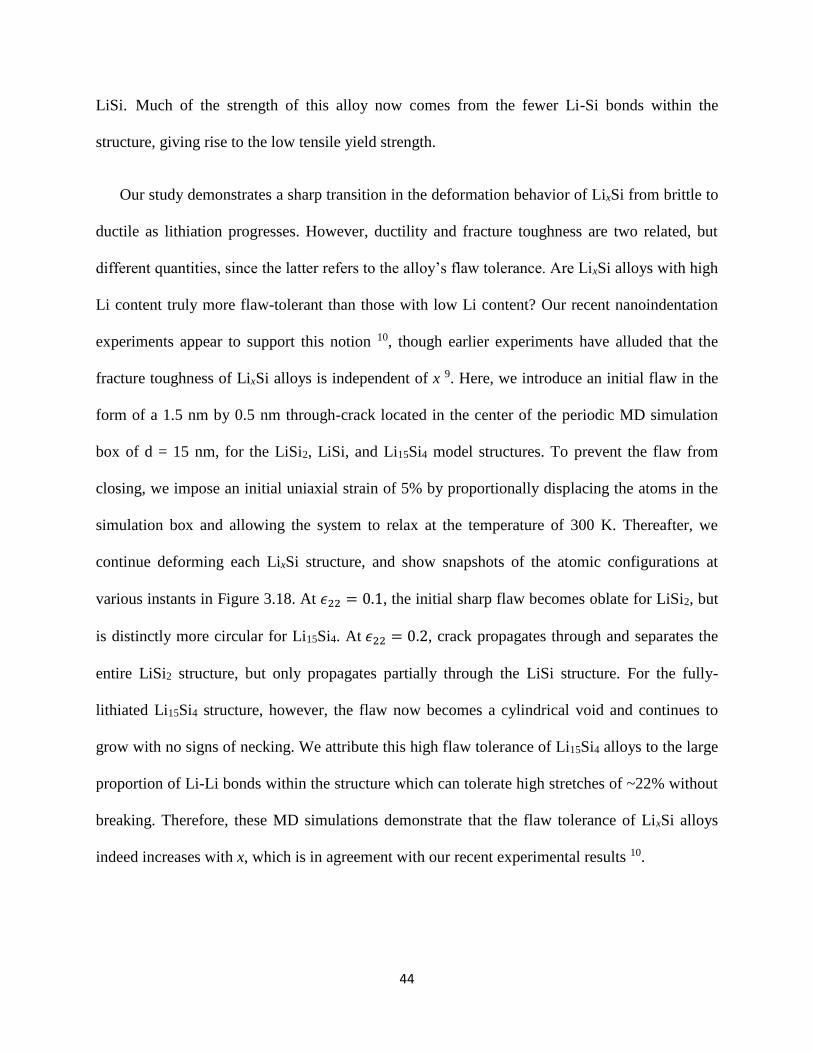
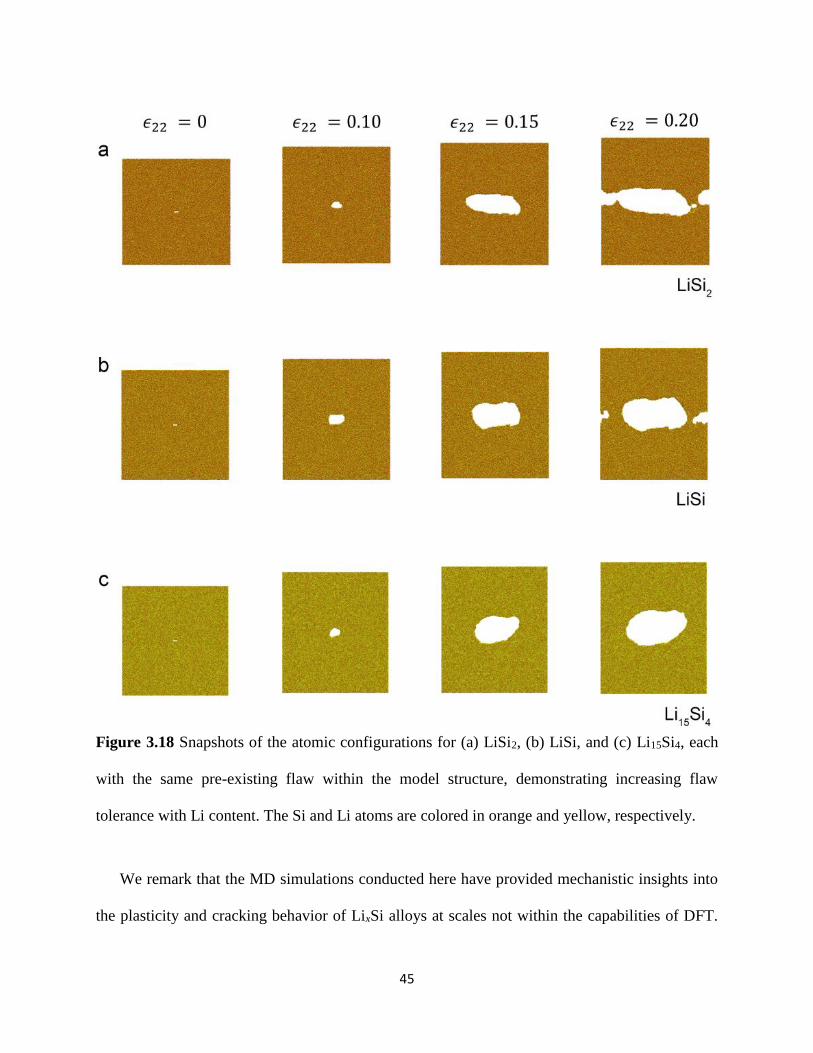
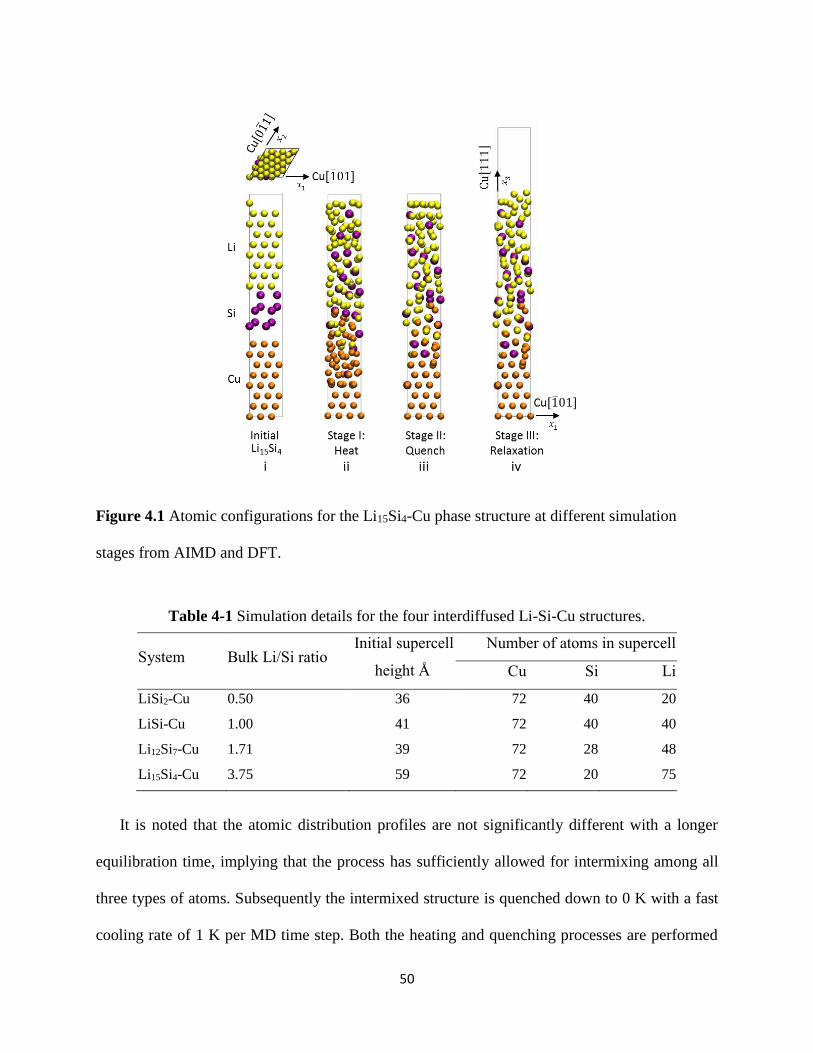
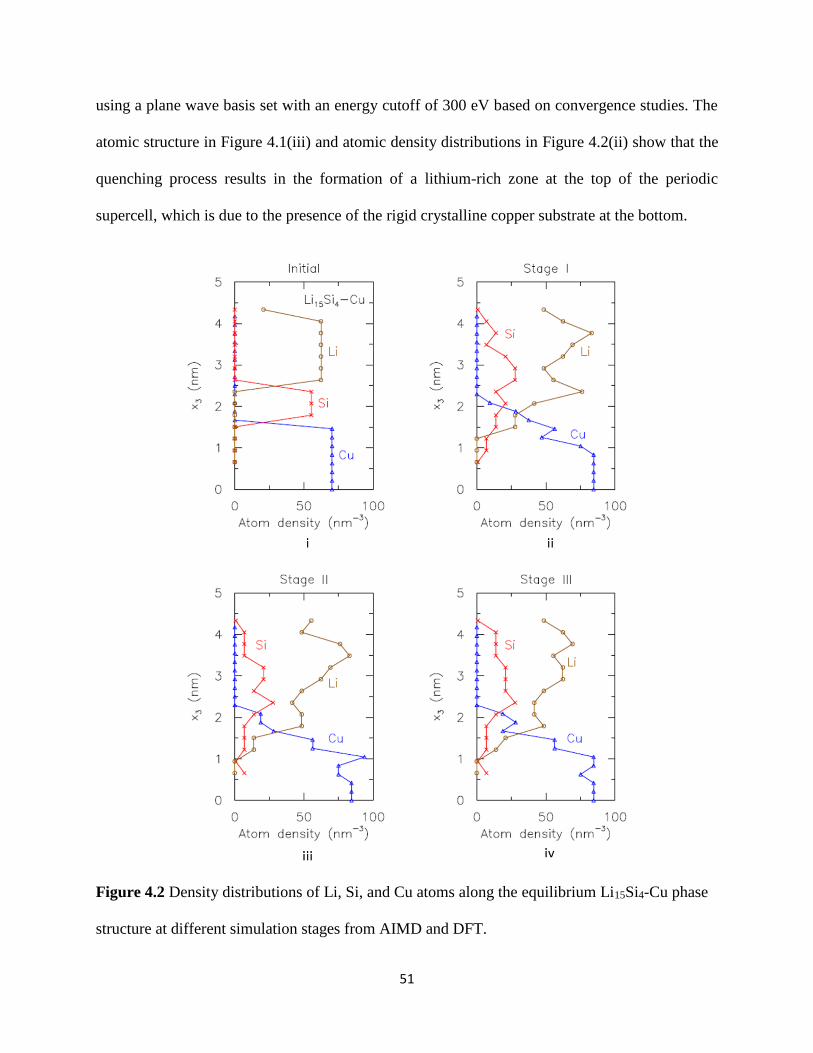
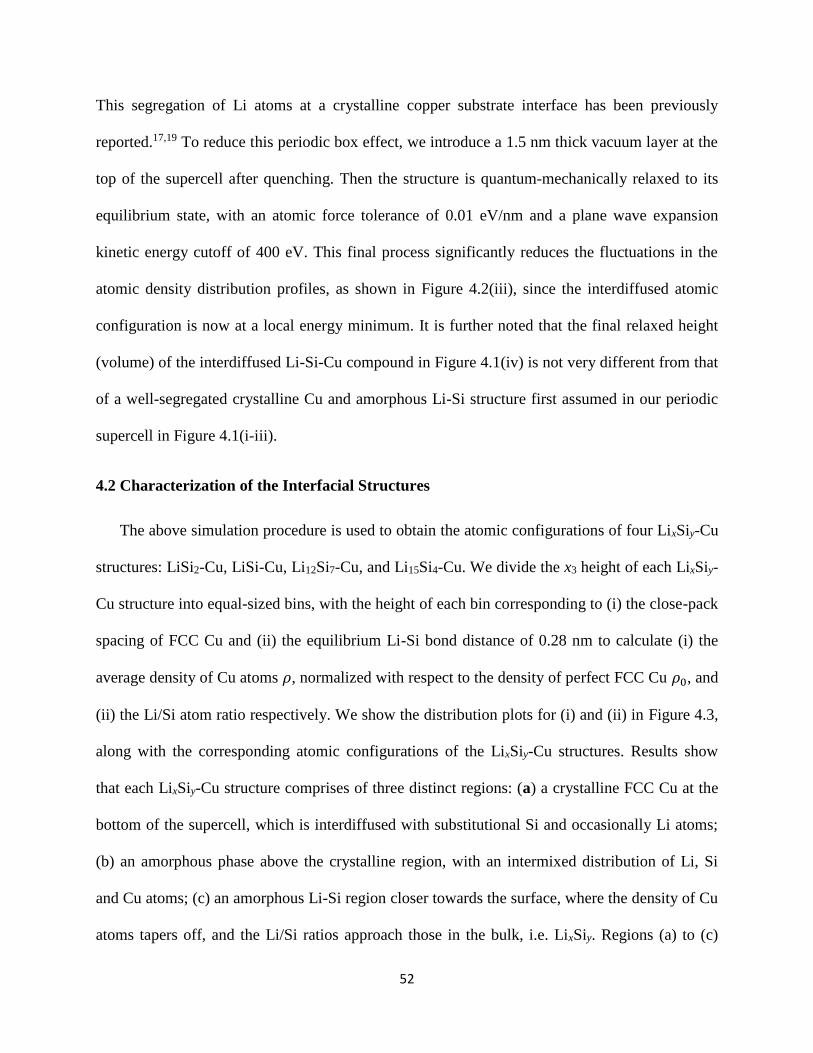
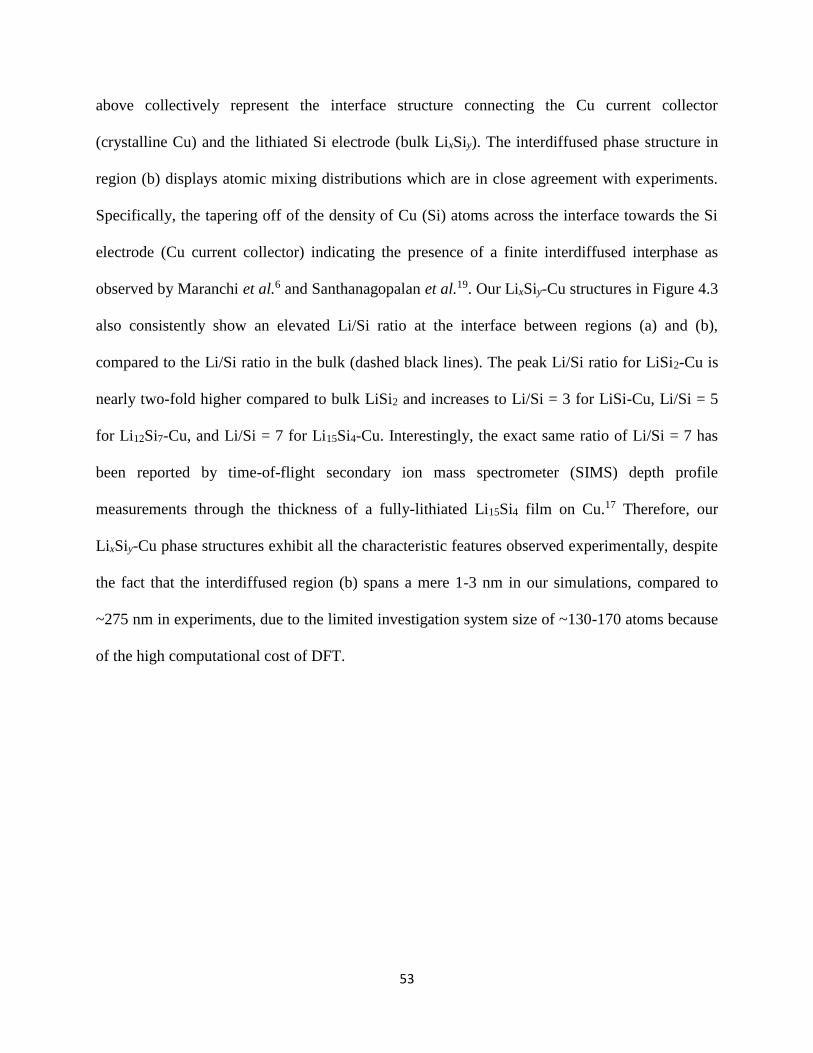
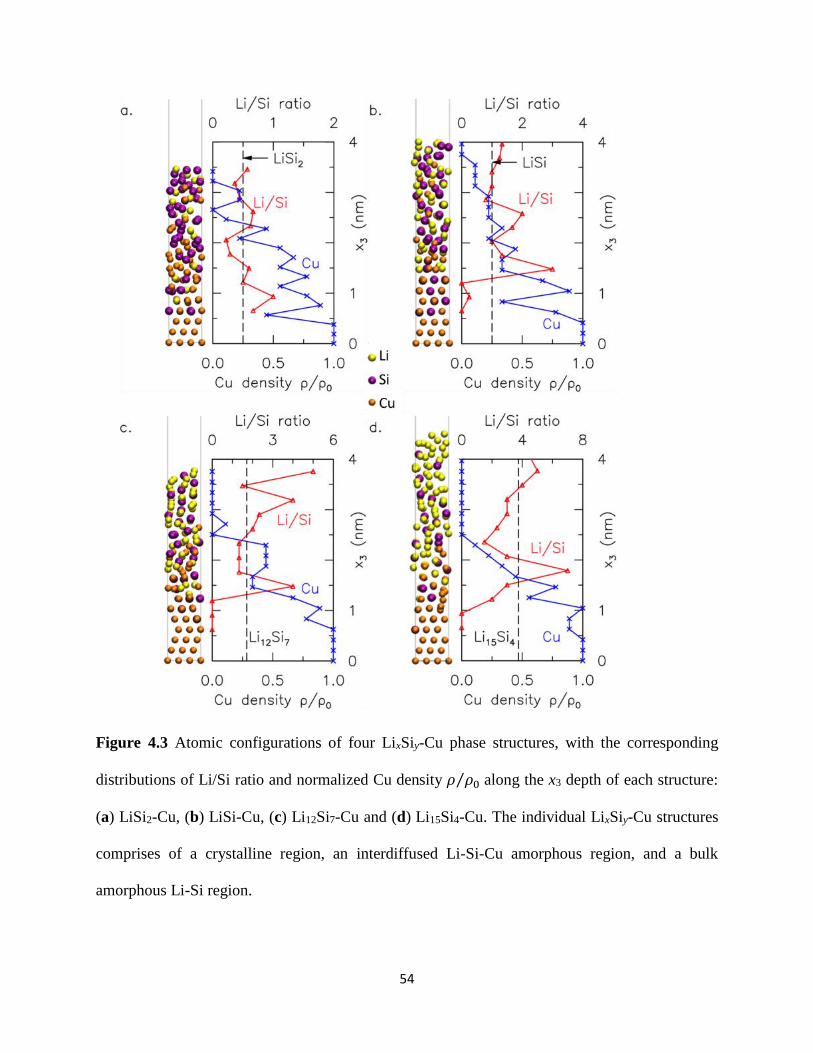
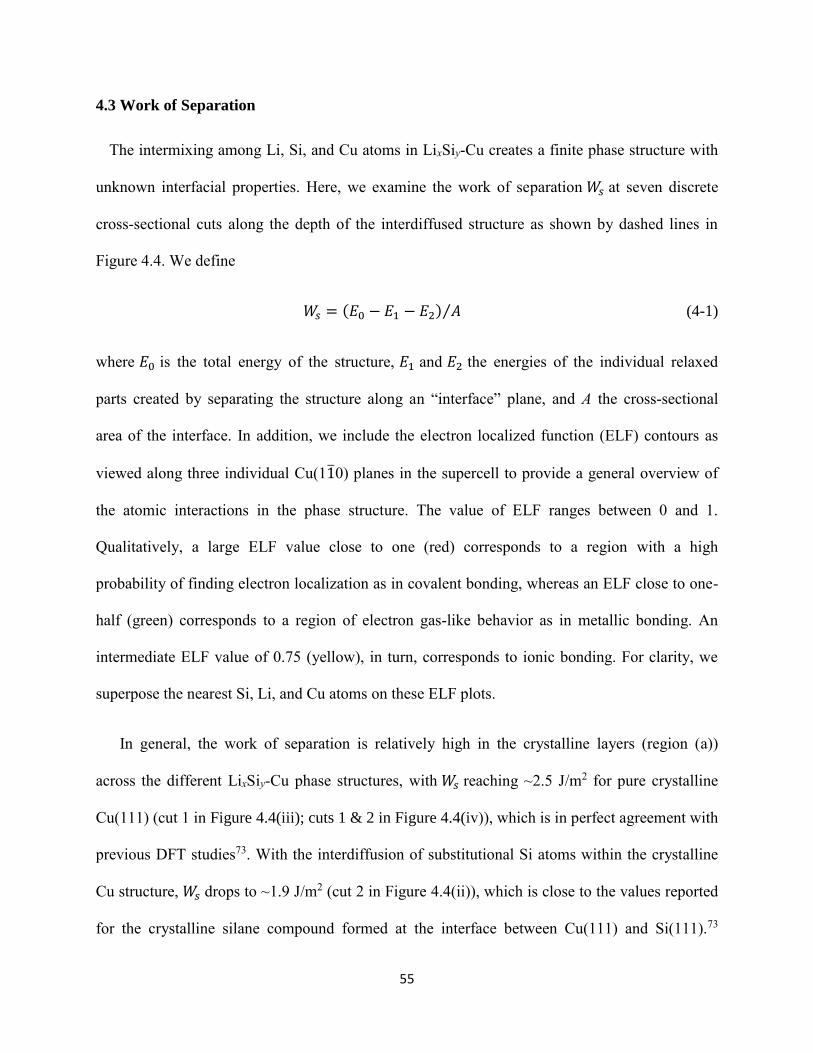
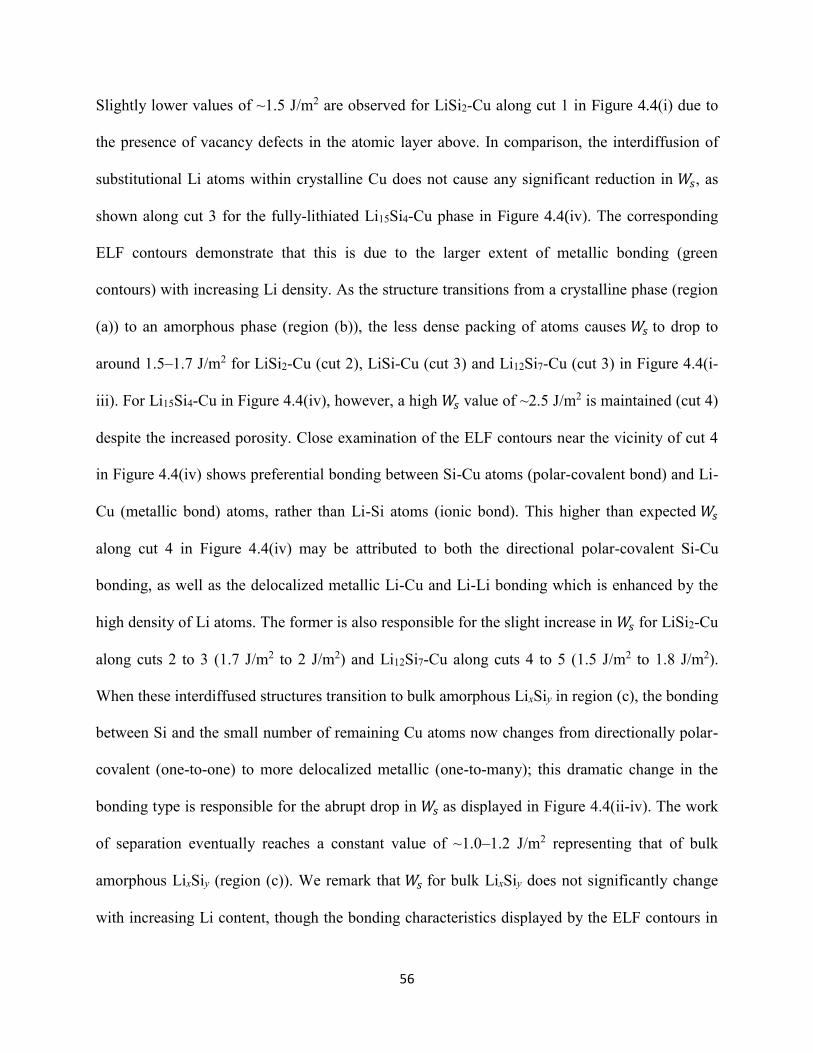
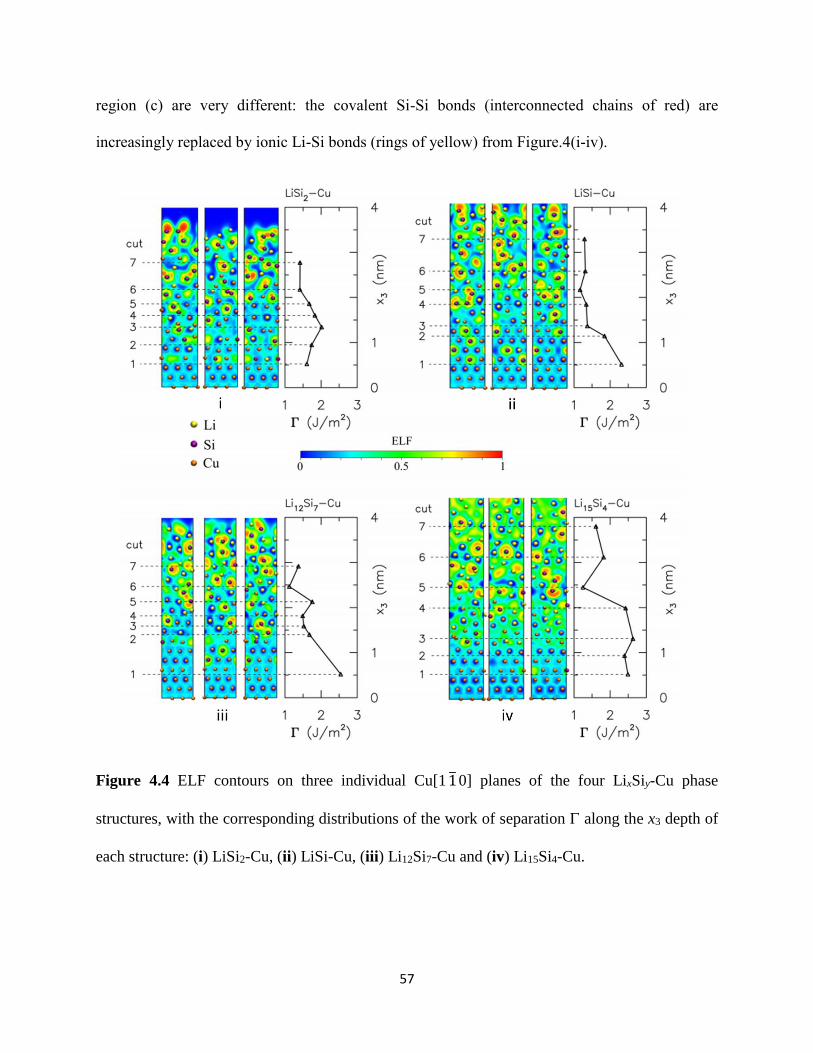
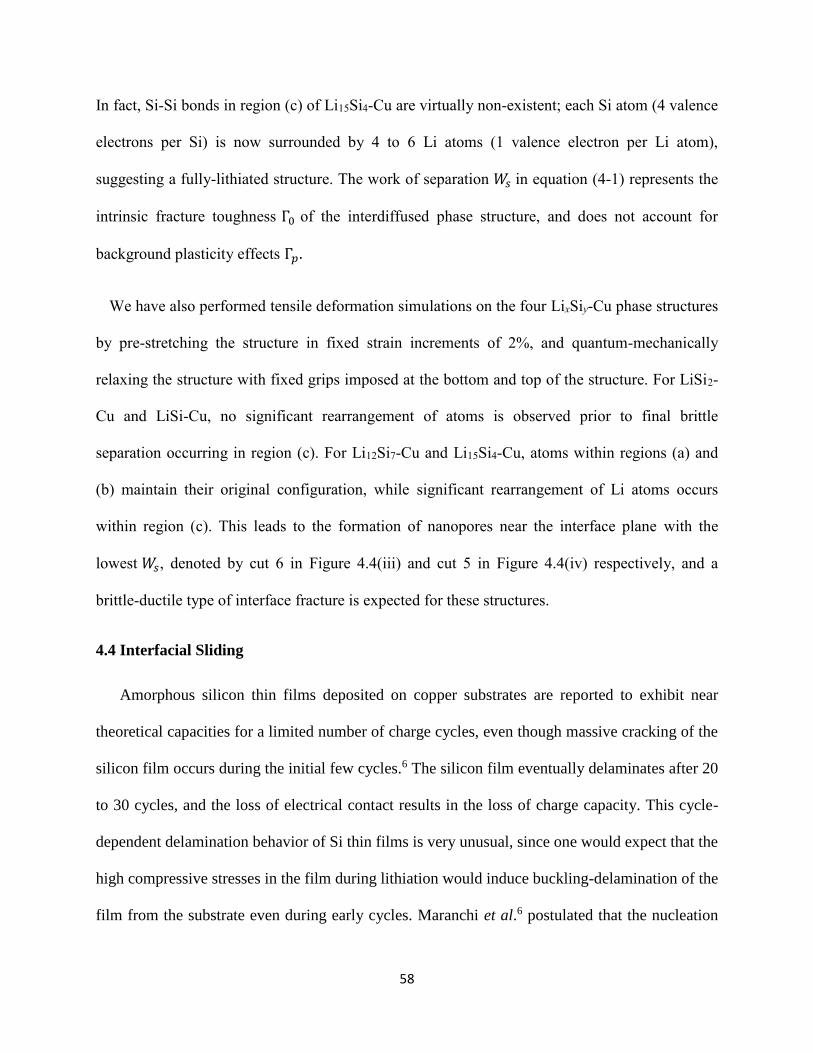
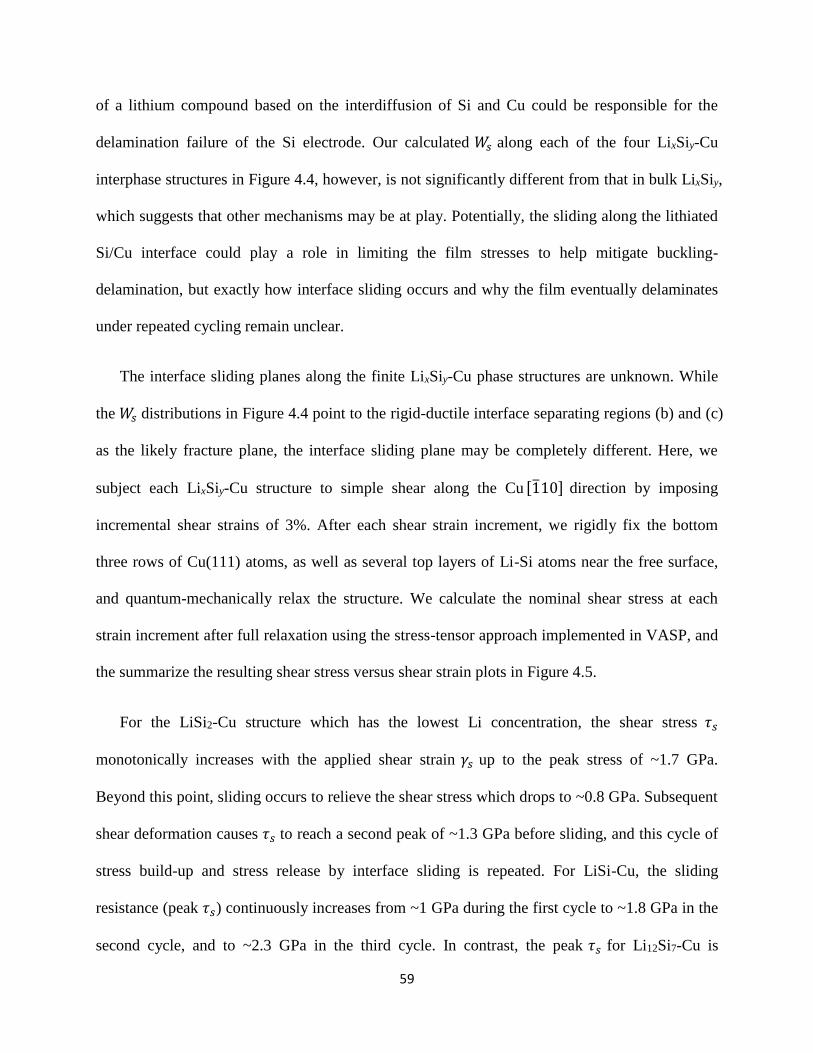
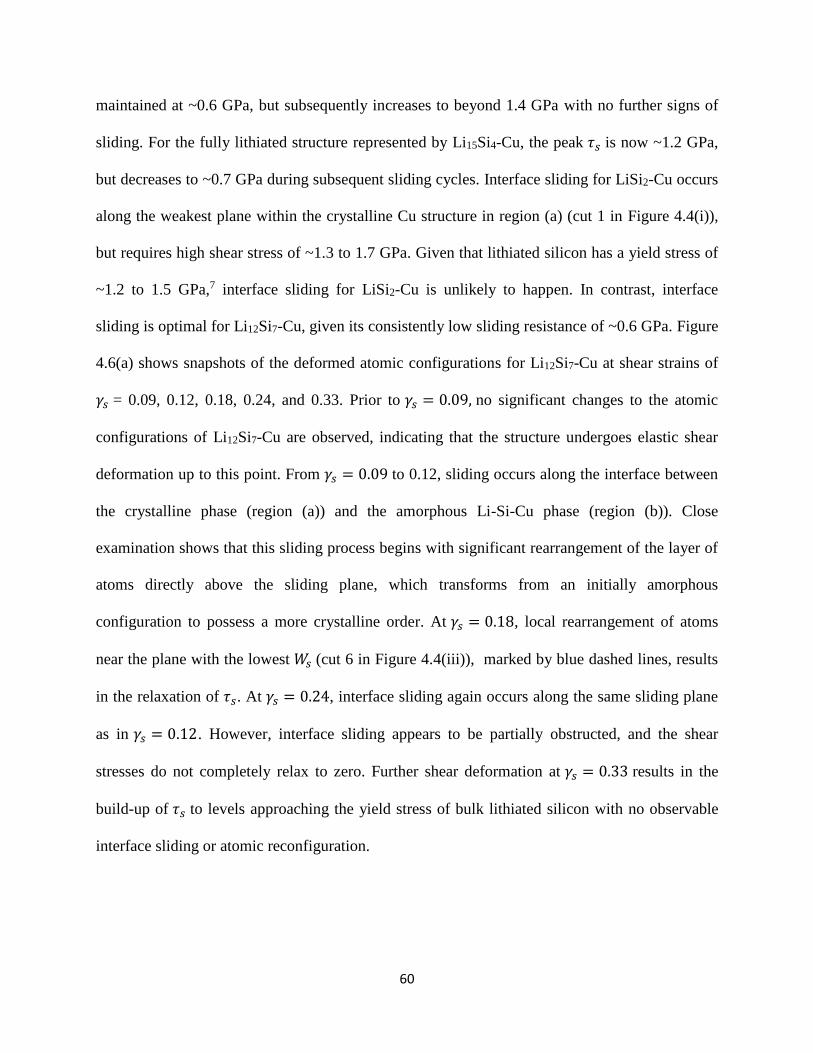
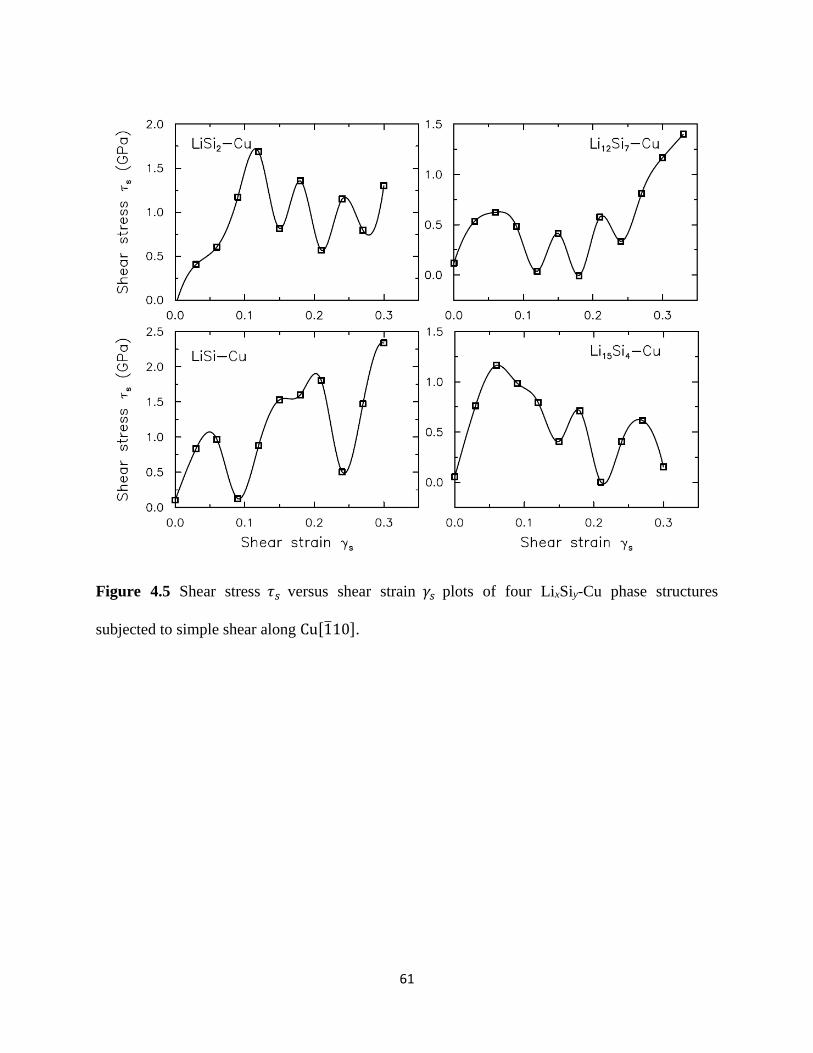
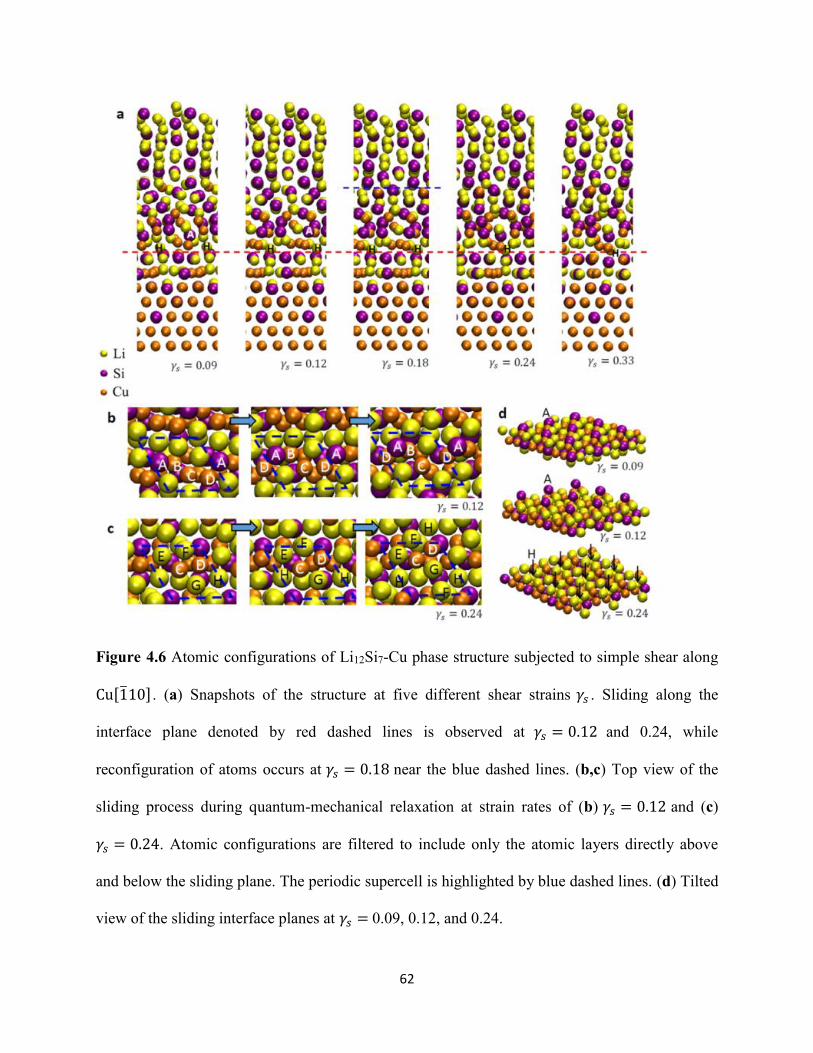
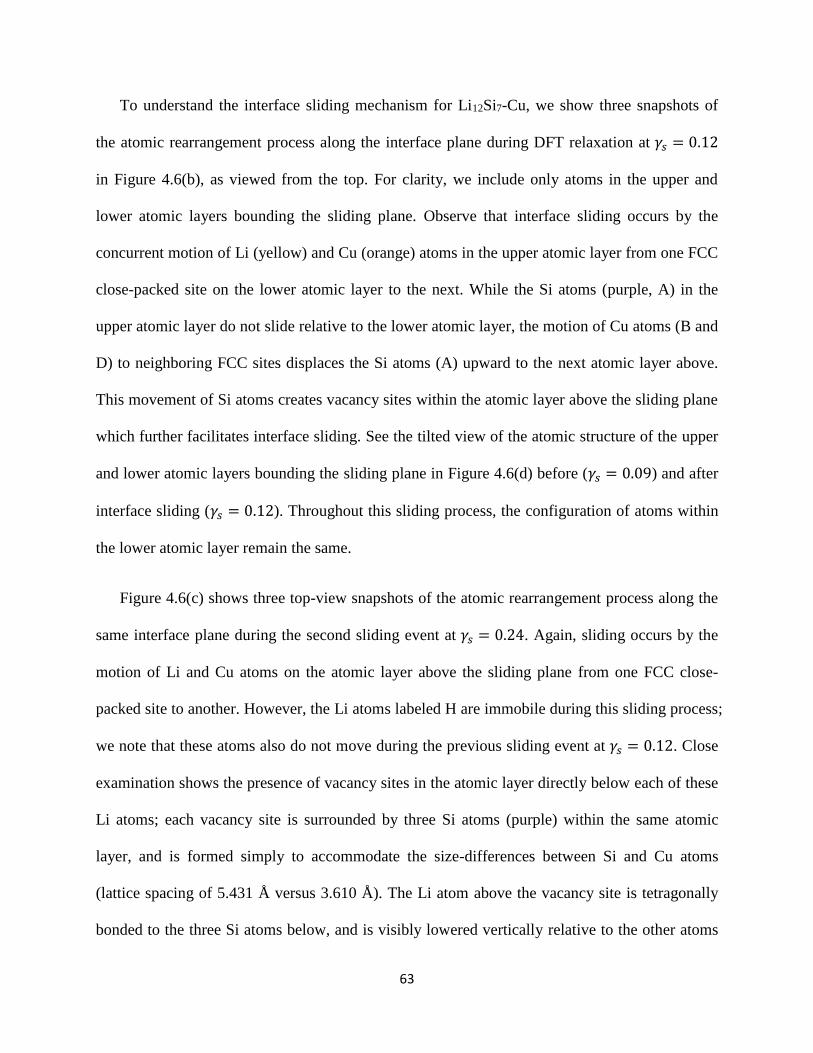
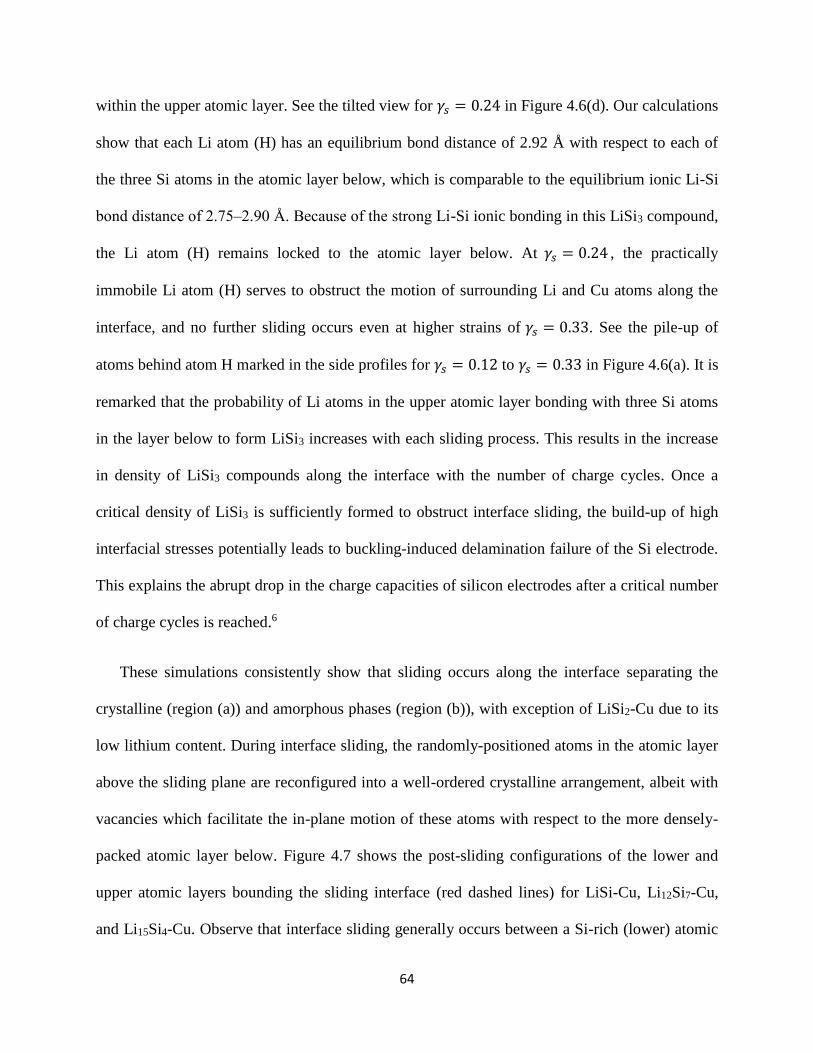
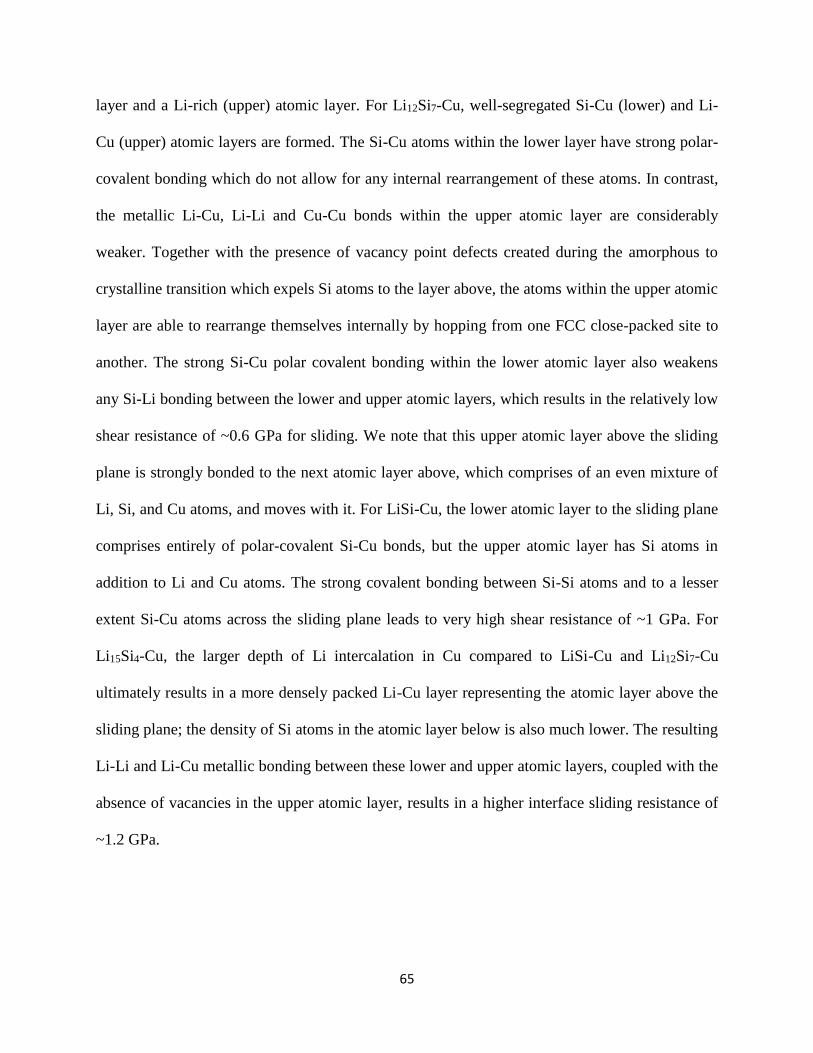
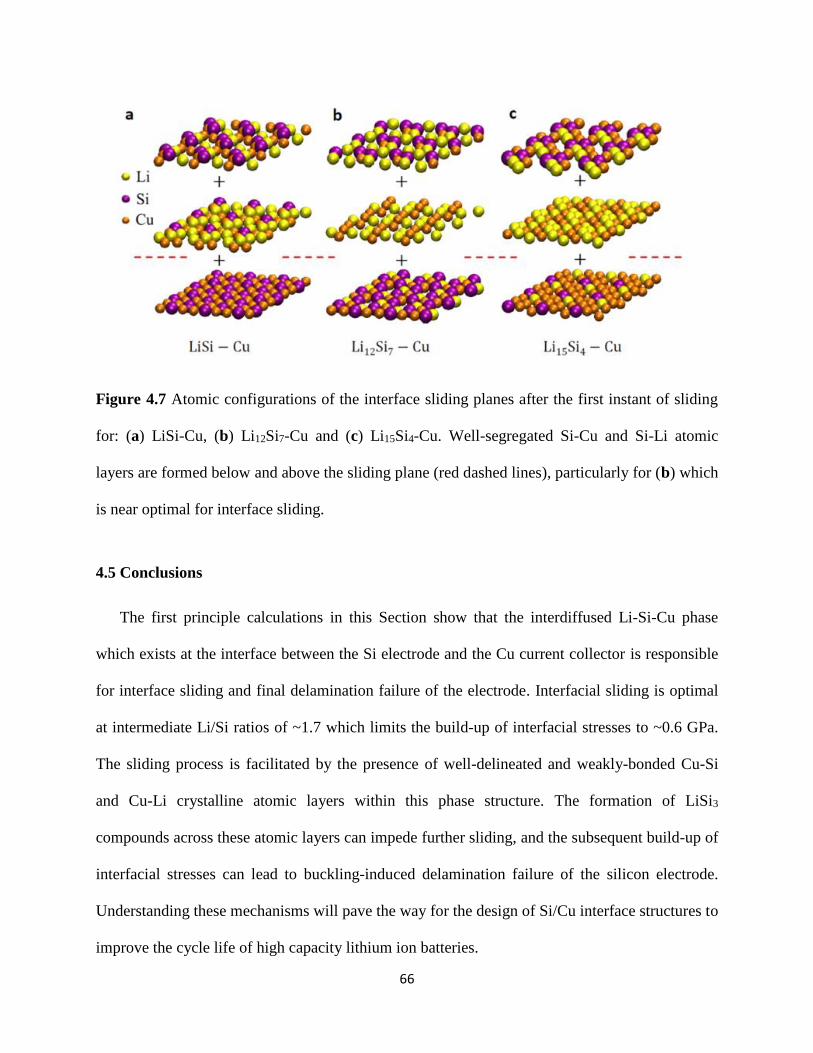
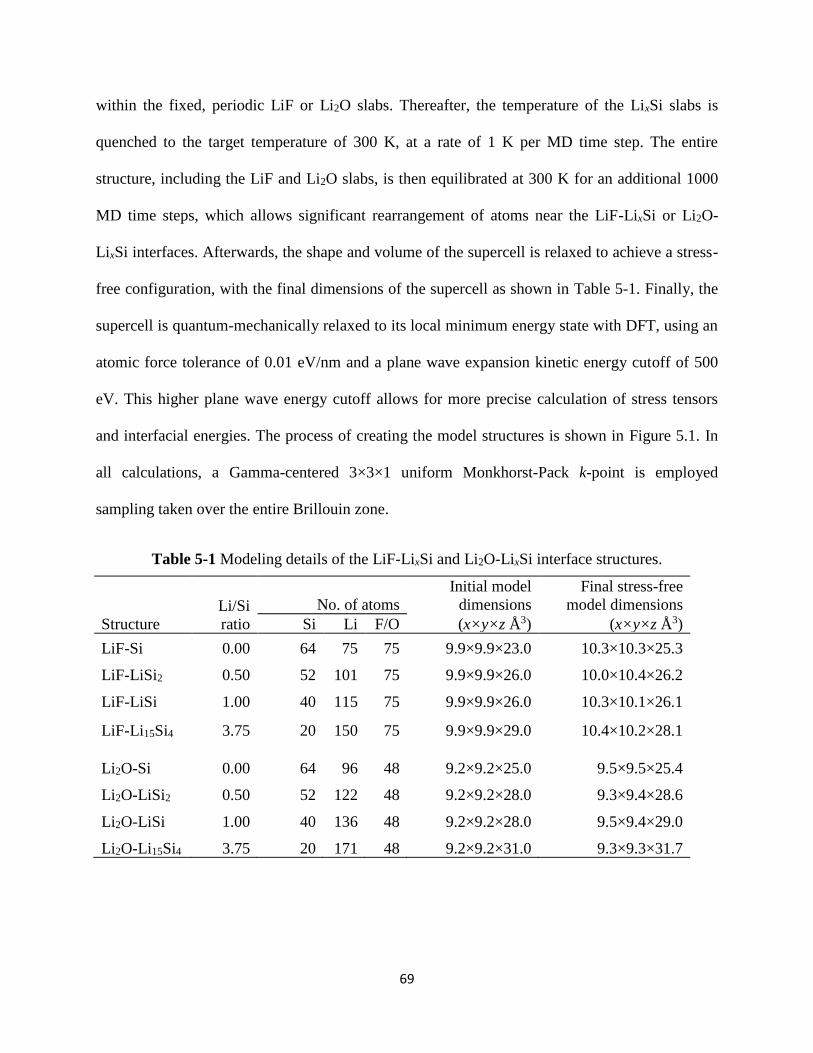
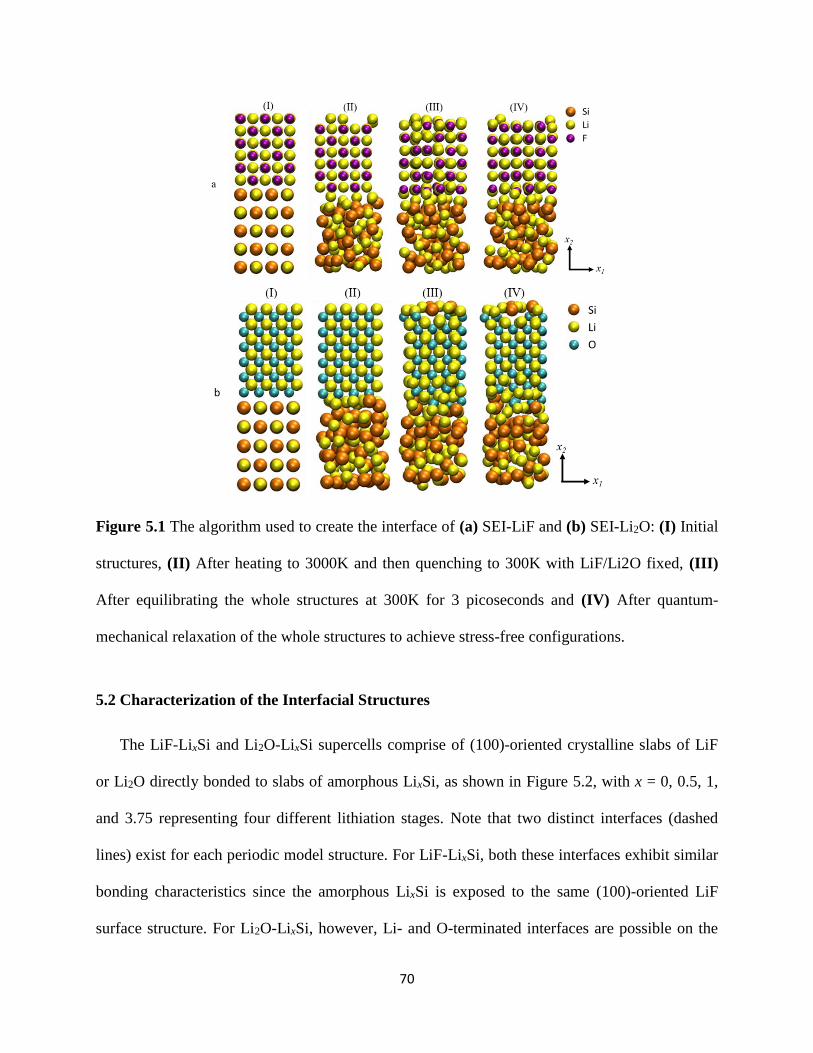
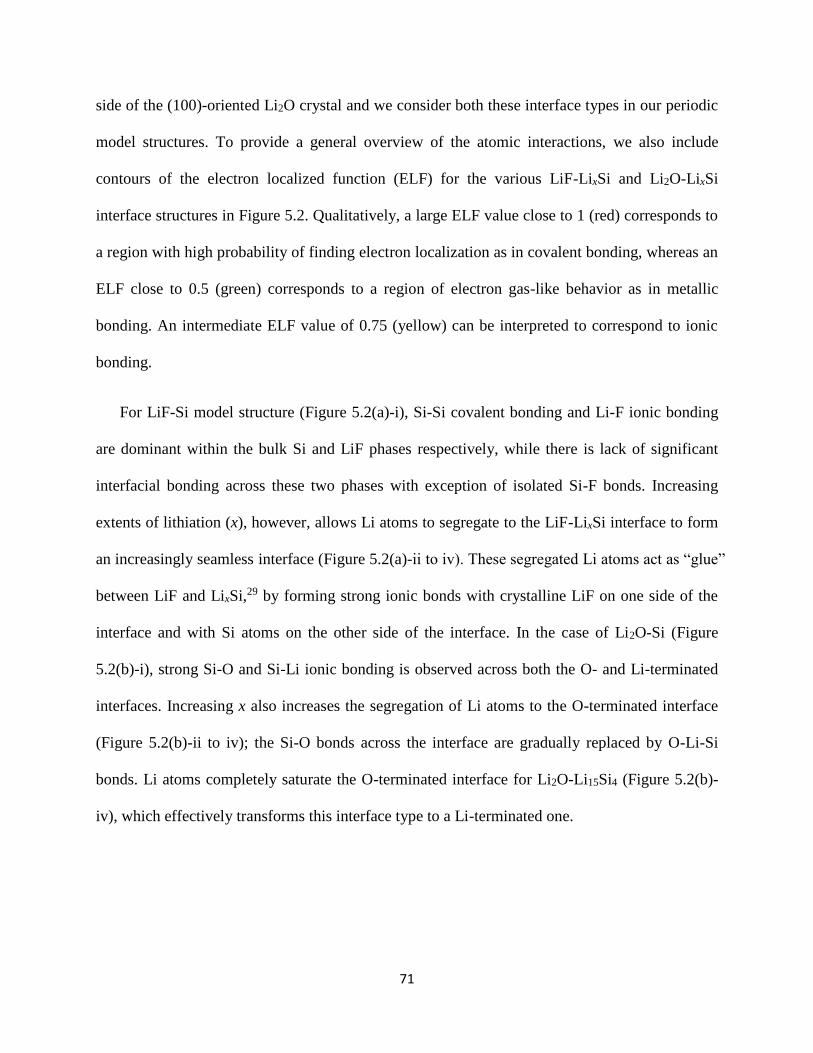
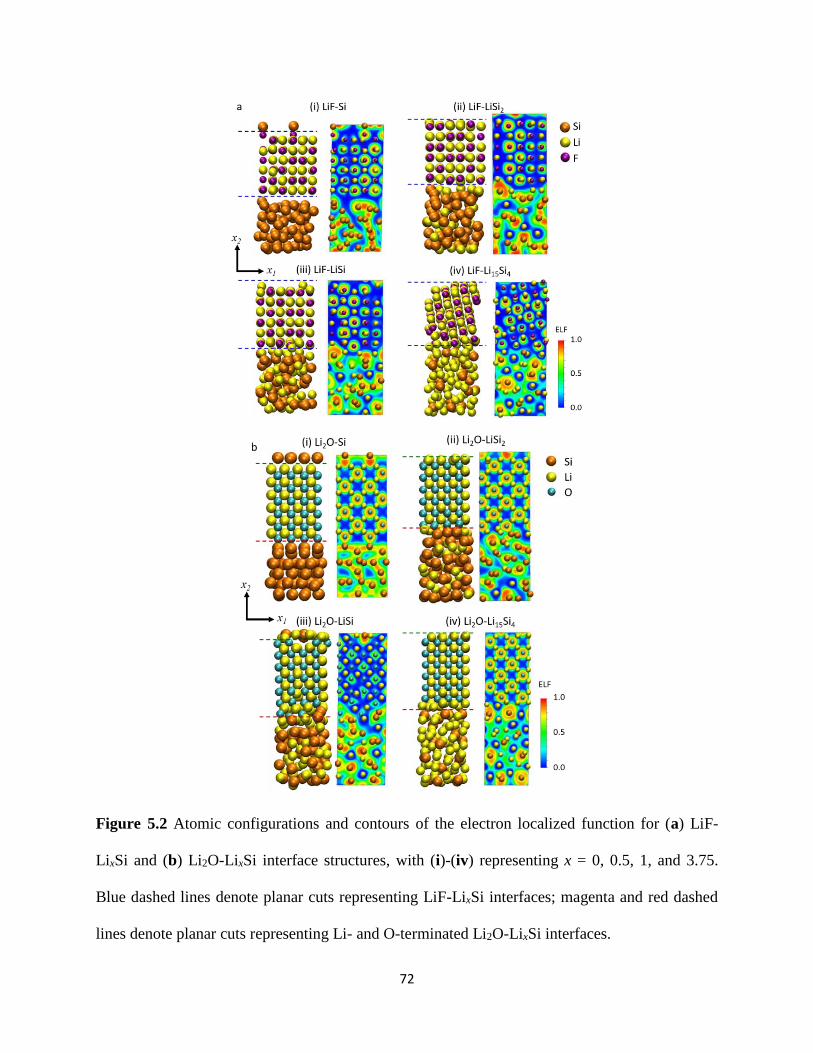
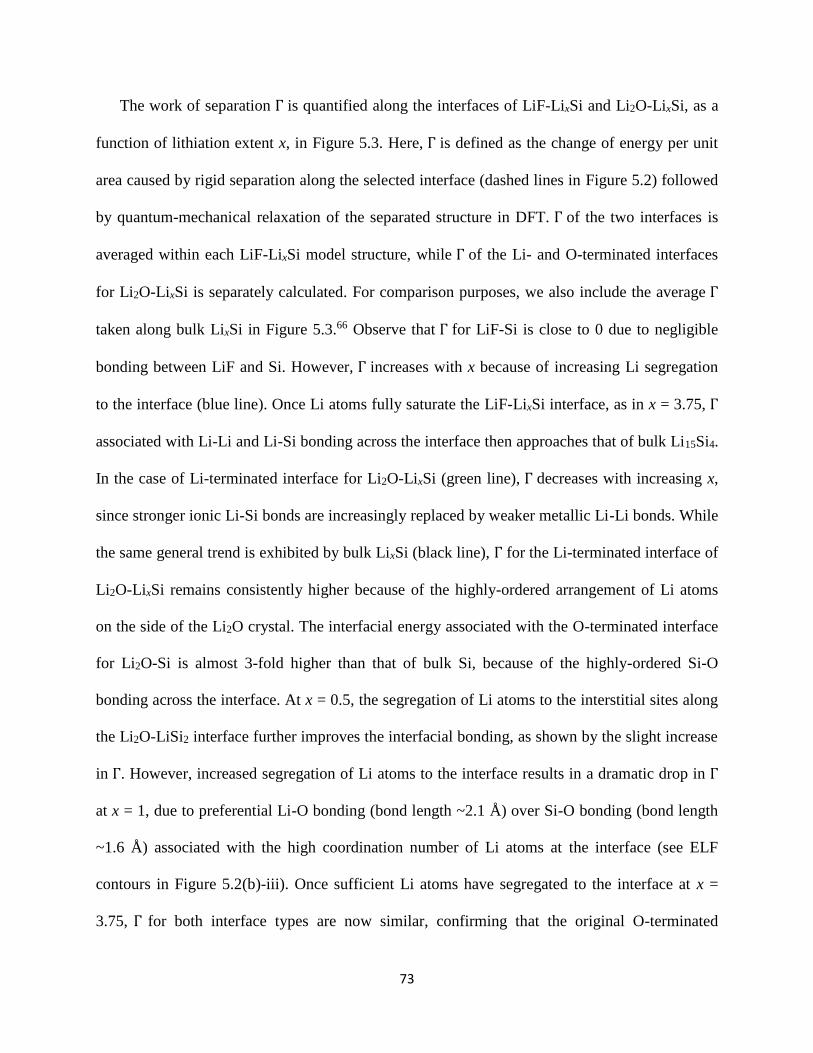
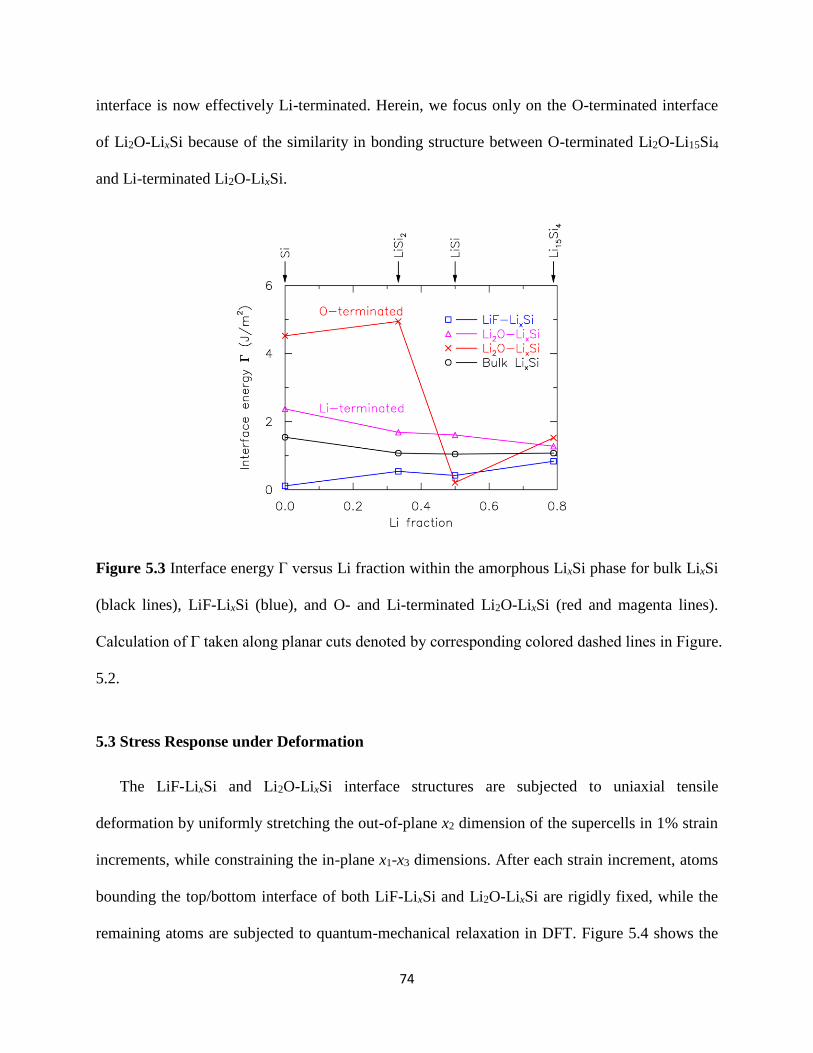
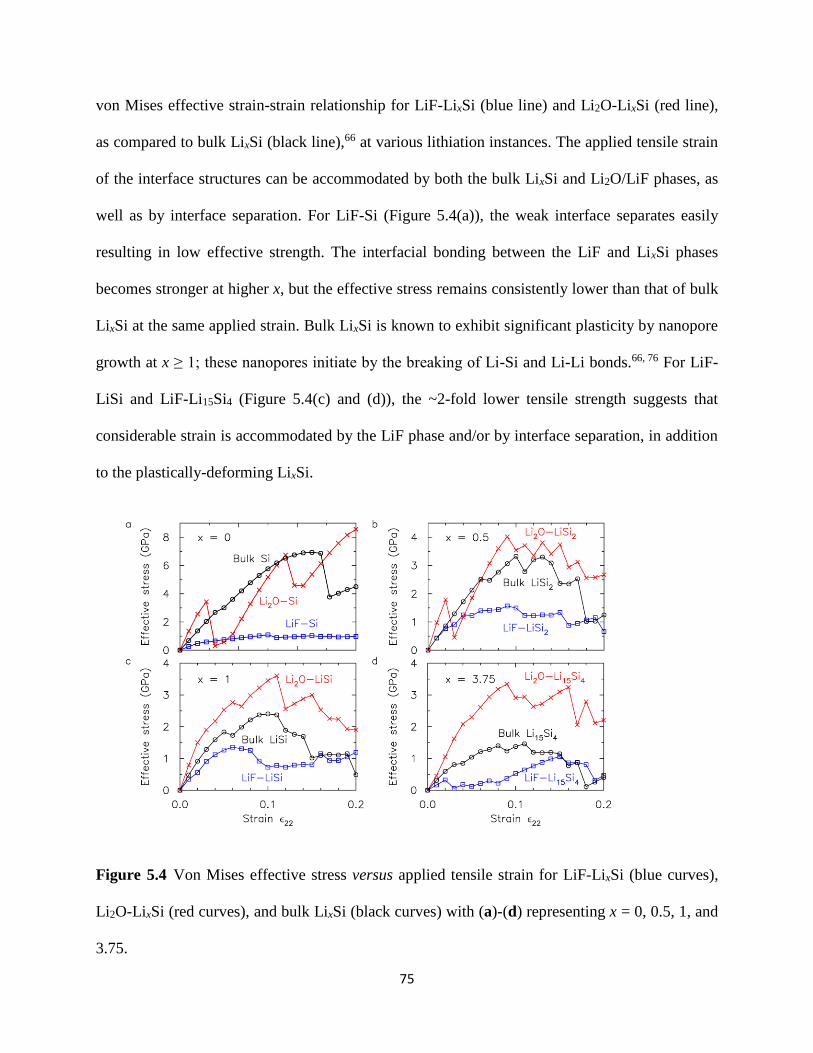
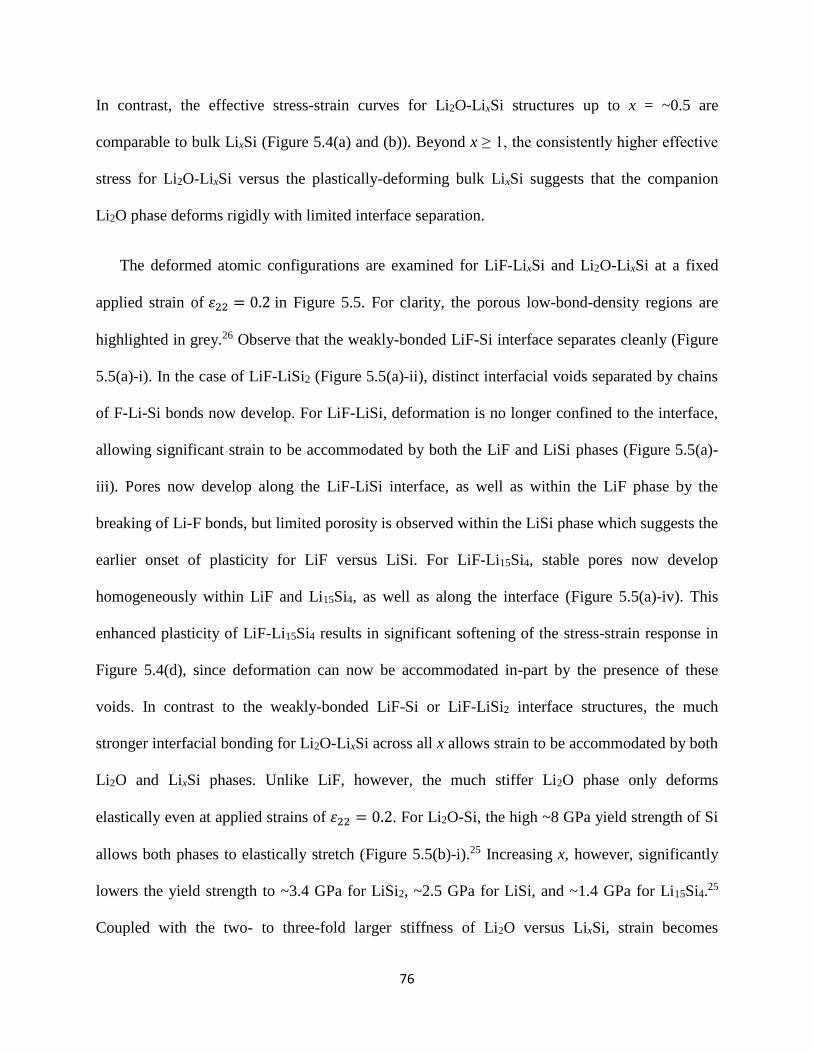
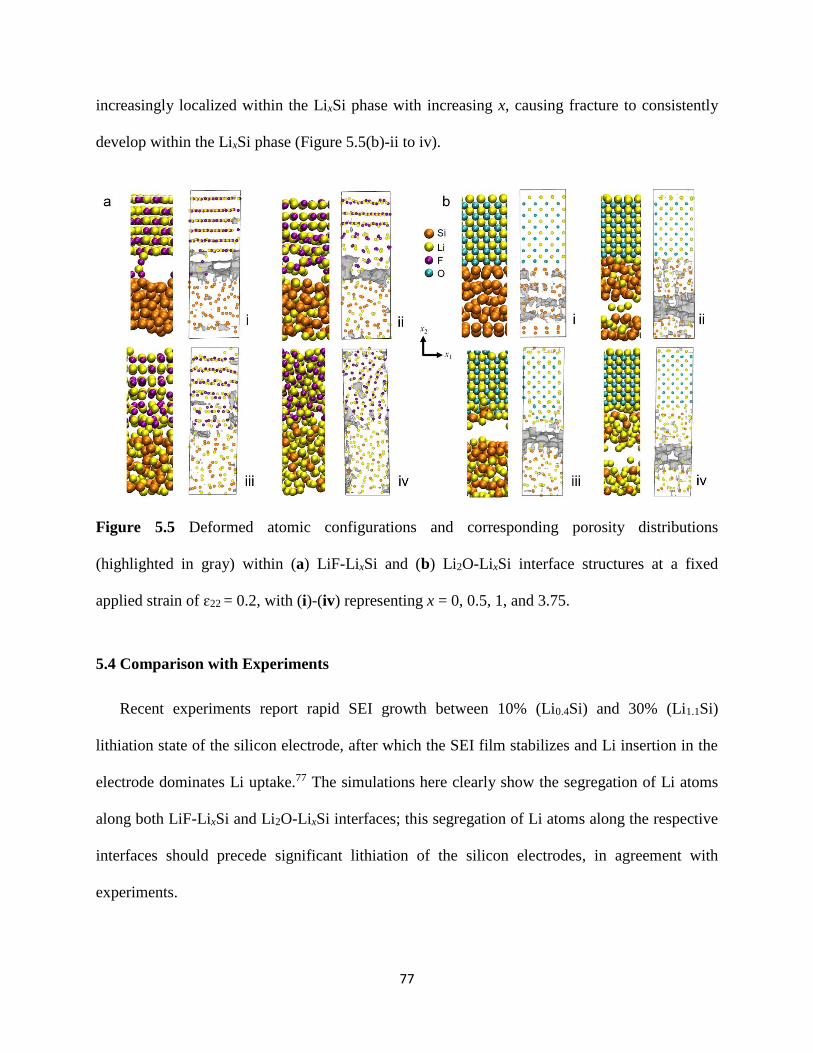
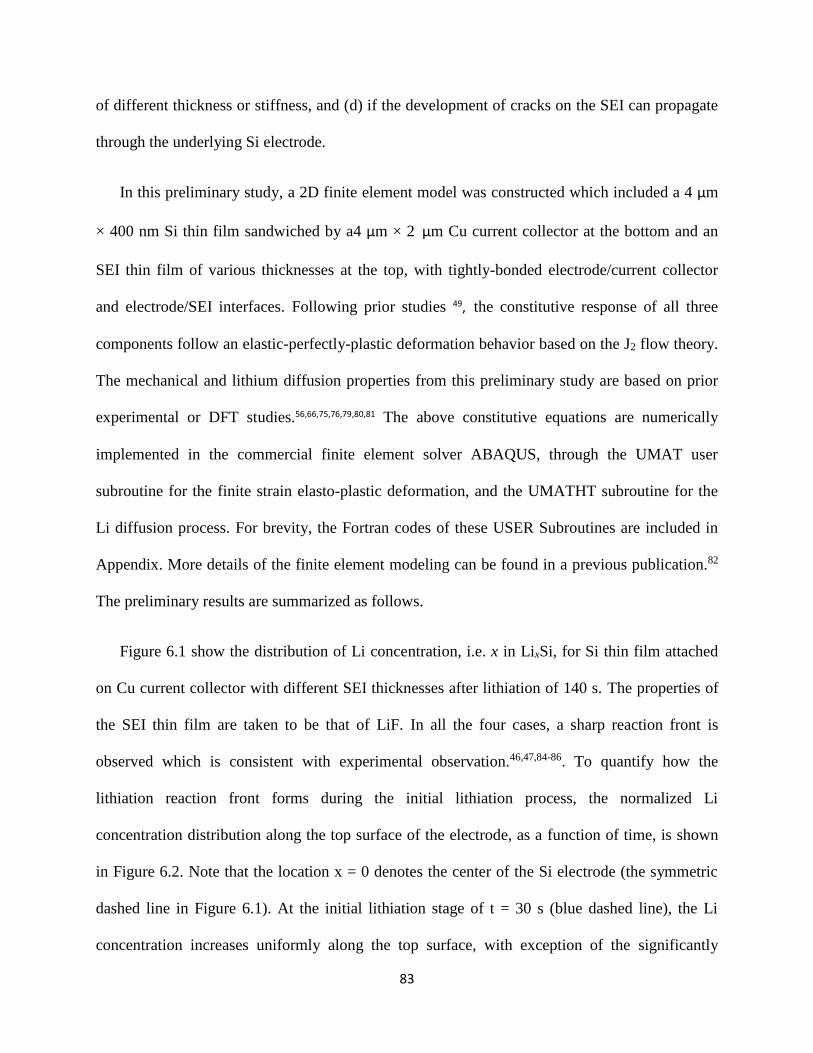
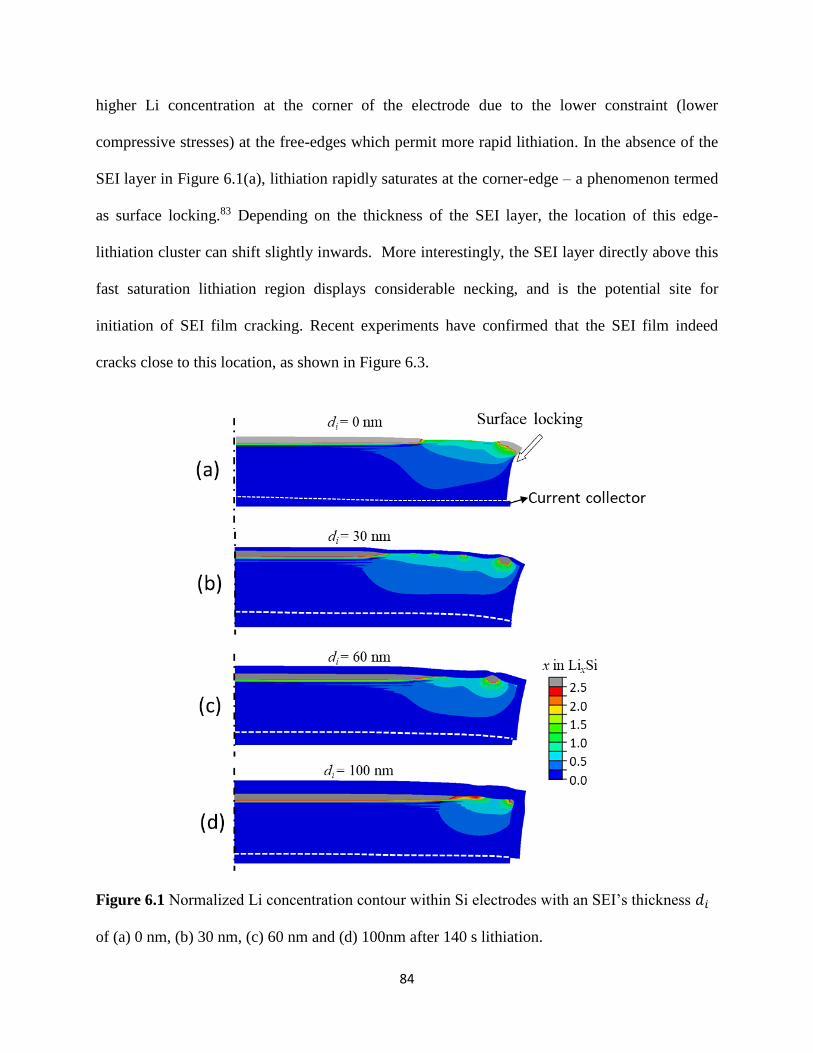
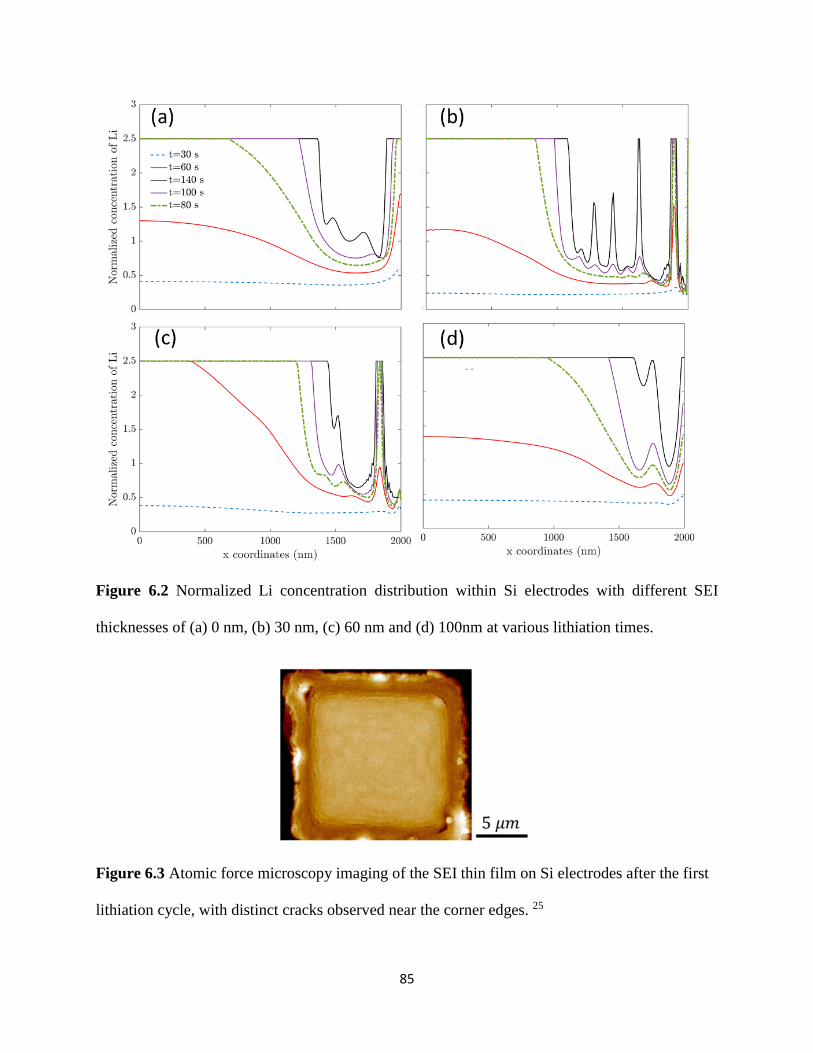
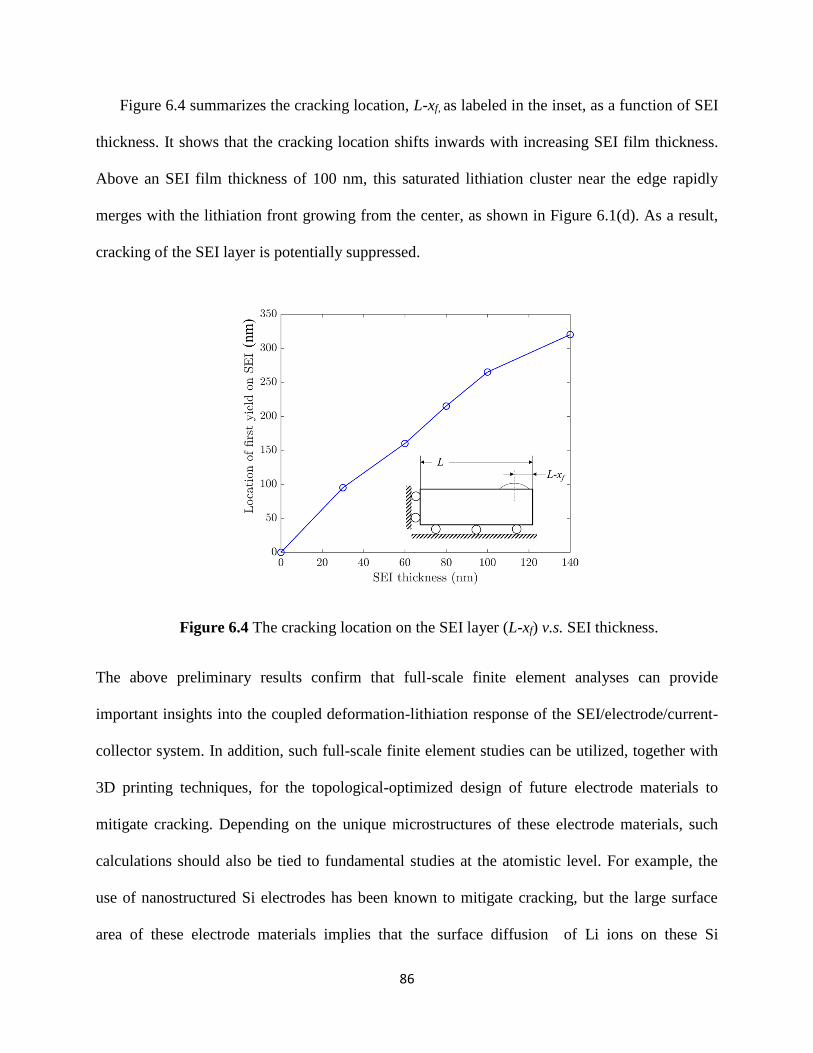

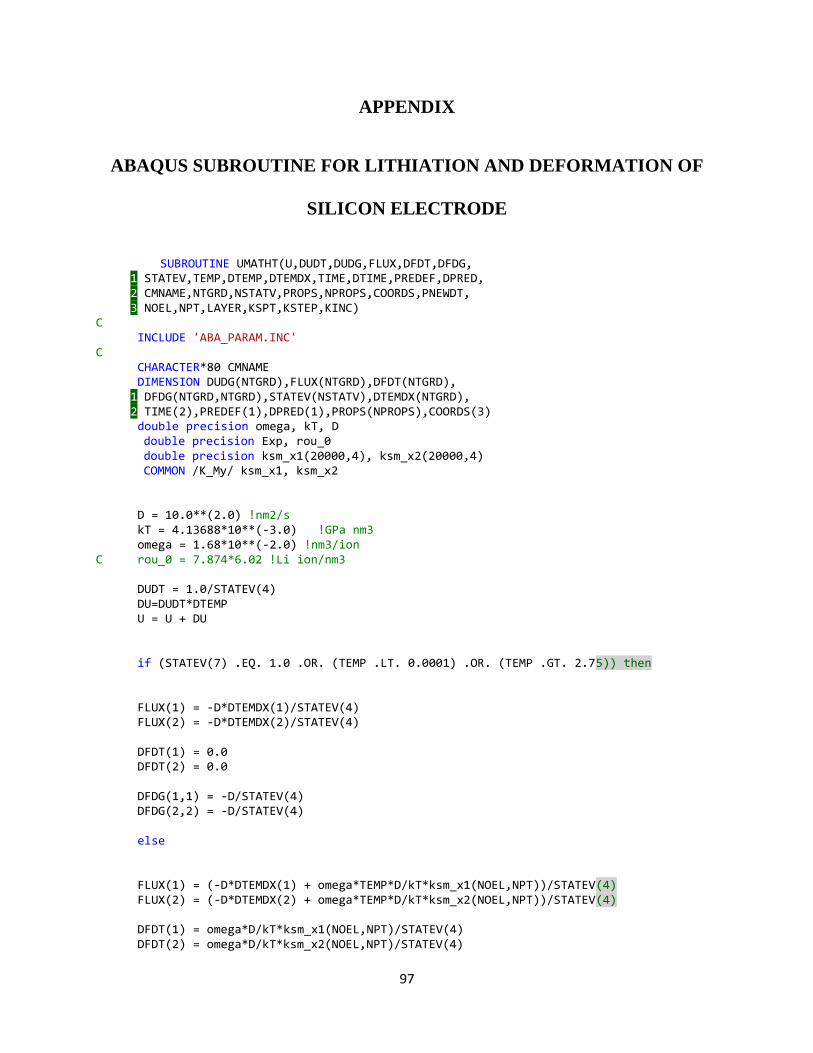
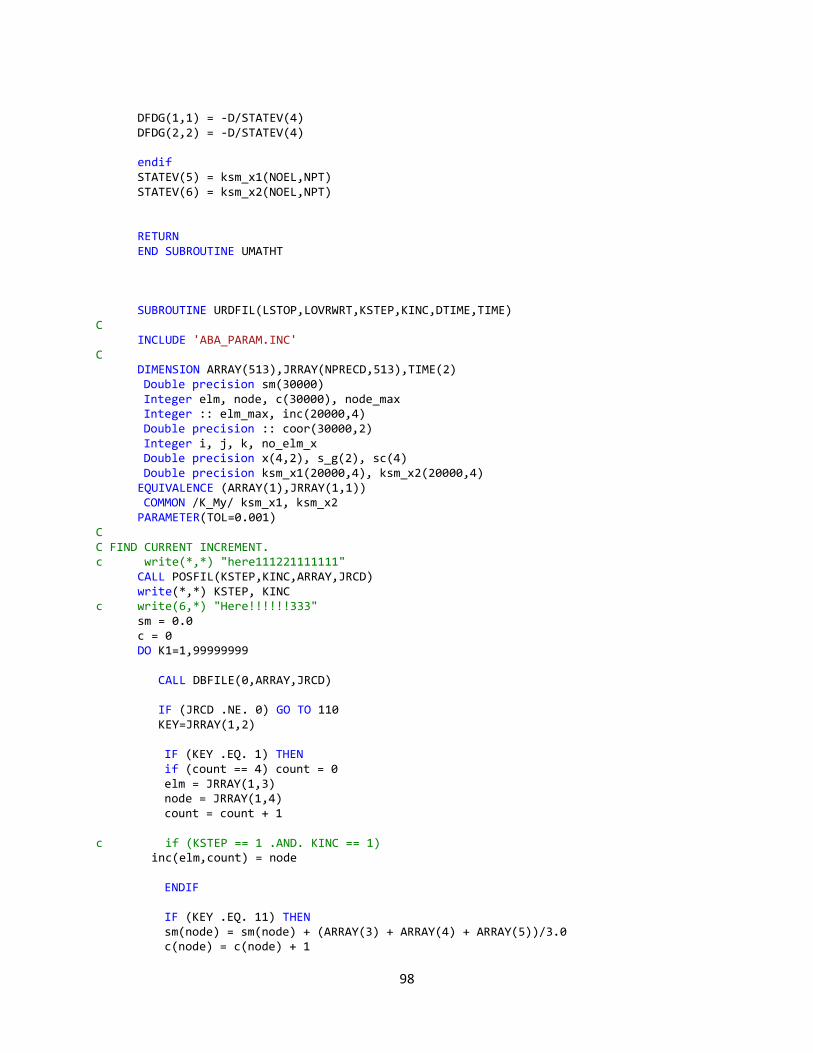
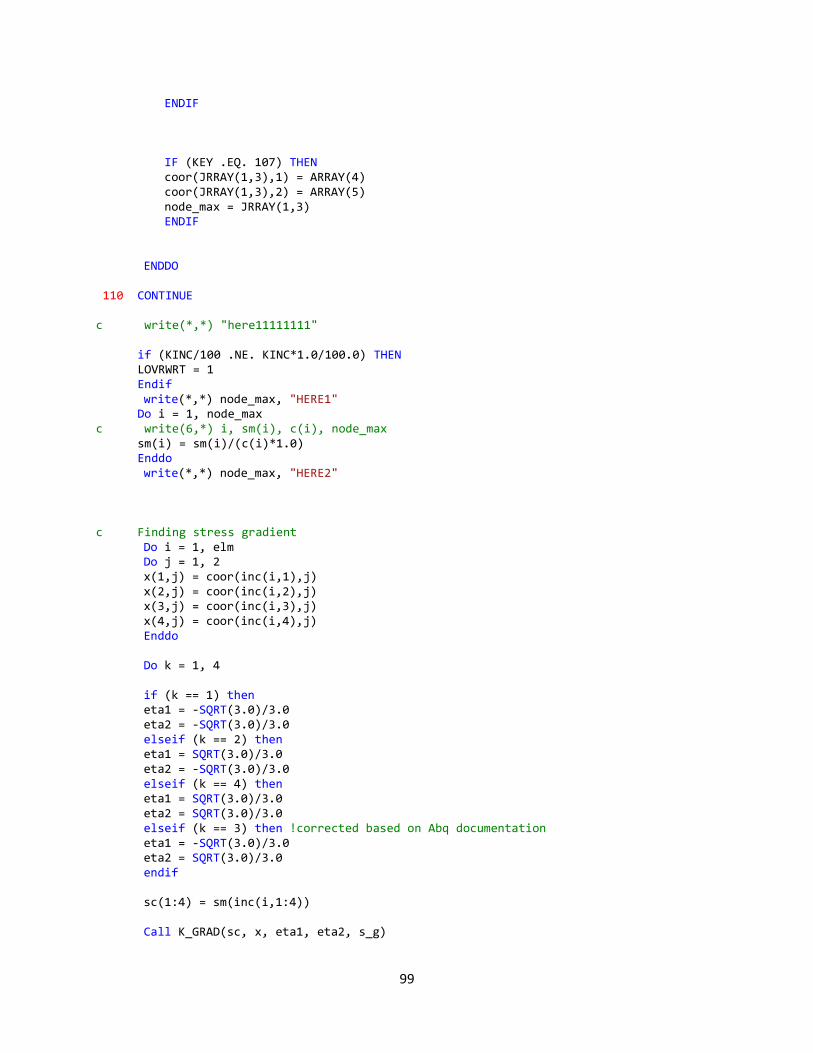
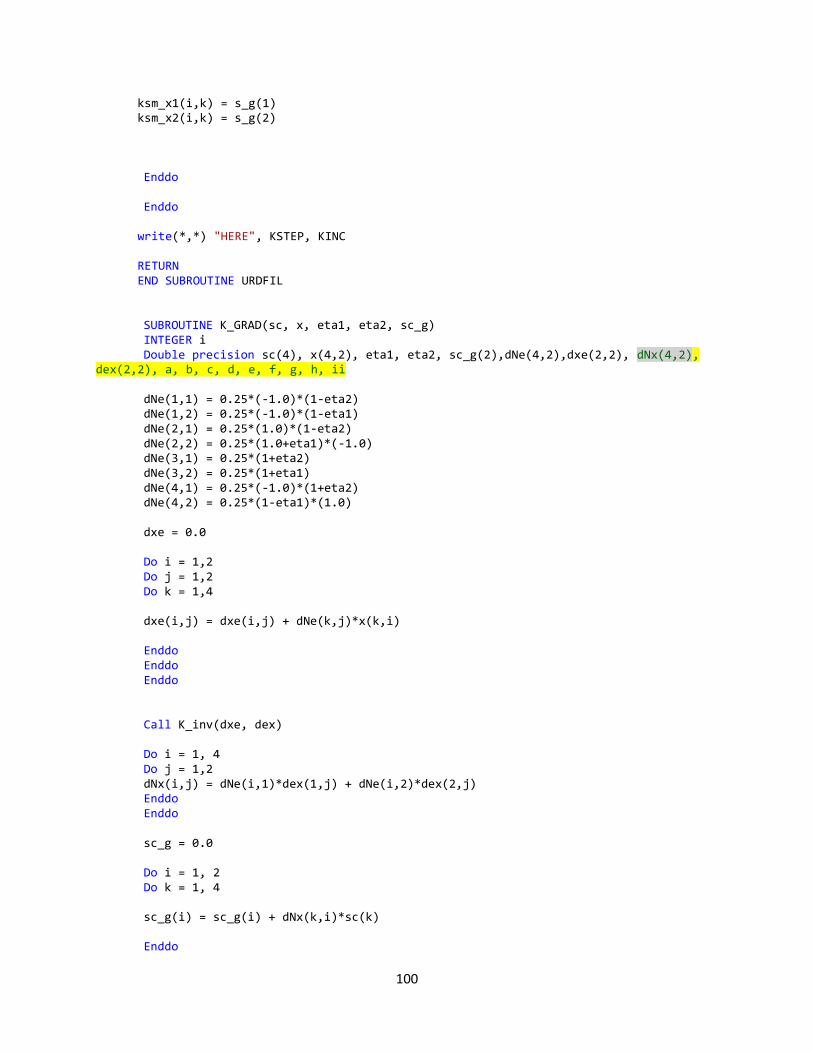
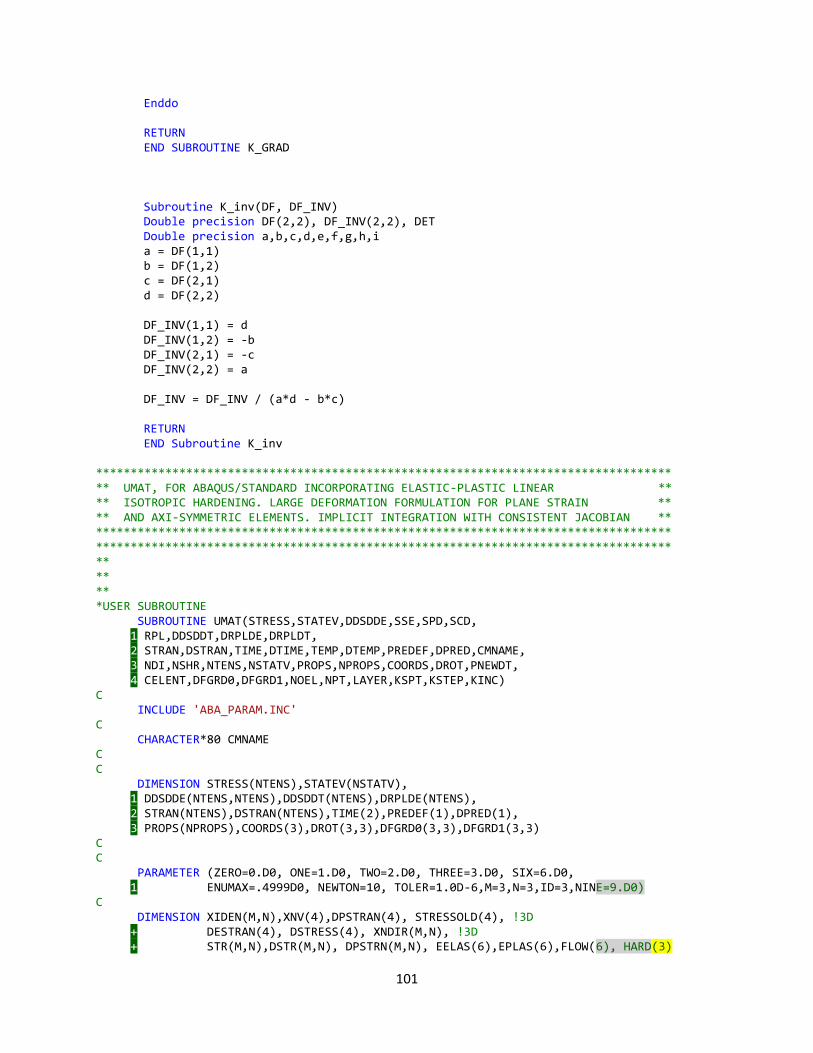
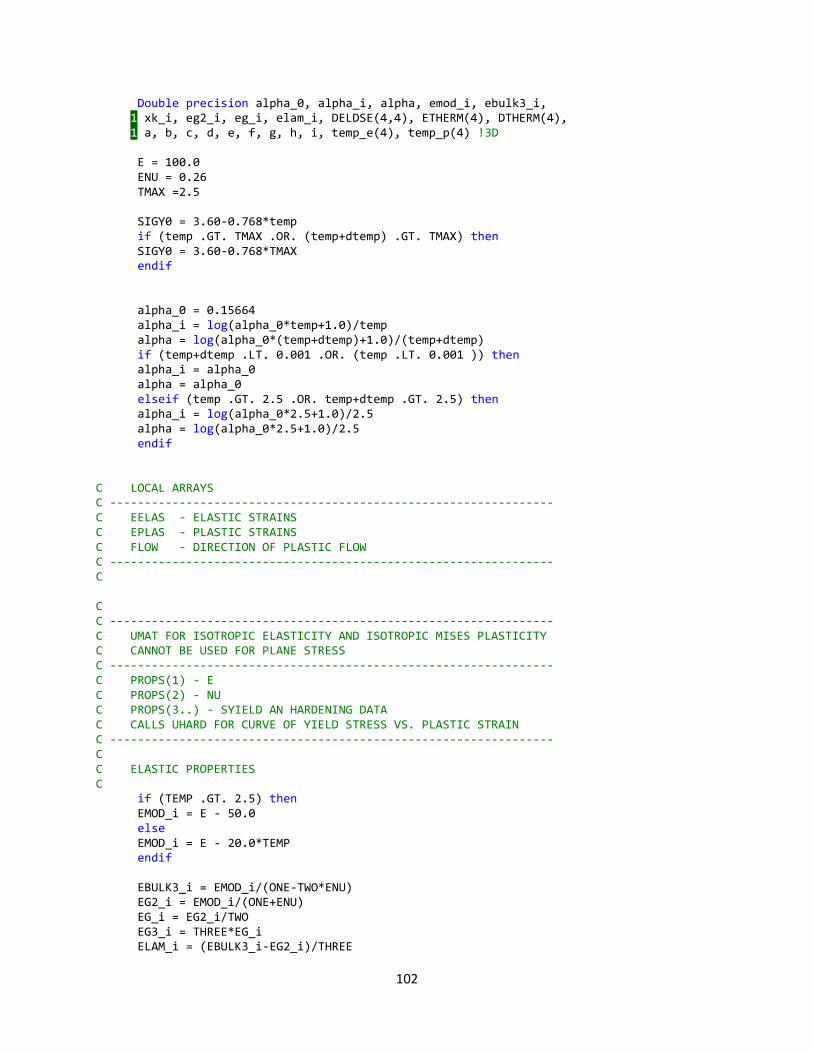
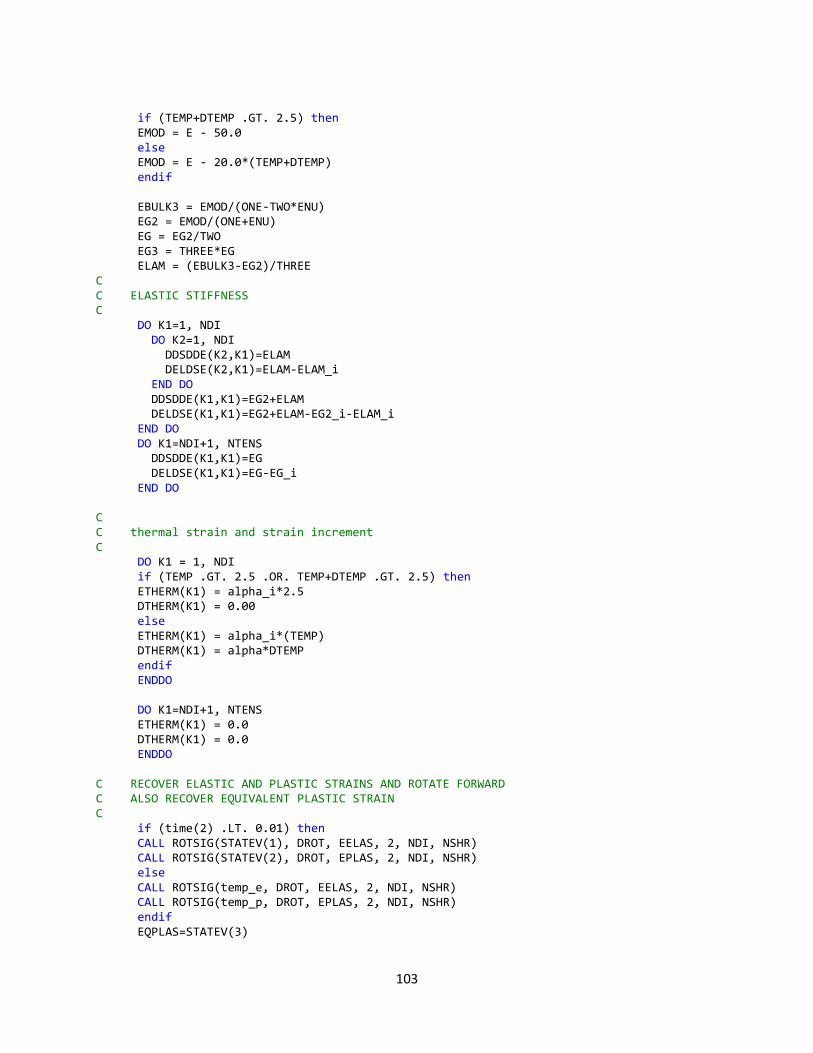
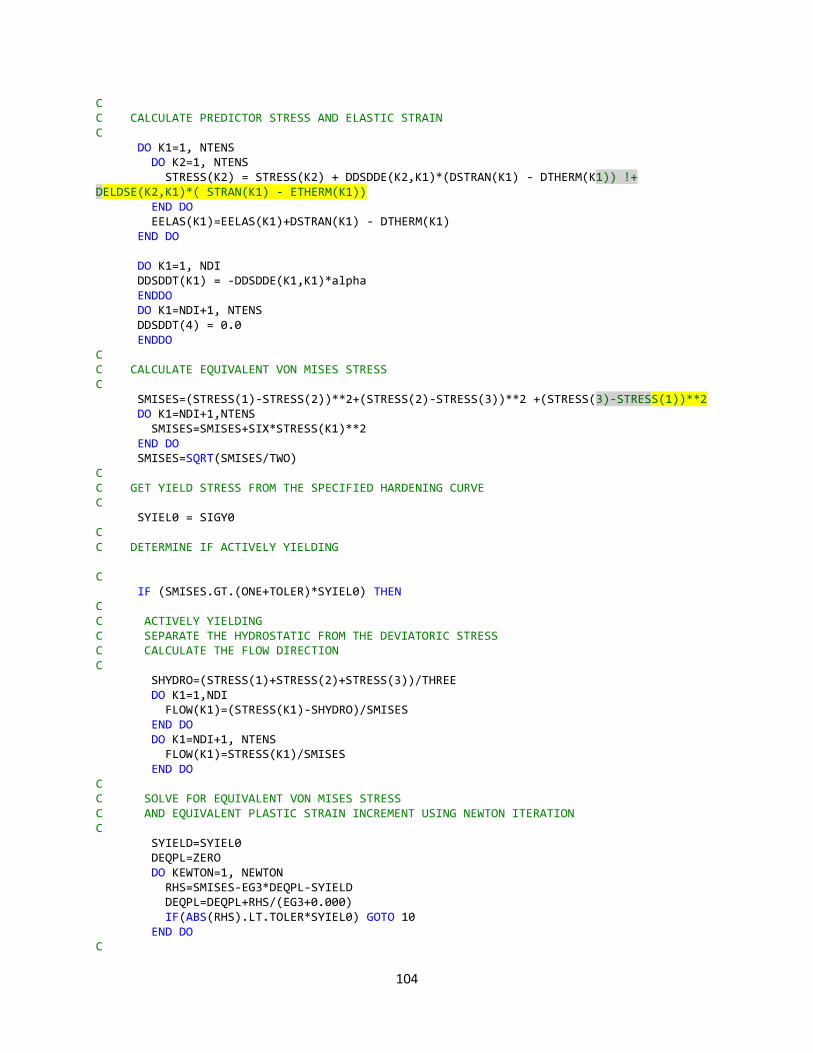
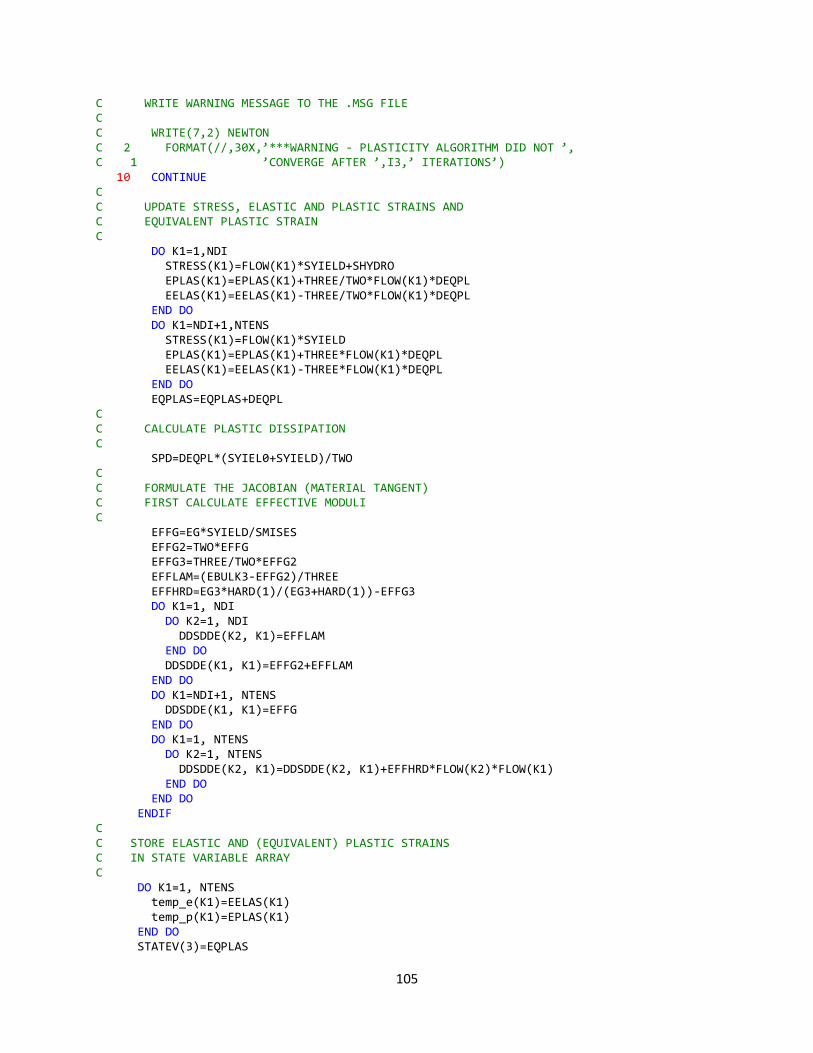
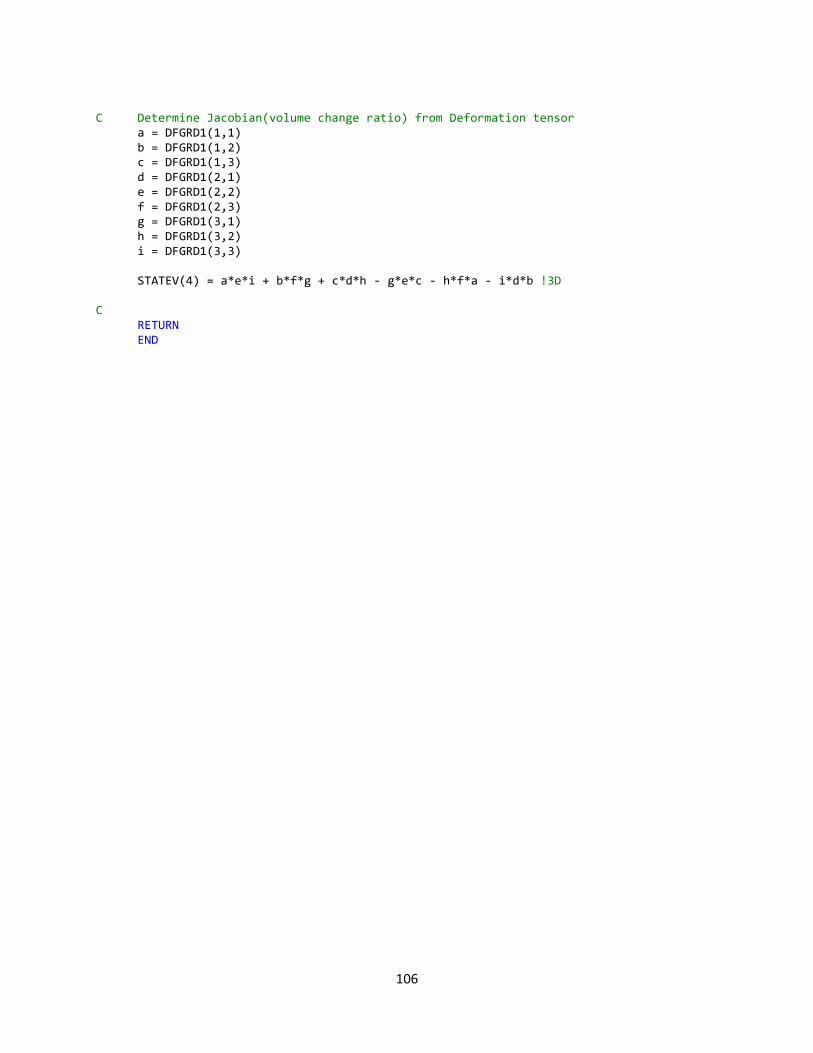


![Microscopic strength of silicon particles in an aluminium ... · mine the alloy's deformation and fracture properties [3,5e7,15,21,24,25,29e36]. Yet, little is known of the intrinsic](https://img.pdfslide.us/doc/110x75/5e7bf66c2469b864f574c07c/microscopic-strength-of-silicon-particles-in-an-aluminium-mine-the-alloys-deformation.jpg)


![Deformation and Fracture Mechanics of Engineering Material [RichardW.hertzberg]](https://img.pdfslide.us/doc/110x75/5695d03c1a28ab9b029195f8/deformation-and-fracture-mechanics-of-engineering-material-richardwhertzberg.jpg)