Embed Size (px)
Citation preview
Measuring Tire-Pavement Noise at the Source
NATIONALCOOPERATIVE HIGHWAYRESEARCH PROGRAMNCHRP
REPORT 630
TRANSPORTATION RESEARCH BOARD 2009 EXECUTIVE COMMITTEE*
OFFICERS
CHAIR: Debra L. Miller, Secretary, Kansas DOT, Topeka VICE CHAIR: Adib K. Kanafani, Cahill Professor of Civil Engineering, University of California, Berkeley EXECUTIVE DIRECTOR: Robert E. Skinner, Jr., Transportation Research Board
MEMBERS
J. Barry Barker, Executive Director, Transit Authority of River City, Louisville, KYAllen D. Biehler, Secretary, Pennsylvania DOT, HarrisburgJohn D. Bowe, President, Americas Region, APL Limited, Oakland, CALarry L. Brown, Sr., Executive Director, Mississippi DOT, JacksonDeborah H. Butler, Executive Vice President, Planning, and CIO, Norfolk Southern Corporation, Norfolk, VAWilliam A.V. Clark, Professor, Department of Geography, University of California, Los AngelesDavid S. Ekern, Commissioner, Virginia DOT, RichmondNicholas J. Garber, Henry L. Kinnier Professor, Department of Civil Engineering, University of Virginia, CharlottesvilleJeffrey W. Hamiel, Executive Director, Metropolitan Airports Commission, Minneapolis, MNEdward A. (Ned) Helme, President, Center for Clean Air Policy, Washington, DCWill Kempton, Director, California DOT, SacramentoSusan Martinovich, Director, Nevada DOT, Carson CityMichael D. Meyer, Professor, School of Civil and Environmental Engineering, Georgia Institute of Technology, AtlantaMichael R. Morris, Director of Transportation, North Central Texas Council of Governments, ArlingtonNeil J. Pedersen, Administrator, Maryland State Highway Administration, BaltimorePete K. Rahn, Director, Missouri DOT, Jefferson CitySandra Rosenbloom, Professor of Planning, University of Arizona, TucsonTracy L. Rosser, Vice President, Corporate Traffic, Wal-Mart Stores, Inc., Bentonville, ARRosa Clausell Rountree, Consultant, Tyrone, GAHenry G. (Gerry) Schwartz, Jr., Chairman (retired), Jacobs/Sverdrup Civil, Inc., St. Louis, MOC. Michael Walton, Ernest H. Cockrell Centennial Chair in Engineering, University of Texas, AustinLinda S. Watson, CEO, LYNX–Central Florida Regional Transportation Authority, OrlandoSteve Williams, Chairman and CEO, Maverick Transportation, Inc., Little Rock, AR
EX OFFICIO MEMBERS
Thad Allen (Adm., U.S. Coast Guard), Commandant, U.S. Coast Guard, Washington, DCRebecca M. Brewster, President and COO, American Transportation Research Institute, Smyrna, GAPaul R. Brubaker, Research and Innovative Technology Administrator, U.S.DOTGeorge Bugliarello, President Emeritus and University Professor, Polytechnic Institute of New York University, Brooklyn; Foreign Secretary,
National Academy of Engineering, Washington, DCSean T. Connaughton, Maritime Administrator, U.S.DOTClifford C. Eby, Acting Administrator, Federal Railroad Administration, U.S.DOTLeRoy Gishi, Chief, Division of Transportation, Bureau of Indian Affairs, U.S. Department of the Interior, Washington, DCEdward R. Hamberger, President and CEO, Association of American Railroads, Washington, DCJohn H. Hill, Federal Motor Carrier Safety Administrator, U.S.DOTJohn C. Horsley, Executive Director, American Association of State Highway and Transportation Officials, Washington, DCCarl T. Johnson, Pipeline and Hazardous Materials Safety Administrator, U.S.DOTDavid Kelly, Acting Administrator, National Highway Traffic Safety Administration, U.S.DOTSherry E. Little, Acting Administrator, Federal Transit Administration, U.S.DOTThomas J. Madison, Jr., Administrator, Federal Highway Administration, U.S.DOT William W. Millar, President, American Public Transportation Association, Washington, DCRobert A. Sturgell, Acting Administrator, Federal Aviation Administration, U.S.DOTRobert L. Van Antwerp (Lt. Gen., U.S. Army), Chief of Engineers and Commanding General, U.S. Army Corps of Engineers, Washington, DC
*Membership as of January 2009.
TRANSPORTAT ION RESEARCH BOARDWASHINGTON, D.C.
2009www.TRB.org
N A T I O N A L C O O P E R A T I V E H I G H W A Y R E S E A R C H P R O G R A M
NCHRP REPORT 630
Subject Areas
Materials and Construction
Measuring Tire-Pavement Noise at the Source
Paul R. Donavan
Dana M. LodicoILLINGWORTH & RODKIN, INC.
Petaluma, CA
Research sponsored by the American Association of State Highway and Transportation Officials in cooperation with the Federal Highway Administration
NATIONAL COOPERATIVE HIGHWAYRESEARCH PROGRAM
Systematic, well-designed research provides the most effective
approach to the solution of many problems facing highway
administrators and engineers. Often, highway problems are of local
interest and can best be studied by highway departments individually
or in cooperation with their state universities and others. However, the
accelerating growth of highway transportation develops increasingly
complex problems of wide interest to highway authorities. These
problems are best studied through a coordinated program of
cooperative research.
In recognition of these needs, the highway administrators of the
American Association of State Highway and Transportation Officials
initiated in 1962 an objective national highway research program
employing modern scientific techniques. This program is supported on
a continuing basis by funds from participating member states of the
Association and it receives the full cooperation and support of the
Federal Highway Administration, United States Department of
Transportation.
The Transportation Research Board of the National Academies was
requested by the Association to administer the research program
because of the Board’s recognized objectivity and understanding of
modern research practices. The Board is uniquely suited for this
purpose as it maintains an extensive committee structure from which
authorities on any highway transportation subject may be drawn; it
possesses avenues of communications and cooperation with federal,
state and local governmental agencies, universities, and industry; its
relationship to the National Research Council is an insurance of
objectivity; it maintains a full-time research correlation staff of
specialists in highway transportation matters to bring the findings of
research directly to those who are in a position to use them.
The program is developed on the basis of research needs identified
by chief administrators of the highway and transportation departments
and by committees of AASHTO. Each year, specific areas of research
needs to be included in the program are proposed to the National
Research Council and the Board by the American Association of State
Highway and Transportation Officials. Research projects to fulfill these
needs are defined by the Board, and qualified research agencies are
selected from those that have submitted proposals. Administration and
surveillance of research contracts are the responsibilities of the National
Research Council and the Transportation Research Board.
The needs for highway research are many, and the National
Cooperative Highway Research Program can make significant
contributions to the solution of highway transportation problems of
mutual concern to many responsible groups. The program, however, is
intended to complement rather than to substitute for or duplicate other
highway research programs.
Published reports of the
NATIONAL COOPERATIVE HIGHWAY RESEARCH PROGRAM
are available from:
Transportation Research BoardBusiness Office500 Fifth Street, NWWashington, DC 20001
and can be ordered through the Internet at:
http://www.national-academies.org/trb/bookstore
Printed in the United States of America
NCHRP REPORT 630
Project 1-44ISSN 0077-5614ISBN: 978-0-309-11768-5Library of Congress Control Number 2009900077
© 2009 Transportation Research Board
COPYRIGHT PERMISSION
Authors herein are responsible for the authenticity of their materials and for obtainingwritten permissions from publishers or persons who own the copyright to any previouslypublished or copyrighted material used herein.
Cooperative Research Programs (CRP) grants permission to reproduce material in thispublication for classroom and not-for-profit purposes. Permission is given with theunderstanding that none of the material will be used to imply TRB, AASHTO, FAA, FHWA,FMCSA, FTA, or Transit Development Corporation endorsement of a particular product,method, or practice. It is expected that those reproducing the material in this document foreducational and not-for-profit uses will give appropriate acknowledgment of the source ofany reprinted or reproduced material. For other uses of the material, request permissionfrom CRP.
NOTICE
The project that is the subject of this report was a part of the National Cooperative HighwayResearch Program conducted by the Transportation Research Board with the approval ofthe Governing Board of the National Research Council. Such approval reflects theGoverning Board’s judgment that the program concerned is of national importance andappropriate with respect to both the purposes and resources of the National ResearchCouncil.
The members of the technical committee selected to monitor this project and to review thisreport were chosen for recognized scholarly competence and with due consideration for thebalance of disciplines appropriate to the project. The opinions and conclusions expressedor implied are those of the research agency that performed the research, and, while they havebeen accepted as appropriate by the technical committee, they are not necessarily those ofthe Transportation Research Board, the National Research Council, the AmericanAssociation of State Highway and Transportation Officials, or the Federal HighwayAdministration, U.S. Department of Transportation.
Each report is reviewed and accepted for publication by the technical committee accordingto procedures established and monitored by the Transportation Research Board ExecutiveCommittee and the Governing Board of the National Research Council.
The Transportation Research Board of the National Academies, the National ResearchCouncil, the Federal Highway Administration, the American Association of State Highwayand Transportation Officials, and the individual states participating in the NationalCooperative Highway Research Program do not endorse products or manufacturers. Tradeor manufacturers’ names appear herein solely because they are considered essential to theobject of this report.

CRP STAFF FOR NCHRP REPORT 630
Christopher W. Jenks, Director, Cooperative Research ProgramsCrawford F. Jencks, Deputy Director, Cooperative Research ProgramsAmir N. Hanna, Senior Program OfficerEileen P. Delaney, Director of PublicationsMaria Sabin Crawford, Assistant Editor
NCHRP PROJECT 1-44 PANELField of Design—Area of Pavements
Matthew W. Mueller, Illinois DOT, Springfield, IL (Chair)Randell H. “Randy” Iwasaki, California DOT, Sacramento, CA German J. Claros, Texas DOT, Austin, TX Larry Lockett, Alabama DOT, Montgomery, AL David E. Newcomb, National Asphalt Pavement Association, Lanham, MD John H. Roberts, American Concrete Pavement Association, Coxsackie, NY Judith L. Rochat, Research and Innovative Technology Administration, Cambridge, MA Larry A. Scofield, American Concrete Pavement Association, Mesa, AZ (formerly with Arizona DOT)Roger L. Wayson, University of Central Florida, Orlando, FL Robert Orthmeyer, FHWA Liaison Mark Swanlund, FHWA Liaison Frederick Hejl, TRB Liaison
AUTHOR ACKNOWLEDGMENTS
The research reported in this document was performed under NCHRP Project 1-44 by Illingworth &Rodkin, Inc., Petaluma, California. Dr. Paul Donavan was the Principal Investigator. Ms. Dana Lodico ofIllingworth & Rodkin, Inc., participated in the data acquisition and analysis and was the second authorof this report. Chris Peters also of Illingworth & Rodkin, Inc., assisted in the fieldwork. The National Cen-ter of Asphalt Technology, Auburn, Alabama, served as a subcontractor for this research.
The authors acknowledge the assistance provided by MnDOT personnel at the MnRoads test facility inMinnesota and the assistance provided by General Motors personnel at the GM Desert Proving Groundtest facility in Arizona during the test parameter investigation phase of this work. The authors also extendtheir gratitude to Dr. James Cable of Iowa State University for his assistance in identifying test sites inIowa and coordinating the assistance provided by Mr. Bruce Rymer of Caltrans in coordinating test siteusage in the State of California.
C O O P E R A T I V E R E S E A R C H P R O G R A M S
This report presents a suggested procedure for measuring tire-pavement noise at the source.The procedure uses the on-board sound intensity (OBSI) method that was found to be the pre-ferred approach for measuring tire-pavement noise at the source. Although the research pre-sented in this report provided a basis for the recently introduced provisional Standard TestMethod for the Measurement of Tire/Pavement Noise Using the On-Board Sound Intensity(OBSI) Method (AASHTO Designation TP076-08), the procedure includes some modifica-tions to the provisional standard. The content of the report will be of immediate interest to stateengineers and others concerned with pavement design and construction and the noise impactson nearby communities.
Tire-pavement noise has become an increasingly important consideration for highwayagencies as the public consistently demands that highway traffic noise be mitigated.Although sound walls provide a means for addressing highway noise, improved pavementstructures and surfaces may provide a competitive alternative for noise mitigation. How-ever, there are no widely accepted procedures for measuring solely tire-pavement noiseunder in-service conditions. Thus, research was needed to evaluate potential noise-measuringprocedures and identify or develop appropriate procedures applicable to light and heavyvehicles and all paved surfaces.
Under NCHRP Project 1-44, “Measuring Tire-Pavement Noise at the Source,” Illing-worth and Rodkin, Inc., of Petaluma, California, worked with the objectives of (1) develop-ing rational procedures for measuring tire-pavement noise and (2) demonstrating applica-bility of the procedures through testing of in-service pavements. To accomplish theseobjectives, the researchers (1) reviewed current practices, approaches, and methods used formeasuring tire-pavement noise in close proximity of the tire; (2) conducted tests to evalu-ate candidate methods and select the most promising test method; (3) examined the pa-rameters associated with the selected test method to identify appropriate parameter limits;and (4) conducted measurements on in-service pavements to demonstrate applicability ofthe selected method to different pavement types. Based on this review and analysis of testresults, the research suggested a procedure for measuring tire-pavement noise using thesound-intensity method. The test procedure will be particularly useful to highway agenciesin considering noise issues because it provides an appropriate means for (1) measuring andrating tire-pavement noise levels on existing pavements, (2) evaluating new pavementsincorporating noise-mitigating features, and (3) identifying design and construction fea-tures associated with different noise levels.
Appendixes A through D contained in the research agency’s final report provide detailedinformation on the literature review, the experimental program, data analysis, and demon-
F O R E W O R D
By Amir N. HannaStaff OfficerTransportation Research Board
stration testing of the suggested method. These appendixes are not published herein, butare available online at http://trb.org/news/blurb_detail.asp?id=9956. These appendixes aretitled as follows:
Appendix A: Review of LiteratureAppendix B: Test Evaluation of Candidate Methods and Recommendation for Test
Procedure DevelopmentAppendix C: Results of Test Parameter EvaluationAppendix D: Demonstration Testing of OBSI Procedure
C O N T E N T S
1 Summary
2 Chapter 1 Introduction 2 Background3 Research Objectives and Scope3 Research Approach
4 Chapter 2 Literature Search 4 Description of the Review5 Remarks on Test Procedure Development
7 Chapter 3 Evaluation of Alternative Test Methods 7 Overview of Evaluation Testing7 Summary of the CPX and OBSI Test Results9 Recommendation of an At-the-Source Measurement Method
11 Chapter 4 Evaluation of OBSI Test Parameters 11 Introduction11 Description of Field Measurements11 Parameters Evaluated11 Measurement Sites11 Measurement Protocol12 Meteorological Conditions12 Results of Parameter Investigation12 Run-to-Run Repeatability of Baseline Condition13 Test Tire (SRTT versus Dunlop)14 Environmental Variables14 Systematic Vehicle and Test Execution Variables15 Test Vehicle16 Fixture Configuration (Single Probe versus Dual Probe)16 Data Quality Criteria16 Recommendations on Parameter Limits
17 Chapter 5 Demonstration Testing of OBSI Procedure 17 Introduction17 Description of Field Measurements17 Measurement Sites17 Measurement Protocol18 Meteorological Conditions19 Data Reduction and Analysis19 Data Reduction19 Data Analysis
20 Results and Discussion20 Normalized SPB and CPB Data versus OBSI23 Prediction of SPB Data from OBSI Data27 Test Tires27 Summary
29 Chapter 6 Conclusions, Recommendations, and Suggested Research
29 Conclusions29 Recommendations30 Test Procedure Implementation and Enhancement30 Other Recommendations30 Suggested Research
31 References
32 Attachment Proposed Method of Test for Measurement of Tire-Pavement Noise Using the On-Board Sound Intensity (OBSI) Method
36 Appendixes A, B, C, and D
S U M M A R Y
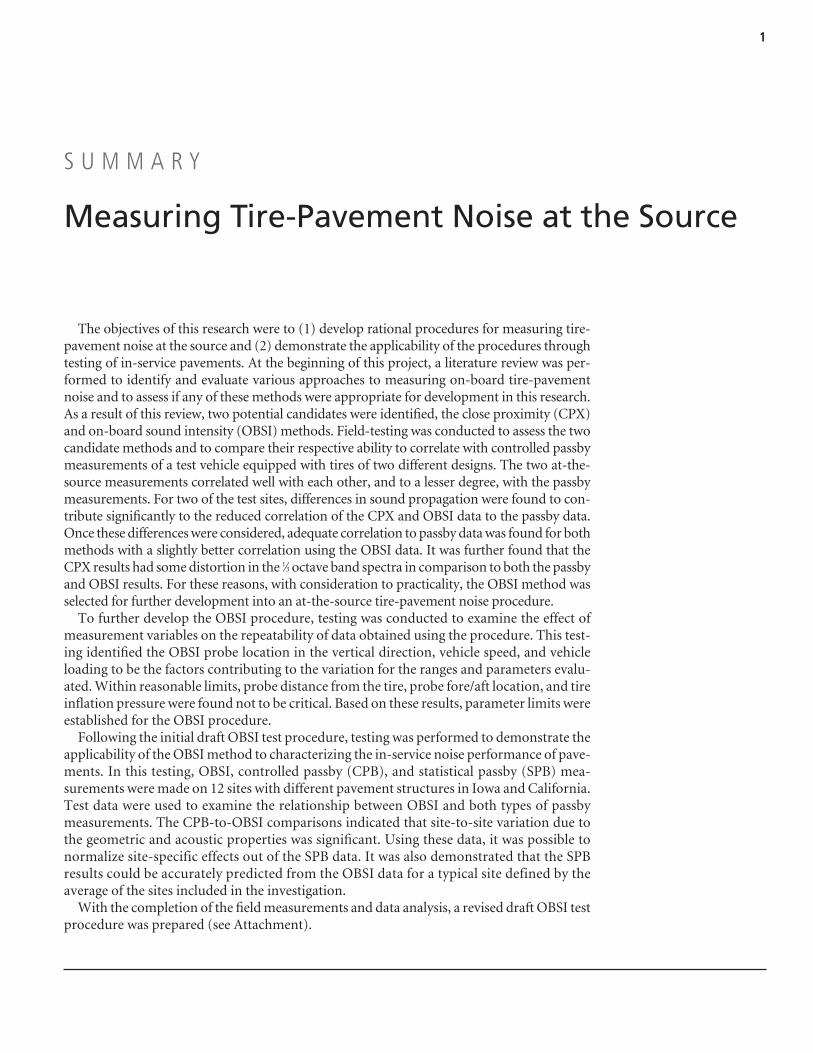
The objectives of this research were to (1) develop rational procedures for measuring tire-pavement noise at the source and (2) demonstrate the applicability of the procedures throughtesting of in-service pavements. At the beginning of this project, a literature review was per-formed to identify and evaluate various approaches to measuring on-board tire-pavementnoise and to assess if any of these methods were appropriate for development in this research.As a result of this review, two potential candidates were identified, the close proximity (CPX)and on-board sound intensity (OBSI) methods. Field-testing was conducted to assess the twocandidate methods and to compare their respective ability to correlate with controlled passbymeasurements of a test vehicle equipped with tires of two different designs. The two at-the-source measurements correlated well with each other, and to a lesser degree, with the passbymeasurements. For two of the test sites, differences in sound propagation were found to con-tribute significantly to the reduced correlation of the CPX and OBSI data to the passby data.Once these differences were considered, adequate correlation to passby data was found for bothmethods with a slightly better correlation using the OBSI data. It was further found that theCPX results had some distortion in the 1⁄3 octave band spectra in comparison to both the passbyand OBSI results. For these reasons, with consideration to practicality, the OBSI method wasselected for further development into an at-the-source tire-pavement noise procedure.
To further develop the OBSI procedure, testing was conducted to examine the effect ofmeasurement variables on the repeatability of data obtained using the procedure. This test-ing identified the OBSI probe location in the vertical direction, vehicle speed, and vehicleloading to be the factors contributing to the variation for the ranges and parameters evalu-ated. Within reasonable limits, probe distance from the tire, probe fore/aft location, and tireinflation pressure were found not to be critical. Based on these results, parameter limits wereestablished for the OBSI procedure.
Following the initial draft OBSI test procedure, testing was performed to demonstrate theapplicability of the OBSI method to characterizing the in-service noise performance of pave-ments. In this testing, OBSI, controlled passby (CPB), and statistical passby (SPB) mea-surements were made on 12 sites with different pavement structures in Iowa and California.Test data were used to examine the relationship between OBSI and both types of passbymeasurements. The CPB-to-OBSI comparisons indicated that site-to-site variation due tothe geometric and acoustic properties was significant. Using these data, it was possible tonormalize site-specific effects out of the SPB data. It was also demonstrated that the SPBresults could be accurately predicted from the OBSI data for a typical site defined by theaverage of the sites included in the investigation.
With the completion of the field measurements and data analysis, a revised draft OBSI testprocedure was prepared (see Attachment).
Measuring Tire-Pavement Noise at the Source
1
2
Tire-pavement noise has become an increasingly importantconsideration for highway agencies. However, there are nowidely accepted procedures for measuring solely tire-pavementnoise under in-service conditions. As a result, this research wasundertaken to evaluate potential noise-measuring proceduresand identify or develop appropriate procedures applicable tolight and heavy vehicles and all paved surfaces. Such proce-dures will provide highway agencies with an appropriate meansfor (1) measuring and rating tire-pavement noise levels onexisting pavements, (2) evaluating new pavements incorporat-ing noise-mitigating features, and (3) identifying design andconstruction features associated with different noise levels.
The objectives of this research were to (1) develop rationalprocedures for measuring tire-pavement noise at the sourceand (2) demonstrate the applicability of the proceduresthrough testing of in-service pavements. To achieve theseobjectives, (1) a literature search was conducted to gain under-standing of what approaches have been used in the past toquantify tire-pavement noise source levels, (2) evaluation test-ing was conducted to assess candidate methods and select themost promising one, (3) the effect of test parameters of theselected method were examined to develop parameter limits,and (4) field tests were performed on in-service pavements todemonstrate the applicability of the proposed measurementmethod for different pavement types. This report presents theresults of the research, the information obtained, implicationsfor developing a rational test procedure, and the proposed testmethod.
Background
Recently, there has been increased interest on the part ofhighway agencies to consider the use of quieter pavements tomitigate traffic noise. This interest has been driven largely bythe cost and, at times, lack of public acceptance of the tradi-tional sound wall approach to mitigating traffic noise (1) andan apparent increase in the demands of the public for highway
traffic noise reduction. In addition, there has been an increas-ing public awareness that pavement selection can affect theresultant traffic noise levels.
An increased interest in measuring tire-pavement noise atthe source has occurred parallel to the recent interest in quietpavements. With this type of testing, acoustic measurementsare made close to the tire-pavement interface with instrumen-tation that translates with the test tire. Thus, the tire-pavementnoise of a large number of pavements can be measured in a rel-atively short period of time with very few restrictions on thetest site. The source-level measurements require less time andfewer resources to complete relative to wayside measurementsand facilitate a more direct comparison of tire-pavement noisegeneration from one site to another. However, there are nowidely accepted procedures in the United States for tire-pavement noise source levels under in-service conditions.
When this research began, tire-pavement noise source-level measurements in the United States primarily used twoapproaches, the Close Proximity (CPX) method as docu-mented in the draft ISO 11819-2 standard document (2), andthe On Board Sound Intensity (OBSI) method based on tech-niques developed at General Motors Corporation (3). In theearly 2000s, both of these methods were used to catalogue andcompare different pavements for their noise performance (4, 5, 6). Other methods using different approaches of soundpressure level measurement (7) and near field acoustical holog-raphy (8) were also reported in the literature. As a result of theuncertainty inherent in the measurement procedures of tire-pavement noise source levels, development of standardizedprocedures was identified as a research need by the AASHTOStanding Committee on Research in March of 2004; the Com-mittee allocated funds to develop such procedures underNCHRP Project 1-44. This need was also reiterated at the firstTire-Pavement Noise Strategic Planning Workshop conductedby the Federal Highway Administration and the Institute forSafe, Quiet, and Durable Highways held at Purdue Universityin September of 2004 (9). The research conducted in this proj-
C H A P T E R 1
Introduction
ect was subsequently initiated with the objective of developinga rational procedure for measuring tire-pavement noise at thesource that could be implemented by highway agencies.
Research Objectives and Scope
The objectives of this research were to (1) develop rationalprocedures for measuring tire-pavement noise at the sourceand (2) demonstrate the applicability of the procedures throughtesting of in-service pavements. This work was divided intotwo Phases. Phase I of this project involved reviewing the rele-vant literature worldwide as documented in conference pro-ceedings, technical papers, and other sources; evaluating theseveral candidate techniques identified from the literature; andthen selecting a single approach for measuring tire-pavementnoise at the source for further development. In Phase II, theeffect of test parameters was examined and field tests were per-formed on in-service pavements to compare source level, con-trolled vehicle passby, and statistical passby data collection.The results were used to develop a recommended test proce-dure for the measurement of tire-pavement noise at the source.
Research Approach
The research was performed in two phases comprising sixtasks. Phase I included the following four tasks (1 through 4):
1. Identify Potential Tire-Pavement Noise Measurement Meth-ods. In this task, information on methods for measuringtire-pavement noise at the source was collected, reviewed,and synthesized. The findings of this literature search aresummarized in Chapter 2 and documented in more detailin Appendix A.
2. Develop Recommendation for Tire-Pavement Test Method.The test methods identified in Task 1 were evaluated inregard to their potential for providing a rational test pro-cedure for measuring tire-pavement noise at the source.Based on this evaluation, two candidate techniques wereidentified for further investigation: CPX and OBSI. Inorder to develop a single recommended method, severalsubtasks were performed. First, the two candidate tech-niques were evaluated in experiments conducted at andaround the National Center for Asphalt Technology(NCAT) test track facility in Opelika, Alabama. CPX,OBSI, and controlled wayside passby noise levels were
measured on a variety of pavement types using the sametires. Next, the results of the CPX and OBSI testing wereanalyzed and ranked on the basis of their ability to corre-late with the wayside passby levels. In addition, consider-ation was given to the expense/practicality and training/expertise required for each method. Under the final sub-task, the OBSI method was recommended as the basis ofthe procedure to be demonstrated and refined in Phase IIbased on the ranking of the techniques and their ability tomeet the other identified criteria developed in Task 1.
3. Develop Work Plan to Demonstrate Recommended Method.In this task, a work plan for Phase II of the project wasdeveloped.
4. Documentation and Interim Report. In this task, an interimreport of the research performed in Tasks 1 through 3 wasprepared. The report included the results of survey work ofTask 1, the experimental work and recommendations ofTask 2, and the updated and detailed work plan for Phase IIdeveloped in Task 3.
Phase II included the following two tasks (5 and 6):
5. Field Measurements, Analysis, and Findings. This taskincluded three subtasks. The first subtask was the evalua-tion of repeatability issues and parameter dependencies ofthe OBSI method using a preliminary test procedure. Thisevaluation was accomplished through testing conducted atMinnesota’s DOT MnROAD Low Volume Road facility inAlbertville, Minnesota, and at the General Motors DesertProving Ground (DPG) in Mesa, Arizona. The second sub-task was the assessment of the applicability of the OBSIprocedure through the testing of in-service pavements.This work consisted of conducting controlled vehiclepassby, statistical passby, and tire-pavement noise OBSImeasurements on 12 in-service pavement sections in Iowaand California. These tests included the simultaneous mea-surement of (1) OBSI on two specific candidate test tires, (2) controlled passbys on test vehicles equipped with thosetires, and (3) statistical passbys of both light and heavy-duty vehicles. The third subtask involved the developmentof a draft OBSI procedure based on the results obtainedthrough the test parameter investigation and the results ofthe in-service pavement testing.
6. Prepare Final Report. In this task, a report documentingthe research, findings, and recommendations resultingfrom this research was prepared.
3
4
Hundreds of papers have been written on the subject of tire-pavement noise. Relevant references were read, summa-rized, and grouped into categories based on the measurementtypes employed. Studies that dealt with measurements onpavements (not on “road-wheels” in a laboratory environ-ment) that were not limited to passby or wayside measure-ments were selected for review. Selected papers were examinedfor the use of a novel approach, the development of a source-level measurement approach, or the comparison of passby tosource-level measurements. Papers that gave results comparingpassby to source-level measurements were reviewed in the mostdetail. References discussing testing parameters and/or vari-ables that affect tire noise measurements were also reviewed.Nearly 100 sources of information were evaluated in this man-ner (detailed results of this work and a complete reference listare provided in Appendix A).
Description of the Review
The primary source of reference material was papers writ-ten for various noise conferences. The proceedings of over100 national and international conferences and symposiahave been searched for work related to tire-pavement noisemeasurement at the source. The Tyre/Road Noise ReferenceBook (10) has been used as a check ensuring that the rele-vant work prior to 2001 has been included in the search.However, material from the 1970s through 2001 wassearched independently of this reference in order to ensureinclusion of all related work. In more recent years (2002through 2005), many additional papers were published onthis subject from ongoing work in Europe, the UnitedStates, and Asia. The literature deals with three general cat-egories of acoustic measurement: sound pressure level(SPL) measurements, sound intensity (SI) level measure-ments, and sound field measurements using acoustic arraytechnology (AAT).
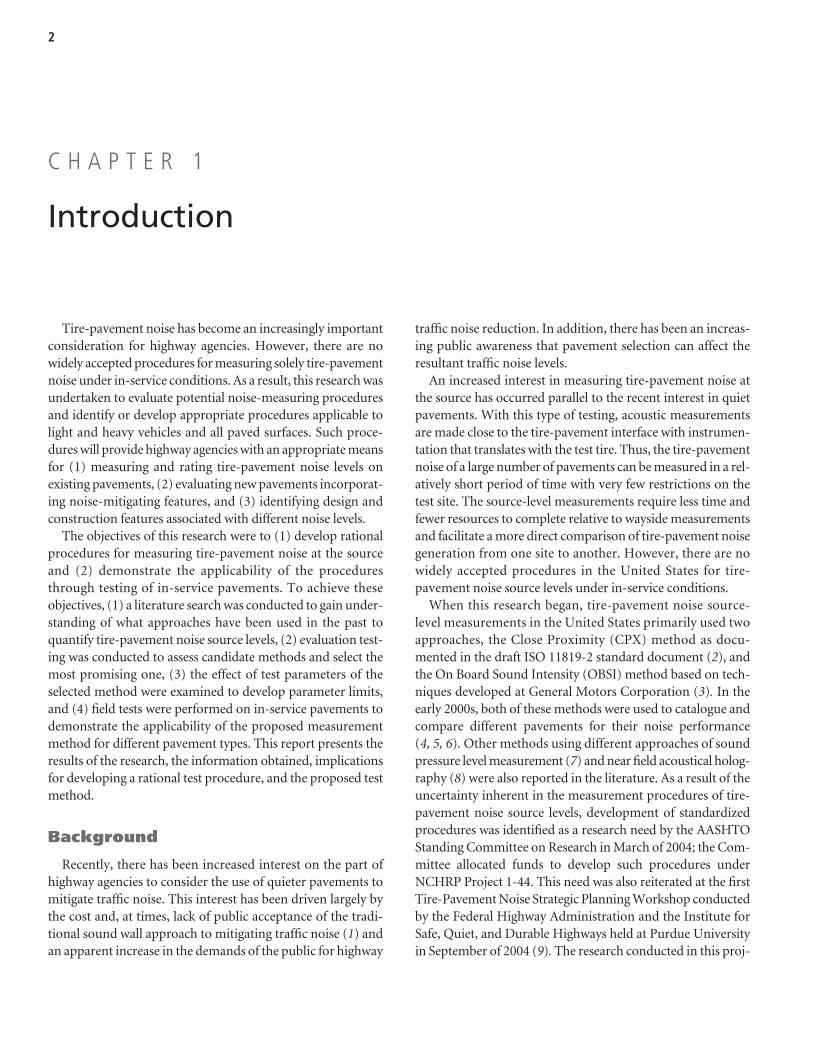
The sound pressure level measurement approaches may bedivided into three subcategories. The first of these are varia-tions of “behind the tire” (BTT) measurements where amicrophone is placed directly behind the tire typically close toboth the tire and pavement. This position was chosen becauseit was thought to reduce wind noise on the microphone. Thesecond subcategory is the so-called “close proximity” mea-surement where several microphones are placed at variouspoints around the tire (Figure 1). This approach evolved intothe formal ISO Draft Standard procedure, ISO 11819-2 (2),which is commonly referred to as the Close Proximity (CPX)method. Use of slightly different microphone positions thanthose used in this draft standard was reported. The CPXapproach includes techniques where the microphones areprotected from airflow by trailers surrounding the test tireand those where the microphones are exposed to flow. Thethird subcategory is all other SPL measurements that are notincluded in BTT and CPX approaches and are typicallyunique to a single study or set of studies by an individualresearcher or research group if referred to as “SPL Other.”
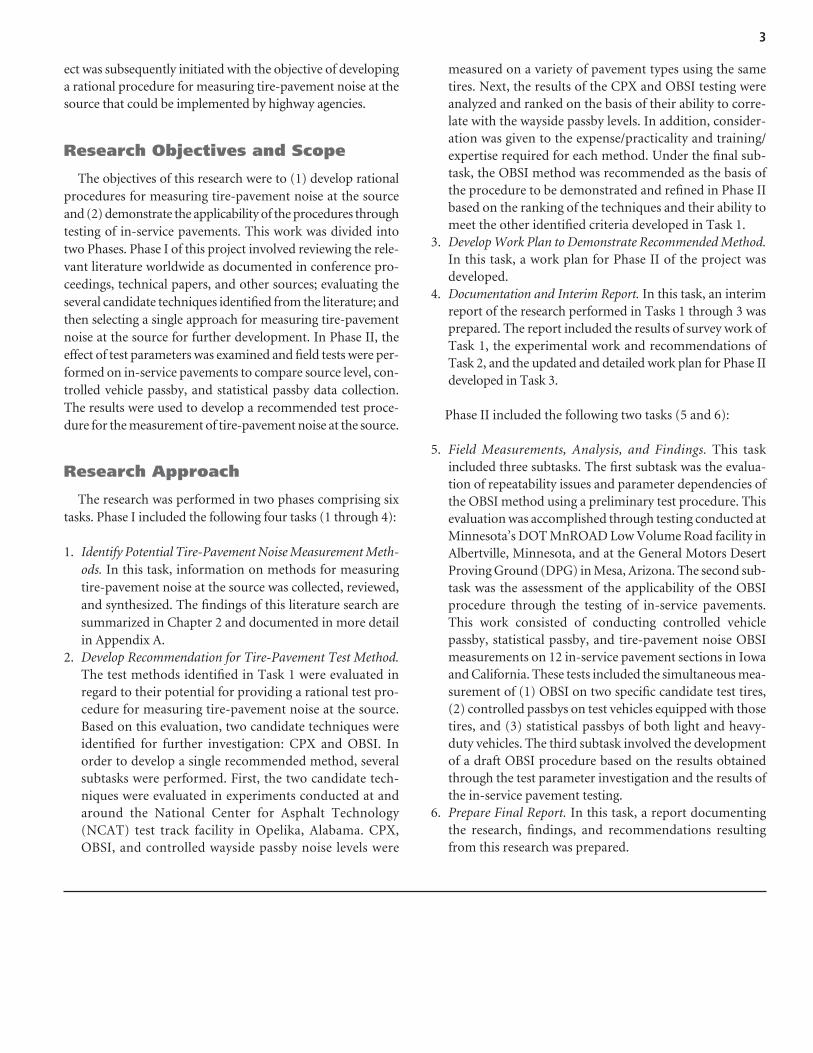
In the SI category, the majority of the reported studies fol-low the approach developed at General Motors Corporation(GM) and documented in the relevant GM Test Procedure(11) (Figure 2) although several other unique approaches werealso reported. In the AAT category, almost all of on-road workuses a near-field acoustic holography approach (NAH) andhas been done largely by a single research effort at Penn StateUniversity (8).
Each of the three major measurement categories has been used both for on-road and road-wheel (RW) testing.Although it was the intent of this project to develop a proce-dure for in situ measurement of tire-pavement noise at thesource, some of the RW work is of interest and was includedin the review. Also included in the review were a few referencesdealing with measurements that were important to under-standing tire-pavement noise variables as they relate to a testprocedure.
C H A P T E R 2
Literature Search
Remarks on Test Procedure Development
In this subsection, the implications of the literature searchon the selection of the candidate test method are summa-rized. This draws upon the complete discussion of the liter-ature search provided in Appendix A, which includes thecitation of 85 references.
Of the three overall approaches, AAT methods appear tobe the furthest away from being a usable technique for rou-tine, in-service pavement noise evaluation. These techniqueshave never been applied to measurements in a highwayenvironment and no comparisons to passby data have been
reported. The measurement systems are not standardized andrequire acquisition and manipulation of many channels ofacoustic signals. Considering the similarity of results pro-vided by sound intensity and AAT mapping, there appears tobe no advantage in pursuing AAT technology over the sim-pler OBSI methods.
For SPL measurements, a lot of different approaches havebeen cited in the literature. Some of the early work using BTTmethods displayed some limited level of correlation to passbymeasurement for trucks. However, more recent research workhas shown that the noise region at the front of the tire isequally important to overall tire noise and that there is littlecorrelation between the front and the rear of the tire. Of theremainder of the SPL methods, there appears to be no justifi-cation for following any method other than that defined in theISO CPX draft standard. Comparisons between passby andonboard measurements using other SPL methods show aboutthe same degree of correlation as seen with CPX methods.Regarding the CPX approaches, some consideration should begiven to using trailer instead of exposed microphones. Withthe trailer method, concern has been expressed about reflec-tions in the enclosure. Tests to evaluate reflections have beendefined; however, recent work comparing different tests andequipment have indicated some variation. An attractive alter-native to the trailer-based CPX method is the exposed micro-phone technique. With the microphones fixed to the side ofthe test vehicle, this approach should avoid the build up ofreflections and should be less expensive to implement. How-ever, the issue of flow noise contamination of the exposedmicrophone remains unresolved and methods for testing forit are not defined.
As with the CPX method, the OBSI method using the GMmethodology has been used extensively for in situ highwaypavement noise measurements. This method has been shownto correlate reasonably well with both controlled passby(CPB) data and CPX data. Unlike the test tires specified in theISO CPX draft standard, tires used today in OBSI testingseemed to be somewhat arbitrary relative to “typical” tirenoise as little data comparing OBSI to statistical passby (SPB)for light vehicles has been reported. Further, the use of con-sumer tires for standardized testing is problematic as tire sup-pliers discontinue production of these tires, as has beenexperienced both by users of the CPX and OBSI methods.International availability of test tires has also been an issue assome test tires used in Europe are not available in the UnitedStates and vice versa. For the onboard procedure to be usedby highway agencies in the United States, the selection andavailability of test tires must be considered regardless of thetest procedure used.
An issue that remains an unknown is relating either CPXor OBSI measurements to passby levels of porous pavements.
5
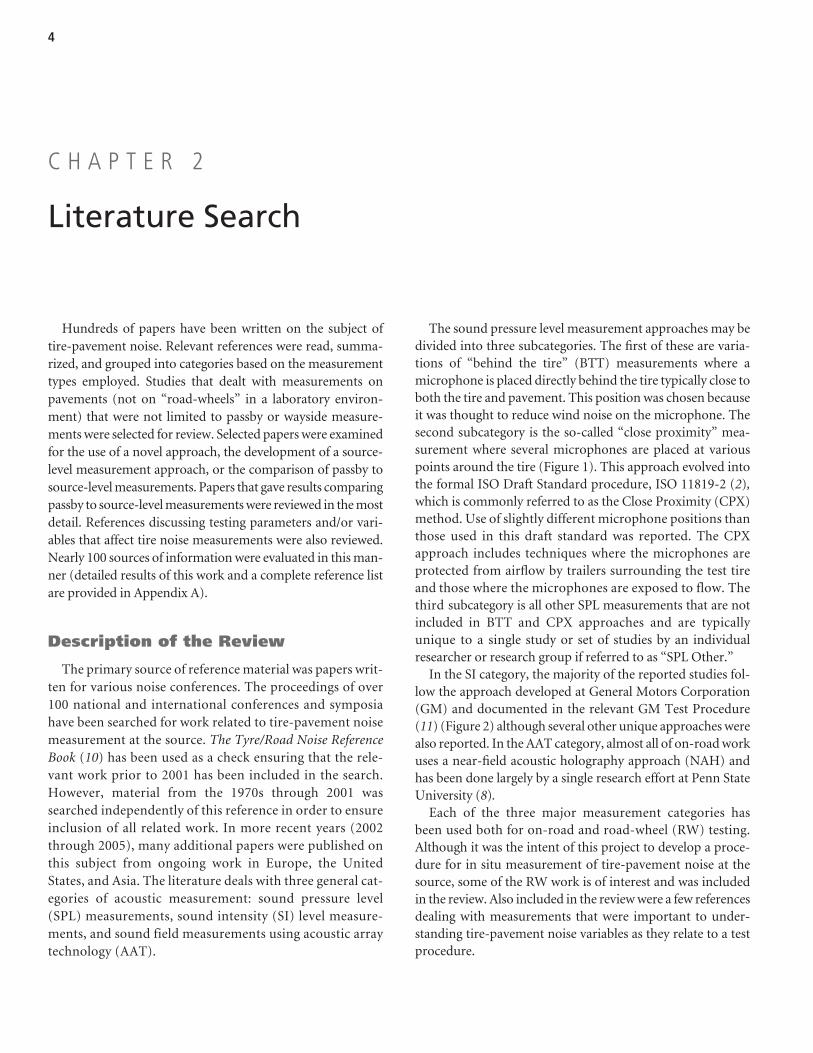
Figure 1. CPX tire-pavement noise measurementconfiguration.
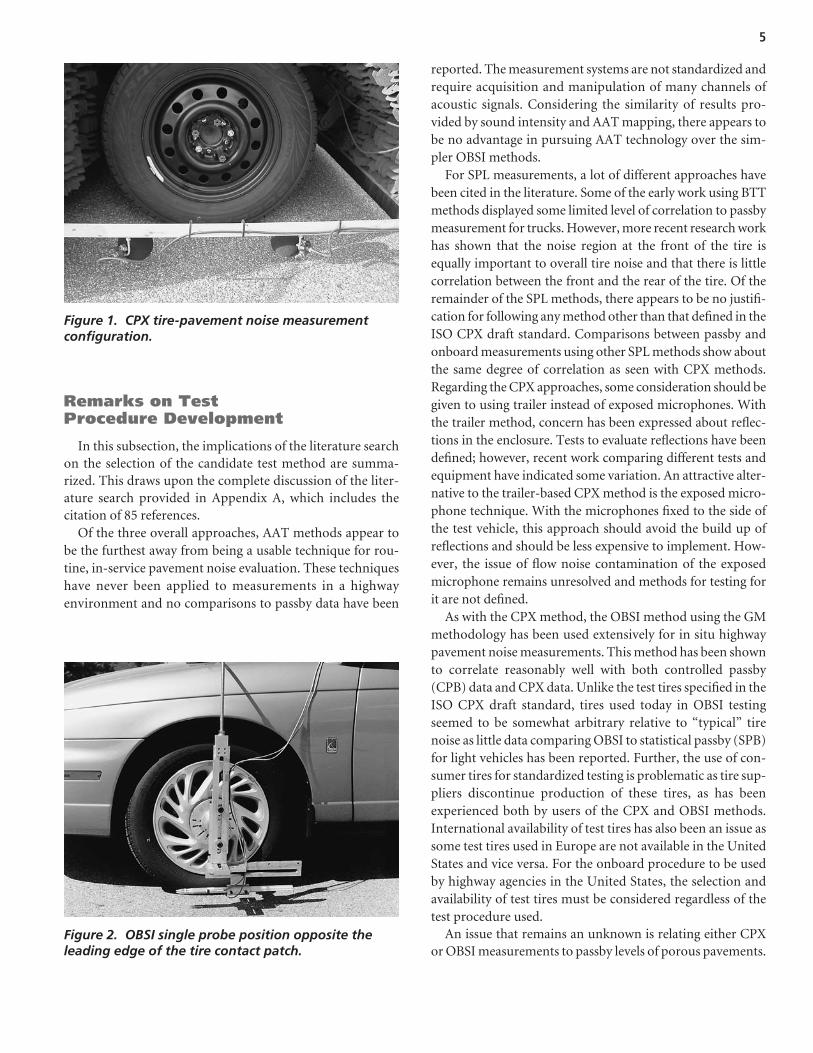
Figure 2. OBSI single probe position opposite theleading edge of the tire contact patch.

Differences between CPX to CPB or SPB relationships havebeen reported in some European studies. Also, one study sug-gested that porosity played a role in CPB and OBSI datameasured for two test surfaces, one slightly porous and onenon-porous (12). Differences may also exist in the way in whichthese two methods respond to porous pavement and how theyrelate to passby levels.
Prior to this study, there had been no research to compareOBSI to CPX and both to CPB within the same study. Suchinformation is necessary in order to assess the technical mer-its of both approaches and to determine if there is a technicaladvantage in one of the approaches that should be consideredalong with other, non-technical issues. The evaluation testingof these two methods is reported in Chapter 3.
6
7
Based on the results of the literature search, testing wasconducted to evaluate the two candidate methods for on-board, tire-pavement noise source measurement. This testingconsisted of measuring CPX and OBSI noise levels on thesame tires and then conducting controlled passby measure-ments using the test tires along with three other tires of thesame design mounted on the test vehicle. The findings fromthis testing along with other considerations leading to theselection of the OBSI method of tire-pavement noise mea-surement at the source are summarized in this section (detailsof the testing and analyses are discussed in Appendix B).
Overview of Evaluation Testing
Passby measurements were made under both cruise andcoast conditions. Sound pressure levels of tire-pavement noiseat the source were measured in a manner following the ISOCPX test procedure (2). Sound intensity levels were measuredusing the OBSI methodology employed in previous CaliforniaDepartment of Transportation (Caltrans) studies (6). OBSIlevels were also measured on the CPX trailer for comparison tothose measured on the test car. In addition to these measure-ments, testing was done to examine potential propagation dif-ferences between sites. Measurements were made at five sites:four asphalt concrete (AC) pavements at the National Cen-ter for Asphalt Technology (NCAT) test track in Auburn,Alabama, and one portland cement concrete (PCC) pavementin the nearby town of Waverly, Alabama (specific informationon these sites and pavements is provided in Appendix B).Three of the pavements at NCAT were acoustically hard, pro-ducing no sound absorption. Surfaces for these sections werefine texture Superpave (Section AC S5), medium texture stonemastic asphalt (Section AC S1), and Superpave with addedtransverse texture (Section AC W5). The fourth pavement hada porous, open-graded asphalt concrete (OGAC) pavement ofcoarse texture in the travel lane with propagation over an adja-cent non-porous AC lane (Section AC S4). The Waverly site
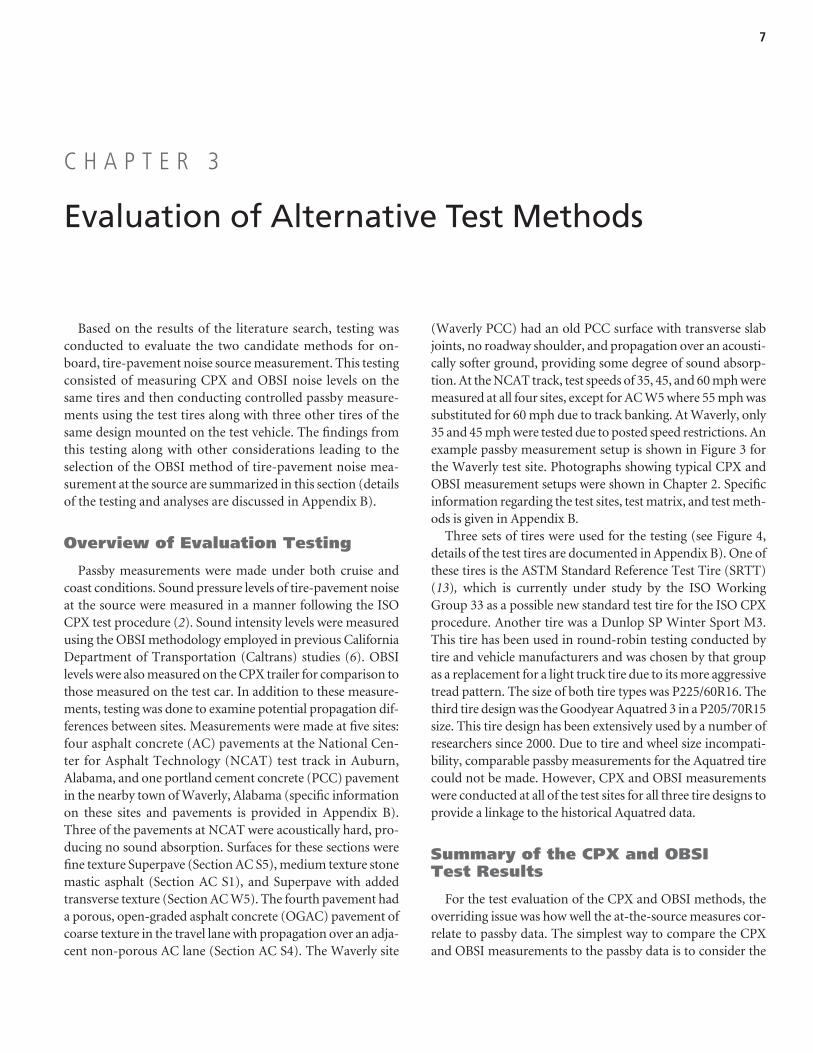
(Waverly PCC) had an old PCC surface with transverse slabjoints, no roadway shoulder, and propagation over an acousti-cally softer ground, providing some degree of sound absorp-tion. At the NCAT track, test speeds of 35, 45, and 60 mph weremeasured at all four sites, except for AC W5 where 55 mph wassubstituted for 60 mph due to track banking. At Waverly, only35 and 45 mph were tested due to posted speed restrictions. Anexample passby measurement setup is shown in Figure 3 forthe Waverly test site. Photographs showing typical CPX andOBSI measurement setups were shown in Chapter 2. Specificinformation regarding the test sites, test matrix, and test meth-ods is given in Appendix B.
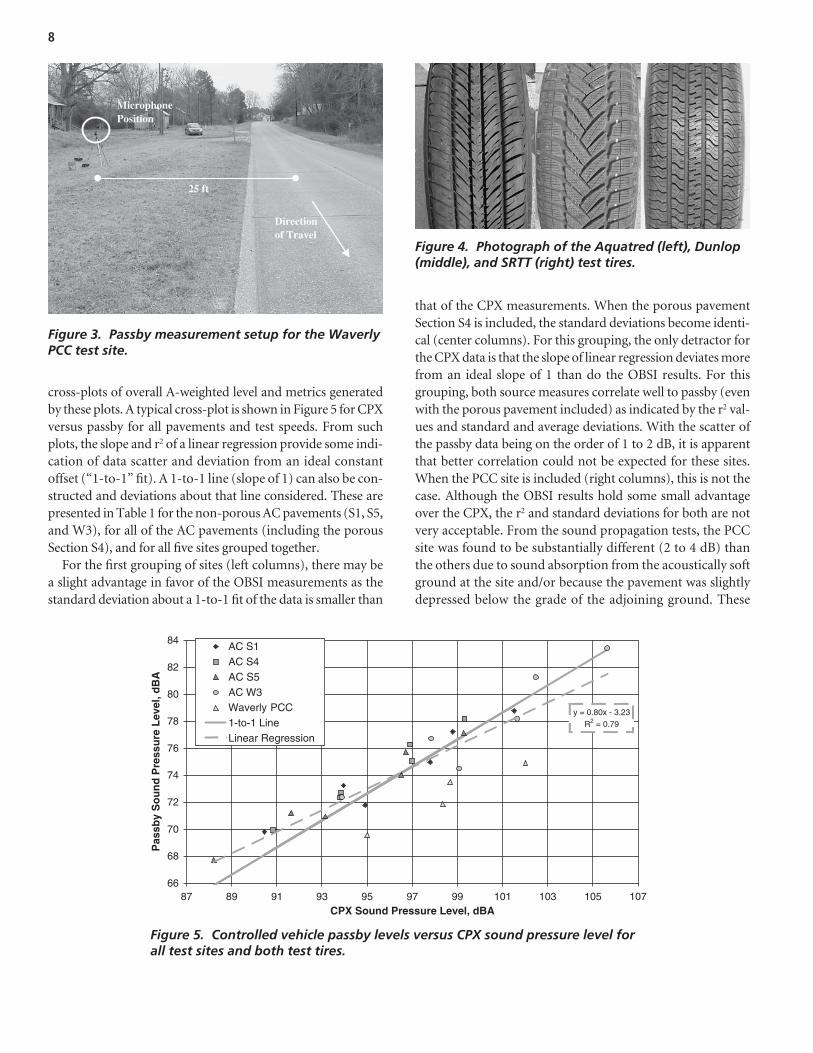
Three sets of tires were used for the testing (see Figure 4,details of the test tires are documented in Appendix B). One ofthese tires is the ASTM Standard Reference Test Tire (SRTT)(13), which is currently under study by the ISO WorkingGroup 33 as a possible new standard test tire for the ISO CPXprocedure. Another tire was a Dunlop SP Winter Sport M3.This tire has been used in round-robin testing conducted bytire and vehicle manufacturers and was chosen by that groupas a replacement for a light truck tire due to its more aggressivetread pattern. The size of both tire types was P225/60R16. Thethird tire design was the Goodyear Aquatred 3 in a P205/70R15size. This tire design has been extensively used by a number ofresearchers since 2000. Due to tire and wheel size incompati-bility, comparable passby measurements for the Aquatred tirecould not be made. However, CPX and OBSI measurementswere conducted at all of the test sites for all three tire designs toprovide a linkage to the historical Aquatred data.
Summary of the CPX and OBSI Test Results
For the test evaluation of the CPX and OBSI methods, theoverriding issue was how well the at-the-source measures cor-relate to passby data. The simplest way to compare the CPXand OBSI measurements to the passby data is to consider the
C H A P T E R 3
Evaluation of Alternative Test Methods
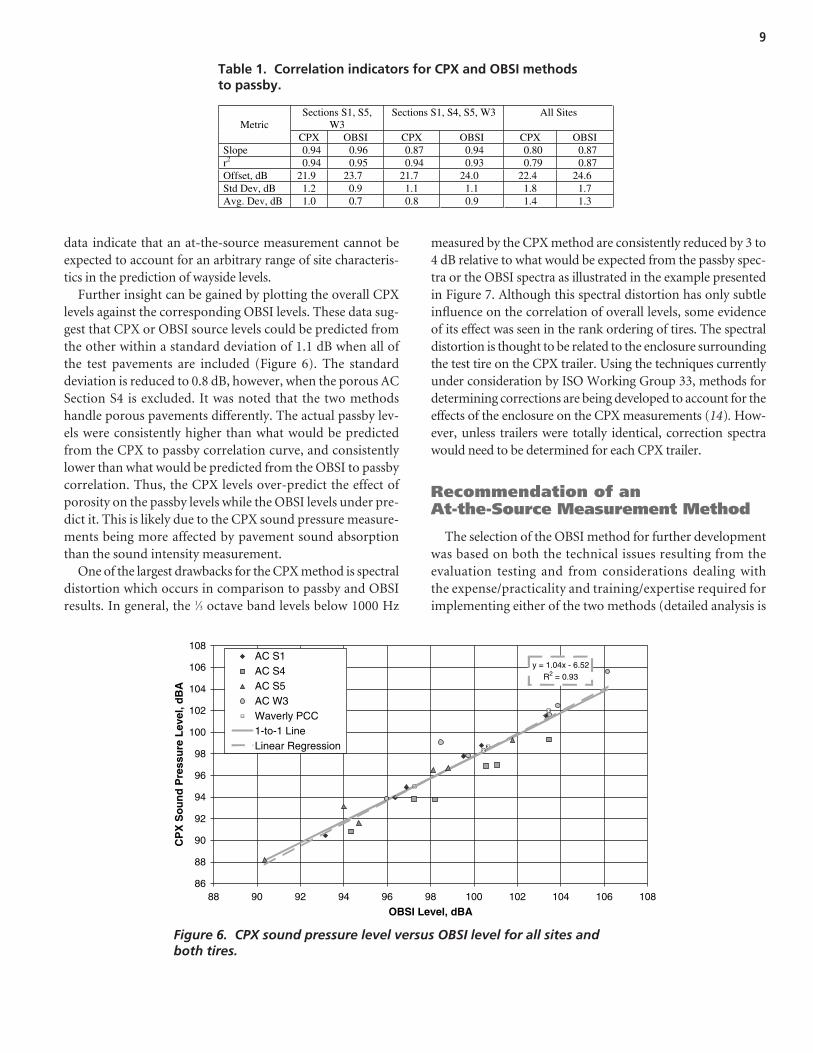
cross-plots of overall A-weighted level and metrics generatedby these plots. A typical cross-plot is shown in Figure 5 for CPXversus passby for all pavements and test speeds. From suchplots, the slope and r2 of a linear regression provide some indi-cation of data scatter and deviation from an ideal constantoffset (“1-to-1” fit). A 1-to-1 line (slope of 1) can also be con-structed and deviations about that line considered. These arepresented in Table 1 for the non-porous AC pavements (S1, S5,and W3), for all of the AC pavements (including the porousSection S4), and for all five sites grouped together.
For the first grouping of sites (left columns), there may bea slight advantage in favor of the OBSI measurements as thestandard deviation about a 1-to-1 fit of the data is smaller than
that of the CPX measurements. When the porous pavementSection S4 is included, the standard deviations become identi-cal (center columns). For this grouping, the only detractor forthe CPX data is that the slope of linear regression deviates morefrom an ideal slope of 1 than do the OBSI results. For thisgrouping, both source measures correlate well to passby (evenwith the porous pavement included) as indicated by the r2 val-ues and standard and average deviations. With the scatter ofthe passby data being on the order of 1 to 2 dB, it is apparentthat better correlation could not be expected for these sites.When the PCC site is included (right columns), this is not thecase. Although the OBSI results hold some small advantageover the CPX, the r2 and standard deviations for both are notvery acceptable. From the sound propagation tests, the PCCsite was found to be substantially different (2 to 4 dB) thanthe others due to sound absorption from the acoustically softground at the site and/or because the pavement was slightlydepressed below the grade of the adjoining ground. These
8
Figure 3. Passby measurement setup for the WaverlyPCC test site.
Figure 4. Photograph of the Aquatred (left), Dunlop(middle), and SRTT (right) test tires.
Figure 5. Controlled vehicle passby levels versus CPX sound pressure level forall test sites and both test tires.
25 ft
Direction of Travel
Microphone Position
y = 0.80x - 3.23 R2 = 0.79
66
68
70
72
74
76
78
80
82
84
87 89 91 93 95 97 99 101 103 105 107CPX Sound Pressure Level, dBA
Pas
sby
So
un
d P
ress
ure
Lev
el, d
BA
AC S1 AC S4 AC S5 AC W3 Waverly PCC 1-to-1 Line Linear Regression
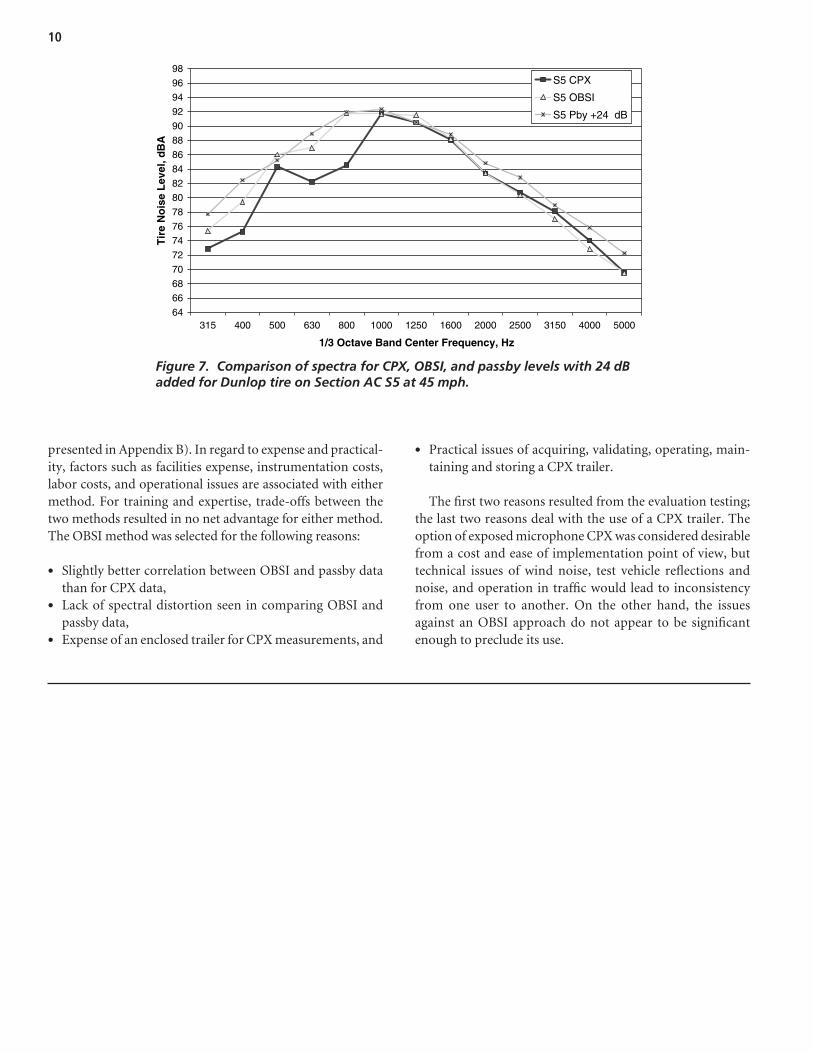
measured by the CPX method are consistently reduced by 3 to4 dB relative to what would be expected from the passby spec-tra or the OBSI spectra as illustrated in the example presentedin Figure 7. Although this spectral distortion has only subtleinfluence on the correlation of overall levels, some evidenceof its effect was seen in the rank ordering of tires. The spectraldistortion is thought to be related to the enclosure surroundingthe test tire on the CPX trailer. Using the techniques currentlyunder consideration by ISO Working Group 33, methods fordetermining corrections are being developed to account for theeffects of the enclosure on the CPX measurements (14). How-ever, unless trailers were totally identical, correction spectrawould need to be determined for each CPX trailer.
Recommendation of an At-the-Source Measurement Method
The selection of the OBSI method for further developmentwas based on both the technical issues resulting from theevaluation testing and from considerations dealing with the expense/practicality and training/expertise required forimplementing either of the two methods (detailed analysis is
9
Figure 6. CPX sound pressure level versus OBSI level for all sites and both tires.
Table 1. Correlation indicators for CPX and OBSI methods to passby.
data indicate that an at-the-source measurement cannot beexpected to account for an arbitrary range of site characteris-tics in the prediction of wayside levels.
Further insight can be gained by plotting the overall CPXlevels against the corresponding OBSI levels. These data sug-gest that CPX or OBSI source levels could be predicted fromthe other within a standard deviation of 1.1 dB when all ofthe test pavements are included (Figure 6). The standarddeviation is reduced to 0.8 dB, however, when the porous ACSection S4 is excluded. It was noted that the two methodshandle porous pavements differently. The actual passby lev-els were consistently higher than what would be predictedfrom the CPX to passby correlation curve, and consistentlylower than what would be predicted from the OBSI to passbycorrelation. Thus, the CPX levels over-predict the effect ofporosity on the passby levels while the OBSI levels under pre-dict it. This is likely due to the CPX sound pressure measure-ments being more affected by pavement sound absorptionthan the sound intensity measurement.
One of the largest drawbacks for the CPX method is spectraldistortion which occurs in comparison to passby and OBSIresults. In general, the 1⁄3 octave band levels below 1000 Hz
Sections S1, S5, W3
Sections S1, S4, S5, W3 All Sites Metric
CPX OBSI CPX OBSI CPX OBSISlope 0.94 0.96 0.87 0.94 0.80 0.87r2 0.94 0.95 0.94 0.93 0.79 0.87Offset, dB 21.9 23.7 21.7 24.0 22.4 24.6Std Dev, dB 1.2 0.9 1.1 1.1 1.8 1.7Avg. Dev, dB 1.0 0.7 0.8 0.9 1.4 1.3
86
88
90
92
94
96
98
100
102
104
106
108
88 90 92 94 96 98 100 102 104 106 108
OBSI Level, dBA
CP
X S
ou
nd
Pre
ssu
re L
evel
, dB
A
AC S1AC S4AC S5AC W3Waverly PCC1-to-1 LineLinear Regression
y = 1.04x - 6.52R2 = 0.93
presented in Appendix B). In regard to expense and practical-ity, factors such as facilities expense, instrumentation costs,labor costs, and operational issues are associated with eithermethod. For training and expertise, trade-offs between thetwo methods resulted in no net advantage for either method.The OBSI method was selected for the following reasons:
• Slightly better correlation between OBSI and passby datathan for CPX data,
• Lack of spectral distortion seen in comparing OBSI andpassby data,
• Expense of an enclosed trailer for CPX measurements, and
• Practical issues of acquiring, validating, operating, main-taining and storing a CPX trailer.
The first two reasons resulted from the evaluation testing;the last two reasons deal with the use of a CPX trailer. Theoption of exposed microphone CPX was considered desirablefrom a cost and ease of implementation point of view, buttechnical issues of wind noise, test vehicle reflections andnoise, and operation in traffic would lead to inconsistencyfrom one user to another. On the other hand, the issuesagainst an OBSI approach do not appear to be significantenough to preclude its use.
10
Figure 7. Comparison of spectra for CPX, OBSI, and passby levels with 24 dBadded for Dunlop tire on Section AC S5 at 45 mph.
64
66
68
70
72
74
76
78
80
82
84
86
88
90
92
94
96
98
315 400 500 630 800 1000 1250 1600 2000 2500 3150 4000 5000
1/3 Octave Band Center Frequency, Hz
Tir
e N
ois
e L
evel
, dB
A
S5 CPX
S5 OBSI
S5 Pby +24 dB
11
Introduction
As explained in Chapter 3, the OBSI method was selected asa basis for developing an onboard, at-the-source measure-ment procedure for tire-pavement noise. As a portion of thework conducted to develop such a procedure, test variables andmeasurement uncertainties were examined. Based on inputfrom current OBSI users as well as information contained inthe draft ISO CPX procedure, some pertinent variables thatcould affect the measurement results were identified. The sen-sitivity of OBSI results to variations in pavement temperature,the configuration of the OBSI measurement fixture, tire infla-tion pressure, test vehicle type, test speed, and load were inves-tigated. The intent of this investigation was to provide initialguidance on test variables and the control limits needed toimplement the OBSI procedure. This chapter summarizes theevaluation and results of the test parameter investigation andmakes recommendations on parameter limits and controls(additional information on the measurement sites and proto-col, along with a more detailed explanation of the results of thisanalysis, are provided in Appendix C).
Description of Field Measurements
Parameters Evaluated
Measurements were conducted to evaluate vehicle vari-ables and test execution variables on OBSI measurementresults. The test matrix is shown in Table 2.
Environmental variables, such as air and pavement temper-atures, wind conditions, and moisture conditions, could notbe systematically controlled for these tests. However, temper-ature and wind conditions were measured throughout, andtesting conducted over the extremes encountered was evalu-ated. All testing was conducted under dry conditions. Vehiclevariables, including loading, tire inflation pressure, andvehicle-to-vehicle variation, were evaluated systematically.Because of the time period of the testing, longer term variables
of tire wear and hardness were not evaluated and wheel align-ment was not evaluated except as it occurred from test vehicleto test vehicle. Test execution variables including probe loca-tion, run-to-run and day-to-day repeatability, probe configu-ration, small variations in test speed, and reproducibility werealso measured. Reproducibility across multiple users was notassessed.
Measurement Sites
The initial portion of this testing was conducted at Minnesota DOT’s MnROAD Low Volume Road facility inAlbertville, MN. This facility is a 2.5-mile closed loop thatcontains 20 pavement test sections. Two of these sections, afine textured AC and a random transversely tined PCC, wereselected as test surfaces. Due to an extended period of rain,testing was limited to the SRTT tire and only a portion of thetest matrix was completed. The remainder of the testing wasconducted at the General Motors Desert Proving Ground(DPG) in Mesa, AZ, on relatively smooth AC and exposedaggregate PCC test sections. The site location, photographs ofthe pavement sections, and the average 1⁄3 octave band spec-trum for each surface under baseline conditions are providedin Appendix C.
Measurement Protocol
The baseline test condition for each test pavement and testtire followed the measurement protocol presented in Attach-ment 1 using “full-sized” rental vehicles along with a baselineload consisting of two people and the OBSI instrumentation.A photograph of the OBSI equipment installed on a test vehi-cle is shown in Figure 8.
Ideally, the same test vehicle would have been used as thebaseline for all of the test scenarios. However, due to the relo-cation of the second portion of the testing, two different base-line vehicles were used. The test vehicle used at MnROAD
C H A P T E R 4
Evaluation of OBSI Test Parameters
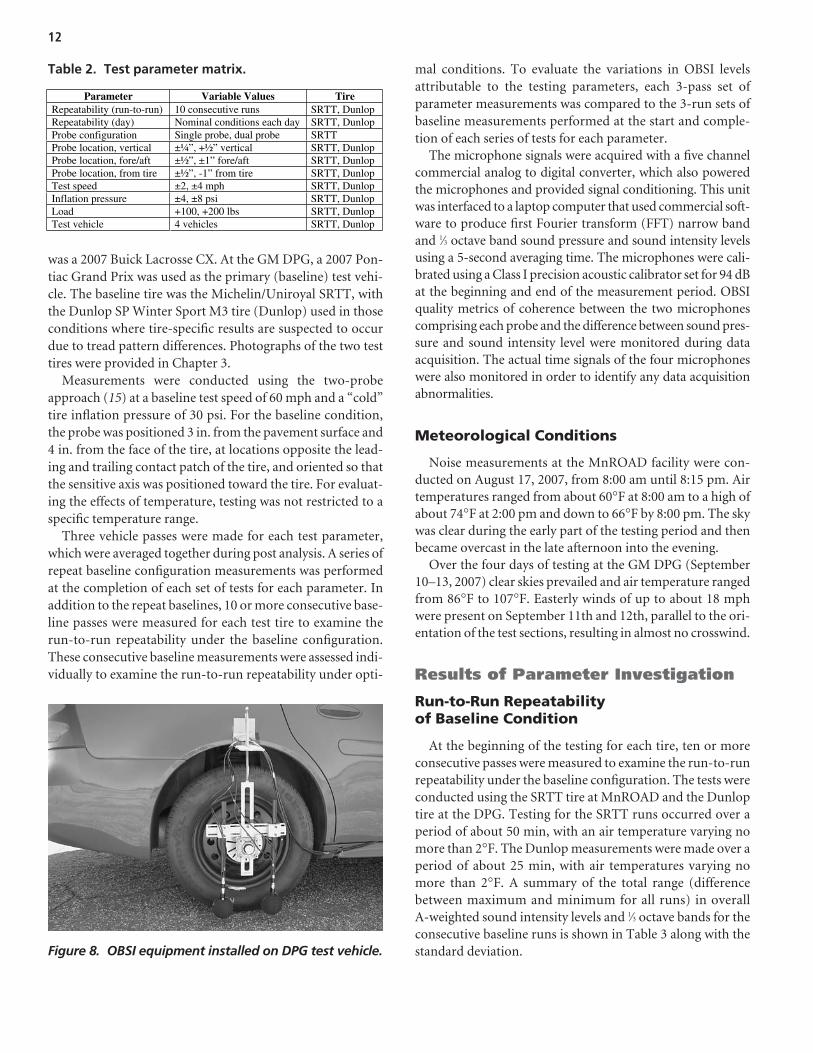
12
was a 2007 Buick Lacrosse CX. At the GM DPG, a 2007 Pon-tiac Grand Prix was used as the primary (baseline) test vehi-cle. The baseline tire was the Michelin/Uniroyal SRTT, withthe Dunlop SP Winter Sport M3 tire (Dunlop) used in thoseconditions where tire-specific results are suspected to occurdue to tread pattern differences. Photographs of the two testtires were provided in Chapter 3.
Measurements were conducted using the two-probeapproach (15) at a baseline test speed of 60 mph and a “cold”tire inflation pressure of 30 psi. For the baseline condition,the probe was positioned 3 in. from the pavement surface and4 in. from the face of the tire, at locations opposite the lead-ing and trailing contact patch of the tire, and oriented so thatthe sensitive axis was positioned toward the tire. For evaluat-ing the effects of temperature, testing was not restricted to aspecific temperature range.
Three vehicle passes were made for each test parameter,which were averaged together during post analysis. A series ofrepeat baseline configuration measurements was performedat the completion of each set of tests for each parameter. Inaddition to the repeat baselines, 10 or more consecutive base-line passes were measured for each test tire to examine therun-to-run repeatability under the baseline configuration.These consecutive baseline measurements were assessed indi-vidually to examine the run-to-run repeatability under opti-
mal conditions. To evaluate the variations in OBSI levelsattributable to the testing parameters, each 3-pass set ofparameter measurements was compared to the 3-run sets ofbaseline measurements performed at the start and comple-tion of each series of tests for each parameter.
The microphone signals were acquired with a five channelcommercial analog to digital converter, which also poweredthe microphones and provided signal conditioning. This unitwas interfaced to a laptop computer that used commercial soft-ware to produce first Fourier transform (FFT) narrow bandand 1⁄3 octave band sound pressure and sound intensity levelsusing a 5-second averaging time. The microphones were cali-brated using a Class I precision acoustic calibrator set for 94 dBat the beginning and end of the measurement period. OBSIquality metrics of coherence between the two microphonescomprising each probe and the difference between sound pres-sure and sound intensity level were monitored during dataacquisition. The actual time signals of the four microphoneswere also monitored in order to identify any data acquisitionabnormalities.
Meteorological Conditions
Noise measurements at the MnROAD facility were con-ducted on August 17, 2007, from 8:00 am until 8:15 pm. Airtemperatures ranged from about 60°F at 8:00 am to a high ofabout 74°F at 2:00 pm and down to 66°F by 8:00 pm. The skywas clear during the early part of the testing period and thenbecame overcast in the late afternoon into the evening.
Over the four days of testing at the GM DPG (September10–13, 2007) clear skies prevailed and air temperature rangedfrom 86°F to 107°F. Easterly winds of up to about 18 mphwere present on September 11th and 12th, parallel to the ori-entation of the test sections, resulting in almost no crosswind.
Results of Parameter Investigation
Run-to-Run Repeatability of Baseline Condition
At the beginning of the testing for each tire, ten or moreconsecutive passes were measured to examine the run-to-runrepeatability under the baseline configuration. The tests wereconducted using the SRTT tire at MnROAD and the Dunloptire at the DPG. Testing for the SRTT runs occurred over aperiod of about 50 min, with an air temperature varying nomore than 2°F. The Dunlop measurements were made over aperiod of about 25 min, with air temperatures varying nomore than 2°F. A summary of the total range (differencebetween maximum and minimum for all runs) in overall A-weighted sound intensity levels and 1⁄3 octave bands for theconsecutive baseline runs is shown in Table 3 along with thestandard deviation.Figure 8. OBSI equipment installed on DPG test vehicle.
Table 2. Test parameter matrix.
Parameter Variable Values TireRepeatability (run-to-run) 10 consecutive runs SRTT, Dunlop Repeatability (day) Nominal conditions each day SRTT, Dunlop Probe configuration Single probe, dual probe SRTT Probe location, vertical ±¼”, +½” vertical SRTT, Dunlop Probe location, fore/aft ±½”, ±1” fore/aft SRTT, Dunlop Probe location, from tire ±½”, -1” from tire SRTT, Dunlop Test speed ±2, ±4 mph SRTT, Dunlop Inflation pressure ±4, ±8 psi SRTT, Dunlop Load +100, +200 lbs SRTT, Dunlop Test vehicle 4 vehicles SRTT, Dunlop
13
The total range in overall A-weighted OBSI levels for theconsecutive baseline runs was 0.8 dB for the SRTT tire on boththe AC and PCC pavements. For the Dunlop tire, the range inlevel was 0.6 and 0.7 dB for the AC and PCC pavements,respectively. The baseline runs for this portion of the analysiswere made consecutively and no changes in the fixture config-uration or measurement protocol were made between runs. Asa result, the difference measured for the consecutive baselinescan be considered to be measurement uncertainty. WhereOBSI levels under different parameter values fall within thestandard deviation of the consecutive baselines, the changes innoise level cannot be reasonably attributed to changes in thegiven parameter because of this uncertainty.
Test Tire (SRTT versus Dunlop)
Data obtained using the SRTT and the Dunlop tires wereexamined using the baseline measurement results from theDPG, where both test tires were assessed on the same set ofpavements. Because baseline measurements were conducted
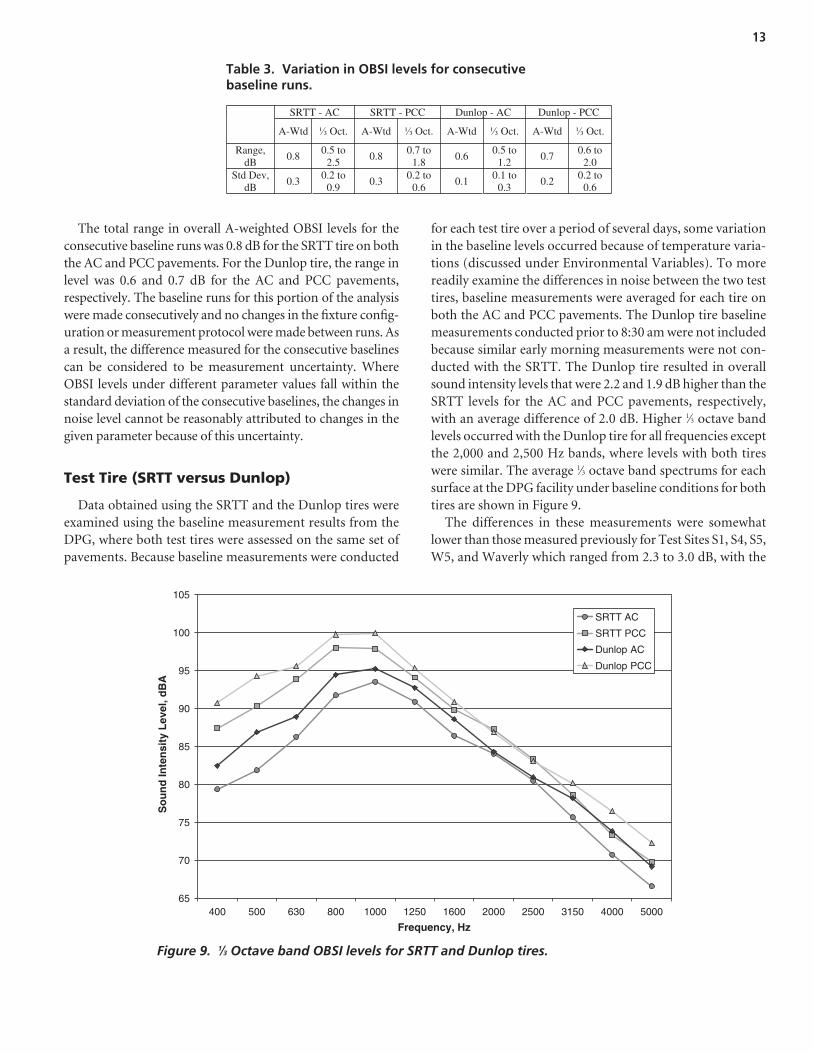
for each test tire over a period of several days, some variationin the baseline levels occurred because of temperature varia-tions (discussed under Environmental Variables). To morereadily examine the differences in noise between the two testtires, baseline measurements were averaged for each tire onboth the AC and PCC pavements. The Dunlop tire baselinemeasurements conducted prior to 8:30 am were not includedbecause similar early morning measurements were not con-ducted with the SRTT. The Dunlop tire resulted in overallsound intensity levels that were 2.2 and 1.9 dB higher than theSRTT levels for the AC and PCC pavements, respectively,with an average difference of 2.0 dB. Higher 1⁄3 octave bandlevels occurred with the Dunlop tire for all frequencies exceptthe 2,000 and 2,500 Hz bands, where levels with both tireswere similar. The average 1⁄3 octave band spectrums for eachsurface at the DPG facility under baseline conditions for bothtires are shown in Figure 9.
The differences in these measurements were somewhatlower than those measured previously for Test Sites S1, S4, S5,W5, and Waverly which ranged from 2.3 to 3.0 dB, with the
Table 3. Variation in OBSI levels for consecutive baseline runs.
Figure 9. 1⁄3 Octave band OBSI levels for SRTT and Dunlop tires.
SRTT - AC SRTT - PCC Dunlop - AC Dunlop - PCC
Oct. A-WtdA-Wtd Oct. A-Wtd Oct. A-Wtd Oct.
Range,dB
0.80.5 to
2.50.8
0.7 to 1.8
0.60.5 to
1.20.7
0.6 to 2.0
Std Dev, dB
0.30.2 to
0.90.3
0.2 to 0.6
0.10.1 to
0.30.2
0.2 to 0.6
65
70
75
80
85
90
95
100
105
40 0 5 00 630 80 0 1 00 0 1 25 0 1 600 2000 2500 3150 4000 500 0
Frequency, Hz
So
un
d In
ten
sity
Lev
el, d
BA
SRTT AC
SRTT PCC
Dunlop AC
Dunlop PCC
14
Dunlop producing higher levels than the SRTT. They were,however, similar to the differences found for the passby sites(see Chapter 5), which ranged from 0.9 dB to 3.1 dB with anaverage difference of 2.0 dB.
Environmental Variables
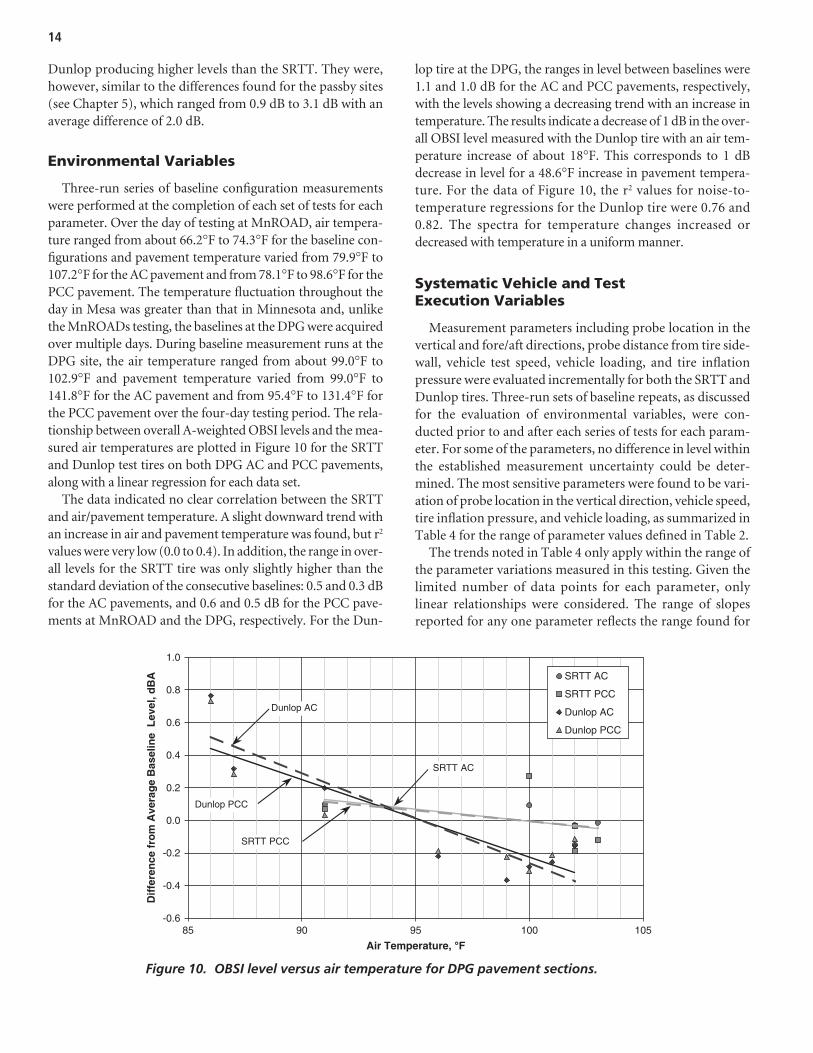
Three-run series of baseline configuration measurementswere performed at the completion of each set of tests for eachparameter. Over the day of testing at MnROAD, air tempera-ture ranged from about 66.2°F to 74.3°F for the baseline con-figurations and pavement temperature varied from 79.9°F to107.2°F for the AC pavement and from 78.1°F to 98.6°F for thePCC pavement. The temperature fluctuation throughout theday in Mesa was greater than that in Minnesota and, unlike the MnROADs testing, the baselines at the DPG were acquiredover multiple days. During baseline measurement runs at theDPG site, the air temperature ranged from about 99.0°F to102.9°F and pavement temperature varied from 99.0°F to141.8°F for the AC pavement and from 95.4°F to 131.4°F forthe PCC pavement over the four-day testing period. The rela-tionship between overall A-weighted OBSI levels and the mea-sured air temperatures are plotted in Figure 10 for the SRTTand Dunlop test tires on both DPG AC and PCC pavements,along with a linear regression for each data set.
The data indicated no clear correlation between the SRTTand air/pavement temperature. A slight downward trend withan increase in air and pavement temperature was found, but r2
values were very low (0.0 to 0.4). In addition, the range in over-all levels for the SRTT tire was only slightly higher than thestandard deviation of the consecutive baselines: 0.5 and 0.3 dBfor the AC pavements, and 0.6 and 0.5 dB for the PCC pave-ments at MnROAD and the DPG, respectively. For the Dun-
lop tire at the DPG, the ranges in level between baselines were1.1 and 1.0 dB for the AC and PCC pavements, respectively,with the levels showing a decreasing trend with an increase intemperature. The results indicate a decrease of 1 dB in the over-all OBSI level measured with the Dunlop tire with an air tem-perature increase of about 18°F. This corresponds to 1 dBdecrease in level for a 48.6°F increase in pavement tempera-ture. For the data of Figure 10, the r2 values for noise-to-temperature regressions for the Dunlop tire were 0.76 and0.82. The spectra for temperature changes increased ordecreased with temperature in a uniform manner.
Systematic Vehicle and Test Execution Variables
Measurement parameters including probe location in thevertical and fore/aft directions, probe distance from tire side-wall, vehicle test speed, vehicle loading, and tire inflationpressure were evaluated incrementally for both the SRTT andDunlop tires. Three-run sets of baseline repeats, as discussedfor the evaluation of environmental variables, were con-ducted prior to and after each series of tests for each param-eter. For some of the parameters, no difference in level withinthe established measurement uncertainty could be deter-mined. The most sensitive parameters were found to be vari-ation of probe location in the vertical direction, vehicle speed,tire inflation pressure, and vehicle loading, as summarized inTable 4 for the range of parameter values defined in Table 2.
The trends noted in Table 4 only apply within the range ofthe parameter variations measured in this testing. Given thelimited number of data points for each parameter, only linear relationships were considered. The range of slopesreported for any one parameter reflects the range found for
Figure 10. OBSI level versus air temperature for DPG pavement sections.
-0.6
-0.4
-0.2
0. 0
0. 2
0. 4
0. 6
0. 8
1. 0
85 90 95 100 105
Air Temperature, °°F
Dif
fere
nce
fro
m A
vera
ge
Bas
elin
e L
evel
, dB
A
SR TT AC
SR TT PC C
Dunlop AC
Dunlop PCC
Dunlop AC
Dunlop PCC
SR TT AC
SR TT PCC
15
specific tires and pavement (complete results are provided inAppendix C). There was a consistent downward trend innoise levels as the probe location was moved incrementallyfrom 1⁄4 in. below to 1⁄2 in. above the standard probe locationin the vertical direction (about 0.4 dB decrease in noise levelsper 1⁄4 in. of movement). For vehicle test speed, OBSI noiselevels increased with speed (by about 0.3 dB per 1 mph). Sim-ilarly, noise levels increased with an increase in the vehicleload (0.2 to 0.4 dB increase per 100 lb load increase). Forprobe location in the vertical direction and vehicle test speed,similar trends were indicated over both the AC and PCCpavements for both the SRTT and Dunlop test tires and thespectral characteristics of each pavement were maintained.Vehicle loading resulted in slightly lower increases on the ACpavement (and SRTT tire) than on the PCC pavement (andDunlop tire); there was a 0.2 dB increase per 100 lbs load forthe AC pavement, as compared to 0.3 and 0.4 dB increases forthe PCC pavement. The loading-related increases occurredprimarily in the frequencies below 1,000 Hz, although a smallincrease in the mid to high frequencies occurred on the ACsection.
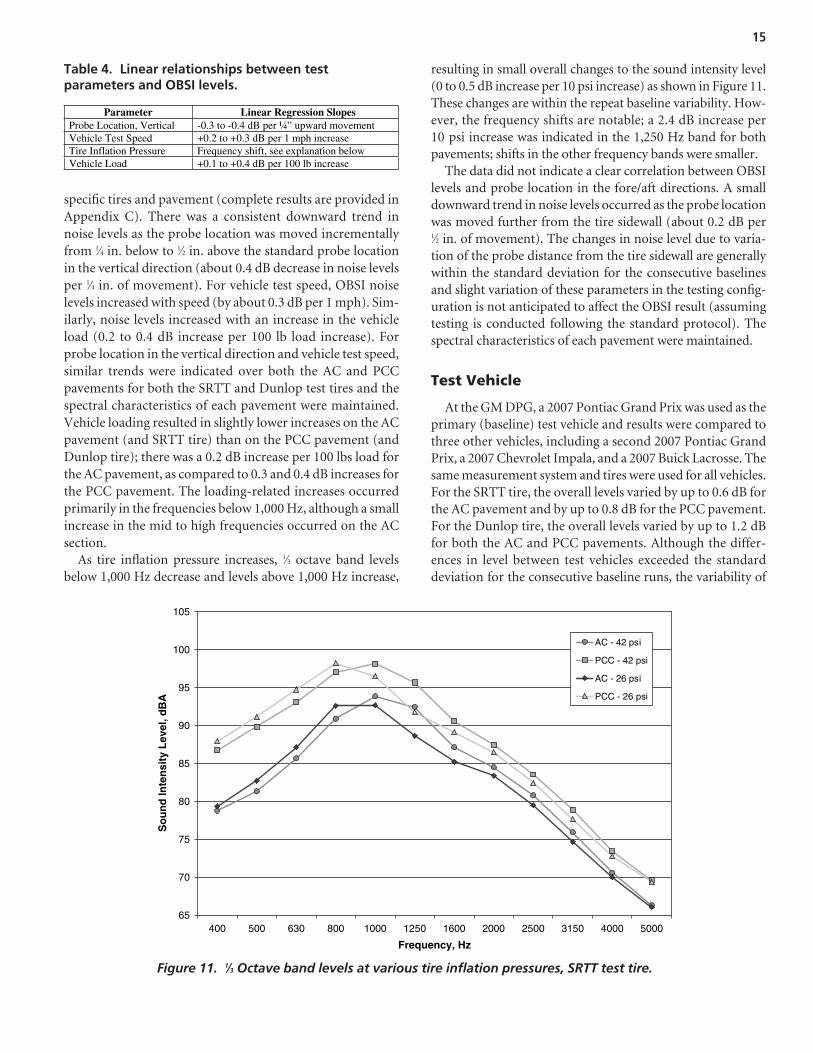
As tire inflation pressure increases, 1⁄3 octave band levelsbelow 1,000 Hz decrease and levels above 1,000 Hz increase,
resulting in small overall changes to the sound intensity level(0 to 0.5 dB increase per 10 psi increase) as shown in Figure 11.These changes are within the repeat baseline variability. How-ever, the frequency shifts are notable; a 2.4 dB increase per10 psi increase was indicated in the 1,250 Hz band for bothpavements; shifts in the other frequency bands were smaller.
The data did not indicate a clear correlation between OBSIlevels and probe location in the fore/aft directions. A smalldownward trend in noise levels occurred as the probe locationwas moved further from the tire sidewall (about 0.2 dB per 1⁄2 in. of movement). The changes in noise level due to varia-tion of the probe distance from the tire sidewall are generallywithin the standard deviation for the consecutive baselinesand slight variation of these parameters in the testing config-uration is not anticipated to affect the OBSI result (assumingtesting is conducted following the standard protocol). Thespectral characteristics of each pavement were maintained.
Test Vehicle
At the GM DPG, a 2007 Pontiac Grand Prix was used as theprimary (baseline) test vehicle and results were compared tothree other vehicles, including a second 2007 Pontiac GrandPrix, a 2007 Chevrolet Impala, and a 2007 Buick Lacrosse. Thesame measurement system and tires were used for all vehicles.For the SRTT tire, the overall levels varied by up to 0.6 dB forthe AC pavement and by up to 0.8 dB for the PCC pavement.For the Dunlop tire, the overall levels varied by up to 1.2 dBfor both the AC and PCC pavements. Although the differ-ences in level between test vehicles exceeded the standarddeviation for the consecutive baseline runs, the variability of
Table 4. Linear relationships between test parameters and OBSI levels.
Figure 11. 1⁄3 Octave band levels at various tire inflation pressures, SRTT test tire.
Parameter Linear Regression SlopesProbe Location, Vertical -0.3 to -0.4 dB per ¼” upward movement Vehicle Test Speed +0.2 to +0.3 dB per 1 mph increase Tire Inflation Pressure Frequency shift, see explanation below Vehicle Load +0.1 to +0.4 dB per 100 lb increase
65
70
75
80
85
90
95
100
105
400 500 630 800 1000 1250 1600 2000 2500 3150 4000 5000
Frequency, Hz
So
un
d In
ten
sity
Lev
el, d
BA
AC - 42 psi
PCC - 42 psi
AC - 26 psi
PCC - 26 psi
16
the environmental conditions was also considerably higher forthese runs. The differences between vehicle results can be attrib-uted to differences in temperature (discussed in this chapterunder Environmental Variables), which were more apparentwith the Dunlop tire. A considerable amount of time wasrequired to change tires and vehicles between measurementsets, resulting in notable air and pavement temperature dif-ferences between vehicle sets. Measurements conductedduring the morning period (prior to 9:30 am), when tem-peratures were 10.8°F to 12.6°F lower than during the latemorning and afternoon, resulted in the highest levels. Thetests conducted during midday (between 11:00 am and 4:00pm) using three vehicles yielded results within 0.5 dBA for boththe SRTT and Dunlop tires and similar spectral characteristics.Although the test vehicle variation did not produce substantialdifferences in OBSI levels, the same vehicle family, measure-ment system, and tires were used. Differences resulting from awider range of vehicle types, OBSI measurement equipment,and multiple test tires of the designs, were not evaluated.
Fixture Configuration (Single Probe versusDual Probe)
Single versus dual probe configurations were examined usingthe SRTT tire at the GM DPG site (photographs of the probeconfigurations are included in Appendix C). The comparisonof the probe configurations was made for test speeds of 45 and60 mph. At 45 mph, the dual probe produced levels that were0.1 dB to 0.5 dB lower for both pavements, while at 60 mph, thedual probe levels were 0.1 to 1.0 dB lower. These typically smalland varied differences in level are consistent with those reportedpreviously (14). The spectral shapes for both probes were verysimilar throughout the measured frequency range.
Data Quality Criteria
During the data acquisition, the coherence between the sig-nals from the two microphones comprising each probe and thedifference between sound pressure and sound intensity level(PI Index) were monitored and recorded for each 1⁄3 octaveband. Coherence is a measure of the linear dependency of twosignals with a value of 0 being no dependency, and a value of 1being perfect linear dependence (16). Mathematically, it is themagnitude of the cross-spectrum between two signals squareddivided the product of the auto-spectrum of both signals. Forsound intensity measurements made in flow such the OBSImeasurements, it is generally found that the data are contami-nated with flow noise when the coherence falls below 0.8 (15).With only a few exceptions, the coherence was greater than0.8 in all 1⁄3 octave bands from 400 to 4,000 Hz during theparameter measurements. In the 400 and 4,000 Hz bands,
slight decreases in coherence occurred at the DPG site in 4out of 578 runs when high temperatures caused equipmentoverloads and overheating (these data were discarded). Above4,000 Hz, coherence is typically lower due to limitations in thefinite difference approximation used in the algorithm fordetermining sound intensity (15). At the 5,000 Hz band, coher-ence was less than 0.8 for 38% of the parameter runs. The PIindex is also used as a data quality check. Generally, if the PIindex is above 5 dB, the measurement is contaminated by flownoise (14). In the parameter testing, the PI index was lessthan 5 dB in all 1⁄3 octave bands from 500 to 5,000 Hz. PI indexvalues for the trailing edge position occasionally exceeded 5 dBin the 400 Hz band (about 3% of the runs). Because the levelsin the 400 Hz 1⁄3 octave band were sufficiently low so as to haveminimal effect on the overall level, the 400 Hz band was notincluded if the PI index exceeded 5 dB.
Recommendations on Parameter Limits
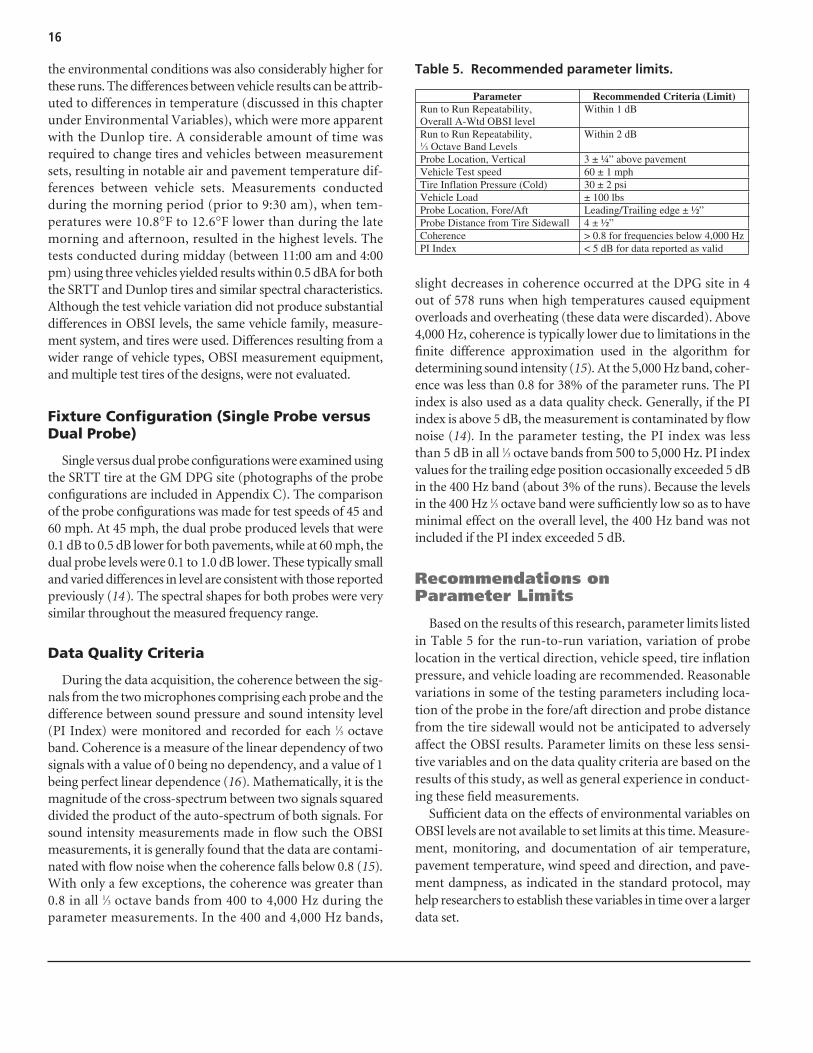
Based on the results of this research, parameter limits listedin Table 5 for the run-to-run variation, variation of probelocation in the vertical direction, vehicle speed, tire inflationpressure, and vehicle loading are recommended. Reasonablevariations in some of the testing parameters including loca-tion of the probe in the fore/aft direction and probe distancefrom the tire sidewall would not be anticipated to adverselyaffect the OBSI results. Parameter limits on these less sensi-tive variables and on the data quality criteria are based on theresults of this study, as well as general experience in conduct-ing these field measurements.
Sufficient data on the effects of environmental variables onOBSI levels are not available to set limits at this time. Measure-ment, monitoring, and documentation of air temperature,pavement temperature, wind speed and direction, and pave-ment dampness, as indicated in the standard protocol, mayhelp researchers to establish these variables in time over a largerdata set.
Table 5. Recommended parameter limits.
Parameter Recommended Criteria (Limit) Run to Run Repeatability, Overall A-Wtd OBSI level
Within 1 dB
Run to Run Repeatability, Octave Band Levels
Within 2 dB
Probe Location, Vertical 3 ± ¼” above pavement Vehicle Test speed 60 ± 1 mph Tire Inflation Pressure (Cold) 30 ± 2 psi Vehicle Load ± 100 lbs Probe Location, Fore/Aft Leading/Trailing edge ± ½” Probe Distance from Tire Sidewall 4 ± ½” Coherence > 0.8 for frequencies below 4,000 Hz PI Index < 5 dB for data reported as valid
17
Introduction
The investigation was conducted to demonstrate the abilityof the OBSI measurement method to quantify the relativeeffect of different pavement types in comparison to total vehi-cle noise emissions measured with the CPB and SPB methods.It included the simultaneous measurement of (1) OBSI on spe-cific candidate test tires, (2) controlled passbys on test vehiclesequipped with the test tires, and (3) statistical passbys of bothlight- and heavy-duty vehicles on in-service payments. Usingthe SPB data, the relationship between OBSI tire-pavementnoise and average vehicle noise emissions was examined forboth light vehicles and heavy trucks. To account for site-to-sitevariation, passby results were normalized using the measuredrelationships between OBSI and CPB levels for each site. Thischapter describes the measurements performed, the results ofthe OBSI and passby testing, and the relationships between theOBSI and passby data.
Description of Field Measurements
Measurement Sites
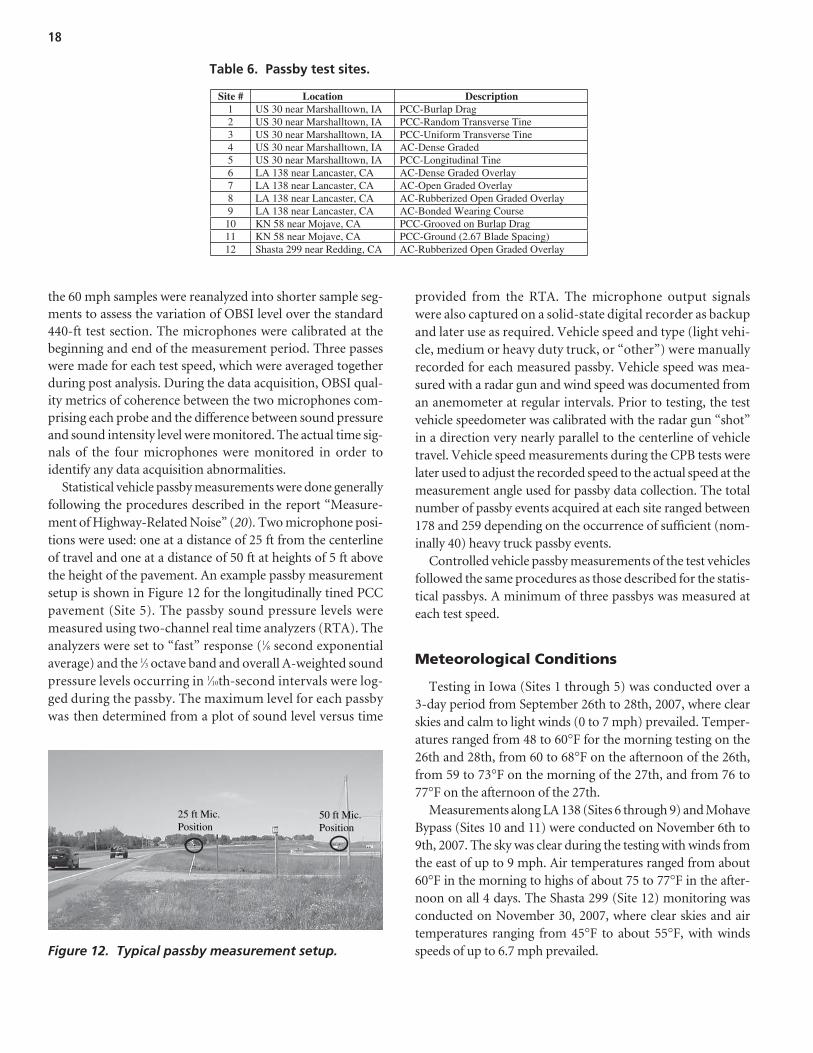
The OBSI and passby testing was conducted at a total of12 sites (five in Iowa and seven in California). The sites in Iowawere located along U.S. Highway 30 between mileposts 178 and198, near Marshalltown. Portions of this section of highwaywere recently constructed to include many different types ofsurface texturing (17). Along this section of highway, four sec-tions with different PCC texture were selected as test sites,including a burlap drag surface, a random transverse tinedsurface, a uniformly tined surface, and a longitudinally tinedsurface. In addition, a nearby hot-mix AC pavement sectionwas selected as a test site. In California, four of the Caltrans testsections on LA 138 (18), including DGAC, OGAC, rubber-ized, and bonded wearing course AC pavements were tested.Two PCC sections, a grooved and a ground pavement, on theCaltrans research sites on the Mojave Bypass (KN 58) (19)
were also tested. In addition, a highly porous rubberized ACpavement along Shasta 299, about 5 miles east of Redding wastested. The site location, photographs of the pavement sec-tions, and the average 1⁄3 octave band spectrum for each sur-face under baseline conditions are provided in Appendix D.
All test sites followed the applicable criteria stipulated in theFHWA document on highway noise measurement (20) andthe ISO 11819-1 procedure (21). To the degree reasonable, siteswere selected to have acoustically hard (non-sound absorb-ing) surface characteristics between the vehicle lane of traveland at least half of the distance to the 25-ft microphone fol-lowing the ISO recommendation. Because the ISO procedureonly addresses 25-ft distances, the FHWA criteria were used forthe 50-ft microphone positions. To obtain comparable results,sites were selected along roadways where the posted and typi-cal vehicle speeds were 55 mph or higher. The designation,location, and description of each of the test sites are listed inTable 6 (details of these sites are also provided in Appendix D).
Measurement Protocol
OBSI and controlled passby measurements were conductedusing the 2007 Pontiac Grand Prix and the 2007 ChevroletImpala with Michelin/Uniroyal SRTT and Dunlop SP WinterSport M3 tires (Dunlop). The OBSI measurements followedthe measurement protocol discussed for the parameter inves-tigation using the two-probe approach (2) with a vehicle loadconsisting of two people and the OBSI instrumentation. Mea-surements were conducted at 60 mph and at test speeds vary-ing from 50 to 70 mph, in 5-mph increments, depending onthe typical speed of on-road vehicles, in order to match thespeeds of the SPB measurements. The microphone signals wereacquired using the same instrumentation and data analysis sys-tem described in Chapter 4. A standard 5-second averagingtime was used for test Sites 1 through 9 and 12; a 4-secondaveraging time was used for Sites 10 and 11 because of theshorter lengths of pavement sections. During post-analysis,
C H A P T E R 5
Demonstration Testing of OBSI Procedure
18
the 60 mph samples were reanalyzed into shorter sample seg-ments to assess the variation of OBSI level over the standard440-ft test section. The microphones were calibrated at thebeginning and end of the measurement period. Three passeswere made for each test speed, which were averaged togetherduring post analysis. During the data acquisition, OBSI qual-ity metrics of coherence between the two microphones com-prising each probe and the difference between sound pressureand sound intensity level were monitored. The actual time sig-nals of the four microphones were monitored in order toidentify any data acquisition abnormalities.
Statistical vehicle passby measurements were done generallyfollowing the procedures described in the report “Measure-ment of Highway-Related Noise” (20). Two microphone posi-tions were used: one at a distance of 25 ft from the centerlineof travel and one at a distance of 50 ft at heights of 5 ft abovethe height of the pavement. An example passby measurementsetup is shown in Figure 12 for the longitudinally tined PCCpavement (Site 5). The passby sound pressure levels weremeasured using two-channel real time analyzers (RTA). Theanalyzers were set to “fast” response (1⁄8 second exponentialaverage) and the 1⁄3 octave band and overall A-weighted soundpressure levels occurring in 1⁄10th-second intervals were log-ged during the passby. The maximum level for each passbywas then determined from a plot of sound level versus time
provided from the RTA. The microphone output signalswere also captured on a solid-state digital recorder as backupand later use as required. Vehicle speed and type (light vehi-cle, medium or heavy duty truck, or “other”) were manuallyrecorded for each measured passby. Vehicle speed was mea-sured with a radar gun and wind speed was documented froman anemometer at regular intervals. Prior to testing, the testvehicle speedometer was calibrated with the radar gun “shot”in a direction very nearly parallel to the centerline of vehicletravel. Vehicle speed measurements during the CPB tests werelater used to adjust the recorded speed to the actual speed at themeasurement angle used for passby data collection. The totalnumber of passby events acquired at each site ranged between178 and 259 depending on the occurrence of sufficient (nom-inally 40) heavy truck passby events.
Controlled vehicle passby measurements of the test vehiclesfollowed the same procedures as those described for the statis-tical passbys. A minimum of three passbys was measured ateach test speed.
Meteorological Conditions
Testing in Iowa (Sites 1 through 5) was conducted over a3-day period from September 26th to 28th, 2007, where clearskies and calm to light winds (0 to 7 mph) prevailed. Temper-atures ranged from 48 to 60°F for the morning testing on the26th and 28th, from 60 to 68°F on the afternoon of the 26th,from 59 to 73°F on the morning of the 27th, and from 76 to77°F on the afternoon of the 27th.
Measurements along LA 138 (Sites 6 through 9) and MohaveBypass (Sites 10 and 11) were conducted on November 6th to9th, 2007. The sky was clear during the testing with winds fromthe east of up to 9 mph. Air temperatures ranged from about60°F in the morning to highs of about 75 to 77°F in the after-noon on all 4 days. The Shasta 299 (Site 12) monitoring wasconducted on November 30, 2007, where clear skies and airtemperatures ranging from 45°F to about 55°F, with windsspeeds of up to 6.7 mph prevailed.
Table 6. Passby test sites.
Figure 12. Typical passby measurement setup.
Site # Location Description1 US 30 near Marshalltown, IA PCC-Burlap Drag 2 US 30 near Marshalltown, IA PCC-Random Transverse Tine 3 US 30 near Marshalltown, IA PCC-Uniform Transverse Tine 4 US 30 near Marshalltown, IA AC-Dense Graded 5 US 30 near Marshalltown, IA PCC-Longitudinal Tine 6 LA 138 near Lancaster, CA AC-Dense Graded Overlay 7 LA 138 near Lancaster, CA AC-Open Graded Overlay 8 LA 138 near Lancaster, CA AC-Rubberized Open Graded Overlay 9 LA 138 near Lancaster, CA AC-Bonded Wearing Course 10 KN 58 near Mojave, CA PCC-Grooved on Burlap Drag 11 KN 58 near Mojave, CA PCC-Ground (2.67 Blade Spacing) 12 Shasta 299 near Redding, CA AC-Rubberized Open Graded Overlay
25 ft Mic.Position
50 ft Mic.Position
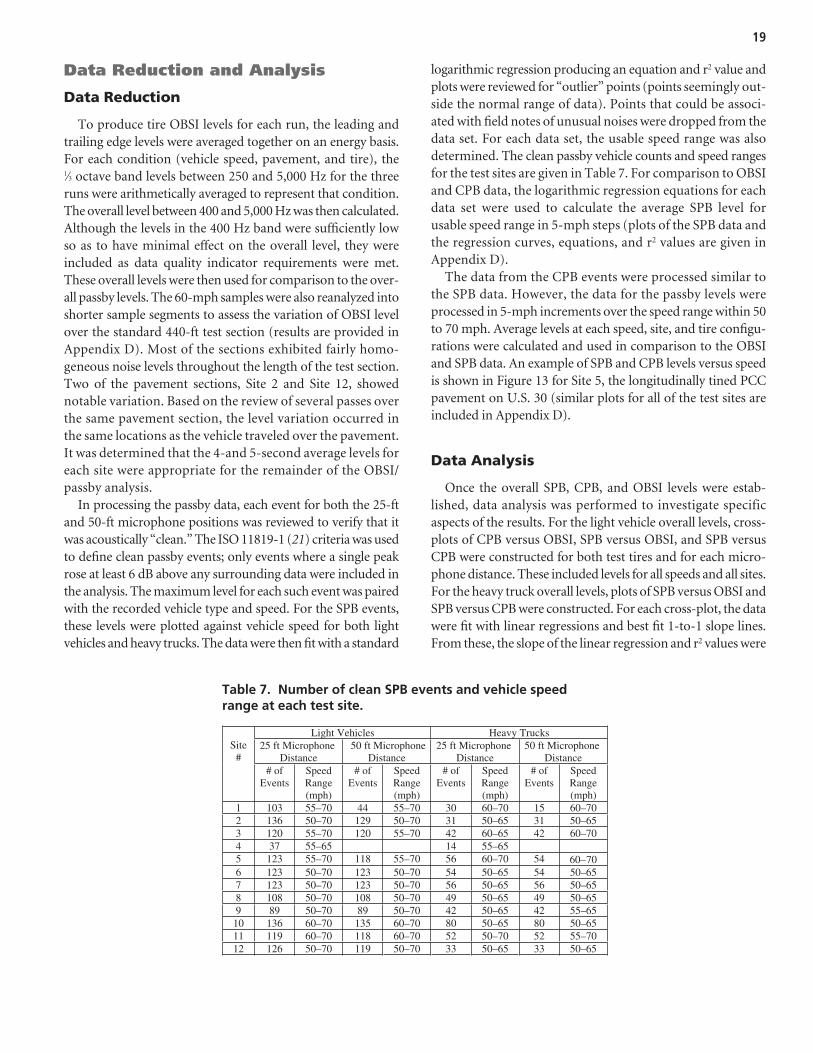
19
Data Reduction and Analysis
Data Reduction
To produce tire OBSI levels for each run, the leading andtrailing edge levels were averaged together on an energy basis.For each condition (vehicle speed, pavement, and tire), the 1⁄3 octave band levels between 250 and 5,000 Hz for the threeruns were arithmetically averaged to represent that condition.The overall level between 400 and 5,000 Hz was then calculated.Although the levels in the 400 Hz band were sufficiently low so as to have minimal effect on the overall level, they wereincluded as data quality indicator requirements were met.These overall levels were then used for comparison to the over-all passby levels. The 60-mph samples were also reanalyzed intoshorter sample segments to assess the variation of OBSI levelover the standard 440-ft test section (results are provided inAppendix D). Most of the sections exhibited fairly homo-geneous noise levels throughout the length of the test section.Two of the pavement sections, Site 2 and Site 12, showednotable variation. Based on the review of several passes overthe same pavement section, the level variation occurred inthe same locations as the vehicle traveled over the pavement.It was determined that the 4-and 5-second average levels foreach site were appropriate for the remainder of the OBSI/passby analysis.
In processing the passby data, each event for both the 25-ftand 50-ft microphone positions was reviewed to verify that itwas acoustically “clean.” The ISO 11819-1 (21) criteria was usedto define clean passby events; only events where a single peakrose at least 6 dB above any surrounding data were included inthe analysis. The maximum level for each such event was pairedwith the recorded vehicle type and speed. For the SPB events,these levels were plotted against vehicle speed for both lightvehicles and heavy trucks. The data were then fit with a standard
logarithmic regression producing an equation and r2 value andplots were reviewed for “outlier” points (points seemingly out-side the normal range of data). Points that could be associ-ated with field notes of unusual noises were dropped from thedata set. For each data set, the usable speed range was alsodetermined. The clean passby vehicle counts and speed rangesfor the test sites are given in Table 7. For comparison to OBSIand CPB data, the logarithmic regression equations for eachdata set were used to calculate the average SPB level forusable speed range in 5-mph steps (plots of the SPB data andthe regression curves, equations, and r2 values are given inAppendix D).
The data from the CPB events were processed similar tothe SPB data. However, the data for the passby levels wereprocessed in 5-mph increments over the speed range within 50to 70 mph. Average levels at each speed, site, and tire configu-rations were calculated and used in comparison to the OBSIand SPB data. An example of SPB and CPB levels versus speedis shown in Figure 13 for Site 5, the longitudinally tined PCCpavement on U.S. 30 (similar plots for all of the test sites areincluded in Appendix D).
Data Analysis
Once the overall SPB, CPB, and OBSI levels were estab-lished, data analysis was performed to investigate specificaspects of the results. For the light vehicle overall levels, cross-plots of CPB versus OBSI, SPB versus OBSI, and SPB versusCPB were constructed for both test tires and for each micro-phone distance. These included levels for all speeds and all sites.For the heavy truck overall levels, plots of SPB versus OBSI andSPB versus CPB were constructed. For each cross-plot, the datawere fit with linear regressions and best fit 1-to-1 slope lines.From these, the slope of the linear regression and r2 values were
Table 7. Number of clean SPB events and vehicle speedrange at each test site.
Light Vehicles Heavy Trucks 25 ft Microphone
Distance50 ft Microphone
Distance 25 ft Microphone
Distance 50 ft Microphone
Distance Site
# # of
Events Speed Range (mph)
# of Events
Speed Range (mph)
# of Events
Speed Range (mph)
# of Events
Speed Range (mph)
1 103 55–70 44 55–70 30 60–70 15 60–70 2 136 50–70 129 50–70 31 50–65 31 50–65 3 120 55–70 120 55–70 42 60–65 42 60–70 4 37 55–65 14 55–65 5 123 55–70 118 55–70 56 60–70 54 60 – 70 6 123 50–70 123 50–70 54 50–65 54 50–65 7 123 50–70 123 50–70 56 50–65 56 50–65 8 108 50–70 108 50–70 49 50–65 49 50–65 9 89 50–70 89 50–70 42 50–65 42 55–65 10 136 60–70 135 60–70 80 50–65 80 50–65 11 119 60–70 118 60–70 52 50–70 52 55–70 12 126 50–70 119 50–70 33 50–65 33 50–65
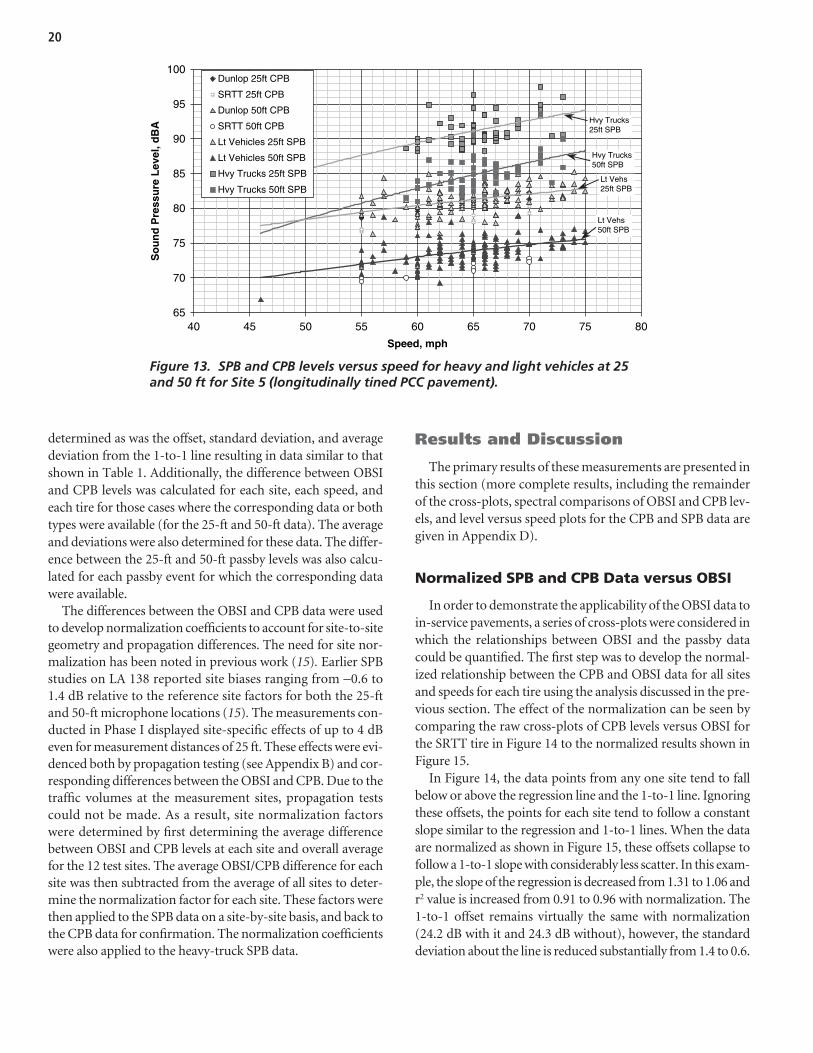
20
determined as was the offset, standard deviation, and averagedeviation from the 1-to-1 line resulting in data similar to thatshown in Table 1. Additionally, the difference between OBSIand CPB levels was calculated for each site, each speed, andeach tire for those cases where the corresponding data or bothtypes were available (for the 25-ft and 50-ft data). The averageand deviations were also determined for these data. The differ-ence between the 25-ft and 50-ft passby levels was also calcu-lated for each passby event for which the corresponding datawere available.
The differences between the OBSI and CPB data were usedto develop normalization coefficients to account for site-to-sitegeometry and propagation differences. The need for site nor-malization has been noted in previous work (15). Earlier SPBstudies on LA 138 reported site biases ranging from −0.6 to1.4 dB relative to the reference site factors for both the 25-ftand 50-ft microphone locations (15). The measurements con-ducted in Phase I displayed site-specific effects of up to 4 dBeven for measurement distances of 25 ft. These effects were evi-denced both by propagation testing (see Appendix B) and cor-responding differences between the OBSI and CPB. Due to thetraffic volumes at the measurement sites, propagation testscould not be made. As a result, site normalization factorswere determined by first determining the average differencebetween OBSI and CPB levels at each site and overall averagefor the 12 test sites. The average OBSI/CPB difference for eachsite was then subtracted from the average of all sites to deter-mine the normalization factor for each site. These factors werethen applied to the SPB data on a site-by-site basis, and back tothe CPB data for confirmation. The normalization coefficientswere also applied to the heavy-truck SPB data.
Results and Discussion
The primary results of these measurements are presented inthis section (more complete results, including the remainderof the cross-plots, spectral comparisons of OBSI and CPB lev-els, and level versus speed plots for the CPB and SPB data aregiven in Appendix D).
Normalized SPB and CPB Data versus OBSI
In order to demonstrate the applicability of the OBSI data toin-service pavements, a series of cross-plots were considered inwhich the relationships between OBSI and the passby datacould be quantified. The first step was to develop the normal-ized relationship between the CPB and OBSI data for all sitesand speeds for each tire using the analysis discussed in the pre-vious section. The effect of the normalization can be seen bycomparing the raw cross-plots of CPB levels versus OBSI forthe SRTT tire in Figure 14 to the normalized results shown inFigure 15.
In Figure 14, the data points from any one site tend to fallbelow or above the regression line and the 1-to-1 line. Ignoringthese offsets, the points for each site tend to follow a constantslope similar to the regression and 1-to-1 lines. When the dataare normalized as shown in Figure 15, these offsets collapse tofollow a 1-to-1 slope with considerably less scatter. In this exam-ple, the slope of the regression is decreased from 1.31 to 1.06 andr2 value is increased from 0.91 to 0.96 with normalization. The1-to-1 offset remains virtually the same with normalization(24.2 dB with it and 24.3 dB without), however, the standarddeviation about the line is reduced substantially from 1.4 to 0.6.
Figure 13. SPB and CPB levels versus speed for heavy and light vehicles at 25and 50 ft for Site 5 (longitudinally tined PCC pavement).
65
70
75
80
85
90
95
100
40 45 50 55 60 65 70 75 80
Speed, mph
So
un
d P
ress
ure
Lev
el, d
BA
Dunlop 25ft CPB
SRTT 25ft CPB
Dunlop 50ft CPB
SRTT 50ft CPB
Lt Vehicles 25ft SPB
Lt Vehicles 50ft SPB
Hvy Trucks 25ft SPB
Hvy Trucks 50ft SPB
Hvy Trucks25ft SPB
Hvy Trucks50ft SPB
Lt Vehs25ft SPB
Lt Vehs50ft SPB
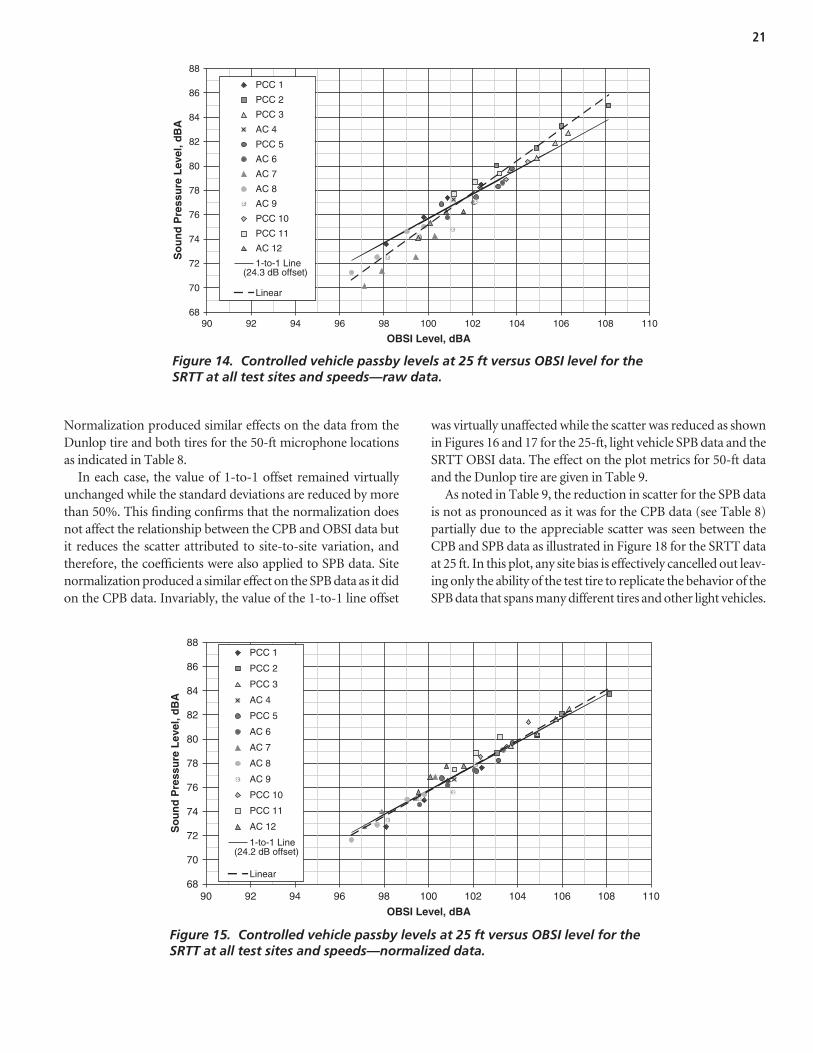
21
Normalization produced similar effects on the data from theDunlop tire and both tires for the 50-ft microphone locationsas indicated in Table 8.
In each case, the value of 1-to-1 offset remained virtuallyunchanged while the standard deviations are reduced by morethan 50%. This finding confirms that the normalization doesnot affect the relationship between the CPB and OBSI data butit reduces the scatter attributed to site-to-site variation, andtherefore, the coefficients were also applied to SPB data. Sitenormalization produced a similar effect on the SPB data as it didon the CPB data. Invariably, the value of the 1-to-1 line offset
was virtually unaffected while the scatter was reduced as shownin Figures 16 and 17 for the 25-ft, light vehicle SPB data and theSRTT OBSI data. The effect on the plot metrics for 50-ft dataand the Dunlop tire are given in Table 9.
As noted in Table 9, the reduction in scatter for the SPB datais not as pronounced as it was for the CPB data (see Table 8)partially due to the appreciable scatter was seen between theCPB and SPB data as illustrated in Figure 18 for the SRTT dataat 25 ft. In this plot, any site bias is effectively cancelled out leav-ing only the ability of the test tire to replicate the behavior of theSPB data that spans many different tires and other light vehicles.
Figure 14. Controlled vehicle passby levels at 25 ft versus OBSI level for theSRTT at all test sites and speeds—raw data.
Figure 15. Controlled vehicle passby levels at 25 ft versus OBSI level for theSRTT at all test sites and speeds—normalized data.
68
70
72
74
76
78
80
82
84
86
88
90 92 94 96 98 100 10 2 1 04 106 108 110
OBSI Level, dBA
So
un
d P
ress
ure
Lev
el, d
BA
PCC 1
PCC 2
PCC 3
AC 4
PCC 5
AC 6
AC 7
AC 8
AC 9
PCC 10
PCC 11
AC 12
1-to-1 Line
Linear
(24.3 dB offset)
68
70
72
74
76
78
80
82
84
86
88
90 92 94 96 98 100 102 10 4 1 06 108 110
OBSI Level, dBA
So
un
d P
ress
ure
Lev
el, d
BA
PCC 1
PCC 2
PCC 3
AC 4
PCC 5
AC 6
AC 7
AC 8
AC 9
PCC 10
PCC 11
AC 12
1-to-1 Line
Linear
(24.2 dB offset)
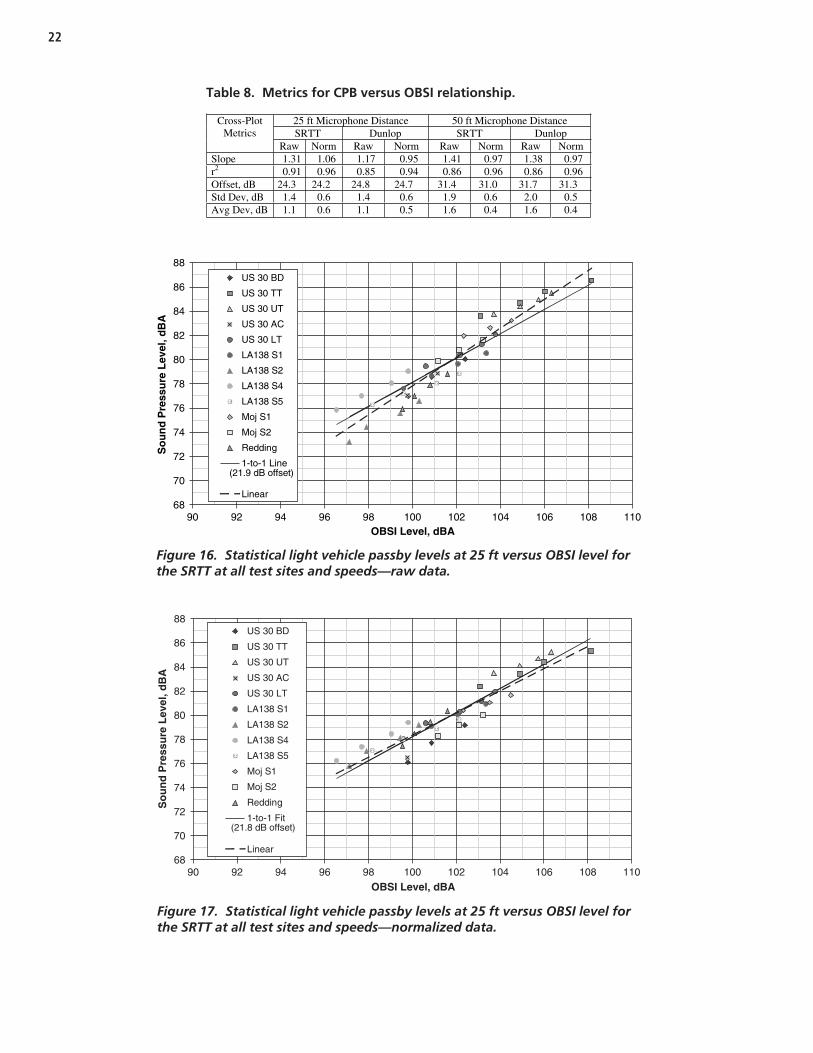
22
Figure 16. Statistical light vehicle passby levels at 25 ft versus OBSI level forthe SRTT at all test sites and speeds—raw data.
Figure 17. Statistical light vehicle passby levels at 25 ft versus OBSI level forthe SRTT at all test sites and speeds—normalized data.
Table 8. Metrics for CPB versus OBSI relationship.
25 ft Microphone Distance 50 ft Microphone Distance SRTT Dunlop SRTT Dunlop
Cross-PlotMetrics
Raw Norm Raw Norm Raw Norm Raw Norm Slope 1.31 1.06 1.17 0.95 1.41 0.97 1.38 0.97 r2 0.91 0.96 0.85 0.94 0.86 0.96 0.86 0.96 Offset, dB 24.3 24.2 24.8 24.7 31.4 31.0 31.7 31.3 Std Dev, dB 1.4 0.6 1.4 0.6 1.9 0.6 2.0 0.5 Avg Dev, dB 1.1 0.6 1.1 0.5 1.6 0.4 1.6 0.4
68
70
72
74
76
78
80
82
84
86
88
90 92 94 96 98 100 102 104 106 108 110OBSI Level, dBA
So
un
d P
ress
ure
Lev
el, d
BA
US 30 BD
US 30 TT
US 30 UT
US 30 AC
US 30 LT
LA138 S1
LA138 S2
LA138 S4
LA138 S5
Moj S1
Moj S2
Redding
1-to-1 Line
Linear
(21.9 dB offset)
68
70
72
74
76
78
80
82
84
86
88
90 92 94 96 98 100 102 104 106 108 110
OBSI Level, dBA
So
un
d P
ress
ure
Lev
el, d
BA
US 30 BD
US 30 TT
US 30 UT
US 30 AC
US 30 LT
LA138 S1
LA138 S2
LA138 S4
LA138 S5
Moj S1
Moj S2
Reddin g
1-to-1 Fi t
Linear
(21.8 dB offset)
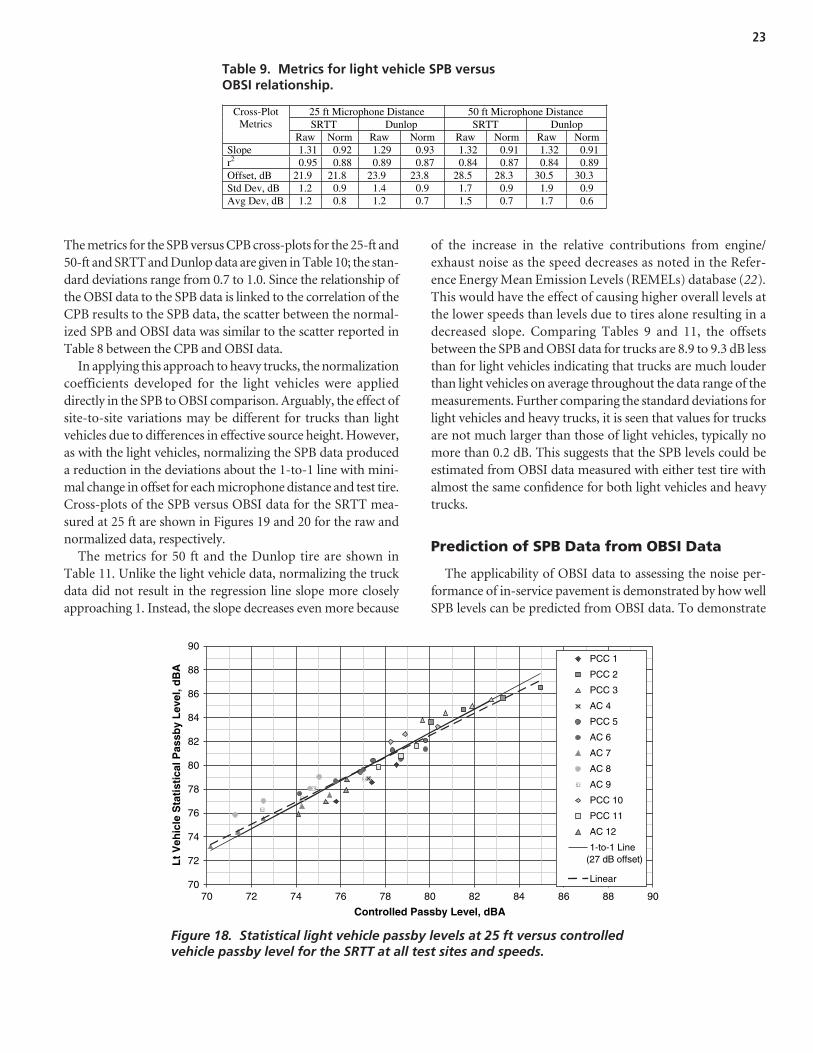
23
The metrics for the SPB versus CPB cross-plots for the 25-ft and50-ft and SRTT and Dunlop data are given in Table 10; the stan-dard deviations range from 0.7 to 1.0. Since the relationship ofthe OBSI data to the SPB data is linked to the correlation of theCPB results to the SPB data, the scatter between the normal-ized SPB and OBSI data was similar to the scatter reported in Table 8 between the CPB and OBSI data.
In applying this approach to heavy trucks, the normalizationcoefficients developed for the light vehicles were applieddirectly in the SPB to OBSI comparison. Arguably, the effect ofsite-to-site variations may be different for trucks than lightvehicles due to differences in effective source height. However,as with the light vehicles, normalizing the SPB data produceda reduction in the deviations about the 1-to-1 line with mini-mal change in offset for each microphone distance and test tire.Cross-plots of the SPB versus OBSI data for the SRTT mea-sured at 25 ft are shown in Figures 19 and 20 for the raw andnormalized data, respectively.
The metrics for 50 ft and the Dunlop tire are shown inTable 11. Unlike the light vehicle data, normalizing the truckdata did not result in the regression line slope more closelyapproaching 1. Instead, the slope decreases even more because
of the increase in the relative contributions from engine/exhaust noise as the speed decreases as noted in the Refer-ence Energy Mean Emission Levels (REMELs) database (22).This would have the effect of causing higher overall levels atthe lower speeds than levels due to tires alone resulting in adecreased slope. Comparing Tables 9 and 11, the offsetsbetween the SPB and OBSI data for trucks are 8.9 to 9.3 dB lessthan for light vehicles indicating that trucks are much louderthan light vehicles on average throughout the data range of themeasurements. Further comparing the standard deviations forlight vehicles and heavy trucks, it is seen that values for trucksare not much larger than those of light vehicles, typically nomore than 0.2 dB. This suggests that the SPB levels could beestimated from OBSI data measured with either test tire withalmost the same confidence for both light vehicles and heavytrucks.
Prediction of SPB Data from OBSI Data
The applicability of OBSI data to assessing the noise per-formance of in-service pavement is demonstrated by how wellSPB levels can be predicted from OBSI data. To demonstrate
Figure 18. Statistical light vehicle passby levels at 25 ft versus controlled vehicle passby level for the SRTT at all test sites and speeds.
Table 9. Metrics for light vehicle SPB versus OBSI relationship.
25 ft Microphone Distance 50 ft Microphone Distance SRTT Dunlop SRTT Dunlop
Cross-PlotMetrics
Raw Norm Raw Norm Raw Norm Raw Norm Slope 1.31 0.92 1.29 0.93 1.32 0.91 1.32 0.91 r2 0.95 0.88 0.89 0.87 0.84 0.87 0.84 0.89 Offset, dB 21.9 21.8 23.9 23.8 28.5 28.3 30.5 30.3 Std Dev, dB 1.2 0.9 1.4 0.9 1.7 0.9 1.9 0.9 Avg Dev, dB 1.2 0.8 1.2 0.7 1.5 0.7 1.7 0.6
70
72
74
76
78
80
82
84
86
88
90
70 72 74 76 78 80 82 84 86 88 90
Controlled Passby Level, dBA
Lt
Veh
icle
Sta
tist
ical
Pas
sby
Lev
el, d
BA
PCC 1
PCC 2
PCC 3
AC 4
PCC 5
AC 6
AC 7
AC 8
AC 9
PCC 10
PCC 11
AC 12
1-to-1 Line
Linear
(27 dB offset)
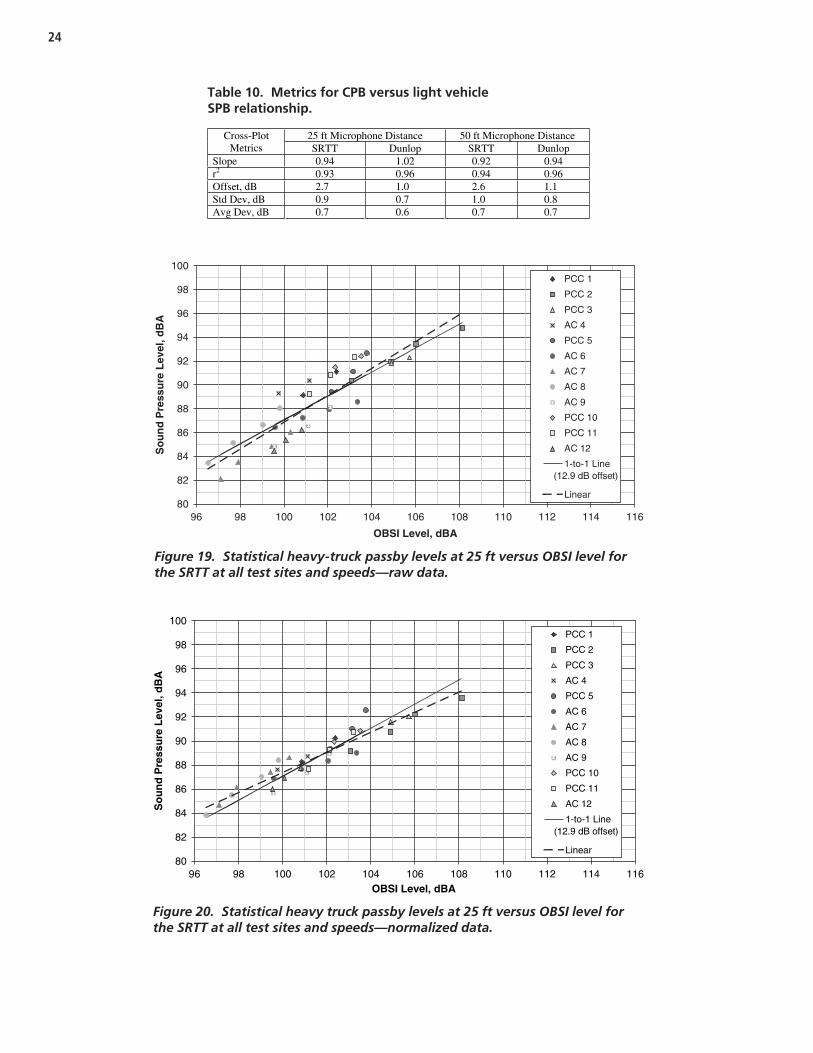
24
Figure 19. Statistical heavy-truck passby levels at 25 ft versus OBSI level forthe SRTT at all test sites and speeds—raw data.
Table 10. Metrics for CPB versus light vehicleSPB relationship.
Figure 20. Statistical heavy truck passby levels at 25 ft versus OBSI level forthe SRTT at all test sites and speeds—normalized data.
25 ft Microphone Distance 50 ft Microphone Distance Cross-PlotMetrics SRTT Dunlop SRTT Dunlop
Slope 0.94 1.02 0.92 0.94 r2 0.93 0.96 0.94 0.96 Offset, dB 2.7 1.0 2.6 1.1 Std Dev, dB 0.9 0.7 1.0 0.8 Avg Dev, dB 0.7 0.6 0.7 0.7
80
82
84
86
88
90
92
94
96
98
10 0
96 98 100 102 104 10 6 1 08 11 0 1 12 114 116
OBSI Level, dBA
So
un
d P
ress
ure
Lev
el, d
BA
PCC 1
PCC 2
PCC 3
AC 4
PCC 5
AC 6
AC 7
AC 8
AC 9
PCC 10
PCC 11
AC 12
1-to-1 Line
Linear
(12.9 dB offset)
80
82
84
86
88
90
92
94
96
98
100
96 98 100 102 104 106 108 110 112 114 116OBSI Level, dBA
So
un
d P
ress
ure
Lev
el, d
BA
PCC 1
PCC 2
PCC 3
AC 4
PCC 5
AC 6
AC 7
AC 8
AC 9
PCC 10
PCC 11
AC 12
1-to-1 Line
Linear
(12.9 dB offset)
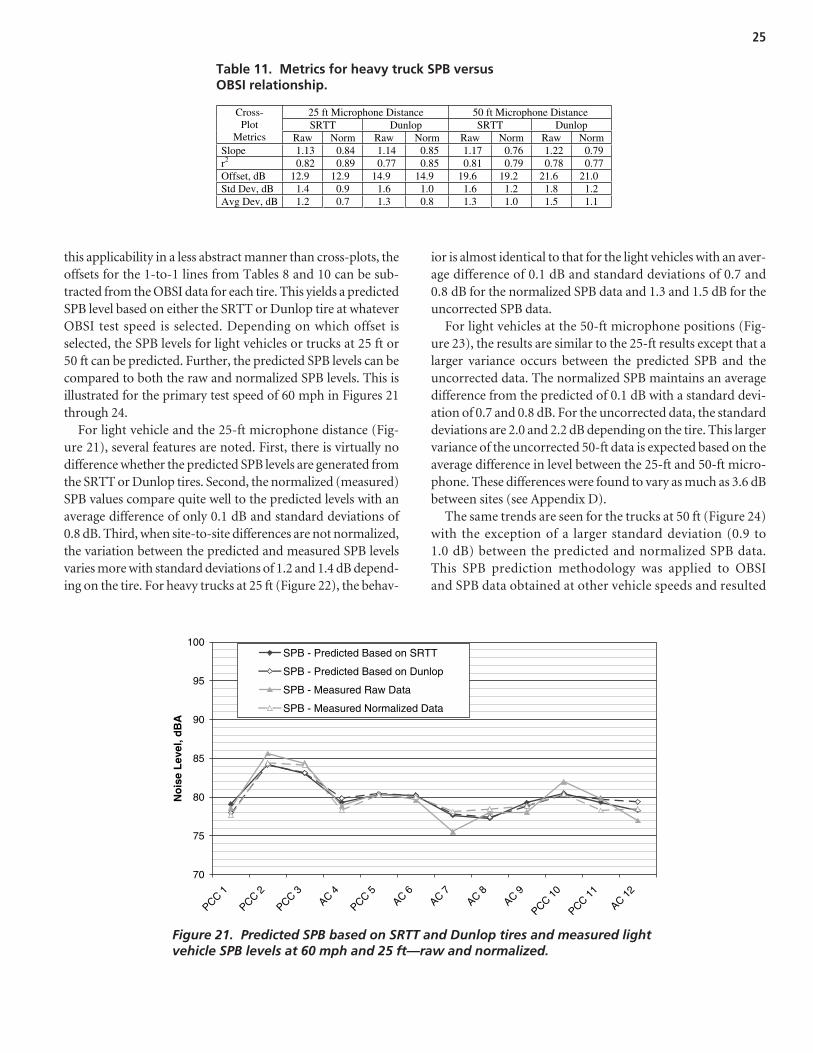
25
this applicability in a less abstract manner than cross-plots, theoffsets for the 1-to-1 lines from Tables 8 and 10 can be sub-tracted from the OBSI data for each tire. This yields a predictedSPB level based on either the SRTT or Dunlop tire at whateverOBSI test speed is selected. Depending on which offset isselected, the SPB levels for light vehicles or trucks at 25 ft or50 ft can be predicted. Further, the predicted SPB levels can becompared to both the raw and normalized SPB levels. This isillustrated for the primary test speed of 60 mph in Figures 21through 24.
For light vehicle and the 25-ft microphone distance (Fig-ure 21), several features are noted. First, there is virtually nodifference whether the predicted SPB levels are generated fromthe SRTT or Dunlop tires. Second, the normalized (measured)SPB values compare quite well to the predicted levels with anaverage difference of only 0.1 dB and standard deviations of 0.8 dB. Third, when site-to-site differences are not normalized,the variation between the predicted and measured SPB levelsvaries more with standard deviations of 1.2 and 1.4 dB depend-ing on the tire. For heavy trucks at 25 ft (Figure 22), the behav-
ior is almost identical to that for the light vehicles with an aver-age difference of 0.1 dB and standard deviations of 0.7 and0.8 dB for the normalized SPB data and 1.3 and 1.5 dB for theuncorrected SPB data.
For light vehicles at the 50-ft microphone positions (Fig-ure 23), the results are similar to the 25-ft results except that alarger variance occurs between the predicted SPB and theuncorrected data. The normalized SPB maintains an averagedifference from the predicted of 0.1 dB with a standard devi-ation of 0.7 and 0.8 dB. For the uncorrected data, the standarddeviations are 2.0 and 2.2 dB depending on the tire. This largervariance of the uncorrected 50-ft data is expected based on theaverage difference in level between the 25-ft and 50-ft micro-phone. These differences were found to vary as much as 3.6 dBbetween sites (see Appendix D).
The same trends are seen for the trucks at 50 ft (Figure 24)with the exception of a larger standard deviation (0.9 to 1.0 dB) between the predicted and normalized SPB data.This SPB prediction methodology was applied to OBSI and SPB data obtained at other vehicle speeds and resulted
Table 11. Metrics for heavy truck SPB versusOBSI relationship.
Figure 21. Predicted SPB based on SRTT and Dunlop tires and measured lightvehicle SPB levels at 60 mph and 25 ft—raw and normalized.
25 ft Microphone Distance 50 ft Microphone Distance SRTT Dunlop SRTT Dunlop
Cross-Plot
Metrics Raw Norm Raw Norm Raw Norm Raw Norm Slope 1.13 0.84 1.14 0.85 1.17 0.76 1.22 0.79 r2 0.82 0.89 0.77 0.85 0.81 0.79 0.78 0.77 Offset, dB 12.9 12.9 14.9 14.9 19.6 19.2 21.6 21.0 Std Dev, dB 1.4 0.9 1.6 1.0 1.6 1.2 1.8 1.2 Avg Dev, dB 1.2 0.7 1.3 0.8 1.3 1.0 1.5 1.1
70
75
80
85
90
95
100
PCC 1
PCC 2
PCC 3AC 4
PCC 5AC 6
AC 7AC 8
AC 9
PCC 10
PCC 11
AC 12
No
ise
Lev
el, d
BA
SPB - Predicted Based on SRTT
SPB - Predicted Based on Dunlop
SPB - Measured Raw Data
SPB - Measured Normalized Data
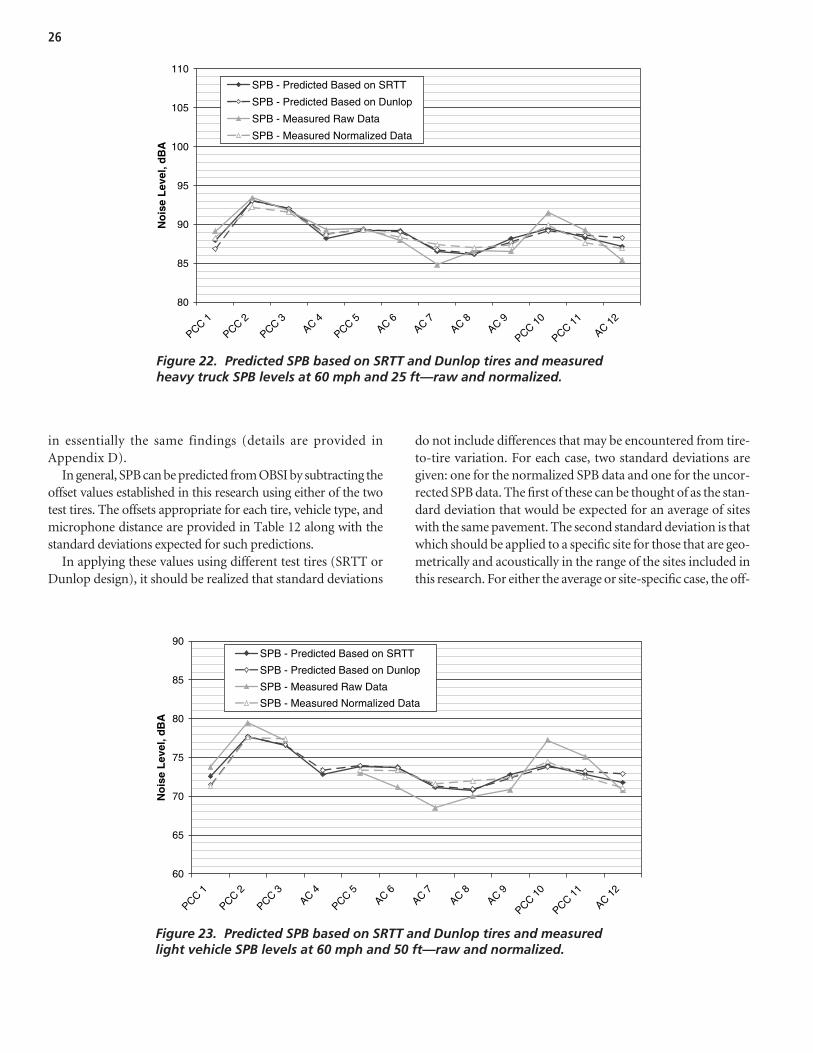
26
Figure 22. Predicted SPB based on SRTT and Dunlop tires and measuredheavy truck SPB levels at 60 mph and 25 ft—raw and normalized.
Figure 23. Predicted SPB based on SRTT and Dunlop tires and measuredlight vehicle SPB levels at 60 mph and 50 ft—raw and normalized.
in essentially the same findings (details are provided inAppendix D).
In general, SPB can be predicted from OBSI by subtracting theoffset values established in this research using either of the twotest tires. The offsets appropriate for each tire, vehicle type, andmicrophone distance are provided in Table 12 along with thestandard deviations expected for such predictions.
In applying these values using different test tires (SRTT orDunlop design), it should be realized that standard deviations
do not include differences that may be encountered from tire-to-tire variation. For each case, two standard deviations aregiven: one for the normalized SPB data and one for the uncor-rected SPB data. The first of these can be thought of as the stan-dard deviation that would be expected for an average of siteswith the same pavement. The second standard deviation is thatwhich should be applied to a specific site for those that are geo-metrically and acoustically in the range of the sites included inthis research. For either the average or site-specific case, the off-
80
85
90
95
100
105
110
PCC 1
PCC 2
PCC 3AC 4
PCC 5AC 6
AC 7AC 8
AC 9
PCC 10
PCC 11
AC 12
No
ise
Lev
el, d
BA
SPB - Predicted Based on SRTT
SPB - Predicted Based on Dunlop
SPB - Measured Raw Data
SPB - Measured Normalized Data
60
65
70
75
80
85
90
PCC 1
PCC 2
PCC 3AC 4
PCC 5AC 6
AC 7AC 8
AC 9
PCC 10
PCC 11
AC 12
No
ise
Lev
el, d
BA
SPB - Predicted Based on SRTT
SPB - Predicted Based on Dunlop
SPB - Measured Raw Data
SPB - Measured Normalized Data
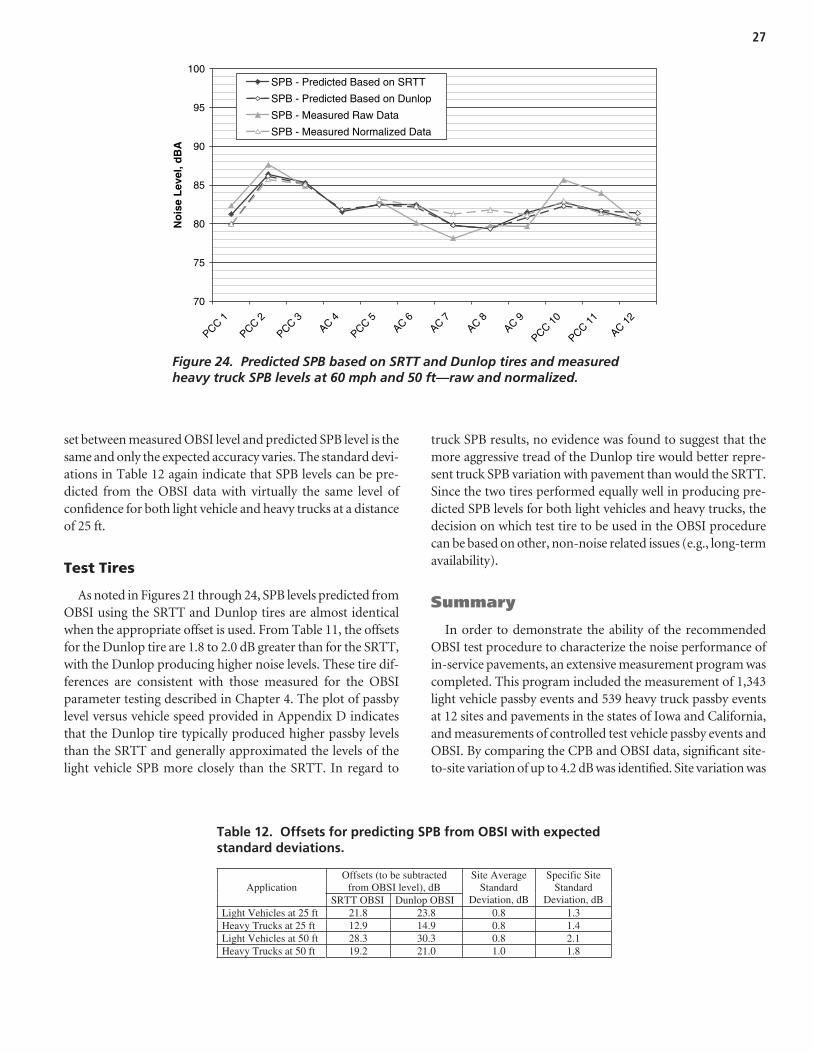
27
set between measured OBSI level and predicted SPB level is thesame and only the expected accuracy varies. The standard devi-ations in Table 12 again indicate that SPB levels can be pre-dicted from the OBSI data with virtually the same level ofconfidence for both light vehicle and heavy trucks at a distanceof 25 ft.
Test Tires
As noted in Figures 21 through 24, SPB levels predicted fromOBSI using the SRTT and Dunlop tires are almost identicalwhen the appropriate offset is used. From Table 11, the offsetsfor the Dunlop tire are 1.8 to 2.0 dB greater than for the SRTT,with the Dunlop producing higher noise levels. These tire dif-ferences are consistent with those measured for the OBSIparameter testing described in Chapter 4. The plot of passbylevel versus vehicle speed provided in Appendix D indicatesthat the Dunlop tire typically produced higher passby levelsthan the SRTT and generally approximated the levels of thelight vehicle SPB more closely than the SRTT. In regard to
truck SPB results, no evidence was found to suggest that themore aggressive tread of the Dunlop tire would better repre-sent truck SPB variation with pavement than would the SRTT.Since the two tires performed equally well in producing pre-dicted SPB levels for both light vehicles and heavy trucks, thedecision on which test tire to be used in the OBSI procedurecan be based on other, non-noise related issues (e.g., long-termavailability).
Summary
In order to demonstrate the ability of the recommendedOBSI test procedure to characterize the noise performance ofin-service pavements, an extensive measurement program wascompleted. This program included the measurement of 1,343light vehicle passby events and 539 heavy truck passby eventsat 12 sites and pavements in the states of Iowa and California,and measurements of controlled test vehicle passby events andOBSI. By comparing the CPB and OBSI data, significant site-to-site variation of up to 4.2 dB was identified. Site variation was
Figure 24. Predicted SPB based on SRTT and Dunlop tires and measuredheavy truck SPB levels at 60 mph and 50 ft—raw and normalized.
Table 12. Offsets for predicting SPB from OBSI with expectedstandard deviations.
70
75
80
85
90
95
100
PCC 1
PCC 2
PCC 3AC 4
PCC 5AC 6
AC 7AC 8
AC 9
PCC 10
PCC 11
AC 12
No
ise
Lev
el, d
BA
SPB - Predicted Based on SRTT
SPB - Predicted Based on Dunlop
SPB - Measured Raw Data
SPB - Measured Normalized Data
Offsets (to be subtracted from OBSI level), dB Application
SRTT OBSI Dunlop OBSI
Site Average Standard
Deviation, dB
Specific Site Standard
Deviation, dB Light Vehicles at 25 ft 21.8 23.8 0.8 1.3 Heavy Trucks at 25 ft 12.9 14.9 0.8 1.4 Light Vehicles at 50 ft 28.3 30.3 0.8 2.1 Heavy Trucks at 50 ft 19.2 21.0 1.0 1.8
28
also indicated by average differences of up to 3.7 dB betweenthe 25-ft and 50-ft passby levels cross the various sites. The siteinformation from the CPB and OBSI data was used to normal-ize the SPB to OBSI data and establish a 1-to-1 relationshipbetween them for each microphone distance and vehicle type.It was then demonstrated that these relationships could be usedto effectively predict SPB results based on OBSI data for theaverage of sites included in the field testing with a standarddeviation of 0.8 dB for both light vehicles and heavy trucks ata distance of 25 ft from the roadway. For 50 ft, a standarddeviation of 0.8 and 1.0 dB was maintained for light vehicles
and heavy trucks, respectively. Although the SRTT producedlower noise levels than the Dunlop test tire, essentially, no dif-ferences were found when using the data to predict SPB data.Some indication of noise sources other than tire-pavementwas found for heavy trucks, particularly at lower speeds (below∼60 mph) where engine/exhaust noise are expected to becomemore pronounced. However, the ability to predict SPB levelsfor heavy trucks from OBSI data alone was almost equal tothat for light vehicles. Also, no issues were discovered thatwould limit the use of the 25-ft microphone distance for heavytrucks.
29
Conclusions
Based on the research work completed in this project, theOBSI method was found to be the preferred approach fordeveloping an at-the-source tire-pavement noise test proce-dure. The CPX approach was not desired due to spectral dis-tortion observed relative to the passby data, a slightly lowerability to correlate with overall passby levels, practical con-cerns in the use of a CPX trailer or “facility,” and the expenseof acquiring and maintaining a CPX trailer. The two methodswere found, however, to correlate well with each other on anoverall level basis and one could be used to reliably estimatethe other, particularly after some initial calibration.
Site-to-site variation was found to be a significant issueaffecting the correlation between OBSI and passby measure-ments, as observed in sound propagation measurements. Inusing passby data to quantify pavement noise performance,more strict requirements on measurement sites need to beconsidered for direct comparison of data from different sites.Simultaneous OBSI and CPB measurements were found to bean effective means of identifying and quantifying site biases.
OBSI data can be used to predict SPB levels for light vehi-cles and heavy trucks using offsets applied to the OBSI levels.This yields predictions for an “average” site as defined by thesites tested in this research. Use of the offsets defined in thiswork should provide a reasonable estimate of passby levelsbased on measured OBSI levels. For specific sites of varyingproperties, greater variance could be expected between pre-dicted and measured levels, however, a better defined “aver-age” site would probably not help to reduce this uncertainty.
Consistent with the REMELs database (22), heavy truckswere found to be about 9 dB louder than light vehicles. Un-expectedly, the SPB levels for trucks could be almost as accu-rately predicted from OBSI data as it could for light vehicles.The analysis indicated that at lower speeds (i.e., 50 to 55 mph)some increase in noise level, which is not attributable to tire-pavement noise alone, occurs with trucks likely due to engine/exhaust noise. However, within a standard deviation of 1 dB,
truck SPB levels could be predicted even for 50 mph. Alsounexpected was the finding that the more aggressive “winter”Dunlop tire did not provide any better correlation to thetruck passby levels than the SRTT. This leads to the conclu-sion that changes in passby noise levels with pavement forheavy trucks can be fairly well predicted on the basis of tire-pavement levels alone at least for speeds of 50 mph and above.However, it is unclear why the levels are typically almost 10 dBhigher for trucks than light vehicles.
Within the uncertainty of site-to-site variation encoun-tered for non-porous pavements (Test Sites 1 through 11), theporous Test Site 12 did not display any unique behavior.The spectrum shape of the OBSI levels was unique relative tothe other sites and displayed the same shape as the porouspavement Test Site S4. As a result, the Test Site 12 pavementwould be expected to have similar sound-absorbing proper-ties as those documented for S4. However, much of the dif-ference between this pavement and the others appears to beaccounted for in the OBSI data. For Test Site 12, actual prop-agation over the porous pavement was quite limited; largereffects may be encountered for propagation over multiplelanes of sound-absorbing pavement.
In regard to the test tire, no overwhelming experimentalevidence was found to favor one tire over the other. The Dun-lop tire produced levels closer to those measured for the lightvehicle statistical passby events, however, both tires trackedequally well with the differences seen in the SPB data for dif-ferent pavements. Both tires displayed similar sensitivity totest variables in most cases. With the lack of a clear differencebased on acoustic performance, the selection of the test tirecan be made on the basis of other, non-noise related issues.
Recommendations
Based on the findings of this research, recommendationsfor the implementation and enhancement of the test proce-dure and other recommendations are provided.
C H A P T E R 6
Conclusions, Recommendations, and Suggested Research
Test Procedure Implementation and Enhancement
The test procedure provided in Attachment 1 is recom-mended for adoption as a national standard. To re-enforce theapplication of the findings of this research, technical presenta-tions should be made to professional organizations and thepavement industry and the results communicated to interestedgroups.
Although there was no technical preference for the SRTT,the SRTT should be specified as the primary test tire for theOBSI procedure because of its expected long-term availability;additional light passenger vehicle tire types such as winter tiresshould not be considered at this time. Periodically, the choiceof the SRTT in regard to issues that could not be investigatedin this research such as tire-to-tire variability and consistencyof noise generation over time should be reviewed. Initial inves-tigation of these issues has been recently reported in otherresearch that indicated minimal tire-to-tire variation and littledifference between new and used tires (23). These preliminaryfindings should be verified over a longer time period.
Effects of temperature were indicated to some degree in theparameter testing. However, the results were too limited todevelop any trends or potential corrections to account foreither air and/or pavement temperature. The effects of tem-perature should be investigated using the OBSI test proce-dure developed in this research, either through collectiveexperience of multiple users or directed research. Similarly,tire rubber hardness due to tire aging could not be addressedin the current research and should be further documented byusers of the recommended procedure. In the testing per-formed in this research, no adverse effects of ambient windconditions were noted on the OBSI data. However, recentwind tunnel testing (19) indicated that some effect may occurunder specific speed and cross wind conditions. Therefore, theeffect of ambient wind speed and direction should be moni-tored in future work to determine if testing should be restricteddue to wind conditions.
In order to establish the expected reproducibility of OBSImeasurements from one user to another, comparative “rodeo”testing should be done between users following the recom-mended procedure. This research focused on repeatability fora single user/measurement combination. In application, tire-to-tire, data acquisition system-to-system, and fixture-to-fixture variation may create a wider variance than this researchindicates. As an example, in this research, a small, but con-sistent difference (−0.3 to −0.6 dB) in OBSI level was notedbetween data taken with the horizontal single probe and verti-cal dual probe fixtures. In comparing one user’s implementa-tion of the OBSI procedure to another, such subtle differencesmay combine with other differences due to tires and instru-mentation to produce user biases on the order of 1 dB. Someother variables may require further specification in the pro-
cedure once differences are identified and understood. Thisrodeo testing should determine the reproducibility amongusers and the reasons for differences greater than 1 dB in over-all level.
In addition, issues such as the effect of roadway curvature,roadway grade, banking, roadside reflecting surfaces, and thepresence of other vehicles near the probe may be of concernbut are not currently documented. For undriven tires, curva-ture, grade, and banking may not be significant issues undermoderate conditions, however, they are currently undefinedin terms of actual data. Strict adherence to the data qualityindicators is recommended to avoid data that are influencedby the presence of sound-reflecting surfaces or nearby vehicles.
Other Recommendations
For SPB and CPB standard measurements, a 25-ft micro-phone distance from the center of the lane of vehicle travelshould be considered. Although even at this reduced distancesite-specific differences were found, the 50-ft distance intro-duced additional site-specific variation. Also, for the 25-ft dis-tance, clean passby events could be more easily acquired dueto the greater signal-to-noise ratio. No adverse effects forheavy truck passby events were noted in the measurements.
Current procedures for SPB should be further evaluated toidentify means to minimize site-specific effects. Proceduresfor SPB and CPB measurements should be developed forconsideration and adoption as a national standard.
The results of passby measurements obtained in this workshould be evaluated relative to the REMELs database to pro-vide insight into how to calibrate OBSI data to those data. Suchcalibration could facilitate using OBSI data in traffic noise pre-diction such as is done in the FHWA Traffic Noise Model.
Suggested Research
To enhance the results of this research the following topicsare suggested for further research:
• Investigations of the effects of temperature and wind con-ditions on OBSI measurement. This research will deter-mine temperature limits and/or correction factors as wellas limits for wind conditions.
• Investigations of the effect of porous (acoustically absorbing)pavement on sound propagation from the OBSI measure-ment point to wayside receiver locations and incorporationof such effects in traffic noise prediction models.
• Investigations of the effects of site-specific variables on SPBand CPB measurements to recommend limits for the moreimportant variables or otherwise site corrections.
• Development of procedures for CPB and SPB for consid-eration and adoption as a national standard.
30
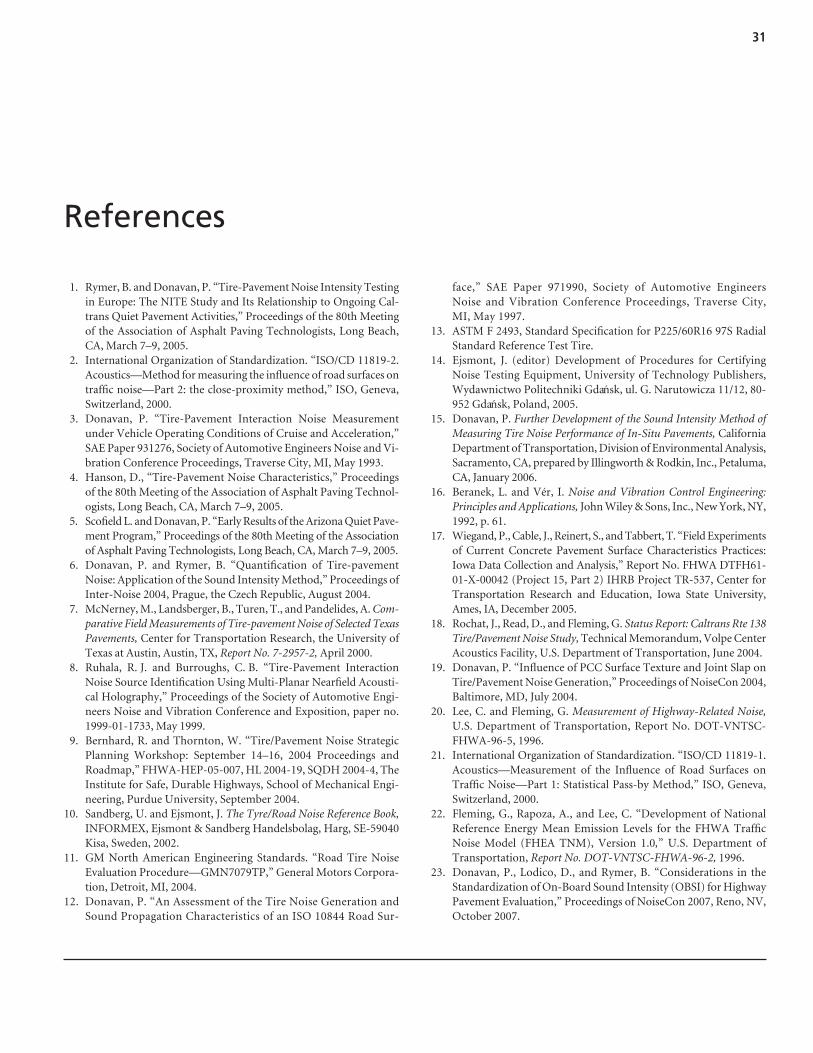
31
face,” SAE Paper 971990, Society of Automotive EngineersNoise and Vibration Conference Proceedings, Traverse City,MI, May 1997.
13. ASTM F 2493, Standard Specification for P225/60R16 97S RadialStandard Reference Test Tire.
14. Ejsmont, J. (editor) Development of Procedures for CertifyingNoise Testing Equipment, University of Technology Publishers,Wydawnictwo Politechniki Gdansk, ul. G. Narutowicza 11/12, 80-952 Gdansk, Poland, 2005.
15. Donavan, P. Further Development of the Sound Intensity Method ofMeasuring Tire Noise Performance of In-Situ Pavements, CaliforniaDepartment of Transportation, Division of Environmental Analysis,Sacramento, CA, prepared by Illingworth & Rodkin, Inc., Petaluma,CA, January 2006.
16. Beranek, L. and Vér, I. Noise and Vibration Control Engineering:Principles and Applications, John Wiley & Sons, Inc., New York, NY,1992, p. 61.
17. Wiegand, P., Cable, J., Reinert, S., and Tabbert, T. “Field Experimentsof Current Concrete Pavement Surface Characteristics Practices:Iowa Data Collection and Analysis,” Report No. FHWA DTFH61-01-X-00042 (Project 15, Part 2) IHRB Project TR-537, Center forTransportation Research and Education, Iowa State University,Ames, IA, December 2005.
18. Rochat, J., Read, D., and Fleming, G. Status Report: Caltrans Rte 138Tire/Pavement Noise Study, Technical Memorandum, Volpe CenterAcoustics Facility, U.S. Department of Transportation, June 2004.
19. Donavan, P. “Influence of PCC Surface Texture and Joint Slap onTire/Pavement Noise Generation,” Proceedings of NoiseCon 2004,Baltimore, MD, July 2004.
20. Lee, C. and Fleming, G. Measurement of Highway-Related Noise,U.S. Department of Transportation, Report No. DOT-VNTSC-FHWA-96-5, 1996.
21. International Organization of Standardization. “ISO/CD 11819-1.Acoustics—Measurement of the Influence of Road Surfaces onTraffic Noise—Part 1: Statistical Pass-by Method,” ISO, Geneva,Switzerland, 2000.
22. Fleming, G., Rapoza, A., and Lee, C. “Development of NationalReference Energy Mean Emission Levels for the FHWA TrafficNoise Model (FHEA TNM), Version 1.0,” U.S. Department ofTransportation, Report No. DOT-VNTSC-FHWA-96-2, 1996.
23. Donavan, P., Lodico, D., and Rymer, B. “Considerations in theStandardization of On-Board Sound Intensity (OBSI) for HighwayPavement Evaluation,” Proceedings of NoiseCon 2007, Reno, NV,October 2007.
References
1. Rymer, B. and Donavan, P. “Tire-Pavement Noise Intensity Testingin Europe: The NITE Study and Its Relationship to Ongoing Cal-trans Quiet Pavement Activities,” Proceedings of the 80th Meetingof the Association of Asphalt Paving Technologists, Long Beach,CA, March 7–9, 2005.
2. International Organization of Standardization. “ISO/CD 11819-2.Acoustics—Method for measuring the influence of road surfaces ontraffic noise—Part 2: the close-proximity method,” ISO, Geneva,Switzerland, 2000.
3. Donavan, P. “Tire-Pavement Interaction Noise Measurementunder Vehicle Operating Conditions of Cruise and Acceleration,”SAE Paper 931276, Society of Automotive Engineers Noise and Vi-bration Conference Proceedings, Traverse City, MI, May 1993.
4. Hanson, D., “Tire-Pavement Noise Characteristics,” Proceedingsof the 80th Meeting of the Association of Asphalt Paving Technol-ogists, Long Beach, CA, March 7–9, 2005.
5. Scofield L. and Donavan, P. “Early Results of the Arizona Quiet Pave-ment Program,” Proceedings of the 80th Meeting of the Associationof Asphalt Paving Technologists, Long Beach, CA, March 7–9, 2005.
6. Donavan, P. and Rymer, B. “Quantification of Tire-pavementNoise: Application of the Sound Intensity Method,” Proceedings ofInter-Noise 2004, Prague, the Czech Republic, August 2004.
7. McNerney, M., Landsberger, B., Turen, T., and Pandelides, A. Com-parative Field Measurements of Tire-pavement Noise of Selected TexasPavements, Center for Transportation Research, the University ofTexas at Austin, Austin, TX, Report No. 7-2957-2, April 2000.
8. Ruhala, R. J. and Burroughs, C. B. “Tire-Pavement InteractionNoise Source Identification Using Multi-Planar Nearfield Acousti-cal Holography,” Proceedings of the Society of Automotive Engi-neers Noise and Vibration Conference and Exposition, paper no.1999-01-1733, May 1999.
9. Bernhard, R. and Thornton, W. “Tire/Pavement Noise StrategicPlanning Workshop: September 14–16, 2004 Proceedings andRoadmap,” FHWA-HEP-05-007, HL 2004-19, SQDH 2004-4, TheInstitute for Safe, Durable Highways, School of Mechanical Engi-neering, Purdue University, September 2004.
10. Sandberg, U. and Ejsmont, J. The Tyre/Road Noise Reference Book,INFORMEX, Ejsmont & Sandberg Handelsbolag, Harg, SE-59040Kisa, Sweden, 2002.
11. GM North American Engineering Standards. “Road Tire NoiseEvaluation Procedure—GMN7079TP,” General Motors Corpora-tion, Detroit, MI, 2004.
12. Donavan, P. “An Assessment of the Tire Noise Generation andSound Propagation Characteristics of an ISO 10844 Road Sur-
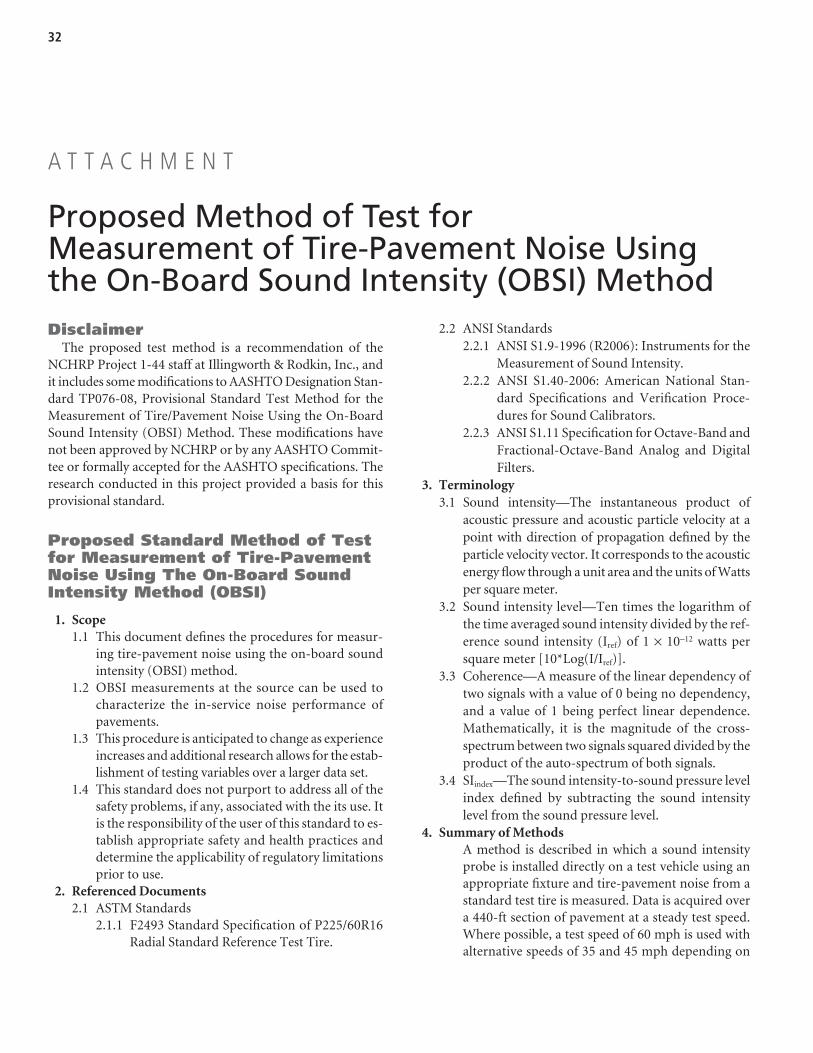
32
A T T A C H M E N T
Proposed Method of Test for Measurement of Tire-Pavement Noise Usingthe On-Board Sound Intensity (OBSI) MethodDisclaimer
The proposed test method is a recommendation of theNCHRP Project 1-44 staff at Illingworth & Rodkin, Inc., andit includes some modifications to AASHTO Designation Stan-dard TP076-08, Provisional Standard Test Method for theMeasurement of Tire/Pavement Noise Using the On-BoardSound Intensity (OBSI) Method. These modifications havenot been approved by NCHRP or by any AASHTO Commit-tee or formally accepted for the AASHTO specifications. Theresearch conducted in this project provided a basis for thisprovisional standard.
Proposed Standard Method of Testfor Measurement of Tire-PavementNoise Using The On-Board SoundIntensity Method (OBSI)
1. Scope1.1 This document defines the procedures for measur-
ing tire-pavement noise using the on-board soundintensity (OBSI) method.
1.2 OBSI measurements at the source can be used tocharacterize the in-service noise performance ofpavements.
1.3 This procedure is anticipated to change as experienceincreases and additional research allows for the estab-lishment of testing variables over a larger data set.
1.4 This standard does not purport to address all of thesafety problems, if any, associated with the its use. Itis the responsibility of the user of this standard to es-tablish appropriate safety and health practices anddetermine the applicability of regulatory limitationsprior to use.
2. Referenced Documents2.1 ASTM Standards
2.1.1 F2493 Standard Specification of P225/60R16Radial Standard Reference Test Tire.
2.2 ANSI Standards2.2.1 ANSI S1.9-1996 (R2006): Instruments for the
Measurement of Sound Intensity.2.2.2 ANSI S1.40-2006: American National Stan-
dard Specifications and Verification Proce-dures for Sound Calibrators.
2.2.3 ANSI S1.11 Specification for Octave-Band andFractional-Octave-Band Analog and DigitalFilters.
3. Terminology3.1 Sound intensity—The instantaneous product of
acoustic pressure and acoustic particle velocity at apoint with direction of propagation defined by theparticle velocity vector. It corresponds to the acousticenergy flow through a unit area and the units of Wattsper square meter.
3.2 Sound intensity level—Ten times the logarithm ofthe time averaged sound intensity divided by the ref-erence sound intensity (Iref) of 1 × 10⁻¹² watts persquare meter [10*Log(I/Iref)].
3.3 Coherence—A measure of the linear dependency oftwo signals with a value of 0 being no dependency,and a value of 1 being perfect linear dependence.Mathematically, it is the magnitude of the cross-spectrum between two signals squared divided by theproduct of the auto-spectrum of both signals.
3.4 SIindex—The sound intensity-to-sound pressure levelindex defined by subtracting the sound intensitylevel from the sound pressure level.
4. Summary of MethodsA method is described in which a sound intensityprobe is installed directly on a test vehicle using anappropriate fixture and tire-pavement noise from astandard test tire is measured. Data is acquired overa 440-ft section of pavement at a steady test speed.Where possible, a test speed of 60 mph is used withalternative speeds of 35 and 45 mph depending on
33
local conditions and regulations. Sound intensity levels are measured at the leading and trailing edgecontact patch of the test tire, either simultaneously orconsecutively, and a minimum of two runs for eachprobe location are made. Data is acquired for 1⁄3octave bands centered at 400 to 5,000 Hz and checkedto ensure that data quality criteria are met. The re-sults from the leading and trailing edge positions foreach run are averaged together and then the tire averages for individual runs are averaged, resulting inthe overall A-weighted OBSI level and 1⁄3 octave bandlevels that are reported for each pavement section.
5. Significance and Use5.1 This test method defines procedures to quantify tire-
pavement noise very near the source in isolationfrom other vehicle noises.
5.2 Using the method and the specified standard testtire, measurements can be compared across differentpavements and among different users of the method.
5.3 The method can also be used to compare the tire-pavement noise generation of different tires, includ-ing truck tires, if the intent of the measurements is tocompare tire noise generation on some defined set ofpavements.
6. Equipment6.1 Acoustic Instrumentation
6.1.1 The sound intensity level shall be measuredusing a sound intensity meter or equivalentmeasurement system meeting the require-ments of ANSI S1.9-1996 (R 2006) and re-quirements of ANSI S1.11.
6.1.2 The sound intensity probe shall consist of two1⁄2″ phased matched condenser microphonesinstalled on two 1⁄2″ microphone preampli-fiers. These shall be attached to a plastic probeholder that provides a 16-mm center-to-centerspacing of the microphones as measured fromthe center of the microphone diaphragms re-sulting in a “side-by-side” SI probe configura-tion. The midpoint between these microphonesshall be used in positioning the probe. The mi-crophones shall be protected from airflowusing a spherical foam windscreen approxi-mately 31⁄2″ in diameter.
6.1.3 Acoustic calibration of the entire data acquisi-tion system shall be performed with a soundcalibrator that fulfils the requirements ofANSI S1.40 Class 0 or Class 1.
6.2 Non-Acoustic Instrumentation6.2.1 Air and surface temperatures shall be measured
with a device with an overall accuracy of ±1.8°F.6.2.2 Wind speed shall be measured with a device
with an overall accuracy of ±5%.
6.2.3 Tire inflation pressure shall be measured witha device with an overall accuracy of ±1 psi.
6.2.4 Vehicle speed shall be measured with a devicewith an overall accuracy of ±1 mph. Vehiclespeedometers may be used if independentlycalibrated by a device with an overall accuracyof ±1 mph.
6.3 Test Tire6.3.1 Measurements shall be conducted using the
ASTM F 2493 P225/60R16 (16 inch) StandardReference Test Tire (SRTT). Test tires shall beoperated in only one rotational direction forthe test life of the tire. The test tire shall bemounted on the right side of the test vehicleon a non-driven axle.
6.3.2 Unless a specific inflation is required, the testtire shall be inflated to a pressure of 30±2 psicold.
6.3.3 The test tire shall be loaded with the existing,unloaded weight of vehicle plus the personneland equipment to perform the testing unlessspecified otherwise in the test plan. Loading ofthe test tire shall be 850±100 lbs.
6.4 Test Vehicle6.4.1 The test vehicle shall provide a non-driven,
non-steering tire/wheel mounting location.6.4.2 The tire and wheel at the test position shall
rotate freely without extraneous noise of anykind.
7. Measuring Procedure7.1 Probe Location
7.1.1 Sound intensity shall be measured at twopoints, one opposite the leading edge of thecontact patch and one opposite the trailingedge (Figure 1)
7.1.2 The leading and trailing edges of the contactpatch shall be defined as the points where thetire tread is 0.1 inch above the pavement sur-face (Figure 2).
7.1.3 The measurement points shall be 3±1⁄4 inchesabove the ground.
7.1.4 Measurements shall be made in a plane surfaceparallel to the sidewall of the tire with themeasurement plane 4±1⁄2 inches from the tiresidewall at the measurement location.
7.1.5 The probe shall be supported by a fixture capa-ble of maintaining it in the specified positionfor the duration of the test. The fixture shallbe designed to minimize extraneous noise andwind turbulence. Measurements of the leadingand trailing edge may be made concurrentlyusing a two-probe fixture configuration.
34
7.3.2 Temperature—Air and pavement tempera-ture shall be measured at the beginning of theOBSI measurement set and monitored suchthat changes of ±10°F are detected. Testingshall be restricted to a temperature range from40 to 105°F unless the purpose of the testing isintended to evaluate the effects of tempera-ture. During the OBSI measurements, tire sur-face temperature shall be measured every half-hour or sooner if environmental conditionsare rapidly changing.
7.3.3 Wind speed and direction—Average windspeed and direction shall be monitored andnoted throughout the testing. No restrictionson wind speed or direction shall be applied.However, data validity checks shall be used toidentify when wind conditions have adverseeffects on the OBSI measurement.
7.4 Test SectionThe test section shall have the same nominalmaterial and surfacing for its length. The testsection shall be free of debris to the extent pos-sible. The test section shall be nominallystraight and free of dips and swells.
7.5 Acoustic Data Acquisition7.5.1 Sound intensity shall be measured using a “lin-
ear average” (energy average) over a specifictime interval. Generally, an averaging time of 5 seconds shall be used for a test speed of 60 mph. For 45 mph, the averaging time is 6.7 seconds. For 35 mph, it is 8.6 seconds. Pave-ment sections that are too short to allow thisaveraging time or are suspected of not beingconsistent throughout the specified shorteraveraging period are acceptable as long as allData Quality Criteria are met.
7.5.2 The mean sound pressure level of the probe mi-crophone pair and coherence of the soundpressure signals between the microphone pairshall be measured. Microphone signals shallalso be recorded for additional post-processingif required.
7.5.3 OBSI and other acoustic data shall be acquiredat minimum for the 1⁄3 octave bands centeredat 400 to 5,000 Hz.
7.5.4 Microphone signals shall be filtered by the A-weighting spectrum shape at the input tothe analyzer.
7.5.5 For each 440-ft section of pavement tested, aminimum of two measurements for the lead-ing and trailing edge probe locations shallmade. It is recommended that three or moremeasurements of each section be performed. If
SI ProbeLocations
4 in.
3 in.
Side View
Leading EdgeTrailing Edge
Tire Contact Patch:
Top View
0.1” Thick
Figure 1. OBSI probe locations relative totest tire and pavement surface.
Figure 2. Orientation of the OBSI probe to the edgeof the tire contact patch—trailing edge position.
7.2 Acoustic Calibration7.2.1 Prior to each set of measurements, the sound
intensity probes and measurement system shallbe calibrated with the acoustic calibrator. At theend of each set of measurements or after 4 hours(whichever is shorter), the calibration shall berepeated. If the second calibration differs fromthe first by more than ±0.2 dB, the set shall berepeated.
7.2.2 Local values for air temperature and baromet-ric pressure shall be entered into the analyzerfor proper calculation of sound intensity priorto OBSI measurement.
7.3 Environmental Conditions7.3.1 Pavement dampness—The pavement shall be
dry. For known non-porous pavements, thiscriterion shall be followed from visual inspec-tion. For porous pavements, testing shall notbe conducted on the pavement if it is knownthat rain has occurred in the vicinity of the testsite within 48 hours.
data quality criteria are not met for at least twoof the runs, the measurements shall be re-peated until they are.
7.6 Data Quality Criteria7.6.1 Audio monitoring—The sound pressure sig-
nals shall be acoustically or visually monitoredas they are acquired. Any unusual noises suchas rattles, excessive wind noise, stones embed-ded in the tire tread, etc., shall be observed andthe cause of such noises shall be identified andremedied.
7.6.2 The direction of the sound intensity shall bepositive for all data reported as valid. Positivedirection is defined to be sound propagatingaway from the test tire.
7.6.3 Mean sound pressure level minus sound in-tensity level (SIindex) shall be less than 5 dB andgreater than −1 dB in all 1⁄3 octave bands for alldata reported as valid.
7.6.4 Coherence—The ordinary coherence betweenthe two microphones constituting the probeshall be greater than 0.8 for all frequenciesbelow 4,000 Hz.
7.6.5 Overall A-weighted sound intensity levels formeasurements made of the same pavementsection shall be within 1 dBA. The range insound intensity level between runs shall be lessthan 2 dB in all 1⁄3 octave bands for all data re-ported as valid.
8. Data ProcessingOBSI data shall be processed into levels representingthe combination of the noise sources at the leading
and trailing edge of the contact patch. If a singleprobe is used, multiple runs shall be averaged to-gether arithmetically for the leading and trailingedges separately. The leading and trailing averagesshall then be averaged on an energy basis. If dualprobes are used, the level of the two probes shall be av-eraged on an energy basis for each run. The energyaverages for individual runs shall then be averagedtogether arithmetically.
9. Data Reporting9.1 The specific acoustic data reported shall depend on
the specific needs of the test as defined in the testplan and final report. As a minimum, the followingtire-pavement average data shall be reported: overallA-weighted OBSI level summed over the frequencyrange of valid data with the range noted; 1⁄3 octaveband levels over the range of valid data.
9.2 Any exceptions to this stated OBSI procedure mustbe reported.
9.3 Other information that shall be reported include airand pavement temperature range during testing, lo-cation and description of the test pavement, the dateof the measurement, period of the performance ofthe measurements, and test speed.
9.4 Additional information to be made available on re-quest shall include wind conditions during the mea-surements, barometric pressure used for air densitycalculation, coherence, SIindex, probe configuration,and test vehicle make and model.
10. Precision and Bias10.1 Precision is expected to be within 0.5 dB.10.2 Bias is expected to be within 1.5 dB.
35
36
Unpublished Material
Appendixes A, B, C, and D contained in the research agency’s final report are not published herein. Copies are available onthe TRB website at http://trb.org/news/blurb_detail.asp?id=9956. The appendixes are titled as follows:
Appendix A: Review of LiteratureAppendix B: Test Evaluation of Candidate Methods and Recommendation for Test Procedure DevelopmentAppendix C: Results of Test Parameter EvaluationAppendix D: Demonstration Testing of OBSI Procedure
Appendixes A, B, C, and D
Abbreviations and acronyms used without definitions in TRB publications:
AAAE American Association of Airport ExecutivesAASHO American Association of State Highway OfficialsAASHTO American Association of State Highway and Transportation OfficialsACI–NA Airports Council International–North AmericaACRP Airport Cooperative Research ProgramADA Americans with Disabilities ActAPTA American Public Transportation AssociationASCE American Society of Civil EngineersASME American Society of Mechanical EngineersASTM American Society for Testing and MaterialsATA Air Transport AssociationATA American Trucking AssociationsCTAA Community Transportation Association of AmericaCTBSSP Commercial Truck and Bus Safety Synthesis ProgramDHS Department of Homeland SecurityDOE Department of EnergyEPA Environmental Protection AgencyFAA Federal Aviation AdministrationFHWA Federal Highway AdministrationFMCSA Federal Motor Carrier Safety AdministrationFRA Federal Railroad AdministrationFTA Federal Transit AdministrationIEEE Institute of Electrical and Electronics EngineersISTEA Intermodal Surface Transportation Efficiency Act of 1991ITE Institute of Transportation EngineersNASA National Aeronautics and Space AdministrationNASAO National Association of State Aviation OfficialsNCFRP National Cooperative Freight Research ProgramNCHRP National Cooperative Highway Research ProgramNHTSA National Highway Traffic Safety AdministrationNTSB National Transportation Safety BoardSAE Society of Automotive EngineersSAFETEA-LU Safe, Accountable, Flexible, Efficient Transportation Equity Act: A Legacy for Users (2005)TCRP Transit Cooperative Research ProgramTEA-21 Transportation Equity Act for the 21st Century (1998)TRB Transportation Research BoardTSA Transportation Security AdministrationU.S.DOT United States Department of Transportation