Embed Size (px)
Citation preview
Measuring the Success of Transaction Processing
Systems: An Adaptation of the DeLone and McLean
Information System Success Model
A study submitted in partial fulfilment of the requirements for the degree of
Master of Science in Information Systems
at
THE UNIVERSITY OF SHEFFIELD
by
TAYO, Oluwasikemi
September 2011
ABSTRACT
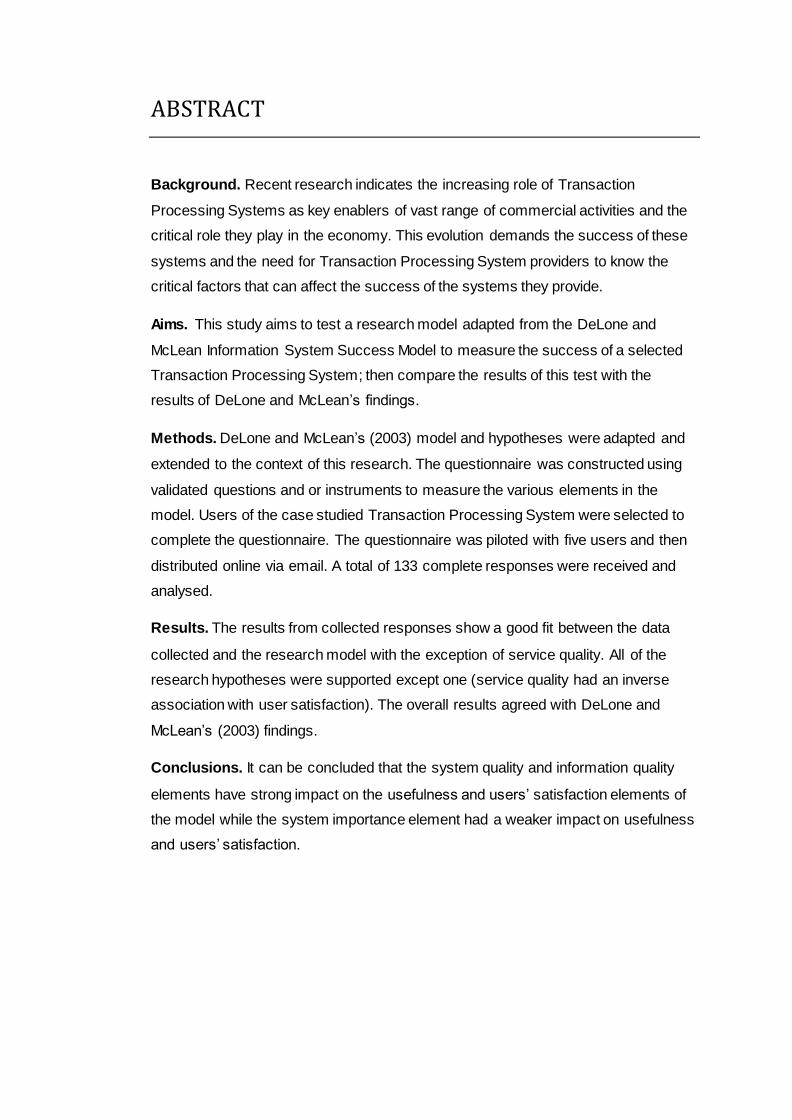
Background. Recent research indicates the increasing role of Transaction
Processing Systems as key enablers of vast range of commercial activities and the
critical role they play in the economy. This evolution demands the success of these
systems and the need for Transaction Processing System providers to know the
critical factors that can affect the success of the systems they provide.
Aims. This study aims to test a research model adapted from the DeLone and
McLean Information System Success Model to measure the success of a selected
Transaction Processing System; then compare the results of this test with the
results of DeLone and McLean’s findings.
Methods. DeLone and McLean’s (2003) model and hypotheses were adapted and
extended to the context of this research. The questionnaire was constructed using
validated questions and or instruments to measure the various elements in the
model. Users of the case studied Transaction Processing System were selected to
complete the questionnaire. The questionnaire was piloted with five users and then
distributed online via email. A total of 133 complete responses were received and
analysed.
Results. The results from collected responses show a good fit between the data
collected and the research model with the exception of service quality. All of the
research hypotheses were supported except one (service quality had an inverse
association with user satisfaction). The overall results agreed with DeLone and
McLean’s (2003) findings.
Conclusions. It can be concluded that the system quality and information quality
elements have strong impact on the usefulness and users’ satisfaction elements of
the model while the system importance element had a weaker impact on usefulness
and users’ satisfaction.
ACKNOWLEDGMENTS
I would like to express my heartfelt gratitude to my parents, siblings and their
families for their support during this period.
I would like to express my thanks to my supervisor Prof Val Gillet for her guidance
and advice.
Finally, I would like to express my thanks to all the friends that stood by me during
the dissertation period.
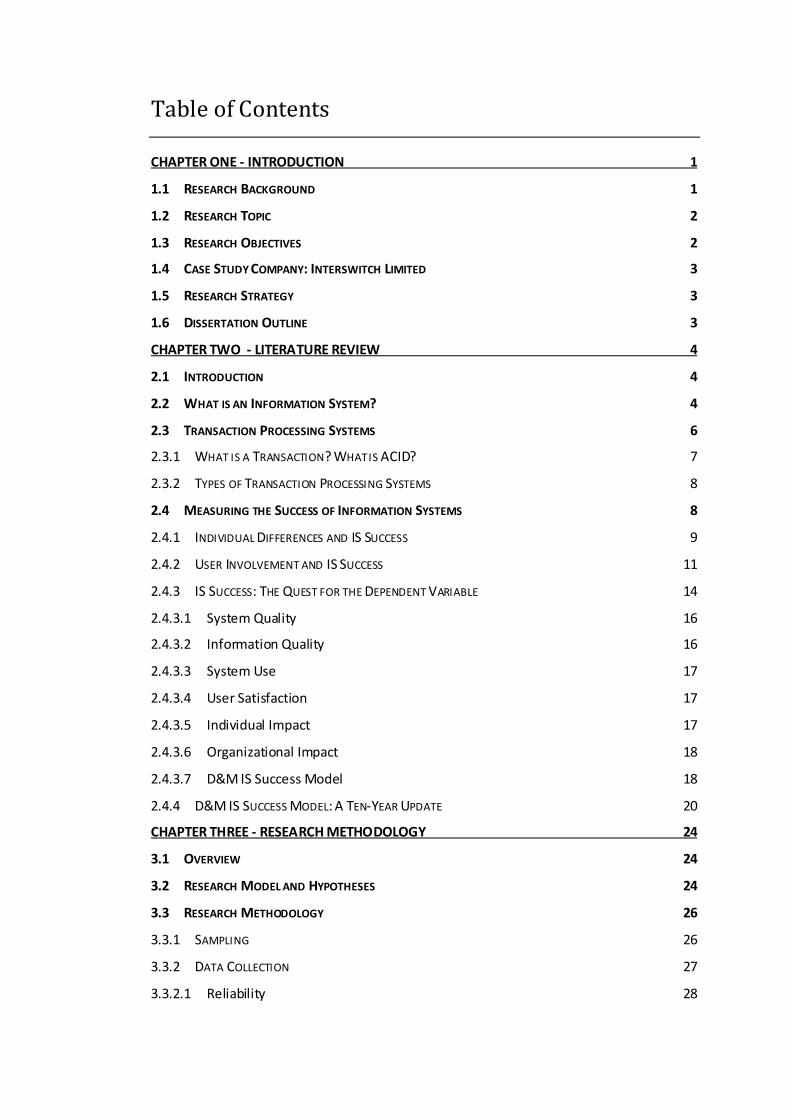
Table of Contents
CHAPTER ONE - INTRODUCTION 1
1.1 RESEARCH BACKGROUND 1
1.2 RESEARCH TOPIC 2
1.3 RESEARCH OBJECTIVES 2
1.4 CASE STUDY COMPANY: INTERSWITCH LIMITED 3
1.5 RESEARCH STRATEGY 3
1.6 DISSERTATION OUTLINE 3
CHAPTER TWO - LITERATURE REVIEW 4
2.1 INTRODUCTION 4
2.2 WHAT IS AN INFORMATION SYSTEM? 4
2.3 TRANSACTION PROCESSING SYSTEMS 6
2.3.1 WHAT IS A TRANSACTION? WHAT IS ACID? 7
2.3.2 TYPES OF TRANSACTION PROCESSING SYSTEMS 8
2.4 MEASURING THE SUCCESS OF INFORMATION SYSTEMS 8
2.4.1 INDIVIDUAL DIFFERENCES AND IS SUCCESS 9
2.4.2 USER INVOLVEMENT AND IS SUCCESS 11
2.4.3 IS SUCCESS: THE QUEST FOR THE DEPENDENT VARIABLE 14
2.4.3.1 System Quality 16
2.4.3.2 Information Quality 16
2.4.3.3 System Use 17
2.4.3.4 User Satisfaction 17
2.4.3.5 Individual Impact 17
2.4.3.6 Organizational Impact 18
2.4.3.7 D&M IS Success Model 18
2.4.4 D&M IS SUCCESS MODEL: A TEN-YEAR UPDATE 20
CHAPTER THREE - RESEARCH METHODOLOGY 24
3.1 OVERVIEW 24
3.2 RESEARCH MODEL AND HYPOTHESES 24
3.3 RESEARCH METHODOLOGY 26
3.3.1 SAMPLING 26
3.3.2 DATA COLLECTION 27
3.3.2.1 Reliability 28
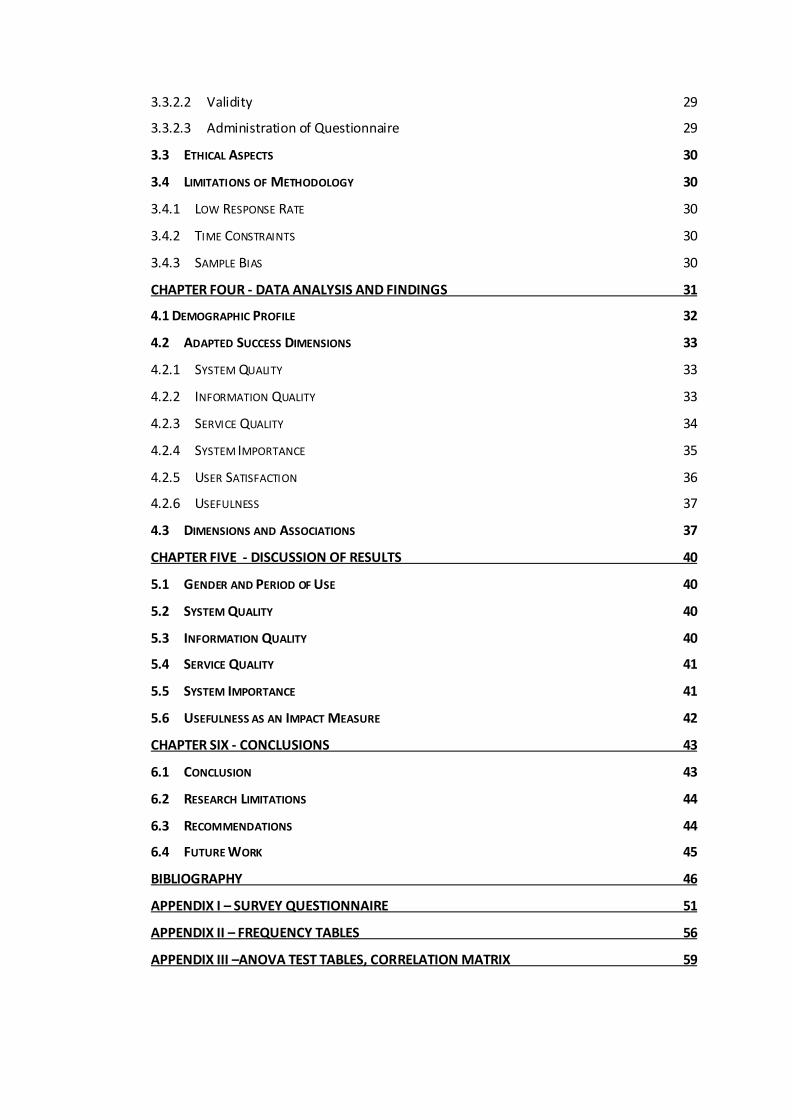
3.3.2.2 Validity 29
3.3.2.3 Administration of Questionnaire 29
3.3 ETHICAL ASPECTS 30
3.4 LIMITATIONS OF METHODOLOGY 30
3.4.1 LOW RESPONSE RATE 30
3.4.2 TIME CONSTRAINTS 30
3.4.3 SAMPLE BIAS 30
CHAPTER FOUR - DATA ANALYSIS AND FINDINGS 31
4.1 DEMOGRAPHIC PROFILE 32
4.2 ADAPTED SUCCESS DIMENSIONS 33
4.2.1 SYSTEM QUALITY 33
4.2.2 INFORMATION QUALITY 33
4.2.3 SERVICE QUALITY 34
4.2.4 SYSTEM IMPORTANCE 35
4.2.5 USER SATISFACTION 36
4.2.6 USEFULNESS 37
4.3 DIMENSIONS AND ASSOCIATIONS 37
CHAPTER FIVE - DISCUSSION OF RESULTS 40
5.1 GENDER AND PERIOD OF USE 40
5.2 SYSTEM QUALITY 40
5.3 INFORMATION QUALITY 40
5.4 SERVICE QUALITY 41
5.5 SYSTEM IMPORTANCE 41
5.6 USEFULNESS AS AN IMPACT MEASURE 42
CHAPTER SIX - CONCLUSIONS 43
6.1 CONCLUSION 43
6.2 RESEARCH LIMITATIONS 44
6.3 RECOMMENDATIONS 44
6.4 FUTURE WORK 45
BIBLIOGRAPHY 46
APPENDIX I – SURVEY QUESTIONNAIRE 51
APPENDIX II – FREQUENCY TABLES 56
APPENDIX III –ANOVA TEST TABLES, CORRELATION MATRIX 59
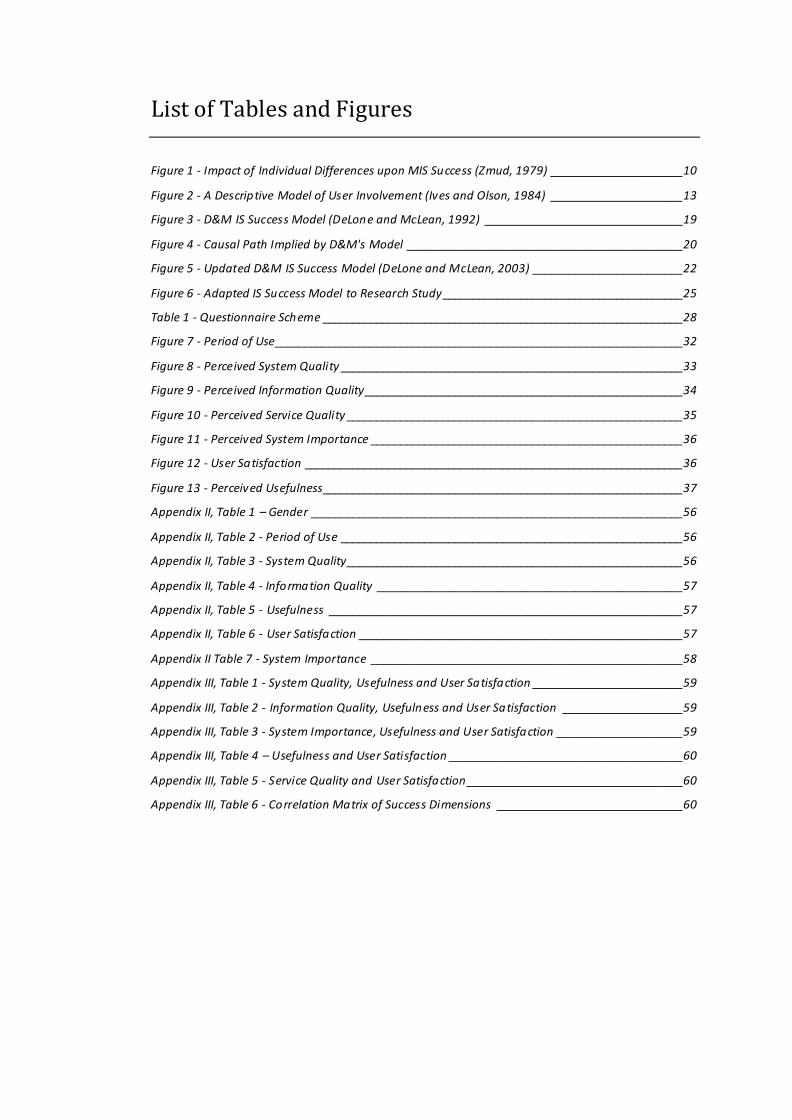
List of Tables and Figures
Figure 1 - Impact of Individual Differences upon MIS Success (Zmud, 1979) ______________________10
Figure 2 - A Descriptive Model of User Involvement (Ives and Olson, 1984) ______________________13
Figure 3 - D&M IS Success Model (DeLone and McLean, 1992) _________________________________19
Figure 4 - Causal Path Implied by D&M's Model ______________________________________________20
Figure 5 - Updated D&M IS Success Model (DeLone and McLean, 2003) _________________________22
Figure 6 - Adapted IS Success Model to Research Study ________________________________________25
Table 1 - Questionnaire Scheme ____________________________________________________________28
Figure 7 - Period of Use____________________________________________________________________32
Figure 8 - Perceived System Quality _________________________________________________________33
Figure 9 - Perceived Information Quality _____________________________________________________34
Figure 10 - Perceived Service Quality ________________________________________________________35
Figure 11 - Perceived System Importance ____________________________________________________36
Figure 12 - User Satisfaction _______________________________________________________________36
Figure 13 - Perceived Usefulness____________________________________________________________37
Appendix II, Table 1 – Gender ______________________________________________________________56
Appendix II, Table 2 - Period of Use _________________________________________________________56
Appendix II, Table 3 - System Quality________________________________________________________56
Appendix II, Table 4 - Information Quality ___________________________________________________57
Appendix II, Table 5 - Usefulness ___________________________________________________________57
Appendix II, Table 6 - User Satisfaction ______________________________________________________57
Appendix II Table 7 - System Importance ____________________________________________________58
Appendix III, Table 1 - System Quality, Usefulness and User Satisfaction _________________________59
Appendix III, Table 2 - Information Quality, Usefulness and User Satisfaction ____________________59
Appendix III, Table 3 - System Importance, Usefulness and User Satisfaction _____________________59
Appendix III, Table 4 – Usefulness and User Satisfaction _______________________________________60
Appendix III, Table 5 - Service Quality and User Satisfaction ____________________________________60
Appendix III, Table 6 - Correlation Matrix of Success Dimensions _______________________________60
Chapter One: Introduction
1
CHAPTER ONE
INTRODUCTION
1.1 Research Background
Transaction processing in an organization could be a visible or an invisible back-end
business computing function. However it is a key enabler of a vast range of
commercial activities from travel reservations and electronic banking, to financial
transactions and e-commerce making it a critical component of the world’s economic
market (IBM, 2005). According to an International Technology Report, a Transaction
Processing System (TPS), a type of Information System (IS) is able to handle a very
large number of transactions, averaging 25,000 per second (International
Technology Report, 2001 cited in IBM, 2005:2). For example in the financial sector,
TPSs allow customers to carry out financial requests remotely thus eliminating the
need for their physical presence at the financial institutions. This remote feature in
turn allows institutions to process multiple requests at a time which could lead to
improved customer satisfaction.
The critical influence that a TPS has on the success of industries in addition to the
explosion of e-business and web-based commerce, has placed a greater demand
on the success of Transaction Processing Systems. The need to identify the critical
success factors of TPS became the focus for this research. In 1992, William H.
DeLone and Ephraim R. McLean introduced their first IS Success model, to
understand and measure the success of an IS. This model was based on a
taxonomy that included all the various distinct measures that had been used in past
IS literatures to evaluate IS success. In their model, they tried to describe the
relationships between the proposed IS success dimensions.
Since entire industries, such as finance and travel, literally owe their current place in
the global economy to TPSs (IBM, 2005), TPS is a real-world type of IS to apply
DeLone and McLean‘s model of IS Success to. Also, because the system is not
always exclusively used by internal users of an organization providing or employing
the TPS, it is can be considered customer facing. This feature in addition to other
system characteristics can be easily interpreted to match each dimension of the
DeLone and McLean’s model.
Chapter One: Introduction
2
1.2 Research Topic
This primary aim of this research project is to adapt the DeLone and McLean’s
Information System Success Model in the measure of a TPS, a type of Information
Systems. The research topic is formulated as:
“Measuring the Success of Transaction Processing Systems: An Adaptation of the
DeLone and McLean Information System Success Model”
The reasons for selecting the above topic stemmed from the need to identify and
understand the success factors of TPS and the inability to find previous literatures at
that time which had applied the model to TPS. Working as a 2nd and 3rd level support
engineer for three years had exposed the researcher to the need for TPS providers
to know these factors that can make or break a TPS.
The identification of these factors is a fulfilling area of research as the research
results could serve as a useful guide to TPS providers in identifying the critical
factors that can impact the success of their systems.
1.3 Research Objectives
To achieve the aim of the research, the following objectives were identified:
1) Research existing literature relating to Information System success.
2) Identify a suitable TPS provider as a case study and select the most
appropriate TPS in the company to evaluate.
3) Identify the success dimensions that will be used in this evaluation and
select appropriate variables that will be used to measure each dimension.
4) Develop a survey from the results of the third objective to be completed by
the users of the selected system.
5) Analyse the responses from the users to determine the success dimensions
applicable to the TPS.
6) Validate the hypotheses developed from the DeLone-McLean IS Success
Model.
7) Advice the case study company on results of the research and
recommendations and contribute to the TPSs research field.
Chapter One: Introduction
3
1.4 Case Study Company: Interswitch Limited
InterSwitch Limited, a Nigerian company is a payment and transaction processing
company that provides transaction processing and payment infrastructure to
government, banks and corporate organizations. With its switching infrastructure,
InterSwitch has been able to connect all 24 banks in Nigeria to its network thus
providing online, real-time transaction switching that enables individuals and
businesses access to their funds across different payment channels like the ATMs
(Automated Teller Machines), the POSs (Point of Sales), Mobile Phones, Web and
Bank Branches. The company leverages on this existing infrastructure to develop
TPSs for revenue collection, bill payments, mobile recharge, funds transfer etc.
1.5 Research Strategy
This research project started with the study of existing literatures on IS success to
gain a better understanding of the concept from which the research model was
adapted and its hypotheses formulated. This also aided the selection of the TPS
used to test the research model and the development of a survey questionnaire
completed by the users of the selected TPS. The responses from the survey were
quantitatively analyzed to present the findings that supported or refuted the research
hypotheses.
1.6 Dissertation Outline
This dissertation consists of six chapters. Chapter One presented an overview of the
research project including its aims and objectives. Chapter Two defined key
concepts and presented a survey of relevant literature to IS success. Chapter Three
presented the research methodology selected for the study—measures and
operationalization—as well as the methods for data collection and analysis. Chapter
Four described the results of the analysis. Chapter Five presented discussions on
the results of the analysis and chapter six presented the conclusions,
recommendations and future work.
Chapter Two: Literature Review
4
CHAPTER TWO
LITERATURE REVIEW
2.1 Introduction
This chapter describes the key concepts relevant to this research. It started with the
definition and categories of IS. Next Transaction Processing Systems were
described and their characteristics highlighted. The last part focused on the review
of previous literatures relevant to this research.
2.2 What is an Information System?
Avison and Fitzgerald defined an Information System (IS) of an organization as a
system that gathers, stores, processes and delivers information relevant to that
organization or the society in an accessible and useful format (Avison and
Fitzgerald, 1995). They emphasized that an Information System is not concerned
with the technology aspect of it but also with the people and organisation aspects.
Here, people are those concerned with the information produced by the system and
organisational aspects are business procedures or processes peculiar to that
organization. For example, a customer management IS used in bank should cater
for customer relationship managers, account officers etc. while taking in
considerations the bank policies about how a customer’s account is managed.
With this revised view of an IS, a better definition would be as a work system whose
internal functions process information such as the capture, transmission, storage,
retrieval, manipulation and display of information (Alter, 1999). A work system to an
organization is a system that is operated by humans and/or machines to perform a
business process using information technology and other resources (such as the
environment, customers or competitions) to deliver a products and/or services to the
organization’s internal or external customers (Alter, 1999). With this definition, an IS
can be viewed as a social system as it describes a human activity system and its
interactions with the environment.
Since an IS can either exist to produce information to its users, provide support to
other systems or automate a work process, it can take many different forms unique
to the organization implementing the system or for the purpose. While the premise
for categorization was not explored in this research, five major categories of
Chapter Two: Literature Review
5
Information Systems have been commonly identified across literatures: Transaction
Processing Systems (TPS), Management Information Systems (MIS), Decision
Support Systems (DSS), Expert Information Systems (EIS) and Office Automation
Systems (OAS) (Laudon and Laudon, 2006; Alter, 1999; Avison and Fitzgerald,
1995; McLeod, 1990).
TPS – is the most basic type of IS performing daily routine transactions required
in a business demonstrating why its functions and features are usually employed
at the operational level of organizations. At this level, tasks and operations are
predefined and highly structured usually requiring a met set of conditions for a
successful processing (Laudon and Laudon, 2006). For example, a purchase
transaction will require the availability of the product in the desired quantity and
the confirmation of funds (customers’) before it can be successfully processed.
MIS – this type of IS employed at the management level of an organization
provides past, present and future information on the organization’s operations
and the environment it operates in. This system could be used to support an
organizational unit and information captured, processed and stored by TPSs are
usually the input to MIS and the output information can be in a written or oral
form (McLeod, 1990).
DSS – this system also employed at the management level of organizations aids
managers or decision makers in making situation specific and prompt decisions.
This system uses whole or part information about the organization and its
environment to produce information to aid the decision maker (Avison and
Fitzgerald, 1995).
EIS – this system is a subset of Artificial Intelligence Systems and attempts to
simulate the role of the human expert, advising its user on how to solve a
problem (McLeod, 1990). EIS is used to analyse complex problems with a high
degree of uncertainty and problem solutions or guidance are derived from the
reasoning ability of the system using its knowledge base on that particular
domain. This process of using the EIS for guidance or solutions is called a
consultation (McLeod, 1990).
OAS – this represents various applications often found in offices like word
processing, electronic mail, voice mail, facsimile transmission (fax). The aim of
these applications is to improve the productivity of their users (McLeod, 1990).
As a problem solving tool, OASs enables mangers to better communicate with
each other while solving a problem and in turn improving the quality and speed
of their decisions (McLeod, 1990).
Chapter Two: Literature Review
6
However, for the purpose of this research, Transaction Processing Systems are the
most relevant and will thus be the focus. The next section describes these systems
in more detail.
2.3 Transaction Processing Systems
As defined in the previous section, a TPS is a computerized system that performs
daily routine transactions required to carry out a business function. Transaction
processing is the transformation of symbols (numbers and letters) for the purpose of
increasing their usefulness (McLeod, 1990). This processing involves all the tasks or
actions required to complete a transaction request: capturing, transmitting, storing,
retrieving, manipulating and displaying information. There are characteristics of a
TPS that distinguishes it from other types of Information Systems (Best Price
Computers, 2010; McLeod, 1990).
Rapid response – TPSs are designed to process transactions very fast to ensure
the availability of information as at the time required. Now more than ever, with
technology advancement, the rapid processing of transactions is critical to the
success of a business enterprise as businesses cannot afford to have customers
waiting for a system response beyond the acceptable time frame which is
usually in seconds (Best Price Computers, 2010).
Reliability – an organization usually does not have a choice of not processing
transactions as it is a required activity and as such rely heavily on their TPS; a
breakdown could disrupt operations or can even stop the business (McLeod,
1990). This makes well-designed backup and recovery procedures essential as
an effective TPS must have a low failure rate.
Standardization – Transactions must be processed in the same way each time
to maximise efficiency. TPS interfaces are designed to acquire identical data
and process transactions in the same way regardless of the user, the customer
or the time for day. A flexible TPS would probably create too many opportunities
for non-standard operations (Best Price Computers, 2010). For example, a bank
needs to consistently accept account numbers (online transfer scenario) in a
certain format to avoid future complications with perhaps special characters.
Controlled Access – an organization’s transaction records can be such a
powerful business tool capable of supporting major organization decisions. In
light of this, TPS access must be restricted to only authorized users and have
Chapter Two: Literature Review
7
the ability to reconstruct past actions and transaction sequence if necessary, this
chronology of actions is referred to as an audit trail (McLeod, 1990).
2.3.1 What is a Transaction? What is ACID?
In the context of TPSs, a transaction is a sequence of actions that is treated as a
unit to fulfilling a system request. This request can either cause a change to the
state of the system (information capture) or not (information retrieval) (TechTarget,
1997). A debit and corresponding credit of funds will be treated as a unit to fulfilling
a payment request. The payment request cannot occur unless all the actions
defined for it had been carried out. A transaction will only be considered one if it has
these properties at every instance (Connolly and Begg, 2010; Date, 2004).
Atomicity: A transaction must be atomic i.e. cannot be split. All defined actions for
that transaction must all be completed or none at all, partial completions are not
permitted. In the event of a failure of any action, effects of all actions that make up
the transaction should be undone, and the system reverted back to its previous
state.
Consistency: A transaction must ensure the transformation of the system from one
consistent state to another consistent state. In other words, a transaction must
preserve all the invariant properties associated with the state. For example, a
transaction that is intended to transfer money from one account to another must
ensure that the correct accounts are debited and credited accordingly. This requires
that the transaction be a correct program.
Isolation: Each transaction should appear to execute independently of other
transactions that may be executing concurrently in the same environment. Any
updates made by a transaction T1 cannot be seen by a transaction T2 unless T1
was done with its process and “saved” these changes.
Durability: Once the above changes to the system had been saved, the updated
state must always be persistent even if the system fails for any reason. This means
that a backup mechanism must be in place to achieve this.
These properties, called as ACID properties, guarantee that a transaction is never
incomplete, the data is never inconsistent, concurrent transactions are independent,
and the effects of a transaction are persistent. To be considered a transaction
processing system the computer must pass the ACID test.
Chapter Two: Literature Review
8
2.3.2 Types of Transaction Processing Systems
From a review of TPS literatures, four functional categories were identified:
marketing, manufacturing, financial and human resource all of which can have sub
functions (Laudon and Laudon, 2006; Avison and Fitzgerald, 1995). Marketing TPSs
are usually employed in an organization’s customer service, sales management,
pricing, company promotion or dealership functions. Examples of these are sales
order systems and customer feedback systems. Manufacturing TPSs are best
employed in the scheduling, shipping and receiving or purchasing functions of a
manufacturing company. Examples are machine control systems, quality control
systems and purchase order systems. An organization could employ Finance TPSs
like funds management systems and payroll systems for their billing, general ledger
or cost accounting functions. Finally, human resource TPSs can be employed in the
personnel records, employee benefits, compensations and training functions of an
organization. Examples are employee skills inventory systems and employee
records systems.
As described in the previous sections, Transaction Processing Systems are often
central to the operations of an organization that a TPS failure even for a short period
of time could have damaging consequences on the organization and even on
external business units dependent on it. As a result, an organization needs to
constantly monitor the operations of their TPSs but most importantly, TPS providers
need to ensure a high success rate in the Transaction Processing Systems they
develop.
2.4 Measuring the Success of Information Systems
Reviewed literatures were selected based on the observation of information systems
and management information systems or their corresponding abbreviations in the
title, abstract or table of contents. Owing to their relevance to this research project
and the frequency of citation by other studies, three literatures were selected: Zmud
(1979), Ives and Olson (1984) and DeLone and McLean (1992) to be described in
the following sections. Zmud’s study explores how the differences in the information
processing and decision behaviours of IS users can impact its success; Ives and
Olson’s study examined how the levels of user involvement at different stages of an
IS development affect the success of that Information System; and DeLone and
McLean’s study proposed a categorisation of IS success dimensions based on a
synthesis of existing IS success research. These literatures are described in a
Chapter Two: Literature Review
9
chronological order because the conclusions of a previous study served as a
premise or part of the premise for the succeeding study.
2.4.1 Individual Differences and IS Success
Though many factors were believed to have had an impact on the success of MIS
experienced by an organization, the influence of individual differences on the
design, implementation and use of MIS produced the largest amount of
interdisciplinary studies whose findings were synthesised in Zmud’s paper to create
a model illustrating the impact of individual differences on MIS success (Zmud,
1979). According to Zmud, Individual differences are the variants in the information
processing and decision behaviours of users of the same system and in studying
their impact on the success of MIS, he identified three classes that individual
differences can fall into: cognitive style, personality and demographic or situational
variables. The cognitive style variables are indicative of the perceptual and thinking
behaviour of the individual characterized or dependent on the task and situational
elements the individual functions in; personality variables indicate cognitive and
sentimental structures such as dogmatism, extroversion/introversion maintained by
an individual, which facilitates their adjustments to people, events and situations
around them; demographic or situational variables indicate a broader spectrum of
personal characteristics like sex, age, professional orientation, experience and so
forth which can vary according to context for example general intellectual abilities or
knowledge of a specific content.
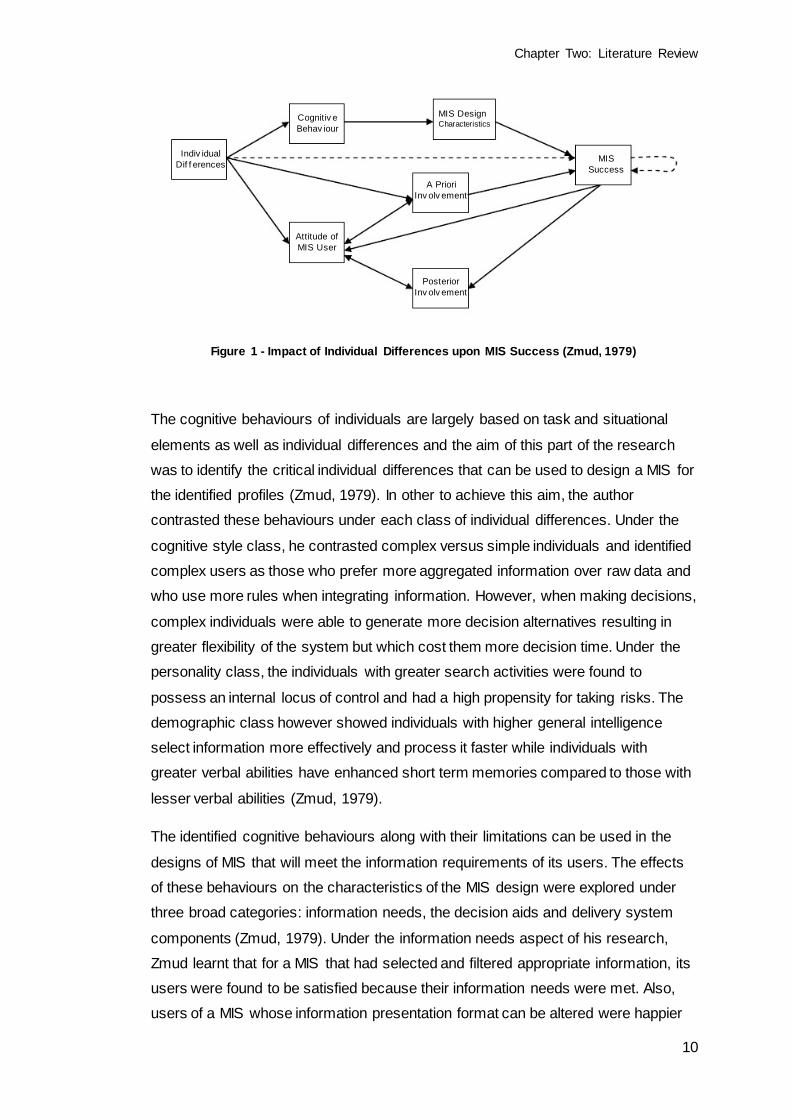
Figure 1 below shows the model illustrating the influences of individual differences
on MIS success. Cognition, a learning process involving mental activities
undertaken by an individual in an attempt to reconcile differences between
perceptions of a concept with what is actually happening in the real world and is
affected by the classes of individual differences. This effect on the cognitive
behaviour in the context of MIS success refers to the amplification or dampening
limitations in human cognition. This limitation in turn relates to the design of the MIS
by suggesting or imposing design alternatives directed towards motivating the MIS
usage and ultimately to the success and failure of the MIS. The individual
differences also affect the attitude of the potential MIS users and the tendency for
these users to involve themselves before or after the MIS development and whose
involvement or lack of can affect the success or failure of the MIS.
Chapter Two: Literature Review
10
Figure 1 - Impact of Individual Differences upon MIS Success (Zmud, 1979)
The cognitive behaviours of individuals are largely based on task and situational
elements as well as individual differences and the aim of this part of the research
was to identify the critical individual differences that can be used to design a MIS for
the identified profiles (Zmud, 1979). In other to achieve this aim, the author
contrasted these behaviours under each class of individual differences. Under the
cognitive style class, he contrasted complex versus simple individuals and identified
complex users as those who prefer more aggregated information over raw data and
who use more rules when integrating information. However, when making decisions,
complex individuals were able to generate more decision alternatives resulting in
greater flexibility of the system but which cost them more decision time. Under the
personality class, the individuals with greater search activities were found to
possess an internal locus of control and had a high propensity for taking risks. The
demographic class however showed individuals with higher general intelligence
select information more effectively and process it faster while individuals with
greater verbal abilities have enhanced short term memories compared to those with
lesser verbal abilities (Zmud, 1979).
The identified cognitive behaviours along with their limitations can be used in the
designs of MIS that will meet the information requirements of its users. The effects
of these behaviours on the characteristics of the MIS design were explored under
three broad categories: information needs, the decision aids and delivery system
components (Zmud, 1979). Under the information needs aspect of his research,
Zmud learnt that for a MIS that had selected and filtered appropriate information, its
users were found to be satisfied because their information needs were met. Also,
users of a MIS whose information presentation format can be altered were happier
Indiv idual
Dif f erences
Cognitiv e
Behav iour
MIS Design Characteristics
MIS
Success
A Priori
Inv olv ement
Attitude of
MIS User
Posterior
Inv olv ement
Chapter Two: Literature Review
11
than those whose were not. Under the decision aids, he discovered that while
quantitative models resulted in improved decision performance, it did not boost
users’ confidence because of increased decision time. However, improvements to
the system formats led to increased usage. Finally, under the delivery system, he
found out that easy to use and becoming user interfaces; quality user training;
pleasant rapport with the MIS provider or department could be positively associated
with users’ satisfaction with the MIS (Zmud, 1979).
The effects of individual differences on users’ attitudes were such that extroverted
individuals adopted a more positive attitude towards the MIS while males, older and
lesser education exhibited less positive attitudes and that users with better self-
image or more knowledge in the area were more likely to be involved in the MIS
design which will in turn positively impact the user’s satisfaction with the final MIS
(Zmud, 1979). In relation to individual differences and MIS success, the author
found that individuals with higher task knowledge and of professional status tend to
use the MIS more than those with more education and with longer tenure in the
organization and as a result are less satisfied with it. While the author agrees that
while there is a significant impact of individual differences on MIS success, he also
concludes that there is still remains unknown individual differences in relation to
contextual factors and he proposes areas of research that still need to be explored
like the relationship between user attitudes and MIS design characteristics; the need
to test these concepts in the field so as to validate the results.
2.4.2 User Involvement and IS Success
While Zmud focused on the effect of individual differences on MIS success, Ives and
Olson in their 1984 paper focused on determining when and how much of user
involvement in the development of a computer based information system is
adequate. They defined user involvement as “a participation in the system
development process by representatives of the target user group” Ives and Olson
(1984:587) and identified two theories of Organizational Behaviour relevant to their
research: participative decision making and planned organizational change. In
participative decision making, an increase in the job related inputs of subordinates to
management decisions caused a corresponding increase in job satisfaction and
improved productivity. In the case of computer based information system,
participative decision making occurs when users and system designers work
together with a view to increasing the acceptance of the system. Based on findings
from several studies carried out by the authors, user involvement was predicted to
Chapter Two: Literature Review
12
improve system quality by: capturing a more accurate and complete interpretation of
the user information requirements; providing more comprehensive particulars about
the organization that is to use the IS; Improving user understanding of the system
and in turn avoid the development of an unusable system. Another possible benefit
of user involvement from the findings was an increase in user acceptance of the
system through: the development of system capabilities from realistic expectations;
creation of an interactive session for bargaining and conflict resolutions regarding
design issues; decreasing users’ resistance to change by increasing their ownership
of the system through their commitments (Ives and Olson, 1984). Planned
organization change on the other hand theorizes that the acceptance and use of the
IS depends on the quality of the implementation process and while user involvement
was considered significant to inducing a positive attitude in the users of the system
to facilitate organizational change, it was not sufficient as research in this area
assumes that change is either a joint effort or negotiation between the manager and
the change agent (Ives and Olson, 1984).
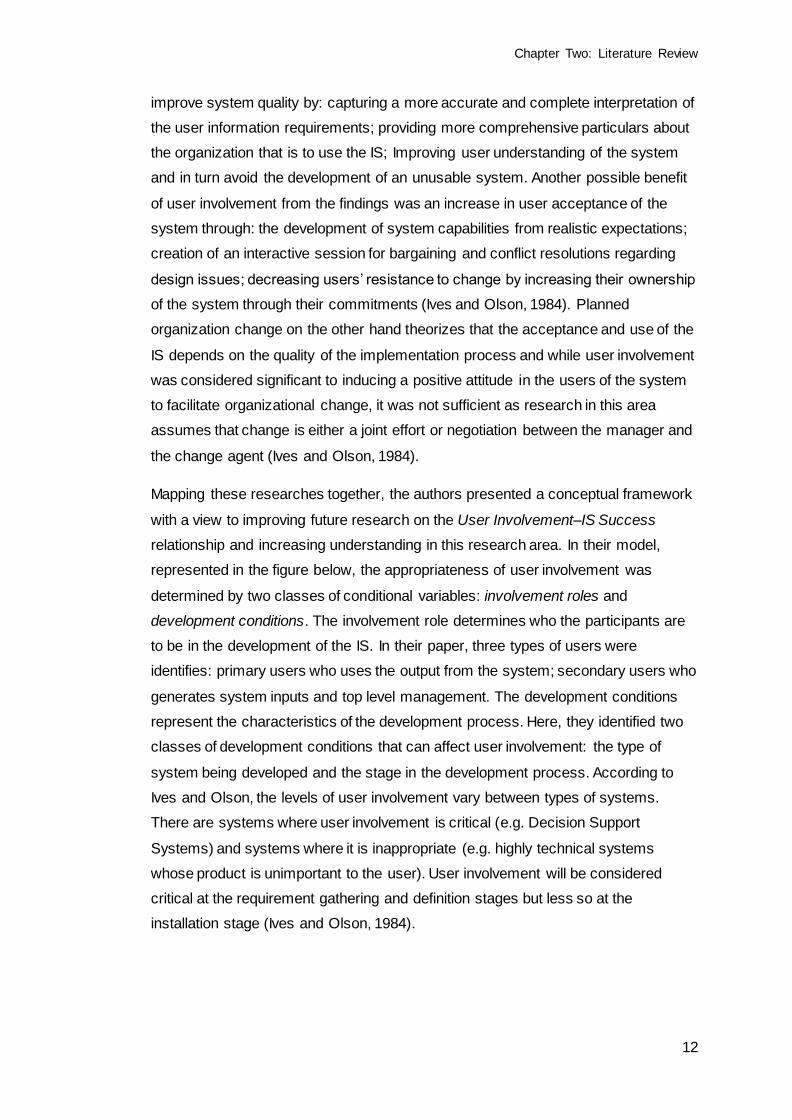
Mapping these researches together, the authors presented a conceptual framework
with a view to improving future research on the User Involvement–IS Success
relationship and increasing understanding in this research area. In their model,
represented in the figure below, the appropriateness of user involvement was
determined by two classes of conditional variables: involvement roles and
development conditions. The involvement role determines who the participants are
to be in the development of the IS. In their paper, three types of users were
identifies: primary users who uses the output from the system; secondary users who
generates system inputs and top level management. The development conditions
represent the characteristics of the development process. Here, they identified two
classes of development conditions that can affect user involvement: the type of
system being developed and the stage in the development process. According to
Ives and Olson, the levels of user involvement vary between types of systems.
There are systems where user involvement is critical (e.g. Decision Support
Systems) and systems where it is inappropriate (e.g. highly technical systems
whose product is unimportant to the user). User involvement will be considered
critical at the requirement gathering and definition stages but less so at the
installation stage (Ives and Olson, 1984).
Chapter Two: Literature Review
13
Figure 2 - A Descriptive Model of User Involvement (Ives and Olson, 1984)
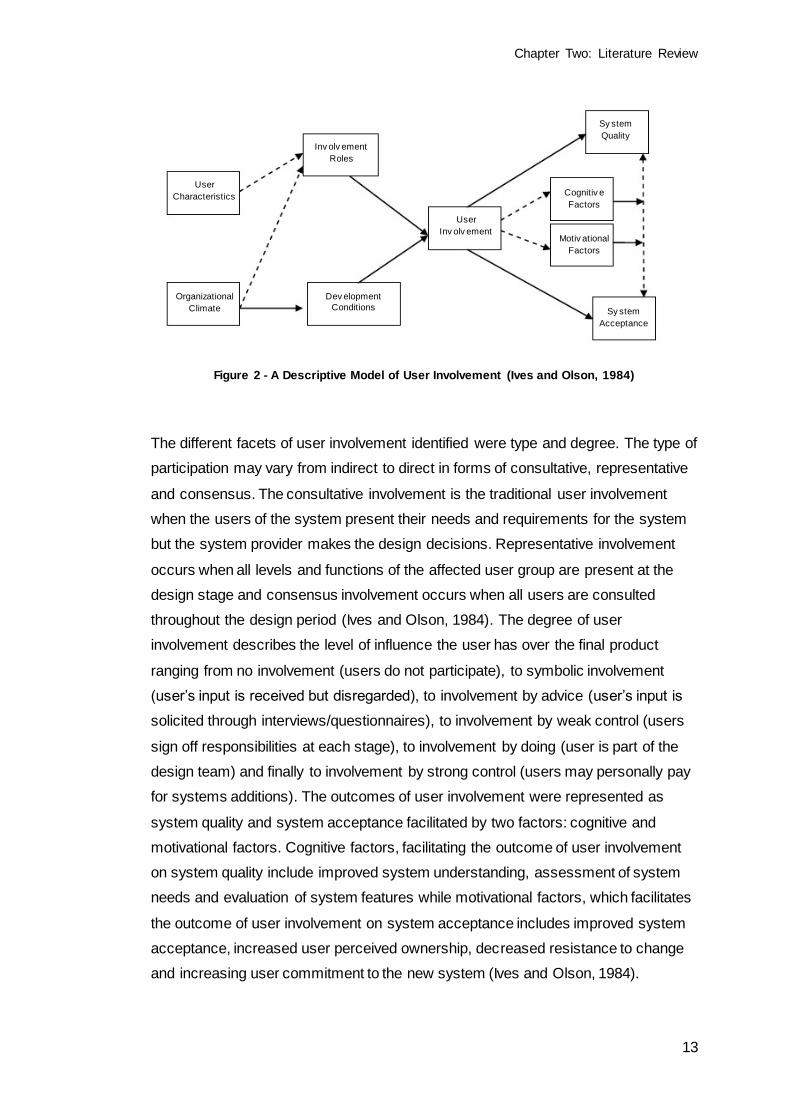
The different facets of user involvement identified were type and degree. The type of
participation may vary from indirect to direct in forms of consultative, representative
and consensus. The consultative involvement is the traditional user involvement
when the users of the system present their needs and requirements for the system
but the system provider makes the design decisions. Representative involvement
occurs when all levels and functions of the affected user group are present at the
design stage and consensus involvement occurs when all users are consulted
throughout the design period (Ives and Olson, 1984). The degree of user
involvement describes the level of influence the user has over the final product
ranging from no involvement (users do not participate), to symbolic involvement
(user’s input is received but disregarded), to involvement by advice (user’s input is
solicited through interviews/questionnaires), to involvement by weak control (users
sign off responsibilities at each stage), to involvement by doing (user is part of the
design team) and finally to involvement by strong control (users may personally pay
for systems additions). The outcomes of user involvement were represented as
system quality and system acceptance facilitated by two factors: cognitive and
motivational factors. Cognitive factors, facilitating the outcome of user involvement
on system quality include improved system understanding, assessment of system
needs and evaluation of system features while motivational factors, which facilitates
the outcome of user involvement on system acceptance includes improved system
acceptance, increased user perceived ownership, decreased resistance to change
and increasing user commitment to the new system (Ives and Olson, 1984).
Inv olv ement
Roles
User
Characteristics
Organizational
Climate
Dev elopment
Conditions
User
Inv olv ement
Sy stem
Quality
Cognitiv e
Factors
Motiv ational
Factors
Sy stem
Acceptance
Chapter Two: Literature Review
14
From their research critique, the authors identified three broad categories of
problems with the research: much of the research studies theorized the effect of
user involvement on system quality or acceptance and there was not a common and
shared view of user involvement and MIS success; in their review methodologies,
they reported that most of the studies were survey data collected after the
development of the system and those systems were either single systems with their
lack of external validity from different methodologies or multiple systems and their
inadequacy in controlling sample selections; the existence of weak measures of
user involvement and system success resulting from lack of a conceptual foundation
to guide the measurement developments and the absence of a measurement
validation tool. In the conclusion on their paper, Ives and Olson reported that the
benefits of user involvement on system success had not been strongly
demonstrated and the consistent lack of rigor in the research then seriously limits
the understanding of the role of user involvement in IS development (Ives and
Olson, 1984).
2.4.3 IS Success: The Quest for the Dependent Variable
In 1992, DeLone and McLean proposed a taxonomy and interactive model known as
the DeLone and McLean IS Success Model as a framework for theorizing and
operationalizing the success of Information Systems. The primary purpose of the
model was to synthesize existing research (including the previously described two)
on Information System success into a more comprehensive multidimensional
framework that can be used to evaluate the success of Information Systems
(DeLone and McLean, 1992).
DeLone and McLean based their taxonomy on the Information theory of Mason
(1978) whose grew out of Shannon and Weaver’s communications research (1949),
and the empirical research studies on Management Information System (MIS) over
a period of seven years from 1981 - 1987. In Shannon and Weaver’s communication
theory, one definition of communication relevant to this research is as a process by
which one system A (say a customer’s credit/debit system in a bank) affects another
system B (customer’s credit check system). The affected system B is the receiver
and the producing system A performs the functions of observing, recording,
collecting, storing, analysing, processing and transmitting. The focus of their
communication theory was in the successful transfer of information and they
identified three different levels of problems that can affect or complicate this
transmission (Shannon and Weaver, 1949).
Chapter Two: Literature Review
15
1. Level A or Technical Problem which is concerned with how accurate and
efficient the symbols of communication are.
2. Level B or Semantic Problem which is concerned with the precision of the
communication symbols. How successful were the symbols in conveying
their intended meaning or purpose?
3. Level C or Effectiveness Problem which is concerned with the effect of the
received meaning on the receiver.
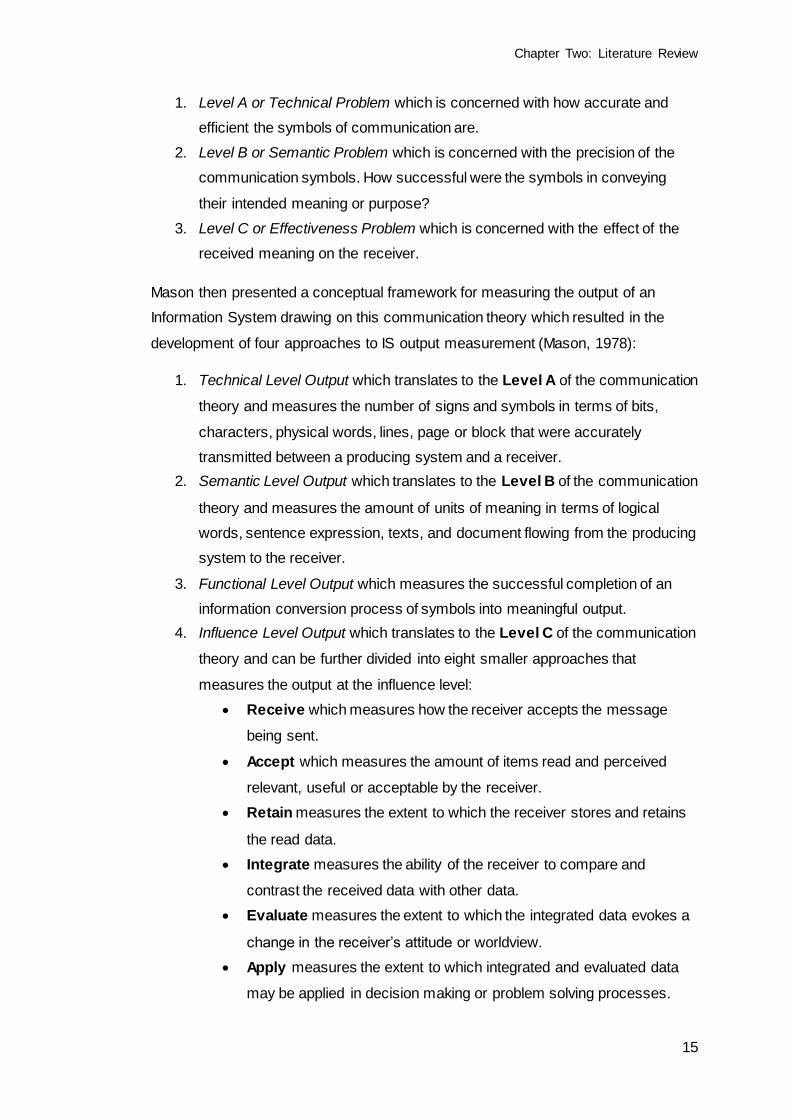
Mason then presented a conceptual framework for measuring the output of an
Information System drawing on this communication theory which resulted in the
development of four approaches to IS output measurement (Mason, 1978):
1. Technical Level Output which translates to the Level A of the communication
theory and measures the number of signs and symbols in terms of bits,
characters, physical words, lines, page or block that were accurately
transmitted between a producing system and a receiver.
2. Semantic Level Output which translates to the Level B of the communication
theory and measures the amount of units of meaning in terms of logical
words, sentence expression, texts, and document flowing from the producing
system to the receiver.
3. Functional Level Output which measures the successful completion of an
information conversion process of symbols into meaningful output.
4. Influence Level Output which translates to the Level C of the communication
theory and can be further divided into eight smaller approaches that
measures the output at the influence level:
Receive which measures how the receiver accepts the message
being sent.
Accept which measures the amount of items read and perceived
relevant, useful or acceptable by the receiver.
Retain measures the extent to which the receiver stores and retains
the read data.
Integrate measures the ability of the receiver to compare and
contrast the received data with other data.
Evaluate measures the extent to which the integrated data evokes a
change in the receiver’s attitude or worldview.
Apply measures the extent to which integrated and evaluated data
may be applied in decision making or problem solving processes.
Chapter Two: Literature Review
16
Change in Behaviour measures the changes in the receiver’s
behaviour after application.
Change in Systems Behaviour measures changes in the total
system.
In adapting the Shannon and Weaver’s communication theory, Mason used their
three levels of communication problems as specific areas of analysis in measuring
the output of an IS. The fourth level was introduced to analyse information from the
point of the processes which transform or produce this information. The resulting
framework consequently focuses on information as an output rather than the whole
process of transmitting information and sets the foundation for the multidimensional
model of IS success that is now known as the DeLone and McLean Model of IS
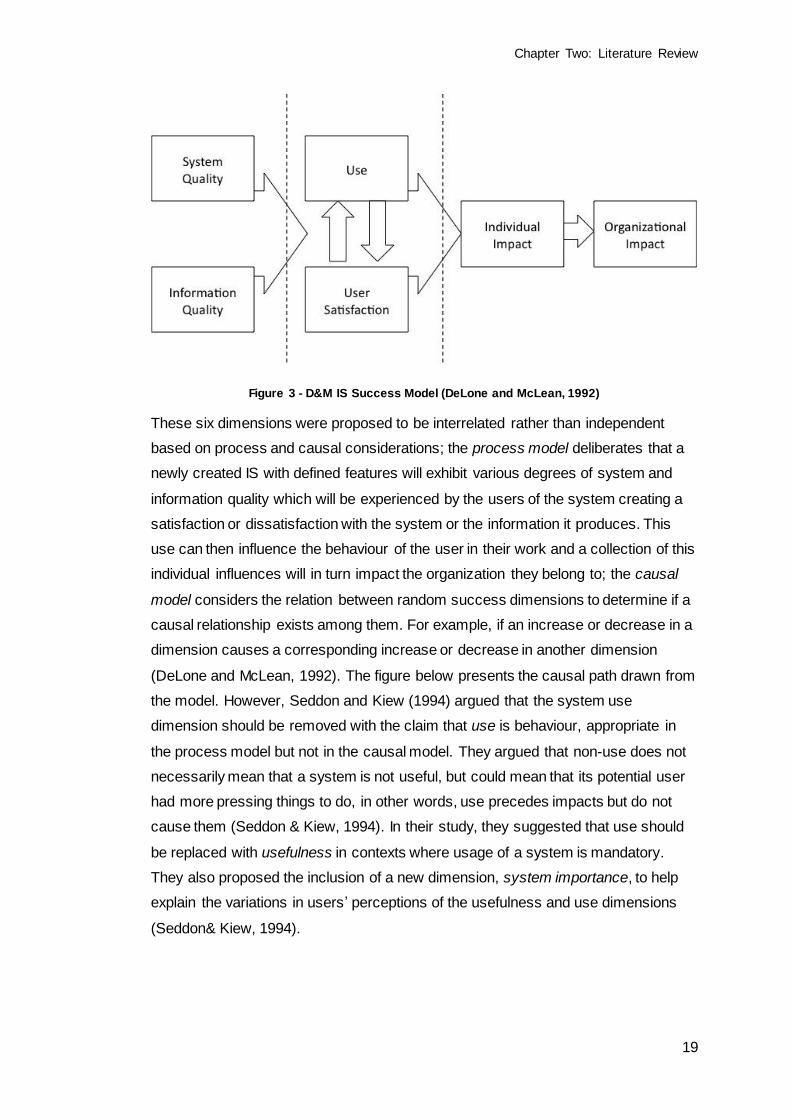
Success (D&M IS Success Model). In their model, DeLone and McLean proposed
six dimensions of IS success: “systems quality” which measures the technical output
or success; “information quality” which measures the semantic output of success;
“system use”, “user satisfaction”, “individual impacts” and “organizational impacts”
all of which measures the influence output of success (DeLone and McLean, 1992).
2.4.3.1 System Quality
This success dimension is concerned with the information processing system itself
like how well the various components of the system work together. These
components could be the hardware, software or network components (DeLone and
McLean, 1992). According to the authors, a number of empirical studies had been
carried out to identify suitable and feasible variables that can be used to measure
system quality in an IS. The flexibility of the system, convenience of access,
response time and integration of systems (Bailey and Pearson, 1983), reliability,
response time, ease of use, ease of learning and perceived usefulness of IS were
some of the commonly employed variables in these studies. In a customer
management system, system quality will generally be concerned with characteristics
of the system like reliability of hardware, ease of use, response time to button clicks
for example and so forth. The table below shows a complete list of twelve studies
that identified distinct variables to measure system quality.
2.4.3.2 Information Quality
Measuring the information quality of an IS refers to the quality of the output
produced by the system which is primarily in form of on-screen reports (DeLone and
McLean, 1992). Nine studies were studied and some of the identified variables of
information quality were its accuracy, precision, timeliness, reliability, completeness,
Chapter Two: Literature Review
17
relevance and the format it was presented in. According to the authors, these
identified variables are understandably from the perspective of the user of the
information and thus fairly subjective in character. A stock broker using a stock
broking system is likely to access the information quality of the system based on its
accuracy and timeliness while the user of a marketing system might consider the
information quality based on relevance and reliability.
2.4.3.3 System Use
This success dimension was one of the most frequently reported measures of IS
success and it describes the way the system user consumes or uses the output
produced by the Information System (DeLone and McLean, 1992). This use was
measured as actual use rather than reported use but the authors however pointed to
the fact that actual or perceived system use as an IS success measure only makes
sense for voluntary or discretionary users as opposed to mandatory users. From
their findings, motivation to use, frequency of use and time spent per session were
some variables that had been used to measure this dimension.
2.4.3.4 User Satisfaction
This measures the user’s response to their use of an IS output, and is probably the
most widely used single measure of IS success because it is hard to refute the
success of a system when its users have expressed their likeness for it (DeLone
and McLean, 1992). Another reason for its popularity is the availability of a reliable
tool by Bailey and Pearson which measures satisfaction. Researchers like (Ein-Dor
and Segev, 1978) and (Hamilton and Chervany, 1981) have found user satisfaction
to be an appropriate success measure when a specific IS was involved. However, in
a situation where an IS use is mandatory, this success measure becomes more
useful and the previously discussed measure, system use, becomes less useful
(DeLone and McLean, 1992). The table below presents a summary of the empirical
studies that have been carried out to measure user satisfaction using a single
variable or multiple variables
2.4.3.5 Individual Impact
Individual impact is perhaps the most difficult measure to define without ambiguity
(DeLone and McLean, 1992). The authors describes impact as closely related to
performance so an improved performance is considered a positive impact but on the
other hand, impacts could also mean that the IS has improved the user’s
understanding on a particular concept, improved their productivity, cause a change
in their user activity or change their perception on the usefulness or importance of
Chapter Two: Literature Review
18
the system. From these possible descriptions, impact thus becomes a general term
that can be used to measure the extent to which the IS has caused a behavioural
change (capabilities and effectiveness) in its key users.
2.4.3.6 Organizational Impact
While academic researchers tend to avoid performance measures such as
organizational impacts due to the difficulty in isolating the changes influenced from
an IS use from other factors that could influence the organization, this measure is of
considerable importance to IS providers (DeLone and McLean, 1992).
Organizational Impact is a measure of the extent to which the IS has caused a
positive change in organizational results and capabilities. This could also be a way
for an organization to justify or count the value of investments that had been made
through the provision of the Information System.
The authors while conceding to the fact that much work is still required in accessing
the business value of information systems, they were been able to present through
twenty empirical researches variables such as cost reductions (e.g. operational
costs); reduced staff costs (e.g. reduced number of staff/hours required for the
process); overall productivity improvement (e.g. key-users are able to achieve more
within certain hours/days compared to previous times); improved outcomes or
outputs (e.g. better quality of produced information); improved business processes;
better positioning for e-Government/Business (e.g. enhancing government to
businesses relationships) which have been used to measure organizational impacts
of an IS.
2.4.3.7 D&M IS Success Model
One of the primary purposes of DeLone and McLean’s 1992 paper was an attempt
to reduce the countless success variables which had been carefully examined in
existing literatures to a more manageable categorization (DeLone and McLean,
1992). While the authors discovered that no single variable is intrinsically better than
the other and that the selection of a success variable was usually a function of the
research objective, the organizational context, the size and the environment of the
organization being studied etc., they identified that many of these variables fell into
one of the six dimensions shown in the figure below.
Chapter Two: Literature Review
19
Figure 3 - D&M IS Success Model (DeLone and McLean, 1992)
These six dimensions were proposed to be interrelated rather than independent
based on process and causal considerations; the process model deliberates that a
newly created IS with defined features will exhibit various degrees of system and
information quality which will be experienced by the users of the system creating a
satisfaction or dissatisfaction with the system or the information it produces. This
use can then influence the behaviour of the user in their work and a collection of this
individual influences will in turn impact the organization they belong to; the causal
model considers the relation between random success dimensions to determine if a
causal relationship exists among them. For example, if an increase or decrease in a
dimension causes a corresponding increase or decrease in another dimension
(DeLone and McLean, 1992). The figure below presents the causal path drawn from
the model. However, Seddon and Kiew (1994) argued that the system use
dimension should be removed with the claim that use is behaviour, appropriate in
the process model but not in the causal model. They argued that non-use does not
necessarily mean that a system is not useful, but could mean that its potential user
had more pressing things to do, in other words, use precedes impacts but do not
cause them (Seddon & Kiew, 1994). In their study, they suggested that use should
be replaced with usefulness in contexts where usage of a system is mandatory.
They also proposed the inclusion of a new dimension, system importance, to help
explain the variations in users’ perceptions of the usefulness and use dimensions
(Seddon& Kiew, 1994).
Chapter Two: Literature Review
20
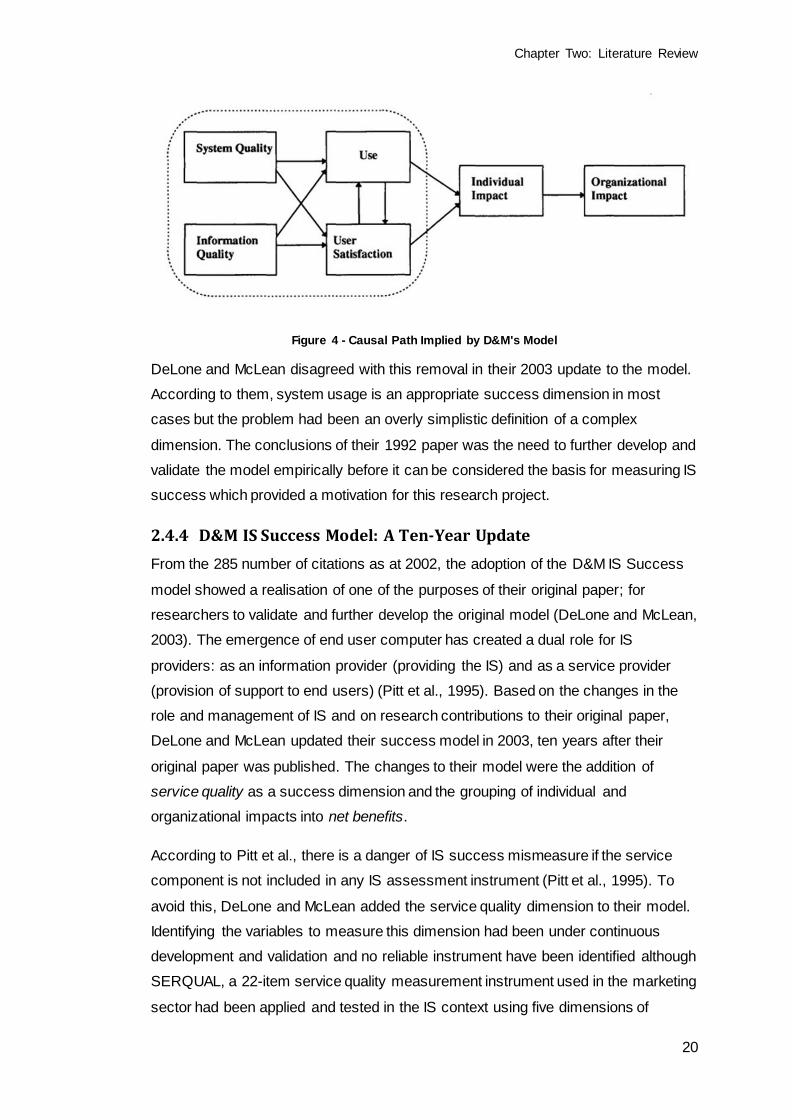
Figure 4 - Causal Path Implied by D&M's Model
DeLone and McLean disagreed with this removal in their 2003 update to the model.
According to them, system usage is an appropriate success dimension in most
cases but the problem had been an overly simplistic definition of a complex
dimension. The conclusions of their 1992 paper was the need to further develop and
validate the model empirically before it can be considered the basis for measuring IS
success which provided a motivation for this research project.
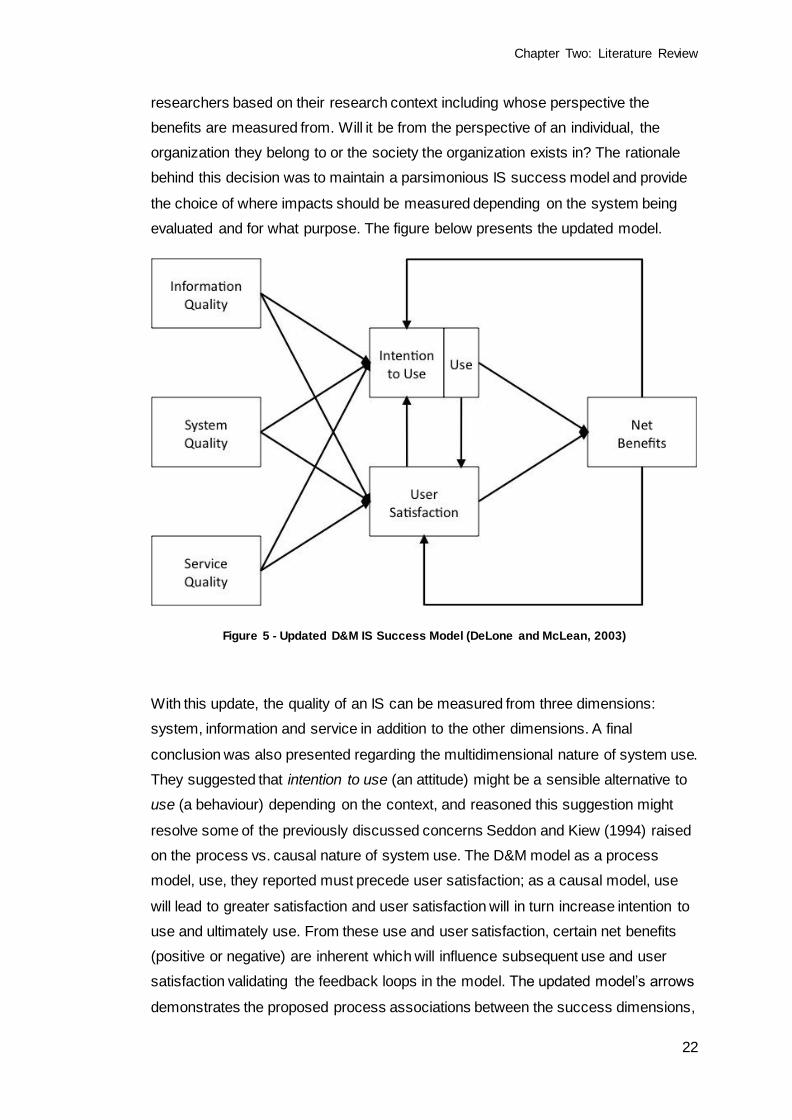
2.4.4 D&M IS Success Model: A Ten-Year Update
From the 285 number of citations as at 2002, the adoption of the D&M IS Success
model showed a realisation of one of the purposes of their original paper; for
researchers to validate and further develop the original model (DeLone and McLean,
2003). The emergence of end user computer has created a dual role for IS
providers: as an information provider (providing the IS) and as a service provider
(provision of support to end users) (Pitt et al., 1995). Based on the changes in the
role and management of IS and on research contributions to their original paper,
DeLone and McLean updated their success model in 2003, ten years after their
original paper was published. The changes to their model were the addition of
service quality as a success dimension and the grouping of individual and
organizational impacts into net benefits.
According to Pitt et al., there is a danger of IS success mismeasure if the service
component is not included in any IS assessment instrument (Pitt et al., 1995). To
avoid this, DeLone and McLean added the service quality dimension to their model.
Identifying the variables to measure this dimension had been under continuous
development and validation and no reliable instrument have been identified although
SERQUAL, a 22-item service quality measurement instrument used in the marketing
sector had been applied and tested in the IS context using five dimensions of
Chapter Two: Literature Review
21
service quality: tangibles, reliability, responsiveness, assurance and empathy (Pitt et
al., 1995).
Tangibles describes the physical facilities of the IS provider such as their up-
to-date software, building and the appearance of the personnel.
Reliability describes the ability of the provider to render the promised service
dependably and accurately.
Responsiveness describes the promptness and willingness of the provider to
help customers.
Assurance describes the confidence and trust the customer has regarding
the ability and expertise of the provider on the service problem.
Empathy describes the ability of the provider to reflect the customer’s best
interests in their interactions with them.
SERVQUAL measures the service quality for each dimension by finding the
difference score between the service that customers expect and the performance
they perceive to have received. Van Dyke et al. has challenged the SERVQUAL
instrument indicating it suffered from both empirical (e.g. reduced reliability, poor
convergent validity and poor predictive validity) and conceptual (difficulty in
operationalizing perceived service quality as a gap score, the ambiguity of the
expectations constructs and the unsuitability of using a single measure of service
quality across different industries) difficulties (1997). While the authors agree that
the SERVQUAL instrument needs to be further developed, they believed that
service quality should be added to system quality and information quality as another
IS success dimension (DeLone and McLean, 2003).
According to DeLone and McLean, the impacts of an IS have evolved over the years
intimating suggestions from researchers a need to create more types of impact such
as consumer impacts, societal impacts. After considering these suggestions, the IS
success model was further refined by grouping of all impacts into a category called -
net benefits. Net benefits raised three issues that they advised researchers to take
into account when in use: “what qualifies as a benefit”? “for whom”? and “at what
level of analysis”? According to the authors, the original term “impacts” could have
been interpreted positively or negatively, possibly creating confusion as to whether
the impact results were good or bad. In light of this, the term “net benefits” is a more
accurate descriptor as it recognizes that no outcome is wholly positive. Who
ultimately appreciates these benefits? Is it the organization that sponsored the
system? Is it the users of the system? These are decisions to be made by
Chapter Two: Literature Review
22
researchers based on their research context including whose perspective the
benefits are measured from. Will it be from the perspective of an individual, the
organization they belong to or the society the organization exists in? The rationale
behind this decision was to maintain a parsimonious IS success model and provide
the choice of where impacts should be measured depending on the system being
evaluated and for what purpose. The figure below presents the updated model.
Figure 5 - Updated D&M IS Success Model (DeLone and McLean, 2003)
With this update, the quality of an IS can be measured from three dimensions:
system, information and service in addition to the other dimensions. A final
conclusion was also presented regarding the multidimensional nature of system use.
They suggested that intention to use (an attitude) might be a sensible alternative to
use (a behaviour) depending on the context, and reasoned this suggestion might
resolve some of the previously discussed concerns Seddon and Kiew (1994) raised
on the process vs. causal nature of system use. The D&M model as a process
model, use, they reported must precede user satisfaction; as a causal model, use
will lead to greater satisfaction and user satisfaction will in turn increase intention to
use and ultimately use. From these use and user satisfaction, certain net benefits
(positive or negative) are inherent which will influence subsequent use and user
satisfaction validating the feedback loops in the model. The updated model’s arrows
demonstrates the proposed process associations between the success dimensions,
Chapter Two: Literature Review
23
however, the authors recommend future researchers who uses this model to
hypothesize its causal associations according to the context of their studies.
Chapter Three: Research Methodology
24
CHAPTER THREE
RESEARCH METHODOLOGY
3.1 Overview
The purpose of this research project was to adapt the D&M IS Success Model to the
measurement of TPS. The chapter starts with a description of the hypotheses
implied from the updated DeLone and McLean’s model followed by a justification of
the selected research methodology and questionnaire design used. The final
sections present an overview of how data collection was carried out and the
limitations to the chosen methods.
3.2 Research Model and Hypotheses
The literature review from the previous chapter highlighted D&M proposed
dimensions to the success of an IS. It also presented some of the validated
variables that had been used to measure each of these dimensions and the implied
causal associations between them. Six success dimensions were chosen to
measure the success of the selected TPS from the case study. Four were from the
updated D&M model: system quality, information quality, service quality and overall
user satisfaction. The last two dimensions: usefulness and system importance were
adopted from Seddon and Kiew’s partial test of the D&M IS Success Model (Seddon
and Kiew, 1994). In their paper, they held that when the usage of a system is
mandatory, the number of hours spent on the system does not wholly convey the
system’s usefulness and so success. Usefulness, they argued was a more
meaningful success dimension. This was adapted to the research model as the case
studied TPS is a mandatory system. This usefulness dimension was also used to
measure the impact of the TPS from the users’ perspectives. Seddon and Kiew
added system importance to the D&M model to explain the variations between
usefulness and user satisfaction. According to them, it seemed likely that the user’s
opinions about the relevance of the system to their job functions (the importance of
their tasks) will influence their opinions on the value of the system and ultimately the
success of the system (Seddon and Kiew, 1994). They were right, the conclusions
on their tests showed that while task importance was independent of the system, it
had a major influences on the perceived usefulness of the system. In the
conclusions of their paper, they cautioned that in adapting the usefulness
Chapter Three: Research Methodology
25
dimension, system importance should be measured (Seddon and Kiew, 1994). The
final adapted success model is presented below.
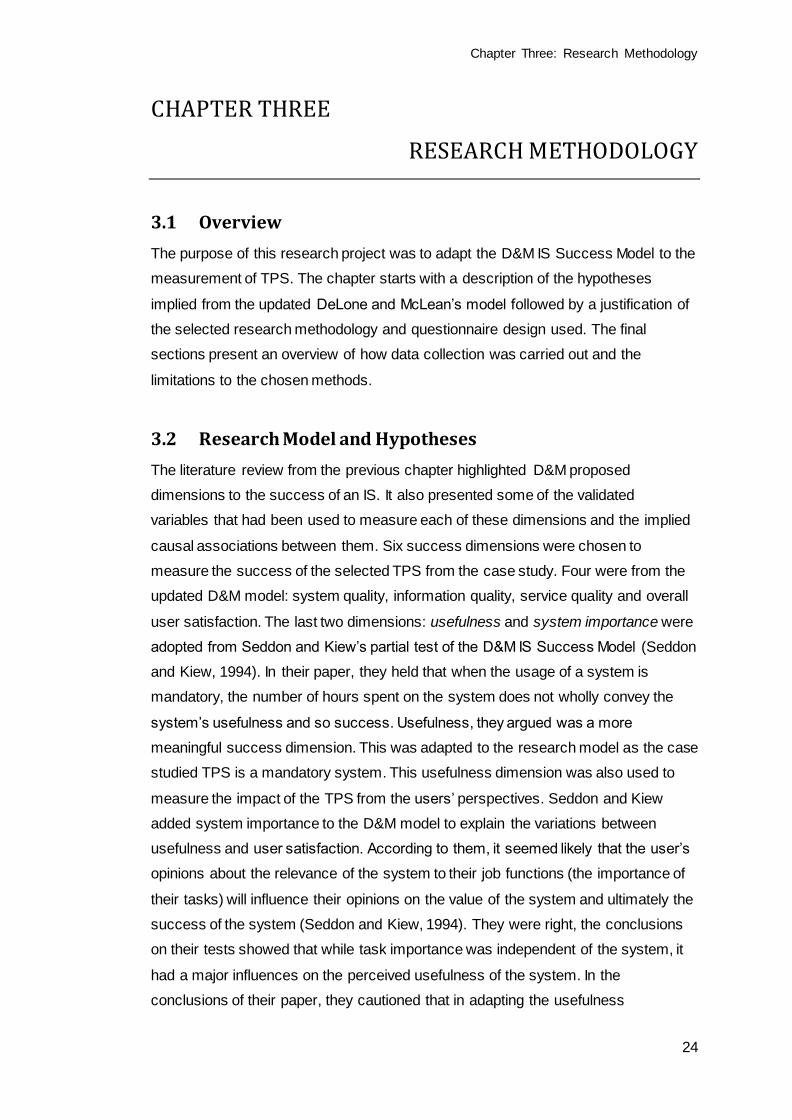
Figure 6 - Adapted IS Success Model to Research Study
In the above model, the model elements in the dotted rectangle are the
interdependent variables in the model. From this model, the research hypotheses
were formulated and are presented below.
H1: Perceived System Quality predicts User Satisfaction
H2: Perceived Information Quality predicts User Satisfaction
H3: Perceived Service Quality predicts User Satisfaction
H4: Perceived System Quality predicts Usefulness
H5: Perceived Information Quality predicts Usefulness
H6: Perceived System Importance predicts Usefulness
H7: Perceived System Importance predicts User Satisfaction
H8: Perceived Usefulness predicts User Satisfaction
Chapter Three: Research Methodology
26
3.3 Research Methodology
A quantitative approach to research is inherently deductive. A deductive approach is
a test of theories, going from more general to the more specific (a top-down
approach) (Trochim, 2006). DeLone and McLean updated model gave rise to eight
hypotheses which were to be confirmed, rejected or modified through findings from
data collected and analysed. As a result, the deductive approach was used in this
research. The main point of a quantitative research method is that measurement is
valid, reliable and can be generalized with its clear anticipation of cause and effect
(Cassell and Symon, 2004). With its particularistic and deductive nature, the
quantitative method depends on the formulation of a research hypothesis and an
empirical confirmation using a specific data set (Frankfort-Nachmias and Nachmias,
1992). In a quantitative method of research, the scientific hypothesis is of no value;
this means that the researcher’s personal opinions, subjective preferences and
prejudices are not applicable. The quantitative approach was useful as it helped
prevent prejudice in the collection and presentation of research data. The
quantitative data collection methods (controlled observations, mass surveys, and
laboratory experiments) are useful and reliable especially when a study needs to
measure the cause and effect relationships evident between pre-selected and
discrete variables (Creswell, 2003). Using the survey collection method in this
research helped specify clearly and precisely variables, both dependent and
independent, that were needed in the study, analyse their findings independent of
subjectivity of judgement and deliver a more objective investigation, discussion, and
conclusion.
3.3.1 Sampling
To validate the D&M IS success model on TPS, the Figure 5 D&M IS model was
adapted to a specific TPS, provided by Interswitch Limited, a Nigerian company.
This TPS is a web-based system that enables corporates and government
organizations receive payments made by their distributors, agents and customers
into their accounts from all of the banks in Nigeria. This system was selected after
an informal discussion with the head of the development team on the need for a
case study system. In the end, the TPS was selected because there had been some
difficulties with its implementation, and a wide range of satisfaction scores was
likely. In addition, the system is used by bank staff, corporate staff and Interswitch
staff (a total of 5372 at the time of study) all of which had been trained using the
same set of training materials provided by Interswitch. There were therefore a
smaller number of extraneous factors that could cause variance in the usefulness
Chapter Three: Research Methodology
27
and satisfaction scores. The case study approach was an opportunity to study a
specific case of “real” users’ perceptions of a “real” system in “real” time. Even
though the study focused only on one system in one organization, the research
setting could be expected to increase the internal validity of the study and to some
extent its external validity as well. To attain a 95% confidence level that the sample
results are inferable to the sampling frame, 357 users were selected to participate in
the survey (a recommendation from the online survey tool). However, knowing the
response rate may be less than 50%, over sampling was estimated to compensate
for this lack of coverage. For this reason, the sample was adjusted to 380 users.
3.3.2 Data Collection
The survey questionnaire was constructed from the six dimensions in the adapted IS
success model. Validated variables to measure each dimension were found in
relevant literatures whose reliability of questions and scales had been tested. Each
of these dimensions was represented per section in the questionnaire including a
demographic section that was added to give a general overview to the study
sample. Each section presented a number of questions and/or statements which
represent the dimension’s validated variables and negative sentences that were
used to measure dimensions will be reworded prior to data analysis, this is to have
the same positive rating for the whole dimension. The table below shows a summary
of the dimensions and variables used.
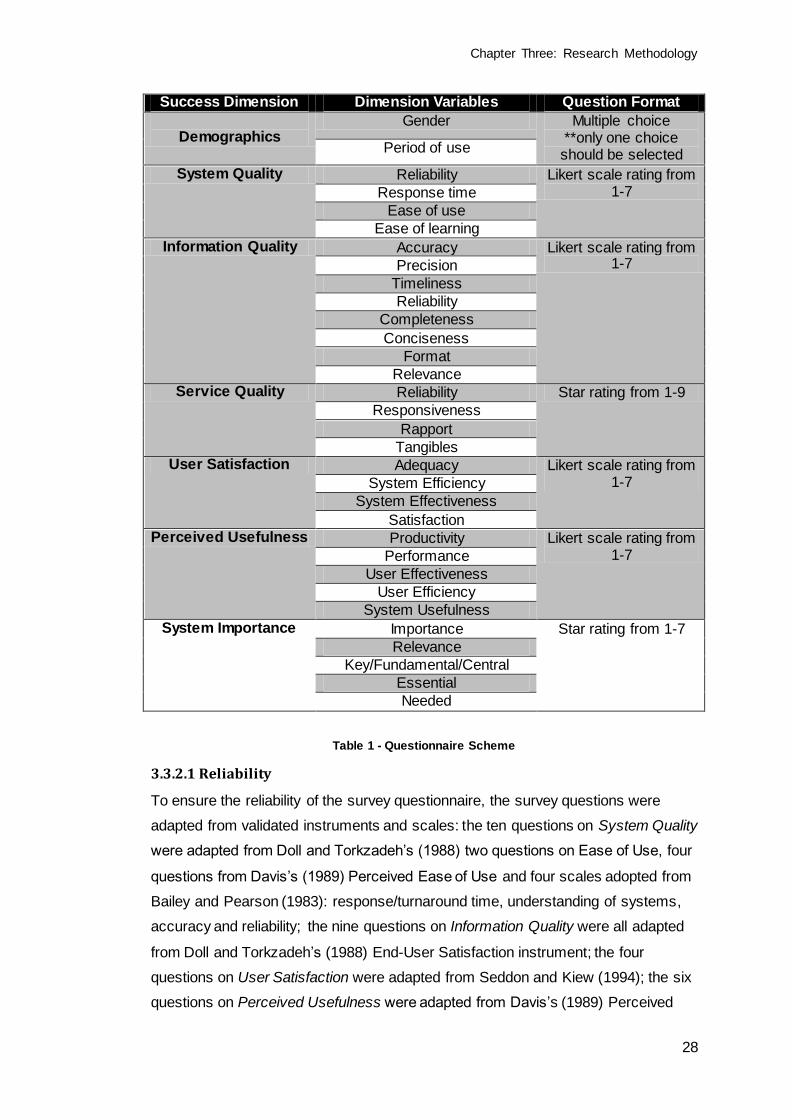
Chapter Three: Research Methodology
28
Success Dimension Dimension Variables Question Format
Demographics
Gender Multiple choice **only one choice should be selected Period of use
System Quality Reliability Likert scale rating from 1-7 Response time
Ease of use
Ease of learning
Information Quality Accuracy Likert scale rating from 1-7 Precision
Timeliness
Reliability
Completeness
Conciseness
Format
Relevance Service Quality Reliability Star rating from 1-9
Responsiveness
Rapport
Tangibles User Satisfaction Adequacy Likert scale rating from
1-7 System Efficiency
System Effectiveness
Satisfaction Perceived Usefulness Productivity Likert scale rating from
1-7 Performance
User Effectiveness
User Efficiency
System Usefulness
System Importance Importance Star rating from 1-7
Relevance
Key/Fundamental/Central
Essential
Needed
Table 1 - Questionnaire Scheme
3.3.2.1 Reliability
To ensure the reliability of the survey questionnaire, the survey questions were
adapted from validated instruments and scales: the ten questions on System Quality
were adapted from Doll and Torkzadeh’s (1988) two questions on Ease of Use, four
questions from Davis’s (1989) Perceived Ease of Use and four scales adopted from
Bailey and Pearson (1983): response/turnaround time, understanding of systems,
accuracy and reliability; the nine questions on Information Quality were all adapted
from Doll and Torkzadeh’s (1988) End-User Satisfaction instrument; the four
questions on User Satisfaction were adapted from Seddon and Kiew (1994); the six
questions on Perceived Usefulness were adapted from Davis’s (1989) Perceived
Chapter Three: Research Methodology
29
Usefulness; the five questions on System Importance were adapted from Seddon
and Kiew (1994); and the fifteen questions on Service Quality grouped under
responsiveness, reliability, tangibles and rapport categories were all adapted from
Kettinger and Lee’s (2005) Zones of Tolerance SERVQUAL (ZOT SERVQUAL)
instrument. Their instrument was developed to address the concerns with the
original SERVQUAL instrument discussed in chapter two, ZOT SERVQUAL
approached the measurement of service quality as a range of levels rather than the
single expectation point the original SERVQUAL instrument measured. Using ZOT,
the IS provider’s service quality was measured on three levels of service: desired
service (the level of service desired), adequate service (the minimum level of service
the customers were willing to accept) and received service (the level of service
received from their most recent interaction with the provider) (Kettinger and Lee,
2005). From these levels of service, the IS provider can recognize the service areas
where they were not meeting the minimum levels of service and can in turn, focus
on getting the levels up.
3.3.2.2 Validity
The validity of the constructed questionnaire was tested from the content
perspective. To test the content validity of the questionnaire, five respondents were
asked to complete the survey. This was done to obtain feedback on the ease of
navigation, comprehension of questions and time spent completing the
questionnaire. Their answers were not part of the actual study process and were
only used for testing purposes. The respondents were asked to provide suggestions
or any corrections to further improve and validate the survey instrument. With these
feedbacks, the survey questionnaire was revised changing ambiguous questions
into clearer ones to ensure comprehension.
3.3.2.3 Administration of Questionnaire
The survey questionnaire was web-based because it was the most cost effective
way to administer the questionnaire. In addition to this, the survey tool provided
greater flexibility to displaying the questions with radio buttons, star rankings,
instruction screens and likert matrices; it also provided immediate data validation
and was used to enforce rules such as required questions, or a minimum number of
answers per row or column, which cannot be done in email or with paper. Anonymity
was another reason for this choice as the respondents’ replies were of their own free
will with no influences as might have been in the case of a face to face interview.
The link to the survey questionnaire was sent via an email to a total of 380 system
users whose email addresses were provided by the company.
Chapter Three: Research Methodology
30
3.3 Ethical Aspects
The involvement of human participants or human related data is was required for
this research project. This was through an informal interview and survey
questionnaires. Therefore, descriptions of the study and a guarantee that all
responses will remain confidential and anonymous were presented at the beginning
of the survey with a clause that respondents’ consent will be implied upon
completion of the survey. The researcher confirms to have read and abided by the
University’s Ethics Policy for Research Involving Human Participants, Data and
Tissue.
3.4 Limitations of Methodology
3.4.1 Low Response Rate
The number of respondents to the online survey questionnaire was not large enough
as statistical tests require a larger sample size to ensure a representative
distribution of the population and to be considered representative of groups of
people to whom results will be generalized or transferred.
3.4.2 Time Constraints
The time available for the research was insufficient to collect as much data as would
have been adequate for an exhaustive statistical analysis.
3.4.3 Sample Bias
Respondents may avoid using extreme response categories (central tendency bias);
agree with statements as presented (acquiescence response bias); or try to portray
themselves or their group in a more favourable light (social desirability bias).
Chapter Four: Data Analysis and Findings
31
CHAPTER FOUR
DATA ANALYSIS AND FINDINGS
This chapter describes the analysis on the data collected from the survey
questionnaire and its results will be used to determine if the hypotheses implied from
the research model hold true or not. It is made of 3 main sections that described the
data collected on each success dimension, and presented the results of the
analyses. Section 4.1 presented the demographic results (gender and period of
use). Section 4.2 presented the results on the success dimensions (system quality,
information quality, service quality, system importance, user satisfaction and
usefulness). The last section, discusses the results of the analysis carried out to test
the hypotheses. SPSS software version 18, provided by the university, was used to
process the survey results. The sample size for this research was 380 registered
TPS users (bank, corporate and Interswitch users). A total of 133 completed
responses were obtained, 179 partially completed and no responses from the rest.
The 133 valid feedbacks received presented a response rate of 35%. Preece et al.
(2002) stated that “forty percent return is generally acceptable for many surveys but
much lower rates are common.” Therefore, the response rate was considered to be
fairly successful.
Different levels of analysis were carried out on the collected data and techniques
selected based on the type of data (ordinal, interval). With the research aims and
objectives in mind, a descriptive analysis, describing the distribution and range of
responses to each success dimension was performed. These dimensions were
independently analysed by univariate analysis using pie charts and bar charts. The
collected data were “summed” where appropriate to enable meaningful statistical
comparisons of subgroups. After this, bivariate analysis was carried out in order to
explore the relationships between two dimensions and the significant level of those
relationships, using Spearman’s rank correlation coefficient, which is the most
suitable statistical technique for exploring the relationship between two likert scales
responses (e.g. system quality and user satisfaction) (MASH, 2009; Jamieson;
2004). In addition, the ANOVA test was used to determine any significant variances
in responses.
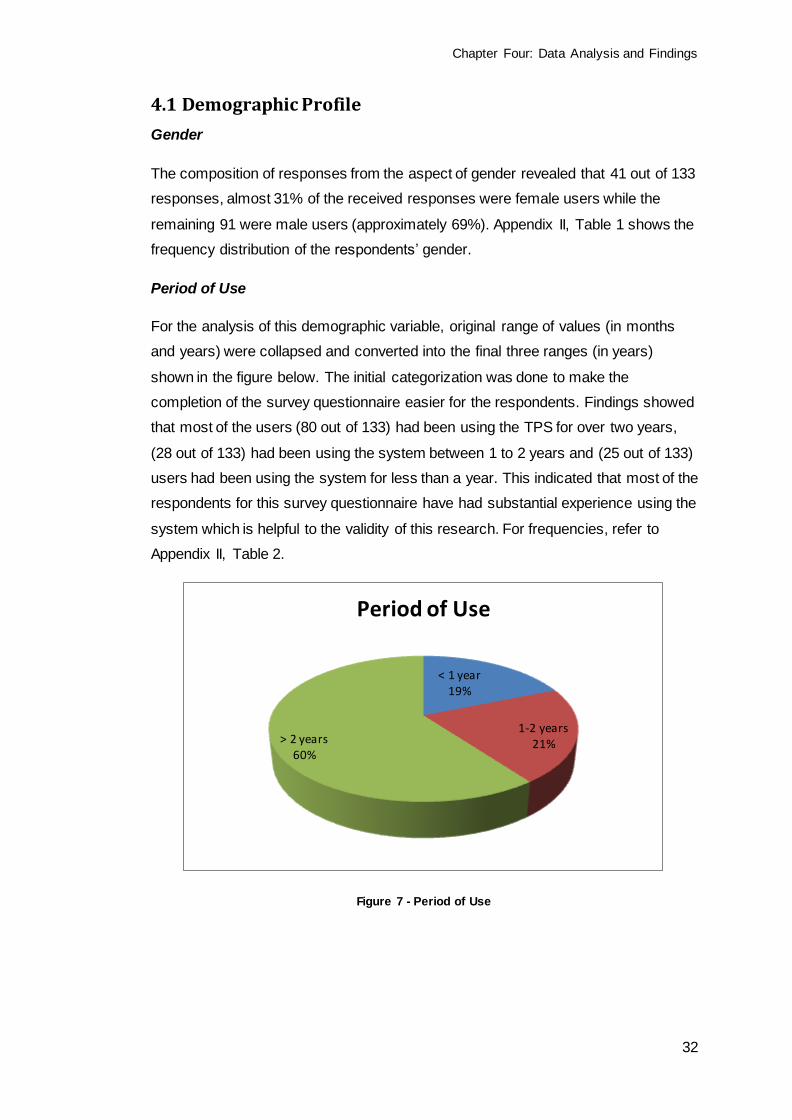
Chapter Four: Data Analysis and Findings
32
4.1 Demographic Profile
Gender
The composition of responses from the aspect of gender revealed that 41 out of 133
responses, almost 31% of the received responses were female users while the
remaining 91 were male users (approximately 69%). Appendix II, Table 1 shows the
frequency distribution of the respondents’ gender.
Period of Use
For the analysis of this demographic variable, original range of values (in months
and years) were collapsed and converted into the final three ranges (in years)
shown in the figure below. The initial categorization was done to make the
completion of the survey questionnaire easier for the respondents. Findings showed
that most of the users (80 out of 133) had been using the TPS for over two years,
(28 out of 133) had been using the system between 1 to 2 years and (25 out of 133)
users had been using the system for less than a year. This indicated that most of the
respondents for this survey questionnaire have had substantial experience using the
system which is helpful to the validity of this research. For frequencies, refer to
Appendix II, Table 2.
Figure 7 - Period of Use
< 1 year 19%
1-2 years 21% > 2 years
60%
Period of Use
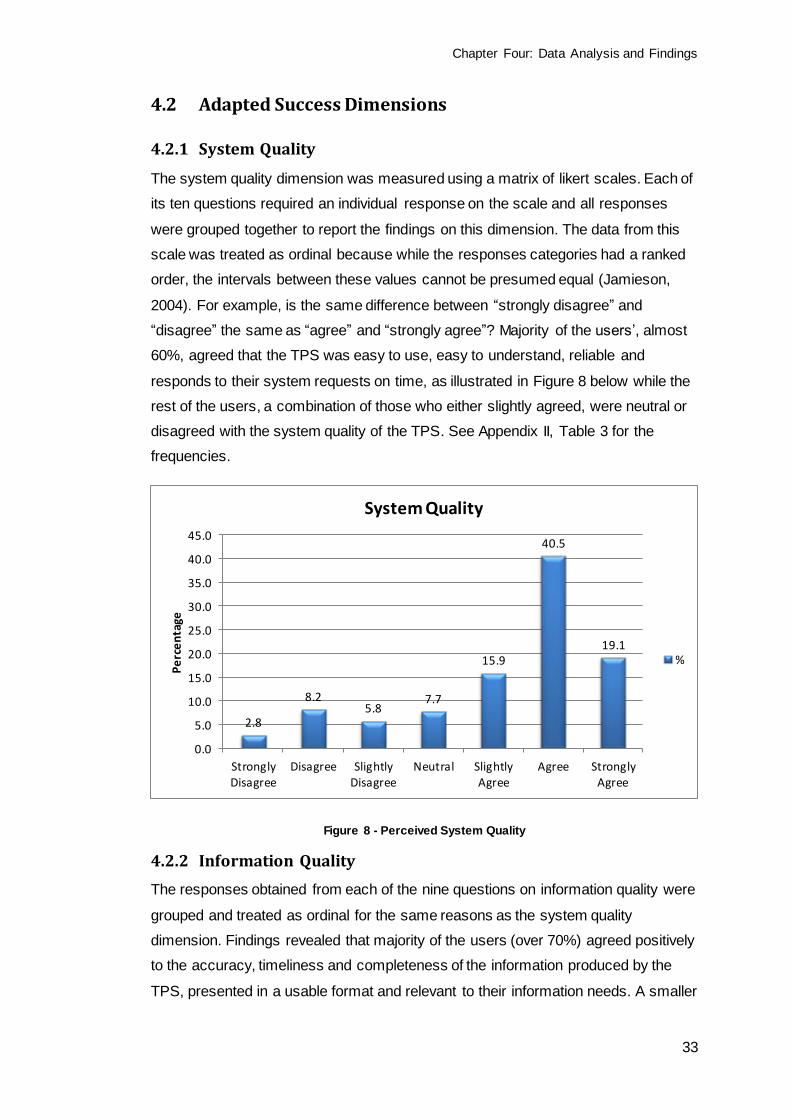
Chapter Four: Data Analysis and Findings
33
4.2 Adapted Success Dimensions
4.2.1 System Quality
The system quality dimension was measured using a matrix of likert scales. Each of
its ten questions required an individual response on the scale and all responses
were grouped together to report the findings on this dimension. The data from this
scale was treated as ordinal because while the responses categories had a ranked
order, the intervals between these values cannot be presumed equal (Jamieson,
2004). For example, is the same difference between “strongly disagree” and
“disagree” the same as “agree” and “strongly agree”? Majority of the users’, almost
60%, agreed that the TPS was easy to use, easy to understand, reliable and
responds to their system requests on time, as illustrated in Figure 8 below while the
rest of the users, a combination of those who either slightly agreed, were neutral or
disagreed with the system quality of the TPS. See Appendix II, Table 3 for the
frequencies.
Figure 8 - Perceived System Quality
4.2.2 Information Quality
The responses obtained from each of the nine questions on information quality were
grouped and treated as ordinal for the same reasons as the system quality
dimension. Findings revealed that majority of the users (over 70%) agreed positively
to the accuracy, timeliness and completeness of the information produced by the
TPS, presented in a usable format and relevant to their information needs. A smaller
2.8
8.2 5.8
7.7
15.9
40.5
19.1
0.0
5.0
10.0
15.0
20.0
25.0
30.0
35.0
40.0
45.0
StronglyDisagree
Disagree SlightlyDisagree
Neutral SlightlyAgree
Agree StronglyAgree
Pe
rce
nta
ge
System Quality
%
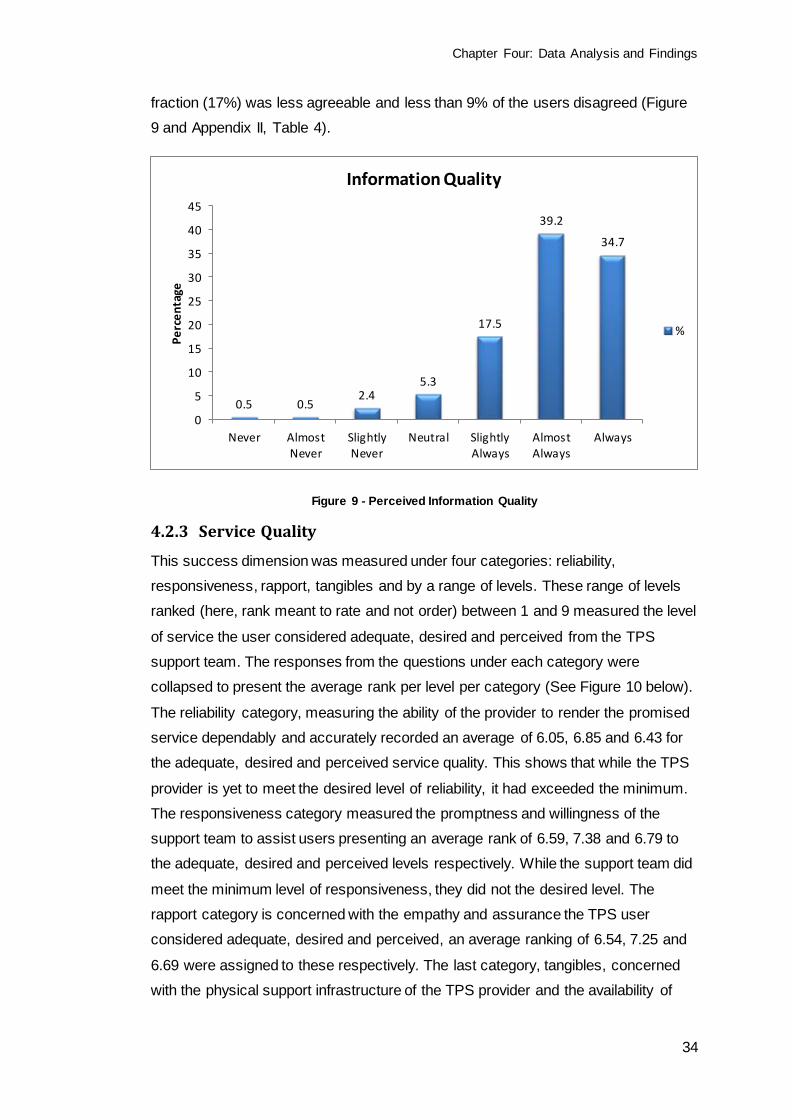
Chapter Four: Data Analysis and Findings
34
fraction (17%) was less agreeable and less than 9% of the users disagreed (Figure
9 and Appendix II, Table 4).
Figure 9 - Perceived Information Quality
4.2.3 Service Quality
This success dimension was measured under four categories: reliability,
responsiveness, rapport, tangibles and by a range of levels. These range of levels
ranked (here, rank meant to rate and not order) between 1 and 9 measured the level
of service the user considered adequate, desired and perceived from the TPS
support team. The responses from the questions under each category were
collapsed to present the average rank per level per category (See Figure 10 below).
The reliability category, measuring the ability of the provider to render the promised
service dependably and accurately recorded an average of 6.05, 6.85 and 6.43 for
the adequate, desired and perceived service quality. This shows that while the TPS
provider is yet to meet the desired level of reliability, it had exceeded the minimum.
The responsiveness category measured the promptness and willingness of the
support team to assist users presenting an average rank of 6.59, 7.38 and 6.79 to
the adequate, desired and perceived levels respectively. While the support team did
meet the minimum level of responsiveness, they did not the desired level. The
rapport category is concerned with the empathy and assurance the TPS user
considered adequate, desired and perceived, an average ranking of 6.54, 7.25 and
6.69 were assigned to these respectively. The last category, tangibles, concerned
with the physical support infrastructure of the TPS provider and the availability of
0.5 0.5 2.4
5.3
17.5
39.2
34.7
0
5
10
15
20
25
30
35
40
45
Never AlmostNever
SlightlyNever
Neutral SlightlyAlways
AlmostAlways
Always
Pe
rce
nta
ge
Information Quality
%
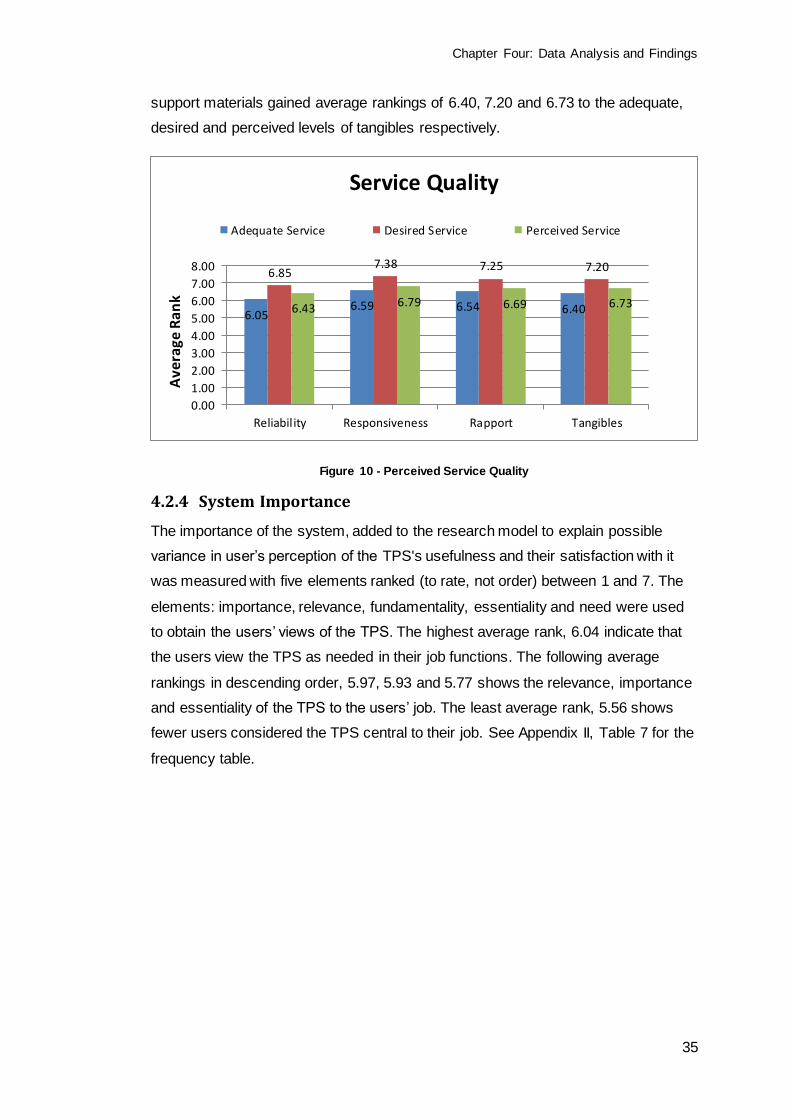
Chapter Four: Data Analysis and Findings
35
support materials gained average rankings of 6.40, 7.20 and 6.73 to the adequate,
desired and perceived levels of tangibles respectively.
Figure 10 - Perceived Service Quality
4.2.4 System Importance
The importance of the system, added to the research model to explain possible
variance in user’s perception of the TPS's usefulness and their satisfaction with it
was measured with five elements ranked (to rate, not order) between 1 and 7. The
elements: importance, relevance, fundamentality, essentiality and need were used
to obtain the users’ views of the TPS. The highest average rank, 6.04 indicate that
the users view the TPS as needed in their job functions. The following average
rankings in descending order, 5.97, 5.93 and 5.77 shows the relevance, importance
and essentiality of the TPS to the users’ job. The least average rank, 5.56 shows
fewer users considered the TPS central to their job. See Appendix II, Table 7 for the
frequency table.
6.05 6.59 6.54 6.40
6.85 7.38 7.25 7.20
6.43 6.79 6.69 6.73
0.00
1.00
2.00
3.00
4.00
5.00
6.00
7.00
8.00
Reliability Responsiveness Rapport Tangibles
Ave
rage
Ra
nk
Service Quality
Adequate Service Desired Service Perceived Service
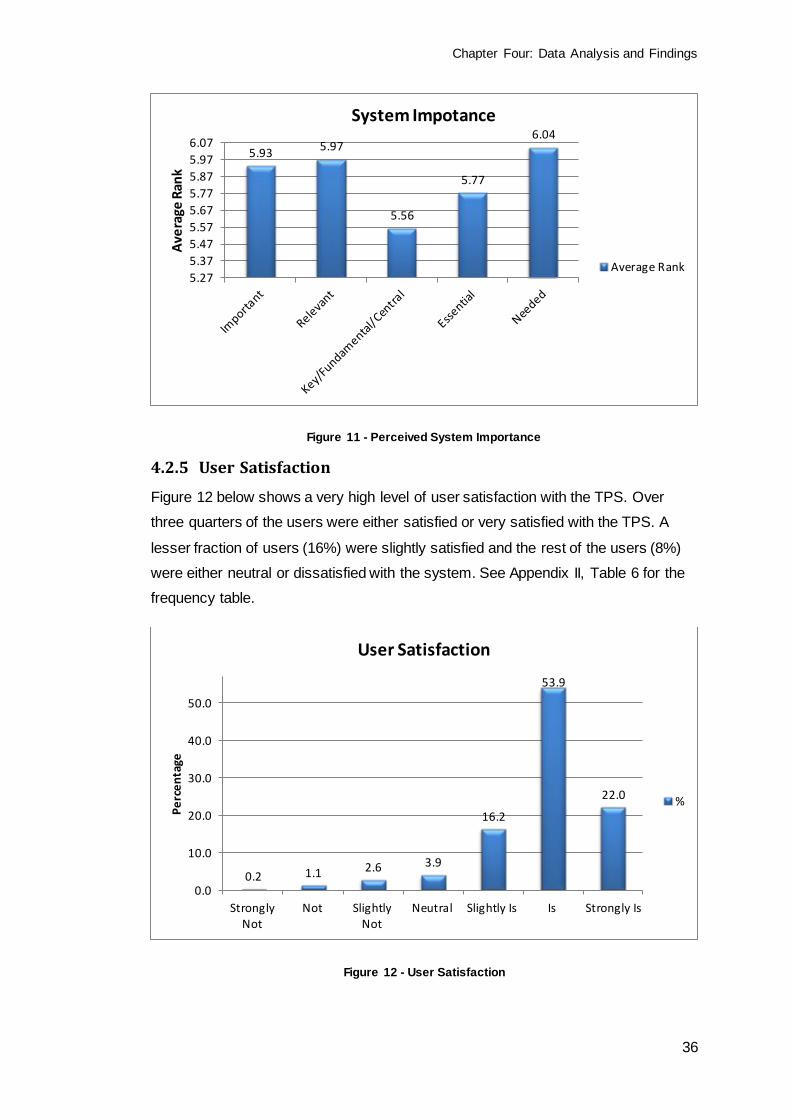
Chapter Four: Data Analysis and Findings
36
Figure 11 - Perceived System Importance
4.2.5 User Satisfaction
Figure 12 below shows a very high level of user satisfaction with the TPS. Over
three quarters of the users were either satisfied or very satisfied with the TPS. A
lesser fraction of users (16%) were slightly satisfied and the rest of the users (8%)
were either neutral or dissatisfied with the system. See Appendix II, Table 6 for the
frequency table.
Figure 12 - User Satisfaction
5.93 5.97
5.56
5.77
6.04
5.27
5.37
5.47
5.57
5.67
5.77
5.87
5.97
6.07
Ave
rage
Ran
k
System Impotance
Average Rank
0.2 1.1 2.6 3.9
16.2
53.9
22.0
0.0
10.0
20.0
30.0
40.0
50.0
StronglyNot
Not SlightlyNot
Neutral Slightly Is Is Strongly Is
Pe
rce
nta
ge
User Satisfaction
%
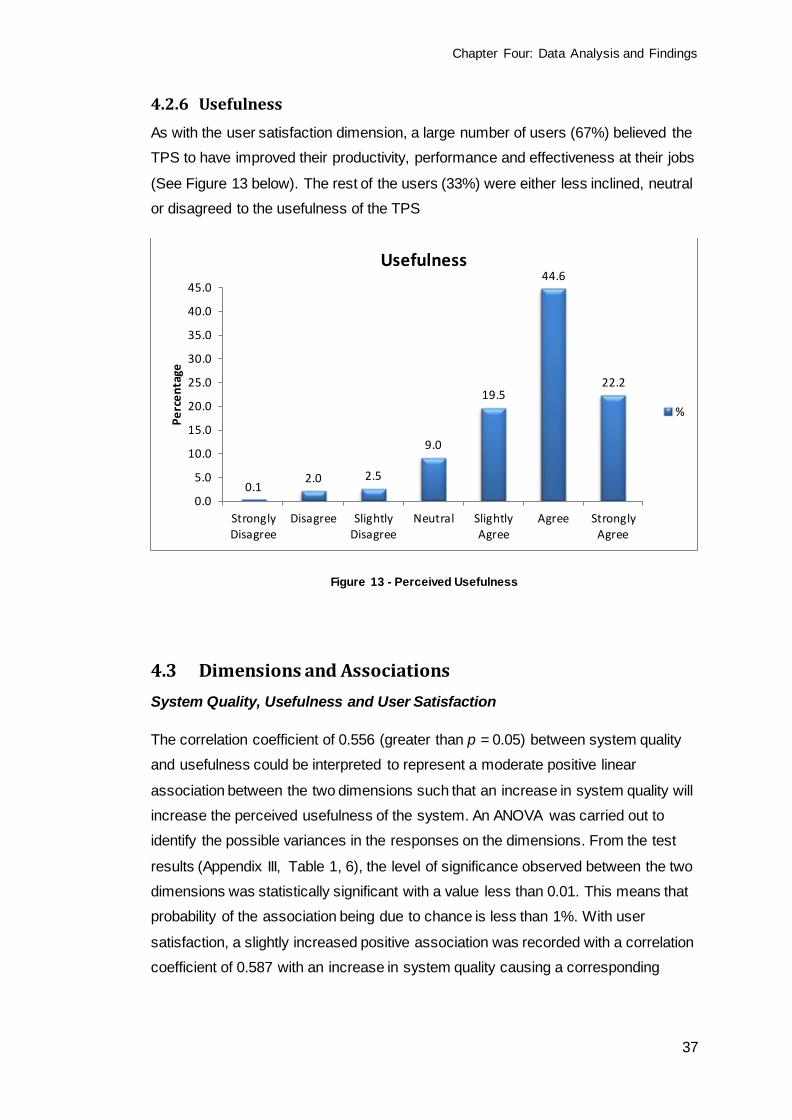
Chapter Four: Data Analysis and Findings
37
4.2.6 Usefulness
As with the user satisfaction dimension, a large number of users (67%) believed the
TPS to have improved their productivity, performance and effectiveness at their jobs
(See Figure 13 below). The rest of the users (33%) were either less inclined, neutral
or disagreed to the usefulness of the TPS
Figure 13 - Perceived Usefulness
4.3 Dimensions and Associations
System Quality, Usefulness and User Satisfaction
The correlation coefficient of 0.556 (greater than p = 0.05) between system quality
and usefulness could be interpreted to represent a moderate positive linear
association between the two dimensions such that an increase in system quality will
increase the perceived usefulness of the system. An ANOVA was carried out to
identify the possible variances in the responses on the dimensions. From the test
results (Appendix III, Table 1, 6), the level of significance observed between the two
dimensions was statistically significant with a value less than 0.01. This means that
probability of the association being due to chance is less than 1%. With user
satisfaction, a slightly increased positive association was recorded with a correlation
coefficient of 0.587 with an increase in system quality causing a corresponding
0.1 2.0 2.5
9.0
19.5
44.6
22.2
0.0
5.0
10.0
15.0
20.0
25.0
30.0
35.0
40.0
45.0
StronglyDisagree
Disagree SlightlyDisagree
Neutral SlightlyAgree
Agree StronglyAgree
Pe
rce
nta
ge
Usefulness
%
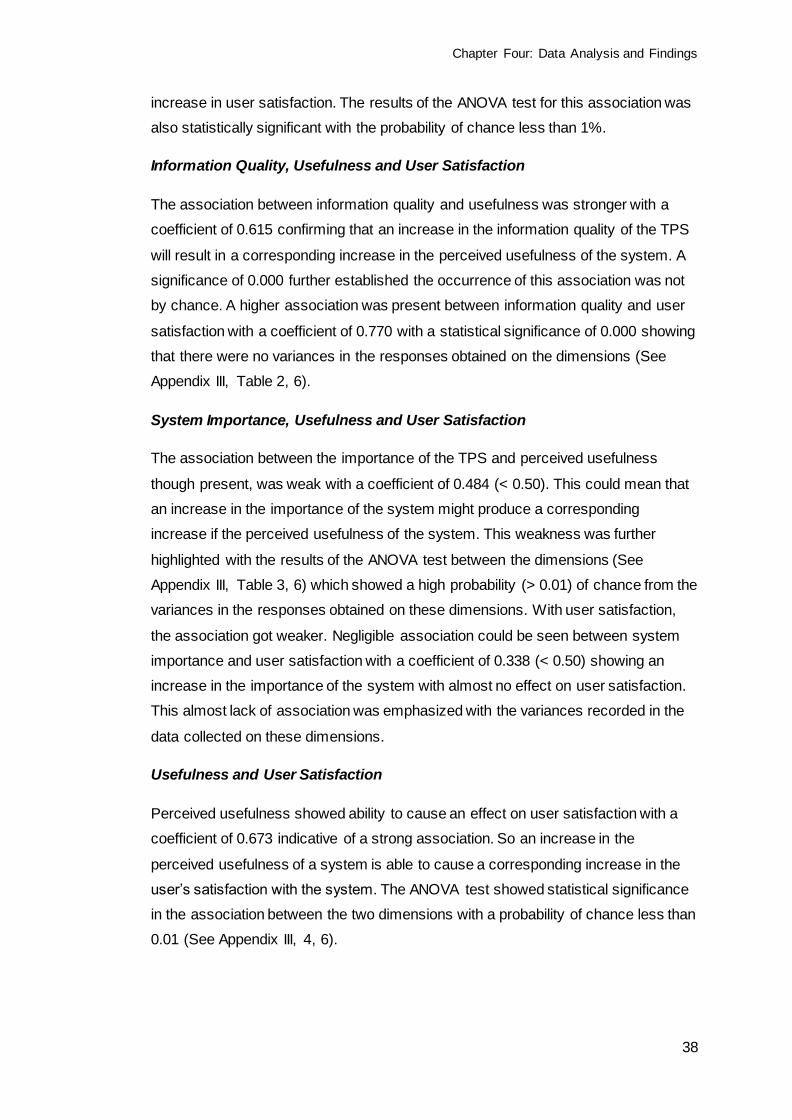
Chapter Four: Data Analysis and Findings
38
increase in user satisfaction. The results of the ANOVA test for this association was
also statistically significant with the probability of chance less than 1%.
Information Quality, Usefulness and User Satisfaction
The association between information quality and usefulness was stronger with a
coefficient of 0.615 confirming that an increase in the information quality of the TPS
will result in a corresponding increase in the perceived usefulness of the system. A
significance of 0.000 further established the occurrence of this association was not
by chance. A higher association was present between information quality and user
satisfaction with a coefficient of 0.770 with a statistical significance of 0.000 showing
that there were no variances in the responses obtained on the dimensions (See
Appendix III, Table 2, 6).
System Importance, Usefulness and User Satisfaction
The association between the importance of the TPS and perceived usefulness
though present, was weak with a coefficient of 0.484 (< 0.50). This could mean that
an increase in the importance of the system might produce a corresponding
increase if the perceived usefulness of the system. This weakness was further
highlighted with the results of the ANOVA test between the dimensions (See
Appendix III, Table 3, 6) which showed a high probability (> 0.01) of chance from the
variances in the responses obtained on these dimensions. With user satisfaction,
the association got weaker. Negligible association could be seen between system
importance and user satisfaction with a coefficient of 0.338 (< 0.50) showing an
increase in the importance of the system with almost no effect on user satisfaction.
This almost lack of association was emphasized with the variances recorded in the
data collected on these dimensions.
Usefulness and User Satisfaction
Perceived usefulness showed ability to cause an effect on user satisfaction with a
coefficient of 0.673 indicative of a strong association. So an increase in the
perceived usefulness of a system is able to cause a corresponding increase in the
user’s satisfaction with the system. The ANOVA test showed statistical significance
in the association between the two dimensions with a probability of chance less than
0.01 (See Appendix III, 4, 6).
Chapter Four: Data Analysis and Findings
39
Service Quality and User Satisfaction
The correlation indicated a negative association between service quality and user
satisfaction with a coefficient of -0.037 indicative if an inverse association. This
means that an increase in service quality will cause a decrease in the level of user
satisfaction and vice versa. However, the results from the ANOVA test shows the
association as statistically significant with a probability to change less than 1% (See
Appendix III, Table 5, 6)
Chapter Five: Discussion of Results
40
CHAPTER FIVE
DISCUSSION OF RESULTS
This chapter discusses the analysis results from the previous chapter and accepts
or rejects the hypotheses formulated from the research model. Each success
dimension in the survey will be discussed separately with the exception of user
satisfaction which will be discussed within each dimension. Any association between
these dimensions will be subsequently clarified.
5.1 Gender and Period of Use
The addition of the demographic profile on respondents was not to identify possible
associations between gender, period of use and any of the other six success
dimensions; rather it was for data presentation. However, noteworthy was the large
fraction of experience users (using the TPS over 2 years) that completed the survey
questionnaire. This, the researcher expected increased the internal validity of the
causal associations identified in the research study.
5.2 System Quality
The results of the data analysis carried out on the system quality highlighted a
positive association with the usefulness and user satisfaction dimensions. This
supports the hypotheses on the positive effect of system quality on the usefulness of
a TPS and its users’ satisfaction. DeLone and McLean (2003) and Seddon and Kiew
(1994) also established the predictive characteristic of the system quality dimension
of an IS over its users’ satisfaction and perceived usefulness respectively. It can
therefore be inferred that the users of the case studied TPS perceived that the more
reliable, easy to use and prompt responding the system was, the more useful it was
to them invariably, increasing their satisfaction with it.
5.3 Information Quality
Information quality was established to have a high positive effect on the perceived
usefulness of the TPS to its users and their satisfaction with it. Seddon and Kiew
(1994) were able to show these strengths of association in their research; as did
DeLone and McLean (2003). Not surprising though, considering the rising the
dependency on these types of systems. A TPS that can be guaranteed to always
Chapter Five: Discussion of Results
41
produce the right information, in the right format at the required time will most likely
have users who will come to depend on it for their related business functions,
increasing its usefulness to them and ultimately their satisfaction with it.
5.4 Service Quality
The results from data analysis on service quality however, did not support the
implied hypothesis which stated that was an increase in users’ satisfaction is
predicted when there is an increase in the level of quality service rendered by the
TPS provider. Rather, findings presented an inverse association which was not
supported by any of the researched literature. However the researcher suggests two
likely reasons for this:
1. Fewer empirical studies have been done on the updated D&M model which
was adapted in this research. Therefore, there are no exhaustive tests
showing the possible associations of service quality as an element of the IS
success model.
2. Due to the number of experienced users that responded to the survey
questionnaire, the service quality dimension might not have had an influence
of their perceptions on the TPS success especially if they do not require
frequent or extensive support. This likelihood could be further supported with
the ratings on the levels of service. As it was, the average ratings leaned
more towards the positive scale.
5.5 System Importance
The results on the system importance dimension showed a weak support of its
hypothesis. This implied that a positive increase in the importance of a system from
the perspective of the user might not guarantee an increase in the system’s
perceived usefulness and or satisfaction. However, Seddon and Kiew (1994) were
able to substantially support this increase in their research though they warned that
a change in the perceived importance of a system is what will result in
corresponding positive associations. Suffice to say there were minimal changes to
the users’ perceptions of the TPS's importance to cause strong effects on perceived
usefulness and satisfaction. The distribution on the period of use could be a reason
for the minimal change to perceptions as majority of the users probably have
already established their perceptions on the importance of the system prior to taking
the survey.
Chapter Five: Discussion of Results
42
5.6 Usefulness as an Impact Measure
The questions presented under the usefulness dimension were also used to
measure the impact of the TPS on the users. This was not to establish a causal
association between independent variables and individual impacts but to measure
how much the use of the TPS has caused a change in the behaviour of its users.
Appendix II, Table 5 shows a high degree of impact on users.
Chapter Six: Conclusions
43
CHAPTER SIX
CONCLUSIONS
This chapter presents the conclusions from the research, summarising the research
findings. The limitations of the research were discussed, recommendations for
Transaction Processing System providers were presented and future work revealed.
6.1 Conclusion
The increasing role of Transaction Processing Systems as key enablers of vast
range of commercial activities and as a critical component to the world’s economy
demands that extra efforts be made to ensure the success of these systems. While
a lot of studies have focused on measuring the success of Information Systems as a
whole or as types of Information System, very little attention has been paid to
Transaction Processing System and its success measures.
In light of this, the research’s aim was to measure the success of Transaction
Processing Systems adapting the D&M IS Success Model. To do this, a model
adapted from the updated D&M model to the context of the research, was
developed to measure the success of a particular TPS. From this model, the
research hypotheses were formulated to be supported or refuted by the findings of
the research. The study focused on exploring the degrees of influences each
independent elements of the model (system quality, information quality, service
quality and system importance) had on the one or more dependent elements
(usefulness and users’ satisfaction). An online survey was conducted, featuring
various types and numbers of questions grouped appropriately to measure each
element in the research model. A total of 133 completed survey responses were
received and a significant number of all the respondents revealed positive effects of
independent elements on one or two of the dependent elements.
The research findings revealed that the system quality of a TPS influences users’
perception of its usefulness and a TPS that its users perceive useful will increase
their satisfaction with it. Information quality also showed a strong positive influence
on perceived usefulness and user’s satisfaction. A system that is reputed to produce
precise reports will be regarded as more useful and thus more satisfying. The
findings also revealed that the weak influence system importance had on usefulness
and user satisfaction so that is the importance of a system increases, it does not
Chapter Six: Conclusions
44
have to influence its usefulness or users’ satisfaction. However, the findings did not
support a positive influence of service quality on user satisfaction; rather it revealed
an inverse influence on which suggestions were presented as to its cause. The
impact of system use on users of the TPS was measured and was found to be high.
Users attested that using the system increased their productivity, their performance
and their efficiency. It is safe to infer that if the users experienced these changes in
behaviour from use of the system; this will ultimately lead to a cumulative benefit to
the organization they are part of. Finally, the findings of this study support DeLone
and McLean (2003) and Seddon and Kiew (1994) results on similar studies with the
exception of the service quality dimension which could be subject to a plausible
unknown factor.
6.2 Research Limitations
Sample Size
Strength in numbers characterizes the many advantages of quantitative research
and while the number of respondents for this research was not overly small, it was
not enough. With more data, extensive statistically tests could have been done.
Time
The major constraint of this research project was time as the researcher believes
the three month duration of this research project was insufficient. It took a while for
to get a final approval from the case study company which encroached into data
collection time affecting the size of collected data.
6.3 Recommendations
The research findings provide TPS providers with an understanding on the aspects
of a TPS that are critical to its success; in particular, the awareness that different
factors, even non-system factors (like system importance) can affect users’
satisfaction which is usually one of the goals of producing the systems. As service
providers, the zones of tolerance could help them develop an efficient service
improvement plan if required such that more focus could be placed on areas where
the adequate levels of service have not been met.
Chapter Six: Conclusions
45
6.4 Future Work
This is not the end of this research; more work is still required before the research
model can be a valid TPS success model. First, the inverse association between
service quality and user satisfaction still needs to be explored to find the causal
associations between them. Second, the weakness of the system importance
dimension needs to be investigated and measured in another context to conclude on
its validity. Lastly, a large sample size that can give a true representation of the
population should be used.
Word Count: 14,500
46
BIBLIOGRAPHY
Alter, S. (1999). A General, Yet Useful Theory of Information Systems.
Communications of the Association of Information Systems. 1(13), 1-71.
Avison, D.E. & Fitzgerald, G. (ed.) (1995). Information Systems Development:
Methodologies, Techniques and Tools. Berkshire: McGraw-Hill Book Company
Europe.
Bailey, J. & Pearson, S. (1983). Development of a Tool for Measuring and Analyzing
Computer User Satisfaction. Management Science. 29(5), 530-545.
Best Price Computers. (2010). TPS: Transaction Processing Systems [Online].
BPC, Articles and Glossary. Available at:
http://www.bestpricecomputers.co.uk/glossary/transaction-processing-systems.htm
[Accessed 22 August 2011].
Beynon-Davies, P. (2002) Information Systems: An Introduction to Informatics in
Organizations. Hampshire: Palgrave.
Cassell, C. & Symon, G (ed.) (2004). Essential Guide to Qualitative Methods in
Organizational Research. London: Sage Publications.
Connolly, T. & Begg, C. (ed.) (2010). Database Systems: A Practical Approach to
Design, Implementation and Management. Boston: Pearson Addison Wesley.
Creswell, J.W. (ed.) (2003). Research Design: Qualitative, Quantitative and Mixed
Methods Approaches. London: Sage Publications.
47
Date, C.J. (ed.) (2004). An Introduction to Database Systems. Boston: Pearson
Addison Wesley.
Davis, F.D. (1989). Perceived Usefulness, Perceived Ease Of Use, And User
Acceptance of Information Technology. MIS Quarterly. 13(3), 319-340.
DeLone, W.H., & McLean, E.R. (2003). The DeLone and McLean Model of
Information Systems Success: A Ten-Year Update. Journal of Management
Information System. 19(4), 9-30.
DeLone, W.H., & McLean, E.R. (1992). Information Systems Success: The Quest
for the Dependent Variable. Information Systems Research. 3(1), 60-95.
Doll, W.J. & Torkzadeh, G. (1988). The Measurement of End-User Computing
Satisfaction. MIS Quarterly. 12(2), 259-274.
Ein-Dor, P. & Segev, E. (1978). Organizational Context and the Success of
Management Information Systems. Management Science. 24(10), 1064-1077.
Frankfort-Nachmias, C. & Nachmias, D (ed.) (1992). Research Methods in the
Social Sciences. London: Edward Arnold.
Galliers, R. (1992). Information Systems Research: Issues, Methods and Practical
Guidelines. Henley-On-Thames: Alfred Waller Ltd.
Hamilton, S. & Chervany, N.L. (1981). Evaluating Information System Effectiveness
- Part I: Comparing Evaluation Approaches. MIS Quarterly. 5(3), 55-69
48
IBM. (2005). The evolution of transaction processing to open standards [Online].
Enabling transaction processing for On Demand Business. Available at: http://www-
01.ibm.com/software/htp/tpf/pages/G299-0768-00F.pdf [Accessed 21 August 2011].
Ives, B. & Olson, M. (1984). User Involvement and MIS Success: A Review of
Research. Management Science. 30(5), 586-603.
Jackson, S.L. (ed.) (2008). Research Methods and Statistics: A Critical Thinking
Approach. Belmont: Wadsworth Publishing.
Jamieson, S. (2004). Likert Scales: How to (Ab)use Them. Medical Education.
38(12), 1217-1218.
Kettinger, W.J. & Lee, C.C. (2005). Zones of Tolerance: Alternative Scales for
Measuring Information Systems Service Quality. MIS Quarterly. 29(4), 607-623.
Kriebel, C. & Raviv, A. (1980). An Economics Approach to Modeling the Productivity
of Computer Systems. Management Science. 26(3), 297-311.
Laudon, K.C. & Laudon, J.P. (ed.) (2006). MANAGEMENT INFORMATION
SYSTEMS: Managing the Digital Firm. New Jersey: Pearson Prentice Hall.
Mason, R.O. (1978). Measuring information output: A communication systems
approach. Information & Management. 1(4), 219-234.
49
Mathematics and Statistics Help (MASH). (2009). Statistics [Online]. Sheffield: The
University of Sheffield. Available at: http://www.shef.ac.uk/mash/statistics.html
[Accessed 29 August 2011].
McLeod, R. (Jr.) (1990). Information Systems Concepts. New Jersey: Prentice Hall.
Pitt, L.F. et al. (1995). Service Quality: A Measure of Information Systems
Effectiveness. MIS Quarterly. 19(2), 173-187.
Preece, J. et al. (2002). Interaction Design: Beyond Human-Computer Interaction.
New York: John Wiley & Sons.
Seddon, P.B. & Kiew, M-Y. (1994). A partial test and development of the DeLone
and McLean model of IS success. Australasian Journal of Information Systems.
4(1), 90-109.
Shannon, C.E. & Weaver, W. (1949). The Mathematical Theory of Communication.
Urbana IL: University of Illinois Press.
TechTarget. (1997). Transaction [Online]. SearchCIO. Available at:
http://searchcio.techtarget.com/definition/transaction [Accessed 22 August 2011].
Trochim, W.M.K. (2006). Deductive and Inductive Thinking. [Online]. Research
Methods Knowledge Database. Available at:
http://www.socialresearchmethods.net/kb/dedind.php [Accessed 24 August 2011].
50
Van Dyke T.P. et al. (1997). Measuring Information System Service Quality:
Concerns on the use of the SERVQUAL questionnaire. MIS Quarterly. 21(2), 195-
208.
Whyte, G. & Bytheway, A. (1996). Factors affecting information systems’ success.
International Journal of Service Industry Management. 7(1), 74-93.
Zmud, R.W. (1979). Individual Differences and MIS Success: A Review of the
Empirical Literature. Management Science. 25(10), 966-979.
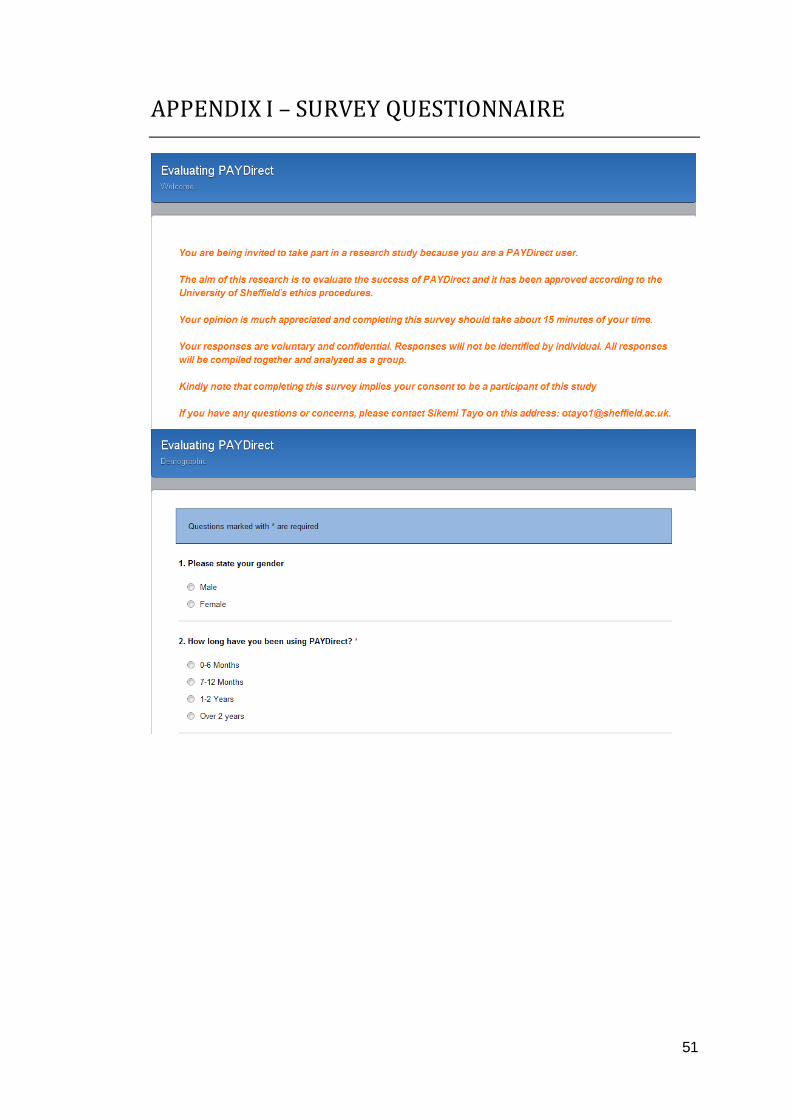
51
APPENDIX I – SURVEY QUESTIONNAIRE
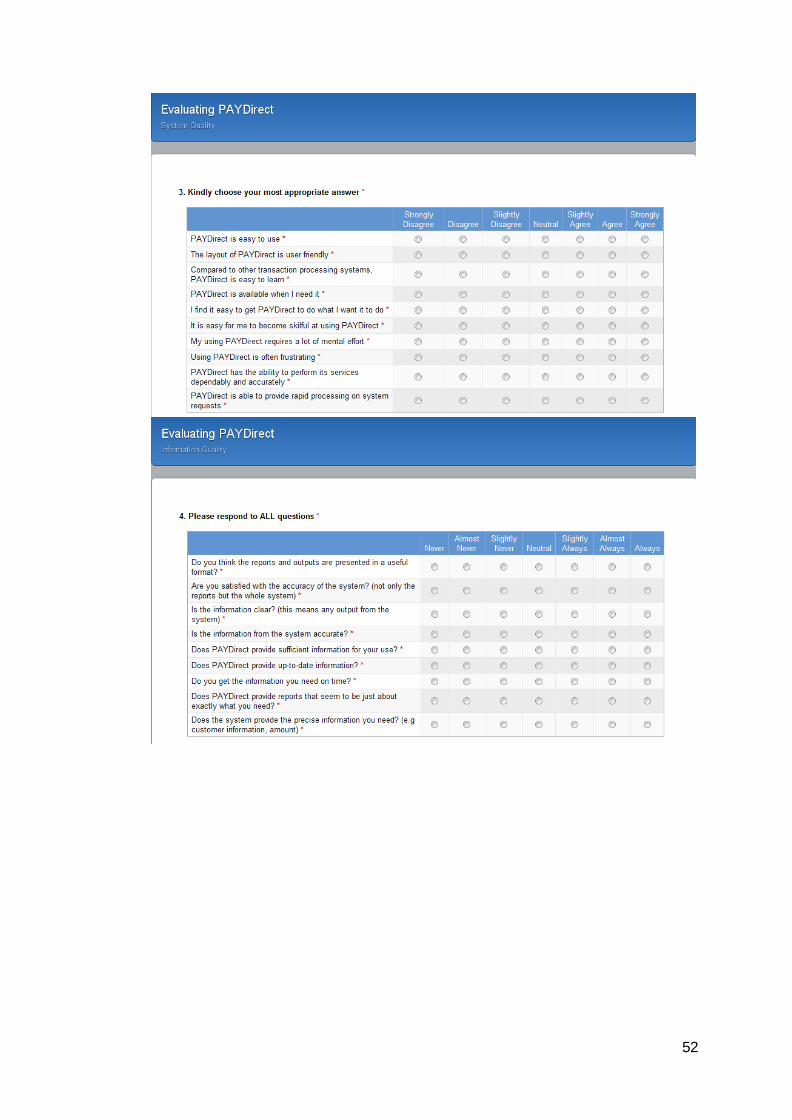
52
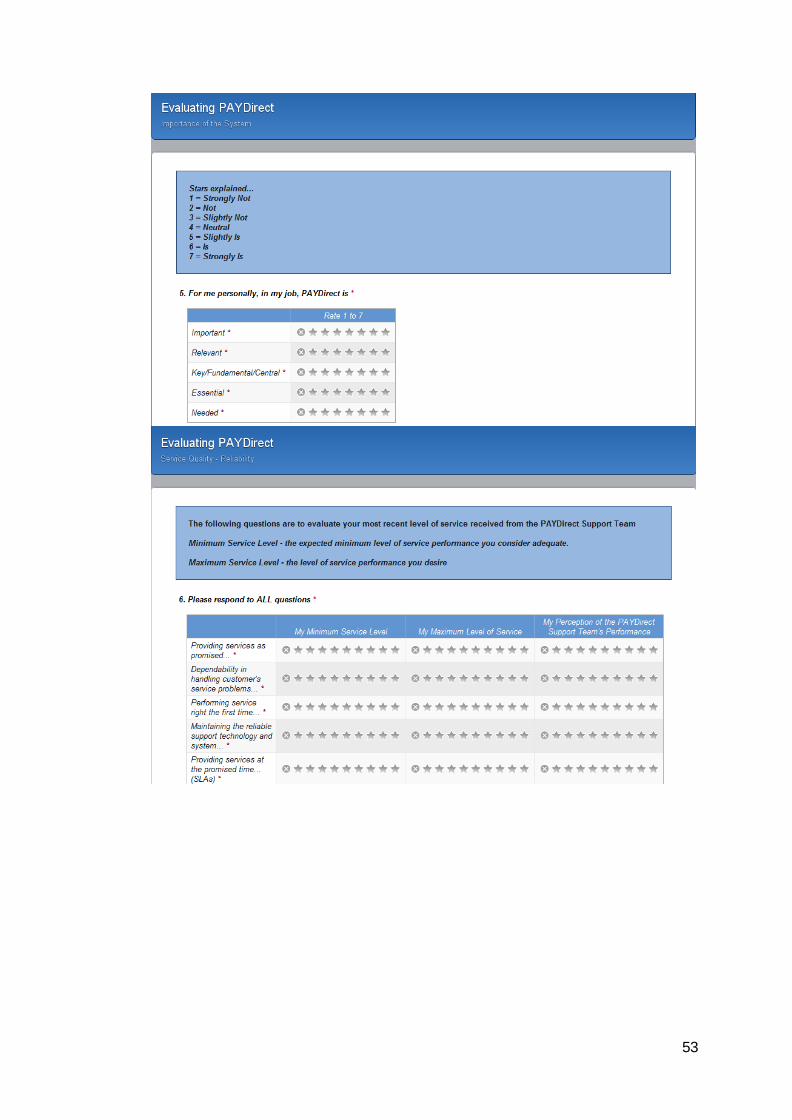
53
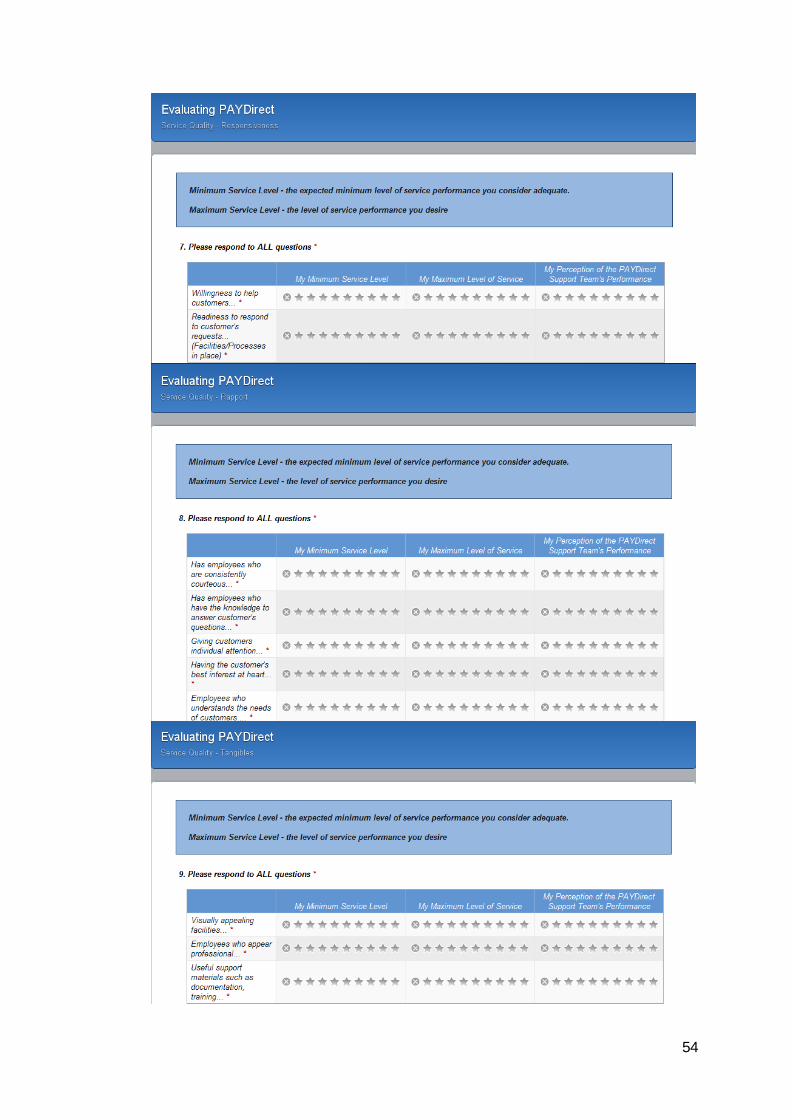
54
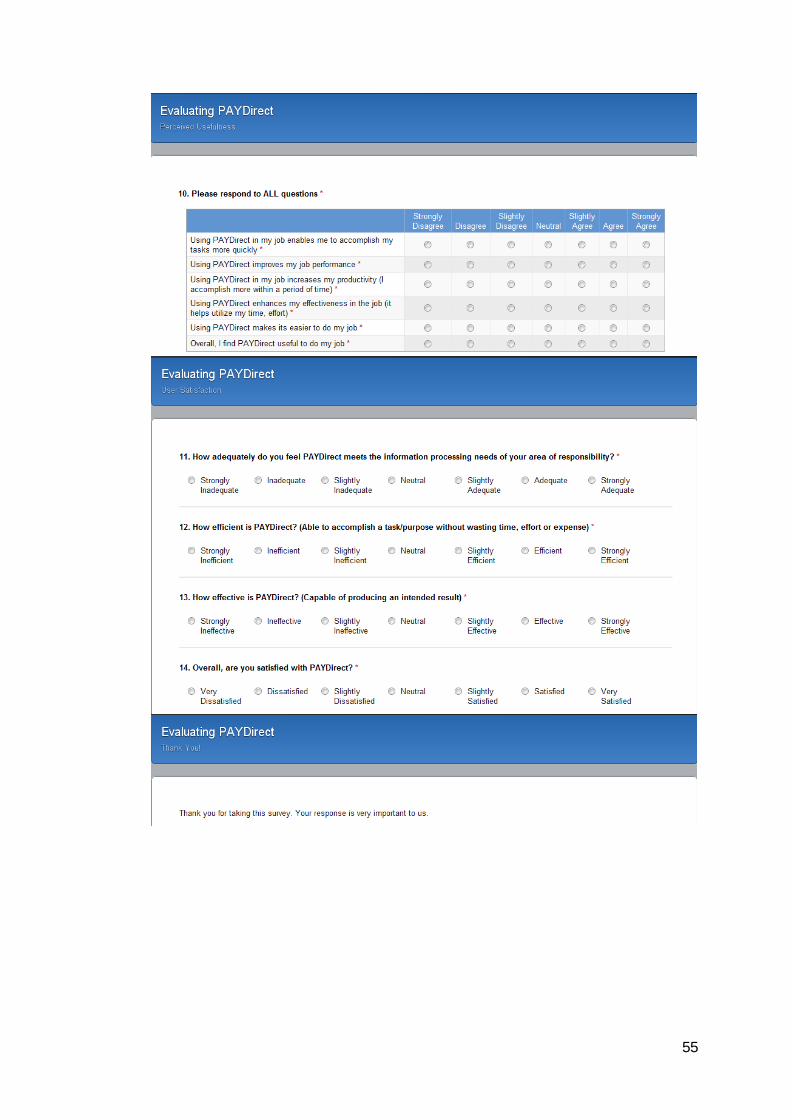
55
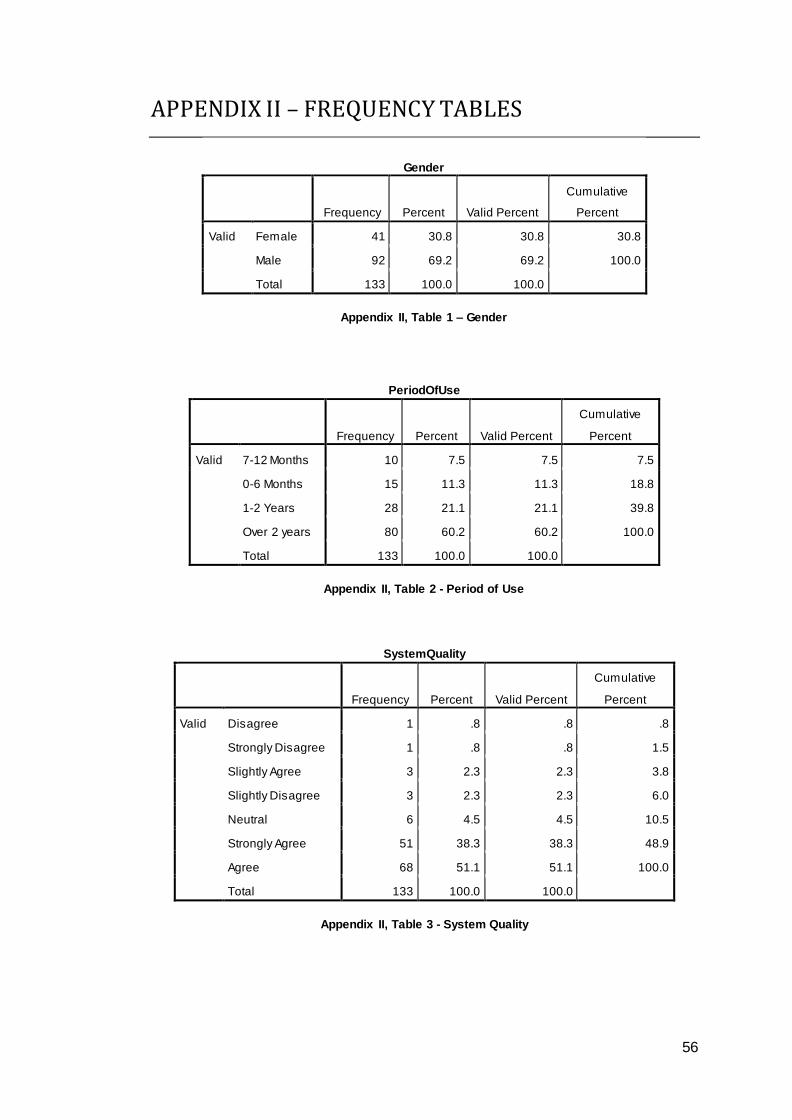
56
APPENDIX II – FREQUENCY TABLES
Gender
Frequency Percent Valid Percent
Cumulative
Percent
Valid Female 41 30.8 30.8 30.8
Male 92 69.2 69.2 100.0
Total 133 100.0 100.0
Appendix II, Table 1 – Gender
PeriodOfUse
Frequency Percent Valid Percent
Cumulative
Percent
Valid 7-12 Months 10 7.5 7.5 7.5
0-6 Months 15 11.3 11.3 18.8
1-2 Years 28 21.1 21.1 39.8
Over 2 years 80 60.2 60.2 100.0
Total 133 100.0 100.0
Appendix II, Table 2 - Period of Use
SystemQuality
Frequency Percent Valid Percent
Cumulative
Percent
Valid Disagree 1 .8 .8 .8
Strongly Disagree 1 .8 .8 1.5
Slightly Agree 3 2.3 2.3 3.8
Slightly Disagree 3 2.3 2.3 6.0
Neutral 6 4.5 4.5 10.5
Strongly Agree 51 38.3 38.3 48.9
Agree 68 51.1 51.1 100.0
Total 133 100.0 100.0
Appendix II, Table 3 - System Quality
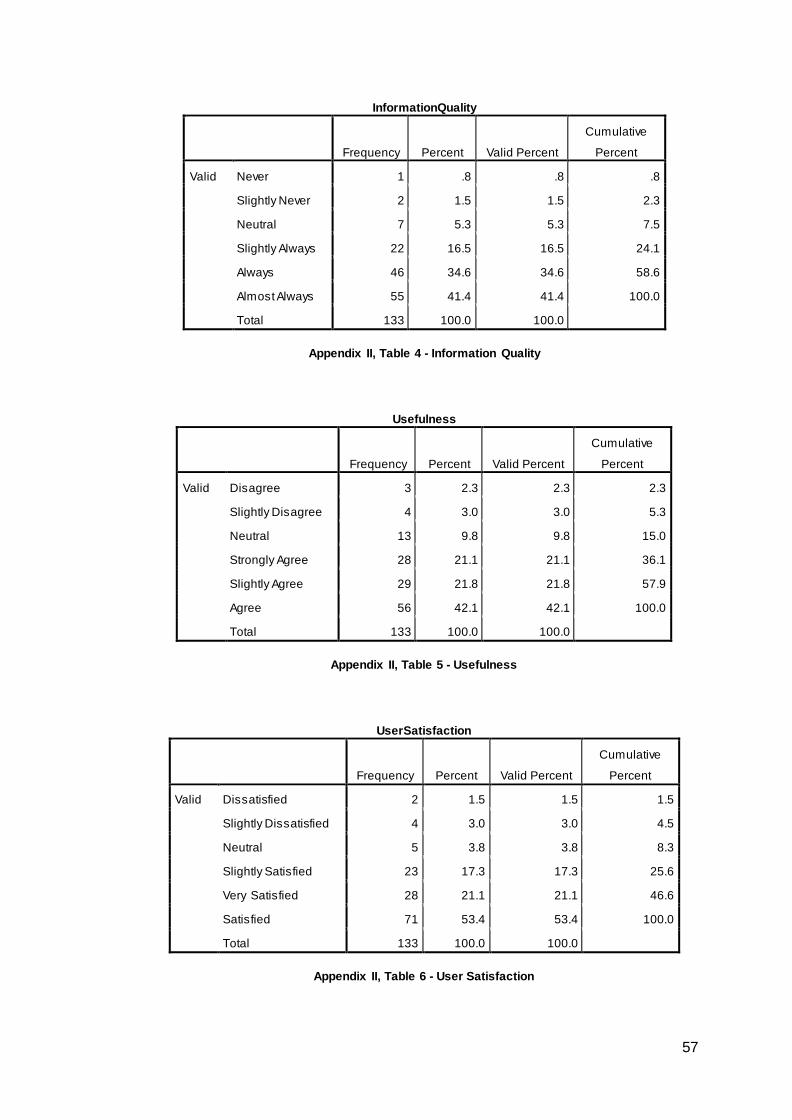
57
InformationQuality
Frequency Percent Valid Percent
Cumulative
Percent
Valid Never 1 .8 .8 .8
Slightly Never 2 1.5 1.5 2.3
Neutral 7 5.3 5.3 7.5
Slightly Always 22 16.5 16.5 24.1
Always 46 34.6 34.6 58.6
Almost Always 55 41.4 41.4 100.0
Total 133 100.0 100.0
Appendix II, Table 4 - Information Quality
Usefulness
Frequency Percent Valid Percent
Cumulative
Percent
Valid Disagree 3 2.3 2.3 2.3
Slightly Disagree 4 3.0 3.0 5.3
Neutral 13 9.8 9.8 15.0
Strongly Agree 28 21.1 21.1 36.1
Slightly Agree 29 21.8 21.8 57.9
Agree 56 42.1 42.1 100.0
Total 133 100.0 100.0
Appendix II, Table 5 - Usefulness
UserSatisfaction
Frequency Percent Valid Percent
Cumulative
Percent
Valid Dissatisfied 2 1.5 1.5 1.5
Slightly Dissatisfied 4 3.0 3.0 4.5
Neutral 5 3.8 3.8 8.3
Slightly Satisfied 23 17.3 17.3 25.6
Very Satisfied 28 21.1 21.1 46.6
Satisfied 71 53.4 53.4 100.0
Total 133 100.0 100.0
Appendix II, Table 6 - User Satisfaction
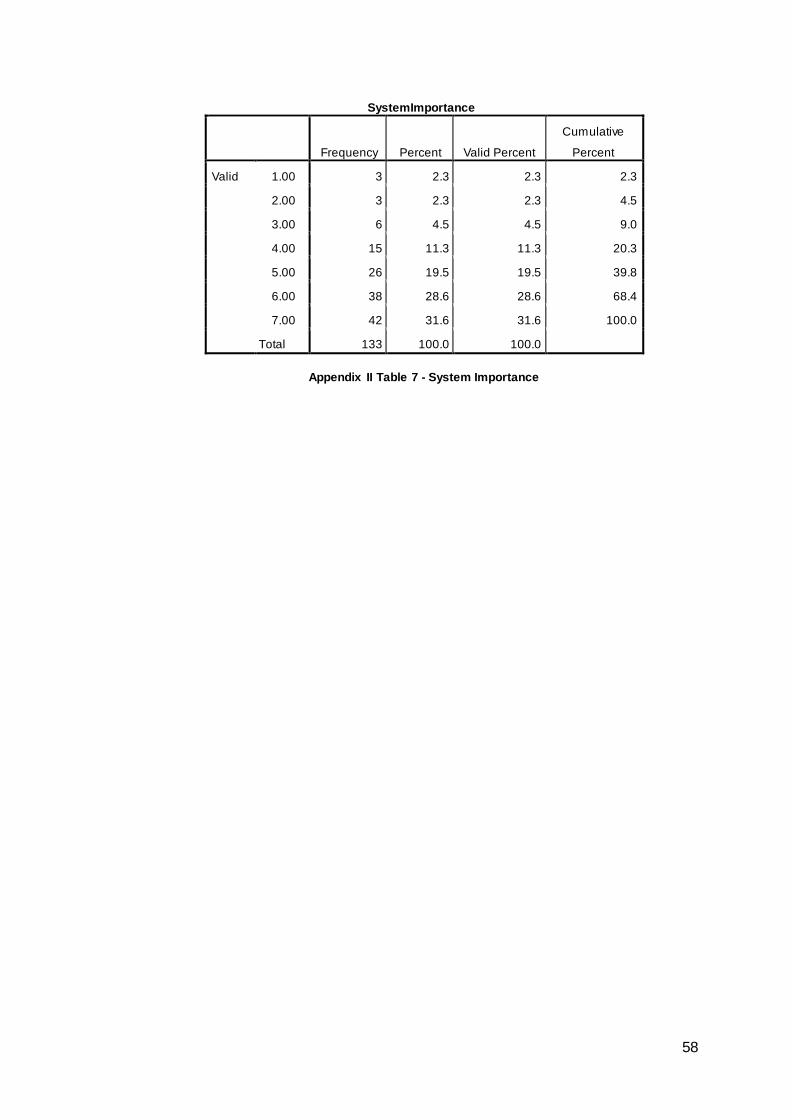
58
SystemImportance
Frequency Percent Valid Percent
Cumulative
Percent
Valid 1.00 3 2.3 2.3 2.3
2.00 3 2.3 2.3 4.5
3.00 6 4.5 4.5 9.0
4.00 15 11.3 11.3 20.3
5.00 26 19.5 19.5 39.8
6.00 38 28.6 28.6 68.4
7.00 42 31.6 31.6 100.0
Total 133 100.0 100.0
Appendix II Table 7 - System Importance
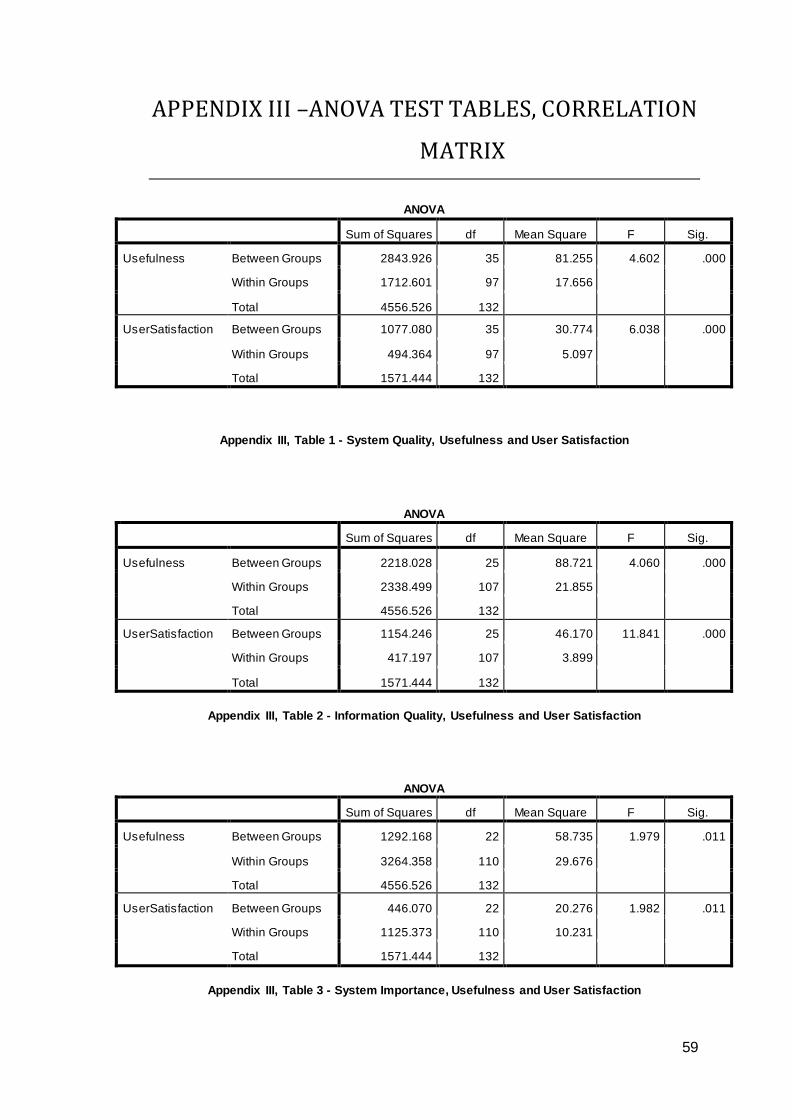
59
APPENDIX III –ANOVA TEST TABLES, CORRELATION
MATRIX
ANOVA
Sum of Squares df Mean Square F Sig.
Usefulness Between Groups 2843.926 35 81.255 4.602 .000
Within Groups 1712.601 97 17.656
Total 4556.526 132
UserSatisfaction Between Groups 1077.080 35 30.774 6.038 .000
Within Groups 494.364 97 5.097
Total 1571.444 132
Appendix III, Table 1 - System Quality, Usefulness and User Satisfaction
ANOVA
Sum of Squares df Mean Square F Sig.
Usefulness Between Groups 2218.028 25 88.721 4.060 .000
Within Groups 2338.499 107 21.855
Total 4556.526 132
UserSatisfaction Between Groups 1154.246 25 46.170 11.841 .000
Within Groups 417.197 107 3.899
Total 1571.444 132
Appendix III, Table 2 - Information Quality, Usefulness and User Satisfaction
ANOVA
Sum of Squares df Mean Square F Sig.
Usefulness Between Groups 1292.168 22 58.735 1.979 .011
Within Groups 3264.358 110 29.676
Total 4556.526 132
UserSatisfaction Between Groups 446.070 22 20.276 1.982 .011
Within Groups 1125.373 110 10.231
Total 1571.444 132
Appendix III, Table 3 - System Importance, Usefulness and User Satisfaction
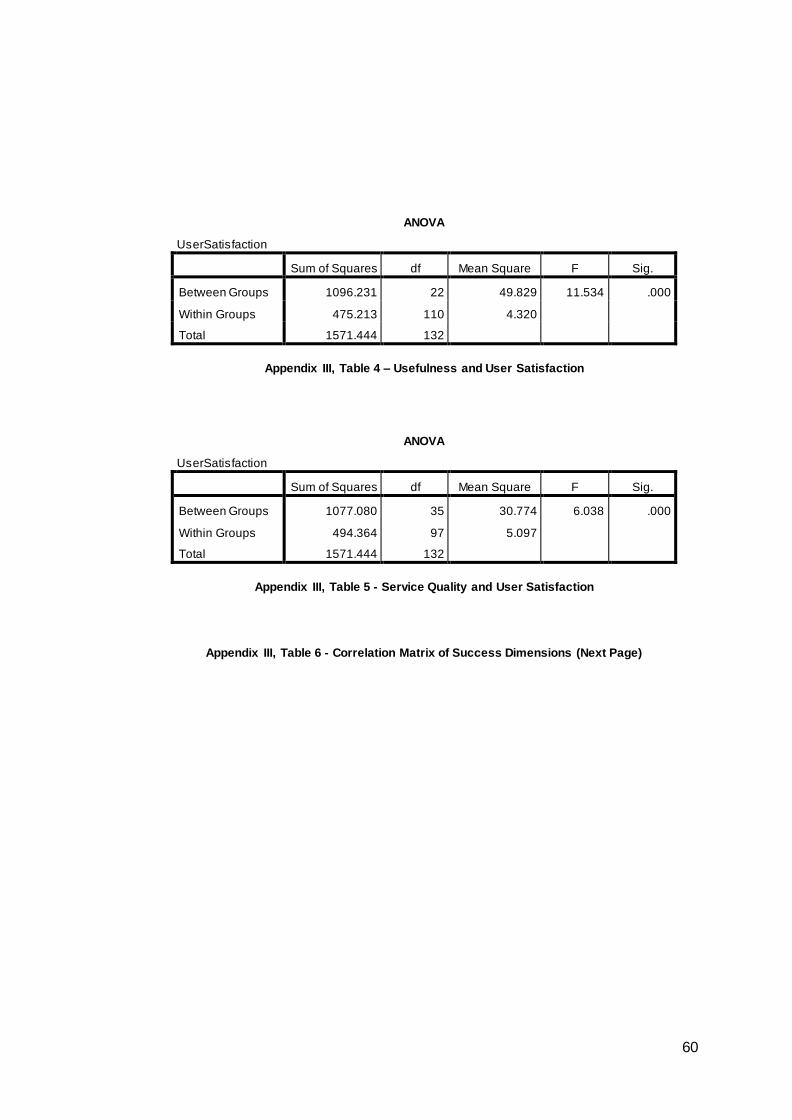
60
ANOVA
UserSatisfaction
Sum of Squares df Mean Square F Sig.
Between Groups 1096.231 22 49.829 11.534 .000
Within Groups 475.213 110 4.320
Total 1571.444 132
Appendix III, Table 4 – Usefulness and User Satisfaction
ANOVA
UserSatisfaction
Sum of Squares df Mean Square F Sig.
Between Groups 1077.080 35 30.774 6.038 .000
Within Groups 494.364 97 5.097
Total 1571.444 132
Appendix III, Table 5 - Service Quality and User Satisfaction
Appendix III, Table 6 - Correlation Matrix of Success Dimensions (Next Page)
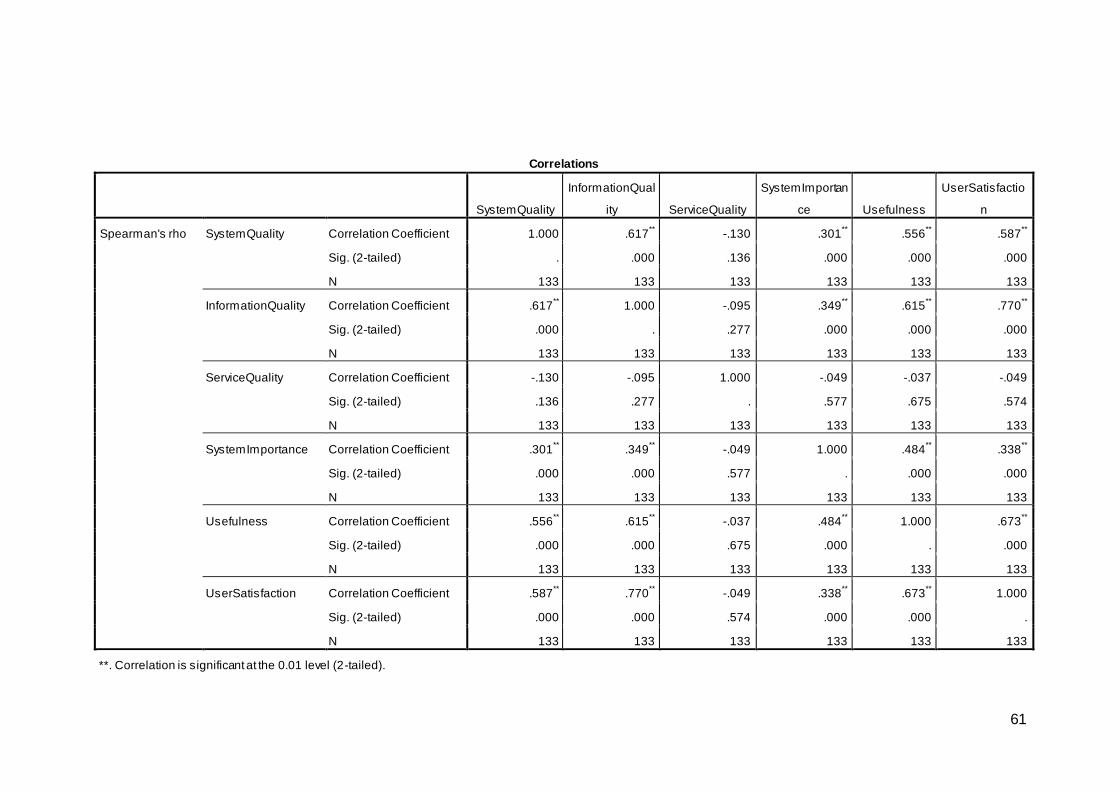
61
Correlations
SystemQuality
InformationQual
ity ServiceQuality
SystemImportan
ce Usefulness
UserSatisfactio
n
Spearman's rho SystemQuality Correlation Coefficient 1.000 .617** -.130 .301
** .556
** .587
**
Sig. (2-tailed) . .000 .136 .000 .000 .000
N 133 133 133 133 133 133
InformationQuality Correlation Coefficient .617** 1.000 -.095 .349
** .615
** .770
**
Sig. (2-tailed) .000 . .277 .000 .000 .000
N 133 133 133 133 133 133
ServiceQuality Correlation Coefficient -.130 -.095 1.000 -.049 -.037 -.049
Sig. (2-tailed) .136 .277 . .577 .675 .574
N 133 133 133 133 133 133
SystemImportance Correlation Coefficient .301** .349
** -.049 1.000 .484
** .338
**
Sig. (2-tailed) .000 .000 .577 . .000 .000
N 133 133 133 133 133 133
Usefulness Correlation Coefficient .556** .615
** -.037 .484
** 1.000 .673
**
Sig. (2-tailed) .000 .000 .675 .000 . .000
N 133 133 133 133 133 133
UserSatisfaction Correlation Coefficient .587** .770
** -.049 .338
** .673
** 1.000
Sig. (2-tailed) .000 .000 .574 .000 .000 .
N 133 133 133 133 133 133
**. Correlation is significant at the 0.01 level (2-tailed).